Innovative Biomedical Design Competitions and Scenarios Exploring Underserved Populations
Upload
khangminh22Category
view
0download
0
DESIGN SCENARIOS METHODOLOGY – ENABLING REQUIREMENTS-DRIVEN DESIGN SPACES
A DISSERTATION
SUBMITTED TO THE DEPARTMENT OF
CIVIL AND ENVIRONMENTAL ENGINEERING
AND THE COMMITTEE ON GRADUATE STUDIES
OF STANFORD UNIVERSITY
IN PARTIAL FULFILLMENT OF THE REQUIREMENTS
FOR THE DEGREE OF
DOCTOR OF PHILOSOPHY
Victor Gane
May 2011

http://creativecommons.org/licenses/by-nc/3.0/us/
This dissertation is online at: http://purl.stanford.edu/qs170jk0633
© 2011 by Victor Gane. All Rights Reserved.
Re-distributed by Stanford University under license with the author.
This work is licensed under a Creative Commons Attribution-Noncommercial 3.0 United States License.
ii

I certify that I have read this dissertation and that, in my opinion, it is fully adequatein scope and quality as a dissertation for the degree of Doctor of Philosophy.
Martin Fischer, Primary Adviser
I certify that I have read this dissertation and that, in my opinion, it is fully adequatein scope and quality as a dissertation for the degree of Doctor of Philosophy.
John Haymaker, Co-Adviser
I certify that I have read this dissertation and that, in my opinion, it is fully adequatein scope and quality as a dissertation for the degree of Doctor of Philosophy.
Mark Cutkosky
I certify that I have read this dissertation and that, in my opinion, it is fully adequatein scope and quality as a dissertation for the degree of Doctor of Philosophy.
Vladimir Bazjanac
Approved for the Stanford University Committee on Graduate Studies.
Patricia J. Gumport, Vice Provost Graduate Education
This signature page was generated electronically upon submission of this dissertation in electronic format. An original signed hard copy of the signature page is on file inUniversity Archives.
iii

Victor Gane
iv
Abstract
During the conceptual design process, the building shape, orientation, materials and
other major properties are established, all of which have a substantial impact on multi-
aspect performance. In this process, multidisciplinary teams define project objectives,
create various alternatives, and try to understand their impacts and value. With non-
parametric Computer Aided Design (CAD) methods designers produce and analyze as
few as three alternatives, whereas with parametric CAD – they can generate
thousands. However, with current parametric methods, CAD experts lack a
comprehensive method to build and analyze multi-objective parametric models.
Therefore the resulting models do not effectively encapsulate multi-objective value
measures.
This research introduces the Design Scenarios Methodology (DS), which builds on
research from Systems Engineering, Process Modeling, and Parametric Modeling.
With DS, Enablers use Methods to create Elements using five interconnected models
to define (1) project stakeholders and their objectives, (2) designer logic used to
address objectives, (3) the connection between designer logic and computable models
to generate alternatives, (4) the predicted impact and (5) value of the generated
alternatives. I implemented DS as a web-based software prototype and tested it on an
industry project. The results provide evidence that the DS method provides CAD
experts with well-defined logic and parameters for addressing objectives and the
process enables creating parametric alternatives with clear multi-objective values that
potentially provide clients with better building designs.
This thesis lays the foundation for future research on automating the design alternative
generation and analyses processes by leveraging such well-established methods as
Multi-Disciplinary Optimization.

Victor Gane
v
Acknowledgments
The last few years have been an extraordinary journey of learning, discovery,
collaboration, friendship, frustration, and joy. Having completed my Ph.D. is perhaps
my most fundamental achievement to date. I came out of it a more seasoned and ever
more curious thinker, yearning to continue on the path of challenging myself and
contributing to the advancement of the science. I attribute a great part of this success
to many great individuals, to whom I express my gratitude.
I would like to first of all thank John Haymaker, my advisor. John has been
instrumental in inspiring me to pursue a Ph.D. He is a true friend, who has always
helped guide and support my research. No matter whether I was working locally on
my papers, or remotely on industry case studies, John always asked hard questions,
gave great feedback, and encouraged my intuition for developing prototype solutions
for my research problem.
I’d like to express my gratitude to my co-advisor, Martin Fischer, whose drive for
excellence was an important inspiration over the years. Martin helped focus the
contribution of my research and sharpen the story. His comments to my papers, as
well as feedback to numerous informal and formal presentations were invaluable.
I am grateful to my reading committee members Vlado Bazjanac, Mark Cutkosky, and
Axel Kilian. I met Vlado during one of his visits to Stanford and immediately grew to
respect and appreciate his holistic view of the building design process. Professor
Cutkosky’s wealth of knowledge from other design disciplines such as mechanical
engineering and robotics offered an important alternative perspective to my research.
Axel Kilian from Princeton University was an early motivation to this research when
he taught a workshop on computational design methods during my graduate studies at
the Massachusetts Institute of Technology when I became interested in applying
parametric Computer Aided Design in the conceptual design of buildings. Axel is a
true friend and his humility and profound knowledge is inspiring.
Many others helped shape this experience. I thank the Precourt Center for Energy
Efficiency for partially funding my research. David Anderson is the software architect

Victor Gane
vi
that helped implement my ideas into a testable software prototype. John Kunz, Renate
Fruchter, Ray Levitt asked fundamental questions and reinforced the rigorous
scientific thinking that a Ph.D. process entails. I thank the CIFE faculty for
introducing me early on to the “Horseshoe” concept of structuring my Ph.D. research,
without which it might have been much harder to stay focused and understand where
in the overall research process I stood.
I thank Ross Wimer, Bill Baker, Mark Sarkisian, Bernie Gandras, Luke Leung, and
Eric Zachrison from Skidmore, Owings and Merrill who were instrumental in enabling
me to test my research on industry projects and learn firsthand the anticipated practical
impact.
Finally, I am grateful to my many friends and peers at Stanford who throughout the
years contributed to making this a great journey: Reid Senescu, Ben Welle, Rene
Morcos, Tobias Maile, Ben Suter, Caroline Clevenger, Wendy Li, Akiko Yamada.
And last but not least, I dedicate this dissertation to my parents, my most ardent
supporters. Without their unconditional belief in my abilities, encouragement, and
support of higher scholarly pursuits, it would be hard to imagine I would be where I
am today.

Victor Gane
vii
Table of Contents
Abstract ........................................................................................................................ iv
Acknowledgments ......................................................................................................... v
Table of Contents ........................................................................................................ vii
List of Tables ................................................................................................................. x
List of Illustrations ...................................................................................................... xi
Chapter 1: Introduction ............................................................................................... 1
1 Observed problem ........................................................................................................... 2
2 Research questions .......................................................................................................... 5
3 Points of departure .......................................................................................................... 5
4 Research method / tasks .................................................................................................. 6
5 Research results / validation ......................................................................................... 10
6 Contributions to knowledge .......................................................................................... 11
7 Predicted practical impact ............................................................................................ 12
8 Conclusion ...................................................................................................................... 13
9 References ....................................................................................................................... 13
Chapter 2: Benchmarking current conceptual design processes ........................... 16
1 Abstract .......................................................................................................................... 16
2 Introduction: Need for Effective Conceptual High-Rise Design Processes .............. 16
2.1 Points of departure: What are current high-rise design processes and how do we
document and measure them? .................................................................................. 18
2.1.1 Design theory ........................................................................................... 18
2.1.2 Process modeling ..................................................................................... 19
2.1.3 High-rise classification and key design criteria ....................................... 20
3 Methods: Documenting and Analyzing Current Practice .......................................... 27
3.1 Documenting Current Conceptual Design Process .................................................. 27
3.2 A survey of industry professionals on current conceptual design process ............... 35
3.2.1 Organizations ........................................................................................... 36
3.2.2 Options ..................................................................................................... 38
3.2.3 Analyses ................................................................................................... 39

Victor Gane
viii
3.2.4 Decisions .................................................................................................. 40
3.2.5 Time investment ...................................................................................... 41
4 Conclusion: Potential cost of underperforming conceptual design processes .......... 43
4.1 Organizations............................................................................................................ 44
4.2 Goals ......................................................................................................................... 44
4.3 Options ..................................................................................................................... 45
4.4 Analyses ................................................................................................................... 45
4.5 Decisions .................................................................................................................. 46
5 Bibliography ................................................................................................................... 47
Chapter 3: Design Scenarios – enabling requirements-driven parametric design
spaces ........................................................................................................................... 52
1 Abstract .......................................................................................................................... 52
2 Introduction: the need for effective conceptual design processes ............................. 53
3 Framework for measuring the design space quality ................................................... 57
4 Points of Departure: design space exploration methods ............................................ 58
4.1 Concurrent Engineering – integrate and parallelize tasks ........................................ 59
4.2 Quality Function Deployment – translate user needs into design characteristics .... 60
4.3 Requirements Engineering – determine and manage requirements ......................... 61
4.4 Axiomatic Design – generate requirements and enable parameters ......................... 62
4.5 Process modeling – represent and measure design spaces ....................................... 63
4.6 Parametric modeling – generate alternative spaces .................................................. 64
5 Design Scenarios - methodology description ............................................................... 66
5.1 Requirements Model (RM) ...................................................................................... 69
5.2 Scenarios Model (SM) .............................................................................................. 71
5.3 Parametric Process Model (PPM) ............................................................................ 75
5.4 Alternatives Analysis Model (AAM) ....................................................................... 80
5.5 Illustrative Example ................................................................................................. 82
5.5.1 Requirements Model ................................................................................ 83
5.5.2 Scenarios Model ...................................................................................... 84
5.5.3 Parametric Process Model ....................................................................... 87
5.5.4 Alternatives Analyses Model ................................................................... 90
5.5.5 Testing the practical value of DS ............................................................. 93
Victor Gane
ix
6 Conclusion ...................................................................................................................... 94
7 Bibliography ................................................................................................................... 96
Chapter 4: Application of Design Scenarios methodology to evaluate the
effectiveness of transparent parametric CAD ....................................................... 103
1 Abstract ........................................................................................................................ 103
2 Introduction – the need for effective conceptual design processes .......................... 103
3 Conceptual design process using parametric modeling with no formal
implementation method............................................................................................... 108
3.1 Tower 1 test case .................................................................................................... 108
3.2 Tower 2 test case .................................................................................................... 114
3.3 Summary ................................................................................................................ 117
4 Conceptual design process using Design Scenarios (DS) to clarify design spaces . 118
4.1 Summary of Tower 3 design team process ............................................................. 119
4.2 Requirements Model (RM) .................................................................................... 120
4.3 Scenarios Model (SM) ............................................................................................ 122
4.4 Parametric Process Model (PPM) .......................................................................... 126
4.5 Alternatives Analysis Model (AAM) ..................................................................... 129
5 Conclusions and future opportunities ........................................................................ 134
6 Bibliography ................................................................................................................. 138
7 Appendix ....................................................................................................................... 141

Victor Gane
x
List of Tables
Table 3-1: Summary of topics covered by each guideline ........................................... 57
Table 3-2: RM graphical notation, definitions, and data schema in the Design
Scenarios software prototype ................................................................................ 70
Table 3-3: SM graphical notation, definitions, and data schema and in the Design
Scenarios software ................................................................................................ 73
Table 3-4: Table 4. PPM ontology and graphical notation .......................................... 77
Table 3-5: AAM ontology and graphical notation ...................................................... 81
Table 3-6: Three geometric alternatives selected for further analysis and the input and
resulting output parameters .................................................................................. 89
Table 4-1: Tower 1 project facts and requirements. No formal method to gather and
prioritize requirements was implemented ........................................................... 109
Table 4-2: Input parameters and constrained ranges .................................................. 114
Table 4-3: Selection of Tower 2 project facts and design requirements .................... 115
Table 4-4: Input parameters and constrained ranges describing the model in Figure
4-6a. .................................................................................................................... 117
Table 4-5: Project facts ............................................................................................... 119
Table 4-6: Input parameters and constrained ranges .................................................. 126
Table 4-7: 10 design alternatives and a selection of input parameters used to generate
each alternative ................................................................................................... 129
Table 4-8: A comparison of four data sets quantifying conceptual design process
performance. Items in bold denote significant improvements over current
practice. ............................................................................................................... 135

Victor Gane
xi
List of Illustrations
Figure 1-1: CIFE “horseshoe” research method ............................................................. 2
Figure 1-2: Theory defines design space in terms of four subspaces with elements and
relationships among them ....................................................................................... 2
Figure 1-3: a) The Alternative Space consists of scenarios, alternatives, and options; b)
example of impact of alternatives given the goals and constraints ........................ 3
Figure 1-4: Design Theory and Systems Engineering say that design spaces need to be
both well-defined and comprehensive .................................................................... 4
Figure 1-5: Selection of theoretical points of departure used in this dissertation .......... 6
Figure 1-6: Design Scenarios Methodology schema and connections among four
spaces ...................................................................................................................... 7
Figure 1-7: Objective space enablers, methods, and elements ....................................... 8
Figure 1-8: Alternative space logic enablers, methods, and elements ........................... 8
Figure 1-9: Alternative space geometry enablers, methods, and elements .................... 9
Figure 1-10: Impact space enablers, methods, and elements ....................................... 10
Figure 1-11: Value space enablers, methods, and elements ......................................... 10
Figure 1-12: a) Tyrol Tower, Worgl, Austria; b) Infinity Tower, Dubai, UAE; c)
Transbay Tower, San Francisco; d) Jeddah Towers, Jeddah, Saudi Arabia. Images
courtesy of SOM. .................................................................................................. 11
Figure 1-13: Quotes collected from DS validation on industry projects ...................... 13
Figure 2-1: Typical stakeholders and design team organizational hierarchy ............... 22
Figure 2-2: Process model describing the case study conceptual design. Nodes A & B
describe the early stages, in which decisions about team size, composition,
duration, and deliverables were made by the design firm owner, project manager,
and senior designer. Nodes C, D, & E describe the process by which the design
team evaluated the project context and requirements and proposed the first design
concepts in a design charrette. Nodes F, G, H, & I describe the process by which
the design team developed 2D working drawings to calculate whether area and
building efficiency requirements were met and a 3D model for visual evaluation
of the design. Designers repeated the process several times before these

Victor Gane
xii
requirements were met. Nodes J, K, L, M & N show that only after the senior
designer accepted a design option for final development were the mechanical and
structural engineers involved, the geometry for physical model prototyping
prepared, and the conceptual design package assembled. Mechanical and
structural engineers rationalized the design rather than participated from the
beginning in decision making. Adapted from SOM case study project ............... 28
Figure 2-3: Tyrol Tower site, Worgl, Austria. With permission from SOM ............... 29
Figure 2-4: a) Tyrol Tower concept sketches – skiing was the prevailing design theme;
the first concept was influenced by the shape of the slalom ski poll, the second
abstracted a skier in motion with a 2.5 degree inclination; b) massing, orientation,
and tower positioning strategy were influenced by the site geometry, prevailing
wind direction, and the need to link the tower to the adjacent site. With
permission from SOM .......................................................................................... 30
Figure 2-5: a) Tyrol Tower typical and unique floor plans; b) building section. With
permission from SOM .......................................................................................... 31
Figure 2-6: a) Tyrol Tower conceptual renderings; b) physical model. With permission
from SOM ............................................................................................................. 32
Figure 2-7: A late concept sketch proposed by the senior designer in response to the
previously unarticulated goal of providing the building with natural ventilation.
Implementing the proposed side scallops would have invalidated most of the
completed work, and because the time constraints the idea was abandoned. With
permission from SOM .......................................................................................... 33
Figure 2-8: Information produced by mechanical engineers did not include any model-
based analyses but rather a set of conceptual, untested recommendations, such as:
a) stack effect diagram based on architect’s section; b) standardized graphs of
annual wet and dry bulb temperatures, wind rose, and annual direct solar
radiation to inform which months of the year were most suitable for natural
ventilation. With permission from SOM .............................................................. 34
Figure 2-9: Process performance metrics adapted from the SOM case study project .. 35

Victor Gane
xiii
Figure 2-10: Average reported survey results of team size and composition. A typical
design team includes 12 professionals, 65% of whom are architects. Most design
and engineering positions were generally reported to be filled by a single
professional with the exception of intern (3) and mid-level architects (2) ........... 36
Figure 2-11: Average reported survey results (% respondents) showing: a) the
percentage of projects that employed each method of goals communication–
goals on most projects were communicated verbally; b) the clarity of the
identified goals – most had low to low / medium clarity (Note: respondents were
allowed to choose multiple answers) .................................................................... 37
Figure 2-12: Average reported survey results (% respondents) showing: a) who
established project goals – mostly clients and architects with little or no
participation from engineers. b) major project constraints – most were determined
by the developer emphasizing commercial efficiency as opposed to lifecycle
efficiency. ............................................................................................................. 38
Figure 2-13: Average reported survey results (% of respondents) showing: a) the
number of design options generated during conceptual design – majority
indicated three; b) tools used are traditional CAD or graphics software that
support generating single, static solutions. Very few respondents used emerging
technologies, such as parametric modeling or energy analysis tools. (Note: For
question (b) the respondents were allowed to choose multiple answers) ............. 39
Figure 2-14: Average reported survey results (% respondents) showing the model-
based analyses performed during conceptual design. The performed analyses
address predominantly architectural concerns (i.e., budget constraints, program
requirements). (Note: respondents were allowed to choose multiple answers) ... 40
Figure 2-15: Average reported survey results showing which objectives designers
consider when making design decisions. Architectural criteria (i.e., aesthetics,
area efficiency, site views) prevail over engineering performance criteria (i.e.,
energy efficiency, natural ventilation, structural performance) ........................... 41
Figure 2-16: Average reported survey results (% respondents) showing conceptual
design duration, which predominantly fluctuates between 4 - 6 weeks ............... 41

Victor Gane
xiv
Figure 2-17: Average reported survey results showing: a) total man hours invested by
each team member type during concept design phase; b) total number of hours by
discipline ............................................................................................................... 42
Figure 2-18: Average reported survey results showing percentages of the total time
spent on goal definition, option generation, analysis, and preparation of
presentation materials ........................................................................................... 42
Figure 2-19: Averaged survey concept design process performance metrics .............. 43
Figure 3-1: Example of AEC scenarios – concept sketches of a high-rise located in the
Austrian Alps, which are derived from a ski pole (left) and a ski boot (right)
(Gane and Haymaker, 2010) ................................................................................. 54
Figure 3-2: Summary of the concepts used to describe a design space and search
methods ................................................................................................................. 56
Figure 3-3: Summary of how PODs satisfy the identified needs. This paper focuses on
creating an ontology for building multidisciplinary AEC alternative spaces and a
method to translate design requirements from the objective space to the
alternative, impact, and value spaces .................................................................... 66
Figure 3-4: Design Scenarios methodology process description. The Objective Space
is captured in the Requirements Model; the Logical Alternative Space in the
Scenarios Model; the Geometric Alternative Space in the Parametric Process
Model; the Impact and Value Spaces in the Alternatives Analysis Model .......... 68
Figure 3-5: First Order logic implemented in the SM. R1, R2 are the requirement
nodes generated in the SM; A, B, C, D represent the action, strategy, or parameter
nodes in SM .......................................................................................................... 72
Figure 3-6: The site for a teaching space ...................................................................... 82
Figure 3-7: The Requirements Model captures the stakeholders’ constraints, goals, and
preferences for goals. Stakeholders distribute a percentage of preference (totaling
100%) to each identified goal ............................................................................... 83
Figure 3-8: The architect suggests two scenarios (square and rectangular classroom)
that enables determine the desired range of geometric variations ........................ 84

Victor Gane
xv
Figure 3-9: Scenarios Model for the University Quad illustrative example. The model
starts with the two Constraints and two Goals transferred from the RM and design
stakeholders rationalize them into Actions, Strategies, Parameters and Parametric
Constraints. AND, OR, XOR logical gateways are used to describe relations
between Actions, Strategies, and Parameters ....................................................... 86
Figure 3-10: Component-level PPM illustrates the CAD model decomposition into six
components shown in hierarchical order .............................................................. 87
Figure 3-11: Schema-level PPM describes the composition of: a) “Property outline”
component; b)”Building footprint” component .................................................... 88
Figure 3-12: Final composite geometry-level PPM. Note that the nodes’ attributes are
toggled off to help simplify the model. The model helps understand which nodes
are affected when parameter values are changed by highlighting them (i.e., the
Building width value was changed from 40’ to 70’) ............................................ 89
Figure 3-13: Some quantifiable goals require model-based analysis performed outside
the parametric modeler. Autodesk Ecotect© is used to determine average daylight
values in lux for all three alternatives. Note that the ceiling is omitted for clarity
.............................................................................................................................. 91
Figure 3-14: Alternatives Analysis Model: a) users input impact scores and geometric
parameter values for each analyzed alternative; b) the system generates a value
score for each alternative. Alternative 1 emerges as the preferred one based on the
goals identified in the RM and the goal importance determined by stakeholders 92
Figure 3-15: Jeddah mixed-use towers project in Saudi Arabia ................................... 94
Figure 4-1: Tower 1 site configuration, initial tower/podium footprint, and the required
20m setback ....................................................................................................... 110
Figure 4-2: Components describing the high-level structure of the Tower 1 parametric
CAD model. ........................................................................................................ 111
Figure 4-3: Tower 1 parametric model: a) the tower footprint (plan view) instantiated
twice with input parameters controlling the tower rotation; b) tower envelope
(perspective view) lofted from the three footprints; c) small section of the
footprint with a column component and the driving parameters (perspective

Victor Gane
xvi
view); d) columns extruded along the footprint (perspective view); e) final model
of a single floor used to create ~1,000 design options (perspective view). ........ 112
Figure 4-4: The team investigated three structural alternatives using the same
parametric CAD model. a) originally proposed solution with expensive double
curvature; b) intermediate solution with single curvature but with architecturally
unappealing columns; c) final solution with single curvature stepping columns, in
which fins cover the step from top to bottom column. Column and fin sizes were
varied to minimize the heat load. The glazing offset from exterior wall was
adjusted to satisfy the gross area & efficiency constraints. ................................ 113
Figure 4-5: Multiple Tower 1 alternative twist values were parametrically investigated
during the design process. a) 60 degree twist; b) 90 degree twist; c) final design
featuring a 90 degree twist and smaller glazing setback. ................................... 114
Figure 4-6 (a – d): 7 alternatives from over 1,000 generated options. The lack of a
formal methodology for defining and translating design requirements into
parametric models led to the construction of six unique models to generate 20
alternatives. ......................................................................................................... 116
Figure 4-7: Test case “half teardrop” site and the “half teardrop” scenario tower
footprint .............................................................................................................. 120
Figure 4-8: Requirements Model inputs. Project stakeholders: (a) determined 7
quantitative constraints and (b) 5 quantitative and qualitative goals; (c) each
stakeholder indicated his/her preference for the 5 identified goals by distributing
100 percentage points. Note that this example is showing only the Design
Architect preferences. ......................................................................................... 121
Figure 4-9: Requirements Model outputs - the system generates the goal importance
graph and normalized decision makers’ preferences to 100 points. ................... 122
Figure 4-10: “Half teardrop” Scenarios Model for constraint No. 1 – design architect
decomposed the constraint into Action Items, Strategies, Parameters, and
Parameter Constraints and determined how these relate to each other. Faded
nodes indicate strategies considered, but not chosen, to be implemented in the
parametric model. ............................................................................................... 124

Victor Gane
xvii
Figure 4-11: SM output – Actions impact on requirements graph. ‘Control half
teardrop configuration”, “ Control tower orientation and “Control unit width”
emerged as Action Items that impacted most project requirements. .................. 125
Figure 4-12: Component-level PPM showing the parametric model structured into 18
components. ........................................................................................................ 127
Figure 4-13: a) Detail-level PPM for the “half teardrop” scenario showing the
composition of the “Floor Plate” component; b) Test case tower floor plate
preview. .............................................................................................................. 128
Figure 4-14: ISR analysis false color map (blue indicates less radiation, red – more); a)
Alternative 1 – Worst (197,090 Wh/m2); b) Alternative 7 – Best (107,143
Wh/m2); c) Alternative 10 – surprising outcome (168,436 Wh/m2). ................ 131
Figure 4-15: Key parameters affecting the amount of direct solar radiation
accumulated by the tower’s exterior ................................................................... 131
Figure 4-16: Daylight analysis – false color map (blue indicates less daylight, yellow –
more); a) Alternative 1 – Worst (4,022,200 lux / floor); b) Alternative 8 – Best
(2,205,150 lux / floor); Alternative 10 – surprising outcome (3,411,600 lux /
floor) ................................................................................................................... 132
Figure 4-17: AAM “half teardrop” design scenario; a) impact scores for 10 design
alternatives and 5 goals; b) system generated value scores – overall, Alternative 7
emerged as the most successful .......................................................................... 133
Figure 4-18: Alternative 1 of “Triangular” design scenario ....................................... 134
Figure 4-19: AAM “Triangular” design scenario; System generated value scores –
overall, Alternative 8 emerged as most successful ............................................. 134
Figure 4-20: Scenarios Model for constraints No. 2 & 3 ........................................... 142
Figure 4-21: Diagrams illustrating how the balcony lengths were calculated balcony
perimeter length on north side; b) balcony perimeter arc length on south sides 143
Figure 4-22: Scenarios Model for constraint No. 4 .................................................... 144
Figure 4-23: Scenarios Model for constraints No. 5, 6, 7 .......................................... 144
Figure 4-24: Scenarios Model for Goal No. 1 ............................................................ 145
Figure 4-25: Scenario Model for Goals No. 2, 3 ........................................................ 146

Victor Gane
xviii
Figure 4-26: Scenario Model for Goals No. 4, 5 ........................................................ 147
Chapter 1: Introduction Victor Gane
1
Chapter 1: Introduction
The motivations behind this Ph.D. research are the process problems I encountered
while practicing conceptual design of buildings. As one of the pioneers of employing
parametric Computer Aided Design (CAD) methods in the conceptual design of
buildings, I discovered that current design process methods cannot be used to build
effective parametric CAD models. To fully leverage the potential of parametric
modeling in conceptual design of buildings, I developed a methodology called Design
Scenarios (DS), which I present in this dissertation.
The dissertation is organized into four chapters and follows the three-journal paper
format. The format has some redundancy because each paper stands on its own.
Chapter 1 illustrates what motivated and how I organized and conducted my research
and concludes with a summary of the research contribution. Chapter 2 is the first
journal paper, in which I benchmark current non-parametric conceptual design
processes. I propose an assessment method and metrics, which I retrospectively apply
on five industry cases. I support the findings with a survey of industry leading
Architecture Engineering design practices. Chapter 3 presents the second journal paper
in which I introduce the Design Scenarios methodology and the ontology required to
build multi-stakeholder driven parametric models and a software prototype to enable
measuring the methodology’s impact. Chapter 4 presents the third journal paper. I first
give an overview of two industry test cases to benchmark the application of parametric
CAD with existing, non-parametric conceptual design process. I continue the paper
with presenting the application of Design Scenarios methodology on one industry test
and gauge the methodology’s impact by comparing four data sets: (1) Current non-
parametric process; (2, 3) Current parametric process with traditional design methods;
(4) Improved parametric process with DS methodology.
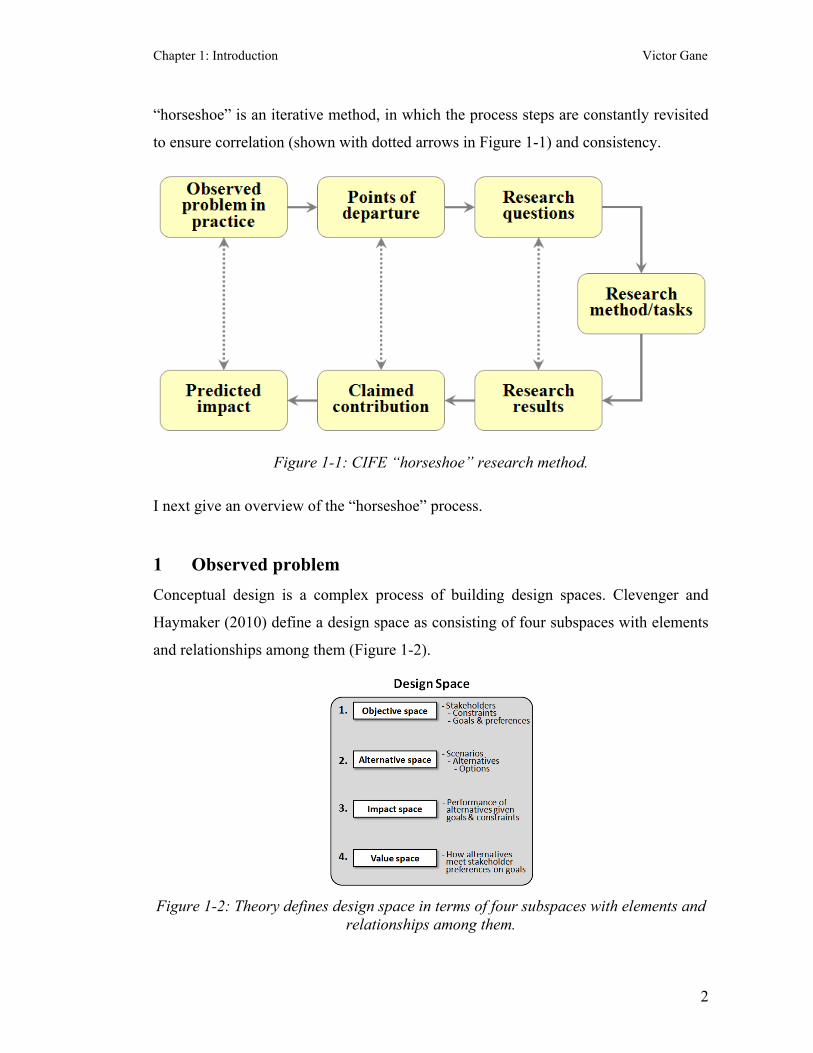
To structure my research I used the seven-step Center for Integrated Facility
Engineering (CIFE) “horseshoe” method (Fischer, 2006) illustrated in Figure 1-1. The
Chapter 1: Introduction Victor Gane
2
“horseshoe” is an iterative method, in which the process steps are constantly revisited
to ensure correlation (shown with dotted arrows in Figure 1-1) and consistency.
Figure 1-1: CIFE “horseshoe” research method.
I next give an overview of the “horseshoe” process.
1 Observed problem Conceptual design is a complex process of building design spaces. Clevenger and
Haymaker (2010) define a design space as consisting of four subspaces with elements
and relationships among them (Figure 1-2).
Figure 1-2: Theory defines design space in terms of four subspaces with elements and
relationships among them.
Chapter 1: Introduction Victor Gane
3
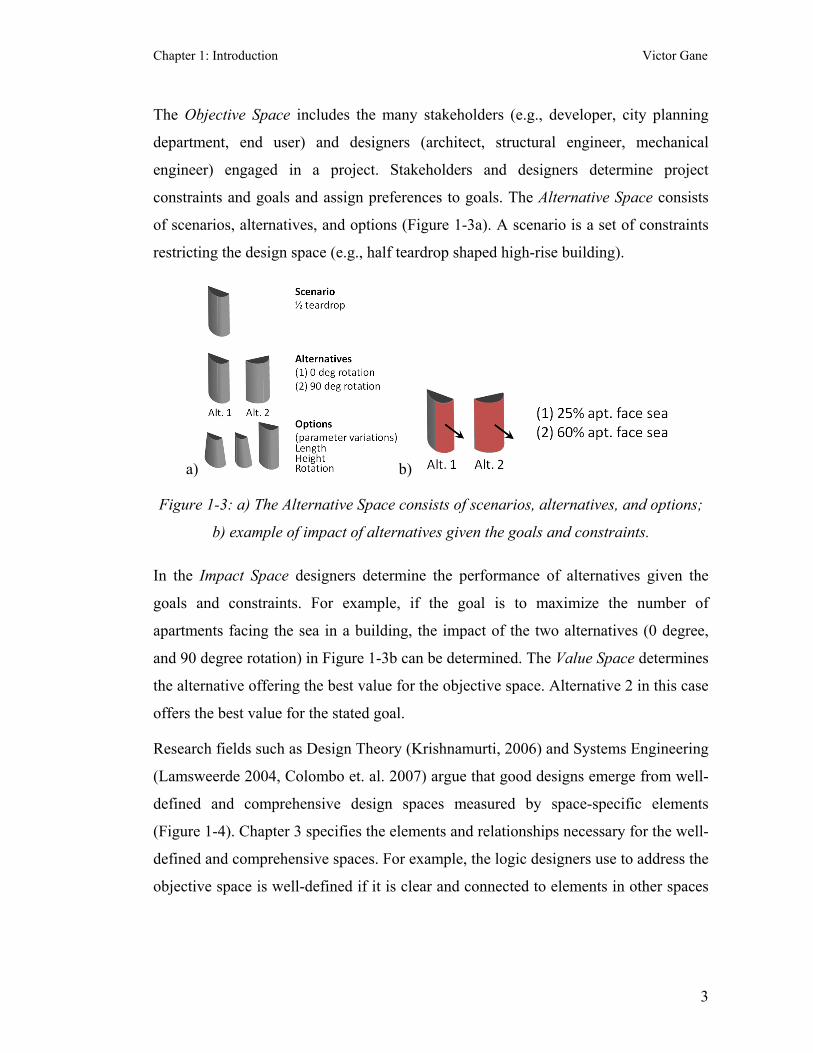
The Objective Space includes the many stakeholders (e.g., developer, city planning
department, end user) and designers (architect, structural engineer, mechanical
engineer) engaged in a project. Stakeholders and designers determine project
constraints and goals and assign preferences to goals. The Alternative Space consists
of scenarios, alternatives, and options (Figure 1-3a). A scenario is a set of constraints
restricting the design space (e.g., half teardrop shaped high-rise building).
a) b)
Figure 1-3: a) The Alternative Space consists of scenarios, alternatives, and options;
b) example of impact of alternatives given the goals and constraints.
In the Impact Space designers determine the performance of alternatives given the
goals and constraints. For example, if the goal is to maximize the number of
apartments facing the sea in a building, the impact of the two alternatives (0 degree,
and 90 degree rotation) in Figure 1-3b can be determined. The Value Space determines
the alternative offering the best value for the objective space. Alternative 2 in this case
offers the best value for the stated goal.
Research fields such as Design Theory (Krishnamurti, 2006) and Systems Engineering
(Lamsweerde 2004, Colombo et. al. 2007) argue that good designs emerge from well-
defined and comprehensive design spaces measured by space-specific elements
(Figure 1-4). Chapter 3 specifies the elements and relationships necessary for the well-
defined and comprehensive spaces. For example, the logic designers use to address the
objective space is well-defined if it is clear and connected to elements in other spaces

Chapter 1: Introduction Victor Gane
4
(e.g., goals) and is comprehensive if all stakeholders participated in developing this
logic.
Figure 1-4: Design Theory and Systems Engineering say that design spaces need to be
both well-defined and comprehensive.
How well does the industry build these design spaces today? In a typical one month
long conceptual design process, with non-parametric methods design teams can
generate on average only three alternatives (Gane and Haymaker, 2010). Parametric
CAD, on the other hand, offers the ability to generate thousands of alternatives
(Kolarevic, 2003). However, in addition to generating large quantities of parametric
alternatives to improve the probability of identifying alternatives with higher value as
motivated by Design Theory (Akin, 2001), it is important to make sure such
alternatives are driven by objectives, and analyzed for multidisciplinary impacts.
Today there exists a gap between the world of design and computing, in which
designers’ concepts need to be translated into computable models. Goals and
constraints are neither clear nor defined by all stakeholders. CAD experts therefore
struggle to build requirements-driven CAD models because they don’t have a well-
defined and comprehensive set of input and output parameters and designer’ logic for
addressing Objective Spaces. Furthermore, designers cannot use such models to select
among alternatives with well-defined impact and value measures. I describe two
industry test cases motivating this problem in Chapter 4.
Chapter 1: Introduction Victor Gane
5
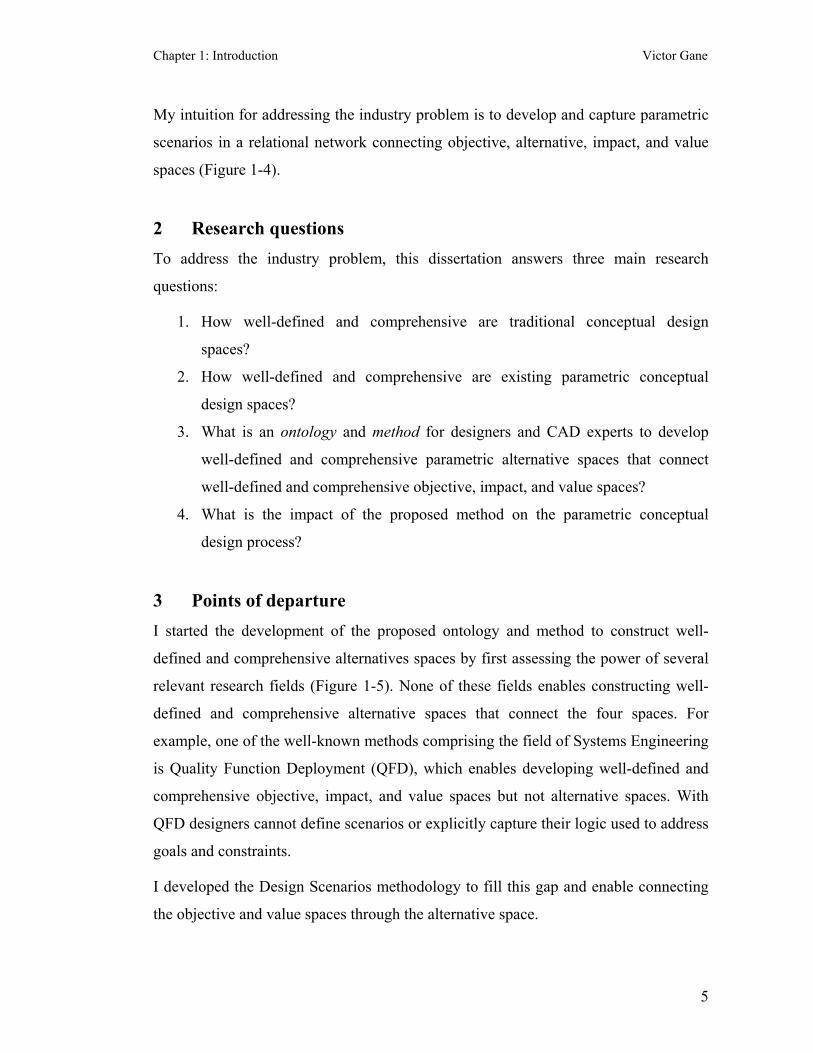
My intuition for addressing the industry problem is to develop and capture parametric
scenarios in a relational network connecting objective, alternative, impact, and value
spaces (Figure 1-4).
2 Research questions To address the industry problem, this dissertation answers three main research
questions:
1. How well-defined and comprehensive are traditional conceptual design
spaces?
2. How well-defined and comprehensive are existing parametric conceptual
design spaces?
3. What is an ontology and method for designers and CAD experts to develop
well-defined and comprehensive parametric alternative spaces that connect
well-defined and comprehensive objective, impact, and value spaces?
4. What is the impact of the proposed method on the parametric conceptual
design process?
3 Points of departure I started the development of the proposed ontology and method to construct well-
defined and comprehensive alternatives spaces by first assessing the power of several
relevant research fields (Figure 1-5). None of these fields enables constructing well-
defined and comprehensive alternative spaces that connect the four spaces. For
example, one of the well-known methods comprising the field of Systems Engineering
is Quality Function Deployment (QFD), which enables developing well-defined and
comprehensive objective, impact, and value spaces but not alternative spaces. With
QFD designers cannot define scenarios or explicitly capture their logic used to address
goals and constraints.
I developed the Design Scenarios methodology to fill this gap and enable connecting
the objective and value spaces through the alternative space.

Chapter 1: Introduction Victor Gane
6
Figure 1-5: Selection of theoretical points of departure used in this dissertation.
4 Research method / tasks Developing the methodology and the software prototype was a significant research
task. DS methodology builds models for each of the four spaces (Figure 1-6). I divided
the alternative space into two subspaces: (a) logic, where the designer’s logic is
captured, and (b) geometry, where the CAD experts use designer’s logic to build
requirements-driven parametric models.
To reflect the multi-stakeholder nature of the design process, each model contains
various enablers, who are either humans or the computer. Enablers (e.g., Designer)
generate elements (i.e., Constraint) with a set of methods (e.g., Create objective). The
selection of methods and elements vary for each model with a total of 30 methods and
29 elements. Figure 1-6 does not include the methods, which are illustrated in Figures
1-7 – 1-11. I used observations of the concepts design teams use in industry and
literature review to build DS elements. For example, MACDADI (Haymaker et. al.

Chapter 1: Introduction Victor Gane
7
2006) and Requirements Engineering (Lamsweerde, 2000) provided the foundation for
the elements in the objective, impact, and value spaces. On the other hand, I motivated
the elements in the alternative space logic based on my knowledge and understanding
of the concepts design teams currently use implicitly in the industry as well Points of
Departure such as Requirements Engineering (e.g., First Order Logic).
Figure 1-6: Design Scenarios Methodology schema and connections among four
spaces.
DS is an iterative process of building interconnected models for each of the five
spaces. The enablers in the objective space are the project stakeholders and designers
who determine goals and constraints and assign preferences to goals in a tabular model
environment. Figure 1-7 illustrates the DS set of enablers, methods, and elements for
building objective space models. In the software prototype the objective space is
captured in the Requirements Model.
Chapter 1: Introduction Victor Gane
8
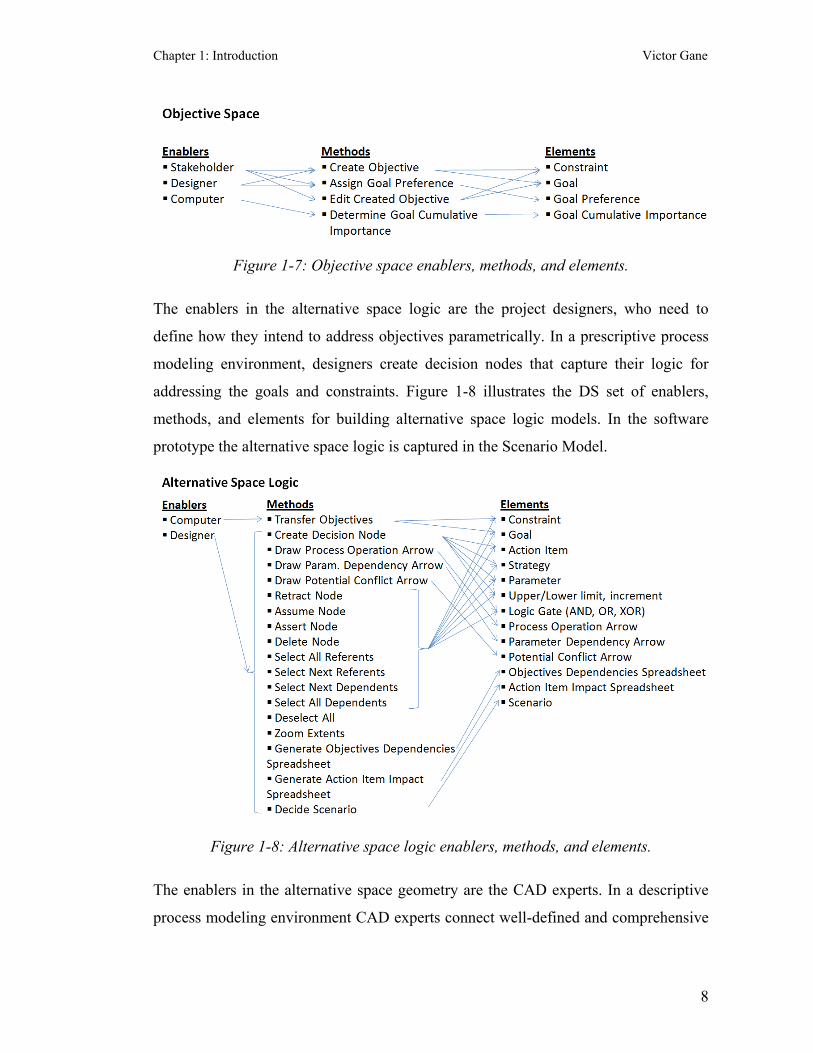
Figure 1-7: Objective space enablers, methods, and elements.
The enablers in the alternative space logic are the project designers, who need to
define how they intend to address objectives parametrically. In a prescriptive process
modeling environment, designers create decision nodes that capture their logic for
addressing the goals and constraints. Figure 1-8 illustrates the DS set of enablers,
methods, and elements for building alternative space logic models. In the software
prototype the alternative space logic is captured in the Scenario Model.
Figure 1-8: Alternative space logic enablers, methods, and elements.
The enablers in the alternative space geometry are the CAD experts. In a descriptive
process modeling environment CAD experts connect well-defined and comprehensive

Chapter 1: Introduction Victor Gane
9
designers’ logic represented by input and output parameters to computable parametric
models. Figure 1-9 illustrates the DS set of enablers, methods, and elements for
building the structure of CAD models. In the software prototype the alternative space
geometry is captured in the Parametric Process Model, which CAD experts use to
construct the CAD model and generate design alternatives.
Figure 1-9: Alternative space geometry enablers, methods, and elements.
The enablers in the impact space are the designers. In a tabular model environment
designers record the impact scores for the generated alternative based on how each
alternative meets objective targets. Figure 1-10 illustrates the DS set of enablers,
methods, and elements for building impact space models. In the software prototype the
impact space is captured in the Alternatives Analysis Model.

Chapter 1: Introduction Victor Gane
10
Figure 1-10: Impact space enablers, methods, and elements.
The enabler in the value space is the computer, which builds a tabular model
determining the overall value score for every generated alternative by summing the
product of the cumulative importance of every goal with the impact score of that goal.
Figure 1-11 illustrates the DS set of enablers, methods, and elements for building
value space models. In the software prototype the value space is captured in the
Alternatives Analysis Model.
Figure 1-11: Value space enablers, methods, and elements.
5 Research results / validation I used the Action Research (Hartmann et. al. 2008) and Case Study methods to
benchmark how well-defined and comprehensive are the objective, alternative, impact,
and value spaces for existing non-parametric, parametric, and DS-supported
parametric conceptual design processes. I was the embedded researcher on eight
industry test cases: (a) five projects benchmarking existing non-parametric design
process (one shown in Figure 1-12a); (b) Infinity Tower in Dubai, UAE, and (c)
Transbay Tower in San Fransicsco benchmarking existing parametric design process;
(d) Jeddah Towers in Jeddah, Saudi Arabia benchmarking DS-supported design
process. All test cases were Skidmore Owings and Merrill projects. On the Infinity and
Transbay Tower test cases I had the roles of a designer and CAD expert and
Chapter 1: Introduction Victor Gane
11
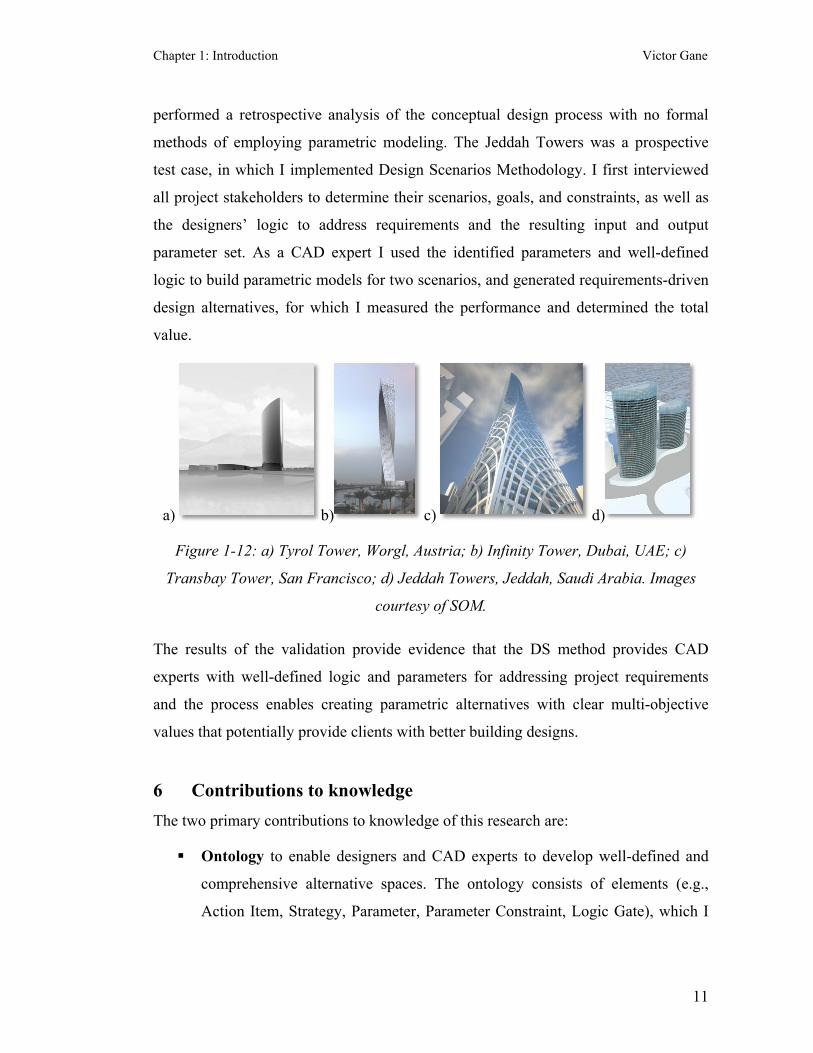
performed a retrospective analysis of the conceptual design process with no formal
methods of employing parametric modeling. The Jeddah Towers was a prospective
test case, in which I implemented Design Scenarios Methodology. I first interviewed
all project stakeholders to determine their scenarios, goals, and constraints, as well as
the designers’ logic to address requirements and the resulting input and output
parameter set. As a CAD expert I used the identified parameters and well-defined
logic to build parametric models for two scenarios, and generated requirements-driven
design alternatives, for which I measured the performance and determined the total
value.
a) b) c) d)
Figure 1-12: a) Tyrol Tower, Worgl, Austria; b) Infinity Tower, Dubai, UAE; c)
Transbay Tower, San Francisco; d) Jeddah Towers, Jeddah, Saudi Arabia. Images
courtesy of SOM.
The results of the validation provide evidence that the DS method provides CAD
experts with well-defined logic and parameters for addressing project requirements
and the process enables creating parametric alternatives with clear multi-objective
values that potentially provide clients with better building designs.
6 Contributions to knowledge The two primary contributions to knowledge of this research are:
Ontology to enable designers and CAD experts to develop well-defined and
comprehensive alternative spaces. The ontology consists of elements (e.g.,
Action Item, Strategy, Parameter, Parameter Constraint, Logic Gate), which I
Chapter 1: Introduction Victor Gane
12
developed by combining industry knowledge and theory. Figure 1-6 illustrates
the ontology in which the novel elements are highlighted.
Design Scenarios Methodology (DS) to enable design teams connect through
alternative spaces the project requirements from the objective space to well-
defined and comprehensive values of alternatives determined in the value
space. DS consists of model-specific enablers (e.g., CAD expert in the
alternative space geometry), methods (e.g., draw geometry node), and elements
(e.g., geometric primitive). Elements in the five DS models are interconnected
(e.g., parameters in the alternative space logic and parameters in the alternative
space geometry). Figure 1-6 illustrates the connections among the five models
through the horizontal highlighted arrows.
7 Predicted practical impact This research determined that current conceptual design process is characterized by
poorly defined, incomplete, and disconnected objective and value spaces. I anticipate
DS methodology to enable design teams to:
Develop comprehensive, multi-stakeholder project requirements;
Guide the designers’ alternative generation process and help CAD experts
build better parametric models;
Provide clients with better performing building designs by clearly
understanding the difference in the overall value of each generated design
alternative;
Improve productivity of design teams and greatly reduce the number of
negative iterations.
Figure 1-13 illustrates a selection of quotes from the industry leaders in support of the
anticipated impact of DS methodology.

Chapter 1: Introduction Victor Gane
13
Figure 1-13: Quotes collected from DS validation on industry projects.
8 Conclusion The validation of DS methodology has several limitations. I was the only researcher to
implement the methodology and perform the measurements, which come from a single
industry test case. Therefore, future work is to extend external validity by having
design teams apply the DS methodology on more industry projects. DS also offers
opportunities for automating the generation of the parametric CAD model from the
Parametric Process Model, as well as integrate and automate the impact section of the
Alternatives Analysis Model with multidisciplinary optimization methods.
Design Scenarios bridges two important worlds of design and computing. For
example, researchers at the Design School at Stanford follow and develop more
human centric design methods as opposed to researchers at the Center for Integrated
Facility Engineering, who take a more mechanistic approach to design. I developed
Design Scenarios method to enable designers to combine both approaches and
integrate human thinking and creativity into a formal but flexible structure to support
creative and systematic design exploration.
9 References Akın, Ö. (2001). “Variants of design cognition”, Design Knowing and Learning:
Cognition in Design Education. Eastman, C., Newsletter, W., & McCracken,
M., Eds., pp. 105–124. New York: Elsevier.

Chapter 1: Introduction Victor Gane
14
Chachere, J., Haymaker J. (2011). “Framework for measuring rationale clarity of AEC
design decisions.” Journal of Architectural Engineering, doi: 10.1061/ (ASCE)
AE.1943-5568.0000036.
Clevenger, C., Haymaker, J. (2011). “Metrics to assess design guidance.” Design
Studies, doi:10.1016/j.destud.2011.02.001.
Colombo, G., Mosca, A., Sartori, F. (2007). “Towards the design of intelligent CAD
systems: An ontological approach”. Advanced Engineering Informatics 21, pp.
153–168.
Fischer, M. (2006). Formalizing Construction Knowledge for Concurrent
Performance-Based Design. Intelligent Computing in Engineering and
Architecture, 4200:186-205. Berlin / Heidelberg: Springer.
http://dx.doi.org/10.1007/11888598_20 last accessed on May 12, 2010.
Gane, V., Haymaker, J. (2010). “Benchmarking current conceptual high-rise design
processes”, ASCE Journal of Architectural Engineering. Vol. 16, No. 3. pp.
100-111.
Haymaker, J. and Chachere, J. (2006). “Coordinating Goals, Preferences, Options, and
Analyses for the Stanford Living Laboratory Feasibility Study,” Intelligent
Computing in Engineering and Architecture 13th EG-ICE Revised Selected
Papers, Lecture Notes in Computer Science, Vol. 4200/2006, Ian Smith (ed.),
Springer-Verlag, Berlin, Heidelberg, New York, pp. 320-327.
Kolarevic, B. (Ed), (2003). “Architecture in the Digital Age: Design and
Manufacturing”. Taylor & Francis.
Krishnamurti, R., (2006), “Explicit design space?” Artificial Intelligence for
Engineering Design, Analysis and Manufacturing. Vol. 20, pp. 95-103.
Lamsweerde A (2000). “Requirements engineering in the year 2000: A research
perspective”. In: Proceedings of 22nd International Conference on Software
Engineering, (ICSE’2000): Limerick, Ireland, Invited Paper, ACM Press, pp.
5–19.

Chapter 1: Introduction Victor Gane
15
Lamsweerde A (2001). “Goal-Oriented Requirements Engineering: A Guided Tour”.
Proceedings RE’01, 5th IEEE International Symposium on Requirements
Engineering, Toronto, pp. 249-263.
Ross, D., Schoman, E. (1977). “Structured Analysis for Requirements Definition”.
IEEE Transactions on Software Engineering, Vol. SE-3, No. 1, pp. 6-15.

Chapter 2: Benchmarking current conceptual design processes Victor Gane
16
Chapter 2: Benchmarking current conceptual design
processes
Victor Gane, John Haymaker
1 Abstract This paper presents an analysis of current conceptual design processes for high-rise buildings.
We synthesize a method to document and measure these processes and use it to analyze data
from several case studies and a survey of leading architectural and engineering design firms.
We describe current high-rise conceptual design process in terms of the following: design
team size, composition, and time investment; clarity of goal definition; number and range of
design options generated; number and type of model-based analyses performed; and the
criteria used for decision making. We identify several potential weaknesses in current design
processes including lack of clarity in goal definition and a low quantity of generated and
analyzed options. We argue that potentially higher performing designs are being left
unconsidered, and discuss the potential reasons and costs.
2 Introduction: Need for Effective Conceptual High-Rise Design
Processes The twentieth century experienced an unprecedented demographic shift. The world
population more than doubled in the last 40 years. A 2004 United Nations report
predicts that by 2050 the world population is expected to exceed 9 billion, and by
2010 the world’s urban population for the first time will surpass the rural one. Across
the globe, low-density urban sprawl is the solution to population growth. There is
mounting consensus among the scientific community that urban sprawl has significant
negative social, economic and environmental implications (McElfish 2007, Kienast
et.al. 2003). Four billion additional people will need housing and work places in just a
few decades. An immediate way to address population growth is for cities to support
high-density buildings, particularly high-rises. Over the past century, high-rises have
successfully and increasingly responded to this need. We calculate that housing for 4

Chapter 2: Benchmarking current conceptual design processes Victor Gane
17
billion people will require constructing close to 4 million 40-storey high rise buildings
(each with 1,050 occupants in 350 units).
Yet most high-rises perform poorly in terms of lifecycle cost, environmental impact
and social benefit. According to Yeang (1996), in a 50-year lifecycle of a high-rise,
energy costs contribute 34% of the total cost. Close to 50% of energy use in high-rises
comes from artificial illumination (Chartered Institution of Building Services
Engineers 1997). Kaplan (2004) indicates that a typical high-rise building is made of
poor quality materials and is aesthetically mundane. Successful high-rise designs need
to use a minimum of nonrenewable energy, produce limited pollution, and minimize
their carbon footprint, without diminishing the comfort, health, functional needs, and
safety of the people who inhabit them.
To respond to these mounting environmental, economic, and social pressures, the
Architecture, Engineering, and Construction (AEC) industry needs to revise traditional
high rise design and analysis methods. Recent advances in computer-based methods
promise vastly improved design processes, but current teams are ill equipped to take
advantage of these new opportunities. To help them understand the reasons behind
current inefficiencies and develop and implement more integrated design and analysis
methods we must first document and measure existing conceptual high-rise design
processes in terms of quantifiable metrics on which to base and compare the
performance of prospective improvements.
Little research has been carried out in this area; the goal of this paper is to fill the gap.
Through literature review and industry-based case studies, this paper develops a
definition and relevant metrics describing conceptual high-rise design processes, and
applies this definition and metrics to a set of contemporary case studies and survey
data. We find that conceptual design teams generally operate with low project goal
clarity, and generate very few formal design options and analyses that neglect
environmental and life-cycle economic considerations. We conclude with a discussion
about the potential causes and costs of today’s greatly underperforming high-rise
design processes.

Chapter 2: Benchmarking current conceptual design processes Victor Gane
18
2.1 Points of departure: What are current high-rise design processes and how
do we document and measure them?
In this section, we look to design theory for a theoretical definition of high-rise design
processes; to process modeling for a method to describe and measure these processes;
and to high rise-specific literature for classification and key design criteria.
2.1.1 Design theory
Akin (2001) formulates conceptual design as a five-step process: 1) identifying a set of
requirements; 2) prioritizing among these requirements; 3) developing preliminary
solutions; 4) evaluating solutions; and 5) establishing final design requirements,
preferences and evaluation criteria. Haymaker and Chachere (2007) further formalize
these distinctions in the MACDADI (Multi-Attribute Decision Assistance for Design
Initiatives) framework, which includes: 1) organizations – a project’s stakeholders,
designers, gatekeepers and decision makers; 2) goals – these organizations’
constraints, objectives, and preferences; 3) options – design options and methods to
generate them; 4) analyses – the methods, timing, and types of analyses performed;
and 5) decisions – rationale and process for making decisions. This paper is structured
using these MACDADI distinctions.
Design is an unbounded process; there are infinite numbers of organizations, goals,
options, analyses, and decisions that a team potentially can consider. Simon (1991) in
his behavioral theory of bounded rationality describes people as partially rational
when making decisions, due to computational limitations in gathering and processing
information. Woodbury and Burrow (2006) also argue that designers typically
consider a very small number of alternatives in their work as a result of cognitive
limits. As a result, designers often make decisions without fully understanding their
implications.
To develop solutions, designers first establish a design space. Krishnamurti (2006)
defines a design space as the sum of the problem space, solution space, and design
process. A problem space includes only the candidate solutions that satisfy the
established design requirements. A solution space includes all candidate solutions for
Chapter 2: Benchmarking current conceptual design processes Victor Gane
19
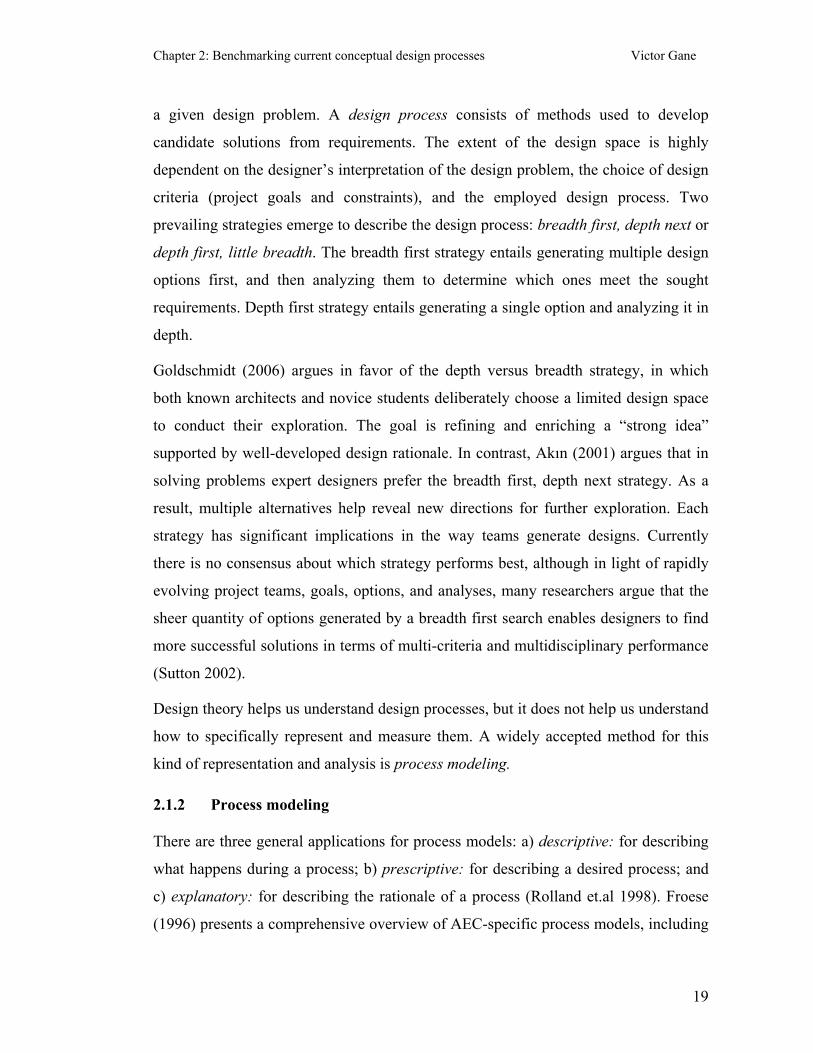
a given design problem. A design process consists of methods used to develop
candidate solutions from requirements. The extent of the design space is highly
dependent on the designer’s interpretation of the design problem, the choice of design
criteria (project goals and constraints), and the employed design process. Two
prevailing strategies emerge to describe the design process: breadth first, depth next or
depth first, little breadth. The breadth first strategy entails generating multiple design
options first, and then analyzing them to determine which ones meet the sought
requirements. Depth first strategy entails generating a single option and analyzing it in
depth.
Goldschmidt (2006) argues in favor of the depth versus breadth strategy, in which
both known architects and novice students deliberately choose a limited design space
to conduct their exploration. The goal is refining and enriching a “strong idea”
supported by well-developed design rationale. In contrast, Akın (2001) argues that in
solving problems expert designers prefer the breadth first, depth next strategy. As a
result, multiple alternatives help reveal new directions for further exploration. Each
strategy has significant implications in the way teams generate designs. Currently
there is no consensus about which strategy performs best, although in light of rapidly
evolving project teams, goals, options, and analyses, many researchers argue that the
sheer quantity of options generated by a breadth first search enables designers to find
more successful solutions in terms of multi-criteria and multidisciplinary performance
(Sutton 2002).
Design theory helps us understand design processes, but it does not help us understand
how to specifically represent and measure them. A widely accepted method for this
kind of representation and analysis is process modeling.
2.1.2 Process modeling
There are three general applications for process models: a) descriptive: for describing
what happens during a process; b) prescriptive: for describing a desired process; and
c) explanatory: for describing the rationale of a process (Rolland et.al 1998). Froese
(1996) presents a comprehensive overview of AEC-specific process models, including

Chapter 2: Benchmarking current conceptual design processes Victor Gane
20
IRMA (Information Reference Model for AEC, BPM - Building Project Model),
ICON (Information / Integration for Construction), and GRM (Generic Reference
Model). Most of these are based on EXPRESS-G modeling language (International
Alliance for Interoperability), which provides a foundation for graphically
representing process models. Other significant process modeling languages relevant to
this paper are: IDEF0 (Integrated Definition Models), used to model decisions, actions,
and activities of an organization or system; Narratives (Haymaker et. al. 2004), which
model information and the sources, nature, and status of the dependencies between
information; and Value Stream Mapping (Tapping et. al. 2002), which describe the
flow of actors, activities, task duration, and information that produce value in a given
process.
With these process-modeling languages, we can describe design processes but not
establish process measurement metrics. To address this problem various techniques
have been proposed; for example, to evaluate BIM (Building Information Model)
users practices and processes (McCuen et. al. 2007), to measure benefits from VDC
(Virtual Design and Construction) use and factors that contribute to its successful
implementation (Kunz et. al. 2007), or to simulate the impact of improvements to the
engineering design process (Sosa et. al. 2002).
In spite of the wealth of existing process modeling languages, none can describe and
measure design processes in terms of all the distinctions included in the MACDADI
framework. This paper later synthesizes a process model and metrics to describe high-
rise design team size and composition, the clarity of their goal definitions, the number
of design options they generate and analyze, the prevailing objectives used in their
decision making, the conceptual design duration, and the discipline-specific time
invested.
2.1.3 High-rise classification and key design criteria
In the late 19th century a wave of innovations in the building industry led to the
development of the first high-rises in Chicago and New York (Frampton 1992). The
elevator, the steel frame, and later the curtain wall and HVAC, along with the demand
Chapter 2: Benchmarking current conceptual design processes Victor Gane
21
for new office space on expensive and limited land, made the development of high-
rises possible and necessary. Despite the success of high rises, the AEC industry lacks
a consistent definition of the building type. The American Society of Heating,
Refrigeration and Air-conditioning Engineers (ASHRAE 1989) defines high-rises as
buildings in which the height is over three times the width, whereas structural
engineers define high-rises as buildings influenced primarily by wind loads (Council
on Tall Buildings and Urban Habitat 2000). High-rises can be categorized according to
their function, structural system type, and environmental control strategies. From a
functional standpoint, there are four types: residential, commercial, hospitality, and
mixed-use. This section briefly describes what is currently known about the
organizations, goals, options, and analyses of high-rise design processes.
Organizations
In high-rise design the developer is often the main decision maker. The developer
outlines the architectural program and the budget constraints, and may specify a
desired design language and construction start date. Future tenants are often involved
at the conceptual design stage, and many cities require a design to be approved by
neighbors. Gatekeepers such as city planning and building departments determine
building height and construction limitations.
Design firms involved in the design process include architects, structural and
mechanical engineers; later design phases include other consultants such as landscape,
egress or LEED. The majority of design firms are single disciplinary, offering either
architectural or engineering services, and are typically organized in a hierarchy. Figure
2-1 illustrates a representative design team hierarchy commonly found in high-rise
design practice. A design director makes high-level design decisions that help
determine the design space and therefore guide the design team, and represents the
firm in client review meetings. Any decisions made at such meetings are then
conveyed verbally or through sketches to the senior design and technical architects
who oversee the design process. Most of the drawings and calculations are done by
mid level and intern architects. The coordination between engineering and
architectural drawings is generally done by the senior technical architect.

Chapter 2: Benchmarking current conceptual design processes Victor Gane
22
Figure 2-1: Typical stakeholders and design team organizational hierarchy.
Goals (design criteria)
Several key design criteria must be considered when designing a high-rise. The Floor-
Area-Ratio (FAR) is calculated by dividing the gross floor area allowed on a site by
the net area of the site. FAR helps designers determine the maximum allowable
building height. Building area efficiency is calculated as a subtraction of the building’s
non-sealable area (core, circulation corridors, etc.) from its gross area. Generally, this
number must be at least 75% and represents the net saleable or rentable area. The lease
span, defined as the distance from the unit’s inner wall to the exterior glazing, varies
according to the building function. For residential high-rises, a maximum lease span of
10m is recommended given the daylight factor considerations. Office buildings with
an open plan allow for deeper spans of up to 14m or more when atriums are provided.
In the case of modular office layout a building depth of over 13m is considered
excessive (Eisele et. al 2002).

Chapter 2: Benchmarking current conceptual design processes Victor Gane
23
The main criterion in choosing a load-bearing system is the lateral stiffness for
resisting the wind and earthquake forces, which is governed by the total height
(Schueller 1986). Additional criteria include building height-to-width aspect ratio,
floor-to-floor height, interior layout, exterior wall, foundation systems, fire safety,
construction methods, and budget constraints.
The criteria in choosing the foundation type are the gravity loads, quality of the site’s
subsoil, water table level, and wind loads. Wind loads lead to significant vibration in
the upper floors, which provides additional stresses on the bed soils (Ulitskii et. al.
2003). The foundation piles often determine the location of the structural grid and
therefore may affect the overall building efficiency.
Fire safety is another important criterion. The core design needs to satisfy the number
and size of escape stairwells by determining the building occupancy, as well as
address the smoke extraction. Budget constraints often influence the structural
material choice.
Multiple design criteria exist to help improve environmental control strategies of high-
rises. High level concepts include maximizing reliance on natural ventilation and
daylight illumination, while -- depending upon the season and geographical location --
minimizing or maximizing the heat gain from direct sunlight along the building’s
perimeter areas.
Options
Facades have a significant influence on the aesthetics and symbolism of high-rises
(Council on Tall Buildings and Urban Habitat 2000). Two main types can be
distinguished: curtain wall (butt glazed, conventional mullion system, composite -
glass and cladding), and facades as expression of structure (reinforced concrete,
prefabricated panels, exoskeleton, etc.).
Circulation patterns influence the building’s efficiency. They are determined by the
configuration, number, and positioning of the service core(s) (i.e., single or multiple
internal or external). A typical core includes elevators (i.e., passenger, service,
dedicated to specific functions), fire-protected stairs, electrical / cable closet, riser

Chapter 2: Benchmarking current conceptual design processes Victor Gane
24
ducts, and sometimes washrooms. The core positioning will determine the floor plan
configuration, given the maximum allowable distance from the outermost point of the
corridor to the escape stair(s). When designing cores an important consideration is the
elevator cab aspect ratio. The preferred range is between 1:2 and 1:3 for maximizing
loading and unloading efficiency (Yeang 1996).
The Council on Tall Buildings and Urban Habitat (CTBUH) defines three major
structural systems: steel, reinforced concrete, and composite. The choice of structural
system determines the building aspect ratio limitations. Until recently, a 6:1 aspect
ratio was a constraint (Khan 2004). Currently, there are precedents for 10:1 or higher
(Pelli 1991). Floor heights in residential high-rises are generally smaller than in
commercial, and range between 2.5 - 3.5m. In commercial high-rises, floor heights
range between 3.3 - 4.5m. To maximize efficiency, interior layouts may often seek a
minimal presence of structural elements, which help choose alternative strategies
(exoskeleton, concrete tube, etc.) Generally, the architect’s choice of exterior wall
system will impact the structural solution. Until recently, the rule of thumb in curtain
wall-based high-rises was to vertically divide the façade into 1.5m increments due to
ease of assembly, cost savings, and flexible planning. Today, geometrically complex
high-rise designs demand variability in the exterior wall panel sizes and novel
structural solutions (Morphosis 2006).
Engineers can choose among multiple foundation types depending on the building
design and soil properties. Examples include cast-in-place telescoping piles, caissons,
slab-pile, piled-raft, mat foundation, etc.
Cost often can determine the design’s final choice of material. For example, reinforced
concrete is preferred in the developing world, given its cheaper cost and lower
construction skill requirements than for steel structures.
Two types of high-rises can be distinguished according to employed environmental
control strategies. First relies entirely on mechanical systems and is a net energy
consumer. The second type responds to the climate and site context.

Chapter 2: Benchmarking current conceptual design processes Victor Gane
25
The Chartered Institution of Building Services Engineers (CIBSE 1997) distinguishes
four types of natural ventilation systems: a) cross ventilation, with windows on both
sides; b) single-sided ventilation, with all the windows on one side; c) stack
ventilation, in which fresh air is drawn through windows and hot air is exhausted
through the roof; d) mechanically assisted, to increase the airflow in any of the first
three systems. In high-rises stack ventilation is the preferred strategy given that the
building’s height helps create a chimney effect. However, a good understanding of the
environmental conditions is important, as, for example, in hot and dry climates the
stack effect may not function during the day.
Light shelves or reflectors can be used to diminish the energy use in high-rises. Their
performance is subject to optimal orientation, determined by the building orientation
and geometry. Joachim (2006) presents an extensive study of how daylight is affected
by the high-rise geometry and the floor plan proportions as related to the core design.
He concludes that triangular footprints perform best by having the least amount of
dark spaces within a 10m span, followed by the square and circular configurations.
This study, however, is limited to centrally located cores. Yeang (1996) stresses the
importance of peripheral core location on east and west facades used as thermal
“buffer-zones,” leading to important reductions in air-conditioning loads and operation
costs. Additional benefits include access to daylight and natural ventilation into the
core area, making the building safer in case of power failure, and eliminating the
requirement for mechanical fire-fighting pressurization ducts.
Considering their height and external surface area, high-rises are well suited to take
advantage of emerging energy generation technologies. Integrating photovoltaic cells
(PVs) into the building’s exterior wall or louver system, for example, may become
feasible after understanding the local climate and context. This knowledge helps
choose optimal building orientation and location of PVs (i.e., non-shaded sections of
the building). Similarly, given substantial wind velocities at high altitudes, high-rises
can be volumetrically shaped to maximize the performance of integrated wind turbines
(i.e., Zero Energy Tower in Guangdong, China by SOM). Other technologies include

Chapter 2: Benchmarking current conceptual design processes Victor Gane
26
geothermal energy and thermal storage, evaporative cooling systems for arid climates,
etc.
Analyses and Decisions
Designing high-rise buildings is a complex process as illustrated by the criteria
discussed above. As a result, many prototypes have been developed in academia and
practice to address aspects of the design processes as heuristic rules that automate
some of these processes and help designers make decisions more efficiently. Danaher
(2000) argues that by not being well defined the conceptual design is reserved only to
senior, experienced designers. He proposes the use of knowledge-based expert
systems in facilitating the access of junior designers to expert knowledge, in which the
system guides them towards good solutions. Several such systems surveyed by
Danaher are Hi-Rise (Maher et. al. 1985), Tallex (Sabouni et. al. 1997), Conceptual
(Haber et. al. 1990), Predes (Fleming et. al. 1990), and Archie-II (Domeshek et. al.
1992).
Ongoing research efforts address various aspects of conceptual high-rise design in
practice. Baker (2008), for example, explores the use of novel, proprietary
computational tools based on evolutionary structural optimization, genetic algorithms,
etc. in generating topological structural studies of high-rises. Whitehead (2003)
develops custom parametric tools to facilitate the design space exploration. The use of
such tools has led to new architectural expressions. In addition, such challenging
environmental performance criteria as energy, daylight, or natural ventilation can now
be understood through the use of discipline specific model-based analysis tools (i.e.
EnergyPlus, Radiance, Fluent).
Despite these promising developments, the AEC industry currently lacks case studies
describing high-rise design processes and how well these processes perform. This lack
of data makes it hard to understand the impact of the above-mentioned or future
solutions on the overall conceptual design process.

Chapter 2: Benchmarking current conceptual design processes Victor Gane
27
3 Methods: Documenting and Analyzing Current Practice This section explains our methods for describing and measuring the conceptual high-
rise design process. We develop and adapt a process modeling language to record and
communicate the design process, and collect metrics describing the process
performance.
3.1 Documenting Current Conceptual Design Process
Our research method involved using an embedded researcher (Hartmann et. al. 2008)
on several high-rise design teams to observe and document practice. We developed
our observations over five cases. Figure 2-2 describes the observed process used in
one of the cases. To document our observations, we synthesized a process-modeling
notation from IDEF0 and Narratives (Haymaker et. al. 2004). A typical process node
shown in the legend in Figure 2-2 captures the actor(s) that performs the action
(project manager, architect, structural engineer, etc.), the tool or method used to
generate information or make a decision (CAD, team meeting, etc.), the abbreviated
description of the performed action, the time range to perform the action, and finally
the input information needed to perform the action as well as the resulting output
information. If several actors are involved in implementing parts of the same process,
the time tab indicates a cumulative value. The arrows to the input or from the output
nodes indicate observed information dependencies.

Chapter 2: Benchmarking current conceptual design processes Victor Gane
28
Figure 2-2: Process model describing the case
study conceptual design. Nodes A & B describe
the early stages, in which decisions about team
size, composition, duration, and deliverables
were made by the design firm owner, project
manager, and senior designer. Nodes C, D, &
E describe the process by which the design
team evaluated the project context and
requirements and proposed the first design
concepts in a design charrette. Nodes F, G, H,
& I describe the process by which the design
team developed 2D working drawings to
calculate whether area and building efficiency
requirements were met and a 3D model for
visual evaluation of the design. Designers
repeated the process several times before these
requirements were met. Nodes J, K, L, M & N
show that only after the senior designer
accepted a design option for final development
were the mechanical and structural engineers
involved, the geometry for physical model
prototyping prepared, and the conceptual
design package assembled. Mechanical and
structural engineers rationalized the design
rather than participated from the beginning in
decision making. Adapted from SOM case study
project.

Chapter 2: Benchmarking current conceptual design processes Victor Gane
29
We use this notation to describe the conceptual design of the Tyrol Tower case study
in terms of a process model shown in Figure 2-2 and analyzed in the following
subchapter. In the case of Tyrol Tower the client commissioned a feasibility study for
a multi-tenant hotel and office tower on a complex site in the Tyrolean village of
Worgl, Austria. The tower site was contained by a roundabout 150m in diameter
intended to serve as an exit hub from the Munich – Verona freeway (Figure 2-3).
Figure 2-3: Tyrol Tower site, Worgl, Austria. With permission from SOM.
The project duration was set to two weeks. The decision about the team size and
project duration was determined by the project manager in conjunction with the firm’s
managing partner based on the contract amount, profit target, available personnel, and
the client-agreed requirements and schedule. This information was communicated
both verbally and by email to the senior designer, who decided in advance on the team
composition made of a senior architect, two mid level architects and a project
manager. The design process started with a set of loosely defined constraints, such as
the architectural program components (2 and 4 star hotel, offices), area requirements,
and height limitation. During the kickoff meeting the senior designer assigned
appropriate roles / tasks, established the required deliverables and milestones, and set
the first design charrette date.
In between the kickoff meeting and the charrette, the designers researched the
historical and cultural background of the Tyrolean region and studied the site context
and the project brief. This allowed each individual team member to develop a design
strategy before reconvening at the charrette, where after a review of the researched

Chapter 2: Benchmarking current conceptual design processes Victor Gane
30
materials (images, maps, facts, etc.), the senior designer sketched two concepts
(Figure 2-4a).
a) b)
Figure 2-4: a) Tyrol Tower concept sketches – skiing was the prevailing design theme;
the first concept was influenced by the shape of the slalom ski poll, the second
abstracted a skier in motion with a 2.5 degree inclination; b) massing, orientation,
and tower positioning strategy were influenced by the site geometry, prevailing wind
direction, and the need to link the tower to the adjacent site. With permission from
SOM.
Both concepts reflected the region’s strong skiing tradition. The first was inspired by
the shape of a slalom ski pole; the curve along the building height supported the
architectural transition from the area between the 4- and the 2-star hotel (the latter
required a smaller lease span). The second concept drew from the idea of a skier in
motion, and called for a 2.5-degree forward tilt to convey the notion of speed and
movement. Having agreed on the two design themes, the team proceeded to
developing strategies for the building’s massing and orientation / position within the
site (Figure 2-4b). The egg-shaped footprint was preferred over round, square, and
elliptical configurations, because of the site geometry and the prevailing wind
direction. The tower placement on the site was determined by the need to link it to an
adjacent site with a bridge.
At the end of the charrette, the team agreed to pursue the second concept for further
development. Such architectural considerations as aesthetics and context suitability
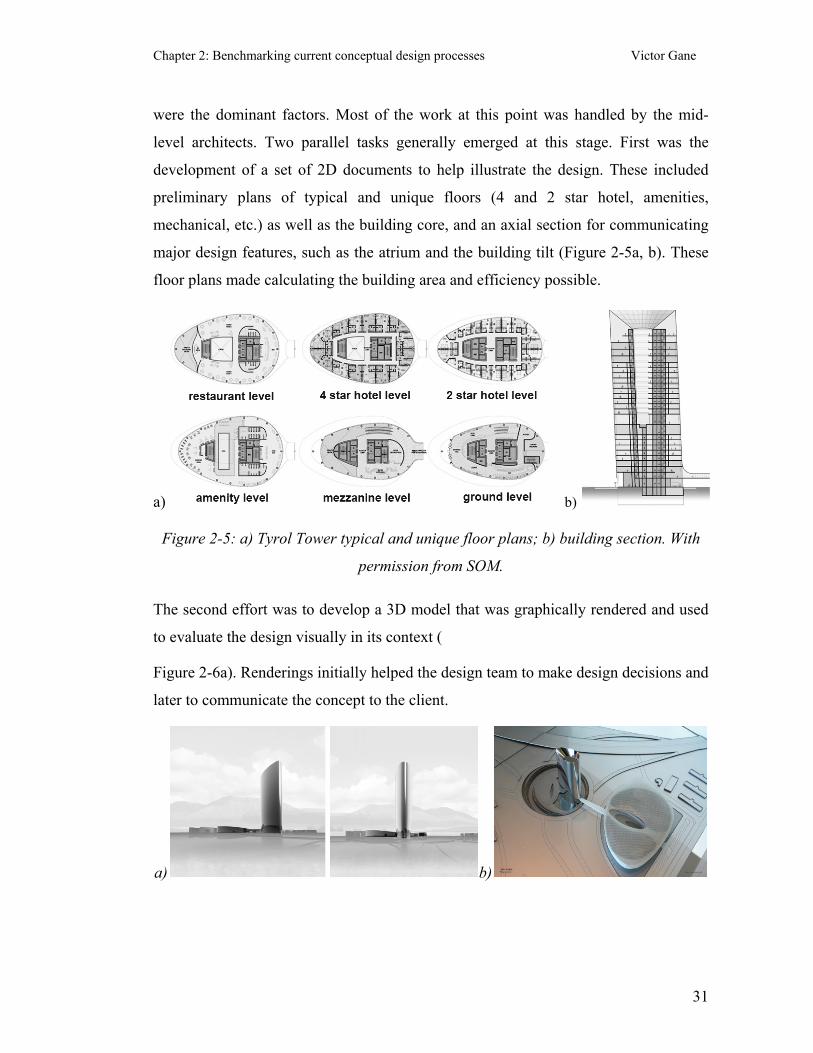
Chapter 2: Benchmarking current conceptual design processes Victor Gane
31
were the dominant factors. Most of the work at this point was handled by the mid-
level architects. Two parallel tasks generally emerged at this stage. First was the
development of a set of 2D documents to help illustrate the design. These included
preliminary plans of typical and unique floors (4 and 2 star hotel, amenities,
mechanical, etc.) as well as the building core, and an axial section for communicating
major design features, such as the atrium and the building tilt (Figure 2-5a, b). These
floor plans made calculating the building area and efficiency possible.
a) b)
Figure 2-5: a) Tyrol Tower typical and unique floor plans; b) building section. With
permission from SOM.
The second effort was to develop a 3D model that was graphically rendered and used
to evaluate the design visually in its context (
Figure 2-6a). Renderings initially helped the design team to make design decisions and
later to communicate the concept to the client.
a) b)
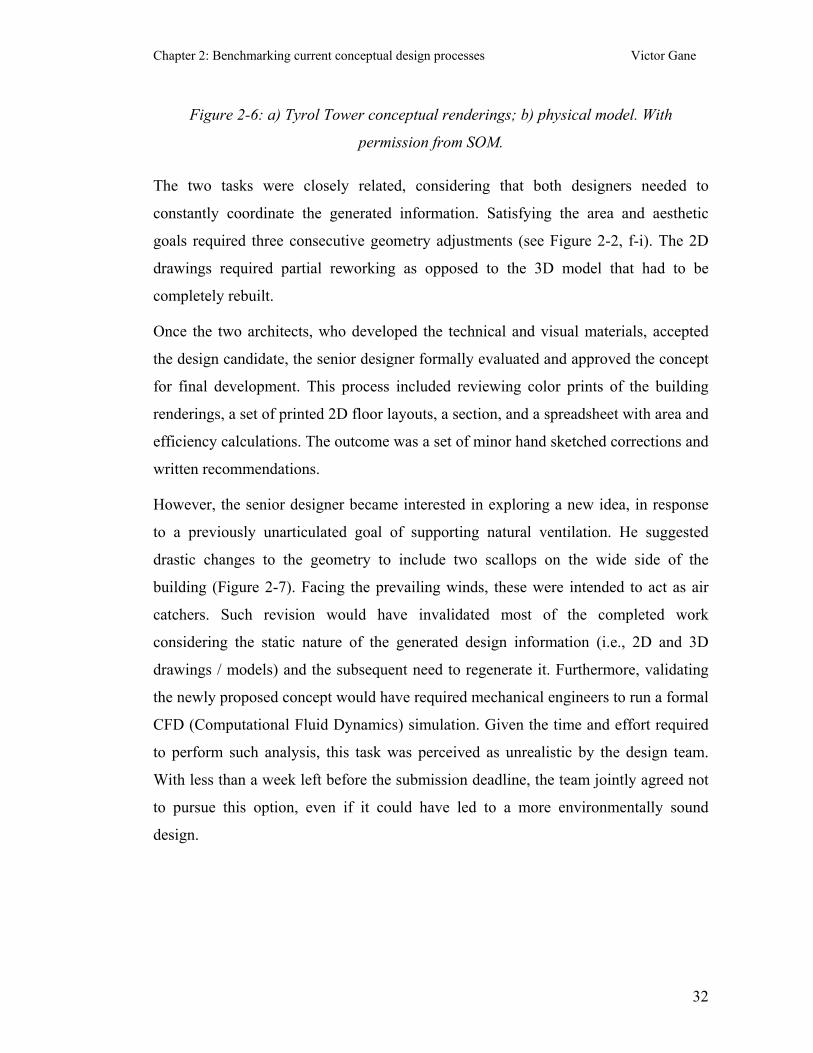
Chapter 2: Benchmarking current conceptual design processes Victor Gane
32
Figure 2-6: a) Tyrol Tower conceptual renderings; b) physical model. With
permission from SOM.
The two tasks were closely related, considering that both designers needed to
constantly coordinate the generated information. Satisfying the area and aesthetic
goals required three consecutive geometry adjustments (see Figure 2-2, f-i). The 2D
drawings required partial reworking as opposed to the 3D model that had to be
completely rebuilt.
Once the two architects, who developed the technical and visual materials, accepted
the design candidate, the senior designer formally evaluated and approved the concept
for final development. This process included reviewing color prints of the building
renderings, a set of printed 2D floor layouts, a section, and a spreadsheet with area and
efficiency calculations. The outcome was a set of minor hand sketched corrections and
written recommendations.
However, the senior designer became interested in exploring a new idea, in response
to a previously unarticulated goal of supporting natural ventilation. He suggested
drastic changes to the geometry to include two scallops on the wide side of the
building (Figure 2-7). Facing the prevailing winds, these were intended to act as air
catchers. Such revision would have invalidated most of the completed work
considering the static nature of the generated design information (i.e., 2D and 3D
drawings / models) and the subsequent need to regenerate it. Furthermore, validating
the newly proposed concept would have required mechanical engineers to run a formal
CFD (Computational Fluid Dynamics) simulation. Given the time and effort required
to perform such analysis, this task was perceived as unrealistic by the design team.
With less than a week left before the submission deadline, the team jointly agreed not
to pursue this option, even if it could have led to a more environmentally sound
design.

Chapter 2: Benchmarking current conceptual design processes Victor Gane
33
Figure 2-7: A late concept sketch proposed by the senior designer in response to the
previously unarticulated goal of providing the building with natural ventilation.
Implementing the proposed side scallops would have invalidated most of the
completed work, and because the time constraints the idea was abandoned. With
permission from SOM.
With natural ventilation becoming an important goal this late in the design process,
mechanical engineers were instead asked to recommend a solution strategy for the
originally developed option. The existing multidisciplinary collaborative model
generally does not support rapid model reuse. In other words, the architect-generated
geometry cannot be used by mechanical or structural engineers in their analyses.
Consequently, no model-based analysis was performed by mechanical engineers
because of the established process and the time constraint. Instead, they reused the
architectural section drawing to graphically illustrate the concept of air circulation
based on the stack effect (Figure 2-8 a, b). Similarly, structural engineers did not
generate model-based analyses and were asked to verbally validate the architect-
suggested structural concept of a centrally located reinforced concrete core and
perimeter column system.

Chapter 2: Benchmarking current conceptual design processes Victor Gane
34
a) b)
Figure 2-8: Information produced by mechanical engineers did not include any
model-based analyses but rather a set of conceptual, untested recommendations, such
as: a) stack effect diagram based on architect’s section; b) standardized graphs of
annual wet and dry bulb temperatures, wind rose, and annual direct solar radiation to
inform which months of the year were most suitable for natural ventilation. With
permission from SOM.
After the design director approved the concept design, the 3D geometry was meshed
and forwarded to a consultant in preparation for building the physical model. In this
case, the material choice for the tower was aluminum and the process of milling the
model was outsourced (Figure 2-6b). The site plan, however, was laser cut in house
using the earlier produced 2D drawings. In parallel, the team started preparing the
final presentation materials, which included coloring the earlier generated plans and
section, photographing the physical model, assembling a board with the project
metrics, and printing full-scale sheets for foam board mounting.
In summary, as shown in Figure 2-9, a team of four architects and three engineers
were able to generate three design options in two weeks. The alternatives were
variations of one design theme chosen for further development. The design process
was primarily based on architectural constraints. No clear goals were established until
close to the project submission deadline, making these impossible to implement. The
performed analyses addressed only architectural concerns. Architects used metaphoric
references on which to base their aesthetic analysis. They motivated the footprint
shape and the orientation of the building volume based on knowledge of prevailing

Chapter 2: Benchmarking current conceptual design processes Victor Gane
35
wind direction supplied by the mechanical engineers; however, no model-based
analysis was performed to understand the airflow and pressure on the chosen design.
Structural engineers were only verbally consulted.
Figure 2-9: Process performance metrics adapted from the SOM case study project.
The embedded observations enabled a detailed understanding of how current high-rise
design processes are performed and managed. However, while our other case studies
provided similar results, our sample size was small and limited to one firm on a
handful of projects. The next section describes a survey we conducted to provide some
evidence for the generality of our field observations.
3.2 A survey of industry professionals on current conceptual design process
We conducted an online survey of 20 senior architects and structural and mechanical
engineers from several leading AEC practices (Survey conducted between January-
May 2008). The survey contained 20 questions about their project’s team size and
composition, goal clarity, number and type of options generated and analyzed, and
prevailing goals in decision making. Respondents were asked to specify the high-rise
function. All four functional types were part of the survey, but almost 60% of answers
were mixed-use type. Fifty six percent rated the projects as moderately complex, and
38% as highly complex. We described a moderately complex designs were defined as
single curvature and including new building systems such as integrated wind
generators. A design of high complexity was defined as having double curved
geometry and using new materials and building systems.

Chapter 2: Benchmarking current conceptual design processes Victor Gane
36
3.2.1 Organizations
On average, we found design team size is 12 professionals with 65% being architects
(including project managers). Figure 2-10 shows on average over 70% of respondents
indicated one professional in each of the positions described in Figure 2-1, with the
exception of mid level and intern architects.
Figure 2-10: Average reported survey results of team size and composition. A typical
design team includes 12 professionals, 65% of whom are architects. Most design and
engineering positions were generally reported to be filled by a single professional
with the exception of intern (3) and mid-level architects (2).
We next asked whether goals were defined and, if so, what were the means to
communicate them (Figure 2-11a). Twelve percent of respondents’ answers indicated
a lack of any goal definition, and 82% pointed to goals being defined and
communicated only verbally.

Chapter 2: Benchmarking current conceptual design processes Victor Gane
37
a) b)
Figure 2-11: Average reported survey results (% respondents) showing: a) the
percentage of projects that employed each method of goals communication– goals on
most projects were communicated verbally; b) the clarity of the identified goals – most
had low to low / medium clarity (Note: respondents were allowed to choose multiple
answers).
Next, respondents rated the clarity of the identified goals (Figure 2-11b). We
differentiated among four levels of clarity: Low with a partial list without metrics
defined; Low / Medium with a partial list with partial metrics defined; Medium with a
complete list without metrics defined; and Comprehensive with a complete list with
metrics defined. About 70% of answers indicated low to low / medium goal clarity. As
one of the survey respondents pointed out, “Internal goals tend to be informal and
more conceptual than specific.” The results confirm our observations from the case
studies and help identify an important conclusion: even when goals are defined, they
often lack clarity of target metrics.
Figure 2-12: Average reported survey results (% respondents) showing: a) who
established project goals – mostly clients and architects with little or no participation
from engineers. b) major project constraints – most were determined by the developer
emphasizing commercial efficiency as opposed to lifecycle efficiencya confirms our
field observations concerning those who participate in goal definition. Over 80% of
respondents indicated the clients and close to 60% the architects, while structural and
mechanical engineers have a low participation in defining goals. This may lead to
important design criteria being omitted in early design decision making process and
require substantial design adjustments in later design phases. A respondent indicated
that “typically, the architect and the client discuss and agree on project goals and

Chapter 2: Benchmarking current conceptual design processes Victor Gane
38
parameters. The contractor and engineering disciplines often contribute to the
definition of these goals and refine and assess the metrics.”
a) b)
Figure 2-12: Average reported survey results (% respondents) showing: a) who
established project goals – mostly clients and architects with little or no participation
from engineers. b) major project constraints – most were determined by the developer
emphasizing commercial efficiency as opposed to lifecycle efficiency. (Note:
respondents were allowed to choose multiple answers).
Figure 2-12b illustrates which goals are generally addressed during conceptual design
of high-rises. Most responses indicated a prevalence of traditional, architect-driven
goals, such as creating a unique and iconic design, and for developer-driven goals,
such as building efficiency, area requirements, and construction budget. Five percent
of respondents indicated sustainable construction principles and energy conservation
as additional goals.
3.2.2 Options
Figure 2-13a and b show that close to 60% of respondents indicated that only two-to-
three options are generally produced, confirming our earlier case study findings. We
defined a new design option as any change that requires generating new or updated
architectural floor plans, elevations, sections, 3d model for generating simple
renderings, conceptual physical model, and a range of model-based analyses discussed
in the next subchapter. Over 90% of respondents indicated using such traditional tools
as AutoCAD, 3D Studio, and Photoshop for option generation. Fifteen percent
indicated the use of FormZ, Google SketchUp, and MS Access, among other tools.

Chapter 2: Benchmarking current conceptual design processes Victor Gane
39
Fifty six percent of respondents did not experience significant differences between the
time it took to generate each design option.
a) b)
Figure 2-13: Average reported survey results (% of respondents) showing: a) the
number of design options generated during conceptual design – majority indicated
three; b) tools used are traditional CAD or graphics software that support generating
single, static solutions. Very few respondents used emerging technologies, such as
parametric modeling or energy analysis tools. (Note: For question (b) the respondents
were allowed to choose multiple answers).
3.2.3 Analyses
Figure 2-14 illustrates that when asked which specific analyses are currently
performed at the conceptual stage of a high-rise one quarter of respondents indicated
performing Computation Fluid Dynamics (CFD), Energy or Daylight analyses.
However, our case study findings were confirmed by close to 78% of respondents,
who chose architectural requirements as the leading analyses criteria. Over 6%
indicated no analyses performed. Problems with interoperability of design and analysis
tools and schedule constraints make the incorporation of engineering performance
concerns difficult in conceptual design.

Chapter 2: Benchmarking current conceptual design processes Victor Gane
40
Figure 2-14: Average reported survey results (% respondents) showing the model-
based analyses performed during conceptual design. The performed analyses address
predominantly architectural concerns (i.e., budget constraints, program
requirements). (Note: respondents were allowed to choose multiple answers).
Our survey and case study findings both illustrate that the current conceptual design
process is dominated by architectural concerns analyzed both in terms of quantifiable
(i.e., cost, area, efficiency) and non-quantifiable metrics (i.e., aesthetics, context
suitability).
3.2.4 Decisions
Now that we have discussed the number and clarity of project goals and how design
options are generated and analyzed, we need to determine the criteria used in actually
making concept design decisions (Figure 2-15). The survey results support our earlier
findings. Such architectural criteria as aesthetics (100% of respondents), area
efficiency (63%), and site views (56%) are predominantly used in current design
decision-making process. A further 13% of respondents indicated it is harder to
quantify architectural criteria, such as identity, character, and human values. Less than
half of respondents indicated using structural or mechanical engineering performance
criteria.

Chapter 2: Benchmarking current conceptual design processes Victor Gane
41
Figure 2-15: Average reported survey results showing which objectives designers
consider when making design decisions. Architectural criteria (i.e., aesthetics, area
efficiency, site views) prevail over engineering performance criteria (i.e., energy
efficiency, natural ventilation, structural performance).
3.2.5 Time investment
Figure 2-16 summarizes the overall concept design duration in weeks. While no
dominant answer emerged, we conclude that in most conceptual design processes take
between 4 and 6 weeks (supported by three quarters of respondents).
Figure 2-16: Average reported survey results (% respondents) showing conceptual
design duration, which predominantly fluctuates between 4 - 6 weeks.
Figure 2-17a illustrates the time investment per design team member, while Figure
2-17b per discipline. Respondents were also instructed to include extra time invested
beyond the 8-hour workday. A disproportionately large amount of the total design
time is spent by architects (with an average of 1,850 hours) as opposed to by
engineers. The average mechanical engineer contributes 30 hrs, the average structural
engineer contributes 50 hrs, the average intern architect contributes 350 hrs, the
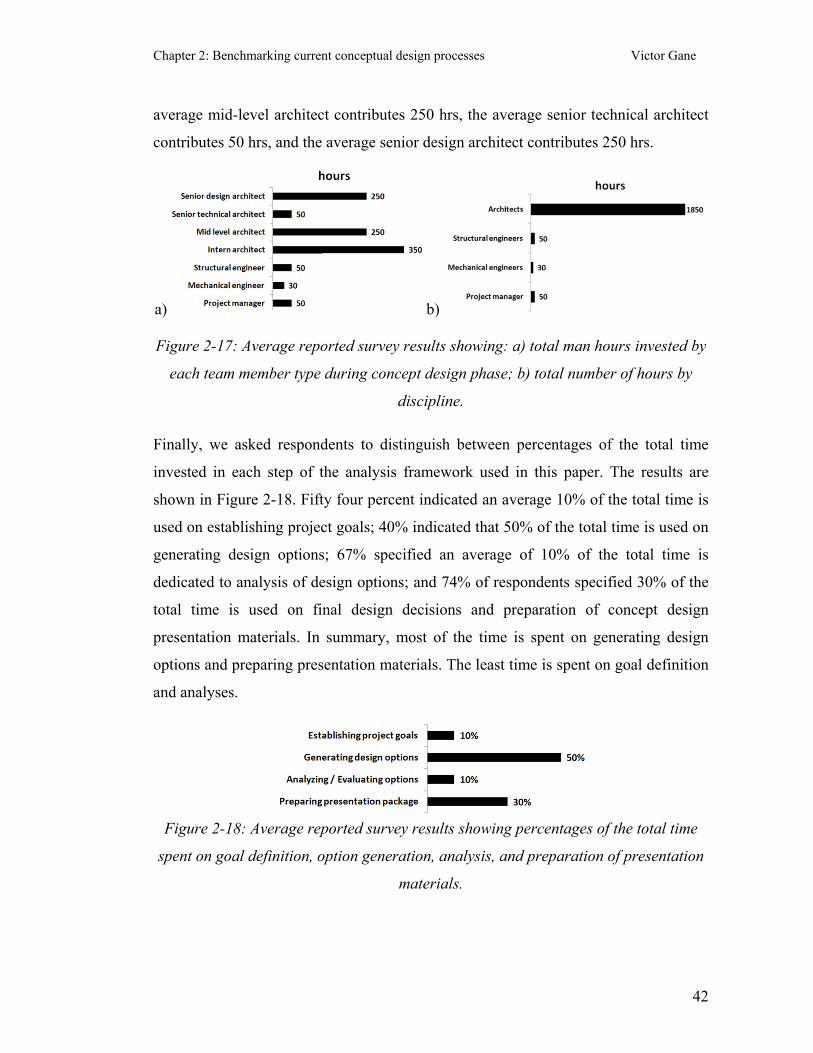
Chapter 2: Benchmarking current conceptual design processes Victor Gane
42
average mid-level architect contributes 250 hrs, the average senior technical architect
contributes 50 hrs, and the average senior design architect contributes 250 hrs.
a) b)
Figure 2-17: Average reported survey results showing: a) total man hours invested by
each team member type during concept design phase; b) total number of hours by
discipline.
Finally, we asked respondents to distinguish between percentages of the total time
invested in each step of the analysis framework used in this paper. The results are
shown in Figure 2-18. Fifty four percent indicated an average 10% of the total time is
used on establishing project goals; 40% indicated that 50% of the total time is used on
generating design options; 67% specified an average of 10% of the total time is
dedicated to analysis of design options; and 74% of respondents specified 30% of the
total time is used on final design decisions and preparation of concept design
presentation materials. In summary, most of the time is spent on generating design
options and preparing presentation materials. The least time is spent on goal definition
and analyses.
Figure 2-18: Average reported survey results showing percentages of the total time
spent on goal definition, option generation, analysis, and preparation of presentation
materials.

Chapter 2: Benchmarking current conceptual design processes Victor Gane
43
A summary of averaged survey results is shown in Figure 2-19. These triangulating
survey results closely corroborate our case study observations presented in Figure 2-9.
Figure 2-19: Averaged survey concept design process performance metrics.
4 Conclusion: Potential cost of underperforming conceptual design
processes The contributions of this paper are the new hybrid process models and quantified
measurements describing current conceptual design processes. While these findings
are limited to high-rise building type and for a limited number of case study and
survey participants, which makes it difficult to claim generality, the presented models
and metrics can help researchers and decision makers understand how complex
architecture-engineering design processes perform, can guide research and
development efforts to improve these measurements, and can serve as a benchmark for
comparing new design methods, tools and processes.
The market economy requires us to design quickly and cheaply; however, researchers
such as Sutton (2002) have shown that we can’t tell which new ideas will succeed and
which will fail at the outset, and that successful design is largely a function of sheer
quantity. Current design methods manage only a few potential designs without a deep
understanding of their multi-attribute performance. When coupled with increasing
complexity in the design requirements and available building technologies, design
teams are doomed to produce underperforming buildings.
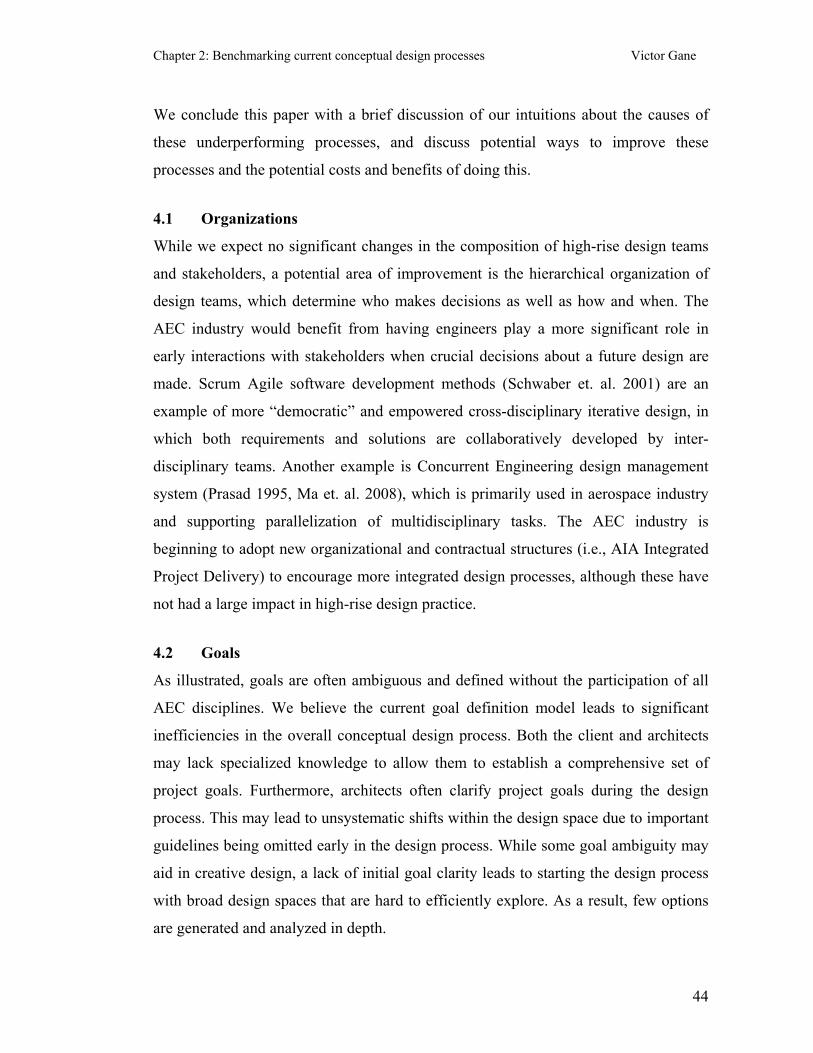
Chapter 2: Benchmarking current conceptual design processes Victor Gane
44
We conclude this paper with a brief discussion of our intuitions about the causes of
these underperforming processes, and discuss potential ways to improve these
processes and the potential costs and benefits of doing this.
4.1 Organizations
While we expect no significant changes in the composition of high-rise design teams
and stakeholders, a potential area of improvement is the hierarchical organization of
design teams, which determine who makes decisions as well as how and when. The
AEC industry would benefit from having engineers play a more significant role in
early interactions with stakeholders when crucial decisions about a future design are
made. Scrum Agile software development methods (Schwaber et. al. 2001) are an
example of more “democratic” and empowered cross-disciplinary iterative design, in
which both requirements and solutions are collaboratively developed by inter-
disciplinary teams. Another example is Concurrent Engineering design management
system (Prasad 1995, Ma et. al. 2008), which is primarily used in aerospace industry
and supporting parallelization of multidisciplinary tasks. The AEC industry is
beginning to adopt new organizational and contractual structures (i.e., AIA Integrated
Project Delivery) to encourage more integrated design processes, although these have
not had a large impact in high-rise design practice.
4.2 Goals
As illustrated, goals are often ambiguous and defined without the participation of all
AEC disciplines. We believe the current goal definition model leads to significant
inefficiencies in the overall conceptual design process. Both the client and architects
may lack specialized knowledge to allow them to establish a comprehensive set of
project goals. Furthermore, architects often clarify project goals during the design
process. This may lead to unsystematic shifts within the design space due to important
guidelines being omitted early in the design process. While some goal ambiguity may
aid in creative design, a lack of initial goal clarity leads to starting the design process
with broad design spaces that are hard to efficiently explore. As a result, few options
are generated and analyzed in depth.
Chapter 2: Benchmarking current conceptual design processes Victor Gane
45
In addition, verbal communication of established goals may lead to further omissions
and misinterpretations, especially among the junior design team members.
Understanding and managing these requirements early in the design process is a major
challenge today. Consequently, the AEC industry would benefit from a formal
methodology used to determine explicit design requirements to help guide the
generation of design options.
4.3 Options
Translating such requirements into a wide range of design options that designers can
quickly analyze and choose from is essential. With current methods, a
multidisciplinary team averaging 12 people can normally produce only three design
options in 5 weeks - a poor result that we have discovered in other segments of the
AEC industry as well (Flager et. al. 2007). Among possible causes are the unclear goal
definitions and the prevalently used design tools that support developing only single,
static solutions. The relationships among design information are difficult to establish,
manage, and resolve with these tools, making design modifications hard to quickly
coordinate. This explains why there is no significant difference in the time needed to
develop new design options, once an initial design has been proposed. The AEC
industry would benefit from a formal methodology to translate requirements
efficiently into multiple design options.
4.4 Analyses
The current inability to conduct multidisciplinary model-based analysis efficiently is
in part caused by the nature of AEC tools. The design and analysis tools are not well
integrated and require substantial time investment in structuring the information for
discipline-specific needs. For example, the architect-generated geometry is generally
unusable by structural engineers, who need to reconstruct it in a suitable format (i.e.,
wireframe with attributes describing material properties and load conditions). Current
design approaches do not support efficiently calculating even rudimentary model-
based analyses, such as cost or area, which in turn discourage designers from
exploring a larger segment of the design space. Finally, engineers are normally

Chapter 2: Benchmarking current conceptual design processes Victor Gane
46
engaged after architects have already chosen a preferred design option, which leads to
inconsistencies in the types of analyses performed on each generated option.
Consequently, the AEC industry would benefit from a design model that includes
engineers much earlier in the conceptual design process to help develop robust design
and analysis strategies, starting early in conceptual design.
4.5 Decisions
Designers tend to use only a limited selection of high-rise design criteria when making
early design decisions. Bounded rationality theory (Simon 1991) provides an
explanation. Concurrent consideration of multiple criteria with today’s design methods
overwhelms designers, who instead break down the problem into sub problems
leading, according to Goldschmidt (2006), to partial interconnected solutions. These
solutions are synthesized into adequate designs through multiple consecutive manual
corrections as illustrated in the case study. The notion of adequacy, however, is
compromised when the criteria used in making these decisions are architecturally
biased.
This paper observed, through case studies and a survey, that design organizations
during the conceptual design of high-rises treat goals informally and search through a
relatively narrow part of the design space. Design theory and our own experience
suggest that significantly better performing buildings are remaining undiscovered.
Deficiencies in current conceptual design process lead to solutions with mediocre
daylighting, and excessive thermal loads and energy demands, thus making the cost of
operating or retrofitting traditional high-rises prohibitive. The lack of a comprehensive
and systematic method of defining multi-stakeholder and multidisciplinary goals,
managing their evolution, and generating and choosing among design options that
respond to identified goals is a major impediment to more successful design.
Chapter 2: Benchmarking current conceptual design processes Victor Gane
47
5 Bibliography Akın, Ö. (2001). “Variants of design cognition”. Design Knowing and Learning:
Cognition in Design Education. Eastman, C., Newstetter, W., & McCracken,
M., Eds., pp. 105–124. New York: Elsevier.
American Society of Heating, Refrigeration and Air-conditioning Engineers
(ASRAE), (1989). “Handbook on fundamentals”.
Baker, W. F. (2008). “Extending Structure and Architecture - Studies in Structural
Topology”. The John A. Blume Distinguished Lecture Series, Stanford
University. April 17, 2008.
Chartered Institution of Building Services Engineers. (1997). “Natural Ventilation in
Non-Domestic Buildings”. Applications Manual AM10. The Chartered
Institution of Building Services Engineers, London.
Council on Tall Buildings and Urban Habitat, (2000). “Architecture of Tall
Buildings”. McGraw-Hill, Inc. pp. 95, 102-106.
Danaher, M. (2000). “Expert Systems – A Design Application”. Proceedings, 22nd
International Conference, Information Technology Interfaces, Pula, Croatia. ,
pp. 439 – 444.
Domeshek, E., Kolodner, J. (1992). “A case-based design aid for architecture”.
Artificial Intelligence in Design 92, J. S.Gero, Ed., Kluwer Academic
Publishers, The Netherlands, pp. 497-516.
Eisele, J., Kloft, E., (2002). “High-rise Manual - Typology and Design, Construction
and Technology”. Birkhauser - Publishers for Architecture
Flager, F., Haymaker, J. (2007). “A Comparison of Multidisciplinary Design, Analysis
and Optimization Processes in the Building Construction and Aerospace
Industries,” 24th International Conference on Information Technology in
Construction, I. Smith (ed.), pp. 625-630.

Chapter 2: Benchmarking current conceptual design processes Victor Gane
48
Fleming, J., Elghadamsi, E., Tanik, M. (1990). “A knowledge-based approach to
preliminary design of structures”. Journal of Energy Resources Technology,
ASME, Vol 1 12, 4, pp. 213 - 219.
Frampton, K. (1992). “Modern Architecture: A Critical History”. Thames & Hudson;
3 Sub edition.
Froese, T. (1996). “Models of Construction Process Information”. Journal of
Computing in Civil Engineering. Vol. 10, No. 3, pp. 183-193.
Goldschmidt, G., (2006). “Quo vadis, design space explorer?” Artificial Intelligence
for Engineering Design, Analysis and Manufacturing. Vol. 20, pp. 105-111.
Haber, D., Karshenas, S. (1990). “Conceptual; An expert system for conceptual
structural design”. Microcomputers in Civil Engineering. Vol. 5, 2, pp 119-
125.
Hartmann, T., Fischer, M., Haymaker, J. (2009). “Implementing information systems
with project teams using ethnographic–action research,” Advanced
Engineering Informatics, Vol. 23, Issue 1, pp. 57-67.
Haymaker, J., Chachere, J., (2007). “Coordinating goals, preferences, options, and
analyses for the Stanford Living Laboratory feasibility study”. Intelligent
Computing in Engineering and Architecture 13th EG-ICE Revised Selected
Papers. Lecture Notes in Computer Science, Vol. 4200/2006. Springer-Verlag,
Berlin, Heidelberg, New York, pp. 320-327.
Haymaker, J., Fischer, M., Kunz, J., Suter, B. (2004). “Engineering test cases to
motivate the formalization of an AEC project model as a directed acyclic graph
of views and dependencies”. Itcon, Vol. 9. Pp. 419-441.
Integrated Definition Methods. Accessed at http://www.idef.com/idef0.html
International Alliance for Interoperability, Data Modelling Using EXPRESS-G for
IFC Development, Accesses at http://www.iai-
international.org/Model/documentation/Data_Modelling_Using_EXPRESS-
G_for_IFC_Development.pdf
Chapter 2: Benchmarking current conceptual design processes Victor Gane
49
Joachim, M. (2006). “Ecotransology - Integrated Design for Urban Mobility”. PhD
Thesis, MIT.
Kaplan, D. (2004). “High Performance High-Rise Residential Buildings”. AIA Center
for Building Performance. Symposium on Building Performance.
Khan, Y. (2004). “Engineering Architecture: The Vision of Fazlur R. Khan”. W. W.
Norton & Company. pp. 260.
Kienast, F. Jager, J. (2006). “Degree of urban sprawl in Switzerland: Quantitative
analysis 1940–2002 and implications for regional planning”. Swiss Federal
Institute of Forest, Snow and Landscape Research Report; ETH.
Krishnamurti, R. (2006). “Explicit design space?” Artificial Intelligence for
Engineering Design, Analysis and Manufacturing. Vol. 20, pp. 95-103.
Kunz, J., Gilligan, B. (2007). “Value from VDC / BIM Use”. Accessed at
http://cife.stanford.edu/VDCSurvey.pdf
Ma, Y., Chen, G., Thimm, G. (2008). “Paradigm Shift: Unified and Associative
Feature-based Concurrent Engineering and Collaborative Engineering”.
Journal of Intelligent Manufacturing, DOI 10.1007/s10845-008-0128-y
Maher, M.L., Fenves, S.J. (1985). “Hi-Rise: A Knowledge-Based Expert System for
the Preliminary Structural Design of High Rise Buildings”. Ph.D. Dissertation,
Department of Civil Engineering, Carnegie-Mellon University, Pittsburgh,
USA.
McCuen, T., Suermann, P. (2007). “The Interactive Capability Maturity Model”.
Accessed at http://www.aecbytes.com/viewpoint/2007/issue_33.html
McElfish, J. (2007). “Ten Things Wrong With Sprawl”. Environmental Law Institute
report.
Morphosis, (2006). “Phare Tower”. Paris, France. Project currently under
development.

Chapter 2: Benchmarking current conceptual design processes Victor Gane
50
Skidmore, Owings, & Merrill, (2007). “Transbay Tower”. San Francisco, CA.
Competition entry.
Pelli, C. (1991). “Carnegie Hall Tower”. Completed building in Manhattan, New
York.
Prasad, B. (1995). “Concurrent Engineering Fundamentals: Integrated product
development”. Prentice Hall Professional Technical Reference.
Rolland, C.; Pernici, C. (1998). “A Comprehensive View of Process Engineering”.
Proceedings of the 10th International Conference CAiSE'98, B. Lecture Notes
in Computer Science 1413. Pisa, Italy: Springer.
Sabouni, A.R., AI-Mourad, O.M. (1997). “Quantitative knowledge based approach for
preliminary design of tall buildings”. Artificial Intelligence in Engineering,
Vol. 11, pp. 143-154.
Schueller, W. (1986). “High-rise buildings structures”. 2nd edition, Robert E. Krieger
Publication Company.
Schwaber, K., Beedle, M. Agile (2001). “Software Development with Scrum”.
Prentice Hall.
Simon, H. (1991). “Bounded Rationality and Organizational Learning”. Organization
Science Vol. 2 (1), pp. 125-134.
Sosa, M., Eppinger, S., Pich, M., McKendrick, D., Stout, S. (2002). “Factors that
Influence Technical Communication in Distributed Product Development: An
Empirical Study in the Telecommunications Industry”. IEEE Transactions on
Engineering Management, Vol. 49, No. 1, pp. 45-58
Survey conducted between January – May, 2008. 20 participants from the following
firms: Skidmore, Owings & Merrill LLP (SOM), Kohn Pedersen Fox
Architects (KPF), Adrian Smith + Gordon Gill Architecture, Hellmuth, Obatta,
Kassabaum (HOK), HWI Architects, Atkins, Arquitectonica.
Sutton, R. (2002). “Weird Ideas that Work - 11.5 practices for promoting, managing,
and sustaining innovation”. The Free Press, New York, NY.
Chapter 2: Benchmarking current conceptual design processes Victor Gane
51
Tapping, D., Shuker, T. (2002). “Value Stream Management”. Productivity Press.
Ulitskii, V. M., Shashkin, A. G., Shashkin, K. G., (2003). “Geotechnical Problems
Associated with the Construction of High-rise Buildings”. Foreign Experience
and Domestic Practice. Soil Mechanics and Foundation Engineering, Vol. 40,
No.5. pp. 182.
United Nations, (2004). “World population to grow from 6.5 billion to 9.1 billion by
2050”. Accessed at
http://www.un.org/esa/population/publications/WPP2004/2004_Revision_pres
s_release_Final.pdf
Whitehead, H. (2003). “Laws of Form. Architecture in the Digital Age: Design and
Manufacturing”. Taylor & Francis.
Woodbury, R., Burrow, A., (2006). “Whither Design Space?” Artificial Intelligence
for Engineering Design, Analysis and Manufacturing. Vol. 20, pp. 63-82.
Yeang, K. (1996). “The Skyscraper Bioclimatically Considered – a design primer”.
Academy Editions.

Chapter 3: DS Methodology Victor Gane
52
Chapter 3: Design Scenarios – enabling requirements-driven
parametric design spaces
Victor Gane, John Haymaker
1 Abstract Ideally, conceptual design processes in Architecture Engineering Construction (AEC)
start with well-defined, multidisciplinary requirements used to generate large
quantities of requirements-driven alternatives with well understood value to enable
objective decision making. A quality design space is both well-defined and
comprehensive as motivated by research in Design Theory or Systems Engineering.
Concurrent Engineering and Requirements Engineering offer the means to gather
requirements, Quality Function Deployment – to translate requirements into
engineering characteristics, and Parametric Modeling – to generate large quantities of
alternatives. Good designs in AEC are shaped by the interaction of decisions by many
disciplines and today’s parametric solutions work well within their particular domain
or discipline, but in reality a parameter in one discipline drives parameters in other
disciplines. To build parametric design spaces, it is critical to integrate the process of
determining project requirements, generating alternatives, and determining the
performance and value of alternatives.
This paper presents a novel methodology called Design Scenarios (DS) intended for
use in conceptual design of buildings. DS proposes to enable multi-stakeholder and
multidisciplinary design teams to streamline the alternative generation and decision-
making processes by providing a methodology for building and managing
requirements driven design spaces with parametric Computer Aided Design (CAD)
tools. DS consists of four interdependent models: (1) Requirements Model –
stakeholders and designers explicitly define and prioritize context specific design
requirements; (2) Scenarios Model (SM) – designers formally transform these
requirements into actions necessary to achieve them, and determine the geometric and

Chapter 3: DS Methodology Victor Gane
53
material parameters, interrelationships, and potential conflicts; (3) Parametric Process
Model (PPM) – CAD experts build and represent the technical implementation of a
SM in a parametric model to enable design teams to manage and communicate its
logical construct and partially automate the generation of parametric models by
linking PPMs to parametric CAD models; (4) Alternative Analysis Model – analyze
and visually report performance back to the designers and stakeholders. This paper
describes its implementation into a software prototype, and provides an example to
illustrate how DS can potentially enable multidisciplinary teams to generate and
communicate larger and better performing design spaces more efficiently than with
traditional methods.
2 Introduction: the need for effective conceptual design processes Ideally, designers could create and analyze as many alternatives as possible. This
entails the translation of requirements into possible alternatives and their evaluation
for impact and value, or, in other words, the exploration of large design spaces and
capturing the rationale used to build these spaces. The design process culminates in
the selection of a building’s physical form. This process is complex and consists of
constructing and assessing four spaces. The objective space consists of the constraints
and goals determined by project stakeholders. The alternative space includes all
possible design options describing geometric and/or material design decisions to be
made, as well as the options chosen to generate specific alternatives. The impact space
captures the performance of alternatives on goals and constraints. The value space
shows how well the alternatives meet the stakeholder preferences on goals and
supports the selection of successful alternatives (Clevenger & Haymaker, 2011). The
construction and exploration of these spaces is difficult with today’s methods because
the translation of multi-stakeholder requirements into specific parameters used to
generate alternatives with a clearly understood value has not yet been formalized in
AEC.

Chapter 3: DS Methodology Victor Gane
54
Researchers such as Sutton (2002), Akin (2001), and Bock et. al. (2010) argue that
successful designs emerge from exploring large design spaces, while Simon (1969)
explains why designers’ bounded rationality forces them to narrow these spaces.
Designers reduce the alternative space to address constraints such as the boundaries of
the project site to find designs that maximize value to their goals. To assist them in
generating alternatives, designers often adopt a scenario – a collection of structures
and behaviors that represent the design intent (Baniassad and Clarke, 2004). In other
words, a scenario is a set of selected constraints, which restrict the design space that
needs to be further considered by capturing a set of related design decisions (Giesecke
et. al. 2007). To Alexander (1977), a scenario is a “design pattern”, a “solution to a
problem in a context” (Gamma et. al. 1995). In computer science a scenario (also
called Theme, Pattern or Style) provides a “set of predefined subsystems, specifies the
responsibilities of these subsystems, and includes rules and guidelines for organizing
the relationships between them” (Buschmann et. al. 1996) and has an explicit
representation (Giesecke et. al. 2007). In the AEC industry a scenario is a less formal
construct generally communicated verbally or through hand sketches. Figure 3-1
illustrates an example of a traditional AEC scenario, in which the design architect with
little or no participation of other design stakeholders might use the local context (e.g.,
Austrian Alps widely used for skiing) to implicitly constrain the design space (e.g.,
propose a building shape that draws its reference from skiing activity).
Figure 3-1: Example of AEC scenarios – concept sketches of a high-rise located in the
Austrian Alps, which are derived from a ski pole (left) and a ski boot (right) (Gane
and Haymaker, 2010).
Moran and Carroll (1996) argue that constructing effective design spaces requires
explicitly communicating the design rationale but also that existing methods lack the
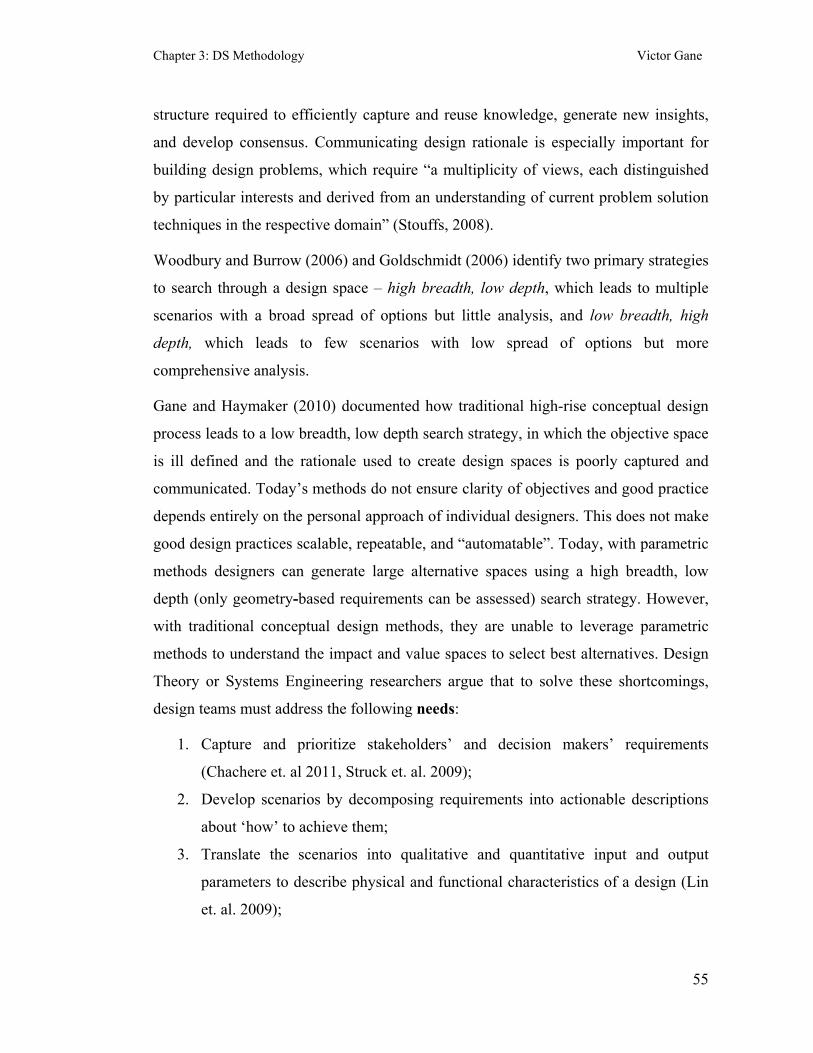
Chapter 3: DS Methodology Victor Gane
55
structure required to efficiently capture and reuse knowledge, generate new insights,
and develop consensus. Communicating design rationale is especially important for
building design problems, which require “a multiplicity of views, each distinguished
by particular interests and derived from an understanding of current problem solution
techniques in the respective domain” (Stouffs, 2008).
Woodbury and Burrow (2006) and Goldschmidt (2006) identify two primary strategies
to search through a design space – high breadth, low depth, which leads to multiple
scenarios with a broad spread of options but little analysis, and low breadth, high
depth, which leads to few scenarios with low spread of options but more
comprehensive analysis.
Gane and Haymaker (2010) documented how traditional high-rise conceptual design
process leads to a low breadth, low depth search strategy, in which the objective space
is ill defined and the rationale used to create design spaces is poorly captured and
communicated. Today’s methods do not ensure clarity of objectives and good practice
depends entirely on the personal approach of individual designers. This does not make
good design practices scalable, repeatable, and “automatable”. Today, with parametric
methods designers can generate large alternative spaces using a high breadth, low
depth (only geometry-based requirements can be assessed) search strategy. However,
with traditional conceptual design methods, they are unable to leverage parametric
methods to understand the impact and value spaces to select best alternatives. Design
Theory or Systems Engineering researchers argue that to solve these shortcomings,
design teams must address the following needs:
1. Capture and prioritize stakeholders’ and decision makers’ requirements
(Chachere et. al 2011, Struck et. al. 2009);
2. Develop scenarios by decomposing requirements into actionable descriptions
about ‘how’ to achieve them;
3. Translate the scenarios into qualitative and quantitative input and output
parameters to describe physical and functional characteristics of a design (Lin
et. al. 2009);

Chapter 3: DS Methodology Victor Gane
56
4. Represent and manage geometry, dependencies, constraints, and CAD
operations illustrating the parametric CAD model structure (Stouffs, 2008);
5. Manipulate and record parameter values to generate design alternatives (Struck
et. al. 2009);
6. Visualize the alternatives;
7. Evaluate the alternatives (Zhang, et. al. 2010);
8. Compare evaluations and facilitate objective decision making (Colombo et. al.
2007).
Most of these needs are not new and several have been addressed by prior research.
An integrated solution to enable effective use of parametric CAD is lacking, however.
Specifically, this paper addresses the following primary question about these gaps:
What is an ontology and method for designers and CAD experts to develop
well defined and comprehensive alternative spaces that connect well defined
and comprehensive objective, impact, and value spaces?
Figure 2 summarizes the main concepts introduced so far.
Figure 3-2: Summary of the concepts used to describe a design space and search
methods.
To understand the quality of design spaces we need to measure how well-defined and
comprehensive they are. In section 2 we introduce a framework for measuring the
quality of design spaces. The framework is not the focus of this paper. However, the

Chapter 3: DS Methodology Victor Gane
57
importance of this framework is to enable testing and understanding the impact of
Design Scenarios and other proposed methodologies on the quality of design spaces.
Our intuition is that as design teams generate and analyze scenarios explicitly, they
can explore better defined design spaces that lead to better designs.
3 Framework for measuring the design space quality Since traditional conceptual design methods don’t ensure clarity of the objective,
impact, and value spaces, but the ideal practice cannot live with such ambiguities, we
define a framework to enable designers to assess the quality of parametric design
spaces (Table 1). We use this framework in Gane et. al. (2011) to measure the impact
of DS on an industry test case. Clevenger and Haymaker (2011) review and synthesize
metrics for measuring design space quality, while Chachere and Haymaker (2011)
review and synthesize methods for measuring design space clarity. In this paper we
build on these methods to synthesize the following framework for assessing how well-
defined and comprehensive the parametric design spaces are:
Table 3-1: Summary of topics covered by each guideline.
Metric Definition
Obj
ectiv
e sp
ace Objective Space Size What is the number of project goals and constraints considered?
Objective Space Clarity
Is the value function explicitly and broadly communicated? The clarity is determined through documented statements describing stakeholders, goals, constraints, and preferences.
Objective Space Quality
Are the project goals and constraints determined by all key stakeholders? A low quality denotes participation of <50% of stakeholders; medium quality: 51-80%; high quality: 81-100%.
Alte
rnat
ive
spac
e
Number of Scenarios What is the number of design scenarios considered?
Total Option Space Size
What is the total number of possible options comprising a scenario? Discrete versus continuous parameters are used to determine this metric by multiplying the constrained range of values of input parameters (e.g., building length between 30m and 40m) and their reasonable increment (e.g., 1m for building length).
Generated Option Space Size What is the number of the generated design options for a scenario?
Options Space Quality
What is the ratio of Total Options Space Size to Generated Options Space Size? A 1.0 ratio is ideal because it covers the complete Design Space for a given scenario. Statistical sampling of the space could also yield high quality option spaces, but as none of the cases used in our research have involved this, we reserve this for future research.
Alternative Space Size What is the number of the generated design alternatives for a scenario? Alternative Space Are the scenarios, designers’ logic, and the parameters describing these
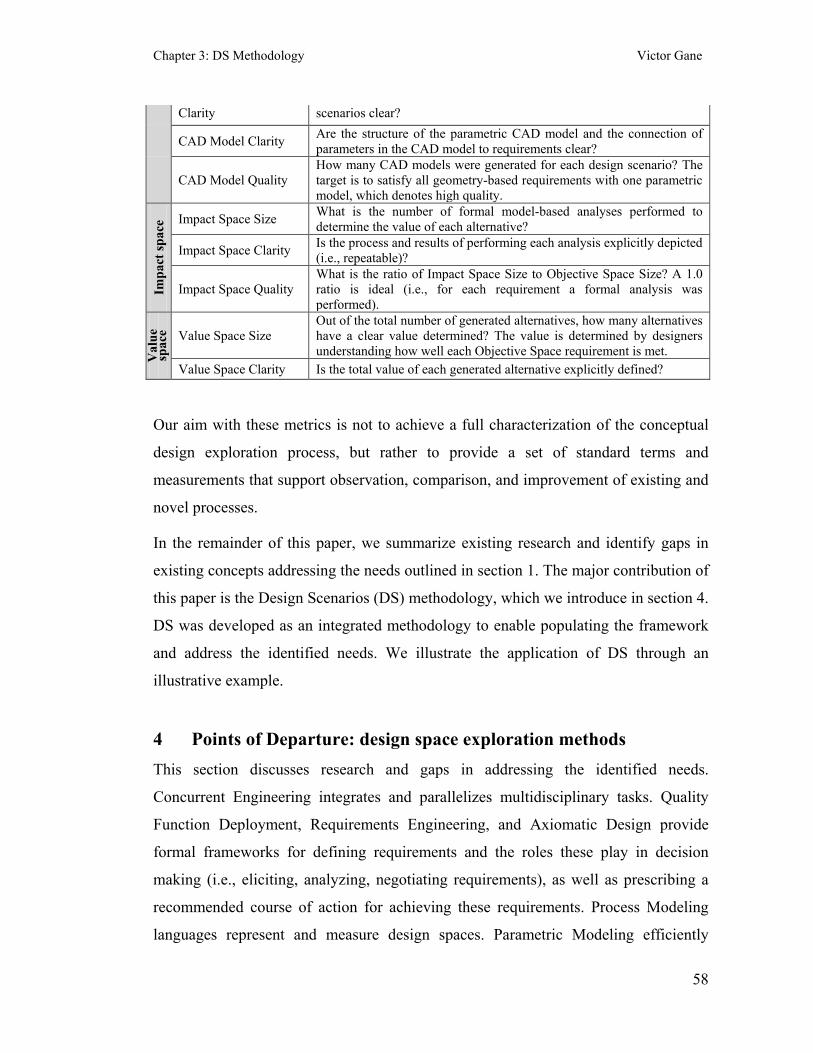
Chapter 3: DS Methodology Victor Gane
58
Clarity scenarios clear?
CAD Model Clarity Are the structure of the parametric CAD model and the connection of parameters in the CAD model to requirements clear?
CAD Model Quality How many CAD models were generated for each design scenario? The target is to satisfy all geometry-based requirements with one parametric model, which denotes high quality.
Impa
ct sp
ace Impact Space Size What is the number of formal model-based analyses performed to
determine the value of each alternative?
Impact Space Clarity Is the process and results of performing each analysis explicitly depicted (i.e., repeatable)?
Impact Space Quality What is the ratio of Impact Space Size to Objective Space Size? A 1.0 ratio is ideal (i.e., for each requirement a formal analysis was performed).
Val
ue
spac
e Value Space Size Out of the total number of generated alternatives, how many alternatives have a clear value determined? The value is determined by designers understanding how well each Objective Space requirement is met.
Value Space Clarity Is the total value of each generated alternative explicitly defined?
Our aim with these metrics is not to achieve a full characterization of the conceptual
design exploration process, but rather to provide a set of standard terms and
measurements that support observation, comparison, and improvement of existing and
novel processes.
In the remainder of this paper, we summarize existing research and identify gaps in
existing concepts addressing the needs outlined in section 1. The major contribution of
this paper is the Design Scenarios (DS) methodology, which we introduce in section 4.
DS was developed as an integrated methodology to enable populating the framework
and address the identified needs. We illustrate the application of DS through an
illustrative example.
4 Points of Departure: design space exploration methods This section discusses research and gaps in addressing the identified needs.
Concurrent Engineering integrates and parallelizes multidisciplinary tasks. Quality
Function Deployment, Requirements Engineering, and Axiomatic Design provide
formal frameworks for defining requirements and the roles these play in decision
making (i.e., eliciting, analyzing, negotiating requirements), as well as prescribing a
recommended course of action for achieving these requirements. Process Modeling
languages represent and measure design spaces. Parametric Modeling efficiently

Chapter 3: DS Methodology Victor Gane
59
generates alternatives spaces. While each of these methods address important subsets
of the identified needs, gaps remain in how design requirements can be translated into
parametric design spaces, which is the contribution of this paper.
4.1 Concurrent Engineering – integrate and parallelize tasks
Several case studies show that poor definition or misunderstandings of requirements
are major causes of system failure in software engineering (Rolland and Salinesi,
2005), mechanical engineering (Hsu and Woon, 1998), and in AEC (Kiviniemi et. al.
2004, Kam, 2005). Requirements-driven methods propose systematic approaches for
screening and prioritizing design requirements.
Concurrent Engineering (CE) is a framework for achieving multidisciplinary objective
spaces. CE addresses the limitations of traditional sequential design development
methods by describing a set of technical, business, manufacturing planning, and
design processes that are concurrently performed by elements of the manufacturing
organization prior to committing to production (Miller, 1993). Cross-process
integration is at the core of concurrent design and consists of a multidisciplinary team
method and engineering of product lifecycle (Xiong, 2000). An already mature field,
CE is at its third generation (Fukuda, 2007). The first generation addressed the
limitations of sequential product development by noting the content of each design
part, thus allowing independent parts to be processed in parallel. The second
generation introduced the missing communication/negotiation among decision makers
needed to determine the goals across the entire design process, and to relax some
constraints. The current generation of CE helps determine the latest moment in the
design process when binding decisions can be made. All four characteristics identified
by Fukuda that describe successful application of CE apply to generating AEC design
spaces: (1) high rate of design and process definition change (change rate); (2) high
rate and short cycles of new design developments (speed); (3) designs with complex
configurations that vary by client (complexity); (4) design processes that require
multiple teams to produce a single product (multiple design teams).

Chapter 3: DS Methodology Victor Gane
60
A key issue in concurrent engineering from a designer’s perspective is how to bridge
the multitude of models required to support at various stages a complex design
process. Although concurrent engineering is almost universally advocated today, it is
hard to execute when large multidisciplinary projects are involved. CE requires a set
of analytic tools and procedures to make its concepts operational (Yassine and Braha,
2003). In the context of this research, CE partially addresses need #1 by enabling
designers to capture design requirements.
4.2 Quality Function Deployment – translate user needs into design
characteristics
Quality Function Deployment (QFD) is one of the methods comprising the field of
systems engineering (Struck et. al. 2009) and an important point of departure for this
research. QFD is a multi-phase design to production management model, which
captures and prioritizes customer needs (objective space) and translates them into
engineering design characteristics (alternative space). Vagueness in requirements
eventually yields indifference to customer needs, while trivial characteristics make the
team lose sight of the overall design and stifle creativity (Houser and Clausing, 1988).
QFD avoids ambiguity in interpreting engineering characteristics through a systematic
analysis of each characteristic (impact space). In QFD large-scale systems are
decomposed by multidisciplinary teams into modules and evaluated against target
requirements and cost by means of matrices (Takai and Ishii, 2006). A popular matrix
example is “House of Quality”, which provides the means for inter-functional
planning and communication (Houser and Clausing, 1988). The QFD process starts
with the customer requirements, continues with ‘functions’ required by the products or
services to be developed, and ends with identifying the means for optimal
‘deployment’ of available resources to produce the desired products or services.
Research shows that the competence of engineering designers is related to their ability
to consider design constraints (Colombo et. al. 2007). Traditional QFD tools are
enhanced by assessment methods that include constraints (Leary and Burvill, 2007).
Chapter 3: DS Methodology Victor Gane
61
QFD helps design teams determine the objective, alternative, and impact spaces. It
enables understanding stakeholder requirements, engineering characteristics, and their
relationships and target values, and has been extended to help guide designers in the
translation of requirements into feasible design options (Chen and Pai, 2005).
However, QFD does not enable translating requirements into parametric CAD models.
In the AEC industry, PREMISS (Kiviniemi et. al. 2004), Decision Dashboard (Kam,
2005), and MACDADI (Haymaker and Chachere, 2007), are other examples of
methodologies for eliciting requirements and relating them to building design
alternatives. Similar to QFD, these methodologies also lack the means to reliably
identify and relate parameters to drive geometric design spaces from requirements
models. In the context of this research, QFD satisfies need #1 by enabling designers to
capture and prioritize design requirements, partially satisfies need #2 by helping
decompose requirements for a single scenario into actionable descriptions, and
satisfies need #7 by evaluating design options against customer requirements.
4.3 Requirements Engineering – determine and manage requirements
Requirements Engineering (RE) provides another method to build objective and
alternative spaces by formalizing the requirements gathering and specification process
represented in the form of a checklist of requirements. Originating in systems and
software engineering (Laplante, 2007), RE overcomes the drawbacks of traditional
software development methods, in which the developed systems are often technically
good but unable to appropriately respond to user needs (Rolland and Salinesi, 2005).
RE states why a system is needed based on current and foreseen conditions, what
requirements the system will satisfy, and how the system is to be constructed (Ross
and Schoman, 1977). An expanded RE definition is concerned with making such goals
operational by transforming them into services and constraints, and assigning
responsibilities to agents, including humans, devices, and software (Lamsweerde,
2000). Reasoning with goals can also help resolve conflicts among stakeholders. For
example, it is important to capture the fact that one goal can prevent another from
being satisfied. AND/OR graphs are used to capture goal refinement links
(Lamsweerde, 2000). An OR node represents a choice between possible

Chapter 3: DS Methodology Victor Gane
62
decompositions while an AND node represents a required decomposition. A conflict-
link between two goals is introduced when the satisfaction of one goal may prevent
another from being satisfied.
In the context of this research, RE partially addresses need #1 by enabling designers to
capture but not prioritize design requirements; addresses need #2 by decomposing
requirements into actionable descriptions of how to achieve them; partially addresses
need #4 by representing and managing dependencies and constraints, but not geometry
and CAD operations.
4.4 Axiomatic Design – generate requirements and enable parameters
Axiomatic Design (AD) provides a theoretical framework to help reduce the
complexity of the design space and improve decision making at all levels (Suh, 1998).
AD represents design in terms of four domains: (1) Customer Domain identifies end
user needs and design specifications (objective space); (2) Functional Domain
identifies functional requirements needed to satisfy customer needs; (3) Physical
Domain identifies designs satisfying the functional requirements (alternative space),
and (4) Process Domain identifies the processes needed to determine design
parameters (Suh, 1995). AD defines design as a process of mapping designers’
requirements from the functional to the physical domain. Suh defines Functional
Requirements (FRs) as the minimum number of independent requirements that
characterize a design solution. AD stipulates two fundamental axioms that govern the
design process. The Independence Axiom states that the independence of FRs has to
be always maintained. In other words, in case of design problems with multiple FRs, a
good design solution is made of design parameters (DP) that result in the
independence of the FRs from each other. The Information Axiom states that
information content of the design must be minimized.
The output of AD is a design matrix used to determine relationships between DPs and
associated FRs. The shape of the matrix is used to distinguish between good and bad
designs. Uncoupled designs are considered ideal because adjustments to the FRs are
the easiest to make. A decoupled design is less desirable given the increased

Chapter 3: DS Methodology Victor Gane
63
complexity in relationships between a DP and several FRs. A typical AEC design
problem is often a decoupled design. A coupled design is the worst and generally calls
for the selection process of DPs to be repeated. In the context of this research, AD
partially addresses need #1 by helping to capture but not prioritize design
requirements; partially addresses need #3 by enabling designers to translate
requirements into design parameters without distinguishing between input and output
parameters; and partially addresses need #4 by representing dependencies between
requirements and parameters, but not constraints, geometry, and CAD operations.
4.5 Process modeling – represent and measure design spaces
Building a shared ontology is critical for increasing the effectiveness of
multidisciplinary teams (Xexe et. al. 2005). Process modeling is a medium for
building shared ontologies to help organizations plan, measure, compare, and adopt
well-defined processes. Generally, there are three applications for process models: a)
descriptive for describing what happens during a process; b) prescriptive for
describing a desired process; c) explanatory for describing the rationale of a process
(Rolland and Pernici, 1998). Some languages help system developers define software
and databases. IDEF (Integration DEFinition) is a family of modeling languages from
systems engineering covering issues such as functional modeling, data acquisition, and
simulation. Unified Modeling Language (UML), also from systems engineering,
consists of structure and behavior diagrams to describe a system’s functional
requirements, structure, procedural flow of class objects, etc. (Fowler, 2004). Froese
(1996) describes many of the core and application process models for AEC, including
IRMA – Information Reference Model for AEC, BPM - Building Project Model,
ICON – Information / Integration for Construction, GRM – Generic Reference Model.
GTPPM (Lee et. al. 2007) integrates multiple use-cases with differing data
requirements to define databases that facilitate collaboration among design teams.
Other languages are intended for use directly by design teams. For example, Value
Stream Mapping (Tapping and Shuker, 2002) helps teams illustrate the flow of
activities, and information that produce value in a given process, while Narratives
(Haymaker et. al. 2004) help teams model and manage the information and the
Chapter 3: DS Methodology Victor Gane
64
sources, nature, and status of the dependencies between information in a process.
These existing process modeling methods lack a representation formalism for
communicating the structure of parametric CAD models (GTPPM being the
exception), as well as their relationships to the requirements they address, and
performance they achieve. In the context of this research, process modeling partially
addresses need #1 by capturing but not prioritizing design requirements; partially
addresses need #2 by showing actions but not decomposing requirements into actions.
4.6 Parametric modeling – generate alternative spaces
The development of procedures for generating design alternatives is an active research
area. For example, shape grammars (Knight, 2000) are a class of production systems
used to generate geometric alternatives based on a set of transformation rules. Graph
grammars consist of a set of rules that illustrate ways of constructing a design product
or process as a graph represented by nodes denoting objects and arrows denoting
relations between objects (Rozenberg, 1997). Multidisciplinary Design Optimization
methods guide generative methods to automatically select optimal designs (AIAA,
1991). Others (Kelley, 2006, Sutton, 2002) adopt more human-centric approaches,
regarding the concept of “brainstorming” as the backbone of creative thinking. A
balance is needed between both strategies – breadth (i.e., brainstorming) for initial
idea generation and depth (i.e., geometry adjustment) for refining alternatives.
Parametric modeling can support building design spaces with great breadth (multiple
geometric alternatives) and partial depth (analysis of geometry-based requirements
only).
Parametric CAD is used to create and manage geometric alternative spaces. Also
called constraint or feature based, associative modeling, parametric modeling can
enable designers to shift from creators of single designs to designers of systems of
inputs and outputs that generate design spaces. The concept of “features” encapsulates
generic shapes or characteristics of a product with which designers can associate
certain attributes and knowledge useful for reasoning about that product (Shah and
Mäntylä, 1995). To design parametrically means to design a constrained system that

Chapter 3: DS Methodology Victor Gane
65
sets up a design space that can be explored through the variations of parameters
(Kilian, 2004). Using parametric models, designers can create an infinite number of
objects, geometric manifestations of a previously articulated schema of variable
dimensional, relational or operative dependencies (Koralevic, 2003). Designing with
multiple constraints without an efficient constraint management system is a daunting
task. An example of a constraint management methodology are the design sheets, in
which design models are represented as constraints between variables in the form of
nonlinear algebraic equations organized into bipartite graphs and constraint networks
(Reddy et. al. 1996). Using design sheets to define parametric models, however, is not
intuitive given the overwhelming number of constraints that need to be described at
the schema level and the inability to visualize geometry, a capability that AEC
designers need. Therefore parametric systems using geometric constraint
programming to graphically impose constraints helps designers solve the relevant
nonlinear equations without having to explicitly formulate them (Kinzel et. al. 2007).
Existing methods such as Building Object Behavior (BOB) (Lee, et al., 2006), and
software solutions such as Bentley’s Generative Components or McNeel’s
Grasshopper for Rhinoceros (http://wiki.mcneel.com/labs/explicithistory/home)
address parts of the needs by helping designers define the structure of the parametric
models (need #4), manage parameter values to generate alternatives (need #5),
visualize alternatives (need #6), and geometrically evaluate alternatives with output
parameters (partially need #7). However, parametric modeling needs a formal method
for deriving constraints and parameters from requirements, and for relating the
resulting alternatives to analyses performed outside of the parametric model.
In summary, each point of departure (POD) helps address parts of the identified needs.
However, an integrated solution is still missing, including an ontology for building
multidisciplinary AEC alternative spaces and systematic transfer of design
requirements from the objective space to the alternative, impact and value spaces.
Figure 3-3 graphically summarizes the relationship of the PODs to the needs we
identified.

Chapter 3: DS Methodology Victor Gane
66
Figure 3-3: Summary of how PODs satisfy the identified needs. This paper focuses on
creating an ontology for building multidisciplinary AEC alternative spaces and a
method to translate design requirements from the objective space to the alternative,
impact, and value spaces.
5 Design Scenarios - methodology description The Design Scenarios (DS) methodology was developed as an integrated solution to
the identified needs. It enables design teams to develop and capture parametric
scenarios in a relational network connecting objective, alternative, impact, and value
spaces. DS builds models for each of the four spaces. However, to enable the
translation of requirements into alternatives, we divided the alternative space into two
subspaces: Alternative Space Logic, where designers capture their logic for addressing
requirements, and Alternative Space Geometry, where CAD experts use designers’
logic to build requirements-driven parametric models. Because each space requires the
participation of various roles, we introduce the concept of an Enabler (e.g., Architect,
CAD expert) who uses a Method (e.g., Create objective) to generate an Element (e.g.,
Goal, parameter). Each model contains various enablers who are either humans or the
computer. DS has a total of 30 methods and 29 elements. The selection of methods
and elements varies for each model (see Chapter 1).

Chapter 3: DS Methodology Victor Gane
67
Figure 3-4 illustrates the DS process, which after the project administrator completes
the project setup, starts with building the objective space in the Requirements Model
(RM). The RM enablers are the stakeholders and designers, who concurrently create
and prioritize project constraints and goals. The process continues with constructing
the logical alternative space in the Scenarios Model (SM). The SM enablers are the
computer and the designers, who concurrently decompose the requirements
transferred by the computer from the RM into key geometric and/or material
parameters and relationships. The computer then transfers the SM parameters into the
geometric alternative space in the Parametric Process Model (PPM), where the CAD
experts define the structure of dependencies between parameters, geometric
constraints, CAD operations, and geometry. CAD experts use the PPM to construct the
parametric model and generate design alternatives. The process continues with
building the impact space in the Alternatives Analysis Model (AAM). The AAM
enablers are the designers, who determine the performance of alternatives given the
RM requirements. The process is finalized with building the value space, which in DS
is also completed in the AAM. The enabler is the computer, which determines the
value of each analyzed alternative in relation to the goal targets and preferences, thus
enabling design teams to make objective decisions.

Chapter 3: DS Methodology Victor Gane
68
Figure 3-4: Design Scenarios methodology process description. The Objective Space
is captured in the Requirements Model; the Logical Alternative Space in the Scenarios
Model; the Geometric Alternative Space in the Parametric Process Model; the Impact
and Value Spaces in the Alternatives Analysis Model.
We implemented the Design Scenarios methodology into a web-based software
prototype with the same name developed in Java and Ruby on Rails, and supported by
a MySQL database management system. In addition to the four DS models comprising
the methodology and represented in either tabular or process model format, the
software contains a Project Administration interface used to create new projects and
add users, and a Project Setup interface used to create projects roles, assign users to
these roles, determine access privileges to each model, and assign stakeholder
influence weights. A description of these two modules can be found at
www.designscenarios.com.

Chapter 3: DS Methodology Victor Gane
69
5.1 Requirements Model (RM)
Methodology description
Building on a Concurrent Engineering framework, the RM parallelizes the
requirement definition process of all project stakeholders (e.g., client, architect,
mechanical engineer, structural engineer) to enable collective understanding of each
others’ requirements. MACDADI (Haymaker et. al. 2006) and Requirements
Engineering (Lamsweerde 2000) provided the foundation for the RM elements. An
RM is a tabular model built by project stakeholders and designers who concurrently
generate constraints and goals (two out of four RM elements). Constraints must be
satisfied, while goals can be traded off against each other when finding an optimal
design. When all stakeholders finish generating requirements, each stakeholder
distributes 100 points over the identified goals to represent individual preference (third
RM element). Many rating methods can be used, however this technique was chosen
for the first implementation of the DS methodology because of its simplicity and ease
of implementation. When all stakeholders finish assigning preferences, the computer
generates a cumulative goal importance score for each goal, the sum of which is
normalized to 100 points (fourth RM element).
Software Implementation
In Table 3-2, we describe the RM in detail. The left column gives the visual
representation and definition of each element of the RM, while the right column uses
the EXPRESS data model (ISO 10303-11, 1994) to describe each concept as
implemented in the software prototype. Some user and system-defined inputs use free-
form string data types that enable users to represent either text or values.
Weighting stakeholders is also relevant and has been implemented in the Project Setup
interface of the software prototype. Requirements can be qualitative or quantitative,
and can range from those defined by stakeholders (e.g., client: building use, space
efficiency; planning department: shadows, density of development), to those
established by the designers (e.g., architect: design language; mechanical engineer:
daylight factor, energy comfort).
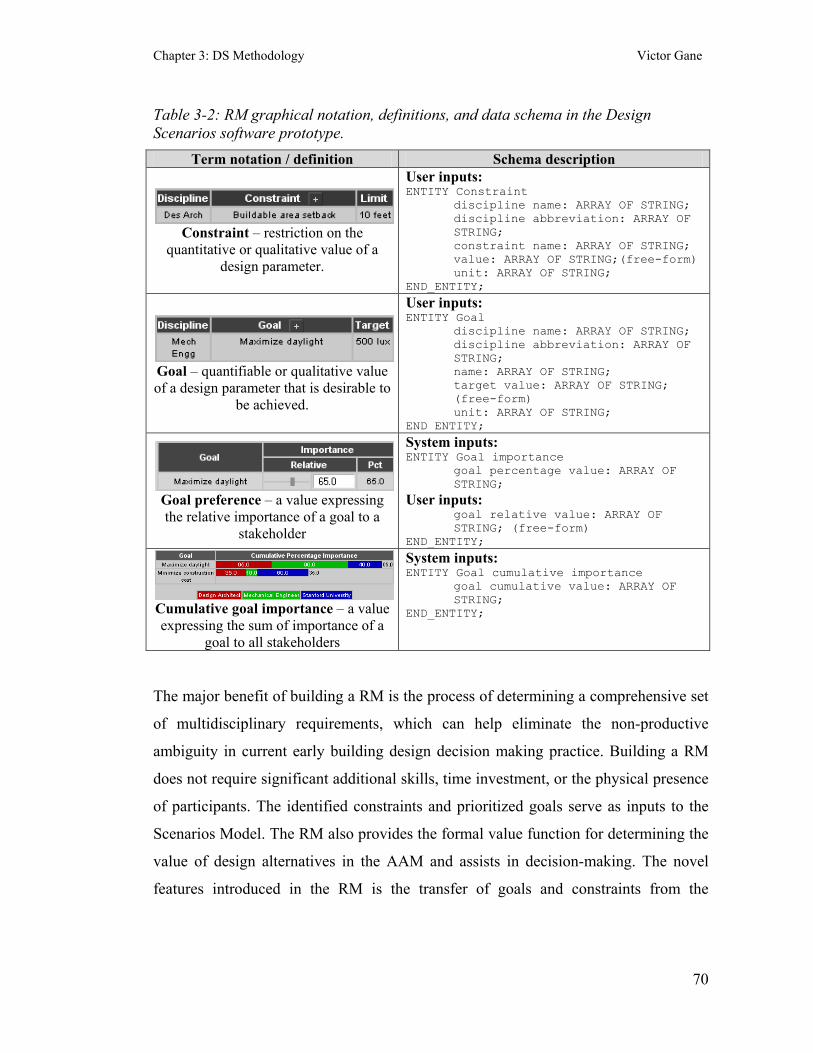
Chapter 3: DS Methodology Victor Gane
70
Table 3-2: RM graphical notation, definitions, and data schema in the Design Scenarios software prototype.
Term notation / definition Schema description
Constraint – restriction on the
quantitative or qualitative value of a design parameter.
User inputs: ENTITY Constraint
discipline name: ARRAY OF STRING; discipline abbreviation: ARRAY OF STRING; constraint name: ARRAY OF STRING; value: ARRAY OF STRING;(free-form) unit: ARRAY OF STRING;
END_ENTITY;
Goal – quantifiable or qualitative value of a design parameter that is desirable to
be achieved.
User inputs: ENTITY Goal
discipline name: ARRAY OF STRING; discipline abbreviation: ARRAY OF STRING; name: ARRAY OF STRING; target value: ARRAY OF STRING; (free-form) unit: ARRAY OF STRING;
END_ENTITY;
Goal preference – a value expressing the relative importance of a goal to a
stakeholder
System inputs: ENTITY Goal importance
goal percentage value: ARRAY OF STRING;
User inputs: goal relative value: ARRAY OF STRING; (free-form)
END_ENTITY;
Cumulative goal importance – a value expressing the sum of importance of a
goal to all stakeholders
System inputs: ENTITY Goal cumulative importance
goal cumulative value: ARRAY OF STRING;
END_ENTITY;
The major benefit of building a RM is the process of determining a comprehensive set
of multidisciplinary requirements, which can help eliminate the non-productive
ambiguity in current early building design decision making practice. Building a RM
does not require significant additional skills, time investment, or the physical presence
of participants. The identified constraints and prioritized goals serve as inputs to the
Scenarios Model. The RM also provides the formal value function for determining the
value of design alternatives in the AAM and assists in decision-making. The novel
features introduced in the RM is the transfer of goals and constraints from the

Chapter 3: DS Methodology Victor Gane
71
objective to the logical alternative space and transfer of stakeholder preferences from
the objective to impact space.
The RM addresses need #1, and makes populating the Objective Space Size, Clarity,
and Quality metrics in the proposed framework possible.
5.2 Scenarios Model (SM)
Methodology description
To enable building well-defined alternative space logic and thus address needs #2 and
#3, designers need to capture and communicate how they intend to address
requirements parametrically. A prescriptive process model offers the means to do that.
The SM is a prescriptive process model that builds on the scenario concept from
Requirements Engineering. The first author’s knowledge of the concepts that design
teams currently use implicitly in the industry as well research from Requirements
Engineering (e.g., First Order Logic) provided the foundation for the SM elements.
The enablers in the SM are designers, who begin the process of building the SM with
the RM-established requirements. Building on the Concurrent Engineering framework,
multiple designers concurrently decompose the same requirement into four inter-
related levels of decision elements: action items strategies parameters
parameter constraints.
An action item is an actionable description of how to achieve a requirement. An action
is generally addressed through multiple strategies - processes required to achieve an
action. Both actions and strategies are decomposed into parameters - variables
denoting properties impacting a design requirement. The last decision level is the
parameter constraint - a fixed value or upper and lower limit of values and an
increment that a parameter might be required to be within. When designers create
multiple same-level decision elements (e.g., three action items for the same
constraint), they specify how such decision elements relate to each other. AND/OR
graphs (Lamsweerde, 2001) widely used in Requirements Engineering can efficiently
describe simpler relationships but are not efficient in more complex cases since this
would lead to duplication of SM elements and result in model scalability issues.
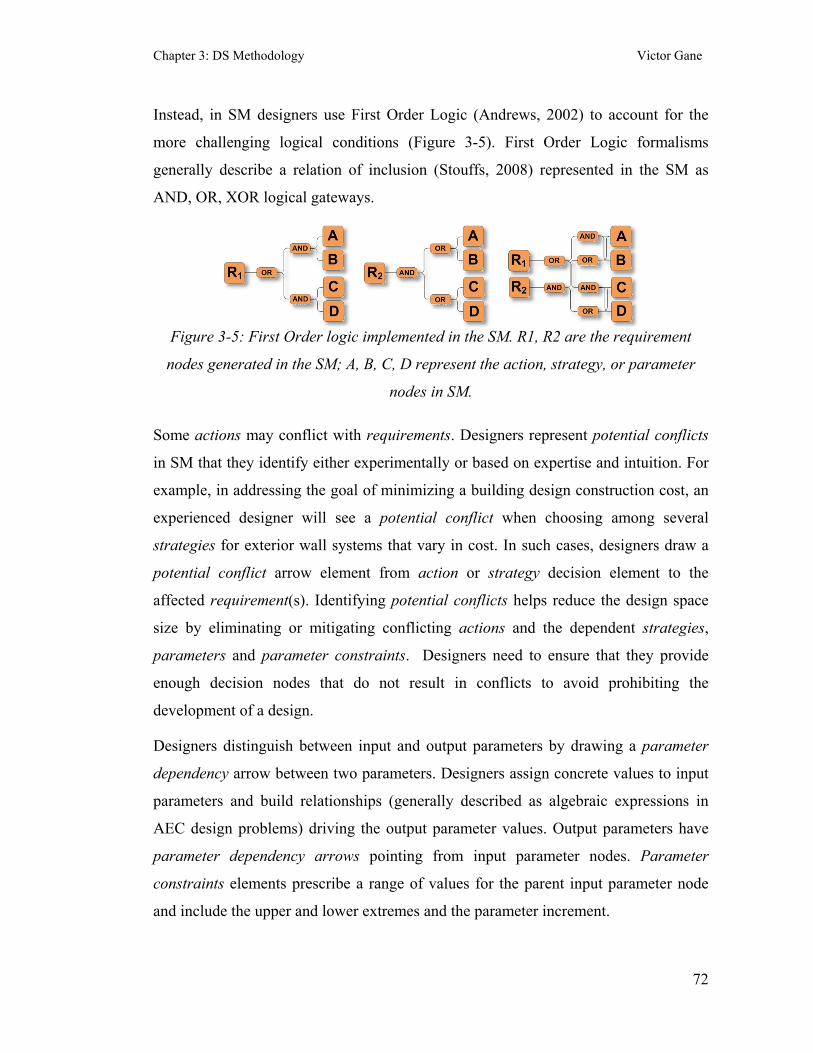
Chapter 3: DS Methodology Victor Gane
72
Instead, in SM designers use First Order Logic (Andrews, 2002) to account for the
more challenging logical conditions (Figure 3-5). First Order Logic formalisms
generally describe a relation of inclusion (Stouffs, 2008) represented in the SM as
AND, OR, XOR logical gateways.
Figure 3-5: First Order logic implemented in the SM. R1, R2 are the requirement
nodes generated in the SM; A, B, C, D represent the action, strategy, or parameter
nodes in SM.
Some actions may conflict with requirements. Designers represent potential conflicts
in SM that they identify either experimentally or based on expertise and intuition. For
example, in addressing the goal of minimizing a building design construction cost, an
experienced designer will see a potential conflict when choosing among several
strategies for exterior wall systems that vary in cost. In such cases, designers draw a
potential conflict arrow element from action or strategy decision element to the
affected requirement(s). Identifying potential conflicts helps reduce the design space
size by eliminating or mitigating conflicting actions and the dependent strategies,
parameters and parameter constraints. Designers need to ensure that they provide
enough decision nodes that do not result in conflicts to avoid prohibiting the
development of a design.
Designers distinguish between input and output parameters by drawing a parameter
dependency arrow between two parameters. Designers assign concrete values to input
parameters and build relationships (generally described as algebraic expressions in
AEC design problems) driving the output parameter values. Output parameters have
parameter dependency arrows pointing from input parameter nodes. Parameter
constraints elements prescribe a range of values for the parent input parameter node
and include the upper and lower extremes and the parameter increment.

Chapter 3: DS Methodology Victor Gane
73
Software Implementation
In Table 3-3 we describe the SM ontology, which includes several decision node
types, and logical and process relationships among nodes that enable design
stakeholders to generate and communicate multiple scenarios for the same design
project. The system transfers constraints and goals between the RM and SM to serve
as a starting point for designers to explicitly describe their logic to address
requirements. To enable designers to determine parts of the SM that might be out of
date, the mapping process captures any modifications in the RM as time stamps, which
are reflected in the equivalent requirements nodes in the SM. The system enables
designers to indicate the choice of scenarios by setting the decision node status: (a)
asserted – indicates confident choice; (b) retracted – indicates a rejected choice. If
designers retract a decision node, all other dependent decision nodes are retracted as
well; (c) assumed – indicates uncertainty and a choice that might need revision. A
retracted status propagates both down and upstream through SM arrows. The SM also
enables designers to quantify the down and upstream dependencies for any node, and
the number of requirements impacted by each action item to help determine high
impact parameters.
Table 3-3: SM graphical notation, definitions, and data schema and in the Design Scenarios software.
Term notation / definition Schema description
Restriction on the
quantitative or qualitative value of a
design parameter
System inputs: ENTITY Constraint
name: STRING; value: STRING; (free-form) unit: STRING; created by: USER; last updated: DATE; node color: BLUE;
User inputs: status: (ONEOF (Asserted, Retracted, Assumed));
END_ENTITY;
Quantifiable or
qualitative value of a design parameter that is desirable to be achieved
System inputs: ENTITY Goal
name: STRING; value: STRING; (free-form) unit: STRING; created by: USER; last updated: DATE; node color: BLUE;

Chapter 3: DS Methodology Victor Gane
74
User inputs: status: (ONEOF (Asserted, Retracted, Assumed));
END_ENTITY;
An actionable
description of how to achieve each requirement
System inputs: ENTITY Action item
created by: USER; last updated: DATE; node color: GREEN; upstream dependencies: STRING; downstream dependencies: STRING;
User inputs: ENTITY Action item
description: STRING; status: (ONEOF (Asserted, Retracted, Assumed));
END_ENTITY;
A process required to achieve an action item
System inputs: created by: USER; last updated: DATE; node color: RED; upstream dependencies: STRING; downstream dependencies: STRING;
User inputs: ENTITY Strategy
description: STRING; status: (ONEOF (Asserted, Retracted, Assumed));
END_ENTITY;
A variable denoting
properties that impact a design requirement
System inputs: created by: USER; last updated: DATE; node color: YELLOW; upstream dependencies: STRING; downstream dependencies: STRING;
User inputs: ENTITY Parameter
name: STRING; value: STRING; (free-form) type: STRING; status: (ONEOF (Asserted, Retracted, Assumed));
END_ENTITY;
A fixed value or range of values (shown as lower and upper limit nodes) that a parameter might
be required to be within
System inputs: created by: USER; last updated: DATE; node color: YELLOW; upstream dependencies: STRING; downstream dependencies: STRING;
User inputs: ENTITY Parameter constraint
name: STRING; value: STRING; (free-form)
END_ENTITY;
Logical gates describing
relationships between actions, strategies, and
parameters.
System inputs: upstream dependencies: STRING; downstream dependencies: STRING;
User inputs: ENTITY Logic gate
function: (ONEOF (AND, OR, XOR)); END_ENTITY;
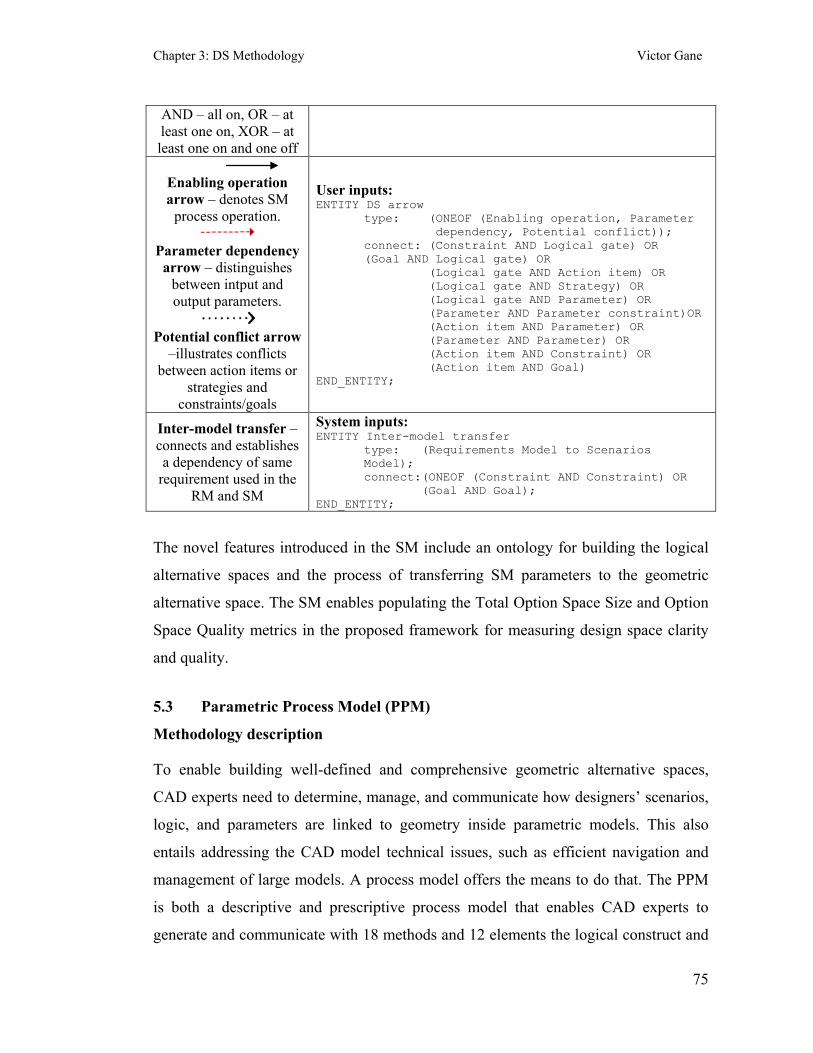
Chapter 3: DS Methodology Victor Gane
75
AND – all on, OR – at least one on, XOR – at least one on and one off
Enabling operation arrow – denotes SM
process operation.
Parameter dependency arrow – distinguishes
between intput and output parameters.
Potential conflict arrow
–illustrates conflicts between action items or
strategies and constraints/goals
User inputs: ENTITY DS arrow
type: (ONEOF (Enabling operation, Parameter dependency, Potential conflict)); connect: (Constraint AND Logical gate) OR (Goal AND Logical gate) OR (Logical gate AND Action item) OR (Logical gate AND Strategy) OR (Logical gate AND Parameter) OR (Parameter AND Parameter constraint)OR (Action item AND Parameter) OR (Parameter AND Parameter) OR (Action item AND Constraint) OR (Action item AND Goal)
END_ENTITY;
Inter-model transfer – connects and establishes a dependency of same
requirement used in the RM and SM
System inputs: ENTITY Inter-model transfer
type: (Requirements Model to Scenarios Model); connect:(ONEOF (Constraint AND Constraint) OR (Goal AND Goal);
END_ENTITY; The novel features introduced in the SM include an ontology for building the logical
alternative spaces and the process of transferring SM parameters to the geometric
alternative space. The SM enables populating the Total Option Space Size and Option
Space Quality metrics in the proposed framework for measuring design space clarity
and quality.
5.3 Parametric Process Model (PPM)
Methodology description
To enable building well-defined and comprehensive geometric alternative spaces,
CAD experts need to determine, manage, and communicate how designers’ scenarios,
logic, and parameters are linked to geometry inside parametric models. This also
entails addressing the CAD model technical issues, such as efficient navigation and
management of large models. A process model offers the means to do that. The PPM
is both a descriptive and prescriptive process model that enables CAD experts to
generate and communicate with 18 methods and 12 elements the logical construct and

Chapter 3: DS Methodology Victor Gane
76
technical implementation of a chosen SM scenario in a parametric CAD model used to
generate and search through alternative spaces (need #4). The first author’s knowledge
of the concepts that CAD experts use to build parametric models provided the
foundation for the PPM elements.
The enablers in the PPM are the CAD experts, who connect the well-defined and
comprehensive designers’ logic to computable parametric models. The CAD experts
begin the process of building the PPM with the SM-established parameters. CAD
experts refer back to the SM to understand the designers’ scenario(s), logic, and
decision choices and select the appropriate geometric elements (e.g., line, arc) for the
identified scenario to which they link the corresponding input and output parameters.
To enable predictable interaction with the parametric model, CAD experts constrain
the geometric elements (e.g., tangency relation between two arcs). To create new
geometry, CAD experts use CAD operations (e.g., extrude) and Reference elements
(e.g., XY plane) to establish the CAD operation direction. CAD experts use the
completed PPM to construct the parametric model. CAD experts use the resulting
CAD model to search through the alternative space delimited by the SM scenario (e.g.,
round building shape), evaluate the alternatives’ performance against requirements
that can be assessed geometrically through output parameters (e.g., building area), and
extract the design alternatives that satisfy the geometry-based requirements for further
analysis in discipline-specific tools (e.g., daylight, thermal comfort).
Software Implementation
In Table 3-4 we describe the PPM ontology, which includes several node types, and
logical and process relationships among nodes. A PPM contains two levels of
information abstraction. At the component-level the model illustrates how the CAD
model is decomposed into components (e.g., floor plates, exterior wall) and their
dependencies (e.g., exterior wall is dependent on floor plates). This is especially
important when working with large CAD models that can become overwhelming to
manage if no decomposition is pursued. At the geometry-level, a PPM describes the
composition of elements in each component. All nodes contain system-generated type-
dependent attributes (e.g., Extrude CAD operation attributes include a Profile,

Chapter 3: DS Methodology Victor Gane
77
Direction, and a Length value) that serve as prerequisite inputs for generating a node.
Groups of geometry-level PPM nodes can be associated with or disassociated from a
component. A node from one group can be cross-associated with another group. To
help efficiently navigate large PPM models, CAD experts can “focus” a component to
highlight the geometry-level grouped nodes that describe its composition and fade the
rest.
The system transfers input and output parameters between the SM and the geometry-
level PPM to help link requirements-driven parameters to CAD models. The mapped
parameter nodes serve as inputs to geometry nodes. CAD experts choose which
geometry node types to use based on the actions and strategies captured by designers
in the SM (e.g., Action → Generate building footprint; Strategies → Rectangular OR
Round, which will lead to choosing either a Line or Arc attribute in the geometric
element node and link either a Length or Radius parameter describing each strategy).
The PPM enables extracting input and output parameter nodes as tabular data and
automates their generation in such parametric CAD tools as CATIA or Digital Project.
The CAD expert manually builds the other PPM nodes in CAD following the PPM
prescribed structure and dependencies.
The novel features introduced in the PPM include an ontology for building the
geometric alternative spaces and the process of transferring PPM parameters to the
impact space. The PPM enables populating the CAD Model Clarity and Quality
metrics in the proposed framework for measuring design space quality.
Table 3-4: PPM ontology and graphical notation. Term notation /
definition Schema description
An information
container describing a component-level
decomposition of the CAD model.
System inputs: node color: GREEN;
User inputs: ENTITY Component
name: STRING; label: STRING; (free form) focus: (ONEOF (On, Off));
END_ENTITY;

Chapter 3: DS Methodology Victor Gane
78
A predetermined
geometric primitive used to create the
geometric representation of the
intended design
System inputs: set of attributes: SET OF STRINGS; node color: BLUE;
User inputs: ENTITY Geometric element ABSTRACT SUPERTYPE OF (ONEOF (Point, Line, Circle, Spline Polyline, Arc, Ellipse));
name: STRING; custom attribute: STRING; (free-form) component association: (ONEOF (Associate, Disassociate);
END_ENTITY;
A geometric element used to construct the design intent but not explicitly featured in
the final design representation
System inputs: identical to geometric element node type except node outline (dotted). User inputs: identical to geometric element node type.
A plane of reference used to determine the
orientation of the geometric elements
System inputs: set of attributes: SET OF STRINGS; node color: BROWN;
User inputs: ENTITY Reference element ABSTRACT SUPERTYPE OF (ONEOF (Offset from plane, Parallel through point, Angle normal to plane, Through three points, Through two lines, Through point and line, Through planar curve, Normal to curve, Tangent to surface));
name: STRING; component association: (ONEOF (Associate, Disassociate);
END_ENTITY;
An action performed on geometric element(s) in
a CAD model
System inputs: set of attributes: SET OF STRINGS; node color: GREEN; node shape: DIAMOND;
User inputs: ENTITY CAD operation ABSTRACT SUPERTYPE OF (ONEOF (Project, Intersect, Extrude, Revolve, Offset, Fill, Loft, Blend, Join, Split, Translate, Rotate, Symmetry, Scale));
custom attribute: STRING; name: STRING; component association: (ONEOF (Associate, Disassociate);
END_ENTITY;
A user-controlled parameter, which affects multiple
geometric elements
System inputs: name: STRING;(if Parameter created in SM) value: STRING; (free-form) Node color: YELLOW;
User inputs: ENTITY Global Input parameter name: STRING;(if New parameter) custom attribute: STRING;(if New parameter)

Chapter 3: DS Methodology Victor Gane
79
within a CAD model component association: (ONEOF (Associate, Disassociate);
END_ENTITY;
A user-controlled parameter, which affects a single
geometric element within a CAD model
User inputs: identical to global input parameter. System inputs: identical to global input parameter node except node outline (dashed).
An input parameter with a constrained
value
System inputs: identical to global input parameter except node outline (dotted). User inputs: identical to global input parameter.
A parameter whose value is determined
formulaically
System inputs: name: STRING;(if Parameter created in SM) value: STRING; (free-form)(if created in SM) node color: YELLOW; node shape: OVAL;
User inputs: ENTITY Output parameter
name: STRING;(if New parameter) value: input parameter 1 AND STRING (free-form) AND input parameter n; (if New parameter) component association: (ONEOF (Associate, Disassociate);
END_ENTITY;
A constant, non-
numerical relationship between geometric
elements
System inputs: Node color: RED;
User inputs:
ENTITY Geometric constraint ABSTRACT SUPERTYPE OF (ONEOF (Fixed, Horizontal, Vertical, Coincidence, Concentric, Perpendicular, Tangent, Parallel));
set of attributes: SET OF STRINGS; name: STRING; component association: (ONEOF (Associate, Disassociate);
END_ENTITY;
Component
sequencing – illustrates the sequence of
construction process of components
System inputs: start component name: STRING; end component name: STRING;
User inputs: ENTITY PP Component arrow
connect: Component AND Component; END_ENTITY;
Input / output dependency –
illustrates information
System inputs: start node name: STRING; end node name: STRING;
User inputs:

Chapter 3: DS Methodology Victor Gane
80
dependency applicable to all but component
nodes
ENTITY PP arrow connect: (Geometric element AND Constraint) OR (Reference element AND Constraint) OR (Reference element AND CAD operation) OR (Reference element AND Geom. element) OR (Input parameter AND Geom. element) OR (Output parameter AND Geom. element) OR (Input parameter AND Output parameter) OR (Input parameter AND CAD operation) OR (Output parameter AND CAD operation) OR (Input parameter AND Output parameter) END_ENTITY;
Inter-model transfer – connects and establishes a
dependency of the same parameter in the SM
and PPM
System inputs: ENTITY Inter-model transfer
type: Scenarios Model to Parametric Process Model; connect (ONEOF (Input Parameter AND Input Parameter) OR (Output parameter AND Output parameter);
END_ENTITY;
5.4 Alternatives Analysis Model (AAM)
Methodology description
The AAM is a tabular model developed by the designers to evaluate how each
alternative analyzed in parametric CAD or discipline-specific tools ranks in relation to
the goals identified in the RM, thus enabling building the impact and value spaces and
addressing need #8. MACDADI (Haymaker et. al. 2006) provided the foundation for
the AAM elements.
The enablers in the AAM are the designers. DS method asks designers to perform a
formal analysis (e.g., daylight) for every parametrically generated alternative and
determine a well-defined impact score given the RM constraints and goals. A major
benefit of DS method is that designers are ensured to perform analysis only on
alternatives that satisfy all the geometry-based requirements. Benchmark-based
scoring enables designers to determine and compare the impact of each alternative’s
performance against the RM goals’ targets, calculated as a percentage of the goal
target value. Designers assign scores measured in percentage points to each alternative
based on low and high benchmarks (e.g., high benchmark: minimize cost to $80,000,
low benchmark: minimize to $100,000). If an alternative achieves a goal, it receives a
100% score. If it exceeds it (e.g., $70,000, it receives the percentage scored above the
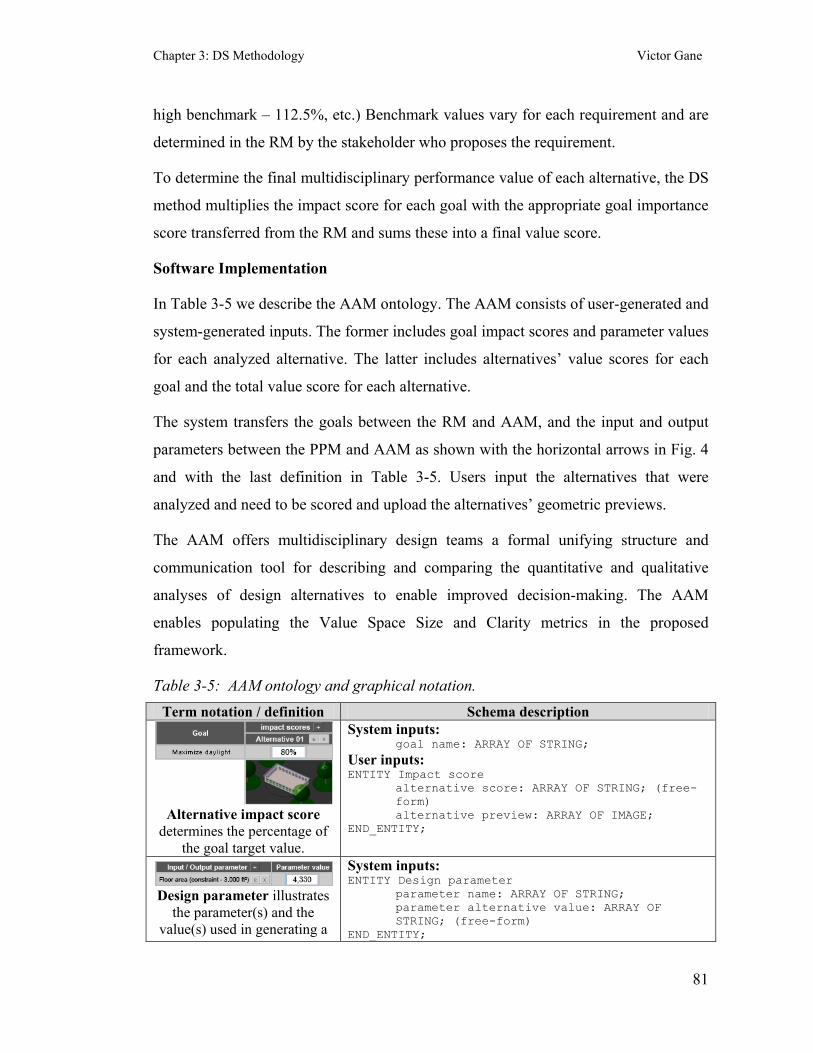
Chapter 3: DS Methodology Victor Gane
81
high benchmark – 112.5%, etc.) Benchmark values vary for each requirement and are
determined in the RM by the stakeholder who proposes the requirement.
To determine the final multidisciplinary performance value of each alternative, the DS
method multiplies the impact score for each goal with the appropriate goal importance
score transferred from the RM and sums these into a final value score.
Software Implementation
In Table 3-5 we describe the AAM ontology. The AAM consists of user-generated and
system-generated inputs. The former includes goal impact scores and parameter values
for each analyzed alternative. The latter includes alternatives’ value scores for each
goal and the total value score for each alternative.
The system transfers the goals between the RM and AAM, and the input and output
parameters between the PPM and AAM as shown with the horizontal arrows in Fig. 4
and with the last definition in Table 3-5. Users input the alternatives that were
analyzed and need to be scored and upload the alternatives’ geometric previews.
The AAM offers multidisciplinary design teams a formal unifying structure and
communication tool for describing and comparing the quantitative and qualitative
analyses of design alternatives to enable improved decision-making. The AAM
enables populating the Value Space Size and Clarity metrics in the proposed
framework.
Table 3-5: AAM ontology and graphical notation. Term notation / definition Schema description
Alternative impact score
determines the percentage of the goal target value.
System inputs: goal name: ARRAY OF STRING;
User inputs: ENTITY Impact score
alternative score: ARRAY OF STRING; (free-form) alternative preview: ARRAY OF IMAGE;
END_ENTITY;
Design parameter illustrates
the parameter(s) and the value(s) used in generating a
System inputs: ENTITY Design parameter
parameter name: ARRAY OF STRING; parameter alternative value: ARRAY OF STRING; (free-form)
END_ENTITY;

Chapter 3: DS Methodology Victor Gane
82
design alternative
Alternative illustrates the design alternative(s) that
satisfy constraints and selected to be analyzed
against goal target values
System inputs: ENTITY Alternative
alternative name: ARRAY OF STRING; END_ENTITY;
Alternative value illustrates
the score calculated by multiplying the alternative
impact score and goal importance. Value score
illustrates the sum of alternative’s impact scores for
all goals
System inputs: ENTITY Value score
goal name: ARRAY OF STRING; goal importance: ARRAY OF STRING; (free-form) goal alternative value score: STRING;(free-form) alternative value score: ARRAY OF STRING; (free form)
END_ENTITY;
Inter-model transfer – connects and establishes a
dependency of the same goal or parameter in RM, PPM and
AAM models
System inputs: ENTITY Inter-model transfer
type: (ONEOF (Requirements Model to Alternatives Analysis)OR (Parametric Process Model to Alternatives Analysis Model); connect (ONEOF (Goal AND Goal) OR (Input Parameter AND Input Parameter) OR (Output parameter AND Output parameter);
END_ENTITY;
5.5 Illustrative Example
This section explains the application of DS through a simple, hypothetical example
that has three stakeholders – client (a University), architect, and mechanical engineer.
Figure 3-6 illustrates the site between the four central planters in the University Quad,
where a new teaching space is to be designed.
Figure 3-6: The site for a teaching space.

Chapter 3: DS Methodology Victor Gane
83
5.5.1 Requirements Model
The design process begins with the analysis of the site opportunities and constraints.
The client creates a constraint in the RM – minimum usable area of 3,000 square feet.
The site helps the architect identify an additional constraint – the buildable area set
back of 10 feet from the four adjacent planters to allow circulation around the
building. The mechanical engineer adds the goal to maximize the use of daylight to an
average of 500 lux required for a teaching space and thus minimize the use of electric
lighting. The client adds the goal to minimize the construction cost to below $100,000.
Once the requirements are synthesized and accepted by all parties, stakeholders and
designers individually rank each goal according to their preference. All stakeholders
are weighted equally in this example. Figure 3-7 illustrates the client’s preference for
minimizing construction cost by assigning a 60% relative importance value. When
stakeholders complete assigning importance to goals, the system generates a
cumulative importance percentage graph. By comparing weighted characteristics of
goals, design teams can set priorities. Figure 3-7 shows that maximizing use of
daylight emerged as the prevailing goal with a 65% cumulative percentage score. The
RM helps clarify what the project requirements are, who generated them, and how
important are they to the project stakeholders in an integrated, concurrently generated
model. The concept of requirements if not novel, however prior to developing the RM,
design teams could not ensure that requirements are well-defined by all stakeholders.
Figure 3-7: The Requirements Model captures the stakeholders’ constraints, goals,
and preferences for goals. Stakeholders distribute a percentage of preference (totaling
100%) to each identified goal.

Chapter 3: DS Methodology Victor Gane
84
5.5.2 Scenarios Model
Establishing a scenario enables design stakeholders (architect and mechanical
engineer) to determine the alternative space extremes based on the identified set of
requirements. The architect suggests investigating two scenarios – one single large
teaching space configuration and two smaller ones, both with perimeter windows to
address the daylight goal. This decision clarifies the range of geometric variations –
from a square to a rectangle (Figure 3-8).
Figure 3-8: The architect suggests two scenarios (square and rectangular classroom)
that enables determine the desired range of geometric variations.
Figure 3-9 shows the case study SM model. The model starts with the goal and
constraints nodes mapped from the RM and is concurrently decomposed by the design
stakeholders into action, strategy, parameter, and parameter constraint decision nodes.
The design space extremes are explicitly recorded as strategy nodes (e.g., rectangular
OR square footprint – both extremes need to be supported by the CAD model), which
in turn describe the Control building configuration action, one of the two actions
required to achieve the Minimum usable area constraint. Both strategies share the
same set of geometric parameters – Building width (input) and Building length
(output). Using his expert knowledge on minimum usable building width, the architect
suggests a range decribed by two parameter constraints – lower limit of 30 feet, and
upper limit of 95 feet, calculated by using Pythagora’s theorem in view of the round
site configuration.
In addressing the Maximize use of daylight goal, Introducing lightshelves – one of the
five required actions, is identified as leading to a potential conflict with the Minimize
construction cost goal which is important for the client. Further decomposing the
action into strategies helps determines how to avoid the negative impact. For example,

Chapter 3: DS Methodology Victor Gane
85
two strategies impact the geometry, the third suggests a material. Having the Same
depth on all sides is a less costly solution than Orientation dependent depth strategy,
which results in a higher number of custom building components, and thus is the
chosen strategy. The strategy that wasn’t chosen along with the subsequent dependent
nodes is faded by the system and kept as a reference in case stakeholders change their
preferences in the Requirements Model.
The SM enables design stakeholders to concurrently simplify complex design
decisions by visualizing each others’ logic and the repercussions, and identify key
design parameters used to generate a requirements-driven logical alternative space.
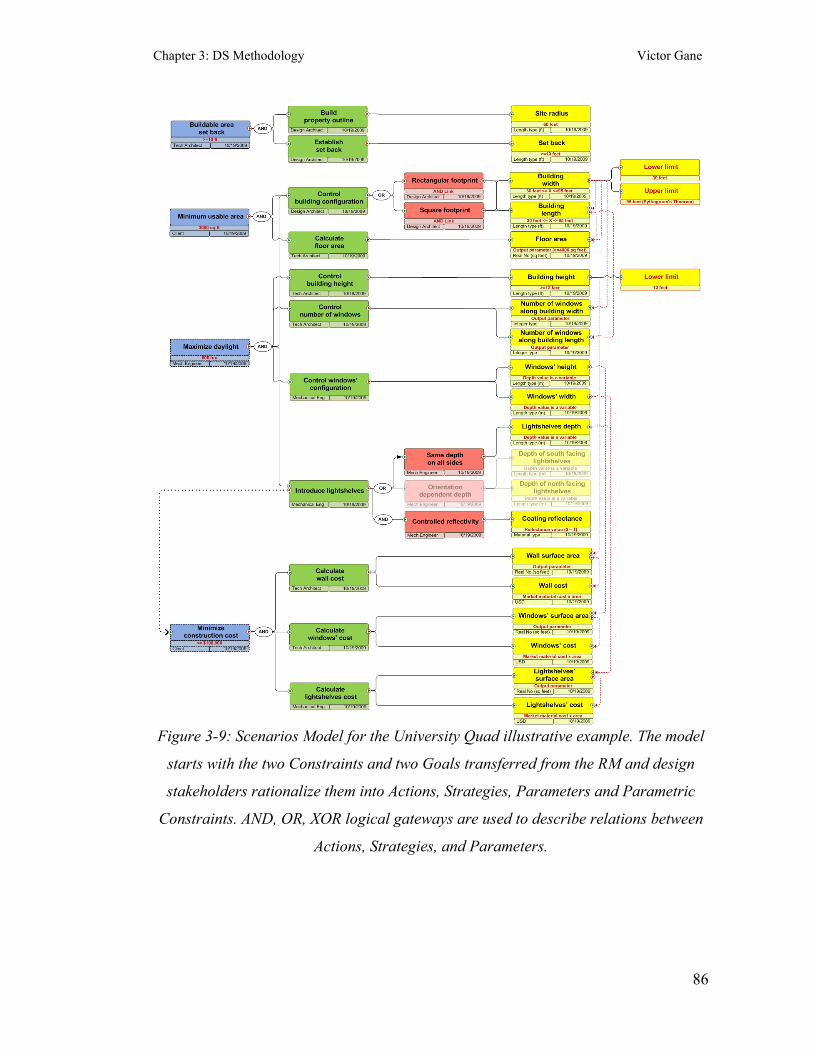
Chapter 3: DS Methodology Victor Gane
86
Figure 3-9: Scenarios Model for the University Quad illustrative example. The model
starts with the two Constraints and two Goals transferred from the RM and design
stakeholders rationalize them into Actions, Strategies, Parameters and Parametric
Constraints. AND, OR, XOR logical gateways are used to describe relations between
Actions, Strategies, and Parameters.

Chapter 3: DS Methodology Victor Gane
87
5.5.3 Parametric Process Model
With the SM finalized, the system transfers the input and output parameters into the
PPM environment. The CAD expert is notified by the project administrator to begin
building the PPM used to generate the geometric alternative space. He first examines
the SM to understand the design stakeholders’ logic for addressing requirements and
the scenario(s) to be implemented in a CAD model. He begins building the PPM by
decomposing the CAD model structure into six components created in the component-
level PPM model space (Figure 3-10). In today’s practice, this step is generally
fraught with errors and leads to likely rework because a comprehensive RM/SM is
missing. The CAD expert organizes the nodes to reflect the sequence in the model
building process and the inter-component dependency. For example, in order to
generate the Windows, the model must first have the Walls component constructed,
which in turn is dependent on the Building footprint component.
Figure 3-10: Component-level PPM illustrates the CAD model decomposition into six
components shown in hierarchical order.
With the component-level structure of the parametric model in place, the next task is
to determine the composition of each component at the schema level. For example, in
describing the model’s first component called Property outline, the CAD expert
referenced the RM model that helped identify the site’s circular configuration and its
radius constraint. As a result, a circle was used as a starting point in building the
geometry-level PPM. To help fix the circle in the work space, its origin was
coincidentally constrained to the origin of the XY plane, and its radius was determined
by the Property radius parameter, which includes the 10’-0” set back constraint
(Property radius → 60’–10’=50’) (Figure 3-11a).

Chapter 3: DS Methodology Victor Gane
88
To construct the Building footprint component the CAD expert chooses a rectangle as
the geometric element given the scenarios prescribed in the SM (i.e., square to
rectangle). He then assigns a geometric constraint (i.e., coincident) that binds the
rectangle’s first three vertices to the circle outline, and connects with a dependency
arrow the SM transferred Building width global input parameter to the vertical line on
the rectangle’s right hand side. The Building length output parameter and its value is
dynamically measured after the CAD expert links it to the rectangle’s horizontal line.
This enables calculating the Minimum usable area constraint through the Floor area
output parameter by multiplying the Building length and Building width parameters
(Figure 3-11b). To prevent emergence of unpredictable geometry (e.g., changing the
length of the rectangle that has not been geometrically constrained may lead to a
parallelepiped), the pairs of lines are assigned vertical and horizontal geometric
constraints.
a) b) Figure 3-11: Schema-level PPM describes the composition of: a) “Property outline”
component; b)”Building footprint” component.
A similar method is used to construct the model’s remaining four components. Figure
3-12 illustrates the final composite PPM model, which helps understand the
implications of changing the value of any input parameter on the rest of the model.
CAD experts can navigate through the model by selecting component nodes and
bringing into focus at the geometry-level only the nodes that are grouped into that
component.

Chapter 3: DS Methodology Victor Gane
89
Figure 3-12: Final composite geometry-level PPM. Note that the nodes’ attributes are
toggled off to help simplify the model. The model helps understand which nodes are
affected when parameter values are changed by highlighting them (i.e., the Building
width value was changed from 40’ to 70’).
The completed PPM serves as a guideline to building the parametric CAD model in
which design stakeholders manage the SM parameters to generate geometric design
alternatives. Table 6 illustrates three such alternatives from potentially an infinite
number that the CAD model can support within the SM-defined alternative space. A
selection of model definition parameters is also included. Designers selected these
alternatives for further analysis following both a qualitative (e.g., visual) and
quantitative assessment, in which they use the Floor area output parameter to
understand which alternatives satisfy the 3,000 ft2 Minimum usable area constraint.
Table 3-6: Three geometric alternatives selected for further analysis and the input and resulting output parameters.
Alternative 1
Alternative 2
Alternative 3 Floor Area (Constraint) - 3000 ft2
4,330 5,000 3,666
Constr. Cost (Goal) - $<100,000
112,809 130,655 139,250
Building Height (ft) 16 18 18 Building width (ft) 50 70 40 Window Height (ft) 9 10 8 Window Width (ft) 6 9 5

Chapter 3: DS Methodology Victor Gane
90
Window Spacing (ft) 3 2 2 Light shelves Depth (ft) 3 4 2.5
5.5.4 Alternatives Analyses Model
Building the AAM enables the design stakeholders to make an objective decision
amongst the three alternatives based on how well each alternative satisfies the value
function established in the RM. First, the system transfers the RM goals and the PPM
input and output parameters into the AAM model environment. Next, design
stakeholders add the three alternatives to the project database, for which they record
the parameter values used to generate them and the impact scores for each goal.
Similar to the quantitative assessment of constraints in CAD used to select the three
alternatives, the design stakeholders determine the impact scores of each selected
alternative for the Minimize construction cost below $100,000 goal, calculated as the
sum of Window cost, Wall cost, and Light shelves cost output parameters. For
example, alternative 1 cost $112,809 or 17% above the goal target value and receives
a score of 83%. Changing any of the input parameters affects the performance of this
goal.
Not all goals, however, can be calculated by means of output parameters in CAD.
Some require model-based analyses in specialized tools. For example, to address the
Maximize use of daylight goal, the mechanical engineer optimizes the geometry of the
selected alternatives (e.g., mesh) to perform daylight analyses in Autodesk Ecotect
(Figure 3-13).

Chapter 3: DS Methodology Victor Gane
91
a)
b)
c) Figure 3-13: Some quantifiable goals require model-based analysis performed outside
the parametric modeler. Autodesk Ecotect© is used to determine average daylight
values in lux for all three alternatives. Note that the ceiling is omitted for clarity.

Chapter 3: DS Methodology Victor Gane
92
This enables extracting average daylight values and assigning impact scores for
Maximize daylight use goal. For example, alternative 1 has an average of 400 lux, or
an 80% score of the target value of 500 lux (400*100/500=80%); alternative 2 → 300
lux, or a 60% score (300*100/500=60%), and alternative 3 → 450 lux, or a 90% score
(450*100/500=90%). All global input parameters listed in Table 3-6 impact this goal.
Once the stakeholders assign all the impact scores, the system generates the value
scores for each alternative by multiplying the impact scores with the cumulative
percentage importance scores of each goal from the RM. For example, alternative 1
value score multiplies 80*0.65=52. The system aggregates value scores for each
alternative into a total value score (e.g., alternative 1 → 52+29=81) to enable the
stakeholders to objectively select the highest performing alternative 1 (Figure 3-14b).
a)
b) Figure 3-14: Alternatives Analysis Model: a) users input impact scores and geometric
parameter values for each analyzed alternative; b) the system generates a value score
for each alternative. Alternative 1 emerges as the preferred one based on the goals
identified in the RM and the goal importance determined by stakeholders.
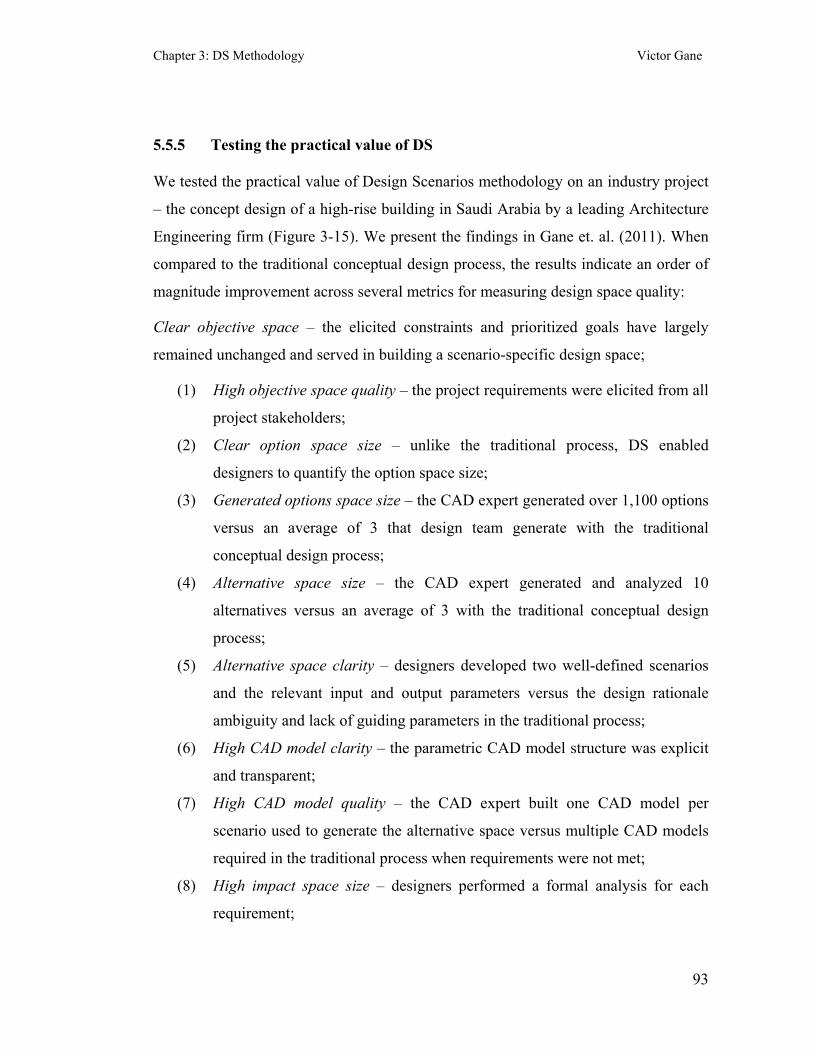
Chapter 3: DS Methodology Victor Gane
93
5.5.5 Testing the practical value of DS
We tested the practical value of Design Scenarios methodology on an industry project
– the concept design of a high-rise building in Saudi Arabia by a leading Architecture
Engineering firm (Figure 3-15). We present the findings in Gane et. al. (2011). When
compared to the traditional conceptual design process, the results indicate an order of
magnitude improvement across several metrics for measuring design space quality:
Clear objective space – the elicited constraints and prioritized goals have largely
remained unchanged and served in building a scenario-specific design space;
(1) High objective space quality – the project requirements were elicited from all
project stakeholders;
(2) Clear option space size – unlike the traditional process, DS enabled
designers to quantify the option space size;
(3) Generated options space size – the CAD expert generated over 1,100 options
versus an average of 3 that design team generate with the traditional
conceptual design process;
(4) Alternative space size – the CAD expert generated and analyzed 10
alternatives versus an average of 3 with the traditional conceptual design
process;
(5) Alternative space clarity – designers developed two well-defined scenarios
and the relevant input and output parameters versus the design rationale
ambiguity and lack of guiding parameters in the traditional process;
(6) High CAD model clarity – the parametric CAD model structure was explicit
and transparent;
(7) High CAD model quality – the CAD expert built one CAD model per
scenario used to generate the alternative space versus multiple CAD models
required in the traditional process when requirements were not met;
(8) High impact space size – designers performed a formal analysis for each
requirement;
Chapter 3: DS Methodology Victor Gane
94
(9) High value space size – designers determined a total value for each generated
alternative versus a lacking valuation method in the traditional process;
(10) High value space clarity – unlike the traditional process, designers explicitly
defined a total value for the generated alternatives.
Design Scenarios was tested on a single industry project. However, we expect DS to
have a similar impact and power on other AEC projects and industries that undergo
analogous process problems.
Figure 3-15: Jeddah mixed-use towers project in Saudi Arabia.
6 Conclusion Today, the process of designing a building requires the expertise of many disciplines,
in which experts tackle the same problem with different sets of requirements,
ontologies, and work methods. The performance of a design project is, therefore, not
only a function of the expertise of the individual experts, but also how well they work
together (Garcia et. al. 2004). This is especially true during conceptual design, when
decisions are the cheapest to make for design stakeholders and have biggest impact on
the design cost and performance (Ellis & Torcellini, 2008). A system that is flexible
enough to be considered general but which offers a common ontology and work
process for all stakeholders in the building design process can positively impact the
design space quality. This paper first introduced a framework for measuring design
space quality through a set of key metrics for the Objective, Alternative, Impact, and
Value subspaces. The paper’s major contribution is a methodology called Design
Scenarios developed to enable populating the framework with metrics quantifying a
conceptual design process in which the alternative space is generated with parametric

Chapter 3: DS Methodology Victor Gane
95
CAD. The novel features include an ontology for building multidisciplinary logical
and geometric alternative spaces, as well as the process of systematically transferring
design requirements from the objective space to the alternative, impact and value
spaces through the means of four interrelated models.
With the Requirements Model stakeholders explicitly determine project requirements
in a unified model, in which they rank goals and understand how important these goals
are to each stakeholder. With the Scenarios Model, design stakeholders rationalize the
requirements transferred from the RM into logical alternative spaces described in
terms of scenarios and key input and output parameters. With the Parametric Process
Model CAD experts explicitly communicate the construct of parametric CAD models,
in which the parameters transferred from the SM are used to generate geometric
alternative spaces within the boundaries of the SM-defined scenario. Finally, with the
Alternatives Analysis Model stakeholders determine the impact and total value scores
for the generated alternatives to enable an objective decision making process.
This paper described the application of Design Scenarios through an illustrative
example. Gane et. al. (2011) illustrate the application of Design Scenarios on an
industry test case and compare the resulting metrics measuring the design space
quality with three other data sets: (1) traditional, non-parametric conceptual design
practice; (2, 3) two applications of parametric modeling with no formal methodology
to generate and communicate scenarios. The DS methodology was tested on two
scenarios for the same industry test case to illustrate its generality across requirements
and scenarios. However, the current limitation is that one researcher implemented the
methodology and performed the measurements from one industry test case. Future
work is to extend external validity by applying DS on more industry projects. DS
offers opportunities to automate the parametric CAD model generation from the PPM
and integrate the AAM with multidisciplinary optimization tools to automate the
process of determining the impact scores for alternatives. The industry application of
the methodology presents evidence that DS provides CAD experts with well-defined
logic and parameters for addressing requirements and the process enables creating

Chapter 3: DS Methodology Victor Gane
96
parametric alternatives with clear multi-objective values that potentially provide
clients with better building designs.
7 Bibliography AIAA, (1991). “Current state of the art in multidisciplinary design optimization”.
American Institute for Aeronautics and Astronautics Inc. MDO Technical
Committee.
Akın, Ö. (2001). “Variants of design cognition”, Design Knowing and Learning:
Cognition in Design Education. Eastman, C., Newsletter, W., & McCracken,
M., Eds., New York: Elsevier, pp. 105–124.
Andrews, P. (2002). “An Introduction to Mathematical Logic and Type Theory: To
Truth Through Proof”. Kluwer Academic Publishers.
Baniassad, E., Clarke, S., (2004). "Theme: An Approach for Aspect-Oriented Analysis
and Design". 26th International Conference on Software Engineering
(ICSE'04), pp.158-167
Bock, C., Zha, X., Suh, H., Lee, (2010). “Ontological product modeling for
collaborative design”. Journal of Advanced Engineering Informatics, Vol. 24,
pp. 510–524.
Chachere J., Haymaker J. (2011). “Framework for measuring rationale clarity of AEC
design decisions”. Journal of Architectural Engineering, In Press, doi:
10.1061/ (ASCE) AE.1943-5568.0000036.
Chen, D., Pai, W. (2005). “A Methodology for Conceptual Design of Mechanisms by
Parsing Design Specifications”. Journal of Mechanical Engineering, Vol. 127,
Issue 6, pp. 1039-1045.
Clevenger, C., Haymaker, J. (2011). “Metrics to assess design guidance”. Design
Studies, In Press, doi:10.1016/j.destud.2011.02.001

Chapter 3: DS Methodology Victor Gane
97
Colombo, G., Mosca, A., Sartori, F. (2007). “Towards the design of intelligent CAD
systems: An ontological approach”. Advanced Engineering Informatics, Vol.
21, pp. 153–168
Ellis, P., Torcellini, P. (2008). “Energy Design Plug-in: An Energy Plus Plugin for
SketchUp”, ed. SimBuild Proceedings, Berkeley, California, NREL/CP-550-
43569.
Fowler, M. (2004). “UML Distilled Third Edition – A Brief Guide to Standard Object
Modeling Language”. Pearson Education.
Froese, T. (1996). “Models of Construction Process Information”. ASCE Journal of
Computing in Civil Engineering”. Vol. 10, No. 3, pp. 183-193.
Fukuda, S., (2007). “Be Lazy: A Motto for New Concurrent Engineering”, Springer
London.
Gane, V., Haymaker, J. (2010). “Benchmarking current conceptual high-rise design
processes”, ASCE Journal of Architectural Engineering. Vol. 16, No. 3, pp.
100-111.
Gane, V., Haymaker, J., Fischer, M., Bazjanac, V. (2011). “Application of Design
Scenarios methodology to evaluate the effectiveness of transparent parametric
CAD”, CIFE Technical Report No. 199
(http://cife.stanford.edu/online.publications/TR199.pdf)
Garcia, A., Kunz, J., Ekstrom, M., Kiviniemi, A. (2004). “Building a project ontology
with extreme collaboration and virtual design and construction”. Advanced
Engineering Informatics, Vol. 18, pp. 71–83
Goldschmidt, G., (2006). “Quo vadis, design space explorer?” Artificial Intelligence
for Engineering Design, Analysis and Manufacturing. Vol. 20, pp. 105-111.
Hartmann, T., Fischer, M., Haymaker, J. (2009). “Implementing information systems
with project teams using ethnographic–action research,” Advanced
Engineering Informatics, Volume 23, Issue 1, pp. 57-67.

Chapter 3: DS Methodology Victor Gane
98
Hauser, J., Clausing, D. (1988). “The House of Quality”. Harvard Business Review.
Vol. May-June, pp. 63-73.
Haymaker, J., Fischer, M., Kunz, J. and Suter, B. (2004). “Engineering Test Cases to
Motivate the Formalization of an AEC Project Model as a Directed Acyclic
Graph of Views and Dependencies,” ITcon, Vol. 9, pp. 419-441.
Haymaker, J. and Chachere, J. (2006). “Coordinating Goals, Preferences, Options, and
Analyses for the Stanford Living Laboratory Feasibility Study,” Intelligent
Computing in Engineering and Architecture 13th EG-ICE Revised Selected
Papers, Lecture Notes in Computer Science, Ian Smith (ed.), Springer-Verlag,
Berlin, Heidelberg, New York, Vol. 4200/2006, pp. 320-327.
Hsu, W., Woon, I. M. (1998). “Current Research in the Conceptual Design of
Mechanical Products”. Computer-Aided Design, 30, 1998, pp 377-389.
ISO International Standard 10303-11 (1994). “Industrial automation systems and
integration — Product data representation andexchange - Part 11: Description
methods: The EXPRESS language reference manual”, International
Organization for Standardization, Geneva, Switzerland.
Kam, C., (2005). “Dynamic Decision Breakdown Structure: Ontology, Methodology,
& Framework for Information Management in Support of Decision-Enabling
Tasksin the Building Industry”. CIFE Technical Report No. 164. Accessed at
http://cife.stanford.edu/online.publications/TR164.pdf.
Kelley, D. (2006). “Design Thinking”. Accessed at
http://www.extrememediastudies.org/extreme_media/
1_navigating/pdf/navigating_design_thinking.pdf
Kilian, A. (2004). PhD Scholar, MIT. From an interview conducted in March, 2004.
Kinzel, E., Schmiedeler, J., Pennock, G. (2007). “Function Generation With Finitely
Separated Precision Point Using Geometric Constraint Programming”. Journal
of Mechanical Engineering, Vol. 129, Issue 11, pp. 1185-1191.

Chapter 3: DS Methodology Victor Gane
99
Kiviniemi, A., Fischer, M., Bazjanac, V., Paulson, B. (2004). “PREMISS -
Requirements Management Interface to Building Product Models: Problem
Definition and Research Issues”. CIFE Technical Report No. 92.
(http://cife.stanford.edu/Publications)
Knight, T. (2000). “Shape grammars in education and practice: history and prospects”.
International Journal of Design Computing. Vol 2. Accessed at:
http://www.arch.usyd.edu.au/kcdc/journal/vol2.
Kolarevic, B. (Ed), (2003). “Architecture in the Digital Age: Design and
Manufacturing”. Taylor & Francis.
Lamsweerde A (2000). “Requirements engineering in the year 2000: A research
perspective”. In: Proceedings of 22nd International Conference on Software
Engineering, (ICSE’2000): Limerick, Ireland, Invited Paper, ACM Press, pp.
5–19.
Lamsweerde A (2001). “Goal-Oriented Requirements Engineering: A Guided Tour”.
Proceedings RE’01, 5th IEEE International Symposium on Requirements
Engineering, Toronto, pp. 249-263.
Laplante, P. (2007). “What Every Engineer Should Know about Software
Engineering”. CRC Press, Taylor & Francis Group.
Leary, M., Burvill, C. (2007). “Enhancing the quality function deployment conceptual
design tool”. ASME Journal of Mechanical Design, Vol. 129, Issue 7, pp. 701-
709.
Lee, G., Sacks, R., Eastman, C., (2006). “Specifying parametric building object
behavior (BOB) for a building information modeling system”. Automation in
Construction, Vol. 15, pp. 758 – 776.
Lee, G., Sacks, R., Eastman, C., (2007). “Product data modeling using GTPPM – A
case study”. Automation in Construction, Vol. 16, pp. 392 – 407.

Chapter 3: DS Methodology Victor Gane
100
Lin, M., Chen, L., Chen, M. (2009). “An integrated component design approach to the
development of a design information system for customer-oriented product
design”. Advanced Engineering Informatics, Vol. 23, pp. 210–221
Miller, L., (1993). “Concurrent Engineering Design: integrating the best practices for
process improvement”. Society of Manufacturing Engineers. Publications
Development Department, Reference Publications Division.
National Institute of Standard and Technology (NIST), (1993). “IDEF0 - Function
Modeling Method”. Accessed on http://www.idef.com/IDEF0.htm.
Olewnik, A., Brauen, T. (2004). “A Framework for Flexible Systems and Its
Implementation in Multi attribute Decision Making”. Journal of Mechanical
Engineering, Vol. 126, Issue 3, pp. 412-420.
Reddy, S., Fertig, K., Smith, D. (1996). “Constraint Management Methodology for
Conceptual Design Tradeoff Studies”. Proceedings of the 1996 ASME Design
Engineering Technical Conferences and Computers in Engineering
Conference, Irvine, California, pp 1-11.
Rolland, C.; Pernici, C. (1998). “A Comprehensive View of Process Engineering”.
Proceedings of the 10th International Conference CAiSE'98, B. Lecture Notes
in Computer Science 1413. Pisa, Italy: Springer, pp. 191.
Rolland, C., Salinesi, C. (2005). “Modeling Goals and Reasoning with Them”.
Engineering and Managing Software Requirements. A. Aurum, C. Wohlin
(editors), Springer Verlag.
Ross, D., Schoman, E. (1977). “Structured Analysis for Requirements Definition”.
IEEE Transactions on Software Engineering, Vol. SE-3, No. 1. Pp. 6-15.
Royce, W., (1970).“Managing the development of large software systems”.
Proceedings, IEEE Wescon, pp. 1-9.
Rozenberg, G., 1997. “Handbook on Graph Grammars and Computing by Graph
Transformation: Foundations”, Vol.1, World Scientific Publishing Company.
Chapter 3: DS Methodology Victor Gane
101
Shah, J., Mäntylä, M. (1995). “Parametric and Feature-Based CAD/CAM: Concepts,
Techniques, and Applications”. Wiley, John & Sons, Inc.
Stouffs, R. (2008). “Constructing design representations using a sortal approach”.
Advanced Engineering Informatics, Vol. 22, pp. 71–89.
Struck, C., de Wilde, P., Hopfe, C., Hensen, J. (2009). “An investigation of the option
space in conceptual building design for advanced building simulation”.
Advanced Engineering Informatics, Vol. 23, pp. 386–395
Suh, N. P., (1998). “Axiomatic Design Theory for Systems”. Research in Engineering
Design Vol. 10, pp. 189–209, Springer-Verlag London Limited.
Suh, N. P., (1995). “Axiomatic Design of Mechanical Systems”. Journal of Vibration
and Acoustics. Vol. 117, pp. 2-10.
Sutton, R. (2002). “Weird Ideas that Work - 11.5 practices for promoting, managing,
and sustaining innovation”. The Free Press, New York, NY.
Takai, S., Ishii, K. (2006). “Integrating Target Costing Into Perception-Based Concept
Evaluation of Complex and Large-Scale Systems Using Simultaneous
Decomposed QFD”. Journal of Mechanical Engineering, Vol. 128, Issue 6, pp.
1186-1196.
Tapping, D., Shuker, T. (2002). “Value Stream Management”. Productivity Press.
Turner, C., Frankel, M., (2008). “Energy Performance of LEED for New Construction
Buildings”. USGBC report.
United States Green Building Council (USGBC), Leadership in energy and
environmental design, http://www.usgbc.org (2007)
Woodbury, R., Burrow, A., (2006). “Whither Design Space?”Artificial Intelligence for
Engineering Design, Analysis and Manufacturing”. Vol. 20, pp. 63-82.
Yassine, A., Braha, D., (2003). “Complex Concurrent Engineering and the Design
Structure Matrix Method”. Sage Publications, Vol. 11, No. 3, pp. 165-176.

Chapter 3: DS Methodology Victor Gane
102
Xexe, G., Vivacquaa, A., Moreira de Souzaa, J., Bragaa, B., D’Almeida Jr, J., Kinder
Almenteroa, B., Castilhoa, R., Miranda, B. (2005). “COE: A collaborative
ontology editor based on a peer-to-peer framework”. Advanced Engineering
Informatics, Vol. 19, pp. 113–121.
Xiong, G. (2000) “Theory and practice of concurrent engineering”. Tsing Hua Press,
Beijing.
Zhang. H., Wang, H., Chen, D., Zacharewicz, G. (2010). “A model-driven approach to
multidisciplinary collaborative simulation for virtual product development.”
Advanced Engineering Informatics, Vol. 24, pp. 167–179.

Chapter 4: Application of DS Methodology Victor Gane
103
Chapter 4: Application of Design Scenarios methodology to
evaluate the effectiveness of transparent parametric CAD
Victor Gane, John Haymaker, Martin Fischer, Vladimir Bazjanac
1 Abstract Quality designs generally emerge from a conceptual design process that generates and
communicates large design spaces of objectives, alternatives, impacts, and values.
Parametric modeling is a popular means for generating large alternative spaces but it is
difficult to use effectively when the other spaces are not well generated. We apply the
framework for measuring design space clarity and quality (Gane et. al, 2011) to
traditional non-parametric practice, and to two industry applications of parametric
modeling on high-rise projects. The framework reveals deficiencies in both the quality
and clarity of the design spaces that building designers are able to construct. We
describe a third industry test case illustrating the application of a formal methodology
called Design Scenarios developed to address these shortcomings. The data sets
illustrate the potential for significant impact that parametric modeling can have on the
overall conceptual design process performance, particularly when supported by
methodologies to better generate and communicate design spaces.
2 Introduction – the need for effective conceptual design processes Last decade has witnessed increased awareness about the negative impact buildings
have on the environment. In the U.S. over 70% of the electricity, 40% of raw
materials, and 12% of water consumption is attributed to buildings (USGBC, 2007).
The situation is not improving – the lifecycle performance of many new buildings is
below that of older buildings and often below code requirements (Turner and Frankel,
2008). While design costs (5-8%) are typically dwarfed by construction costs (60-
80%) (Miller, 1993), the biggest impact and opportunities for lifecycle performance
improvement are with decisions made during conceptual design, when the building’s

Chapter 4: Application of DS Methodology Victor Gane
104
orientation, massing, materials, components, and systems and their properties are
proposed (Ellis and Torcellini, 2008).
Quality designs generally emerge from a conceptual design process that generates and
communicates large design spaces of objectives, alternatives, impacts, and values.
Design requires the integration of knowledge and the simultaneous satisfaction of
many functional requirements (Suh, 1995, Kraft et.al. 2007). Research shows that
successful designs require an early understanding of such requirements and the ability
to explore and analyze a large quantity of alternatives (Houser and Clausing, 1988,
Kelley, 2006). To make the design space more manageable, designers normally adopt
a scenario – a collection of structures and behaviors that represent the design intent
(Baniassad and Clarke, 2004). Research identifies two primary search methods
through a design space: high breadth, low depth (multiple scenarios with a broad
spread of options but little analysis) and high depth, low breadth (few scenarios with a
low spread of options but more comprehensive analysis) (Woodbury and Burrow,
2006, Goldschmidt, 2006). Design theory indicates that ideally, during the design
process, lots of scenarios and alternatives within each scenario are generated and
analyzed.
In spite of this increased awareness about the impacts of buildings, the importance of
conceptual design, and areas for improving the design process, current
multidisciplinary design processes have not changed dramatically. Gane and
Haymaker (2010) determined that existing conceptual design processes are inefficient.
We conducted a benchmarking survey to determine the performance of leading design
teams. We found that during a design process that generally lasts 5 weeks a
multidisciplinary team averaging 12 people can normally produce small alternative
spaces, in which on average 3 design alternatives are generated. Very little of their
time is dedicated to establishing / understanding the objective, impact, and value
spaces. The performed analyses are inconsistent and primarily governed by
architectural rather than multi-stakeholder criteria (i.e., day lighting, energy
efficiency), which may often lead to major and costly redesigns when results fail to
satisfy such requirements (Royce, 1970). Decisions are made and changed frequently
Chapter 4: Application of DS Methodology Victor Gane
105
as specifications change and new ideas come forward, yet much of the decision
making rationale is lost in the due process, or presented to the client as descriptive
narratives, in which important inter-related topics are difficult to identify and
comprehend (Kam, 2005). These process deficiencies lead to design solutions with
often poor initial cost and lifecycle performance.
Such methods as performance-based concurrent engineering (Miller, 1993), Quality
Function Deployment (Houser and Clausing, 1988), or parametric modeling (Shah and
Mäntylä, 1995), which emerged in aerospace and automotive industries, can help
design stakeholders formally create and explore large design spaces. However, these
methods are not used broadly in conceptual Architecture Engineering Construction
(AEC) design. In part this is caused by a sequential process of decision making in
multidisciplinary design teams and the limited ability of CAD experts to capture the
designers’ rationale, identify key design parameters, and communicate and manage the
complex structure of parametric models. This makes the design process dependent on
few experts and the expert knowledge hard to disseminate. To maximize the efficiency
of the conceptual design process and improve the life-cycle performance of the
resulting designs, our intuition is that AEC industry needs (see motivations in Gane et.
al., 2011) a significantly more structured and concurrent process of constructing and
communicating:
(1) Objective spaces – capture, prioritize, communicate, and manage design
requirements (constraints and goals);
(2) Alternative spaces – translate such requirements into geometrically flexible
parametric CAD models used to generate design alternatives;
(3) Impact spaces – evaluate performance of alternatives against the project
requirements and
(4) Value spaces – determine the value of alternatives to support improved
decision making.

Chapter 4: Application of DS Methodology Victor Gane
106
Gane et. al., (2011) reviewed other research and found many points of departure, but
no integrated solution that sufficiently covered all four spaces. Some methodologies,
like Requirements Engineering (REF) and MACDADI (Haymaker et. al., 2011),
communicate objective, impact, and value, spaces, but do not communicate alternative
spaces sufficiently. Other methodologies, like parametric modeling, excel at
generating alternative spaces, but fail to communicate these spaces and relate them to
objectives and impacts. Gane et. al., (2011) proposed Design Scenarios to enable
multi-stakeholder and multidisciplinary design teams to streamline the alternative
generation and decision-making processes by providing a methodology for building
and managing requirements driven design spaces with parametric tools. DS consists of
four consecutively built interdependent models: (1) a Requirements Model that allows
stakeholders and designers to explicitly define and prioritize context specific design
requirements; (2) a Scenarios Model that helps designers formally transform these
requirements into actions necessary to achieve them, and the into geometric and
material parameters, interrelationships, and potential conflicts; (3) a Parametric
Process Model that helps CAD experts communicate the structure of a parametric
model for building requirements-driven alternative spaces and facilitate its technical
implementation; and (4) an Alternative Analysis Model that helps designers to analyze
and visually report performance back to the stakeholders.
To enable gauging the impact of such a process, Gane et. al. (2011) proposed a
framework for measuring design space clarity and quality, which consists of the
following metrics:
Objective Space Size – what is the number of project goals and constraints
considered?
Objective Space Clarity – is the value function explicitly and broadly
communicated? The clarity is determined through documented statements
describing stakeholders, goals, constraints, and preferences.
Objective Space Quality – are the project goals and constraints determined by all
key stakeholders? A low quality denotes participation of <50% of stakeholders;
medium quality: 50-80%; high quality: 80-100%.

Chapter 4: Application of DS Methodology Victor Gane
107
Number of Scenarios – what is the number of design scenarios considered? A
design scenario is a collection of structures and behaviors that represent the design
intent (Baniassad & Clarke, 2004).
Total Options Space Size – what is the total number of options comprising a
scenario? The total number is determined by multiplying the constrained range of
values of input parameters (i.e., building length between 30m and 40m) and their
reasonable increment (i.e., 1m for building length).
Generated Option Space Size – what is the number of the generated design
options for a scenario?
Options Space Quality – the ratio of Total Options Space Size to Generated
Options Space Size. A 1.0 ratio is ideal because it covers the complete Design
Space for a given scenario.
Alternative Space Size – what is the number of the generated design alternatives
for a scenario?
Alternative Space Clarity – are the design scenarios and the parameters
describing these scenarios clear?
CAD Model Clarity – is the structure of the CAD model communicated?
CAD Model Quality – how many CAD models were generated for each design
scenario? One CAD model is the target and denotes high quality and
responsiveness. A new model is built when it cannot satisfy a requirement.
Impact Space Size – what is the number of performed analyses used to determine
the value of each alternative?
Impact Space Clarity – is the process of performing each analysis explicitly
depicted (i.e., repeatable)?
Impact Space Quality – what is the ratio of Impact Space Size to Objective Space
Size? A 1.0 ratio is ideal (i.e., for each requirement a formal analysis was
performed).
Value Space Size – what is the number of alternatives that have been analyzed
and valued?

Chapter 4: Application of DS Methodology Victor Gane
108
Value Space Clarity – is the total value of each generated alternative explicitly
defined?
Process Duration – how long did the conceptual design process last? Designers
favor shorter durations because it positively impacts the firm’s profitability.
In the remainder of the paper we populate this framework with four data sets,
summarized at the end in table 8. Gane & Haymaker (2010) described and quantified
traditional high-rise conceptual design processes in which no parametric modeling or
methodology addressing the needs outlined in section 1 were used, and these data are
used to populate the first column in table 8. In section 2 we describe two industry
applications of parametric modeling on high-rise projects, in which no formal
methodology to address the above needs was used. The framework reveals
deficiencies in both the quality and clarity of the design spaces that designers are able
to construct. In section 3 we describe a final industry test case illustrating the
application of a formal methodology called “Design Scenarios” developed to address
these shortcomings. In section 4 we compare the four data sets to illustrate the
potential for significant impact that parametric modeling, supported by methodologies
to better generate and communicate design spaces, can have on the design space
quality and clarity. We used the action research method (Hartmann et. al., 2008) on
the three test cases designed by the same leading AE firm, in which the first author of
this paper had the role of the parametric CAD expert.
3 Conceptual design process using parametric modeling with no
formal implementation method We now discuss two conceptual design process case studies, called Tower 1 and
Tower 2, in which designers used parametric modeling in alternative generation and
decision-making.
3.1 Tower 1 test case
Tower 1 is a residential high-rise currently being built in the Dubai Marina. The
analysis in this paper is based on the conceptual design process only. Table 4-1
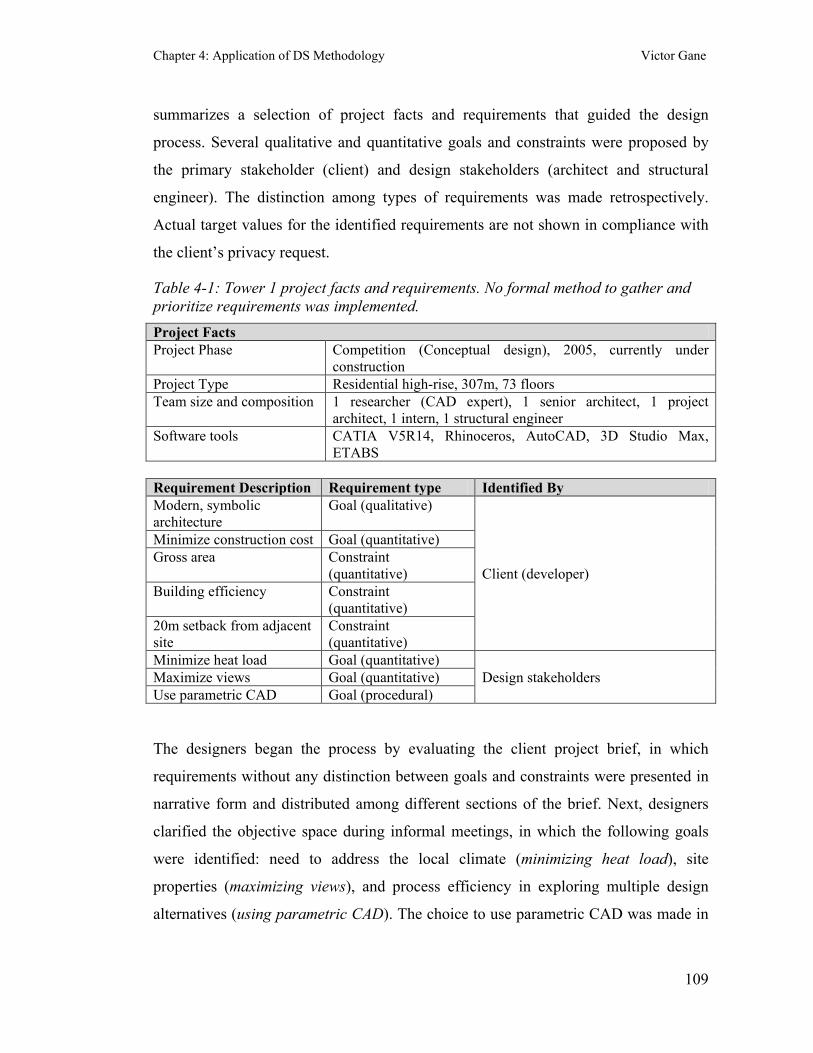
Chapter 4: Application of DS Methodology Victor Gane
109
summarizes a selection of project facts and requirements that guided the design
process. Several qualitative and quantitative goals and constraints were proposed by
the primary stakeholder (client) and design stakeholders (architect and structural
engineer). The distinction among types of requirements was made retrospectively.
Actual target values for the identified requirements are not shown in compliance with
the client’s privacy request.
Table 4-1: Tower 1 project facts and requirements. No formal method to gather and prioritize requirements was implemented. Project Facts Project Phase Competition (Conceptual design), 2005, currently under
construction Project Type Residential high-rise, 307m, 73 floors Team size and composition 1 researcher (CAD expert), 1 senior architect, 1 project
architect, 1 intern, 1 structural engineer Software tools CATIA V5R14, Rhinoceros, AutoCAD, 3D Studio Max,
ETABS Requirement Description Requirement type Identified By Modern, symbolic architecture
Goal (qualitative)
Client (developer)
Minimize construction cost Goal (quantitative) Gross area Constraint
(quantitative) Building efficiency Constraint
(quantitative) 20m setback from adjacent site
Constraint (quantitative)
Minimize heat load Goal (quantitative) Design stakeholders Maximize views Goal (quantitative)
Use parametric CAD Goal (procedural)
The designers began the process by evaluating the client project brief, in which
requirements without any distinction between goals and constraints were presented in
narrative form and distributed among different sections of the brief. Next, designers
clarified the objective space during informal meetings, in which the following goals
were identified: need to address the local climate (minimizing heat load), site
properties (maximizing views), and process efficiency in exploring multiple design
alternatives (using parametric CAD). The choice to use parametric CAD was made in

Chapter 4: Application of DS Methodology Victor Gane
110
response to the client’s objective to build a contemporary, unique building
exemplifying the technological complexity of the 21st century (modern, symbolic
architecture), but governed by simple rules that supported rationalization for effective
construction and modularization for reducing costs. None of the requirements or the
rationale used by designers to propose the requirements was explicitly captured.
Figure 4-1 illustrates the project site. The building’s irregular footprint configuration
was determined by the site’s irregular shape and the 20m setback constraint from the
adjacent site, as well as the gross area constraint.
Figure 4-1: Tower 1 site configuration, initial tower/podium footprint, and the
required 20m setback.
The architect then proposed a design scenario of a twisting tower that helped delineate
the design space boundaries. The scenario was proposed because the narrow sides of
the footprint faced the best views (i.e., ocean and city as opposed to adjacent
buildings). To address the maximizing views goal, the design was twisted to expose the
wide sides in the tower’s top third, where the most expensive units were located, to the
best views. The CAD expert identified a set of key geometric parameters and
relationships in the CAD model that could enable generating the scenario-specific
range of geometric variations. For example, the architect anticipated needing to refine
the building twist and footprint configuration, and identified such parameters as tower
rotation ranging from 0 to 90 degrees, angle controlling the kink, and the individual
side lengths. The CAD expert decomposed the model into components containing
geometric elements, parameters, and constraints. The model decomposition was
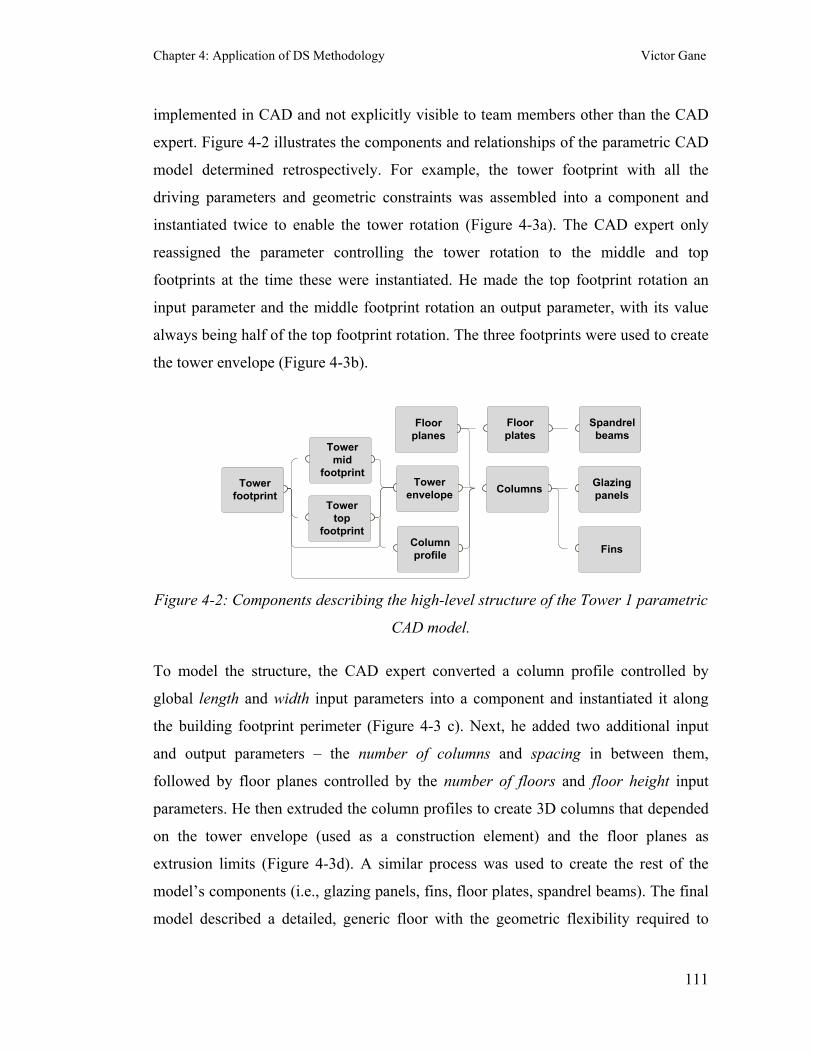
Chapter 4: Application of DS Methodology Victor Gane
111
implemented in CAD and not explicitly visible to team members other than the CAD
expert. Figure 4-2 illustrates the components and relationships of the parametric CAD
model determined retrospectively. For example, the tower footprint with all the
driving parameters and geometric constraints was assembled into a component and
instantiated twice to enable the tower rotation (Figure 4-3a). The CAD expert only
reassigned the parameter controlling the tower rotation to the middle and top
footprints at the time these were instantiated. He made the top footprint rotation an
input parameter and the middle footprint rotation an output parameter, with its value
always being half of the top footprint rotation. The three footprints were used to create
the tower envelope (Figure 4-3b).
Figure 4-2: Components describing the high-level structure of the Tower 1 parametric
CAD model.
To model the structure, the CAD expert converted a column profile controlled by
global length and width input parameters into a component and instantiated it along
the building footprint perimeter (Figure 4-3 c). Next, he added two additional input
and output parameters – the number of columns and spacing in between them,
followed by floor planes controlled by the number of floors and floor height input
parameters. He then extruded the column profiles to create 3D columns that depended
on the tower envelope (used as a construction element) and the floor planes as
extrusion limits (Figure 4-3d). A similar process was used to create the rest of the
model’s components (i.e., glazing panels, fins, floor plates, spandrel beams). The final
model described a detailed, generic floor with the geometric flexibility required to
Tower footprint
Tower mid
footprint
Tower top
footprint
Tower envelope Columns
Floor planes
Glazing panels
Fins
Floor plates
Spandrel beams
Columnprofile

Chapter 4: Application of DS Methodology Victor Gane
112
generate and assemble the three floor types with unique heights – typical residential,
penthouse, and mechanical (Figure 4-3e).
a) b) c)
d) e)
Figure 4-3: Tower 1 parametric model: a) the tower footprint (plan view) instantiated
twice with input parameters controlling the tower rotation; b) tower envelope
(perspective view) lofted from the three footprints; c) small section of the footprint
with a column component and the driving parameters (perspective view); d) columns
extruded along the footprint (perspective view); e) final model of a single floor used to
create ~1,000 design options (perspective view).
By updating the values of building side length and floor height parameters, the design
stakeholders were able to investigate which alternatives satisfied the gross area and
tower efficiency constraints, both established as output parameters in the CAD model.
To address the minimizing the construction cost goal, designers altered the input
parameter values determining the spandrel beam depth and column length & width.
Structural Engineers formally analyzed in ETABS the resulting design alternatives to
determine structural viability and cost. As a result, the structural design evolved from
the initial columns with double curvature to columns with single curvature, which

Chapter 4: Application of DS Methodology Victor Gane
113
dramatically reduced the cost but maintained the original architectural design intent
(Figure 4-4). The final solution required amending the CAD model by adding a
stepped extension to allow the rebar connections between columns. Output parameters
calculating the surface area of components such as glass and cladding, and the volume
of components such as columns and spandrel beams, were used to dynamically
calculate rudimentary cost estimates.
a) b) c)
Figure 4-4: The team investigated three structural alternatives using the same
parametric CAD model. a) originally proposed solution with expensive double
curvature; b) intermediate solution with single curvature but with architecturally
unappealing columns; c) final solution with single curvature stepping columns, in
which fins cover the step from top to bottom column. Column and fin sizes were varied
to minimize the heat load. The glazing offset from exterior wall was adjusted to satisfy
the gross area & efficiency constraints.
To address the minimize heat load goal designers iterated the values of parameters
determining the window setback in relation to the building’s exterior face, as well as
the column size, which controlled the fin size. The objective was to minimize the
glazed surface area impacted by direct sunlight. The actions taken to address this goal
were carefully coordinated with the gross area and efficiency constraints.
The CAD model was operated through 13 input parameters illustrated in Table 4-2 and
used to generate 15 alternatives (Figure 4-5). The model enabled the research team to
determine the Total Option Space Size metric for the scenario-specific design space by
multiplying the total number of steps for the input parameters by the input parameters’
increment (see Table 4-8).

Chapter 4: Application of DS Methodology Victor Gane
114
Table 4-2: Input parameters and constrained ranges. Input parameter
name Constrained range Parameter
increment Total steps
Core diameter 13-15m 1m 3 Circulation corridor
diameter 17-18m 1m 2
Tower width 30-40m 1m 11 Tower length 20-30m 1m 11
Tower rotation 45-90deg 1deg 46 Building side angle 150-170deg 1deg 21
Tower height 300-330m 1m 31 Column spacing 3.0-3.6m 0.5m 14 Column length 0.5-1.0m 0.1m 6 Column width 0.5-0.9m 0.1m 5 Floor height 3.6-4.5m 1m 9 Slab depth 0.2-0.3m 0.1m 2
Spandrel beam depth 0.5-0.9m 0.1m 5
a) b) c)
Figure 4-5: Multiple Tower 1 alternative twist values were parametrically
investigated during the design process. a) 60 degree twist; b) 90 degree twist; c) final
design featuring a 90 degree twist and smaller glazing setback.
3.2 Tower 2 test case
Tower 2 was a high-rise competition in San Francisco. Table 4-3 summarizes a
selection of project facts and requirements that guided the design process. Two types
of requirements were considered: qualitative constrains proposed by the primary
stakeholder (client), and one procedural goal by the design stakeholders (architect and
structural engineer).

Chapter 4: Application of DS Methodology Victor Gane
115
Table 4-3: Selection of Tower 2 project facts and design requirements Project Facts Project Phase Competition (Conceptual design), 2007 Project Type Multiuse high-rise (office, hotel, residential), 1375ft
Team size and composition 1 researcher (CAD expert), 2 senior architects, 3 mid-level architects, 2 senior structural engineers, 1 structural engineer, 2 mechanical engineers
Software tools DigitalProjectV1R2, Rhinoceros, AutoCAD, 3D Studio Max, ETABS, Ecotect, Flovent, Virtual Wind
Requirement Description Requirement type Identified By Office gross area Constraint
(quantitative)
Client (developer)
Office 1st floor gross area Constraint (quantitative)
Office last floor gross area Constraint (quantitative)
Hotel gross area Constraint (quantitative)
Use parametric CAD Goal (procedural) Design Stakeholders
The design process started with a poorly defined objective space containing only a
limited set of constraints proposed by the client. The design stakeholders did not
explicitly delineate any design scenarios they were interested in exploring but rather
pursued the conventional practice of gradual, informal clarification of the design
intent.
Designers generated a total of 20 alternatives from six different parametric models.
Figure 4-6 shows a selection of seven alternatives generated with four of the six
models. For each model, the CAD expert required one week to understand the senior
architect’s emerging scenario and translate it into a CAD model through a technical
process similar to the one described in Tower 1 case. The major distinction, however,
was in how design stakeholders and CAD experts interacted. The senior architect
occasionally reviewed the in-progress CAD model generated by the CAD expert, who
was not clear of the design scenario, and made improvised suggestions. For example,
the CAD expert built the first model based on a design precedent that the senior
architect developed for another project and adapted it to address the client constraints
(Figure 4-6a). However, it was soon determined that the resulting aspect ratio of 1:10

Chapter 4: Application of DS Methodology Victor Gane
116
and the lease span on multiple floors were unacceptable. A relatively quick check
could have helped invalidate this segment of the design space had these requirements
been explicitly defined early on. As a result, the senior architect decided to investigate
a geometrically and structurally different scenario (Figure 4-6b). This invalidated the
original CAD model, which given its geometric and relational complexity took
significant time to build. A similar process was repeated on all consecutive models.
This lack of procedural rigor dramatically reduced the effectiveness of parametric
CAD tools in a conceptual design process that lasted longer than average (see Table
4-8).
a) b) c) d)
Figure 4-6 (a – d): 7 alternatives from over 1,000 generated options. The lack of a
formal methodology for defining and translating design requirements into parametric
models led to the construction of six unique models to generate 20 alternatives.
The CAD expert operated the CAD model in Figure 4-6a through 9 input parameters
and ranges illustrated in Table 4-4: Input parameters and constrained ranges
describing the model in Figure 4-6a, which enabled the research team to determine the
Total Option Space Size metric. Table 4-8 summarizes the third data set describing the
resulting conceptual design process performance.

Chapter 4: Application of DS Methodology Victor Gane
117
Table 4-4: Input parameters and constrained ranges describing the model in Figure 4-6a.
Input parameter name Constrained range
Parameter increment
Total steps
Bot. triangle base length 170-190ft 1ft 21 Bot. triangle side length 160-170ft 1ft 11 Top triangle side length 90-100ft 1ft 11 Bottom triangle chamfer 20-30ft 1ft 11
Chamfer angle 60-90deg 1deg 31 Bottom centroid offset – origin 50-65ft 1ft 16
Top centroid offset – origin 50-60ft 1ft 11 Office floor height 13-15ft 1ft 3
Residential floor height 10-12ft 1ft 3
3.3 Summary
In summary, both test cases illustrated an effectively new conceptual design process in
which with parametric CAD design teams build systems for developing large design
spaces rather than point solutions. However, neither case represents a methodology
that would enable designers to optimize or repeat the process. The designers had no
formal method to capture, manage, and rationalize design requirements into effective
parametric CAD models. They were unable to make the structure and rationale of
those models clear to the entire team, which renders the process they developed hard
to integrate with analysis, and to repeat even within the same firm. For example, as
Tower 1 progressed into the next phase a few months after the concept design
submission, even the CAD expert who built the CAD model required a substantial
time investment to restore his understanding of the model structure and the means to
operate it. The lack of such a method in larger teams leads to significantly poorer
results as was illustrated in the Tower 2 test case. In both cases design stakeholders
finished the conceptual design process without a clear understanding of the potential
value of the alternative space.
Overall, Tower 1 proved more successful. In spite of a demanding schedule, the
design stakeholders effectively addressed the project requirements and delivered a
geometrically complex and architecturally engaging design that mostly addressed
economic requirements (Figure 4-5). In three weeks, a single CAD model was built for
Chapter 4: Application of DS Methodology Victor Gane
118
one scenario and used to investigate nearly 1000 design options refined into 15
alternatives. Designers made this possible by implicitly defining the objective space,
translating requirements into key parameters, and following a scenario that remained
largely unchanged throughout the design process. The success of the project was due
in part to the small team size with few design stakeholders (architect and structural
engineer only, making it an objective space of medium quality), the expertise in using
parametric CAD (one architect built and operated the model), and its diligence in
observing the project requirements with which it started the design process.
Next we discuss the application of Design Scenarios (DS) methodology on a third
high-rise test case. DS was implemented into a web-based software prototype to help
enhance the application of parametric CAD in conceptual design and enable design
stakeholders to generate and communicate clearer and better design spaces. DS
consists of four consecutively built interdependent models. With the Requirements
Model (RM) project stakeholders explicitly define the context specific objective space
and prioritize goals. With the Scenarios Model (SM) design stakeholders build the
logical alternative space by formally transforming the objective space into geometric
and material parameters, establishing parameter interrelationships and identifying
potential conflicts. With the Parametric Process Model (PPM) CAD experts build the
geometric alternative space by illustrating the technical implementation of a SM in a
parametric model used to generate design alternatives. With the Alternative Analysis
Model (AAM) design stakeholders analyze alternatives to determine the impact and
value spaces.
4 Conceptual design process using Design Scenarios (DS) to clarify
design spaces We tested the impact of Design Scenarios methodology on an industry supported test
case called Tower 3 – a mixed use project in Jeddah, Saudi Arabia consisting of two
towers – an all residential (Tower 1) and a mixed use (Tower 2 - hotel and serviced
apartments). The project team developed four scenarios using traditional concept
design methods similar to those described in Gane and Haymaker (2010). The research
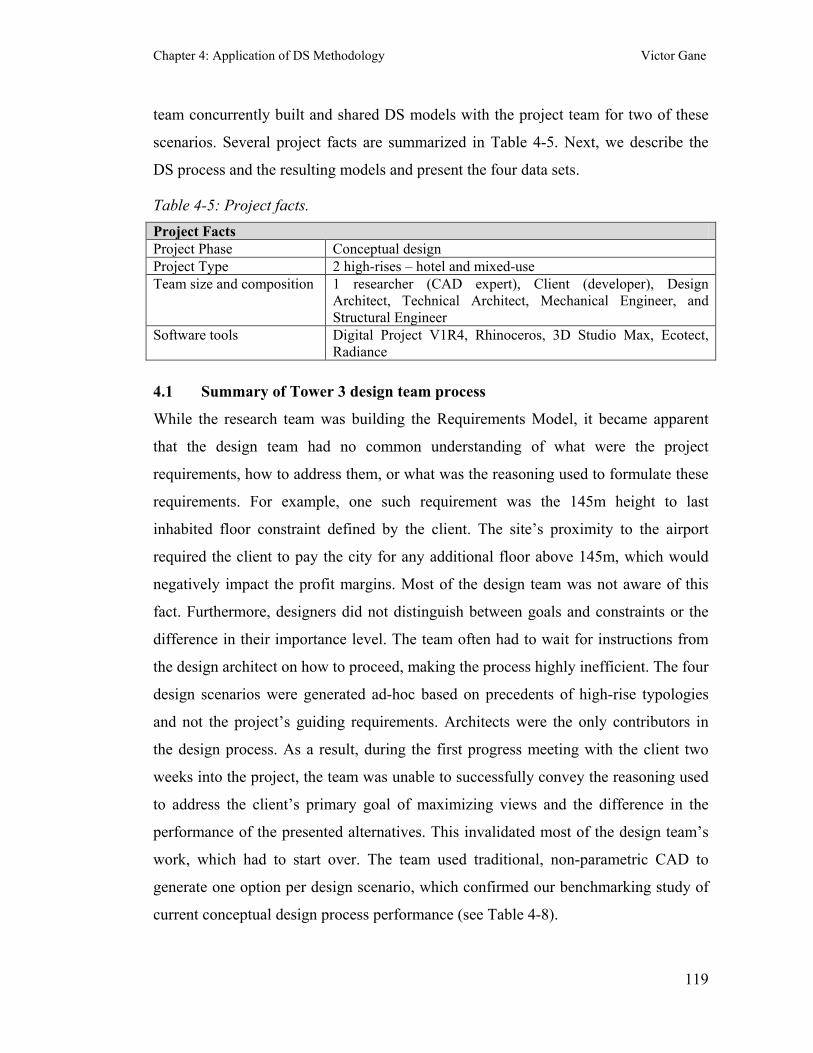
Chapter 4: Application of DS Methodology Victor Gane
119
team concurrently built and shared DS models with the project team for two of these
scenarios. Several project facts are summarized in Table 4-5. Next, we describe the
DS process and the resulting models and present the four data sets.
Table 4-5: Project facts. Project Facts Project Phase Conceptual design Project Type 2 high-rises – hotel and mixed-use Team size and composition 1 researcher (CAD expert), Client (developer), Design
Architect, Technical Architect, Mechanical Engineer, and Structural Engineer
Software tools Digital Project V1R4, Rhinoceros, 3D Studio Max, Ecotect, Radiance
4.1 Summary of Tower 3 design team process
While the research team was building the Requirements Model, it became apparent
that the design team had no common understanding of what were the project
requirements, how to address them, or what was the reasoning used to formulate these
requirements. For example, one such requirement was the 145m height to last
inhabited floor constraint defined by the client. The site’s proximity to the airport
required the client to pay the city for any additional floor above 145m, which would
negatively impact the profit margins. Most of the design team was not aware of this
fact. Furthermore, designers did not distinguish between goals and constraints or the
difference in their importance level. The team often had to wait for instructions from
the design architect on how to proceed, making the process highly inefficient. The four
design scenarios were generated ad-hoc based on precedents of high-rise typologies
and not the project’s guiding requirements. Architects were the only contributors in
the design process. As a result, during the first progress meeting with the client two
weeks into the project, the team was unable to successfully convey the reasoning used
to address the client’s primary goal of maximizing views and the difference in the
performance of the presented alternatives. This invalidated most of the design team’s
work, which had to start over. The team used traditional, non-parametric CAD to
generate one option per design scenario, which confirmed our benchmarking study of
current conceptual design process performance (see Table 4-8).

Chapter 4: Application of DS Methodology Victor Gane
120
4.2 Requirements Model (RM) The DS process started with project stakeholders clarifying the Objective Space by
building the RM. All five project stakeholders were asked to determine and record
relevant project constraints and goals. First, designers analyzed the contextual
constraints (i.e., site, geographic location, climate) and determined the design
scenarios to be explored.
The test case site is located between the city center and the airport and is irregularly
shaped as a “half teardrop”. The design architect proposed four design scenarios to be
explored – half teardrop to mimic the site configuration, triangular, oval, and tapered.
The research team developed two scenarios in DS (half teardrop and triangular).
Figure 4-7 illustrates the site for the first scenario.
Figure 4-7: Test case “half teardrop” site and the “half teardrop” scenario tower
footprint.
The research team started building the RM by first examining the requirements used
by the project team to commence the design process. The only available formal
resource was a booklet specifying the following three constraints: (1) Gross area for
Tower 1 (55,000 sq m - residential), (2, 3) Gross area for Tower 2 (40,000 sq m –
hotel, 50,000 sq m – serviced apartments). We engaged various members of the
architectural team and identified six additional requirements not formally captured
before - four constraints: (1) Maximum tower height to last inhabited floor – 145m,
(2) Maximum site coverage – 60%, (3) North site setback – 12m, (4) South site setback
- 3m, and two goals: (1) Maximize exposure to water of 100% units, (2) Sleek design.
Unlike the project team, we also engaged the lead Mechanical Engineer to identify
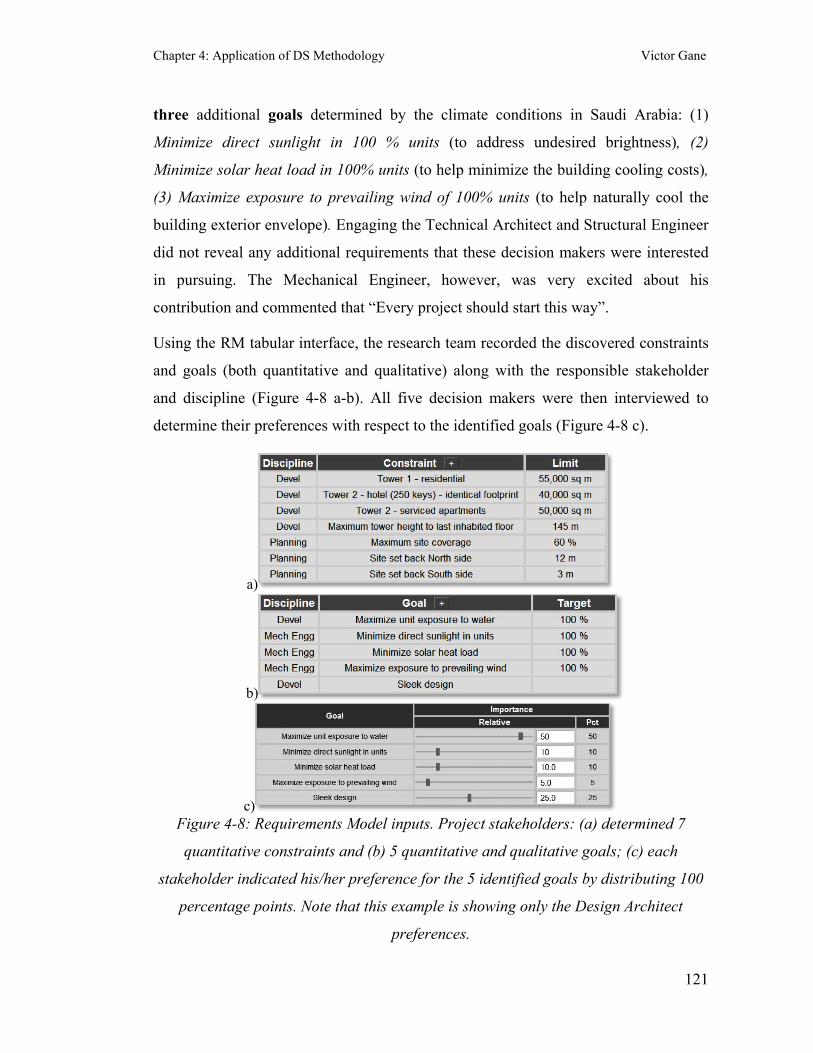
Chapter 4: Application of DS Methodology Victor Gane
121
three additional goals determined by the climate conditions in Saudi Arabia: (1)
Minimize direct sunlight in 100 % units (to address undesired brightness), (2)
Minimize solar heat load in 100% units (to help minimize the building cooling costs),
(3) Maximize exposure to prevailing wind of 100% units (to help naturally cool the
building exterior envelope). Engaging the Technical Architect and Structural Engineer
did not reveal any additional requirements that these decision makers were interested
in pursuing. The Mechanical Engineer, however, was very excited about his
contribution and commented that “Every project should start this way”.
Using the RM tabular interface, the research team recorded the discovered constraints
and goals (both quantitative and qualitative) along with the responsible stakeholder
and discipline (Figure 4-8 a-b). All five decision makers were then interviewed to
determine their preferences with respect to the identified goals (Figure 4-8 c).
a)
b)
c) Figure 4-8: Requirements Model inputs. Project stakeholders: (a) determined 7
quantitative constraints and (b) 5 quantitative and qualitative goals; (c) each
stakeholder indicated his/her preference for the 5 identified goals by distributing 100
percentage points. Note that this example is showing only the Design Architect
preferences.

Chapter 4: Application of DS Methodology Victor Gane
122
Figure 4-9 illustrates the system generated goal importance graph, in which
stakeholder preferences were normalized to 100 points. The graph enabled the
research team to understand individual preferences, as well as the overall relative
importance of each goal. Maximizing unit exposure to water emerged as the leading
goal with 46% out of 100 of overall preferences, while maximizing exposure to
prevailing wind became the least important goal with only 7%.
Figure 4-9: Requirements Model outputs - the system generates the goal importance
graph and normalized decision makers’ preferences to 100 points.
Building the RM enabled the research team to determine the Objective Space size of
12 requirements (7 constraints and 5 goals). The process of aggregating stakeholder
requirements, assigning preferences, and building the RM lasted 1 day.
4.3 Scenarios Model (SM)
The SM is a process model built by design stakeholders to explicitly determine the
logical alternative space, in which requirements are decomposed into enabling
parameters and relationships. Constraints and goals determined in the RM are mapped
by the system into the SM, where design stakeholders concurrently decompose
requirements into action items (actionable descriptions of how to achieve
requirements), strategies (decision making process required to achieve an action item),
parameters (variables denoting either geometric or material properties that impact a
design requirement), parameter constraints (fixed value or range of values shown as
lower and upper limit nodes that a parameter might be required to be within), and first
order logic gateways (describe relationships between actions, strategies, and
parameters. AND – all on, OR – at least one on, XOR – at least one on and one off).
The SM ontology was implemented in the software prototype as visual representations
that build on Unified Modeling Language object diagram formalism. The research

Chapter 4: Application of DS Methodology Victor Gane
123
team engaged design stakeholders to explicitly capture the rationale each design
discipline used in addressing individual constraints and goals and determine how these
logically interrelate. The following section depicts this process for one constraint only.
A similar process was used to rationalize the remaining constraints and goals, which
we illustrate in the Appendix section of this paper.
Constraint No. 1 – Tower 1 Gross Area
To enable CAD experts to address this constraint in a parametric CAD model, the
research team (acting as the Design Architect) proposed three action items: “Control
the half teardrop configuration”, “Calculate gross area”, and “Control number of
floors” (Figure 4-10). An “AND” relationship indicates that all three items were
required to be implemented. The research team further clarified the first action item by
proposing three strategies for how to control the building configuration – “Straight
base only”, “Curved sides only”, and “Individually all sides”. Interested in attaining
geometric flexibility, the design architect chose only the third strategy, illustrated
through a “XOR” relationship. The system faded the two strategy nodes that were not
chosen.

Chapter 4: Application of DS Methodology Victor Gane
124
Figure 4-10: “Half teardrop” Scenarios Model for constraint No. 1 – design architect
decomposed the constraint into Action Items, Strategies, Parameters, and Parameter
Constraints and determined how these relate to each other. Faded nodes indicate
strategies considered, but not chosen, to be implemented in the parametric model.
The design architect now had enough information to determine the parameters that
address each action item or Strategy. Given the chosen “half teardrop” design
scenario, researchers identified three key parameters to enable controlling all sides
individually – “Base length”, “Major arc radius”, and “Minor arc radius”. However,
one of the arcs could not be user controlled because of the required geometric
continuity represented by a tangency relationship between the two arcs. The design
architect decided the “Base length” and “Major arc radius” to be input parameters
and the “Minor arc radius” an output parameter. Next, the architect experimentally
through sketches determined constrained ranges beyond which the input parameters
would result in invalid solutions. For example, any value below 45m for minor arc
radius resulted in a footprint that violated the site set back constraints.
Similarly, the design architect identified two parameters that enable “Calculating the
gross area” action item. The “Single floor gross area” output parameter was
calculated by measuring its value in CAD when either of the two footprint input

Chapter 4: Application of DS Methodology Victor Gane
125
parameters were modified. The “Gross area” became a user defined input parameter
that enabled calculating the “Number of floors” output parameter, which addressed
the third and last action item.
SM outputs
Clarifying rationale enabled analysis of that rationale. Figure 4-11 illustrates the
impact of actions on requirements. “Controlling half teardrop configuration”, for
example, is the action with the impact on the most number of requirements. As a
result, when searching through the design space, designers focused on but were not
limited to the following input parameters addressing high impact action items: “Tower
1 base length”, “Tower 1 major arc radius”, “Tower rotation”, and “Unit width”.
Figure 4-11: SM output – Actions impact on requirements graph. ‘Control half
teardrop configuration”, “ Control tower orientation and “Control unit width”
emerged as Action Items that impacted most project requirements.
Building the SM enabled determining the Total Option Space Size metric for the “half
teardrop” scenario. Table 4-6 illustrates the 13 input parameters used to operate the
parametric model (see the complete SM model in the Appendix section for parameter
sources).

Chapter 4: Application of DS Methodology Victor Gane
126
Table 4-6: Input parameters and constrained ranges. Input parameter
name Constrained range Parameter
increment Total steps
base length 80-90m 1m 11 major arc radius 45-60m 1m 16
Unit width 4.2-4.6m 0.1m 5 floor height 3.0-3.6m 0.1m 7
South units view vector
30-50deg 1deg 21
North units view vector
50-60deg 1deg 11
City units view vector 50-60deg 1deg 11 Tower rotation 0-10deg 1deg 11
Frit density 20-50% 10% 4 South wall inclination 1-5deg 1deg 5 East wall inclination 1-5deg 1deg 5 West wall inclination 1-5deg 1deg 5 North wall inclination 1-5deg 1deg 5 The process of aggregating individual stakeholder inputs on how to address
requirements and building the SM for both scenarios lasted 1 man-day.
4.4 Parametric Process Model (PPM)
The PPM is a process model built by CAD experts to explicitly determine the
geometric alternative space, in which the structure of dependencies between
parameters, geometric constraints, CAD operations, and geometry is established.
Parameters identified in the SM are mapped by the system into the PPM and used to
control the CAD model’s geometry. The PPM enables making the CAD model
structure clear and disseminating expert knowledge needed to enhance the application
of parametric CAD in conceptual design. The PPM consists of two levels of
information abstraction implemented as process model nodes in the software prototype
– (1) components, which are information containers describing the component-level
decomposition of the CAD model, and (2) detail-level description of the components’
composition, in which input and output parameters determined in the SM are first
linked to geometric elements (predetermined geometric primitives used to create the
geometric representation of the intended design), then relationships among geometric
elements are established through geometric constraints (e.g., tangency, parallelism),

Chapter 4: Application of DS Methodology Victor Gane
127
and CAD operations (e.g., extrude, join) are used to modify geometric elements in the
direction specified by reference elements (e.g., XY plane).
The CAD expert used the “half teardrop” scenario determined in the SM to first
organize the parametric CAD model structure into 18 components (Figure 4-12). The
graph communicates the hierarchical dependency of components (i.e., any change to
the “Floor Plate” will affect the “Slabs” component) and the CAD model
construction sequence (i.e., “Slabs” can be built only after the “Floor Plate” was
built). Unlike the process of building traditional, static CAD models, such distinction
is critical when building parametric models.
Figure 4-12: Component-level PPM showing the parametric model structured into 18
components.
Figure 4-13 a & b illustrate the detail-level description of the “Floor Plate”
component only and its graphical preview. The CAD expert used the “XY Plane” as
the reference needed to determine the orientation in space of the “Ground Floor
Sketch”, composed of “Line.01”, which defines the tower straight base, “Major Arc”,
and “Minor Arc” defining the curved sides of the tower. He used three input and one
output parameters mapped by the system from the SM to geometrically control the
footprint. For example, “Tower 1 base length” controlled the length of “Line.01”, etc.
“Line.02” was a horizontally constrained construction element used only as a
reference when rotating the tower footprint. The “Tower rotation” input parameter
defined the angle between “Line.01” and “Line.02”. The CAD expert tangentially
constrained the “Major Arc” and “Minor Arc” at the overlapping vertices. He

Chapter 4: Application of DS Methodology Victor Gane
128
extracted the value of “Tower 1 minor arc radius” output parameter by measuring the
radius of the “Minor Arc”, which updated each time the “Major Arc” radius value
was changed. He coincidentally inter-constrained the vertices of “Line.01”, “Major
Arc” and “Minor Arc” to enable applying parametric adjustments globally (without
these constraints, changing the “Tower rotation” value will reposition only
“Line.01”).
a) b)
Figure 4-13: a) Detail-level PPM for the “half teardrop” scenario showing the
composition of the “Floor Plate” component; b) Test case tower floor plate preview.
The CAD expert used a similar method to construct the remaining 16 components not
shown in this paper. Note that component 1 represented the imported 2D geometry of
the project site. The complete PPM can be accessed online by contacting the authors.
The process of building the PPM for both scenarios lasted 2 man days.
Parametric CAD model
The PPM specifies the structure of the parametric CAD model built by the CAD
expert and used to explore the design space. Table 4-7 illustrates a selection of 10
alternatives that satisfied the project constraints from ~1100 generated options, and the
key input parameter values used to generate these. A total of 13 input parameters were

Chapter 4: Application of DS Methodology Victor Gane
129
modified during the option generation process (4 main parameters only are shown
below).
Table 4-7: 10 design alternatives and a selection of input parameters used to generate each alternative.
The CAD model building process for both scenarios lasted 3 man days, while the
generation of design options and alternatives lasted 2 days.
4.5 Alternatives Analysis Model (AAM)
The AAM is a tabular model that provides design stakeholders with the framework to
determine and understand the scenario’s Impact and Value Spaces. It is a tool to
compare the quantitative and qualitative analyses of design alternatives and determine
their relative value to enable an objective decision making process. Building the AAM
requires design stakeholders to evaluate how each design alternative ranks in relation
to the goals identified in the Requirements Model. A simple scoring system was
designed for this purpose. A design alternative receives 100% score for a given
requirement if it meets its target value, which serves as a benchmark for determining
the score when the target value is not met or is exceeded.
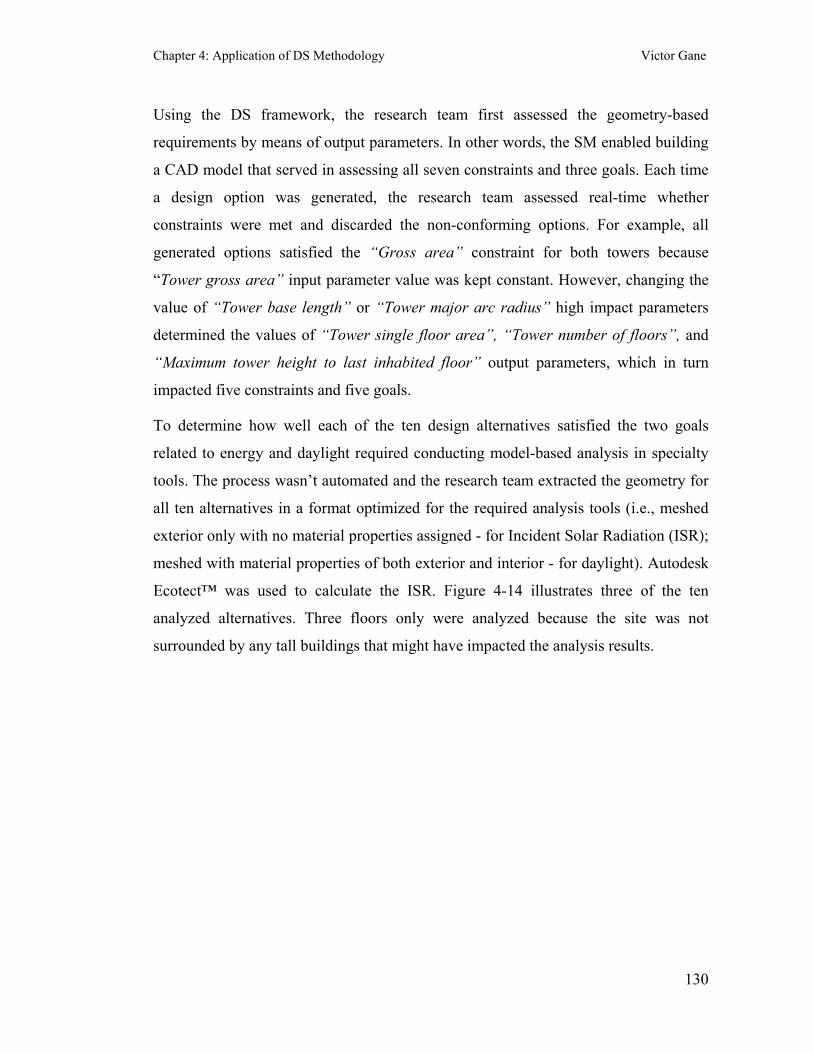
Chapter 4: Application of DS Methodology Victor Gane
130
Using the DS framework, the research team first assessed the geometry-based
requirements by means of output parameters. In other words, the SM enabled building
a CAD model that served in assessing all seven constraints and three goals. Each time
a design option was generated, the research team assessed real-time whether
constraints were met and discarded the non-conforming options. For example, all
generated options satisfied the “Gross area” constraint for both towers because
“Tower gross area” input parameter value was kept constant. However, changing the
value of “Tower base length” or “Tower major arc radius” high impact parameters
determined the values of “Tower single floor area”, “Tower number of floors”, and
“Maximum tower height to last inhabited floor” output parameters, which in turn
impacted five constraints and five goals.
To determine how well each of the ten design alternatives satisfied the two goals
related to energy and daylight required conducting model-based analysis in specialty
tools. The process wasn’t automated and the research team extracted the geometry for
all ten alternatives in a format optimized for the required analysis tools (i.e., meshed
exterior only with no material properties assigned - for Incident Solar Radiation (ISR);
meshed with material properties of both exterior and interior - for daylight). Autodesk
Ecotect™ was used to calculate the ISR. Figure 4-14 illustrates three of the ten
analyzed alternatives. Three floors only were analyzed because the site was not
surrounded by any tall buildings that might have impacted the analysis results.

Chapter 4: Application of DS Methodology Victor Gane
131
a) b)
c) Figure 4-14: ISR analysis false color map (blue indicates less radiation, red – more);
a) Alternative 1 – Worst (197,090 Wh/m2); b) Alternative 7 – Best (107,143 Wh/m2);
c) Alternative 10 – surprising outcome (168,436 Wh/m2).
The goal of ISR analysis was to determine which alternative accumulated the smallest
amount of direct solar radiation annually from 8am to 6pm – one of the most
important goals of the project. Alternative 7 emerged as the best, given its floor plate
configuration, orientation, floor height (h), slab offset from exterior glazing (d), and
the balcony exterior face inclination (α) (Figure 4-15). The cumulative value in Wh/m2
was calculated from individual data points of the analysis mesh. Alternative 10 was
expected to be the worst performer given the vertical balcony exterior face and the
slab flushed with exterior glazing. However, a 0.1m reduction in the floor height was
significant enough to make Alternative 10 perform better than Alternative 1.
Figure 4-15: Key parameters affecting the amount of direct solar radiation
accumulated by the tower’s exterior.
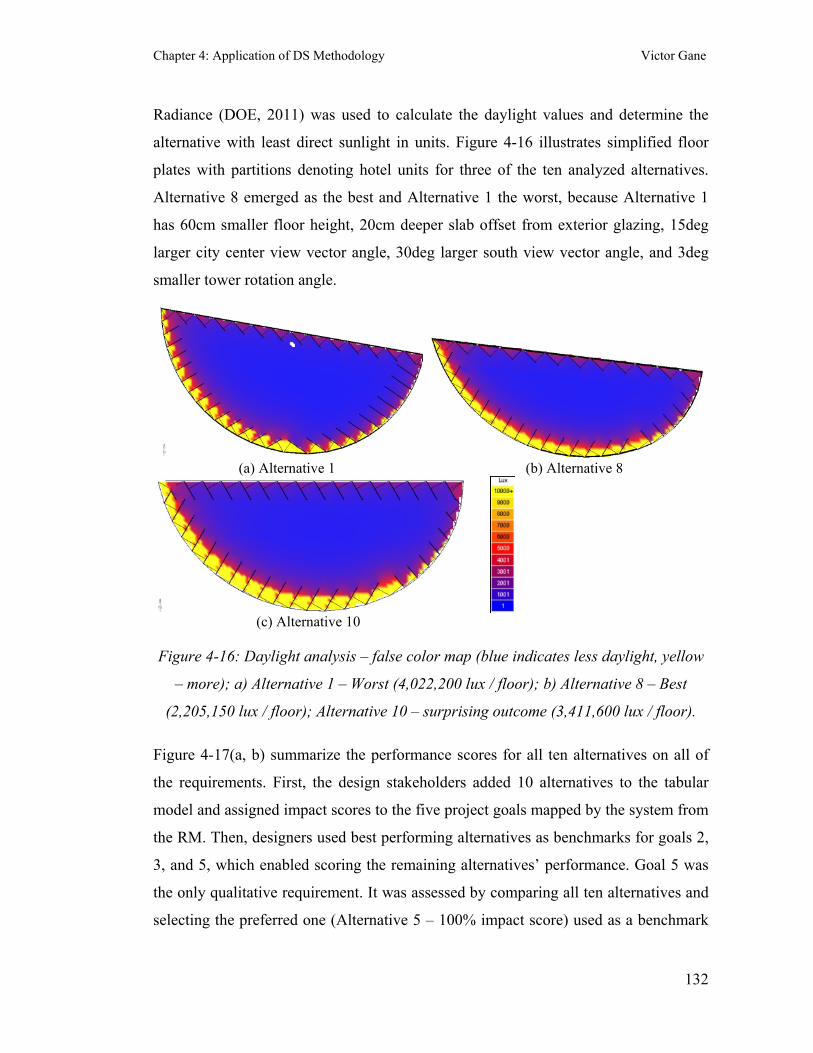
Chapter 4: Application of DS Methodology Victor Gane
132
Radiance (DOE, 2011) was used to calculate the daylight values and determine the
alternative with least direct sunlight in units. Figure 4-16 illustrates simplified floor
plates with partitions denoting hotel units for three of the ten analyzed alternatives.
Alternative 8 emerged as the best and Alternative 1 the worst, because Alternative 1
has 60cm smaller floor height, 20cm deeper slab offset from exterior glazing, 15deg
larger city center view vector angle, 30deg larger south view vector angle, and 3deg
smaller tower rotation angle.
(a) Alternative 1 (b) Alternative 8
(c) Alternative 10
Figure 4-16: Daylight analysis – false color map (blue indicates less daylight, yellow
– more); a) Alternative 1 – Worst (4,022,200 lux / floor); b) Alternative 8 – Best
(2,205,150 lux / floor); Alternative 10 – surprising outcome (3,411,600 lux / floor).
Figure 4-17(a, b) summarize the performance scores for all ten alternatives on all of
the requirements. First, the design stakeholders added 10 alternatives to the tabular
model and assigned impact scores to the five project goals mapped by the system from
the RM. Then, designers used best performing alternatives as benchmarks for goals 2,
3, and 5, which enabled scoring the remaining alternatives’ performance. Goal 5 was
the only qualitative requirement. It was assessed by comparing all ten alternatives and
selecting the preferred one (Alternative 5 – 100% impact score) used as a benchmark

Chapter 4: Application of DS Methodology Victor Gane
133
against which others were compared. The evaluation was based on such criteria as
overall proportions (i.e., building length vs. height, crown height vs. inhabited section
height), and tactile quality of the exterior envelope (i.e., slab depth and inclination of
balcony exterior face) – a subjective assessment by a human designer.
a)
b)
Figure 4-17: AAM “half teardrop” design scenario; a) impact scores for 10 design
alternatives and 5 goals; b) system generated value scores – overall, Alternative 7
emerged as the most successful.
After all the impact scores were assigned, the system generated the Alternatives’
Value Scores, calculated by multiplying the alternative’s impact score for every goal
by the importance percentage of each goal determined by the project stakeholders in
the RM and summing these into a total value score. For example, Alternative 1
received a 68% impact score for “Maximizing unit exposure to water” goal. Its
relative value score was 31.3 (68*46%=31.3).
A similar process was used to generate ten design alternatives for the “triangular”
design scenario and determine the total value sores of each alternative. Figure 4-18
illustrates one of the ten alternatives, and Figure 4-19 summarizes the value scores.

Chapter 4: Application of DS Methodology Victor Gane
134
Figure 4-18: Alternative 1 of “Triangular” design scenario.
Figure 4-19: AAM “Triangular” design scenario; System generated value scores –
overall, Alternative 8 emerged as most successful.
5 Conclusions and future opportunities This paper presented three industry test cases, in which parametric modeling was used
to search through large design spaces. Tower 1 and 2 cases employed parametric
modeling without any formal method of eliciting requirements, translating
requirements into input and output parameters, and determining the value of the
generated design alternatives. Tower 3 case illustrated the application of a formal
method called Design Scenarios. Table 4-8 compares the three new data sets with the
earlier benchmarked current practice.
Design theory has extensively looked into the design space exploration topic.
Woodbury and Burrow (2006) distinguish three main areas of research, all of which
were in part or fully addressed in the presented test cases: (1) the premise that

Chapter 4: Application of DS Methodology Victor Gane
135
exploration is a good model for designer action; (2) strategies and tools that amplify
designer action in exploration; (3) development of computational structures to support
exploration and represent the design space. Conceptual design offers most
opportunities for design space exploration (Barrie and Paulson, 1991). Akin (2001)
defines conceptual design in terms of several process steps: (a) identify requirements;
(b) prioritize requirements; (c) develop preliminary solutions; (d) evaluate solutions.
Test cases 1 and 2 illustrated that process steps (a), (b), and (d) are not consistently
implemented and clearly communicated in current practice. The data sets, however,
indicate a substantial improvement in the Option Space and Alternative Space size
over current practice. The Impact Space Quality metric for both cases is lower than in
current practice. It is essential, however, to view this metric in conjunction with
Objective Space Quality, which in current practice is lowest.
Table 4-8: A comparison of four data sets quantifying conceptual design process performance. Items in bold denote significant improvements over current practice.
Metric Current practice Tower 1 case Tower 2 case Tower 3 case
Objective Space Size 3 8 5 12 Objective Space Clarity no no no yes Objective Space Quality low medium medium high
Number of Scenarios 3 1 6 2 Total Option Space Size unknown 821.8 bil 1.37 bil 430.44 bil
Generated Option Space Size 3 ~900 ~1200 ~1100
Options Space Quality unknown 913.11 mil 1.14 mil 391.31 mil Alternative Space Size 3 15 20 10
Alternative Space Clarity no
partial (scenario only,
parameters retrospectively)
no (parameters determined
retrospectively) yes
CAD Model Clarity no no no yes CAD Model Quality 3 1 6 1
Impact Space Size
3 (area,
aesthetics, efficiency)
4 (area,
efficiency, FEA, cost)
4 (area, FEA, CFD, ISR)
12
Impact Space Clarity no no no partial Impact Space Quality 1 0.5 0.8 1 Value Space Size 0 (no formal 0 (no formal 0 (no formal 10

Chapter 4: Application of DS Methodology Victor Gane
136
valuation valuation valuation Value Space Clarity no no no yes Process Duration 5 weeks 3 weeks 6 weeks 3 weeks The fourth data set, describing the process in which design space was clarified using
the DS methodology, shows improvement in several additional metrics. The SM
enabled: (1) design stakeholders to make the Objective and Alternative Spaces clear
by explicitly capturing the value function for each design scenario described through
input and output parameters, formulas used to define parameters, and the range of
acceptable parameter values; (2) CAD experts to construct parametric models used to
search the requirements specific segment of the design space; (3) design stakeholders
to identify high impact action items by means of upstream and downstream
dependency propagation. The PPM enabled making the parametric CAD model
structure clear. This clarity should help disseminate expert knowledge, which has been
an impediment in the wide adoption of this modeling technique in practice. By
utilizing the SM-determined parameters, the PPM can also help improve the CAD
model quality metric by eliminating the need to construct multiple models for a given
design scenario. However, building and communicating scenarios explicitly may
impact the number of scenarios that designers are able to construct. More research is
needed to determine this impact.
The DS AAM enabled the design stakeholders to make the Impact and Value Spaces
clear by analyzing the performance of all generated alternatives against all project
goals. The research team used the outputs for both design scenarios to perform an
objective comparison and determine which scenario overall performed better for the
same set of constraints and goals, as well as identify the winning design alternative. In
9 out of 10 cases the “half teardrop” scenario performed better and its winning
Alternative 7 had a substantial value score difference in comparison with the winning
Alternative 8 for the “triangular” scenario. AAM enables design teams to make
objective decisions when faced with lots of choices, something that was impossible in
test cases 1 and 2.

Chapter 4: Application of DS Methodology Victor Gane
137
Design Scenarios received some accolades from the AE firm’s design stakeholders.
The Sustainable Design Group leader highlighted that “DS is a tool to quantitatively
compare the results of different teams. It helps guide the team, document decisions
and the reasons.” A Technical Architect and Studio Head pointed out that “DS has
given us the ability to provide the client with a better product”. The Computational
Design Leader stated that “DS encourages participation from people that otherwise get
involved later in the design process.”
The merit of this paper was to provide evidence that increasing the design space
clarity and rationale used to construct these spaces leads to improved application of
parametric modeling and enables an objective design decision making process. We
provided a test bed to systematically investigate the question of how much rationale
needs to be made explicit in different contexts (Moran and Carroll,1996). However,
we acknowledge several important opportunities to further the research presented in
this paper. Table 8 illustrates that we did not have enough data to complete the
proposed metrics set. For current practice, no distinction was made between scenarios
and alternatives when we collected the data. That is, we collected the number of
scenarios, and number of alternatives, but not the number of alternatives within each
scenario. Furthermore, our survey asked to retrospectively quantify traditional
conceptual design process performance. However, current design methods do not
enable practitioners to quantify the number of input parameters and constrained ranges
to help determine the Total Option Space Size and Options Space Quality metrics.
More test cases are required to determine the comprehensiveness of the proposed set
of metrics as well as better understand which method leads to more lateral thinking –
Design Scenarios or parametric modeling with no formal method of clarifying design
spaces.
The impact of Design Scenarios can be further expanded by addressing the following
opportunities: (1) use the PPM to fully automate the parametric CAD model
generation from PPM nodes by leveraging the parametric modeler’s Application
Programming Interface; (2) use Process Integration and Design Optimization methods
(Welle & Haymaker, 2011, Flager et. al., 2008) to automate the process of performing

Chapter 4: Application of DS Methodology Victor Gane
138
multidisciplinary analyses and determining the impact scores in the AAM. The
anticipated impact is a substantial increase in the Option and Alternative Space size,
Options Space Quality, Value Space Quality, and a further reduction in the overall
conceptual design process duration.
6 Bibliography Akın, Ö. (2001). “Variants of design cognition”. Design Knowing and Learning:
Cognition in Design Education. Eastman, C., Newstetter, W., & McCracken,
M., Eds., New York: Elsevier, pp. 105–124.
Alexander, C., Ishikawa, S., Silverstein, M. (1977). “A pattern language : towns,
buildings, construction”. Center for Environmental Structure, vol. 2, Oxford
University Press, New York.
Baniassad, E., Clarke, S. (2004). “Theme: An Approach for Aspect-Oriented Analysis
and Design”. Proceedings of the 26th International Conference on Software
Engineering (ICSE’04), Vol. 5, No. 3b, pp 69 – 92.
Barrie, D., Paulson, B. (1991). “Professional Construction Management: Including
CM, Design-Construct and General Contracting.” McGraw-Hill, Inc.; 3rd
edition.
Buschmann, F., Meunier, R., Rohnert, H., Sommerlad, P., Stal, M. (1996). “Pattern-
Oriented Software Architecture: A System of Patterns”. John Wiley & Sons.
Clevenger, C., Haymaker, J. (2010). "Design Exploration Assessment Methodology:
Testing the Guidance of Design Processes". CIFE Technical Report 192.
Chachere, J., Haymaker, J. (2008). "Framework for Measuring Rationale Clarity of
AEC Design Decisions". CIFE Technical Report 177.
DOE, Radiance Homepage, US Department of Energy, Washington, D.C., Accessed
in March 2011, from: http://radsite.lbl.gov/.
Chapter 4: Application of DS Methodology Victor Gane
139
Flager F., Welle B., Bansal P., Soremekun G., Haymaker J. (2009). “Multidisciplinary
Process Integration and Design Optimization of a Classroom Building.”
Journal of Information Technology in Construction (ITcon), Vol. 14, pg. 595-
612.
Garlan, D., Allen, R., Ockerbloom, J. (1994). “Exploiting style in architectural design
environments”. Proceedings of SIGSOFT’94: The Second ACM SIGSOFT
Symposium on the Foundations of Software Engineering, ACM Press, pp.
175–188.
Gane, V., Haymaker, J. (2010). “Benchmarking current high-rise conceptual design
processes”. ASCE Journal of Architectural Engineering. Vol. 16, No. 3, pp.
100-111.
Gane, V., Haymaker, J. (2011). “Design Scenarios – enabling requirements-driven
design spaces”, CIFE Technical Report No. 194.
(http://cife.stanford.edu/online.publications/TR194.pdf)
Giesecke, S., Hasselbring , W., Riebisch, M. (2007). “Classifying architectural
constraints as a basis for software quality assessment”. Advanced Engineering
Informatics, Vol. 21, pp. 169–179.
Goldschmidt, G., (2006). “Quo vadis, design space explorer?” Artificial Intelligence
for Engineering Design, Analysis and Manufacturing. Vol. 20, pp. 105-111.
Hartmann, T., Fischer, M., Haymaker, J. (2008). “Implementing information systems
with project teams using ethnographic–action research,” Advanced
Engineering Informatics, In Press.
Hauser, J., Clausing, D. (1988). “The House of Quality”. Harvard Business Review.
Vol. May – June 1988, pp. 3-13
Hazelrigg, G. A., (1998). “A Framework for Decision-Based Engineering Design”.
Journal of Mechanical Design. Vol. 20, Issue 4, pp. 653-658.

Chapter 4: Application of DS Methodology Victor Gane
140
Howard, Ronald A. (1966). "Decision Analysis: Applied Decision Theory"
Proceedings of the 4th International Conference on Operational Research.
pp. 55–77.
Kraft, B., Nagl, M. (2007). “Visual knowledge specification for conceptual design:
Definition and tool support”. Advanced Engineering Informatics, Vol. 21, pp.
67–83.
Miller, L., (1993). “Concurrent Engineering Design: integrating the best practices for
process improvement”. Society of Manufacturing Engineers.
Moran, T., Carroll, J. (1996). “Design Rationale: concepts, techniques, and use”.
Lawrence Erlbaum Associates, Inc., Publishers.
Shah, J., Mäntylä, M. (1995). “Parametric and Feature-Based CAD/CAM: Concepts,
Techniques, and Applications”. Wiley, John & Sons, Inc.
Welle, B., Haymaker, J., (2011). “Reference-Based Optimization Method (RBOM):
Enabling Flexible Problem Formulation for Product Model-Based
Multidisciplinary Design Optimization”.
http://cife.stanford.edu/online.publications/TR195.pdf . Accessed January,
2011.
Woodbury, R., Burrow, A., (2006). “Whither Design Space?”Artificial Intelligence for
Engineering Design, Analysis and Manufacturing. Vol. 20, pp. 63-82.

Chapter 4: Application of DS Methodology Victor Gane
141
7 Appendix The section contains the explanation of how the requirements not covered in section 3
of this paper were addressed.
Constraint No. 2 & 3 – Tower 2 Gross Area (hotel and serviced apartments)
The design scenario called for the footprints of both towers to be identical. Tower 2,
however, was described by two programmatic constraints – hotel (40,000 sq m) and
serviced apartments (50,000 sq m) summed to a total gross area of 90,000 sq m. Fig.
20 illustrates how the design architect rationalized constraints 2 and 3.
An “AND” relationship indicates that all six succeeding action items were required to
address both constraints. Given the identical footprints for both towers, the first action
and the dependent strategies and parameters from constraint 1 applied to constraints 2
and 3. “Calculate gross area” was the second action further decomposed into two
strategies – “Hotel tier” AND “Residential tier”. Each strategy was addressed
through a pair of parameters – “Single floor area”, an output parameter to be
measured in the CAD model and dependent on the “Tower1 base length” and “Major
arc radius” parameters, AND “Gross area”, an input parameter with a constant value.
The third action, “Control number of floors”, was addressed through two output
parameters – “Total number of hotel floors” AND “Total number of residential
floors”. Both were calculated by dividing “Gross area” to “Single floor area” for the
hotel and residential tiers respectively. The fourth action, “Calculate number of
units”, was decomposed into two strategies – “Hotel tier” AND “Serviced apartments
tier”, addressed through three output parameters – “Number of units north”, “Number
of units south major arc”, “Number of units south minor arc”. The fifth action,
“Calculate balcony length”, was introduced in response to “Create glass enclosed
balconies as buffer zones” action addressing three goals introduced later in the
following sections.

Chapter 4: Application of DS Methodology Victor Gane
142
Figure 4-20: Scenarios Model for constraints No. 2 & 3.
The fifth action was decomposed into three strategies – balcony length along “North
perimeter”, in which “North balcony perimeter length” parameter applied globally
because the tower’s north side footprint was a straight line (Figure 4-21a), “South
major arc perimeter”, and “South minor arc perimeter”, in which the “South balcony
major arc length” and “South balcony minor arc length” parameters were unique for
every balcony (Figure 4-21b).

Chapter 4: Application of DS Methodology Victor Gane
143
a) b)
Figure 4-21: Diagrams illustrating how the balcony lengths were calculated balcony
perimeter length on north side; b) balcony perimeter arc length on south sides.
The final action, “Control unit width”, was addressed by “Unit width” input
parameter, which had its values constrained between 4.2 – 4.8m.
Constraint No. 4 – Maximum tower height to last inhabited floor To address constraint 4 (Figure 4-22), the design architect proposed only one action –
“Control tower height”, further decomposed into two strategies: “Individually” and
“Globally”. The XOR relationship communicated that only one strategy had to be
chosen given the mutual exclusiveness of these. To attain more flexibility, the
architect chose the first strategy addressed through the following five parameters.
“Tower 1 floor height” was an input parameter with values ranging between 3.0–3.6m
(expert knowhow was used to determine this range), “Tower 1 height”, an output
parameter calculated by multiplying “Tower 1 No. floors” from constraint 1 with
“Tower 1 floor height”. Similarly, “Tower 2 hotel floor height” AND “Tower 2
residential floor height” were input parameters with values ranging between 3.0–3.6m
and used to calculate the “Tower 2 height” output parameter.

Chapter 4: Application of DS Methodology Victor Gane
144
Figure 4-22: Scenarios Model for constraint No. 4.
Constraints No. 5, 6, 7 – North and South site setbacks, Maximum site coverage
The next three constraints were straightforward to rationalize (Figure 4-23). The
“Setback north” and “Setback south” parameters (with values greater or equal to 12m
and 3m respectively) were the only ones needed to address the site setback constraints.
The design architect proposed three required actions describing the “Maximum site
coverage” constraint: “Calculate site area”, addressed through “Site area” constant
output parameter calculated by measuring the site area in CAD, “Calculate ground
floor area of both towers”, addressed through “Tower 1 and 2 single floor area”
output parameter, and “Calculate site coverage”, addressed through “Percentage of
site coverage” output parameter.
Figure 4-23: Scenarios Model for constraints No. 5, 6, 7.

Chapter 4: Application of DS Methodology Victor Gane
145
Goal No. 1 – Maximize unit exposure to water The design architect and mechanical engineer proposed three required actions to
address the project’s most important goal (Figure 4-24). First, “Control unit
orientation” was further decomposed into three required strategies – south, north, and
city “facing units”. Each strategy was addressed by a “View vector” input parameter
with the angle range determined by the architect based on the site’s perpendicular
orientation to the water. Second, “Calculate percentage of units facing water” was
addressed by the “Percentage of units facing the water” output parameter calculated
through an algebraic expression captured in the parameter node. Third, “Control tower
orientation” was further decomposed into two strategies – “Globally” OR “Each
tower individually”. The design architect decided to have one input parameter “Tower
rotation” with an angle ranging between 0-10 degrees applied to both towers.
Figure 4-24: Scenarios Model for Goal No. 1.
Goals No. 2 & 3 – Minimize direct sunlight in units and Minimize solar heat load To address Goals 2 and 3, the design architect and mechanical engineer proposed eight
required actions (Figure 4-25). “Control tower orientation”, “Control unit width”
from Goal 1 AND “Control unit width” from Constraints 2 and 3 also addressed
Goals 2 and 3. The fourth action, “Consider passive shading techniques”, was

Chapter 4: Application of DS Methodology Victor Gane
146
decomposed into four strategies. The first two indicated the requirement for top AND
bottom balcony sections to be shaded. The architect proposed three output parameters
determining the “Shaded section height” in Tower 1 and the hotel and residential tiers
of Tower 2. The other two strategies offered a choice between two materials –
reflective metal vs. fritted glass illustrated through an XOR relationship. The design
architect chose the fritted glass strategy in support of two other goals – “Maximizing
unit exposure to water” and “Sleek design”. The “Frit density” input parameter
explicitly communicated the architect preferred frit range later used in daylight
simulations. The fifth action, “Control balcony depth” was retracted soon after being
proposed because of a conflict with “Control unit orientation” action from Goal 1,
which already helped determine the balcony depth.
Figure 4-25: Scenario Model for Goals No. 2, 3.
The sixth action, “Introduce horizontal sliding panels for natural ventilation”, was
addressed through “Sliding panel height” output parameter. The seventh action,
“Control envelope inclination at each level”, was decomposed into two strategies –
globally OR individually on “North, South, East, West walls”. The design architect

Chapter 4: Application of DS Methodology Victor Gane
147
decided on the second strategy in order to attain greater flexibility in exploring design
options for the exterior envelope. The mechanical engineer proposed four required
input parameters matching the building orientation with an inclination angle ranging
between 1–8 degrees.
Goals No. 4 & 5 – Sleek design and Maximize exposure to prevailing wind The design architect proposed two required actions to address the “Sleek Design”
qualitative goal – “Create glass enclosed balconies” from goals 2 & 3 AND “Creating
an all glass exterior” complementary action.
Figure 4-26: Scenario Model for Goals No. 4, 5.
The design architect and the mechanical engineer decomposed the last project goal
into three required actions – “Control tower orientation” AND “Control half
teardrop configuration” from Constraint 1 and Goal 1, AND “Calculate percentage
of prevailing wind facing units”, assessed through “Percentage of total units facing
prevailing wind” output parameter. The mechanical engineer proposed the last action
after he determined the prevailing wind direction, information also used to write the
formula for calculating the output parameter (Figure 4-26).
Copyright © 2022 FDOKUMEN