
Design Methodology for a SEAREV Wave Energy Converter
9
1 Design Methodology for a SEAREV Wave Energy Converter Marie Ruellan, Hamid BenAhmed, Bernard Multon, Christophe Josset, Aurelien Babarit, and Alain Clement Abstract —This article will begin by presenting two power take-off (PTO) technologies for the SEAREV wave energy converter (WEC) followed by the design methodology applied to electromagnetic generator cy- cles for the all-electric solution. The operating principle associated with the SEAREV WEC will be described before discussing the two conversion technologies in- tended to transform wave energy into electricity. The types of systems are twofold: hydroelectric and all- electric. The strong coupling between the hydrody- namic, mechanical and electrical phenomena heavily influences the behavior of the recovery (PTO) system and leads to a complex system design that requires a full-scale modeling description. A unique design methodology for the all-electric conversion chain has been developed around several distinct control modes, including one featuring power leveling. Index Terms —wave energy conversion - electromag- netic generator - optimization - design methodology. I. Introduction According to the World Energy Council (WEC) [1], be- tween 140 and 700 TWh/year of wave energy are available and economically-accessible, i.e. approximately 1% to 5% of the annual worldwide demand for electricity. The recov- erable energy could reach as high as 2,000 TWh/year with more efficient conversion systems. Swells are described as the overlapping of several gradual and monochromatic elementary waves, with all phases being random. Studies have shown that the sea state, i.e. the quantity of energy contained within each of the elementary waves making up a swell, is a slowly-varying non-periodic function. The sea state may be modeled, according to the hydrodynamic community, within the frequency space f by means of an energy spectrum that depends upon two parameters, i.e.: • the significant height (peak-to-valley) denoted H s . This parameter corresponds to the average height of the highest third of the waves [2]; and • the peak period of the waves T p = 1/f p , where f p corresponds to the highest peak in the frequency spectrum of the wave field (Fig. 1). The figure 1 shows a temporal measurement of the wave elevation. The significant height is indicated. The energy spectrum is also presented and the peak frequency is indicated. For an aleatory swell, equation 1 below yields an ap- proximation for its energy potential (in W/m): P = ρg 2 32π H 2 s T p (1) Fig. 1: Wave elevation measurement and wave energy spectrum where ρ is the mass density of water and g the gravita- tional constant. Table I provides an order of magnitude for the recover- able power P vs. swell height H s and peak period T p . Tp(s) Hs (m) P (kW/m) 6 1 2.4 9 2.5 22.5 12 6 173 TABLE I: Exemplary swell energy profiles II. Principle behind the searev system The WEC concept is based on a pendulum set in a closed buoy actuated by the swell through excitation forces [3] [4] (see Fig. 2). The lever or pendulum executes rotational movements transmitted to an active recovery system (in turn coupled to a charge via an electronic power converter), which recovers a portion of its kinetic energy produced. In order to obtain a PTO well suited to the swell characteristics associated with a particular geographic site, it is to be optimized by incorporating the actual measured swell cycles. Moreover, the design and optimization of such a system necessitate including the rather strong couplings physically existing between the hydrodynamic, mechanical and control phenomena. In an initial approach, the electromechanical part may be modeled by a simplified recovery function and confined to the recovery braking torque, whose evolution over time has been optimized in the aim of maximizing, for a given set of excitation conditions, electrical energy while minimizing the size of the conversion chain. The computation of the electrical power output re- quires determining movements of the coupled device {buoy + pendulum + generator with control}. Hence, a hal-00528937, version 1 - 22 Oct 2010 Author manuscript, published in "Energy Conversion 25, 3 (2010) 760-767"
-
Upload
independent -
Category
Documents
-
view
7 -
download
0
Transcript of Design Methodology for a SEAREV Wave Energy Converter
1
Design Methodology for a SEAREV Wave Energy
ConverterMarie Ruellan, Hamid BenAhmed, Bernard Multon, Christophe Josset, Aurelien Babarit,
and Alain Clement
Abstract—This article will begin by presenting twopower take-off (PTO) technologies for the SEAREVwave energy converter (WEC) followed by the designmethodology applied to electromagnetic generator cy-cles for the all-electric solution. The operating principleassociated with the SEAREV WEC will be describedbefore discussing the two conversion technologies in-tended to transform wave energy into electricity. Thetypes of systems are twofold: hydroelectric and all-electric. The strong coupling between the hydrody-namic, mechanical and electrical phenomena heavilyinfluences the behavior of the recovery (PTO) systemand leads to a complex system design that requiresa full-scale modeling description. A unique designmethodology for the all-electric conversion chain hasbeen developed around several distinct control modes,including one featuring power leveling.
Index Terms—wave energy conversion - electromag-netic generator - optimization - design methodology.
I. Introduction
According to the World Energy Council (WEC) [1], be-tween 140 and 700 TWh/year of wave energy are availableand economically-accessible, i.e. approximately 1% to 5%of the annual worldwide demand for electricity. The recov-erable energy could reach as high as 2,000 TWh/year withmore efficient conversion systems. Swells are described asthe overlapping of several gradual and monochromaticelementary waves, with all phases being random. Studieshave shown that the sea state, i.e. the quantity of energycontained within each of the elementary waves making upa swell, is a slowly-varying non-periodic function. The seastate may be modeled, according to the hydrodynamiccommunity, within the frequency space f by means of anenergy spectrum that depends upon two parameters, i.e.:
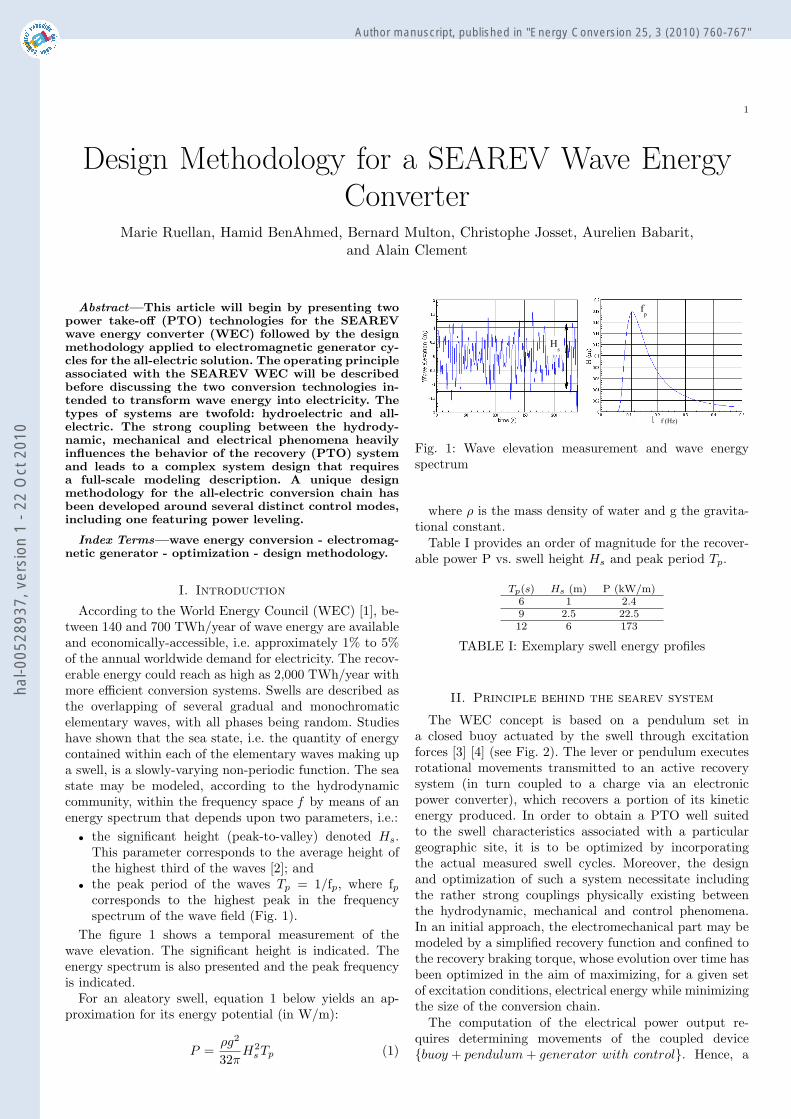
• the significant height (peak-to-valley) denoted Hs.This parameter corresponds to the average height ofthe highest third of the waves [2]; and
• the peak period of the waves Tp = 1/fp, where fpcorresponds to the highest peak in the frequencyspectrum of the wave field (Fig. 1).
The figure 1 shows a temporal measurement of thewave elevation. The significant height is indicated. Theenergy spectrum is also presented and the peak frequencyis indicated.
For an aleatory swell, equation 1 below yields an ap-proximation for its energy potential (in W/m):
P =ρg2
32πH2
s Tp (1)
Fig. 1: Wave elevation measurement and wave energyspectrum
where ρ is the mass density of water and g the gravita-tional constant.
Table I provides an order of magnitude for the recover-able power P vs. swell height Hs and peak period Tp.
Tp(s) Hs (m) P (kW/m)6 1 2.49 2.5 22.512 6 173
TABLE I: Exemplary swell energy profiles
II. Principle behind the searev system
The WEC concept is based on a pendulum set ina closed buoy actuated by the swell through excitationforces [3] [4] (see Fig. 2). The lever or pendulum executesrotational movements transmitted to an active recoverysystem (in turn coupled to a charge via an electronicpower converter), which recovers a portion of its kineticenergy produced. In order to obtain a PTO well suitedto the swell characteristics associated with a particulargeographic site, it is to be optimized by incorporatingthe actual measured swell cycles. Moreover, the designand optimization of such a system necessitate includingthe rather strong couplings physically existing betweenthe hydrodynamic, mechanical and control phenomena.In an initial approach, the electromechanical part may bemodeled by a simplified recovery function and confined tothe recovery braking torque, whose evolution over time hasbeen optimized in the aim of maximizing, for a given setof excitation conditions, electrical energy while minimizingthe size of the conversion chain.
The computation of the electrical power output re-quires determining movements of the coupled device{buoy + pendulum + generator with control}. Hence, a
hal-0
0528
937,
ver
sion
1 -
22 O
ct 2
010
Author manuscript, published in "Energy Conversion 25, 3 (2010) 760-767"
2
Fig. 2: Schematic diagram of the SEAREV pendular waveenergy converter [4]
multi-physical hydrodynamic-mechanical-electrical model-ing description must be derived. The movement is sup-posed to be plane.
The general equation to be solved is of the followingform [3]:
M.~X =
∑~Fext (2)
where M represents the system’s inertia matrix and~X = [xG zG θ α] is the displacement vector (Fig. 2). ~Fext
is the vector of generalized forces:
~Fext = ~Fp + ~FH + ~FR + ~Fs + ~TR (3)
Fp denotes the force being exerted by the pendulum; thisforce depends on X, and on the set of geometric parametersfor both the buoy and the pendulum.FH stands for the hydrostatic force due to buoyancy.FR is the so-called radiation force corresponding to thereaction of the {buoy + pendulum} system on the swell.TR is the energy recovery torque.Swell excitation forces Fs are calculated from a set ofimposed swell conditions for a given overall buoy geometry[5].
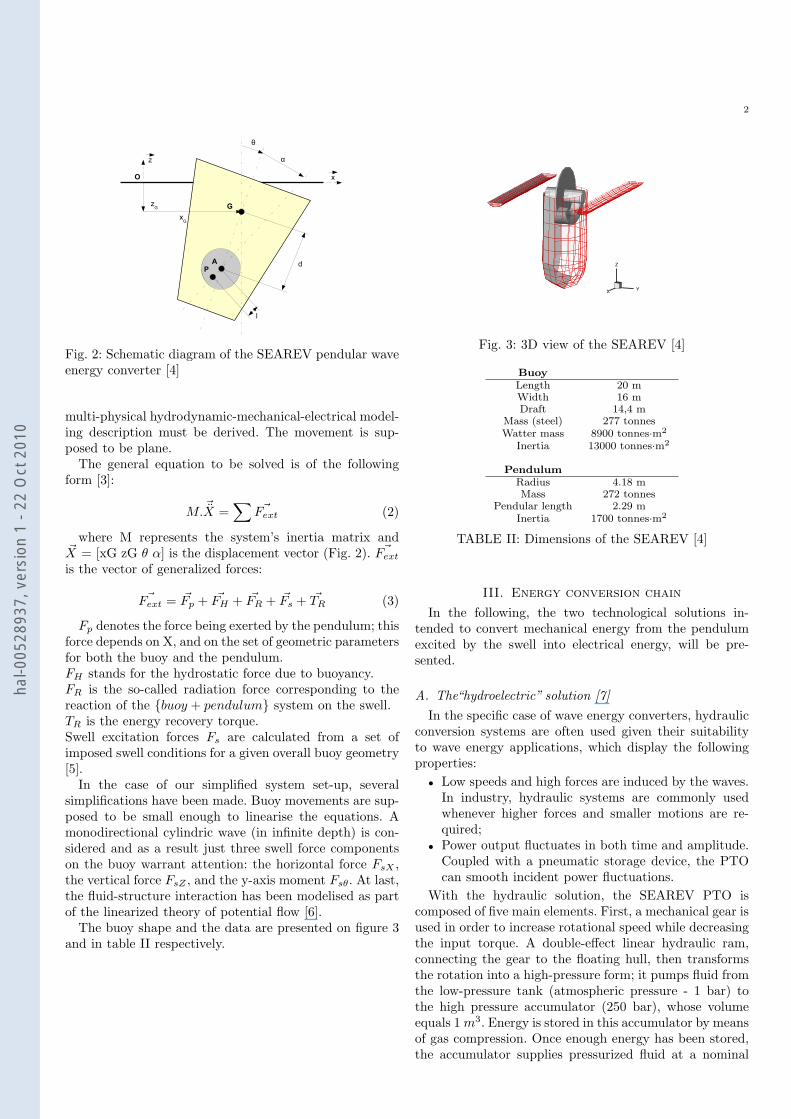
In the case of our simplified system set-up, severalsimplifications have been made. Buoy movements are sup-posed to be small enough to linearise the equations. Amonodirectional cylindric wave (in infinite depth) is con-sidered and as a result just three swell force componentson the buoy warrant attention: the horizontal force FsX ,the vertical force FsZ , and the y-axis moment Fsθ. At last,the fluid-structure interaction has been modelised as partof the linearized theory of potential flow [6].
The buoy shape and the data are presented on figure 3and in table II respectively.
Fig. 3: 3D view of the SEAREV [4]
Buoy
Length 20 mWidth 16 mDraft 14,4 m
Mass (steel) 277 tonnesWatter mass 8900 tonnes·m2
Inertia 13000 tonnes·m2
Pendulum
Radius 4.18 mMass 272 tonnes
Pendular length 2.29 mInertia 1700 tonnes·m2
TABLE II: Dimensions of the SEAREV [4]
III. Energy conversion chain
In the following, the two technological solutions in-tended to convert mechanical energy from the pendulumexcited by the swell into electrical energy, will be pre-sented.
A. The“hydroelectric” solution [7]
In the specific case of wave energy converters, hydraulicconversion systems are often used given their suitabilityto wave energy applications, which display the followingproperties:
• Low speeds and high forces are induced by the waves.In industry, hydraulic systems are commonly usedwhenever higher forces and smaller motions are re-quired;
• Power output fluctuates in both time and amplitude.Coupled with a pneumatic storage device, the PTOcan smooth incident power fluctuations.
With the hydraulic solution, the SEAREV PTO iscomposed of five main elements. First, a mechanical gear isused in order to increase rotational speed while decreasingthe input torque. A double-effect linear hydraulic ram,connecting the gear to the floating hull, then transformsthe rotation into a high-pressure form; it pumps fluid fromthe low-pressure tank (atmospheric pressure - 1 bar) tothe high pressure accumulator (250 bar), whose volumeequals 1 m3. Energy is stored in this accumulator by meansof gas compression. Once enough energy has been stored,the accumulator supplies pressurized fluid at a nominal
hal-0
0528
937,
ver
sion
1 -
22 O
ct 2
010
3
Fig. 4: Synopsis of the “hydroelectric” conversion chain
flow rate to a hydraulic motor coupled to an inductiongenerator, which in turn is directly coupled to the grid.Electricity can then be generated and the fluid is releasedback into the tank at low pressure. A sample of the resultsobtained from this study appear in Table III below.
Viscousdamper
Hydraulic PTO
Tp(s) Hs (m) Eextracted
(kWh)Eextracted
(kWh)P0 (bar) Pnominal
(kW)9 1 8 8 30 3009 3 62 82 150 3009 5 130 155 190 340
TABLE III: Results using hydraulic PTO
B. The All-electric solution
An all-electric solution has also been assessed for po-tential industrial application following an initial electro-hydraulic phase (see Section III-A). The remainder ofthis article will lay out the design methodology for thissolution. The pendulum is damped by an electromagneticgenerator driven by an IGBT static converter using pulsewidth modulation (2 three-phase bridges, back-to-back onboth the machine and network sides), in association witha system that imposes a set of optimized control laws. Thegenerator may be directly coupled to the pendulum (i.e.direct drive) or coupled via a mechanical multiplier (bothof these options are currently under study). The researchpresented herein concerns the optimal electromagneticgenerator design and its static converter solely in the directdrive mode. The multi-physical couplings and the swellcycle complexity necessitate developing a specific designoptimization methodology that incorporates the controllaws.
IV. Design methodology for the all-electric
solution
A. A heavily-coupled multi-physical problem
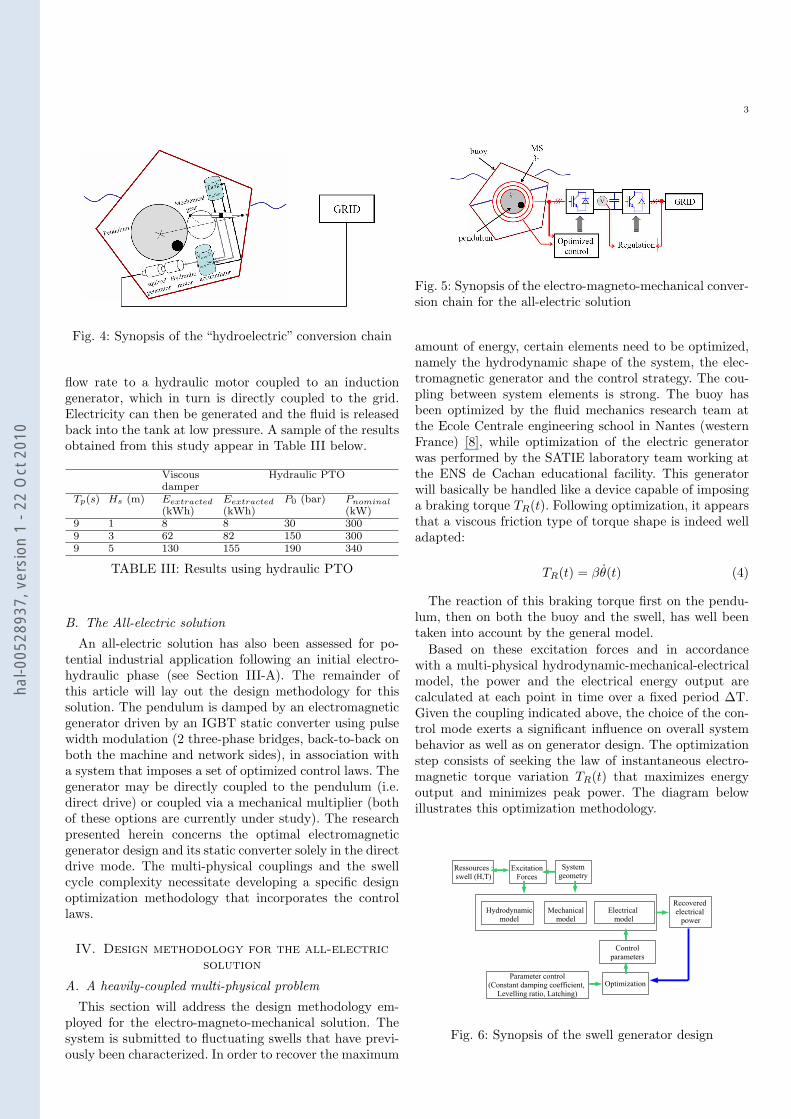
This section will address the design methodology em-ployed for the electro-magneto-mechanical solution. Thesystem is submitted to fluctuating swells that have previ-ously been characterized. In order to recover the maximum
Fig. 5: Synopsis of the electro-magneto-mechanical conver-sion chain for the all-electric solution
amount of energy, certain elements need to be optimized,namely the hydrodynamic shape of the system, the elec-tromagnetic generator and the control strategy. The cou-pling between system elements is strong. The buoy hasbeen optimized by the fluid mechanics research team atthe Ecole Centrale engineering school in Nantes (westernFrance) [8], while optimization of the electric generatorwas performed by the SATIE laboratory team working atthe ENS de Cachan educational facility. This generatorwill basically be handled like a device capable of imposinga braking torque TR(t). Following optimization, it appearsthat a viscous friction type of torque shape is indeed welladapted:
TR(t) = βθ(t) (4)
The reaction of this braking torque first on the pendu-lum, then on both the buoy and the swell, has well beentaken into account by the general model.
Based on these excitation forces and in accordancewith a multi-physical hydrodynamic-mechanical-electricalmodel, the power and the electrical energy output arecalculated at each point in time over a fixed period ∆T.Given the coupling indicated above, the choice of the con-trol mode exerts a significant influence on overall systembehavior as well as on generator design. The optimizationstep consists of seeking the law of instantaneous electro-magnetic torque variation TR(t) that maximizes energyoutput and minimizes peak power. The diagram belowillustrates this optimization methodology.
Fig. 6: Synopsis of the swell generator design
hal-0
0528
937,
ver
sion
1 -
22 O
ct 2
010
4
B. Control modes
Three distinct control methods have been examined [9]:
• optimization of the viscous damping coefficient β,• power leveling, and• latching-based control [6] [10].
1) Optimization with constant damping coefficient β
Firstly a viscous damping type of torque is imposed:TR(t) = βθ(t).
where β is the viscous damping coefficient, whichremains constant over the full cycle (including the start-up phase with the transient pendular motion ), and whichmust be optimized. The optimization problem consists inseeking the values of β such that the mechanical energyoutput We is maximized. Figure 7 presents the mechanicalenergy output according to the viscous damping for twowave cycle simulations.
Ee =
∫β ˙θ(t)2dt (5)
0 0.5 1 1.5 2
x 107
0
0.5
1
1.5
2x 10
5
β (N.m.s/rad)
P avg (
W)
Tp = 8 s H
s=3 m
Tp = 4 s H
s=1.5 m
Fig. 7: Average power vs. damping coefficient β
Simulations must be run over period cycles ∆ T >> Tp
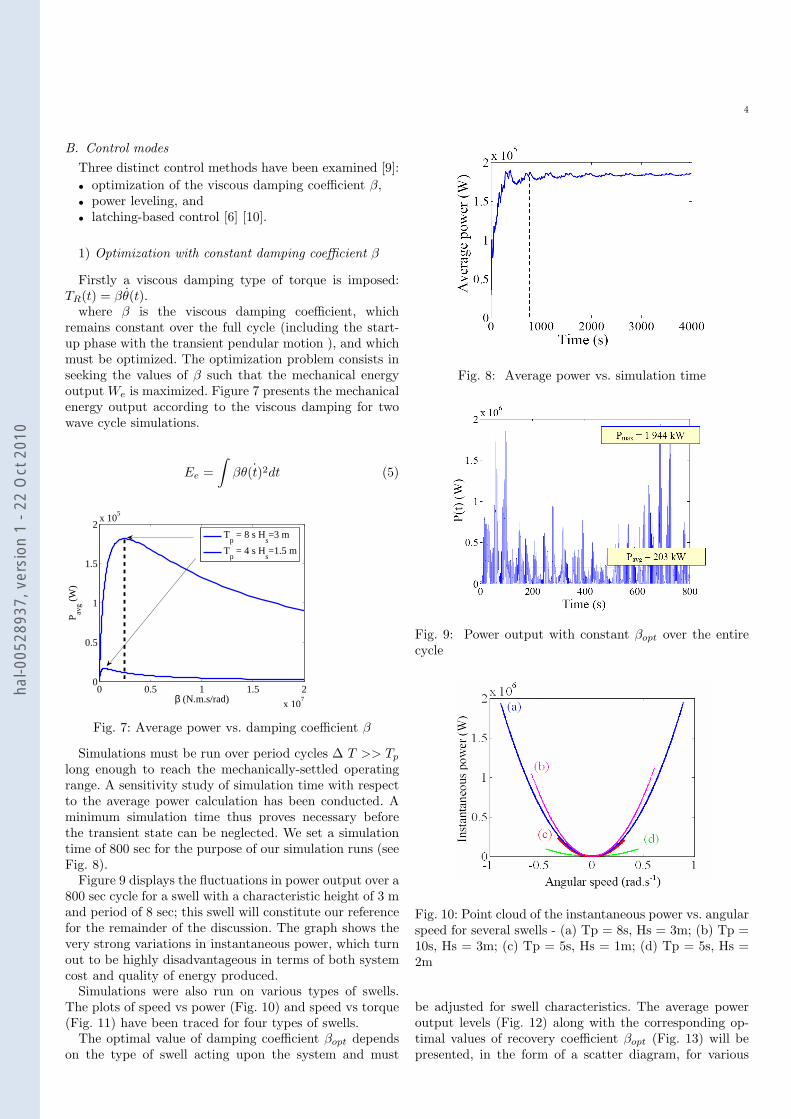
long enough to reach the mechanically-settled operatingrange. A sensitivity study of simulation time with respectto the average power calculation has been conducted. Aminimum simulation time thus proves necessary beforethe transient state can be neglected. We set a simulationtime of 800 sec for the purpose of our simulation runs (seeFig. 8).
Figure 9 displays the fluctuations in power output over a800 sec cycle for a swell with a characteristic height of 3 mand period of 8 sec; this swell will constitute our referencefor the remainder of the discussion. The graph shows thevery strong variations in instantaneous power, which turnout to be highly disadvantageous in terms of both systemcost and quality of energy produced.
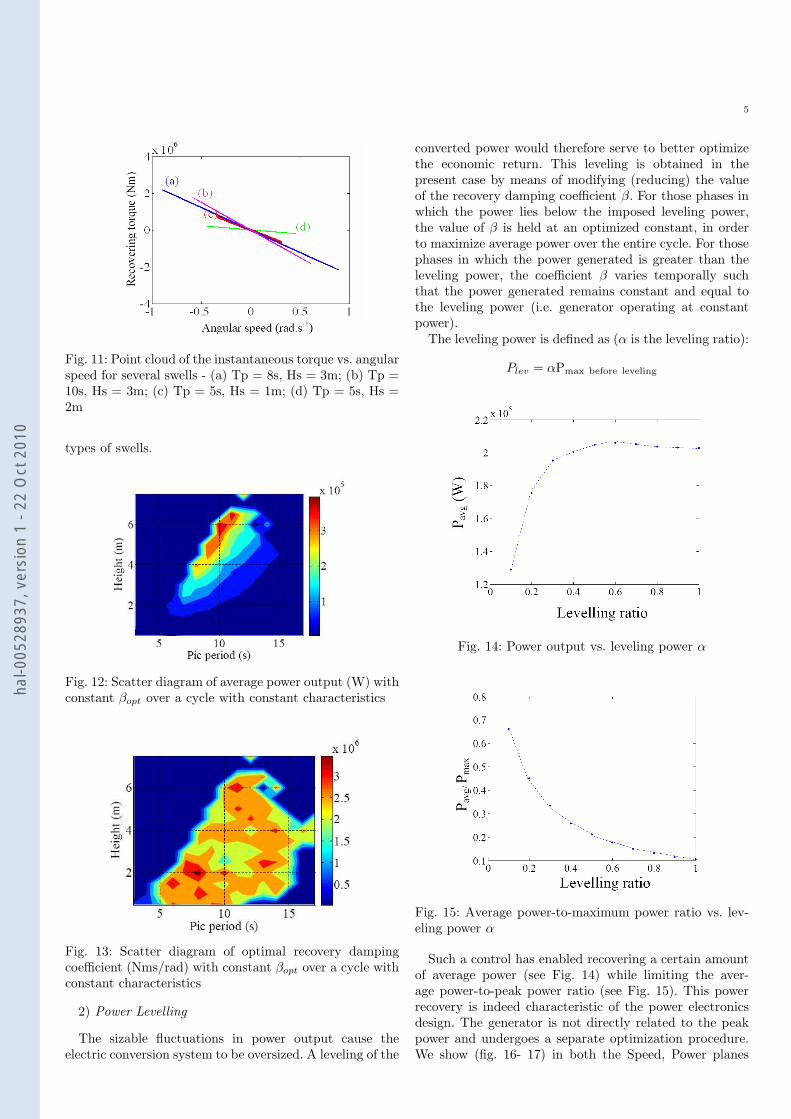
Simulations were also run on various types of swells.The plots of speed vs power (Fig. 10) and speed vs torque(Fig. 11) have been traced for four types of swells.
The optimal value of damping coefficient βopt dependson the type of swell acting upon the system and must
Fig. 8: Average power vs. simulation time
Fig. 9: Power output with constant βopt over the entirecycle
Fig. 10: Point cloud of the instantaneous power vs. angularspeed for several swells - (a) Tp = 8s, Hs = 3m; (b) Tp =10s, Hs = 3m; (c) Tp = 5s, Hs = 1m; (d) Tp = 5s, Hs =2m
be adjusted for swell characteristics. The average poweroutput levels (Fig. 12) along with the corresponding op-timal values of recovery coefficient βopt (Fig. 13) will bepresented, in the form of a scatter diagram, for various
hal-0
0528
937,
ver
sion
1 -
22 O
ct 2
010
5
Fig. 11: Point cloud of the instantaneous torque vs. angularspeed for several swells - (a) Tp = 8s, Hs = 3m; (b) Tp =10s, Hs = 3m; (c) Tp = 5s, Hs = 1m; (d) Tp = 5s, Hs =2m
types of swells.
Fig. 12: Scatter diagram of average power output (W) withconstant βopt over a cycle with constant characteristics
Fig. 13: Scatter diagram of optimal recovery dampingcoefficient (Nms/rad) with constant βopt over a cycle withconstant characteristics
2) Power Levelling
The sizable fluctuations in power output cause theelectric conversion system to be oversized. A leveling of the
converted power would therefore serve to better optimizethe economic return. This leveling is obtained in thepresent case by means of modifying (reducing) the valueof the recovery damping coefficient β. For those phases inwhich the power lies below the imposed leveling power,the value of β is held at an optimized constant, in orderto maximize average power over the entire cycle. For thosephases in which the power generated is greater than theleveling power, the coefficient β varies temporally suchthat the power generated remains constant and equal tothe leveling power (i.e. generator operating at constantpower).
The leveling power is defined as (α is the leveling ratio):
Plev = αPmax before leveling
Fig. 14: Power output vs. leveling power α
Fig. 15: Average power-to-maximum power ratio vs. lev-eling power α
Such a control has enabled recovering a certain amountof average power (see Fig. 14) while limiting the aver-age power-to-peak power ratio (see Fig. 15). This powerrecovery is indeed characteristic of the power electronicsdesign. The generator is not directly related to the peakpower and undergoes a separate optimization procedure.We show (fig. 16- 17) in both the Speed, Power planes
hal-0
0528
937,
ver
sion
1 -
22 O
ct 2
010
6
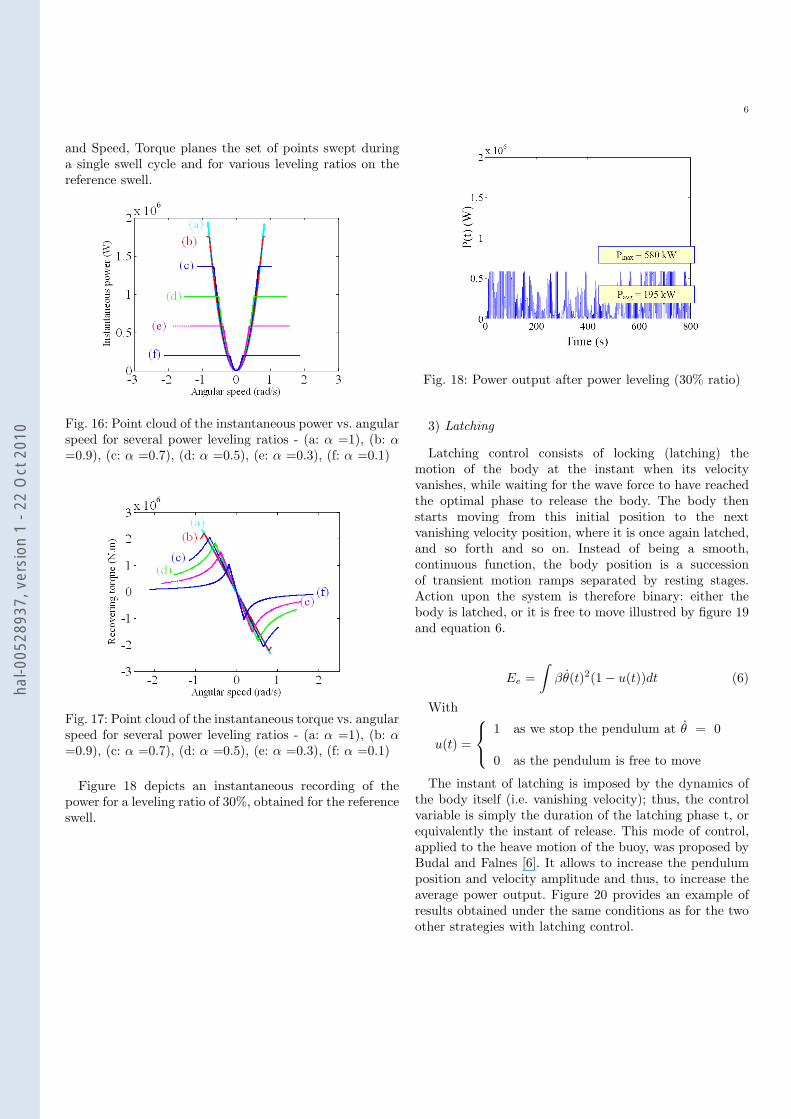
and Speed, Torque planes the set of points swept duringa single swell cycle and for various leveling ratios on thereference swell.
Fig. 16: Point cloud of the instantaneous power vs. angularspeed for several power leveling ratios - (a: α =1), (b: α
=0.9), (c: α =0.7), (d: α =0.5), (e: α =0.3), (f: α =0.1)
Fig. 17: Point cloud of the instantaneous torque vs. angularspeed for several power leveling ratios - (a: α =1), (b: α
=0.9), (c: α =0.7), (d: α =0.5), (e: α =0.3), (f: α =0.1)
Figure 18 depicts an instantaneous recording of thepower for a leveling ratio of 30%, obtained for the referenceswell.
Fig. 18: Power output after power leveling (30% ratio)
3) Latching
Latching control consists of locking (latching) themotion of the body at the instant when its velocityvanishes, while waiting for the wave force to have reachedthe optimal phase to release the body. The body thenstarts moving from this initial position to the nextvanishing velocity position, where it is once again latched,and so forth and so on. Instead of being a smooth,continuous function, the body position is a successionof transient motion ramps separated by resting stages.Action upon the system is therefore binary: either thebody is latched, or it is free to move illustred by figure 19and equation 6.
Ee =
∫βθ(t)2(1 − u(t))dt (6)
With
u(t) =
1 as we stop the pendulum at θ = 0
0 as the pendulum is free to move
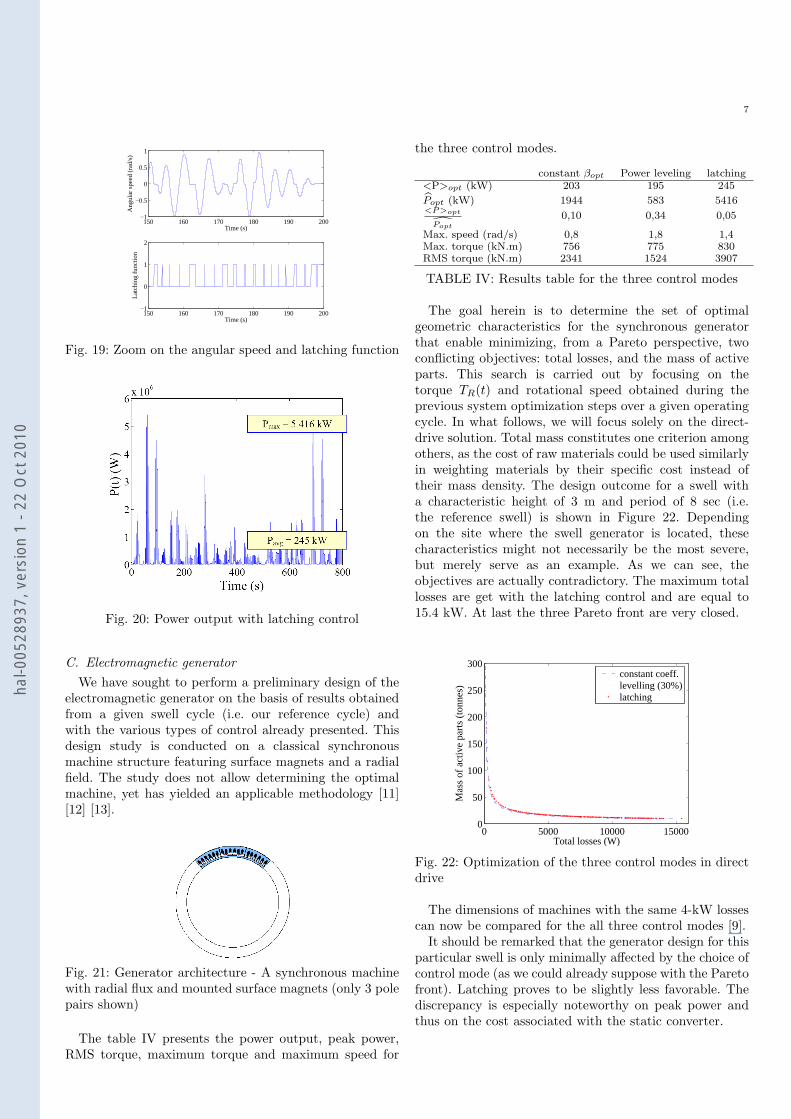
The instant of latching is imposed by the dynamics ofthe body itself (i.e. vanishing velocity); thus, the controlvariable is simply the duration of the latching phase t, orequivalently the instant of release. This mode of control,applied to the heave motion of the buoy, was proposed byBudal and Falnes [6]. It allows to increase the pendulumposition and velocity amplitude and thus, to increase theaverage power output. Figure 20 provides an example ofresults obtained under the same conditions as for the twoother strategies with latching control.
hal-0
0528
937,
ver
sion
1 -
22 O
ct 2
010
7
150 160 170 180 190 200−1
−0.5
0
0.5
1
Time (s)
Ang
ular
spe
ed (
rad/
s)
150 160 170 180 190 200−1
0
1
2
Time (s)
Latc
hing
func
tion
Fig. 19: Zoom on the angular speed and latching function
Fig. 20: Power output with latching control
C. Electromagnetic generator
We have sought to perform a preliminary design of theelectromagnetic generator on the basis of results obtainedfrom a given swell cycle (i.e. our reference cycle) andwith the various types of control already presented. Thisdesign study is conducted on a classical synchronousmachine structure featuring surface magnets and a radialfield. The study does not allow determining the optimalmachine, yet has yielded an applicable methodology [11][12] [13].
Fig. 21: Generator architecture - A synchronous machinewith radial flux and mounted surface magnets (only 3 polepairs shown)
The table IV presents the power output, peak power,RMS torque, maximum torque and maximum speed for
the three control modes.
constant βopt Power leveling latching<P>opt (kW) 203 195 245
Popt (kW) 1944 583 5416<P>opt
Popt
0,10 0,34 0,05
Max. speed (rad/s) 0,8 1,8 1,4Max. torque (kN.m) 756 775 830RMS torque (kN.m) 2341 1524 3907
TABLE IV: Results table for the three control modes
The goal herein is to determine the set of optimalgeometric characteristics for the synchronous generatorthat enable minimizing, from a Pareto perspective, twoconflicting objectives: total losses, and the mass of activeparts. This search is carried out by focusing on thetorque TR(t) and rotational speed obtained during theprevious system optimization steps over a given operatingcycle. In what follows, we will focus solely on the direct-drive solution. Total mass constitutes one criterion amongothers, as the cost of raw materials could be used similarlyin weighting materials by their specific cost instead oftheir mass density. The design outcome for a swell witha characteristic height of 3 m and period of 8 sec (i.e.the reference swell) is shown in Figure 22. Dependingon the site where the swell generator is located, thesecharacteristics might not necessarily be the most severe,but merely serve as an example. As we can see, theobjectives are actually contradictory. The maximum totallosses are get with the latching control and are equal to15.4 kW. At last the three Pareto front are very closed.
0 5000 10000 150000
50
100
150
200
250
300
Total losses (W)
Mas
s of
act
ive
part
s (t
onne
s) constant coeff.levelling (30%)latching
Fig. 22: Optimization of the three control modes in directdrive
The dimensions of machines with the same 4-kW lossescan now be compared for the all three control modes [9].
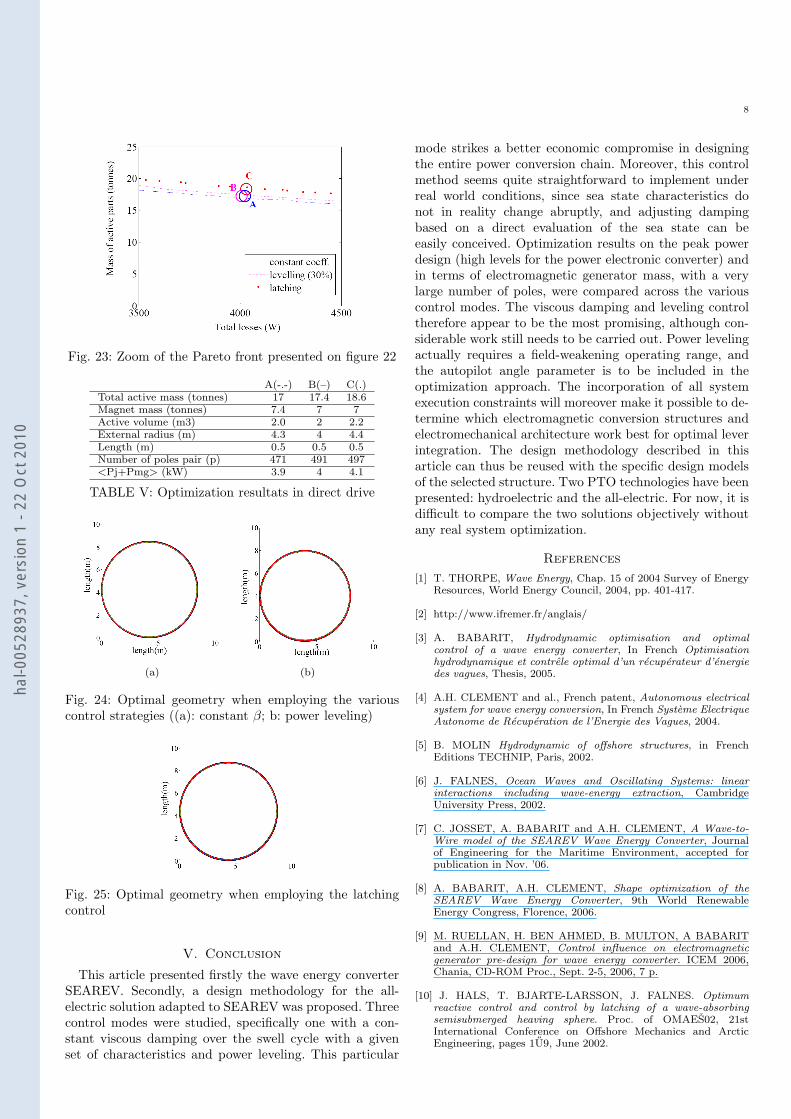
It should be remarked that the generator design for thisparticular swell is only minimally affected by the choice ofcontrol mode (as we could already suppose with the Paretofront). Latching proves to be slightly less favorable. Thediscrepancy is especially noteworthy on peak power andthus on the cost associated with the static converter.
hal-0
0528
937,
ver
sion
1 -
22 O
ct 2
010
8
Fig. 23: Zoom of the Pareto front presented on figure 22
A(-.-) B(–) C(.)Total active mass (tonnes) 17 17.4 18.6Magnet mass (tonnes) 7.4 7 7Active volume (m3) 2.0 2 2.2External radius (m) 4.3 4 4.4Length (m) 0.5 0.5 0.5Number of poles pair (p) 471 491 497<Pj+Pmg> (kW) 3.9 4 4.1
TABLE V: Optimization resultats in direct drive
(a) (b)
Fig. 24: Optimal geometry when employing the variouscontrol strategies ((a): constant β; b: power leveling)
Fig. 25: Optimal geometry when employing the latchingcontrol
V. Conclusion
This article presented firstly the wave energy converterSEAREV. Secondly, a design methodology for the all-electric solution adapted to SEAREV was proposed. Threecontrol modes were studied, specifically one with a con-stant viscous damping over the swell cycle with a givenset of characteristics and power leveling. This particular
mode strikes a better economic compromise in designingthe entire power conversion chain. Moreover, this controlmethod seems quite straightforward to implement underreal world conditions, since sea state characteristics donot in reality change abruptly, and adjusting dampingbased on a direct evaluation of the sea state can beeasily conceived. Optimization results on the peak powerdesign (high levels for the power electronic converter) andin terms of electromagnetic generator mass, with a verylarge number of poles, were compared across the variouscontrol modes. The viscous damping and leveling controltherefore appear to be the most promising, although con-siderable work still needs to be carried out. Power levelingactually requires a field-weakening operating range, andthe autopilot angle parameter is to be included in theoptimization approach. The incorporation of all systemexecution constraints will moreover make it possible to de-termine which electromagnetic conversion structures andelectromechanical architecture work best for optimal leverintegration. The design methodology described in thisarticle can thus be reused with the specific design modelsof the selected structure. Two PTO technologies have beenpresented: hydroelectric and the all-electric. For now, it isdifficult to compare the two solutions objectively withoutany real system optimization.
References
[1] T. THORPE, Wave Energy, Chap. 15 of 2004 Survey of EnergyResources, World Energy Council, 2004, pp. 401-417.
[2] http://www.ifremer.fr/anglais/
[3] A. BABARIT, Hydrodynamic optimisation and optimalcontrol of a wave energy converter, In French Optimisationhydrodynamique et contrele optimal d’un recuperateur d’energiedes vagues, Thesis, 2005.
[4] A.H. CLEMENT and al., French patent, Autonomous electricalsystem for wave energy conversion, In French Systeme ElectriqueAutonome de Recuperation de l’Energie des Vagues, 2004.
[5] B. MOLIN Hydrodynamic of offshore structures, in FrenchEditions TECHNIP, Paris, 2002.
[6] J. FALNES, Ocean Waves and Oscillating Systems: linearinteractions including wave-energy extraction, CambridgeUniversity Press, 2002.
[7] C. JOSSET, A. BABARIT and A.H. CLEMENT, A Wave-to-Wire model of the SEAREV Wave Energy Converter, Journalof Engineering for the Maritime Environment, accepted forpublication in Nov. ’06.
[8] A. BABARIT, A.H. CLEMENT, Shape optimization of theSEAREV Wave Energy Converter, 9th World RenewableEnergy Congress, Florence, 2006.
[9] M. RUELLAN, H. BEN AHMED, B. MULTON, A BABARITand A.H. CLEMENT, Control influence on electromagneticgenerator pre-design for wave energy converter. ICEM 2006,Chania, CD-ROM Proc., Sept. 2-5, 2006, 7 p.
[10] J. HALS, T. BJARTE-LARSSON, J. FALNES. Optimumreactive control and control by latching of a wave-absorbingsemisubmerged heaving sphere. Proc. of OMAES02, 21stInternational Conference on Offshore Mechanics and ArcticEngineering, pages 1U9, June 2002.
hal-0
0528
937,
ver
sion
1 -
22 O
ct 2
010

9
[11] J. REGNIER, B. SARENI, X. ROBOAM and S. ASTIER,Optimal design of electrical engineering systems using ParetoGenetic Algorithms, 10th European Conference on PowerElectronics and Applications, Toulouse, 2003.
[12] E. FITAN, F. MESSINE, B. NOGAREDE, The electromagneticactuator design problem: a general and rational approach. IEEETransactions on Magnetics, Volume 40, No. 3, May 2004.
[13] M.A. MUELLER, H. POLINDER, N. BAKER, Current andNovel Electrical Generator Technology for Marine RenewableEnergy Applications. IEMDC 2007, Antalya, CD-ROM Proc.,Mai, 2007, 6 p.
hal-0
0528
937,
ver
sion
1 -
22 O
ct 2
010