
Experimental and numerical investigation of non-predictive phase-control strategies for a...
18
This article appeared in a journal published by Elsevier. The attached copy is furnished to the author for internal non-commercial research and education use, including for instruction at the authors institution and sharing with colleagues. Other uses, including reproduction and distribution, or selling or licensing copies, or posting to personal, institutional or third party websites are prohibited. In most cases authors are permitted to post their version of the article (e.g. in Word or Tex form) to their personal website or institutional repository. Authors requiring further information regarding Elsevier’s archiving and manuscript policies are encouraged to visit: http://www.elsevier.com/copyright
Transcript of Experimental and numerical investigation of non-predictive phase-control strategies for a...

This article appeared in a journal published by Elsevier. The attachedcopy is furnished to the author for internal non-commercial researchand education use, including for instruction at the authors institution
and sharing with colleagues.
Other uses, including reproduction and distribution, or selling orlicensing copies, or posting to personal, institutional or third party
websites are prohibited.
In most cases authors are permitted to post their version of thearticle (e.g. in Word or Tex form) to their personal website orinstitutional repository. Authors requiring further information
regarding Elsevier’s archiving and manuscript policies areencouraged to visit:
http://www.elsevier.com/copyright
Author's personal copy
Experimental and numerical investigation of non-predictive phase-controlstrategies for a point-absorbing wave energy converter
M.F.P. Lopes a,�, J. Hals b, R.P.F. Gomes a, T. Moan b, L.M.C. Gato a, A.F.de O. Falcao a
a IDMEC, Instituto Superior Tecnico, Technical University of Lisbon, 1049-001 Lisbon, Portugalb CeSOS, Norwegian University of Science and Technology NTNU, NO-7491 Trondheim, Norway
a r t i c l e i n f o
Article history:
Received 31 July 2008
Accepted 18 January 2009Available online 1 February 2009
Keywords:
Ocean waves
Wave energy
Latching control
Point-absorber
Threshold unlatching
Oscillating water column
a b s t r a c t
Phase control may substantially increase the power absorption in point-absorber wave energy
converters. This study deals with validation of dynamic models and latching control algorithms for an
oscillating water column (OWC) inside a fixed vertical tube of small circular cross-section by small-scale
testing. The paper describes experimental and numerical results for the system’s dynamics, using
simple and practical latching control techniques that do not require the prediction of waves or wave
forces, and which will be relevant to any type of point-absorbing devices.
In the experimental set-up, the upper end of the tube was equipped with an outlet duct and
a shut-off valve, which could be controlled to give a latching of the inner free surface movement. The
pressure drop through the open valve is used as a simplified measure of the energy extraction. The
control was realized by using the real-time measurement signals for the inner and outer surface
displacement.
A mathematical model of the system was established and applied in numerical simulation. In the
case the OWC’s diameter is much smaller than the wavelength and the wave amplitude much smaller
than the draft, the free surface movement inside the tube can be described as an oscillating weightless
piston. For this hydrodynamic problem an analytical solution is known. In addition, the mathematical
model includes the effects of viscous flow losses, the air compressibility inside the chamber and the
pressure drop across the valve. Experimental results were used to calibrate some of the model
parameters, and the total model was formulated as a coupled system of six non-linear, first-order
differential equations. Time-domain integration was used to simulate the system in order to test the
control strategies and compare with experimental results.
& 2009 Elsevier Ltd. All rights reserved.
1. Introduction
Point-absorbing wave energy converters have been studiedsince the late 1970s, including testing at laboratory scale andunder real-sea conditions. Presently there are several conceptsunder development within this category.
An oscillating water column (OWC) device in the formof a vertical tube of small circular cross-section is a geometricallysimple point absorber that was studied analytically in thefrequency domain by Evans (1978). He obtained a solutionfor the hydrodynamic coefficients based on linear waterwave theory by assuming a small radius compared with thecylinder draft and with the wavelength. Since sloshing isnot significant at frequencies relevant for wave energy conver-
sion for these conditions, the movement of the inner freesurface is practically identical to that of a weightless piston, oreven to the motion of a heaving body in waves. His formulationalso includes the possibility of adding a force on the conceptualpiston, which could for instance be modelled as a linearinertia–spring–dashpot system representing a power take-off(PTO) mechanism.
This simplified theoretical model was later improved byconsidering a uniform pressure distribution on the inner freesurface (Sarmento and Falcao, 1985; Evans, 1982), which yields amore realistic representation of the (in general non-flat) freesurface shape. Numerical codes based on the boundary elementmethod were developed and applied to model the OWC hydro-dynamics assuming a uniform distribution of the pressure on theinner free surface (Delaure and Lewis, 2003; Lopes et al., 2007).The effect of air compressibility was found to be relevant in full-sized OWCs (Sarmento and Falcao, 1985). A time-domainrepresentation can be developed from the frequency-domainmodel by applying Fourier transform techniques. This formulation
ARTICLE IN PRESS
Contents lists available at ScienceDirect
journal homepage: www.elsevier.com/locate/oceaneng
Ocean Engineering
0029-8018/$ - see front matter & 2009 Elsevier Ltd. All rights reserved.
doi:10.1016/j.oceaneng.2009.01.015
� Corresponding author. Tel.: +351 218417273.
E-mail addresses: [email protected] (M.F.P. Lopes),
[email protected] (J. Hals).
Ocean Engineering 36 (2009) 386–402
Author's personal copy
is required in order to deal with a non-linear PTO mechanism, andis an appropriate tool to model the energy absorption fromirregular waves.
The amount of power absorbed from ocean waves by anoscillating body is governed by the amplitude and phase of theoscillation relative to the wave. Thus, the absorption can beoptimized by controlling the amplitude, and, when not inresonance, also the phase of motion. Several strategies have beenproposed for approaching the theoretically optimal controller,which is non-causal, and a review of the theoretical basis is givenby Falnes (2002b). Causal implementations have been describedand tested by various authors, of which some of the most recentare Perdigao (1998), Gieske (2007), Valerio et al. (2007), andSchoen et al. (2008a, b). An early proposal (Falnes and Budal,1978), which is further investigated here, was the latching control
technique where the relative motion between the body and thereference is stopped during specified parts of a wave cycle.Originally, it was counting on a prediction of the wave force forthe determination of the unlatching instants. Latching control hascontinued to receive attention (see e.g. Korde, 2002; Mundon etal., 2005; Babarit and Clement, 2006; Falcao, 2007), and has stillthe potential to become a viable solution for application to waveenergy devices due to its possible easy implementation and highperformance.
There are several ways of defining a latching strategy.A common feature for all of them is that they aim at implement-ing, accurately or approximately, what in optimal controlterminology is identified as ‘bang-bang’ control. Earlierresearch (Hoskin and Nichols, 1986) showed that if we restrictourselves to control only the damping coefficient of the PTOsystem, bang-bang control is the optimal strategy. This means thatthe control output jumps between two values—one low andone high. The high damping should be set when the velocityof the oscillator becomes zero, leading to a latching of the motion,and the change to the low value (unlatching) should be suchthat the velocity of the oscillator falls into phase with theexcitation force.
A model for the application of latching control to the airflow ofOWC type wave energy converters has been presented by Jefferysand Whittaker (1986). In their paper, the effect of air compres-sibility is accounted for. They showed that it has significantinfluence on the system’s behavior, as the stiffness of the airchamber is not very different from the hydrodynamic stiffness ofthe water column. An approximate method was used for theoptimization of the latching instants.
The problem of simultaneous scaling of hydrodynamics andcompressibility effects in small-scale experiments on OWCs wasaddressed by Weber (2007), who highlighted the fact that the aircompressibility cannot be accurately represented by geometricalscaling of the device.
The modelling of the thermodynamic processes related to theair compression and the airflow in and out of the chamber in anOWC was described in detail in Falcao and Justino (1999). Thiswork shows that a complete modelling of these processes iscomplex and depends on the flow direction (in- or outflow).
Experimental results for latching strategies have previouslybeen reported. Budal et al. (1979) made an early demonstration ofthe importance of phase control and the benefit of latching theoscillator motion, with subsequent developments reported inBudal and Falnes (1982). Further, Bjarte-Larsson et al. (2002)applied this principle to a hybrid OWC/buoy device with ahydraulic PTO. Bjarte-Larsson and Falnes (2006) performedexperiments with a point absorber. Experimental results forlatching control of a pitching device are reported by Durandet al. (2007).
2. Mathematical model
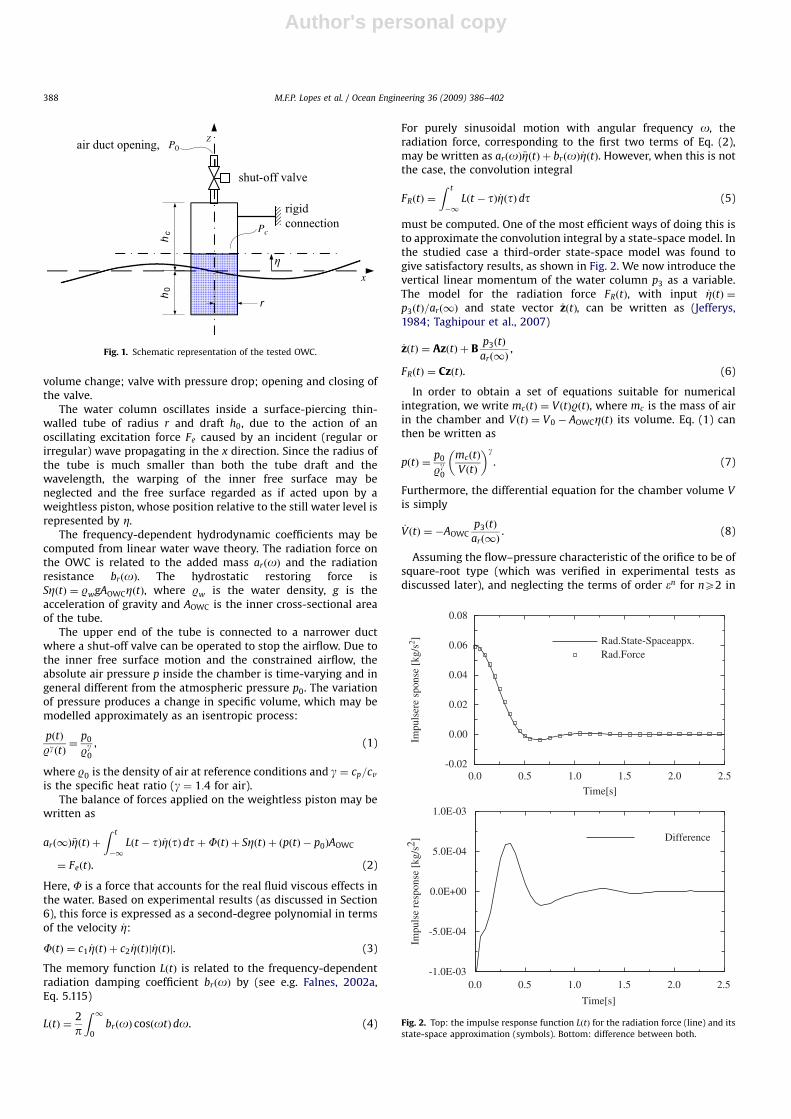
A schematic representation of the OWC geometry underconsideration is shown in Fig. 1. The following effects are includedin the mathematical model of the laboratory set-up: hydrody-namic forces (excitation and radiation); hydrostatic buoyancy;viscous loss in water; air chamber compressibility with mass and
ARTICLE IN PRESS
Nomenclature
A, B, C state-space matrices for approximation of FR
AOWC waterplane area of OWCAv nominal valve areaar added massar1 added mass at infinite frequencybr radiation resistanceCdc valve discharge coefficientc1 linear term constant for Fc2 quadratic term constant for Ff frequencyf e energy frequency, f e ¼ 1=Te
Fe excitation forceFR convolution part of radiation forceg acceleration of gravityH wave heightHs significant wave heighthc chamber heighth0 tube draftLðtÞ radiation memory functionkv valve state, ‘open’ ¼ 1, ‘closed’ ¼ 0kc stiffness of air chamberm massmc mass of air in the chamber
Pu useful powerp air pressurep0 pressure at reference conditionspc air pressure in the chamberp3 vertical linear momentum of the water columnr tube inner radiusro tube outer radiusS hydrostatic stiffnessT periodTe energy periodt time variableV volumex horizontal coordinatez sate vector for approximation of FR, here: size 3� 1g specific heat ratio for airg0 JONSWAP spectrum shape factoro angular frequencyZ vertical displacement of OWCRw water densityR air densityR0 air density reference conditionst time integration variabletd delay for operation of valveF viscous forceon natural frequency of chamber oscillation
M.F.P. Lopes et al. / Ocean Engineering 36 (2009) 386–402 387
Author's personal copy
volume change; valve with pressure drop; opening and closing ofthe valve.
The water column oscillates inside a surface-piercing thin-walled tube of radius r and draft h0, due to the action of anoscillating excitation force Fe caused by an incident (regular orirregular) wave propagating in the x direction. Since the radius ofthe tube is much smaller than both the tube draft and thewavelength, the warping of the inner free surface may beneglected and the free surface regarded as if acted upon by aweightless piston, whose position relative to the still water level isrepresented by Z.
The frequency-dependent hydrodynamic coefficients may becomputed from linear water wave theory. The radiation force onthe OWC is related to the added mass arðoÞ and the radiationresistance brðoÞ. The hydrostatic restoring force isSZðtÞ ¼ RwgAOWCZðtÞ, where Rw is the water density, g is theacceleration of gravity and AOWC is the inner cross-sectional areaof the tube.
The upper end of the tube is connected to a narrower ductwhere a shut-off valve can be operated to stop the airflow. Due tothe inner free surface motion and the constrained airflow, theabsolute air pressure p inside the chamber is time-varying and ingeneral different from the atmospheric pressure p0. The variationof pressure produces a change in specific volume, which may bemodelled approximately as an isentropic process:
pðtÞ
RgðtÞ¼
p0
Rg0, (1)
where R0 is the density of air at reference conditions and g ¼ cp=cv
is the specific heat ratio (g ¼ 1:4 for air).The balance of forces applied on the weightless piston may be
written as
arð1Þ €ZðtÞ þZ t
�1
Lðt � tÞ _ZðtÞdtþFðtÞ þ SZðtÞ þ ðpðtÞ � p0ÞAOWC
¼ FeðtÞ. (2)
Here, F is a force that accounts for the real fluid viscous effects inthe water. Based on experimental results (as discussed in Section6), this force is expressed as a second-degree polynomial in termsof the velocity _Z:
FðtÞ ¼ c1 _ZðtÞ þ c2 _ZðtÞj _ZðtÞj. (3)
The memory function LðtÞ is related to the frequency-dependentradiation damping coefficient brðoÞ by (see e.g. Falnes, 2002a,Eq. 5.115)
LðtÞ ¼2
p
Z 10
brðoÞ cosðotÞdo. (4)
For purely sinusoidal motion with angular frequency o, theradiation force, corresponding to the first two terms of Eq. (2),may be written as arðoÞ €ZðtÞ þ brðoÞ _ZðtÞ. However, when this is notthe case, the convolution integral
FRðtÞ ¼
Z t
�1
Lðt � tÞ _ZðtÞ dt (5)
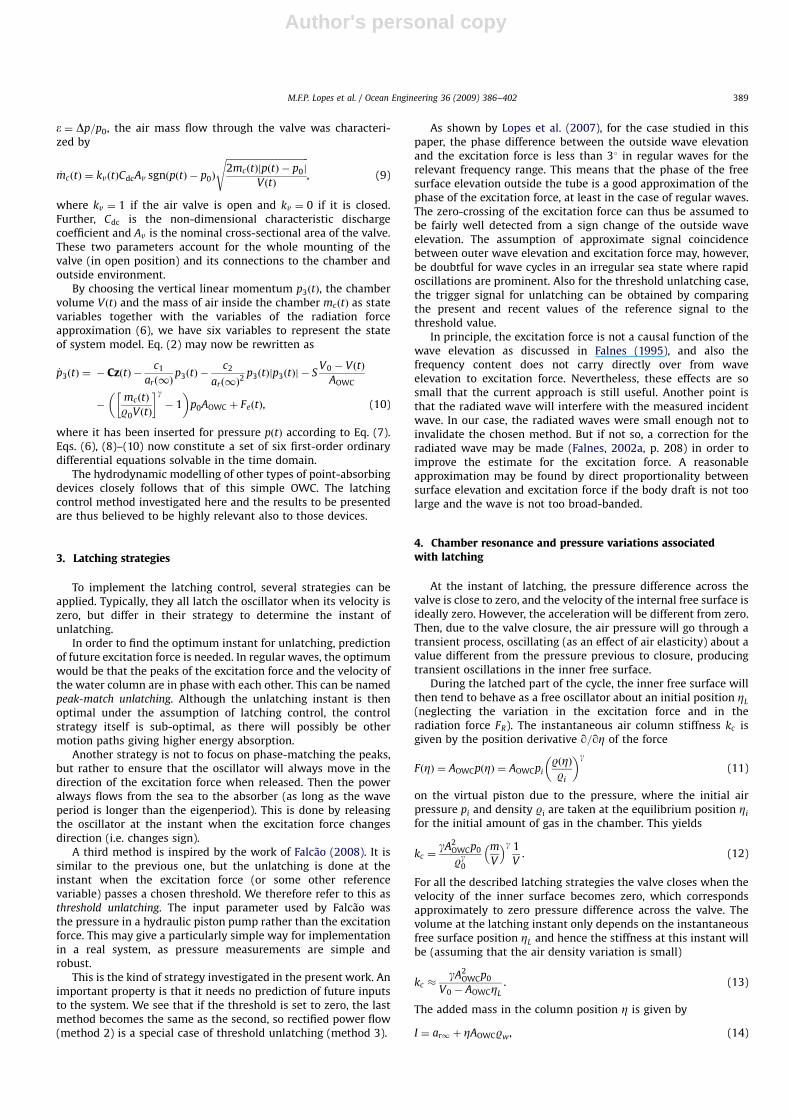
must be computed. One of the most efficient ways of doing this isto approximate the convolution integral by a state-space model. Inthe studied case a third-order state-space model was found togive satisfactory results, as shown in Fig. 2. We now introduce thevertical linear momentum of the water column p3 as a variable.The model for the radiation force FRðtÞ, with input _ZðtÞ ¼p3ðtÞ=arð1Þ and state vector _zðtÞ, can be written as (Jefferys,1984; Taghipour et al., 2007)
_zðtÞ ¼ AzðtÞ þ Bp3ðtÞ
arð1Þ,
FRðtÞ ¼ CzðtÞ. (6)
In order to obtain a set of equations suitable for numericalintegration, we write mcðtÞ ¼ VðtÞRðtÞ, where mc is the mass of airin the chamber and VðtÞ ¼ V0 � AOWCZðtÞ its volume. Eq. (1) canthen be written as
pðtÞ ¼p0
Rg0
mcðtÞ
VðtÞ
� �g. (7)
Furthermore, the differential equation for the chamber volume V
is simply
_VðtÞ ¼ �AOWCp3ðtÞ
arð1Þ. (8)
Assuming the flow–pressure characteristic of the orifice to be ofsquare-root type (which was verified in experimental tests asdiscussed later), and neglecting the terms of order en for nX2 in
ARTICLE IN PRESS
Fig. 1. Schematic representation of the tested OWC.
Time[s]
Impu
lser
e sp
onse
[kg
/s2 ]
0.0 0.5 1.0 1.5 2.0 2.5-0.02
0.00
0.02
0.04
0.06
0.08
Rad.State-Spaceappx.Rad.Force
Time[s]
Impu
lse
resp
onse
[kg
/s2 ]
0.0 0.5 1.0 1.5 2.0 2.5-1.0E-03
-5.0E-04
0.0E+00
5.0E-04
1.0E-03
Difference
Fig. 2. Top: the impulse response function LðtÞ for the radiation force (line) and its
state-space approximation (symbols). Bottom: difference between both.
M.F.P. Lopes et al. / Ocean Engineering 36 (2009) 386–402388
Author's personal copy
e ¼ Dp=p0, the air mass flow through the valve was characteri-zed by
_mcðtÞ ¼ kvðtÞCdcAv sgnðpðtÞ � p0Þ
ffiffiffiffiffiffiffiffiffiffiffiffiffiffiffiffiffiffiffiffiffiffiffiffiffiffiffiffiffiffiffiffiffiffiffiffi2mcðtÞjpðtÞ � p0j
VðtÞ
s, (9)
where kv ¼ 1 if the air valve is open and kv ¼ 0 if it is closed.Further, Cdc is the non-dimensional characteristic dischargecoefficient and Av is the nominal cross-sectional area of the valve.These two parameters account for the whole mounting of thevalve (in open position) and its connections to the chamber andoutside environment.
By choosing the vertical linear momentum p3ðtÞ, the chambervolume VðtÞ and the mass of air inside the chamber mcðtÞ as statevariables together with the variables of the radiation forceapproximation (6), we have six variables to represent the stateof system model. Eq. (2) may now be rewritten as
_p3ðtÞ ¼ � CzðtÞ �c1
arð1Þp3ðtÞ �
c2
arð1Þ2
p3ðtÞjp3ðtÞj � SV0 � VðtÞ
AOWC
�mcðtÞ
R0VðtÞ
� �g� 1
� �p0AOWC þ FeðtÞ, (10)
where it has been inserted for pressure pðtÞ according to Eq. (7).Eqs. (6), (8)–(10) now constitute a set of six first-order ordinarydifferential equations solvable in the time domain.
The hydrodynamic modelling of other types of point-absorbingdevices closely follows that of this simple OWC. The latchingcontrol method investigated here and the results to be presentedare thus believed to be highly relevant also to those devices.
3. Latching strategies
To implement the latching control, several strategies can beapplied. Typically, they all latch the oscillator when its velocity iszero, but differ in their strategy to determine the instant ofunlatching.
In order to find the optimum instant for unlatching, predictionof future excitation force is needed. In regular waves, the optimumwould be that the peaks of the excitation force and the velocity ofthe water column are in phase with each other. This can be namedpeak-match unlatching. Although the unlatching instant is thenoptimal under the assumption of latching control, the controlstrategy itself is sub-optimal, as there will possibly be othermotion paths giving higher energy absorption.
Another strategy is not to focus on phase-matching the peaks,but rather to ensure that the oscillator will always move in thedirection of the excitation force when released. Then the poweralways flows from the sea to the absorber (as long as the waveperiod is longer than the eigenperiod). This is done by releasingthe oscillator at the instant when the excitation force changesdirection (i.e. changes sign).
A third method is inspired by the work of Falcao (2008). It issimilar to the previous one, but the unlatching is done at theinstant when the excitation force (or some other referencevariable) passes a chosen threshold. We therefore refer to this asthreshold unlatching. The input parameter used by Falcao wasthe pressure in a hydraulic piston pump rather than the excitationforce. This may give a particularly simple way for implementationin a real system, as pressure measurements are simple androbust.
This is the kind of strategy investigated in the present work. Animportant property is that it needs no prediction of future inputsto the system. We see that if the threshold is set to zero, the lastmethod becomes the same as the second, so rectified power flow(method 2) is a special case of threshold unlatching (method 3).
As shown by Lopes et al. (2007), for the case studied in thispaper, the phase difference between the outside wave elevationand the excitation force is less than 31 in regular waves for therelevant frequency range. This means that the phase of the freesurface elevation outside the tube is a good approximation of thephase of the excitation force, at least in the case of regular waves.The zero-crossing of the excitation force can thus be assumed tobe fairly well detected from a sign change of the outside waveelevation. The assumption of approximate signal coincidencebetween outer wave elevation and excitation force may, however,be doubtful for wave cycles in an irregular sea state where rapidoscillations are prominent. Also for the threshold unlatching case,the trigger signal for unlatching can be obtained by comparingthe present and recent values of the reference signal to thethreshold value.
In principle, the excitation force is not a causal function of thewave elevation as discussed in Falnes (1995), and also thefrequency content does not carry directly over from waveelevation to excitation force. Nevertheless, these effects are sosmall that the current approach is still useful. Another point isthat the radiated wave will interfere with the measured incidentwave. In our case, the radiated waves were small enough not toinvalidate the chosen method. But if not so, a correction for theradiated wave may be made (Falnes, 2002a, p. 208) in order toimprove the estimate for the excitation force. A reasonableapproximation may be found by direct proportionality betweensurface elevation and excitation force if the body draft is not toolarge and the wave is not too broad-banded.
4. Chamber resonance and pressure variations associatedwith latching
At the instant of latching, the pressure difference across thevalve is close to zero, and the velocity of the internal free surface isideally zero. However, the acceleration will be different from zero.Then, due to the valve closure, the air pressure will go through atransient process, oscillating (as an effect of air elasticity) about avalue different from the pressure previous to closure, producingtransient oscillations in the inner free surface.
During the latched part of the cycle, the inner free surface willthen tend to behave as a free oscillator about an initial position ZL
(neglecting the variation in the excitation force and in theradiation force FR). The instantaneous air column stiffness kc isgiven by the position derivative q=qZ of the force
FðZÞ ¼ AOWCpðZÞ ¼ AOWCpi
RðZÞRi
� �g(11)
on the virtual piston due to the pressure, where the initial airpressure pi and density Ri are taken at the equilibrium position Zi
for the initial amount of gas in the chamber. This yields
kc ¼gA2
OWCp0
Rg0
m
V
� �g 1
V. (12)
For all the described latching strategies the valve closes when thevelocity of the inner surface becomes zero, which correspondsapproximately to zero pressure difference across the valve. Thevolume at the latching instant only depends on the instantaneousfree surface position ZL and hence the stiffness at this instant willbe (assuming that the air density variation is small)
kc �gA2
OWCp0
V0 � AOWCZL
. (13)
The added mass in the column position Z is given by
I ¼ ar1 þ ZAOWCRw, (14)
ARTICLE IN PRESS
M.F.P. Lopes et al. / Ocean Engineering 36 (2009) 386–402 389
Author's personal copy
where ar1 � arð1Þ. The term ZAOWCRw represents the change inadded mass due to the non-equilibrium position of the inner freesurface. The approximation ar1 � arð1Þ (0.417 kg) was found tobe acceptable for a narrow column in the range of frequencies ofinterest (Lopes et al., 2007). At a latched position the naturalfrequency of the oscillator is consequently, from the harmonicoscillator equation on ¼
ffiffiffiffiffiffiffiffiffikc=I
pand Eqs. (13) and (14):
on �
ffiffiffiffiffiffiffiffiffiffiffiffiffiffiffiffiffiffiffiffiffiffiffiffiffiffiffiffiffiffiffiffiffiffiffiffiffiffiffiffiffiffiffiffiffiffiffiffiffiffiffiffiffiffiffiffiffiffiffigA2
OWCp0
ðV0 � ZLAOWCÞðar1 þ ZARwÞ
s. (15)
The free surface tends to oscillate at the frequency givenby Eq. (15), in combination with variations associated with thechange of the excitation and radiation forces. In a stiff systemthis is a good approximation during the latched part of the cyclesince the variation in air density is small (which was used toobtain Eq. (13)).
The amplitude of the pressure variation is more significantwhen a high frequency on is associated with low stiffness kc . For aconstant cross-sectional area, this will typically occur for thelower latched positions where the mass is low, cf. Eq. (14). The fastvelocity variations can in some cases introduce rapid pressurefluctuations in the chamber.
The sudden opening of the valve introduces an effect thatshould be considered. The air burst that follows the opening of thevalve creates a propagating pressure disturbance whose passage isdetected at the measurement point (located half way between theinner free surface and the top of the tube), as well as its reflectionon the free surface. These pressure fluctuations, which will bemore significant for quicker maneuvres of the valve, together withthe resonance oscillation of the chamber pressure, make itdifficult to use the pressure measured in the chamber as a basisfor calculating a control signal. The same behavior is expected inhydraulic systems used for PTO. This means that we might have tolook for another input to the controller. For the present system agood alternative may be to measure the wave elevation close tothe device, as actually applied herein, or to use a submergedpressure transducer, and estimate the instantaneous excitationforce from these signals, as done for example by Budal et al.(1981).
5. Experimental model
A set of experiments was carried out in the wave flume of theLaboratory of Hydraulics and Water Resources (LHRH) of InstitutoSuperior Tecnico. This flume is 20 m long, 0.70 m wide and thewater depth was set to 0.50 m.
A fixed, vertical tube of circular cross-section was placed at adistance of 9 m from the piston wavemaker. The draft h0 was set to0.18 m and the height of the chamber hc was 0.33 m. The innerradius of the tube was 26 mm and the wall thickness 4 mm. Theupper end of the tube was covered with a removable airtightcovering plate with a centered 12.7 mm (half inch) diameterorifice connecting to a shut-off valve. The laboratory model wasnot intended to represent a practical full-scale device, so there isno fixed scale factor for geometry or forces.
The shut-off valve is externally piloted by 7 bar compressed airand controlled electrically. The standard valve opening andclosing time is specified by the manufacturer to be 29 ms.
The static pressure inside the chamber was measured by adifferential low-pressure manometer that allows measurementsup to 50 Hz and �200 Pa to be performed (thus the transienteffects due to valve operation were not accurately captured). Thesurface elevations were measured at a rate of 250 Hz withresistive water-level gauges, one attached to the wall inside the
tube and the other placed outside, aligned with the center of thetube (i.e. in the same cross-sectional plane of the flume), atdistance of about 0.105 m from the tube wall.
Recordings were made of the outside wave elevation, theinside column elevation, the chamber pressure relative to theambient pressure, and the control signal sent to the shut-off valve.Calibrations were done prior to each day of experiments. Based oncalibration methods and instrument resolutions, the uncertaintyof the wave elevation gauges is estimated to about 0.25 mm andthe pressure measurement to about 1 Pa.
The signals of the free surface displacement in and outside thetube were acquired by a data acquisition card connected to thewave gauges. A control program was developed in LabVIEW andrun on a separate computer to the one used to acquire the data.The result of the control computation (‘valve open’ or ‘valveclosed’) was transmitted through the data card’s analog output,driving a solid state relay that switches the valve state.
The implementation of the control system for the laboratoryset-up faced many of the difficulties associated with a latchingcontrol system for a full-scale device. As a small change in timinghas a large influence on the overall efficiency, overcoming theeffect of operational delays is crucial.
The response delay of the control emerges from two factors:the first—the acquisition delay—comes from the acquisition ofdata from sensors, and the finite update rate in the controlsoftware; the second—the operational delay td—is due to theexecution of valve commands, which are subject to relay and valvereaction times. Based on separate tests, the operational delay (dueto the relay and valve operation), was estimated to betd ¼ 160 ms. The delay in the pressure measurement wasestimated to be 64 ms.
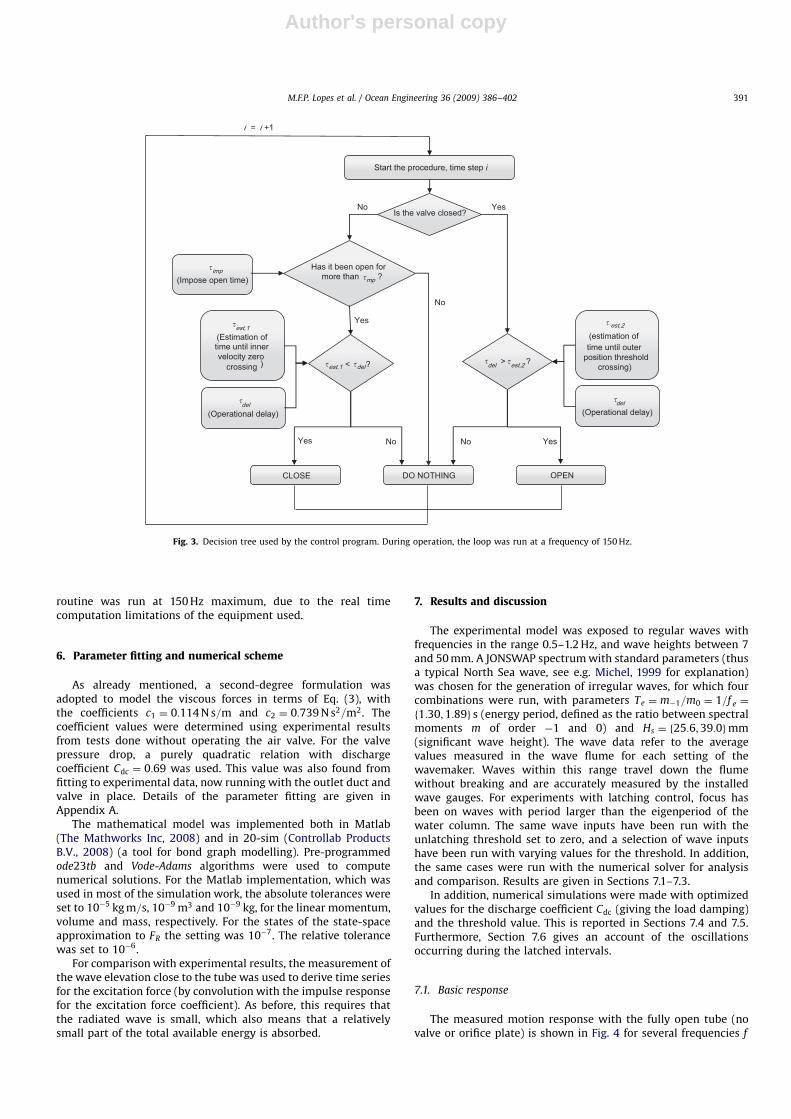
The control routine programmed in LabVIEW was based on thedecision tree represented in Fig. 3. The basic conditions are thefollowing: the valve closes when the inner velocity becomes zero;and it opens when the excitation force crosses a chosen threshold(with zero as the default value). As explained above, an estimationof the excitation force was found directly from the measurementof the wave outside the cylinder.
At the instant when the ‘open’ command is issued, the innervelocity is zero or floating around zero depending onthe air chamber stiffness and the time since it has been latched,and it will take some time before the column has gainedspeed. This implies the possibility that the ‘open’ command willbe immediately followed by a ‘close’ command. Instead, theopening command should prevail until the inner surface hasgained some speed. To take care of this, an ‘impose opentime’—timp—is included in the control routine. As the openingcommand is only effective after the operational delay, this impliesthat timp4td. In this case timp was set to 250 ms, which has provento be an effective value, even in irregular waves. However, the factthat this time is an important fraction of the cycle limits theperformance in irregular waves or waves of frequencies abovethe natural resonance frequency of the tested OWC, which isabout 1.14 Hz.
In this work a short-term anticipation strategy was used byidentifying an interval forward in time corresponding to theoperational delay. In the case of the outer free surface position,given the instantaneous position and velocity at certain time, thetime until next threshold crossing can be estimated by directextrapolation. This strategy is effective provided that the acquisi-tion rate is much larger than the wave frequency, or if analoguecircuits are used. In predicting the next velocity zero-crossing, thesame type of strategy was applied, using the instantaneousvelocity and acceleration. Here, both these signals were derivedfrom the position measurement, and filtering had to be applied toimprove the instantaneous acceleration signal. The whole control
ARTICLE IN PRESS
M.F.P. Lopes et al. / Ocean Engineering 36 (2009) 386–402390
Author's personal copy
routine was run at 150 Hz maximum, due to the real timecomputation limitations of the equipment used.
6. Parameter fitting and numerical scheme
As already mentioned, a second-degree formulation wasadopted to model the viscous forces in terms of Eq. (3), withthe coefficients c1 ¼ 0:114 N s=m and c2 ¼ 0:739 N s2=m2. Thecoefficient values were determined using experimental resultsfrom tests done without operating the air valve. For the valvepressure drop, a purely quadratic relation with dischargecoefficient Cdc ¼ 0:69 was used. This value was also found fromfitting to experimental data, now running with the outlet duct andvalve in place. Details of the parameter fitting are given inAppendix A.
The mathematical model was implemented both in Matlab(The Mathworks Inc, 2008) and in 20-sim (Controllab ProductsB.V., 2008) (a tool for bond graph modelling). Pre-programmedode23tb and Vode-Adams algorithms were used to computenumerical solutions. For the Matlab implementation, which wasused in most of the simulation work, the absolute tolerances wereset to 10�5 kg m=s, 10�9 m3 and 10�9 kg, for the linear momentum,volume and mass, respectively. For the states of the state-spaceapproximation to FR the setting was 10�7. The relative tolerancewas set to 10�6.
For comparison with experimental results, the measurement ofthe wave elevation close to the tube was used to derive time seriesfor the excitation force (by convolution with the impulse responsefor the excitation force coefficient). As before, this requires thatthe radiated wave is small, which also means that a relativelysmall part of the total available energy is absorbed.
7. Results and discussion
The experimental model was exposed to regular waves withfrequencies in the range 0.5–1.2 Hz, and wave heights between 7and 50 mm. A JONSWAP spectrum with standard parameters (thusa typical North Sea wave, see e.g. Michel, 1999 for explanation)was chosen for the generation of irregular waves, for which fourcombinations were run, with parameters Te ¼ m�1=m0 ¼ 1=f e ¼
f1:30;1:89g s (energy period, defined as the ratio between spectralmoments m of order �1 and 0) and Hs ¼ f25:6;39:0gmm(significant wave height). The wave data refer to the averagevalues measured in the wave flume for each setting of thewavemaker. Waves within this range travel down the flumewithout breaking and are accurately measured by the installedwave gauges. For experiments with latching control, focus hasbeen on waves with period larger than the eigenperiod of thewater column. The same wave inputs have been run with theunlatching threshold set to zero, and a selection of wave inputshave been run with varying values for the threshold. In addition,the same cases were run with the numerical solver for analysisand comparison. Results are given in Sections 7.1–7.3.
In addition, numerical simulations were made with optimizedvalues for the discharge coefficient Cdc (giving the load damping)and the threshold value. This is reported in Sections 7.4 and 7.5.Furthermore, Section 7.6 gives an account of the oscillationsoccurring during the latched intervals.
7.1. Basic response
The measured motion response with the fully open tube (novalve or orifice plate) is shown in Fig. 4 for several frequencies f
ARTICLE IN PRESS
Start the procedure, time step i
Is the valve closed?No
) est,1 < del?
No
Yes
del > est,2 ?
Yes
DO NOTHINGCLOSE OPEN
Yes YesNo No
i = i +1
Has it been open for more than mp ?�
imp(Impose open time)
�
est,1(Estimation of time until inner velocity zero
crossing
�
del(Operational delay)
�
� � � �
est,2
(estimation of time until outer
position threshold crossing)
�
del(Operational delay)
�
Fig. 3. Decision tree used by the control program. During operation, the loop was run at a frequency of 150 Hz.
M.F.P. Lopes et al. / Ocean Engineering 36 (2009) 386–402 391
Author's personal copy
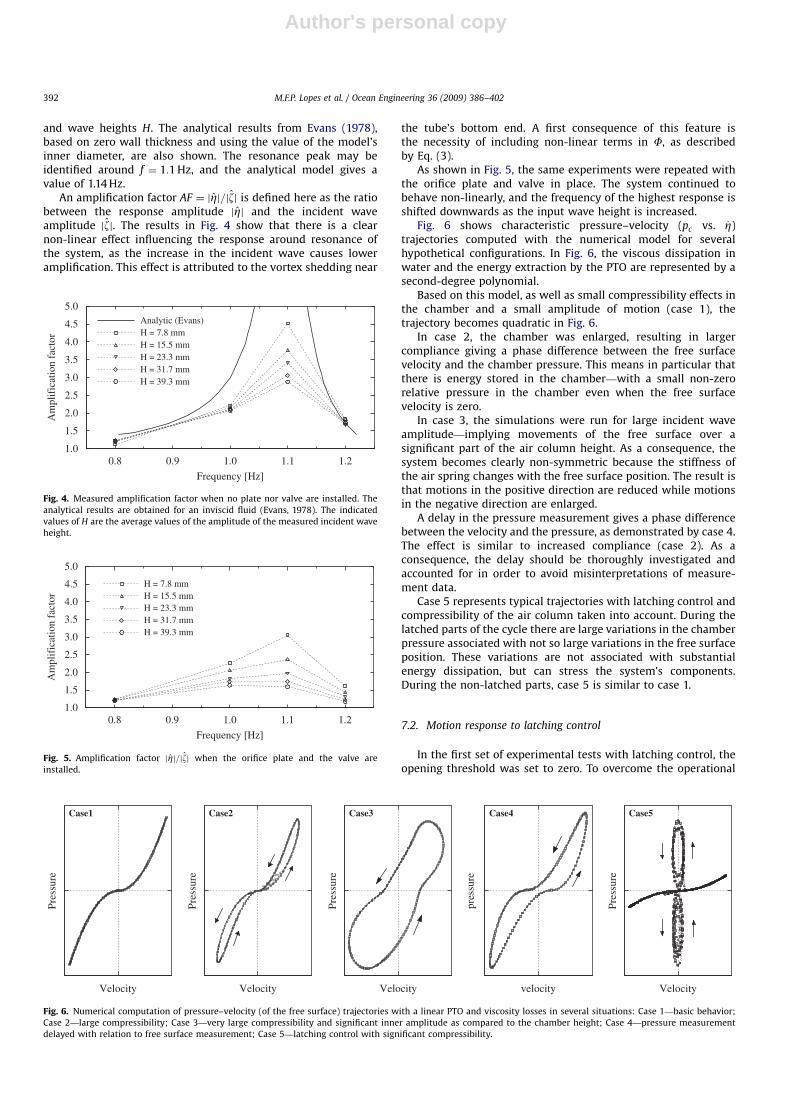
and wave heights H. The analytical results from Evans (1978),based on zero wall thickness and using the value of the model’sinner diameter, are also shown. The resonance peak may beidentified around f ¼ 1:1 Hz, and the analytical model gives avalue of 1.14 Hz.
An amplification factor AF ¼ jZj=jzj is defined here as the ratiobetween the response amplitude jZj and the incident waveamplitude jzj. The results in Fig. 4 show that there is a clearnon-linear effect influencing the response around resonance ofthe system, as the increase in the incident wave causes loweramplification. This effect is attributed to the vortex shedding near
the tube’s bottom end. A first consequence of this feature isthe necessity of including non-linear terms in F, as describedby Eq. (3).
As shown in Fig. 5, the same experiments were repeated withthe orifice plate and valve in place. The system continued tobehave non-linearly, and the frequency of the highest response isshifted downwards as the input wave height is increased.
Fig. 6 shows characteristic pressure–velocity (pc vs. _Z)trajectories computed with the numerical model for severalhypothetical configurations. In Fig. 6, the viscous dissipation inwater and the energy extraction by the PTO are represented by asecond-degree polynomial.
Based on this model, as well as small compressibility effects inthe chamber and a small amplitude of motion (case 1), thetrajectory becomes quadratic in Fig. 6.
In case 2, the chamber was enlarged, resulting in largercompliance giving a phase difference between the free surfacevelocity and the chamber pressure. This means in particular thatthere is energy stored in the chamber—with a small non-zerorelative pressure in the chamber even when the free surfacevelocity is zero.
In case 3, the simulations were run for large incident waveamplitude—implying movements of the free surface over asignificant part of the air column height. As a consequence, thesystem becomes clearly non-symmetric because the stiffness ofthe air spring changes with the free surface position. The result isthat motions in the positive direction are reduced while motionsin the negative direction are enlarged.
A delay in the pressure measurement gives a phase differencebetween the velocity and the pressure, as demonstrated by case 4.The effect is similar to increased compliance (case 2). As aconsequence, the delay should be thoroughly investigated andaccounted for in order to avoid misinterpretations of measure-ment data.
Case 5 represents typical trajectories with latching control andcompressibility of the air column taken into account. During thelatched parts of the cycle there are large variations in the chamberpressure associated with not so large variations in the free surfaceposition. These variations are not associated with substantialenergy dissipation, but can stress the system’s components.During the non-latched parts, case 5 is similar to case 1.
7.2. Motion response to latching control
In the first set of experimental tests with latching control, theopening threshold was set to zero. To overcome the operational
ARTICLE IN PRESS
Frequency [Hz]
0.8
Am
plif
icat
ion
fact
or
0.9 1.0 1.1 1.21.0
1.5
2.0
2.5
3.0
3.5
4.0
4.5
5.0Analytic (Evans)H = 7.8 mmH = 15.5 mmH = 23.3 mmH = 31.7 mmH = 39.3 mm
Fig. 4. Measured amplification factor when no plate nor valve are installed. The
analytical results are obtained for an inviscid fluid (Evans, 1978). The indicated
values of H are the average values of the amplitude of the measured incident wave
height.
Frequency [Hz]
Am
plif
icat
ion
fact
or
0.8 0.9 1.0 1.1 1.2
H = 7.8 mm
1.0
1.5
2.0
2.5
3.0
3.5
4.0
4.5
5.0
H = 15.5 mmH = 23.3 mmH = 31.7 mmH = 39.3 mm
Fig. 5. Amplification factor jZj=jzj when the orifice plate and the valve are
installed.
Velocity
Pres
sure
Case1
Velocity
Pres
sure
Case2
Velocity
Pres
sure
Case3
velocity
pres
sure
Case4
Velocity
Pres
sure
Case5
Fig. 6. Numerical computation of pressure–velocity (of the free surface) trajectories with a linear PTO and viscosity losses in several situations: Case 1—basic behavior;
Case 2—large compressibility; Case 3—very large compressibility and significant inner amplitude as compared to the chamber height; Case 4—pressure measurement
delayed with relation to free surface measurement; Case 5—latching control with significant compressibility.
M.F.P. Lopes et al. / Ocean Engineering 36 (2009) 386–402392
Author's personal copy
delays, the control algorithm was run according to the proceduredescribed in Fig. 3. The algorithm aims to close the valve when thevelocity of the inner free surface crosses zero, and to open it whenthe outside elevation is zero (which is close to a zero excitationforce situation). This makes the phase difference betweenexcitation force and velocity closer to optimum, and as aconsequence larger amplification and maximum velocities areachieved.
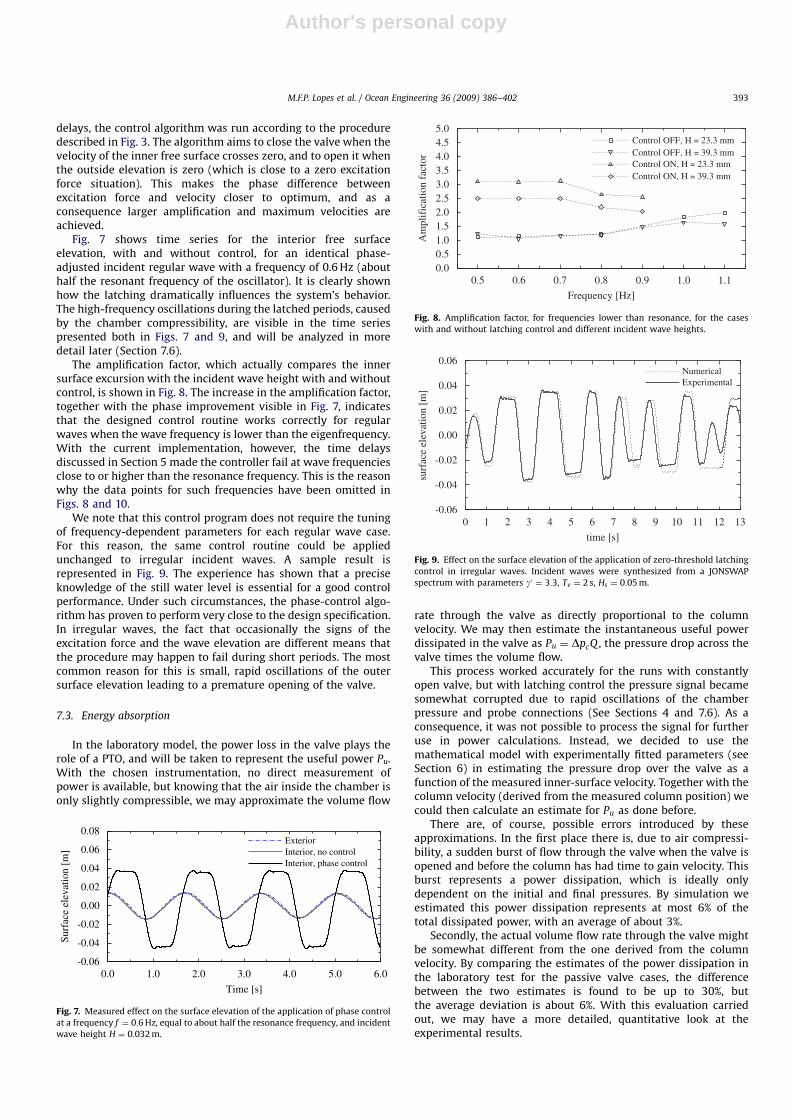
Fig. 7 shows time series for the interior free surfaceelevation, with and without control, for an identical phase-adjusted incident regular wave with a frequency of 0.6 Hz (abouthalf the resonant frequency of the oscillator). It is clearly shownhow the latching dramatically influences the system’s behavior.The high-frequency oscillations during the latched periods, causedby the chamber compressibility, are visible in the time seriespresented both in Figs. 7 and 9, and will be analyzed in moredetail later (Section 7.6).
The amplification factor, which actually compares the innersurface excursion with the incident wave height with and withoutcontrol, is shown in Fig. 8. The increase in the amplification factor,together with the phase improvement visible in Fig. 7, indicatesthat the designed control routine works correctly for regularwaves when the wave frequency is lower than the eigenfrequency.With the current implementation, however, the time delaysdiscussed in Section 5 made the controller fail at wave frequenciesclose to or higher than the resonance frequency. This is the reasonwhy the data points for such frequencies have been omitted inFigs. 8 and 10.
We note that this control program does not require the tuningof frequency-dependent parameters for each regular wave case.For this reason, the same control routine could be appliedunchanged to irregular incident waves. A sample result isrepresented in Fig. 9. The experience has shown that a preciseknowledge of the still water level is essential for a good controlperformance. Under such circumstances, the phase-control algo-rithm has proven to perform very close to the design specification.In irregular waves, the fact that occasionally the signs of theexcitation force and the wave elevation are different means thatthe procedure may happen to fail during short periods. The mostcommon reason for this is small, rapid oscillations of the outersurface elevation leading to a premature opening of the valve.
7.3. Energy absorption
In the laboratory model, the power loss in the valve plays therole of a PTO, and will be taken to represent the useful power Pu.With the chosen instrumentation, no direct measurement ofpower is available, but knowing that the air inside the chamber isonly slightly compressible, we may approximate the volume flow
rate through the valve as directly proportional to the columnvelocity. We may then estimate the instantaneous useful powerdissipated in the valve as Pu ¼ DpcQ , the pressure drop across thevalve times the volume flow.
This process worked accurately for the runs with constantlyopen valve, but with latching control the pressure signal becamesomewhat corrupted due to rapid oscillations of the chamberpressure and probe connections (See Sections 4 and 7.6). As aconsequence, it was not possible to process the signal for furtheruse in power calculations. Instead, we decided to use themathematical model with experimentally fitted parameters (seeSection 6) in estimating the pressure drop over the valve as afunction of the measured inner-surface velocity. Together with thecolumn velocity (derived from the measured column position) wecould then calculate an estimate for Pu as done before.
There are, of course, possible errors introduced by theseapproximations. In the first place there is, due to air compressi-bility, a sudden burst of flow through the valve when the valve isopened and before the column has had time to gain velocity. Thisburst represents a power dissipation, which is ideally onlydependent on the initial and final pressures. By simulation weestimated this power dissipation represents at most 6% of thetotal dissipated power, with an average of about 3%.
Secondly, the actual volume flow rate through the valve mightbe somewhat different from the one derived from the columnvelocity. By comparing the estimates of the power dissipation inthe laboratory test for the passive valve cases, the differencebetween the two estimates is found to be up to 30%, butthe average deviation is about 6%. With this evaluation carriedout, we may have a more detailed, quantitative look at theexperimental results.
ARTICLE IN PRESS
Time [s]
Surf
ace
elev
atio
n [m
]
0.0 1.0 2.0 3.0 4.0 5.0 6.0
Exterior
-0.06
-0.04
-0.02
0.00
0.02
0.04
0.06
0.08
Interior, no controlInterior, phase control
Fig. 7. Measured effect on the surface elevation of the application of phase control
at a frequency f ¼ 0:6 Hz, equal to about half the resonance frequency, and incident
wave height H ¼ 0:032 m.
Frequency [Hz]
Am
plif
icat
ion
fact
or
0.5 0.6 0.7 0.8 0.9 1.0 1.10.00.51.01.52.02.53.03.54.04.55.0
Control OFF, H = 23.3 mmControl OFF, H = 39.3 mmControl ON, H = 23.3 mmControl ON, H = 39.3 mm
Fig. 8. Amplification factor, for frequencies lower than resonance, for the cases
with and without latching control and different incident wave heights.
time [s]
surf
ace
elev
atio
n [m
]
0 1 2 3 4 5 6 7 8 9 10 11 12 13-0.06
-0.04
-0.02
0.00
0.02
0.04
0.06NumericalExperimental
Fig. 9. Effect on the surface elevation of the application of zero-threshold latching
control in irregular waves. Incident waves were synthesized from a JONSWAP
spectrum with parameters g0 ¼ 3:3, Te ¼ 2 s, Hs ¼ 0:05 m.
M.F.P. Lopes et al. / Ocean Engineering 36 (2009) 386–402 393
Author's personal copy
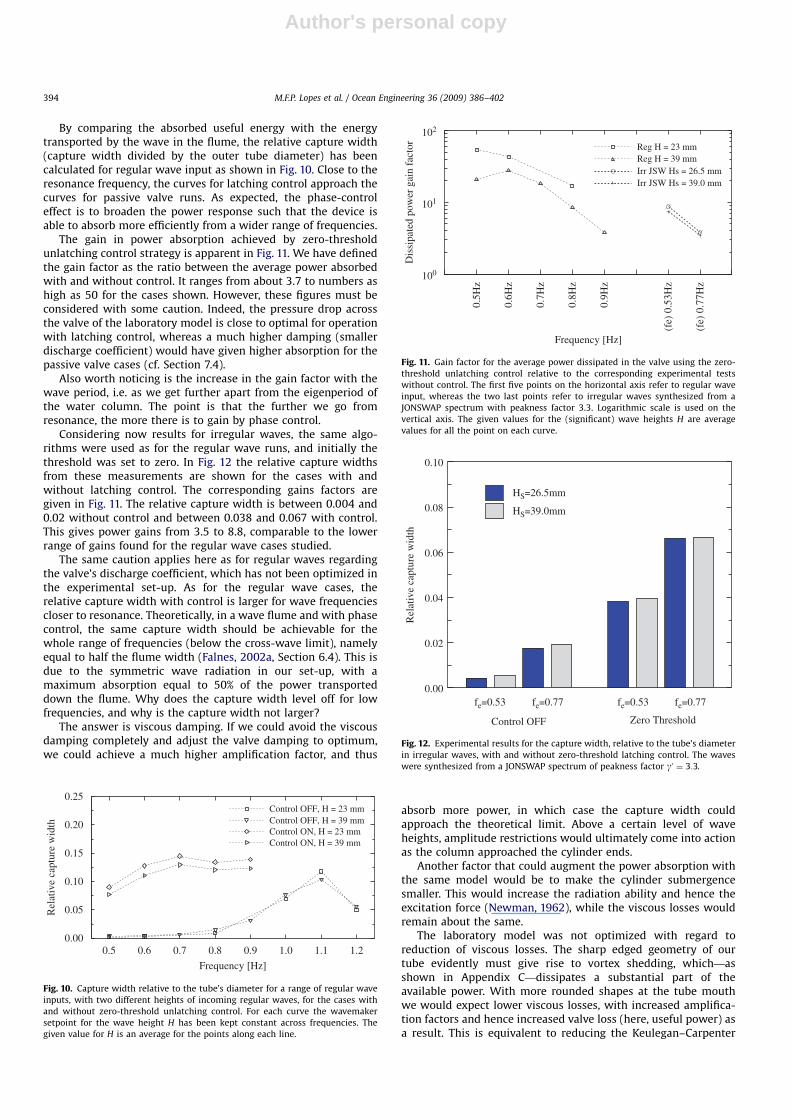
By comparing the absorbed useful energy with the energytransported by the wave in the flume, the relative capture width(capture width divided by the outer tube diameter) has beencalculated for regular wave input as shown in Fig. 10. Close to theresonance frequency, the curves for latching control approach thecurves for passive valve runs. As expected, the phase-controleffect is to broaden the power response such that the device isable to absorb more efficiently from a wider range of frequencies.
The gain in power absorption achieved by zero-thresholdunlatching control strategy is apparent in Fig. 11. We have definedthe gain factor as the ratio between the average power absorbedwith and without control. It ranges from about 3.7 to numbers ashigh as 50 for the cases shown. However, these figures must beconsidered with some caution. Indeed, the pressure drop acrossthe valve of the laboratory model is close to optimal for operationwith latching control, whereas a much higher damping (smallerdischarge coefficient) would have given higher absorption for thepassive valve cases (cf. Section 7.4).
Also worth noticing is the increase in the gain factor with thewave period, i.e. as we get further apart from the eigenperiod ofthe water column. The point is that the further we go fromresonance, the more there is to gain by phase control.
Considering now results for irregular waves, the same algo-rithms were used as for the regular wave runs, and initially thethreshold was set to zero. In Fig. 12 the relative capture widthsfrom these measurements are shown for the cases with andwithout latching control. The corresponding gains factors aregiven in Fig. 11. The relative capture width is between 0.004 and0.02 without control and between 0.038 and 0.067 with control.This gives power gains from 3.5 to 8.8, comparable to the lowerrange of gains found for the regular wave cases studied.
The same caution applies here as for regular waves regardingthe valve’s discharge coefficient, which has not been optimized inthe experimental set-up. As for the regular wave cases, therelative capture width with control is larger for wave frequenciescloser to resonance. Theoretically, in a wave flume and with phasecontrol, the same capture width should be achievable for thewhole range of frequencies (below the cross-wave limit), namelyequal to half the flume width (Falnes, 2002a, Section 6.4). This isdue to the symmetric wave radiation in our set-up, with amaximum absorption equal to 50% of the power transporteddown the flume. Why does the capture width level off for lowfrequencies, and why is the capture width not larger?
The answer is viscous damping. If we could avoid the viscousdamping completely and adjust the valve damping to optimum,we could achieve a much higher amplification factor, and thus
absorb more power, in which case the capture width couldapproach the theoretical limit. Above a certain level of waveheights, amplitude restrictions would ultimately come into actionas the column approached the cylinder ends.
Another factor that could augment the power absorption withthe same model would be to make the cylinder submergencesmaller. This would increase the radiation ability and hence theexcitation force (Newman, 1962), while the viscous losses wouldremain about the same.
The laboratory model was not optimized with regard toreduction of viscous losses. The sharp edged geometry of ourtube evidently must give rise to vortex shedding, which—asshown in Appendix C—dissipates a substantial part of theavailable power. With more rounded shapes at the tube mouthwe would expect lower viscous losses, with increased amplifica-tion factors and hence increased valve loss (here, useful power) asa result. This is equivalent to reducing the Keulegan–Carpenter
ARTICLE IN PRESS
Frequency [Hz]
Rel
ativ
e ca
ptur
e w
idth
0.5 0.6 0.7 0.8 0.9 1.0 1.1 1.20.00
0.05
0.10
0.15
0.20
0.25Control OFF, H = 23 mmControl OFF, H = 39 mmControl ON, H = 23 mmControl ON, H = 39 mm
Fig. 10. Capture width relative to the tube’s diameter for a range of regular wave
inputs, with two different heights of incoming regular waves, for the cases with
and without zero-threshold unlatching control. For each curve the wavemaker
setpoint for the wave height H has been kept constant across frequencies. The
given value for H is an average for the points along each line.
Frequency [Hz]
Dis
sipa
ted
pow
er g
ain
fact
or
0.5H
z
0.6H
z
0.7H
z
0.8H
z
0.9H
z
(fe)
0.5
3Hz
(fe)
0.7
7Hz
100
101
102
Reg H = 23 mmReg H = 39 mmIrr JSW Hs = 26.5 mmIrr JSW Hs = 39.0 mm
Fig. 11. Gain factor for the average power dissipated in the valve using the zero-
threshold unlatching control relative to the corresponding experimental tests
without control. The first five points on the horizontal axis refer to regular wave
input, whereas the two last points refer to irregular waves synthesized from a
JONSWAP spectrum with peakness factor 3.3. Logarithmic scale is used on the
vertical axis. The given values for the (significant) wave heights H are average
values for all the point on each curve.
Rel
ativ
e ca
ptur
e w
idth
fe=0.53 fe=0.77 fe=0.53 fe=0.770.00
0.02
0.04
0.06
0.08
0.10
HS=26.5mm
HS=39.0mm
Zero ThresholdControl OFF
Fig. 12. Experimental results for the capture width, relative to the tube’s diameter
in irregular waves, with and without zero-threshold latching control. The waves
were synthesized from a JONSWAP spectrum of peakness factor g0 ¼ 3:3.
M.F.P. Lopes et al. / Ocean Engineering 36 (2009) 386–402394
Author's personal copy
number (see Falnes, 2002a, p. 237), and is important to bear inmind also for full-scale converters of any kind.
7.4. Damping optimization
The word optimal is here used to refer to a setting or value thatgives the maximum average power-dissipation in the valve underthe given conditions. The laboratory model was equipped with avalve and couplings without any means for adjusting the flowrestriction. The discharge coefficient was close to optimal for thelatching control runs (and at resonance), but excessively large(low damping) for the no-control runs at low frequencies. In orderto make a fair comparison between results, numerical simulationswere used to find optimal values for the valve dischargecoefficient Cdc for different input waves and control strategies.This was done by varying the coefficient over a series of runs, andsubsequently identifying the optimal value in terms of usefulpower (i.e. the power dissipated in the valve).
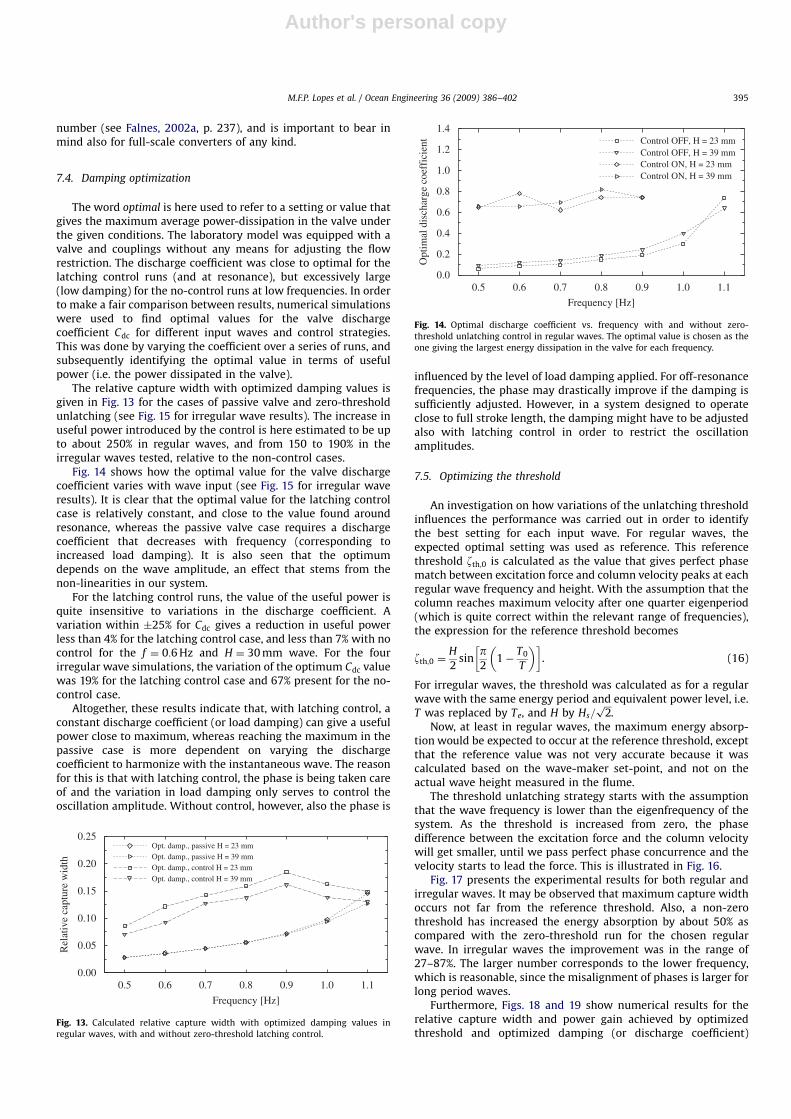
The relative capture width with optimized damping values isgiven in Fig. 13 for the cases of passive valve and zero-thresholdunlatching (see Fig. 15 for irregular wave results). The increase inuseful power introduced by the control is here estimated to be upto about 250% in regular waves, and from 150 to 190% in theirregular waves tested, relative to the non-control cases.
Fig. 14 shows how the optimal value for the valve dischargecoefficient varies with wave input (see Fig. 15 for irregular waveresults). It is clear that the optimal value for the latching controlcase is relatively constant, and close to the value found aroundresonance, whereas the passive valve case requires a dischargecoefficient that decreases with frequency (corresponding toincreased load damping). It is also seen that the optimumdepends on the wave amplitude, an effect that stems from thenon-linearities in our system.
For the latching control runs, the value of the useful power isquite insensitive to variations in the discharge coefficient. Avariation within �25% for Cdc gives a reduction in useful powerless than 4% for the latching control case, and less than 7% with nocontrol for the f ¼ 0:6 Hz and H ¼ 30 mm wave. For the fourirregular wave simulations, the variation of the optimum Cdc valuewas 19% for the latching control case and 67% present for the no-control case.
Altogether, these results indicate that, with latching control, aconstant discharge coefficient (or load damping) can give a usefulpower close to maximum, whereas reaching the maximum in thepassive case is more dependent on varying the dischargecoefficient to harmonize with the instantaneous wave. The reasonfor this is that with latching control, the phase is being taken careof and the variation in load damping only serves to control theoscillation amplitude. Without control, however, also the phase is
influenced by the level of load damping applied. For off-resonancefrequencies, the phase may drastically improve if the damping issufficiently adjusted. However, in a system designed to operateclose to full stroke length, the damping might have to be adjustedalso with latching control in order to restrict the oscillationamplitudes.
7.5. Optimizing the threshold
An investigation on how variations of the unlatching thresholdinfluences the performance was carried out in order to identifythe best setting for each input wave. For regular waves, theexpected optimal setting was used as reference. This referencethreshold zth;0 is calculated as the value that gives perfect phasematch between excitation force and column velocity peaks at eachregular wave frequency and height. With the assumption that thecolumn reaches maximum velocity after one quarter eigenperiod(which is quite correct within the relevant range of frequencies),the expression for the reference threshold becomes
zth;0 ¼H
2sin
p2
1�T0
T
� �� �. (16)
For irregular waves, the threshold was calculated as for a regularwave with the same energy period and equivalent power level, i.e.T was replaced by Te, and H by Hs=
ffiffiffi2p
.Now, at least in regular waves, the maximum energy absorp-
tion would be expected to occur at the reference threshold, exceptthat the reference value was not very accurate because it wascalculated based on the wave-maker set-point, and not on theactual wave height measured in the flume.
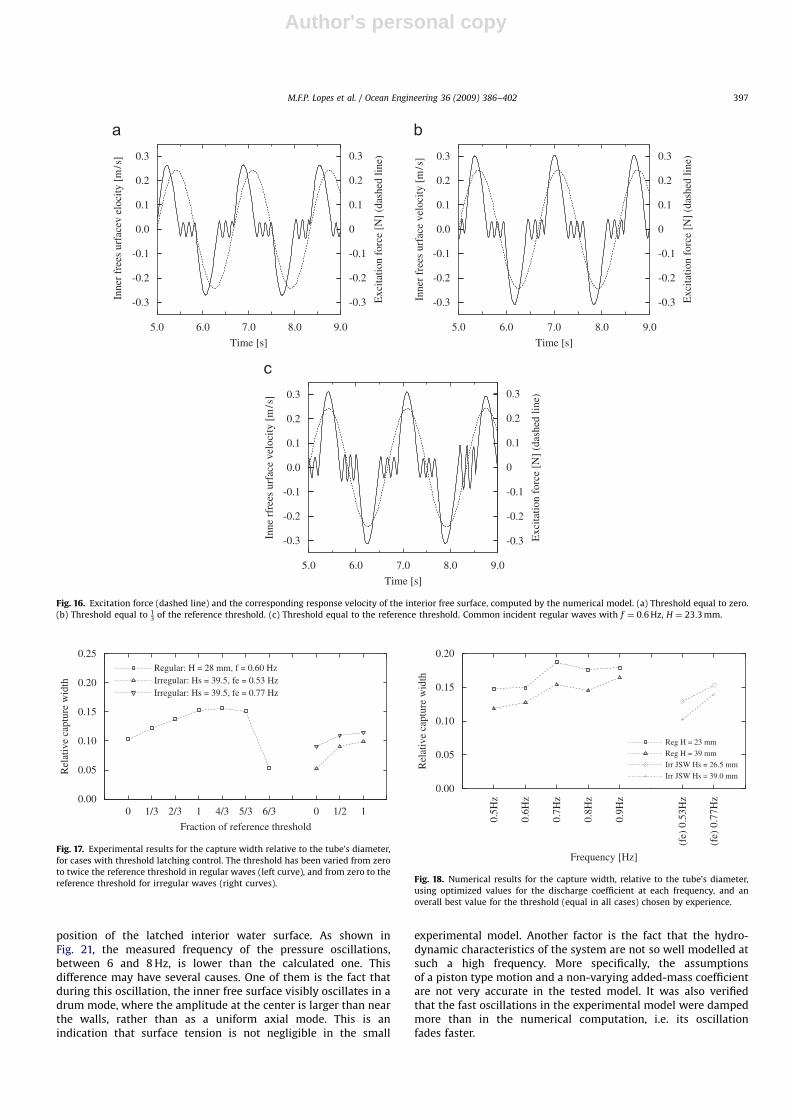
The threshold unlatching strategy starts with the assumptionthat the wave frequency is lower than the eigenfrequency of thesystem. As the threshold is increased from zero, the phasedifference between the excitation force and the column velocitywill get smaller, until we pass perfect phase concurrence and thevelocity starts to lead the force. This is illustrated in Fig. 16.
Fig. 17 presents the experimental results for both regular andirregular waves. It may be observed that maximum capture widthoccurs not far from the reference threshold. Also, a non-zerothreshold has increased the energy absorption by about 50% ascompared with the zero-threshold run for the chosen regularwave. In irregular waves the improvement was in the range of27–87%. The larger number corresponds to the lower frequency,which is reasonable, since the misalignment of phases is larger forlong period waves.
Furthermore, Figs. 18 and 19 show numerical results for therelative capture width and power gain achieved by optimizedthreshold and optimized damping (or discharge coefficient)
ARTICLE IN PRESS
Frequency [Hz]
Rel
ativ
e ca
ptur
e w
idth
0.5 0.6 0.7 0.8 0.9 1.0 1.10.00
0.05
0.10
0.15
0.20
0.25Opt. damp., passive H = 23 mmOpt. damp., passive H = 39 mmOpt. damp., control H = 23 mm
Opt. damp., control H = 39 mm
Fig. 13. Calculated relative capture width with optimized damping values in
regular waves, with and without zero-threshold latching control.
Frequency [Hz]
Opt
imal
dis
char
ge c
oeff
icie
nt
0.5 0.6 0.7 0.8 0.9 1.0 1.10.0
0.2
0.4
0.6
0.8
1.0
1.2
1.4Control OFF, H = 23 mmControl OFF, H = 39 mmControl ON, H = 23 mmControl ON, H = 39 mm
Fig. 14. Optimal discharge coefficient vs. frequency with and without zero-
threshold unlatching control in regular waves. The optimal value is chosen as the
one giving the largest energy dissipation in the valve for each frequency.
M.F.P. Lopes et al. / Ocean Engineering 36 (2009) 386–402 395
Author's personal copy
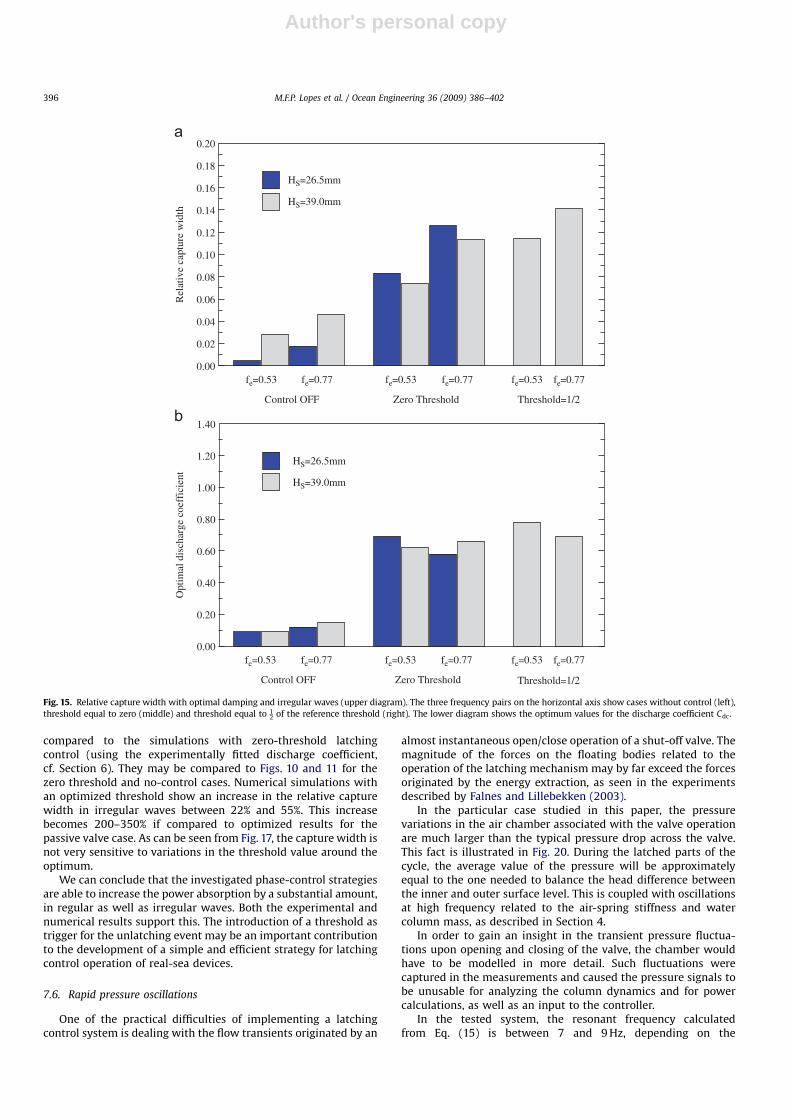
compared to the simulations with zero-threshold latchingcontrol (using the experimentally fitted discharge coefficient,cf. Section 6). They may be compared to Figs. 10 and 11 for thezero threshold and no-control cases. Numerical simulations withan optimized threshold show an increase in the relative capturewidth in irregular waves between 22% and 55%. This increasebecomes 200–350% if compared to optimized results for thepassive valve case. As can be seen from Fig. 17, the capture width isnot very sensitive to variations in the threshold value around theoptimum.
We can conclude that the investigated phase-control strategiesare able to increase the power absorption by a substantial amount,in regular as well as irregular waves. Both the experimental andnumerical results support this. The introduction of a threshold astrigger for the unlatching event may be an important contributionto the development of a simple and efficient strategy for latchingcontrol operation of real-sea devices.
7.6. Rapid pressure oscillations
One of the practical difficulties of implementing a latchingcontrol system is dealing with the flow transients originated by an
almost instantaneous open/close operation of a shut-off valve. Themagnitude of the forces on the floating bodies related to theoperation of the latching mechanism may by far exceed the forcesoriginated by the energy extraction, as seen in the experimentsdescribed by Falnes and Lillebekken (2003).
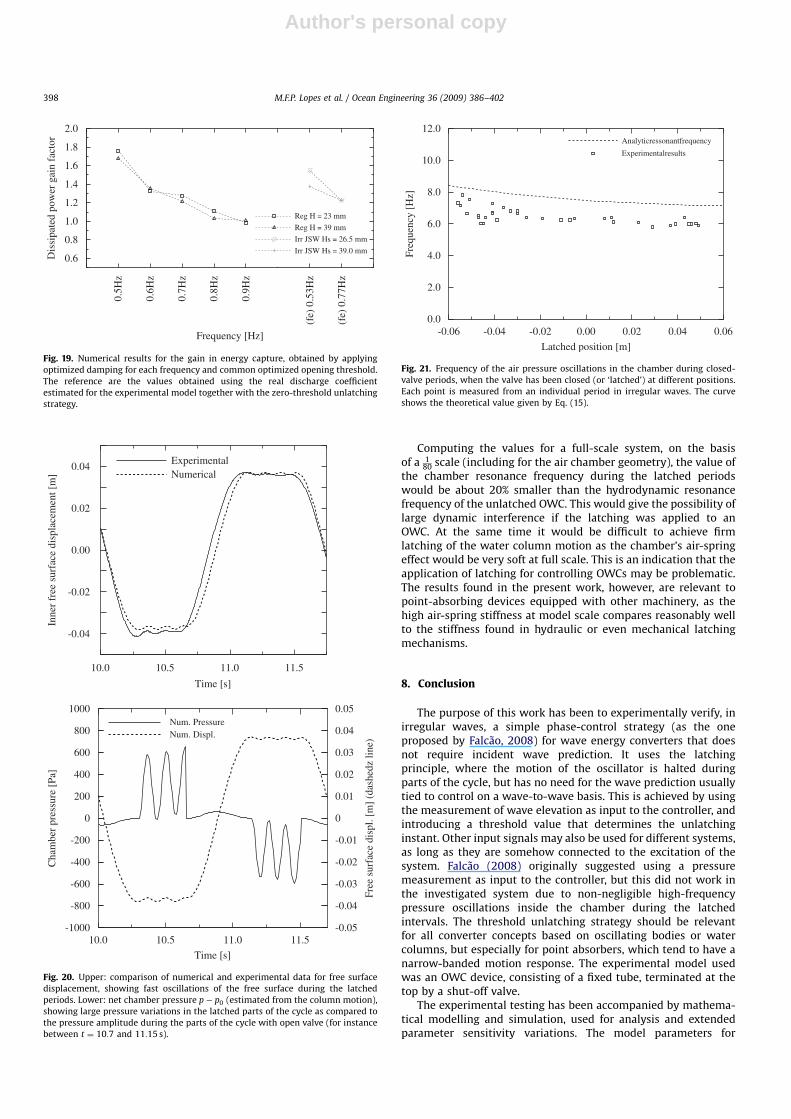
In the particular case studied in this paper, the pressurevariations in the air chamber associated with the valve operationare much larger than the typical pressure drop across the valve.This fact is illustrated in Fig. 20. During the latched parts of thecycle, the average value of the pressure will be approximatelyequal to the one needed to balance the head difference betweenthe inner and outer surface level. This is coupled with oscillationsat high frequency related to the air-spring stiffness and watercolumn mass, as described in Section 4.
In order to gain an insight in the transient pressure fluctua-tions upon opening and closing of the valve, the chamber wouldhave to be modelled in more detail. Such fluctuations werecaptured in the measurements and caused the pressure signals tobe unusable for analyzing the column dynamics and for powercalculations, as well as an input to the controller.
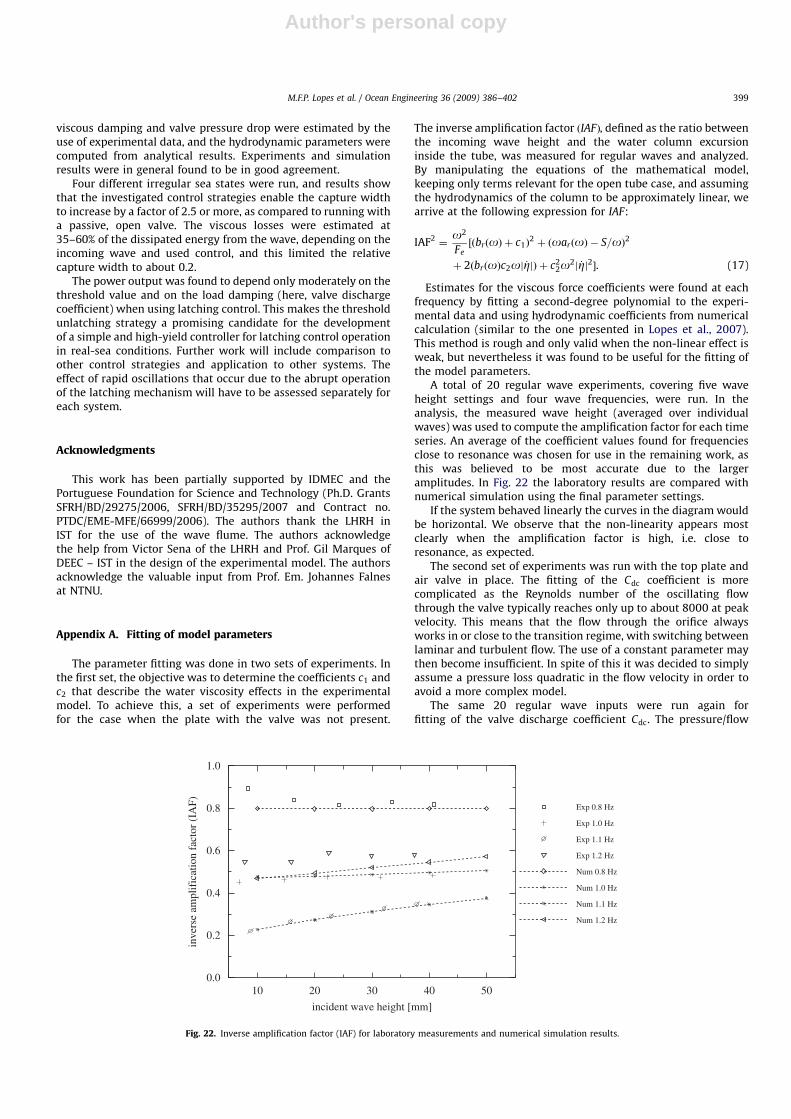
In the tested system, the resonant frequency calculatedfrom Eq. (15) is between 7 and 9 Hz, depending on the
ARTICLE IN PRESS
Rel
ativ
e ca
ptur
e w
idth
fe=0.53 fe=0.77 fe=0.53 fe=0.77 fe=0.53 fe=0.770.00
0.02
0.04
0.06
0.08
0.10
0.12
0.14
0.16
0.18
0.20a
b
HS=26.5mm
HS=39.0mm
Threshold=1/2Control OFF Zero Threshold
Opt
imal
dis
char
ge c
oeff
icie
nt
fe=0.53 fe=0.77 fe=0.53 fe=0.77 fe=0.53 fe=0.770.00
0.20
0.40
0.60
0.80
1.00
1.20
1.40
HS=26.5mm
HS=39.0mm
Threshold=1/2Control OFF Zero Threshold
Fig. 15. Relative capture width with optimal damping and irregular waves (upper diagram). The three frequency pairs on the horizontal axis show cases without control (left),
threshold equal to zero (middle) and threshold equal to 12 of the reference threshold (right). The lower diagram shows the optimum values for the discharge coefficient Cdc.
M.F.P. Lopes et al. / Ocean Engineering 36 (2009) 386–402396
Author's personal copy
position of the latched interior water surface. As shown inFig. 21, the measured frequency of the pressure oscillations,between 6 and 8 Hz, is lower than the calculated one. Thisdifference may have several causes. One of them is the fact thatduring this oscillation, the inner free surface visibly oscillates in adrum mode, where the amplitude at the center is larger than nearthe walls, rather than as a uniform axial mode. This is anindication that surface tension is not negligible in the small
experimental model. Another factor is the fact that the hydro-dynamic characteristics of the system are not so well modelled atsuch a high frequency. More specifically, the assumptionsof a piston type motion and a non-varying added-mass coefficientare not very accurate in the tested model. It was also verifiedthat the fast oscillations in the experimental model were dampedmore than in the numerical computation, i.e. its oscillationfades faster.
ARTICLE IN PRESS
Time [s]
Inne
r fr
ees
urfa
cev
eloc
ity [
m/s
]
Exc
itatio
n fo
rce
[N]
(das
hed
line)
5.0 6.0 7.0 8.0 9.0
-0.3-0.3
-0.2
-0.1
0.0
0.1
0.2
0.3
-0.2
-0.1
0
0.1
0.2
0.3
Time [s]
Inne
r fr
ees
urfa
ce v
eloc
ity [
m/s
]
Exc
itatio
n fo
rce
[N]
(das
hed
line)
5.0 6.0 7.0 8.0 9.0
-0.3
-0.2
-0.1
0.0
0.1
0.2
0.3
-0.3
-0.2
-0.1
0
0.1
0.2
0.3
Time [s]
Inne
rfr
ees
urfa
ce v
eloc
ity [
m/s
]
Exc
itatio
n fo
rce
[N]
(das
hed
line)
5.0 6.0 7.0 8.0 9.0
-0.3
-0.2
-0.1
0.0
0.1
0.2
0.3
-0.3
-0.2
-0.1
0
0.1
0.2
0.3
Fig. 16. Excitation force (dashed line) and the corresponding response velocity of the interior free surface, computed by the numerical model. (a) Threshold equal to zero.
(b) Threshold equal to 13 of the reference threshold. (c) Threshold equal to the reference threshold. Common incident regular waves with f ¼ 0:6 Hz, H ¼ 23:3 mm.
Fraction of reference threshold
Rel
ativ
e ca
ptur
e w
idth
0 1/3 2/3 1 4/3 5/3 6/3 0 1/2 10.00
0.05
0.10
0.15
0.20
0.25Regular: H = 28 mm, f = 0.60 HzIrregular: Hs = 39.5, fe = 0.53 HzIrregular: Hs = 39.5, fe = 0.77 Hz
Fig. 17. Experimental results for the capture width relative to the tube’s diameter,
for cases with threshold latching control. The threshold has been varied from zero
to twice the reference threshold in regular waves (left curve), and from zero to the
reference threshold for irregular waves (right curves).
Frequency [Hz]
Rel
ativ
e ca
ptur
e w
idth
0.5H
z
0.6H
z
0.7H
z
0.8H
z
0.9H
z
(fe)
0.5
3Hz
(fe)
0.7
7Hz
0.00
0.05
0.10
0.15
0.20
Reg H = 23 mm
Reg H = 39 mm
Irr JSW Hs = 26.5 mm
Irr JSW Hs = 39.0 mm
Fig. 18. Numerical results for the capture width, relative to the tube’s diameter,
using optimized values for the discharge coefficient at each frequency, and an
overall best value for the threshold (equal in all cases) chosen by experience.
M.F.P. Lopes et al. / Ocean Engineering 36 (2009) 386–402 397
Author's personal copy
Computing the values for a full-scale system, on the basisof a 1
80 scale (including for the air chamber geometry), the value ofthe chamber resonance frequency during the latched periodswould be about 20% smaller than the hydrodynamic resonancefrequency of the unlatched OWC. This would give the possibility oflarge dynamic interference if the latching was applied to anOWC. At the same time it would be difficult to achieve firmlatching of the water column motion as the chamber’s air-springeffect would be very soft at full scale. This is an indication that theapplication of latching for controlling OWCs may be problematic.The results found in the present work, however, are relevant topoint-absorbing devices equipped with other machinery, as thehigh air-spring stiffness at model scale compares reasonably wellto the stiffness found in hydraulic or even mechanical latchingmechanisms.
8. Conclusion
The purpose of this work has been to experimentally verify, inirregular waves, a simple phase-control strategy (as the oneproposed by Falcao, 2008) for wave energy converters that doesnot require incident wave prediction. It uses the latchingprinciple, where the motion of the oscillator is halted duringparts of the cycle, but has no need for the wave prediction usuallytied to control on a wave-to-wave basis. This is achieved by usingthe measurement of wave elevation as input to the controller, andintroducing a threshold value that determines the unlatchinginstant. Other input signals may also be used for different systems,as long as they are somehow connected to the excitation of thesystem. Falcao (2008) originally suggested using a pressuremeasurement as input to the controller, but this did not work inthe investigated system due to non-negligible high-frequencypressure oscillations inside the chamber during the latchedintervals. The threshold unlatching strategy should be relevantfor all converter concepts based on oscillating bodies or watercolumns, but especially for point absorbers, which tend to have anarrow-banded motion response. The experimental model usedwas an OWC device, consisting of a fixed tube, terminated at thetop by a shut-off valve.
The experimental testing has been accompanied by mathema-tical modelling and simulation, used for analysis and extendedparameter sensitivity variations. The model parameters for
ARTICLE IN PRESS
Frequency [Hz]
Dis
sipa
ted
pow
er g
ain
fact
or
0.5H
z
0.6H
z
0.7H
z
0.8H
z
0.9H
z
(fe)
0.5
3Hz
(fe)
0.7
7Hz
0.6
0.8
1.0
1.2
1.4
1.6
1.8
2.0
Reg H = 23 mm
Reg H = 39 mm
Irr JSW Hs = 26.5 mm
Irr JSW Hs = 39.0 mm
Fig. 19. Numerical results for the gain in energy capture, obtained by applying
optimized damping for each frequency and common optimized opening threshold.
The reference are the values obtained using the real discharge coefficient
estimated for the experimental model together with the zero-threshold unlatching
strategy.
Time [s]
10.0 10.5 11.0 11.5
-0.04
-0.02
0.00
0.02
0.04ExperimentalNumerical
Inne
r fr
ee s
urfa
ce d
ispl
acem
ent [
m]
Time [s]
Cha
mbe
r pr
essu
re [
Pa]
Free
sur
face
dis
pl. [
m]
(das
hedz
line
)
10.0 10.5 11.0 11.5-1000
-800
-600
-400
-200
0
200
400
600
800
1000
-0.05
-0.04
-0.03
-0.02
-0.01
0
0.01
0.02
0.03
0.04
0.05Num. PressureNum. Displ.
Fig. 20. Upper: comparison of numerical and experimental data for free surface
displacement, showing fast oscillations of the free surface during the latched
periods. Lower: net chamber pressure p� p0 (estimated from the column motion),
showing large pressure variations in the latched parts of the cycle as compared to
the pressure amplitude during the parts of the cycle with open valve (for instance
between t ¼ 10:7 and 11:15 s).
Latched position [m]
Freq
uenc
y [H
z]
-0.06 -0.04 -0.02 0.00 0.02 0.04 0.06
Analyticressonantfrequency
0.0
2.0
4.0
6.0
8.0
10.0
12.0
Experimentalresults
Fig. 21. Frequency of the air pressure oscillations in the chamber during closed-
valve periods, when the valve has been closed (or ‘latched’) at different positions.
Each point is measured from an individual period in irregular waves. The curve
shows the theoretical value given by Eq. (15).
M.F.P. Lopes et al. / Ocean Engineering 36 (2009) 386–402398
Author's personal copy
viscous damping and valve pressure drop were estimated by theuse of experimental data, and the hydrodynamic parameters werecomputed from analytical results. Experiments and simulationresults were in general found to be in good agreement.
Four different irregular sea states were run, and results showthat the investigated control strategies enable the capture widthto increase by a factor of 2.5 or more, as compared to running witha passive, open valve. The viscous losses were estimated at35–60% of the dissipated energy from the wave, depending on theincoming wave and used control, and this limited the relativecapture width to about 0.2.
The power output was found to depend only moderately on thethreshold value and on the load damping (here, valve dischargecoefficient) when using latching control. This makes the thresholdunlatching strategy a promising candidate for the developmentof a simple and high-yield controller for latching control operationin real-sea conditions. Further work will include comparison toother control strategies and application to other systems. Theeffect of rapid oscillations that occur due to the abrupt operationof the latching mechanism will have to be assessed separately foreach system.
Acknowledgments
This work has been partially supported by IDMEC and thePortuguese Foundation for Science and Technology (Ph.D. GrantsSFRH/BD/29275/2006, SFRH/BD/35295/2007 and Contract no.PTDC/EME-MFE/66999/2006). The authors thank the LHRH inIST for the use of the wave flume. The authors acknowledgethe help from Victor Sena of the LHRH and Prof. Gil Marques ofDEEC – IST in the design of the experimental model. The authorsacknowledge the valuable input from Prof. Em. Johannes Falnesat NTNU.
Appendix A. Fitting of model parameters
The parameter fitting was done in two sets of experiments. Inthe first set, the objective was to determine the coefficients c1 andc2 that describe the water viscosity effects in the experimentalmodel. To achieve this, a set of experiments were performedfor the case when the plate with the valve was not present.
The inverse amplification factor ðIAFÞ, defined as the ratio betweenthe incoming wave height and the water column excursioninside the tube, was measured for regular waves and analyzed.By manipulating the equations of the mathematical model,keeping only terms relevant for the open tube case, and assumingthe hydrodynamics of the column to be approximately linear, wearrive at the following expression for IAF:
IAF2¼
o2
Fe½ðbrðoÞ þ c1Þ
2þ ðoarðoÞ � S=oÞ2
þ 2ðbrðoÞc2oj _ZjÞ þ c22o
2j _Zj2�. (17)
Estimates for the viscous force coefficients were found at eachfrequency by fitting a second-degree polynomial to the experi-mental data and using hydrodynamic coefficients from numericalcalculation (similar to the one presented in Lopes et al., 2007).This method is rough and only valid when the non-linear effect isweak, but nevertheless it was found to be useful for the fitting ofthe model parameters.
A total of 20 regular wave experiments, covering five waveheight settings and four wave frequencies, were run. In theanalysis, the measured wave height (averaged over individualwaves) was used to compute the amplification factor for each timeseries. An average of the coefficient values found for frequenciesclose to resonance was chosen for use in the remaining work, asthis was believed to be most accurate due to the largeramplitudes. In Fig. 22 the laboratory results are compared withnumerical simulation using the final parameter settings.
If the system behaved linearly the curves in the diagram wouldbe horizontal. We observe that the non-linearity appears mostclearly when the amplification factor is high, i.e. close toresonance, as expected.
The second set of experiments was run with the top plate andair valve in place. The fitting of the Cdc coefficient is morecomplicated as the Reynolds number of the oscillating flowthrough the valve typically reaches only up to about 8000 at peakvelocity. This means that the flow through the orifice alwaysworks in or close to the transition regime, with switching betweenlaminar and turbulent flow. The use of a constant parameter maythen become insufficient. In spite of this it was decided to simplyassume a pressure loss quadratic in the flow velocity in order toavoid a more complex model.
The same 20 regular wave inputs were run again forfitting of the valve discharge coefficient Cdc. The pressure/flow
ARTICLE IN PRESS
incident wave height [mm]
inve
rse
ampl
ific
atio
n fa
ctor
(IA
F)
10 20 30 40 500.0
0.2
0.4
0.6
0.8
1.0
Exp 0.8 Hz
Exp 1.0 Hz
Exp 1.1 Hz
Exp 1.2 Hz
Num 0.8 Hz
Num 1.0 Hz
Num 1.1 Hz
Num 1.2 Hz
Fig. 22. Inverse amplification factor (IAF) for laboratory measurements and numerical simulation results.
M.F.P. Lopes et al. / Ocean Engineering 36 (2009) 386–402 399

Author's personal copy
characteristic of the valve, or more correctly the valve withconnections and entrance geometries, was then investigated byassuming small air compressibility effect and estimating thevolume flow rate directly from the column motion. It was foundthat the relation was slightly non-symmetric, and also had a slightbreak in the curve. We interpreted the non-symmetry as beingdue to the non-symmetric geometry of the valve set-up, and the‘notch’ to be caused by the transition between laminar andturbulent flow, as mentioned above.
It was found that assuming a purely quadratic relation andminimizing the deviation between laboratory measurements andnumerical simulations yielded good results. In order to find a bestvalue to use for Cdc, the sum of squared differences between thenumerical and experimental values for the column elevation wascalculated with different settings for the discharge coefficient. Theresults for each run were added to obtain a gross measure of thedeviation. This gave a convex curve of deviation vs. dischargecoefficient. From the curve a minimizing value of Cdc ¼ 0:69 wasfound, and this was used as default value in the simulation runsreported herein.
Appendix B. Accuracy of the numerical model
The deviation between the measured and simulated responseshave been characterized by a relative standard deviationr ¼ dnum�lab=slab. Here, dnum�lab ¼ ½
PNi¼1ðZnum � ZlabÞ
2=ðN � 1Þ�1=2
is the deviation between the simulated and measured responsedefined in a standard deviation fashion, and slab is the standarddeviation of the laboratory measurement itself.
This measure will equal 0 if the data coincide, and 1 if wehave perfect phase match but double amplitude. A perfectamplitude match but with a phase difference of p=2 would giver ¼
ffiffiffi2p
. For the vertical displacements the numerical modelreproduces the measured data within about r ¼ 25% with betterfit for the lower frequencies and higher wave amplitudes, asshown by Fig. 23.
For comparison, the relative deviation in amplitude has beencalculated, and it has an average value of about 5%.
The deviations in pressure are somewhat larger, as can be seenin Fig. 24. Here the values for the relative standard deviation spanfrom about 20 to 50%.
ARTICLE IN PRESS
Frequency [Hz]
Err
orin
dexf
orth
edis
plac
emen
t[%
]
0.5H
z
0.6H
z
0.7H
z
0.8H
z
0.9H
z
1.0H
z
1.1H
z
1.2H
z
(fe)
0.5
3Hz
(fe)
0.7
7Hz
0
5
10
15
20
25
30
35
Reg H = 23 mm
Reg H = 39 mm
Irr JSW Hs = 26.5 mm
Irr JSW Hs = 39.0 mm
Fig. 23. Error index of the numerical predictions for the free surface displacement (%). Passive cases.
Frequency [Hz]
Err
orin
dexf
orth
epre
ssur
e[%
]
0.5H
z
0.6H
z
0.7H
z
0.8H
z
0.9H
z
1.0H
z
1.1H
z
1.2H
z
(fe)
0.5
3Hz
(fe)
0.7
7Hz
0
10
20
30
40
50
60
70
Reg H = 23 mm
Reg H = 39 mm
Irr JSW Hs = 26.5 mm
Irr JSW Hs = 39.0 mm
Fig. 24. Error index of the numerical predictions of pressure in the chamber (%). Passive cases.
M.F.P. Lopes et al. / Ocean Engineering 36 (2009) 386–402400
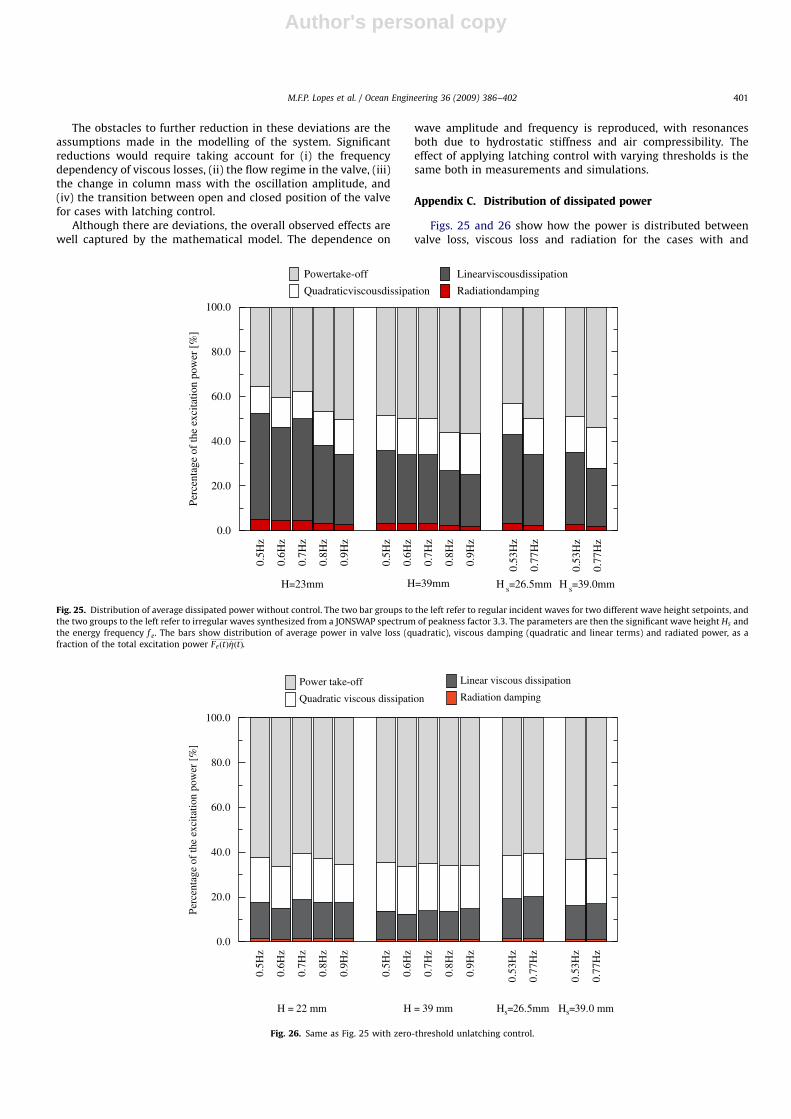
Author's personal copy
The obstacles to further reduction in these deviations are theassumptions made in the modelling of the system. Significantreductions would require taking account for (i) the frequencydependency of viscous losses, (ii) the flow regime in the valve, (iii)the change in column mass with the oscillation amplitude, and(iv) the transition between open and closed position of the valvefor cases with latching control.
Although there are deviations, the overall observed effects arewell captured by the mathematical model. The dependence on
wave amplitude and frequency is reproduced, with resonancesboth due to hydrostatic stiffness and air compressibility. Theeffect of applying latching control with varying thresholds is thesame both in measurements and simulations.
Appendix C. Distribution of dissipated power
Figs. 25 and 26 show how the power is distributed betweenvalve loss, viscous loss and radiation for the cases with and
ARTICLE IN PRESS
Perc
enta
ge o
f th
e ex
cita
tion
pow
er [
%]
0.5H
z
0.6H
z
0.7H
z
0.8H
z
0.9H
z
0.5H
z
0.6H
z
0.7H
z
0.8H
z
0.9H
z
0.53
Hz
0.77
Hz
0.53
Hz
0.77
Hz
0.0
20.0
40.0
60.0
80.0
100.0
Powertake-off
Quadraticviscousdissipation
Linearviscousdissipation
Radiationdamping
H s=26.5mmH=23mm H=39mm H s=39.0mm
Fig. 25. Distribution of average dissipated power without control. The two bar groups to the left refer to regular incident waves for two different wave height setpoints, and
the two groups to the left refer to irregular waves synthesized from a JONSWAP spectrum of peakness factor 3.3. The parameters are then the significant wave height Hs and
the energy frequency f e. The bars show distribution of average power in valve loss (quadratic), viscous damping (quadratic and linear terms) and radiated power, as a
fraction of the total excitation power FeðtÞ _ZðtÞ.
Per
cent
age
ofth
eex
cita
tion
pow
er[%
]
0.5H
z
0.6H
z
0.7H
z
0.8H
z
0.9H
z
0.5H
z
0.6H
z
0.7H
z
0.8H
z
0.9H
z
0.53
Hz
0.77
Hz
0.53
Hz
0.77
Hz
0.0
20.0
40.0
60.0
80.0
100.0
Power take-off
Quadratic viscous dissipation
Linear viscous dissipation
Radiation damping
Hs=26.5mmH = 22 mm H = 39 mm Hs=39.0 mm
Fig. 26. Same as Fig. 25 with zero-threshold unlatching control.
M.F.P. Lopes et al. / Ocean Engineering 36 (2009) 386–402 401
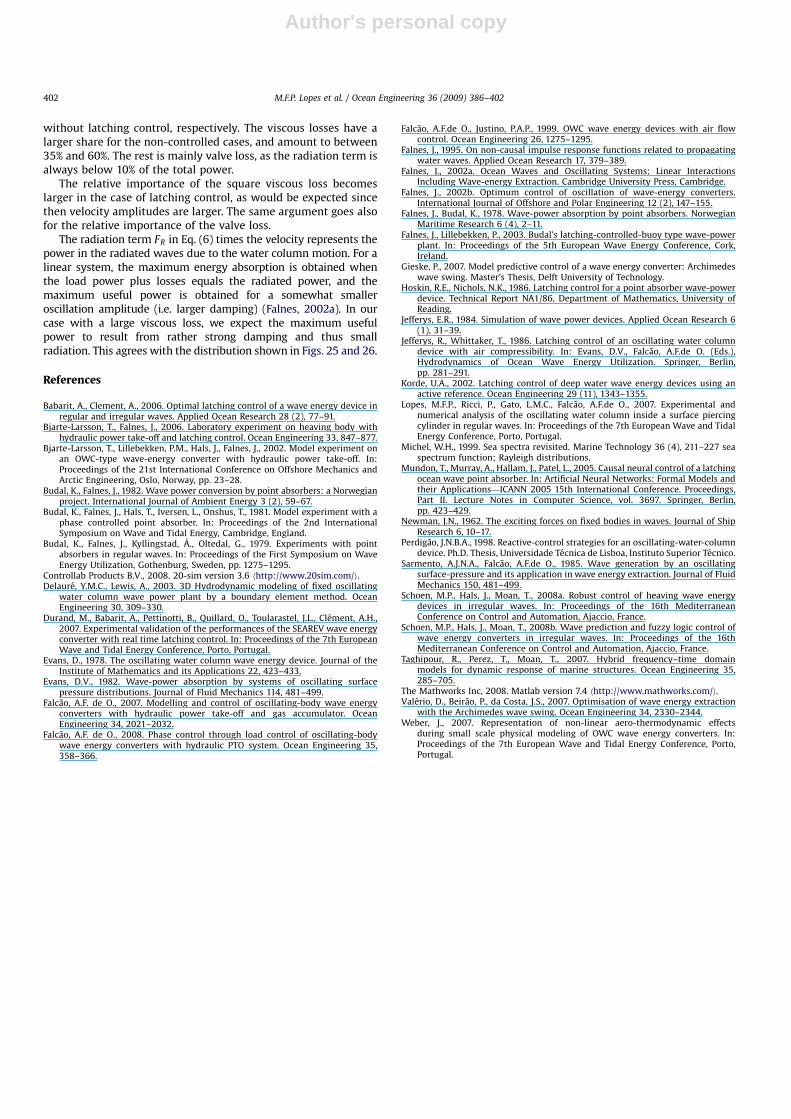
Author's personal copy
without latching control, respectively. The viscous losses have alarger share for the non-controlled cases, and amount to between35% and 60%. The rest is mainly valve loss, as the radiation term isalways below 10% of the total power.
The relative importance of the square viscous loss becomeslarger in the case of latching control, as would be expected sincethen velocity amplitudes are larger. The same argument goes alsofor the relative importance of the valve loss.
The radiation term FR in Eq. (6) times the velocity represents thepower in the radiated waves due to the water column motion. For alinear system, the maximum energy absorption is obtained whenthe load power plus losses equals the radiated power, and themaximum useful power is obtained for a somewhat smalleroscillation amplitude (i.e. larger damping) (Falnes, 2002a). In ourcase with a large viscous loss, we expect the maximum usefulpower to result from rather strong damping and thus smallradiation. This agrees with the distribution shown in Figs. 25 and 26.
References
Babarit, A., Clement, A., 2006. Optimal latching control of a wave energy device inregular and irregular waves. Applied Ocean Research 28 (2), 77–91.
Bjarte-Larsson, T., Falnes, J., 2006. Laboratory experiment on heaving body withhydraulic power take-off and latching control. Ocean Engineering 33, 847–877.
Bjarte-Larsson, T., Lillebekken, P.M., Hals, J., Falnes, J., 2002. Model experiment onan OWC-type wave-energy converter with hydraulic power take-off. In:Proceedings of the 21st International Conference on Offshore Mechanics andArctic Engineering, Oslo, Norway, pp. 23–28.
Budal, K., Falnes, J., 1982. Wave power conversion by point absorbers: a Norwegianproject. International Journal of Ambient Energy 3 (2), 59–67.
Budal, K., Falnes, J., Hals, T., Iversen, L., Onshus, T., 1981. Model experiment with aphase controlled point absorber. In: Proceedings of the 2nd InternationalSymposium on Wave and Tidal Energy, Cambridge, England.
Budal, K., Falnes, J., Kyllingstad, A., Oltedal, G., 1979. Experiments with pointabsorbers in regular waves. In: Proceedings of the First Symposium on WaveEnergy Utilization, Gothenburg, Sweden, pp. 1275–1295.
Controllab Products B.V., 2008. 20-sim version 3.6 hhttp://www.20sim.com/i.Delaure, Y.M.C., Lewis, A., 2003. 3D Hydrodynamic modeling of fixed oscillating
water column wave power plant by a boundary element method. OceanEngineering 30, 309–330.
Durand, M., Babarit, A., Pettinotti, B., Quillard, O., Toularastel, J.L., Clement, A.H.,2007. Experimental validation of the performances of the SEAREV wave energyconverter with real time latching control. In: Proceedings of the 7th EuropeanWave and Tidal Energy Conference, Porto, Portugal.
Evans, D., 1978. The oscillating water column wave energy device. Journal of theInstitute of Mathematics and its Applications 22, 423–433.
Evans, D.V., 1982. Wave-power absorption by systems of oscillating surfacepressure distributions. Journal of Fluid Mechanics 114, 481–499.
Falcao, A.F. de O., 2007. Modelling and control of oscillating-body wave energyconverters with hydraulic power take-off and gas accumulator. OceanEngineering 34, 2021–2032.
Falcao, A.F. de O., 2008. Phase control through load control of oscillating-bodywave energy converters with hydraulic PTO system. Ocean Engineering 35,358–366.
Falcao, A.F.de O., Justino, P.A.P., 1999. OWC wave energy devices with air flowcontrol. Ocean Engineering 26, 1275–1295.
Falnes, J., 1995. On non-causal impulse response functions related to propagatingwater waves. Applied Ocean Research 17, 379–389.
Falnes, J., 2002a. Ocean Waves and Oscillating Systems: Linear InteractionsIncluding Wave-energy Extraction. Cambridge University Press, Cambridge.
Falnes, J., 2002b. Optimum control of oscillation of wave-energy converters.International Journal of Offshore and Polar Engineering 12 (2), 147–155.
Falnes, J., Budal, K., 1978. Wave-power absorption by point absorbers. NorwegianMaritime Research 6 (4), 2–11.
Falnes, J., Lillebekken, P., 2003. Budal’s latching-controlled-buoy type wave-powerplant. In: Proceedings of the 5th European Wave Energy Conference, Cork,Ireland.
Gieske, P., 2007. Model predictive control of a wave energy converter: Archimedeswave swing. Master’s Thesis, Delft University of Technology.
Hoskin, R.E., Nichols, N.K., 1986. Latching control for a point absorber wave-powerdevice. Technical Report NA1/86, Department of Mathematics, University ofReading.
Jefferys, E.R., 1984. Simulation of wave power devices. Applied Ocean Research 6(1), 31–39.
Jefferys, R., Whittaker, T., 1986. Latching control of an oscillating water columndevice with air compressibility. In: Evans, D.V., Falcao, A.F.de O. (Eds.),Hydrodynamics of Ocean Wave Energy Utilization. Springer, Berlin,pp. 281–291.
Korde, U.A., 2002. Latching control of deep water wave energy devices using anactive reference. Ocean Engineering 29 (11), 1343–1355.
Lopes, M.F.P., Ricci, P., Gato, L.M.C., Falcao, A.F.de O., 2007. Experimental andnumerical analysis of the oscillating water column inside a surface piercingcylinder in regular waves. In: Proceedings of the 7th European Wave and TidalEnergy Conference, Porto, Portugal.
Michel, W.H., 1999. Sea spectra revisited. Marine Technology 36 (4), 211–227 seaspectrum function; Rayleigh distributions.
Mundon, T., Murray, A., Hallam, J., Patel, L., 2005. Causal neural control of a latchingocean wave point absorber. In: Artificial Neural Networks: Formal Models andtheir Applications—ICANN 2005 15th International Conference. Proceedings,Part II. Lecture Notes in Computer Science, vol. 3697. Springer, Berlin,pp. 423–429.
Newman, J.N., 1962. The exciting forces on fixed bodies in waves. Journal of ShipResearch 6, 10–17.
Perdigao, J.N.B.A., 1998. Reactive-control strategies for an oscillating-water-columndevice. Ph.D. Thesis, Universidade Tecnica de Lisboa, Instituto Superior Tecnico.
Sarmento, A.J.N.A., Falcao, A.F.de O., 1985. Wave generation by an oscillatingsurface-pressure and its application in wave energy extraction. Journal of FluidMechanics 150, 481–499.
Schoen, M.P., Hals, J., Moan, T., 2008a. Robust control of heaving wave energydevices in irregular waves. In: Proceedings of the 16th MediterraneanConference on Control and Automation, Ajaccio, France.
Schoen, M.P., Hals, J., Moan, T., 2008b. Wave prediction and fuzzy logic control ofwave energy converters in irregular waves. In: Proceedings of the 16thMediterranean Conference on Control and Automation, Ajaccio, France.
Taghipour, R., Perez, T., Moan, T., 2007. Hybrid frequency–time domainmodels for dynamic response of marine structures. Ocean Engineering 35,285–705.
The Mathworks Inc, 2008. Matlab version 7.4 hhttp://www.mathworks.com/i.Valerio, D., Beirao, P., da Costa, J.S., 2007. Optimisation of wave energy extraction
with the Archimedes wave swing. Ocean Engineering 34, 2330–2344.Weber, J., 2007. Representation of non-linear aero-thermodynamic effects
during small scale physical modeling of OWC wave energy converters. In:Proceedings of the 7th European Wave and Tidal Energy Conference, Porto,Portugal.
ARTICLE IN PRESS
M.F.P. Lopes et al. / Ocean Engineering 36 (2009) 386–402402