Joana Bonifácio Andrade Early stage design methodology to ...
360
Joana Bonifácio Andrade August 2017 UMinho | 2017 Early stage design methodology to ensure life cycle sustainability of residential buildings Universidade do Minho Escola de Engenharia Joana Bonifácio Andrade Early stage design methodology to ensure life cycle sustainability of residential buildings
-
Upload
khangminh22 -
Category
Documents
-
view
0 -
download
0
Transcript of Joana Bonifácio Andrade Early stage design methodology to ...

Joan
a Bo
nifá
cio
Andr
ade
August 2017UM
inho
| 2
017
Earl
y st
age
desi
gn m
etho
dolo
gy to
ens
ure
life
cycl
e su
stai
nabi
lity
of r
esid
entia
l bui
ldin
gs
Universidade do MinhoEscola de Engenharia
Joana Bonifácio Andrade
Early stage design methodology to ensure life cycle sustainability of residential buildings

August 2017
Doctoral ThesisCivil Engineering
Work performed under the supervision ofProf. Doutor Luís Bragança
Joana Bonifácio Andrade
Early stage design methodology to ensure life cycle sustainability of residential buildings
Universidade do MinhoEscola de Engenharia

DECLARATION
Name:
E-mail:
Doctoral thesistitle:§upen"isor:Year ofconclusion:Arei ofknowledge
Joana Bonifácio Andrade
joana. bonif andrade@gmail. comjoana. andrade@ciül.uminho.ptEarly Stage design methodology to ensure life cyclesustainability of residential buildingsProfessor Doutor Luís Manuel Braeança de Miranda e Lopes
2017
Civil Engineering
THE INTEGRAL REPRODUCTION OF THIS THESIS IS ONLY AUTHORTZED FORRESBARCH EFFECTS, AFTER WRTTTEN DECIÁRATION OF THE INTERESTEDPARTY, TO WHICH IT PLEDGES TO COMPLY.
University of Minho, August 2017

STATEMENT OF INTEGRITY
I hereby declare having conducted my thesis with integrity. I confirm that I have not used plagiarism
or any form offalsification of results in üe process of the thesis elaboration.
I further dedare that I have firlly acknowledge the Code of Eúical Conduct of the University ofMinho.
University of Minho, August 2017
'L,
/
Joana Boniflácio Andrade


v
ACKNOWLEDMENTS
‘It takes a village’.
Teria sido impossível realizar este trabalho sozinha. Assim, só me resta agradecer a todos aqueles que,
de uma forma ou de outra, contribuíram para que chegasse até aqui.
Em primeiro lugar, gostaria de agradecer ao meu orientador, Prof. Luís Bragança, por ter sempre
acreditado em mim e no meu trabalho, e pela sua orientação científica essencial à conclusão deste
trabalho.
Aos colegas e amigos que fiz na Universidade do Minho, muito obrigada. Vocês foram sem dúvida
fundamentais para a realização deste trabalho. Obrigada pela forma como me receberam, pela
colaboração e ajuda a resolver problemas, por me obrigarem a fazer melhor, pela companhia nos
momentos de maior stress e nos de lazer também, e por tornarem os dias na UM muito mais divertidos.
Queria deixar um agradecimento especial a todos aqueles se disponibilizam a responder ao
questionário que realizei, ao NCREP – Consultoria em Reabilitação do Edificado e Património, ao
Atelier in.Vitro e à basestudio pela cedência de casos de estudo.
Não poderia deixar de agradecer aos que mais contribuíram para a conclusão deste trabalho, mas que,
ao mesmo tempo, foram os que mais sofreram com ele. Minha família querida, queria pedir-vos
desculpa por todos os momentos em que estive ausente ou rezingona, porque tinha de trabalhar e
agradecer-vos muito pela paciência, mimos, ajuda e disparates. Aos meus pais, à minha irmã Elva, ao
meu irmão Nuno e à Vina, ao meu avô e os meus sobrinhos queridos Duarte e Tomás, só um obrigada
não chega, devo-os o mundo. Ao Gil, obrigada também pela ajuda preciosa na edição das imagens.
Por fim, queria agradecer ao Bruno pela paciência, companhia e amor ao longo de todo este percurso.
Obrigada por estares sempre comigo.
O trabalho apresentado nesta tese foi apoiado pela Fundação para a Ciência e a Tecnologia (FCT) através
do POPH/FSE e QREN, financiado pelo Fundo Social Europeu, com a atribuição da bolsa individual de
doutoramento SFRH/BD/76043/2011.


vii
ABSTRACT
EARLY STAGE DESIGN METHODOLOGY TO ENSURE LIFE CYCLE
SUSTAINABILITY OF RESIDENTIAL BUILDINGS
The work presented in this thesis evolved at the Centre for Territory, Environment, and Construction
(CTAC), Department of Civil Engineering of the University of Minho.
Scientific research has given overwhelming findings that environmental problems are a severe global
threat, requiring an immediate response. In the years to come, ecological and economic constraints
will restrain social conditions. Buildings play a fundamental role in controlling and improving both,
social and environmental quality. Countless efforts are being made to promote and implement
sustainable building design. New technologies to reduce resources consumption, low impact materials,
standards, and guidelines, and building assessment methods are being developed worldwide. It is fair
to say that despite remarkable achievements in promoting sustainable buildings, they are still behind
expectation in enhancing sustainable design. When pre-design is poor or incomplete, the effectiveness
of sustainable projects is compromised. Research shows if sustainability goals are established early in
the project, against which to assess options of achievement, the success of accomplishing a sustainable
building, increases. Nevertheless, existing sustainability assessment tools evaluate a selected option
rather than allowing for comparison of alternative solutions. Also, the need for detailed data, inexistent
at those phases, hampers its use at early design phases.
To cope with this gap, this thesis proposes a new methodology aimed at supporting early design phases
decisions towards sustainable design. It is intended to aid getting goals through a measurable and easily
understood target for the building performance instead of prescribing a particular solution.
To achieve such an ambitious goal, the work was divided into five main tasks. First, literature review
was carried out on existing international recommendations for sustainable design and its assessment,
and existing buildings sustainability assessment methods. This research aimed at identifying the state-
of-the-art of such tools and standards, highlighting their advantages and drawbacks, and setting the
basis for Early Stage Model for Sustainable Design – EasyMode. Then, analysis of the life cycle of
buildings design was conducted. Complementing this analysis, Portuguese designers were surveyed to
comprehend their understandings on sustainability and how they consider its criteria during design.
After having the output of these two phases, it was possible to set approach and framework for the
newly developed tool: EasyMode. After having a defined framework, stage four consisted in developing
the calculation procedure of the indicators included in EasyMode. To validate the efficacy of the tool, a
fifth step was taken; the tool was applied to a case study.

viii
EasyMode aims to support designers, through the decision-making process, at early design phases,
towards successful sustainable design. EasyMode provides guidelines and concepts regarding the three
sustainability cornerstones enabling setting early sustainable goals, making informed decisions, and
selecting design options with better performance throughout the building’s lifecycle. EasyMode is
intended to be easy and practical to use, so practitioners can make quick and expedite analysis, in fact
making it accepted by them. This tool will endow designers with sustainability concepts in an easy
manner, improving their knowledge on the subject and thus, improving their projects. Also, this work
represents a step further in the scientific research in this field.
ix
RESUMO
METODOLOGIA DE SUPORTE ÀS FASES INICIAIS DE PROJECTO
PARA ASSEGURAR A SUSTENTABILIDADE DE CICLO DE VIDA
DE EDIFICIOS DE HABITAÇÃO
O trabalho aqui apresentado foi desenvolvido na unidade de investigação Centro do Território,
Ambiente e Construção (CTAC), no Departamento de Engenharia Civil da Universidade do Minho.
Os resultados de investigação científica têm mostrado problemas ambientais alarmantes, que
requerem uma alteração de paradigma imediata. Nos próximos anos, as condições e desenvolvimento
social serão condicionados por restrições ambientais e económicas. O papel dos edifícios para a
sociedade e para a qualidade ambiental é inegável, daí que a necessidade de se adotar uma estratégia
de construção sustentável, esteja a ser veemente defendida. Ao longo dos últimos anos têm sido
desenvolvidas novas soluções construtivas, materiais e tecnologias de baixo impacte, normas e
recomendações de sustentabilidade, e metodologias de avaliação da sustentabilidade de edifícios,
tendo em vista a melhoria da sustentabilidade do meio edificado. No entanto, este objetivo ainda está
longe de estar cumprido. Quando, nas fases iniciais, o projeto é parco em objetivos de sustentabilidade
ou estes são insuficientemente estabelecidos, dificilmente será possível obter um edifício sustentável.
Isto acontece porque, as fases iniciais são cruciais para estabelecer e concretizar os objetivos de
sustentabilidade. É necessário estabelecer-se objetivos, em relação aos quais devem ser analisadas e
comparadas várias opções possíveis, identificando aquela que melhor satisfaz o resultado pretendido.
Todavia, as metodologias e normas atualmente existentes não permitem esta comparação, uma vez
que, são essencialmente dedicadas à avaliação de apenas uma solução, a solução escolhida. Para além
disso, o facto de necessitarem de informação detalhada, impossibilita a sua aplicação durante o início
do projeto, já que nesta, a informação não se encontra ainda definida.
Verifica-se, assim, a existência de uma lacuna que se pretende colmatar com este trabalho. A presente
tese apresenta uma nova metodologia de suporte à tomada de decisão, durante as fases iniciais de
projeto, tendo em vista a implementação de medidas de sustentabilidade. A ferramenta visa auxiliar
projetistas com a identificação de objetivos fáceis de interpretar e quantificar, em vez de, simplesmente,
prescrever uma solução específica.
De forma a alcançar os objetivos traçados para este trabalho, este foi dividido em cinco tarefas
principais. Primeiro, procedeu-se à revisão da literatura, procurando identificar, analisar e comparar
as metodologias de avaliação de sustentabilidade de edifícios existentes, bem como as normas e
recomendações internacionais sobre o tema. Esta revisão visou conhecer o estado da arte destas
metodologias e normas, identificando os seus pontos positivos e negativos, estabelecendo assim a base
para a nova ferramenta. Posteriormente, analisaram-se as várias fases de projeto, procurando verificar

x
como podem os princípios de sustentabilidade ser incluídos no projeto. De forma a completar esta
análise, realizou-se um inquérito a projetistas nacionais, procurando saber-se a sua visão sobre o
conceito de sustentabilidade e como o englobam nos seus projetos.
Após obter os resultados destas duas fases, foi possível idealizar a abordagem e estrutura a adoptar,
para o desenvolvimento para a nova ferramenta - Early Stage Model for Sustainable Design – EasyMode
(Modelo de desenho sustentável para fases iniciais). Assim a terceira fase consistiu na conceção da
abordagem e estrutura do EasyMode. A quarta parte focou-se no desenvolvimento do processo de
calculo da metodologia. Por fim, a metodologia foi validada através da aplicação a um caso de estudo.
O EasyMode tem o intuito de auxiliar os projetistas na tomada de decisões, durante as fases iniciais de
projeto, tendo em vista a obtenção de um edifício sustentável. Esta ferramenta guia e fornece conceitos
de sustentabilidade, no âmbito dos seus três pilares – ambiente, sociedade e economia, permitindo a
definição de objetivos de sustentabilidade e que sejam tomadas decisões que visem o seu cumprimento.
Pretende-se que o EasyMode seja de fácil e prática utilização de forma a que os projetistas possam
realizar análises expeditas. Assim, esta ferramenta dotará os projetistas com conceitos de
sustentabilidade, fazendo-o de forma simples, mas permitindo estes consigam melhorar o seu
conhecimento e, consequentemente, os seus projetos, visando um meio edificado mais sustentável.

xi
CONTENTS
Chapter 0|
Chapter 1| General introduction and motivation ................................................ 271.1 | Goals and scope ................................................................................. 301.2 | Outline of the thesis ............................................................................ 30References of chapter 1 ................................................................................ 32
Chapter 2| Sustainable assessment tools and normative framework .................... 332.1 | Introduction ...................................................................................... 332.2 | Guidelines for construction sector ........................................................ 34
2.2.1 | International Standards ................................................................................................. 342.2.2 | European Standards – CEN ......................................................................................... 39
2.3 | Sustainability assessment tools ............................................................ 442.3.1 | Procedure for comparison ............................................................................................. 46
2.3.1.1 | Tools to be compared ....................................................................................................... 462.3.2 | Results ........................................................................................................................... 50
2.3.2.1 | What is assessed? ........................................................................................................... 502.3.2.2 | Life cycle phases ............................................................................................................. 532.3.2.3 | How is it assessed? ......................................................................................................... 542.3.2.4 | When is the assessment performed? ................................................................................... 60
2.3.3 | Discussion ...................................................................................................................... 612.4 | Concluding remarks ........................................................................... 64References of chapter 2 ................................................................................ 66
Chapter 3| Design Stages of buildings – �Early design ......................................... 713.1 | Introduction ...................................................................................... 713.2 | Early Design Stages – the role to sustainable design ................................ 72
3.2.1 | Design process ............................................................................................................... 723.2.1.1 | Design phases ................................................................................................................. 75
3.2.2 | Decision support ............................................................................................................ 793.2.3 | Discussion of the design process .................................................................................... 81
3.3 | Sustainability dealt with in design – Portuguese reality ........................... 813.3.1 | Research methodology and survey design .................................................................... 82
3.3.1.1 | Pool of indicators ............................................................................................................ 833.3.1.2 | Survey design .................................................................................................................. 84
3.3.2 | Results/survey analysis .................................................................................................. 853.3.2.1 | Participants background .................................................................................................. 853.3.2.2 | Familiarity with buildings sustainability assessment tools .................................................... 863.3.2.3 | Sustainability consideration .............................................................................................. 86

xii
3.3.2.4 | Sustainability categories analysis ...................................................................................... 883.3.3 | Discussion of Portuguese reality .................................................................................... 95
3.4 | Concluding remarks ........................................................................... 97References of chapter 3 ................................................................................ 99
Chapter 4| Early stage sustainability decision support model for homes ............. 1034.1 | Introduction ..................................................................................... 1034.2 | Framework proposal for early stage sustainability design model
1044.2.1 | Aim and scope ............................................................................................................. 1044.2.2 | Evaluation boundaries ................................................................................................. 1074.2.3 | Structure ...................................................................................................................... 1084.2.4 | Evaluation process ....................................................................................................... 112
4.3 | Selection of indicators ........................................................................ 1154.4 | Concluding remarks .......................................................................... 124References of chapter 4 ............................................................................... 126
Chapter 5| Early Stage Model for Sustainable Design – EasyMode ...................... 1275.1 | Introduction ..................................................................................... 1275.2 | Indicators approach .......................................................................... 127
5.2.1 | Efforts approach .......................................................................................................... 1285.2.2 | Quantitative approach ................................................................................................ 129
5.3 | Selection of materials ......................................................................... 1295.3.1 | LCA in early design process ........................................................................................ 1305.3.2 | How BSA tools address LCA ...................................................................................... 1315.3.3 | LCA methodological framework ................................................................................. 131
5.3.3.1 | Scope of the analysis and environmental impact categories .................................................. 1325.3.3.2 | Calculation method ....................................................................................................... 1335.3.3.3 | Functional unit ............................................................................................................. 1335.3.3.4 | System boundaries ......................................................................................................... 1335.3.3.5 | Reference service period .................................................................................................. 133
5.3.4 | LCA in EasyMode ......................................................................................................... 1345.3.4.1 | Calculation procedure .................................................................................................... 134
5.3.5 | Certified products and responsible sourcing ............................................................... 1365.3.5.1 | Certified products and responsible sourcing in early design .................................................. 1385.3.5.2 | Calculation procedure .................................................................................................... 138
5.3.6 | Recycle and reuse of materials and components ......................................................... 1385.3.6.1 | Calculation procedure .................................................................................................... 140
5.3.7 | Heat island ................................................................................................................... 141

xiii
5.3.7.1 | Heat island effect in early design ..................................................................................... 1425.3.7.2 | Calculation procedure .................................................................................................... 142
5.4 | Efficiency ......................................................................................... 1475.4.1 | Energy efficiency ......................................................................................................... 147
5.4.1.1 | Energy efficiency in early design ...................................................................................... 1495.4.1.2 | Calculation procedure .................................................................................................... 151
5.4.2 | Water efficiency ........................................................................................................... 1535.4.2.1 | Water efficiency in early design ....................................................................................... 1565.4.2.2 | Calculation procedure .................................................................................................... 157
5.4.3 | Waste Reduction ......................................................................................................... 1595.4.3.1 | Waste reduction in early design ...................................................................................... 1615.4.3.2 | Calculation procedure .................................................................................................... 161
5.5 | Health and Comfort ........................................................................... 1635.5.1 | Thermal Comfort ........................................................................................................ 163
5.5.1.1 | Thermal comfort in early design ...................................................................................... 1665.5.1.2 | Calculation procedure .................................................................................................... 167
5.5.2 | Visual Comfort ............................................................................................................ 1685.5.2.1 | Visual comfort in early design ......................................................................................... 1705.5.2.2 | Calculation procedure .................................................................................................... 171
5.5.3 | Acoustic Comfort ........................................................................................................ 1725.5.3.1 | Acoustic comfort in early design ...................................................................................... 1725.5.3.2 | Calculation procedure .................................................................................................... 173
5.5.4 | Indoor air quality ........................................................................................................ 1745.5.4.1 | Indoor air quality in early design .................................................................................... 1755.5.4.2 | Calculation procedure .................................................................................................... 175
5.6 | Functionality ..................................................................................... 1765.6.1 | Space Efficiency ........................................................................................................... 176
5.6.1.1 | Addressing space efficiency in pre-design .......................................................................... 1805.6.1.2 | Results ........................................................................................................................ 1825.6.1.3 | Development of Space Efficiency Indicator ....................................................................... 1905.6.1.4 | Calculation procedure .................................................................................................... 191
5.6.2 | Adaptability ................................................................................................................. 1945.6.2.1 | Adaptability at early design ............................................................................................ 1975.6.2.2 | Calculation procedure .................................................................................................... 197
5.6.3 | Design for all ............................................................................................................... 2025.6.3.1 | Addressing accessibility/design for all in pre-design .......................................................... 2055.6.3.2 | Calculation procedure .................................................................................................... 205
5.6.4 | Maintenance ................................................................................................................ 2065.6.4.1 | Maintenance at early design ........................................................................................... 207

xiv
5.6.4.2 | Maintenance in EasyMode ............................................................................................ 2085.6.4.3 | Calculation procedure .................................................................................................... 209
5.7 | Place ................................................................................................ 2145.7.1 | Initial recommendations .............................................................................................. 2155.7.2 | Efficient land use ......................................................................................................... 216
5.7.2.1 | Efficient land use in EasyMode ...................................................................................... 2185.7.2.2 | Calculation procedure .................................................................................................... 218
5.7.3 | Cultural value .............................................................................................................. 2225.7.3.1 | Calculation procedure .................................................................................................... 223
5.8 | Project Quality and management ........................................................ 2255.8.1 | Passive Design ............................................................................................................. 226
5.8.1.1 | Building orientation ...................................................................................................... 2285.8.1.2 | Design and shape .......................................................................................................... 2295.8.1.3 | Solar design strategies .................................................................................................... 233
5.9 | Life cycle costing ............................................................................... 2335.9.1 | Life cycle cost .............................................................................................................. 234
5.9.1.1 | Life cycle costing at early design ...................................................................................... 2355.9.1.2 | Calculation procedure .................................................................................................... 235
5.10 |Concluding Remarks ......................................................................... 239References of chapter 5 ............................................................................... 241
Chapter 6| EasyMode Verification .................................................................. 2536.1 | Introduction ..................................................................................... 2536.2 | Building description .......................................................................... 2536.3 | First Sustainability Assessment – SBToolPT-H ....................................... 2566.4 | EasyMode application ........................................................................ 258
6.4.1 | Environmental assessment ........................................................................................... 2596.4.1.1 | C1 Selection of materials ............................................................................................... 2596.4.1.2 | C2 Efficiency ............................................................................................................... 261
6.4.2 | Social and Functional assessment ................................................................................ 2646.4.2.1 | C3 Health and comfort ................................................................................................. 2646.4.2.2 | C4 Functionality .......................................................................................................... 265
6.4.3 | Location assessment .................................................................................................... 2676.4.3.1 | C5 Place ..................................................................................................................... 267
6.4.4 | Technical assessment ................................................................................................... 2686.4.4.1 | C6. Project quality and management ............................................................................... 268
6.4.5 | Economical assessment ................................................................................................ 2686.4.5.1 | C7. Life cycle cost ......................................................................................................... 268
6.4.6 | Assessment summary ................................................................................................... 269

xv
6.5 | Second Sustainability Assessment – SBToolPT-H .................................... 2716.6 | Concluding remarks .......................................................................... 274References of chapter 6 ............................................................................... 275
Chapter 7| Conclusions & Future Developments ............................................... 2777.1 | Conclusions ...................................................................................... 2777.2 | Future developments ......................................................................... 281
Appendix 1| Questinonaire sample ...................................................................... 283Appendix 2| Sumplemental questionairs’ data analysis .......................................... 305Appendix 3| EasyMode Workbook ....................................................................... 327


xvii
ABBREVIATIONS AND SYMBOLS
AA Allotment Area AEC Architecture, Engineering, and Construction ADF Average Daylight Factor ADP Abiotic Resource Depletion Potential for Elements AP Acidification Potential BIM Building Information Modelling BREEAM Building Research Establishment Environmental Assessment Method BSA Building Sustainability Assessment BSAT Building Sustainability Assessment Tools CED Cumulative Energy Demand CEN European Committee for Standardization CFC Chlorofluorocarbons CFH Classic Family Household DfA Design for All DfD Design for Disassembly DL Decree-Law EC Energy Costs ECS Energy Certification System EIDD European Institute for Design and Disability EP Environmental Profile EPD Environmental Product Declaration EU European Union GEA Gross External Area GIA Gross Internal Area GWP Global Warming Potential HVAC Heating, Ventilation and Air-Conditioning HCFC Hydrochlorofluorocarbons IAQ Indoor Air Quality IDP Integrated Design Process ISO International Standardization Organization L Length LAR,eq A-Weighted Sound Pressure Level, dB(A) LC Life Cycle LCA Life Cycle Assessment LCC Life Cycle Costing LCI Life Cycle Inventory LCIA Life Cycle Impact Assessment LEED Leadership in Energy and Environmental Design LSF Light Steel Framing MC Maintenance Costs MT Modular Timber MW Municipal Waste NIA Net Internal Area NLU Net Land Use Index NPV Net Present Value nUA non-Usable Area

xviii
NUA Net Usable Area
NR Non Renewable / Abiotic Resource Depletion Potential of Fossil Fuels
OC Operational Costs ODP Depletion Potential of The Stratospheric Ozone Layer PBB Performance Based Building PMV Predicted Mean Vote POCP Formation Potential of Tropospheric Ozone Photochemical Oxidants PPD Predicted Percentage of Dissatisfied PV Present Value r Radius
!"# Accessible Room in Room Typology i rCBm Reinforced Concrete and Brick Masonry RE Renewable Primary Energy RES Renewable Energy Systems RIBA Royal Institute of British Architects
!#$ Total Number of Rooms in the Room Typology i. RSP Reference Study Period SC Subcommittees SE Space Efficiency SI Severity Index SLCA Social Life Cycle Assessment SBR Sustainable Building Research SBTool Sustainable Building Tool SmT Stone Masonry and Timber STV Sustainable Target Value TC Technical Committee TDA Total Deployment Area TPE Total Primary Energy UHI Urban Heat Island USA United States of America VOC Volatile Organic Compounds W Width WA Wall Area WC Water Costs WHO World Health Organisation
NOTES
* - throughout the thesis one can find a superscript asterisk (*) next to the name of a BSA tool. This
topographic symbolism was adopted every time a tool’s procedure is applicable to office buildings
rather than dwellings.
xix
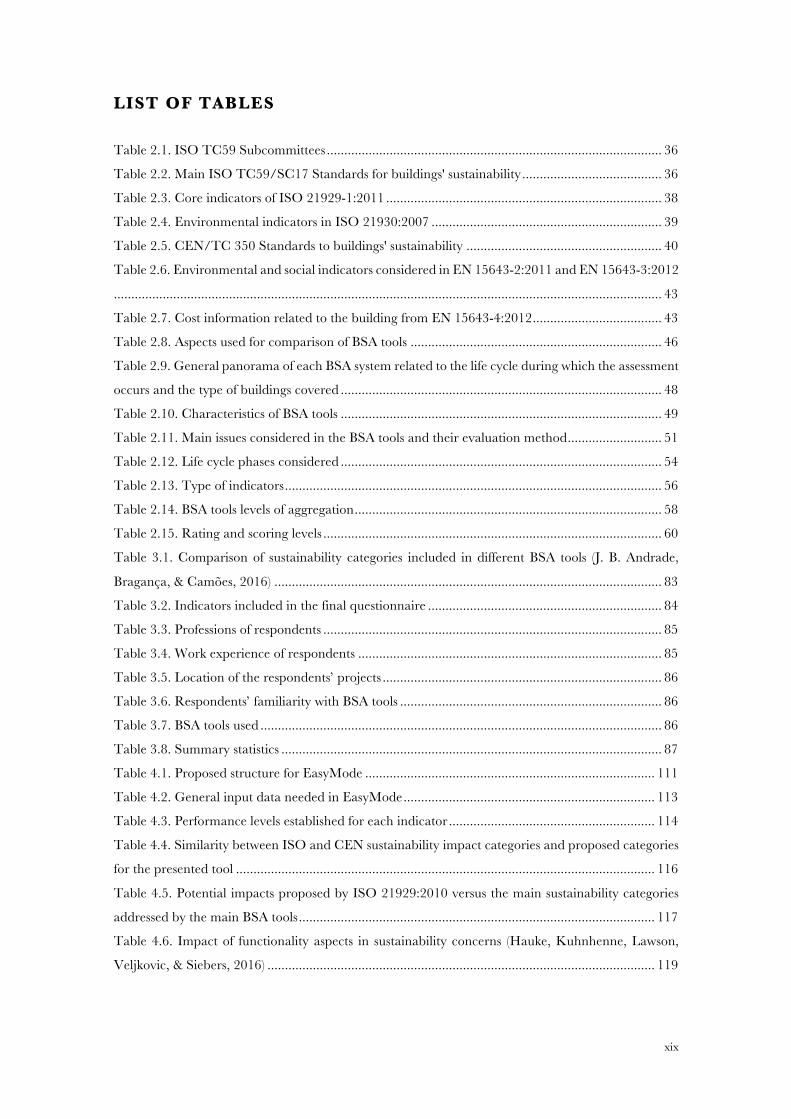
LIST OF TABLES
Table 2.1. ISO TC59 Subcommittees ................................................................................................ 36Table 2.2. Main ISO TC59/SC17 Standards for buildings' sustainability ........................................ 36Table 2.3. Core indicators of ISO 21929-1:2011 ............................................................................... 38Table 2.4. Environmental indicators in ISO 21930:2007 .................................................................. 39Table 2.5. CEN/TC 350 Standards to buildings' sustainability ........................................................ 40Table 2.6. Environmental and social indicators considered in EN 15643-2:2011 and EN 15643-3:2012
............................................................................................................................................................. 43Table 2.7. Cost information related to the building from EN 15643-4:2012 ..................................... 43Table 2.8. Aspects used for comparison of BSA tools ........................................................................ 46Table 2.9. General panorama of each BSA system related to the life cycle during which the assessment
occurs and the type of buildings covered ............................................................................................ 48Table 2.10. Characteristics of BSA tools ............................................................................................ 49Table 2.11. Main issues considered in the BSA tools and their evaluation method ........................... 51Table 2.12. Life cycle phases considered ............................................................................................ 54Table 2.13. Type of indicators ............................................................................................................ 56Table 2.14. BSA tools levels of aggregation ........................................................................................ 58Table 2.15. Rating and scoring levels ................................................................................................. 60Table 3.1. Comparison of sustainability categories included in different BSA tools (J. B. Andrade,
Bragança, & Camões, 2016) ............................................................................................................... 83Table 3.2. Indicators included in the final questionnaire ................................................................... 84Table 3.3. Professions of respondents ................................................................................................. 85Table 3.4. Work experience of respondents ....................................................................................... 85Table 3.5. Location of the respondents’ projects ................................................................................ 86Table 3.6. Respondents’ familiarity with BSA tools ........................................................................... 86Table 3.7. BSA tools used ................................................................................................................... 86Table 3.8. Summary statistics ............................................................................................................. 87Table 4.1. Proposed structure for EasyMode ................................................................................... 111Table 4.2. General input data needed in EasyMode ........................................................................ 113Table 4.3. Performance levels established for each indicator ........................................................... 114Table 4.4. Similarity between ISO and CEN sustainability impact categories and proposed categories
for the presented tool ........................................................................................................................ 116Table 4.5. Potential impacts proposed by ISO 21929:2010 versus the main sustainability categories
addressed by the main BSA tools ...................................................................................................... 117Table 4.6. Impact of functionality aspects in sustainability concerns (Hauke, Kuhnhenne, Lawson,
Veljkovic, & Siebers, 2016) ............................................................................................................... 119

xx
Table 4.7. First version of the list of indicators to use EasyMode. Blue indicators are those excluded
from the final list but included in the initial recommendations; yellow indictors are the ones excluded
due to their level of detail and lack of relevance in early design ....................................................... 121Table 4.8. Comparison of main issues considered in each BSA tools and in the proposed EasyMode
method, using the denomination proposed by CEN ........................................................................ 122Table 5.1. Indicators describing environmental impacts and embodied energy .............................. 133Table 5.2. Efforts to be considered under certified products and responsible sourcing indicator .... 138Table 5.3. Performance levels for certified products and responsible sourcing indicator ................ 138Table 5.4. Performance levels for certified products and responsible sourcing indicator ................ 140Table 5.5. Performance levels heat island effect indicator ................................................................ 143Table 5.6. Efforts to be considered under heat island effect indicator ............................................. 143Table 5.7. Solar reflectance mean values of coating materials (Mateus & Bragança, 2009) ............ 145Table 5.8 Heating, cooling, and DHW systems efficiencies and energy source used ....................... 151Table 5.9 Conversion factor from energy use to primary energy ("Despacho n.º 15793-D/2013," 2013)
........................................................................................................................................................... 151Table 5.10. Performance level description for local energy production ........................................... 153Table 5.11. Efforts' description for water efficiency indicator .......................................................... 157Table 5.12. Water flow (Q) according to water efficiency performance levels for water consumption
devices (l/min) ................................................................................................................................... 158Table 5.13. Efforts considered to promote recycling and waste generation reduction. ................... 162Table 5.14. Performance level description for waste reduction ........................................................ 163Table 5.15. Recommended design values for indoor temperature of residential buildings with HVAC
systems and temperature range for energy calculations (in bold are presented the recommended values
for design for new buildings) (CEN, 2007) ........................................................................................ 164Table 5.16. Recommended design values for PPD, PMV, Vertical air temperature difference between
head and ankles, range of floor temperature (CEN, 2007; ISO, 2005) ............................................ 165Table 5.17. Comfortable floor temperatures (Olessen, 1997) ........................................................... 166Table 5.18. Performance level description for thermal comfort ....................................................... 167Table 5.19. Recommended average daylight factors for dwellings (BSI, 2008) ............................... 169Table 5.20. Performance level description for visual comfort .......................................................... 171Table 5.21. Legal requirements for sound insulation in dwellings ................................................... 172Table 5.22. Preference levels for acoustic comfort ........................................................................... 174Table 5.23. Efforts for selecting low emissions building products .................................................... 176Table 5.24. Preference levels for airborne emissions ........................................................................ 176Table 5.25. Average areas for Portuguese detached houses (Oliveira, 2012) .................................. 179Table 5.26. Average areas for Portuguese detached houses, for principal activities performed within
the home (Oliveira, 2012) ................................................................................................................. 179Table 5.27. Construction Technologies main characteristics. .......................................................... 181Table 5.28. Distribution of analysed buildings per their construction technology. .......................... 182

xxi
Table 5.29. Statistical analysis for space efficiency analysis .............................................................. 183Table 5.30. Performance level’s establishment per quartiles ............................................................ 184Table 5.31. Data collection for space efficiency ............................................................................... 184Table 5.32. Minimum legal areas imposed by Portuguese ("Decreto-lei 650/75," 1975) ................ 189Table 5.33. Performance levels for the indicator use of available area ............................................ 193Table 5.34. Performance level's establishment according to quartile distribution of area availability per
occupant ............................................................................................................................................ 193Table 5.35. Aspects considered with flexibility indicator and corresponding grading ..................... 199Table 5.36. Indicative performance levels for flexibility provision ................................................... 200Table 5.37. Indicative performance levels for adaptability capacity ................................................ 201Table 5.38. Summary of requirements for homes accessibility by DL 163/2006 and ISO 21542:2011
........................................................................................................................................................... 204Table 5.39. Performance levels for accessibility ............................................................................... 206Table 5.40. Suggested minimum design lives for components (ISO, 2011) ..................................... 208Table 5.41. Performance level's establishment according to area percentage .................................. 210Table 5.42. Efforts for maintenance planning and commissioning .................................................. 211Table 5.43. Summary of commission guidelines for the plan establishment (IBEC, 2008) .............. 211Table 5.44. Performance level's establishment according to level of detail given to a maintenance plan
elaboration ........................................................................................................................................ 214Table 5.45. Efforts for ease of maintenance ..................................................................................... 214Table 5.46. Performance level's establishment according the number of measure to be taken to ease
the access to the services supply wires and pipes .............................................................................. 214Table 5.47. Indicative performance levels for Reuse of previously developed or contaminated land
........................................................................................................................................................... 219Table 5.48. Indicative performance level for implantation efficiency .............................................. 220Table 5.49. Indicative performance level for soil permeability ........................................................ 221Table 5.50. Efforts for improving biodiversity through native species use ....................................... 222Table 5.51. Indicative performance level for native species ............................................................. 222Table 5.52. Efforts for improving cultural value preservation .......................................................... 224Table 5.53.Indicative performance level for cultural value preservation ......................................... 224Table 5.54. Green strategies to be considered at early design (Brophy & Lewis, 2011) ................... 227Table 5.55.Best orientation study for Portuguese main regions ....................................................... 228Table 5.56. Performance level description for building orientation assessment ............................... 229Table 5.57. Superficial reference thermal transmittance coefficients for envelop and glazing elements
for Portugal: Uref [W/m2·K] ("Portaria 349-B/2013," 2013) ........................................................... 230Table 5.58. Performance level description for building solutions thermal transmittance coefficient230Table 5.59. Additional information for building airtightness rate .................................................... 232Table 5.60. Performance level description for building thermal bridge treatment .......................... 232Table 5.61. Efforts to be considered for solar design strategies quantification ................................. 233

xxii
Table 5.62. Preference levels investment costs ................................................................................. 237Table 6.1. Case study building description ....................................................................................... 256Table 6.2. Case study first SBToolPT-H assessment: results from parameters assessment ............... 257Table 6.3. Case study first SBToolPT-H assessment: results for Categories ...................................... 258Table 6.4. Case study first SBToolPT-H assessment: Final quantification – Sustainability level ...... 258Table 6.5. Solution 2 building elements description for LCA assessment ........................................ 259Table 6.6. Results from EasyMode indicator I1 ............................................................................... 260Table 6.7. Additional data for the energy assessment with SB_Steel tool ........................................ 262Table 6.8. Results from energy assessment with SB_Steel tool to solution 1 (kWh/m2·year) .......... 262Table 6.9. Results from energy assessment with SB_Steel tool to solution 2 (kWh/m2·year) .......... 262Table 6.10. EasyMode recommendations for thermal comfort ....................................................... 264Table 6.11. I12.1 Space efficiency data summary ............................................................................ 265Table 6.12. I12.2 Functional provision efforts .................................................................................. 266Table 6.13. Assumptions for I14. evaluation .................................................................................... 266Table 6.14. I15.1 cleaning evaluation ............................................................................................... 267Table 6.15. Building orientation evaluation ..................................................................................... 268Table 6.16. Envelope U-values and performance level .................................................................... 268Table 6.17. Maintenance activities scenarios ................................................................................... 269Table 6.18. EasyMode evaluation summary .................................................................................... 269Table 6.19. Case study second SBToolPT-H assessment: results from parameters assessment ........ 272Table 6.20. Case second first SBToolPT-H assessment: results for Categories ................................. 273Table 6.21. Case study second SBToolPT-H assessment: Final quantification – Sustainability level 273Table 7.1. Summary of EasyMode indicators framework ................................................................ 279

xxiii
LIST OF FIGURES
Figure 2.1. Modular structure of the life-cycle stage of a building from the physical point of view (ISO,
2011a) .................................................................................................................................................. 38Figure 2.2. Framework of CEN TC350 standardization .................................................................... 39Figure 2.3. Concept of sustainability assessment of buildings(CEN, 2010b) ...................................... 41Figure 2.4. Building life cycle stages according to CEN TC350 ........................................................ 42Figure 2.5. Distribution of indicator typologies. (a) Relation between number of indicators addressed
in a certain way and the total number of indicators. (b) Distribution of indicator typologies based on
the weights given to those indicators ................................................................................................... 55Figure 2.6. Distribution of BSA tools weightings ................................................................................ 58Figure 3.1. Influence of design decisions on life-cycle impacts and costs (adapted from Kohler and
Moffatt (2003)) ..................................................................................................................................... 72Figure 3.2. Representation of IDP model, (adapted from Larsson, 2009) .......................................... 74Figure 3.3. Stages of a buildings design process .................................................................................. 75Figure 3.4. Methodology schematic diagram ..................................................................................... 83Figure 3.5. Cultural category results ................................................................................................... 89Figure 3.6. Accessibility category results. (a) Summary all of results. Answers given by each profession
to: (b) ‘Access to public transportation’; (c) ‘Access to amenities’ and; (d) ‘Barrier-free accessibility’. 89Figure 3.7. Health and comfort category results. (a) Summary all of results. Answers given by each
profession to: (b) ‘Thermal comfort’; (c) ‘Acoustic comfort’; (d) ‘Indoor air quality’ and; (e) ‘Visual
comfort’. .............................................................................................................................................. 90Figure 3.8. Safety, security and health of workers and local population category results .................. 90Figure 3.9. Functionality category results ........................................................................................... 91Figure 3.10. Project quality category results ....................................................................................... 91Figure 3.11. Life cycle costs category results: (a) Summary all of results. Answers given by each
profession to: (b) ‘Initial cost’; (c) ‘Operation and maintenance costs’; (d) ‘Deconstruction costs’; (e)
‘Resettlement costs’; (f) ‘Local society cost-benefit’ and; (g) ‘Investment in innovative materials and
processes’ ............................................................................................................................................. 92Figure 3.12. Life cycle costs category results ....................................................................................... 93Figure 3.13. Energy efficiency category results ................................................................................... 94Figure 3.14. Site sustainability category results .................................................................................. 94Figure 3.15. Materials and resources use category results .................................................................. 94Figure 4.1. ‘Hamburger’ model (retrieved from Szigeti and Davis (2005) ....................................... 106Figure 4.2. Filled ‘hamburger’ model - translation and validation (retrieved from Szigeti and Davis
(2005)) ................................................................................................................................................ 106Figure 4.3. EasyMode boundary system ........................................................................................... 107Figure 4.4. Life cycle phases and related impacts considered in EasyMode .................................... 108Figure 4.5. EasyMode workflow ....................................................................................................... 109

xxiv
Figure 4.6. Sustainability criteria tree (adapted from Alanne (2004)) ............................................... 110Figure 4.7. EasyMode workbook ..................................................................................................... 112Figure 4.8. Flowchart of EasyMode .................................................................................................. 113Figure 4.9. Differences between Green Design aspects, common sustainability assessment aspects and
Sustainable building .......................................................................................................................... 118Figure 5.1 Effort indicators methodology flowchart ......................................................................... 128Figure 5.2 EasyMode print screen for effort indicators path selection ............................................. 128Figure 5.3. EasyMode print screen for qualitative approach indicators ........................................... 129Figure 5.4 Quantification approach flowchart ................................................................................. 129Figure 5.5. Schematic of LCA indicator evaluation framework ....................................................... 135Figure 5.6. Recycled content and reused materials indicator framework ........................................ 141Figure 5.7. Use of reused and recycled materials. ............................................................................ 141Figure 5.8. Diagram of the house setback from prevailing wind direction (based on (Institute for
Building Environment and Energy Conservation, 2008)) ................................................................. 144Figure 5.9. Holistic approach to nZEB ............................................................................................. 147Figure 5.10. Example of energy needs results table in EasyMode .................................................... 152Figure 5.11. Daily household water use in Portugal (Vieira, Almeida, Baptista, & Ribeiro, 2007) .. 154Figure 5.12. Example of ANQIP water efficiency label (@ANQIP) ................................................ 155Figure 5.13 Municipal waste content shares. The exterior ring corresponds to the fractions that the
waste should be sorted into, while the internal ring depicts the MW contents shares per weight
(Bokalders & Block, 2010) ................................................................................................................. 160Figure 5.14. Acceptable design values for operative indoor temperature during cooling season of
residential buildings without cooling system, as a function of the exponentially-weighted running mean
of the outdoor temperature (CEN, 2007) .......................................................................................... 165Figure 5.15. Probability of switching on the lights depending on daytime, daylight and orientation
(Hunt, 1980) ...................................................................................................................................... 168Figure 5.16. Distribution of classic families per dimension (n. of family members) in the Portuguese
CFH; decennial 2011 (INE, 2014a) .................................................................................................. 178Figure 5.17. Distribution of classic families per usable area echelon per inhabitant, in the CFH in
Portugal; decennial 2011 (INE, 2014a) ............................................................................................ 178Figure 5.18. Statistical distribution of obtained data; (a) distribution of different areas assessment for
all houses addressed; (b) distribution of the obtained ratios, accounting for all buildings. ............... 183Figure 5.19. Benchmarking for NUA per occupant ......................................................................... 184Figure 5.20. Comparison of the relation between (a) NIA and GEA and (b) NUA and GEA of all
buildings analysed ............................................................................................................................. 186Figure 5.21. Mathematical correlation between the NUA and GEA of the buildings analysed: (a)
comparison of all results;(b) modular timber; (c) light steel framing; (d) stone masonry and timber; (e)
reinforced concrete and brick masonry ............................................................................................ 186

xxv
Figure 5.22. Efficiency inversion points between the different construction solutions. (a) Inversion point
between timber and light steel framing solutions; (b) inversion point between timber and reinforced
concrete + brick masonry solutions .................................................................................................. 188Figure 5.23. Use of available area indicator assessment flowchart ................................................... 191Figure 5.24. Area availability assessment flowchart .......................................................................... 193Figure 5.25. Relation between building conversion capacity and sustainability (Durmisevic, 2006) 195Figure 5.26. Stewart Brand’s Six S’s diagram (adapted from Guy et al., 2008) ............................... 196Figure 5.27. The hierarchical structure adopted in Durmisevic (2006) model. ................................ 198Figure 5.28. Schematic representation of cleaning accessibility of external glass surfaces ............... 210Figure 5.29. Process for low-energy building design (adapted from Keeler and Vaidya (2016)) ...... 226Figure 5.30. Framework for building orientation guidance .............................................................. 229Figure 5.31. Orientation range explanation ..................................................................................... 229Figure 5.32. Schematic of U-value evaluation framework ............................................................... 231Figure 6.1. Schematics representing the building's shape ................................................................. 254Figure 6.2. 3D representation of the building; the three pictures show the different façade of the
building (CoolHaven, 2017) .............................................................................................................. 254Figure 6.3. Building’s floor plan; (a) ground floor plan and, (b) first floor plan (adapted from
CoolHaven, 2017) ............................................................................................................................. 255Figure 6.4. Input data spreadsheet- EasyMode case-study ............................................................... 259Figure 6.5. Input for I1 assessment in EasyMode case-study ........................................................... 260Figure 6.6. Graphical representation of energy efficiency indicator in EasyMode .......................... 262


27
1 GENERAL INTRODUCTION AND
MOTIVATION
Why sustainability?
The term sustainability is currently present in all political agendas and it is one of the vogue words in all
industries. The building design is no exception. Although there is a number of definitions of the term,
little insights on how to apply it into real practice are known by most of the practitioners. The term
remains mainly known as it was defined in 1987 “Sustainable development is development that meets the needs
of the present without compromising the ability of future generations to meet their own needs” (CEN, 1987). From this
definition and all other that followed, it is commonly agreed that sustainability has three cornerstones:
society, environment, and economy. As the three affect and are affected by the way we live, personal
experiences and background may and will influence the way sustainability is perceived and interpreted.
In this sense, it is essential to establish and spread the knowledge towards clarifying ideas to pursue a
more sustainable future.
The continuous increase of environmental threatening human activities and biased richness
distribution, drive overwhelming environmental problems, demanding an urgent response. Population
growth requires more resources’ exploitation and produces more waste, endangering, even more, the
environment, if consumption and actual lifestyle are kept unchanged. Sustainability principles aim to
diminish environmental degradation and promote social equality by supporting social and economic
progress but capable of preserving or improving the natural environment (Hens & Nath, 2003).

C H A P T E R 1 | I N T R O C T I O N
28
Nevertheless, applying sustainable principles: (i) social progress which recognises the needs of
everyone; (ii) effective protection of the environment; (iii) prudent use of natural resources; and (iv)
maintenance of high and stable levels of economic growth and employment (DEFRA, 2002 as cited in
Sassi (2006)), is not an easy task. As already said, the interpretation of sustainability is quite personal
and, to follow its principles it necessary affects the way people live. One needs to accept and learn to
live with smaller resources consumption per capita, redefine their sense of quality of life and be less
self-centred. As von Weizsäcker, Lovins, and Lovins (1998) defended resources consumption should
be cute half while doubling wealth. Sustainable consciousness brings altruism, long-term thinking, and
multidisciplinary networks.
Although current sustainability concept had its first steps in the late eighties, the problems associated
with sustainability have been in the mind of the world citizens since, at least, the end of the
XVIII century. Publications from 1798 (Malthus, 1798) or one hundred and seventy years later
(Meadows, Meadows, Randers, & Behrens III, 1972) showed the growing preoccupation with the
exponential increase in population together with the raise of resources consumption, in opposition to
its replacement.
Sustainable building design
Buildings have an undeniable role in people’s life. People in developed countries spend nearly 90% of
their time inside buildings (Bokalders & Block, 2010). Buildings’ first and core role is to provide shelter
and safety from whatever outdoor conditions one may feel threaten by, beyond all the other usages
endorsed inside buildings, in our society. The way people’s life is managed across buildings
corroborates their major influence in each society. People react to buildings, and buildings react to
people. Local buildings quality and architecture deeply connect with culture and life quality
(Mansfield, 2009). The way buildings are designed, built, used, and their disposal has a meaningful
impact on natural, social, and economic environments.
The need for combining sustainability and construction in one term only was claimed by Kibert (1994),
mentioning the need to decrease resources use and waste production. Buildings should be able to make
a positive influence in people’s life, supply a social environment capable of addressing their needs and
cultural backgrounds, and enhance their health and wellbeing. Also, buildings should treat the
environment gently by reducing the adverse impacts associated with their life cycle (construction, use
and end-of-life).
Is it possible to have both? Yes. These two targets are not mutually exclusive. While improving the first,
the second can be assured and even promoting economic viability and stability. In fact, another way
would not make a sustainable building. What is the point to build a highly efficient building, if no one
wants to occupy it? It would become a waste of resources, and potentially create a social critical point
as a vacant and abandoned building, thus not meet sustainability principles at all. When users and

E A R L Y S T A G E D E S I G N M E T H O D O L O G Y T O E N S U R E L I F E C Y C L E S U S T A I N A B I L I T Y O F R E S I D E N T I A L B U I L D I N G S
29
community cherish a building, it improves social cohesion, and extents its life-cycle by being taken
care of, becoming a part of the local cultural identity. Preserving buildings is also a way to improve the
local economy. This should be a sustainable building; a building built to last, with minimal
environmental impact and socially cherished.
There are already technology and knowledge to promote sustainable buildings, so what is failing?
Robichaud and Anantatmula (2011), and Chandramohan, Narayanan, Gaurav, and Krishna (2012)
shown that poor or incomplete pre-design can compromise the effectiveness of green building projects.
A project that is thought since its beginning considering the buildings whole life, has its needs counted
early and its cost is foreseen. Design phases are those where out-of-the-box solutions can be studied
and implemented to improve sustainable performance, and there are dozens of them. Creating
different possibilities, comparing them and their performance is of main importance for designers. This
allows designers to find long-term solutions that assure users’ well-being, minimising the needs for
natural resources exploitation and with economic savings. Decisions made early in the project do not
compromise the efficacy of design decisions taken latter. Thus, essential sustainability goals should be
defined early in the project to set meaningful targets against which to evaluate alternatives and levels
of accomplishment. To ease understanding and fruitful achievement goals should be measurable
targets rather than prescriptive solutions (Keeler & Burke, 2009). The benefits of doing so are the
possibility to improve social environment with lower pressure on the natural environmental and at
controlled costs (Brophy & Lewis, 2011). Although reasonable enough, this does not correspond to the
conventional practice in building design. Thus, acting at early design stages is fundamental for
sustainable design and sustainable buildings.
Why homes?
Within all buildings, homes are those allowing people to be themselves. Homes should be able to
express the personality, culture and lifestyle of its inhabitants (Garcia, Uzzell, Real, & Romay, 2005).
They should be the foremost adapted building to one’s needs. Without a proper home, anyone’s
attempt to “change the world” is a difficult task. Beyond that, housing represents 75% of the
European’s buildings stock, in square meters (BPIE, 2011). Thus, it has a significant role in the building
sector (un)sustainability. In Portugal, single family buildings represent 87% of the residential buildings
(INE & LNEC, 2013), making it the basis for this work.
There is no unique recipe to design a sustainable home. Sustainability concept is still difficult to
quantify as it is open to interpretations and involves many criteria. Sustainability assessment tools and
international standards attempt to establish the criteria needed to define a building as sustainable.
However, although existent, while designing a building, practitioners have lack of information on how
to pursue sustainability, what targets to attain for. There is a lack in empowering designers with

C H A P T E R 1 | I N T R O C T I O N
30
practical sustainability knowledge, through easy-to-use tools and recommendations, to guide them
since early design towards sustainable design. The work presented in this thesis aims to fulfil this gap.
1.1 | GOALS AND SCOPE
This research aimed at overcoming existing barriers to sustainable design. A methodology to ensure
life-cycle sustainability of single family buildings during early design stages was developed enabling the
implementation, integration, and management of sustainability constraints, through a simple and easy
to use interface. The primary goal of this tool is to aid designers at early design stages, building more
sustainable homes by making them aware of how sustainability, across its three cornerstones –
environment, society, and economy – is deeply linked to all design criteria, constraints, and decisions.
Additionally, the tool was thought to increase awareness across all stakeholders, promoting and
encouraging the adoption of more efficient solutions.
The successful completion of this work represents a significant contribution for both, research state-of-
the-art and real practice activities towards sustainable design. It strengthens scientific knowledge
towards an integrated life-cycle approach, concerning a set of key indicators to be considered since
early design phases. Also, this research delivered an easy and practical tool for integrated sustainable
design, making sustainability concepts accessible and easily understandable for architecture,
engineering, and construction practitioners.
1.2 | OUTLINE OF THE THESIS
This thesis advocates such a comprehensive approach and its structure reflects the proposed objectives.
Besides this introduction, it unfolds through six chapters complemented by four appendices.
Chapter 2 introduces a state-of-the-art of the most relevant international normative framework
regarding buildings’ sustainability assessment and existing sustainability assessment tools. A deep
analysis of the International Standard Organisation and European Standardisation Committee
normative framework was carried out to identify the main aspects accepted as being required in a
building sustainability assessment method. Also, a thorough investigation and comparison of the most
well-known building sustainability assessment methods for single family buildings were undertaken as
to identify the pros and cons of such methods and practices. The output of this review established the
development of the research subsequently presented.
Chapter 3 intends to insight on how sustainability concepts are and should be considered throughout
a building’s design stages. This chapter starts to address the main stages of a building design process,
mainly focusing in the early stages. The second part of this chapter presents a survey carried out among
design practitioners unveiling their perception on sustainability concepts and their concerns about

E A R L Y S T A G E D E S I G N M E T H O D O L O G Y T O E N S U R E L I F E C Y C L E S U S T A I N A B I L I T Y O F R E S I D E N T I A L B U I L D I N G S
31
considering them in their projects. The purpose of this research was to establish the baseline for the
development of the sustainable design aiding tool in the following chapters.
Chapter 4 is the core of this work. It presents the approach and the framework developed for the early
stage support tool for homes’ sustainable design developed within this research. The given name of the
tool was “Early Stage Model for Sustainable Design– EasyMode.” The work reported in this chapter
represents the basis of the tool, its premises, organisation, and framework. The chapter describes the
aim and scope of EasyMode, its approach, the building sustainability indicators in which the tool is
based on and the evaluation process framework. The output of this work supported the development
of the indicators assessment procedure, presented in Chapter 5.
Chapter 5, the second main part of this thesis, describes the calculation procedures, and assessment
methods for all the sustainability indicators included in EasyMode. The procedures exposed sustain the
EasyMode evaluation workbook. The chapter presents the preparation of the workbook and also the
work that lead to establishing the calculation procedures as they were defined.
Chapter 6 provides the validation of EasyMode tool, through three assessments to a case study dwelling.
Firstly, the dwelling as assessed using an independent third-party building sustainability assessment
tool – SBToolPT-H, in order to determine its sustainability performance. Next, to the same dwelling,
EasyMode was applied, enabling possible changes in the project as if designers used the tool during its
development. Lastly, SBToolPT-H assessment was again carried out to the dwelling but accounting the
changes imposed by EasyMode, to confirm its relevance and effect when attaining sustainable design.
At last, Chapter 7 summarises the main conclusions from the previous chapters. Some insights for
future developments are presented as well as suggestions for further research is this field of knowledge.

C H A P T E R 1 | I N T R O C T I O N
32
REFERENCES OF CHAPTER 1
Bokalders, V., & Block, M. (2010). The Whole Building Handbook - How to design healthy, efficient and sustainable buildings (1st ed.). UK and USA: Earthscan co-published with RIBA Publishing
Brophy, V., & Lewis, J. O. (2011). A green Vitruvius: Principles and practise of sustainable architectural design (2nd Edition ed.). United Kingdom: Earthscan.
Buildings Performance Institute Europe. (2011). Europe’s buildings under the microscope - A country-by-country review of the energy performance of buildings. Brussels,: BPIE.
Chandramohan, A., Narayanan, S. L., Gaurav, A., & Krishna, N. (2012). Cost and time overrun analysis for green construction projects. International Journal of Green Economics, 6(2), 167-177. doi: doi:10.1504/IJGE.2012.050340
Garcia, R. M., Uzzell, D. L., Real, J. E., & Romay, J. (2005). Introduction. In R. M. Garcia, D. L. Uzzell, J. E. Real & J. Romay (Eds.), Housing, Space and Quality of Life (pp. 1-5). United Kingdom: Ashgate Pub Ltd.
Hens, L., & Nath, B. (2003). The Johannesburg Conference. Environment, Development and Sustainability, 5(Numers 1-2), 7-39
Instituto Nacional de Estatística, & Laboratório Nacional de Engenharia Civil. (2013). O parque habitacional e a sua reabilitação - análise e evolução 2001-2011. Portugal.
Keeler, M., & Burke, B. (2009). Fundamentals of Integrated Design for Sustainable Building (1st ed. ed.). United Statesof America: Wiley.
Kibert, C. J. (1994). Establishing principles and model for sustainable construction. Proceedings of the First International Conference of CIB TG 16: Sustainable Construction, Tampa, USA.
Malthus, R. T. (1798). An Essay on the Principle of Population. London: J. Johnson. Mansfield, J. (2009). Sustainable refurbishment: policy direction and support in the UK. Structural Survey,
27(2), 148-161. doi: doi:10.1108/02630800910956470 Meadows, D. H., Meadows, D. I., Randers, J., & Behrens III, W. (1972). The Limits to Growth. Retrieved
from A report to the Club of Rome. Robichaud, L. B., & Anantatmula, V. S. (2011). Greening Project Management Practices for Sustainable
Construction. Journal of Management in Engineering, 27(1), 48-57. doi: 10.1061/(ASCE)ME.1943-5479.0000030
Sassi, P. (2006). Strategies for sustainable architecture. London; New York: Taylor & Francis. The World Commission on Environment and Development. (1987). Brundtland Report: Our Common Future.
Great Britain: Oxford University. von Weizsäcker, E. U., Lovins, A. B., & Lovins, L. H. (1998). Factor Four: Doubling Wealth, Halving Resource
Use - A Report to the Club of Rome. United Kingdom: Earthscan.

33
2 SUSTAINABLE ASSESSMENT TOOLS AND
NORMATIVE FRAMEWORK
2.1 | INTRODUCTION
Since the nineties, several industrial sectors start to recognise their significant contribution to the
environment degradation and Architecture, Engineering and Construction (AEC) is not an exception.
Since then, the nature of the built environment, the way buildings are designed, built, and operated
has changed to reduce their environmental impact (Crawley & Aho, 1999; Mateus et al., 2011). The
awareness about the consequences of environment impacts leads to a growing market demand for
environmentally friendly products and an increasing of conscience and restrictions in public policies
regarding environmental and sustainability issues (Andrade & Bragança 2011). Nonetheless, life
quality, wellbeing, and comfort conditions must be ensured inside buildings, not forgetting the outdoor
aesthetics, the built heritage and traditions that should be preserved.
A building’s influence on sustainability concerns is undeniable. Ideally, property development should
lead to social quality improvement while mitigating environmental impacts economically and
efficiently. From this necessity, methods and tools capable of ensuring and assessing buildings’
sustainability, involving the relations between built, natural and social systems, have emerged (Mateus,
Braganca, & Koukkari, 2008). Building sustainability assessment (BSA) tools aim at reporting data to
aid decision-making, design and building use, while considering the aspirations of sustainable

C H A P T E R 2 | S U S T A I N A B L E A S S E S S M E N T T O O L S A N D N O R M A T I V E F R A M E W O R K
34
construction, rather than just rating sustainability levels (Kaatz, Root, Bowen, & Hill, 2006; Tarja
Häkkinen et al., 2012). Hundreds of parameters are addressed in those, some of them interrelated and
some contradictory, inputting high complexity to the assessment process. All the methodologies have
different approaches, creating the wrong idea that the concept of sustainable building is subjective and
causes difficulties when comparing results, as well. To overcome these constraints, both the
International Organization for Standardisation (ISO) and the European Committee for
Standardisation (CEN) have been actively working to define standard requirements for buildings
sustainability assessments. Moreover, sustainable construction is on the agenda of main international
and European directives and recommendations, going far beyond standards and as they are taking
important steps into implementing more sustainable directives and regulations.
In the next chapters, the normative framework regarding buildings sustainability is drawn, followed
by a brief presentation and comparison of existing BSA tools.
2.2 | GUIDELINES FOR CONSTRUCTION SECTOR
International regulations for buildings is quite vast, dealing with almost all aspects of a building. There
are standards that address building structures’ dimensioning, energy consumption, durability and
management, materials’ environmental impact, etc. This goes from the boarder aspects to very specific
as fire control systems, accessibility for people with disabilities. It would be impossible and exhaustive,
even to read, to analyse and expose all the existing regulations. In this sense, only those with high
impact in buildings’ sustainability are mentioned in the next sections. Nevertheless, it is the authors
knowledge that there a lot more guides and regulations that could have been analysed here. This
knowledge does not invalidate that, every time a standard, regulation, or law is relevant for an aspect
in the discussion, throughout this document, a reference, and a brief explanation of it will be presented.
2.2.1 | International Standards
In what regards the International Standardisation Organisation (ISO) standards, there are four
Technical Committees (TC) responsible for the development of several standards related to building
Life-Cycle and Sustainability:
• ISO/TC 59 - Buildings and civil engineering works;
• ISO/TC 163 - Thermal performance and energy use in the built environment;
• ISO/TC 205 - Building environment design;
• ISO/TC 207 - Environmental management.
In the early nineties, when ISO took care of standardisation, the first standards for environment life-
cycle assessment (LCA) were developed, under the competency of TC 207/SC 5:

E A R L Y S T A G E D E S I G N M E T H O D O L O G Y T O E N S U R E L I F E C Y C L E S U S T A I N A B I L I T Y O F R E S I D E N T I A L B U I L D I N G S
35
• ISO 14040 – Principles and framework (ISO,1997);
• ISO 14041 – Goal and Scope (ISO, 1998);
• ISO 14042 – Life Cycle Impact Assessment (ISO, 2000a);
• ISO 14043 – Interpretation (ISO, 2000b).
In 2006 they were reviewed and renewed versions were launched: ISO 14040 – Principles and
framework (ISO, 2006a), and ISO 14044 – Requirements and guidelines (ISO, 2006b), which
substituted the 14041, 14042 and 14043 standards. These were revised again in 2010. Together these
two standards describe the principles and requirements, the framework, and guidelines for a LCA.
They include also the definition and the explanation of how to perform the goal and scope, the life
cycle inventory analysis (LCI), the life cycle impact assessment (LCIA), the life cycle interpretation
phase, reporting and critical review of the LCA, the relationship between the LCA phases and
conditions for use of value choices and optional elements (ISO, 2011b). ISO 14040 and 14044 were
specifically developed to assess products, processes, and services.
Although LCA standard methods can be directly applied to the building sector – building products,
single buildings or even groups of buildings – it might sometimes be not an easy task due to buildings
exceptional characteristics, as for example ((IEA), 2001):
• the life expectancy of a building is both long and unknown;
• buildings are site specific and many of the impacts are local;
• buildings and their components/products are heterogeneous in their composition;
• the building life cycle includes specific phases - construction, use and demolition - which have
variable consequences on the environment;
• building is highly multi-functional, which makes it difficult to choose an appropriate
functional unit;
• building creates an indoor living environment, that can be assessed in terms of comfort and
health;
• buildings are closely integrated with other elements in the building environment, particularly
urban infrastructure.
In what regards life cycle costing (LCC) for buildings, ISO 15686-5:2008 (ISO, 2008), from
ISO/TC59/SC14, gives guidelines for performing life cycle cost analyses of buildings and constructed
assets and their parts. LCC allows identifying and evaluating the relevant costs arising from owning,
operating, maintaining, and disposing a building, in its project phase.
Social Life Cycle Assessment (SLCA), is not yet been singly standardised by ISO. However, there is a
standard responsible for providing guidelines to enterprises corporate social responsibility – ISO
26000:2010. According to ISO, this standard is intended to assist organisations in contributing to

C H A P T E R 2 | S U S T A I N A B L E A S S E S S M E N T T O O L S A N D N O R M A T I V E F R A M E W O R K
36
sustainable development, going beyond legal compliance, recognizing that compliance with law is a
fundamental duty of any organization and an essential part of their social responsibility. ISO 26000
also advises that societal, environmental, legal, cultural, political, and organizational diversity, as well
as differences in economic conditions, while being consistent with international norms of behaviour,
should be accounted. Notwithstanding, ISO has a Specific Technical Committee - ISO/TC 59
(Building Construction) to deal with standards regarding buildings and civil engineering works. Within
this TC there are nine subcommittees (SC) each one assigned to a building topic (Table 2.1).
ISO/TC 59/SC 17 deals specifically with standards for buildings sustainability specifically, Table 2.2
briefly lists the already published and the under development standards from TC 59/SC17.
Table 2.1. ISO TC59 Subcommittees
Subcommittee Subcommittee Title
ISO/TC 59/SC 2 Terminology and harmonization of languages
ISO/TC 59/SC 3 Functional/user requirements and performance in building construction ISO/TC 59/SC 8 Sealants ISO/TC 59/SC 13 Organisation of information about construction works ISO/TC 59/SC 14 Design life ISO/TC 59/SC 15 Performance description of houses ISO/TC 59/SC 16 Accessibility and usability of the built environment ISO/TC 59/SC 17 Sustainability in buildings and civil engineering works ISO/TC 59/SC 18 Construction procurement
Table 2.2. Main ISO TC59/SC17 Standards for buildings' sustainability
Number Name Status ISO 15392:2008 Sustainability in building construction - General principles Published
ISO/TS 12720:2014 Sustainability in buildings and civil engineering works - Guidelines on the application of the general principles in ISO 15392 Published
ISO 21929-1: 2011 Sustainability in building construction - Sustainability indicators - Part 1: Framework for development of indicators for buildings Published
ISO 21929-2:2015 Sustainability in building construction - Sustainability indicators - Part 2: Framework for the development of indicators for civil engineering works
Published
ISO 21930:2007 Sustainability in building construction - Environmental declaration of building products
Published/Under revision
ISO 21931-1:2010 Sustainability in building construction - Framework for methods of assessment of the environmental performance of construction works - Part 1: Buildings
Published
ISO/CD 21931-2 Sustainability in building construction - Framework for methods of assessment of the environmental performance of construction works - Part 2: Civil engineering works
Under development
ISO/NP 20887 Design for Disassembly and Adaptability of Buildings Under development
ISO 16745:2015 Environmental performance of buildings - Carbon metric of a building - Use stage Published
ISO/DIS 16745-1 Sustainability in buildings and civil engineering works - Carbon metric of a building during use stage - Part 1: Calculation, reporting and communication
Under development
ISO/DIS 16745-2 Sustainability in buildings and civil engineering works - Carbon metric of a building during use stage - Part 2: Verification Under development

E A R L Y S T A G E D E S I G N M E T H O D O L O G Y T O E N S U R E L I F E C Y C L E S U S T A I N A B I L I T Y O F R E S I D E N T I A L B U I L D I N G S
37
General principles for buildings and construction works sustainability, throughout their life cycle are
established in ISO 15392:2008. This standard does not propose benchmarking for sustainability
assessment raking, it rather gives a brief inception to the concept of sustainable construction and its
principles. The guidance for application these general principles is provided by the
ISO/TS 12720:2014. A systematic approach is given to encourage the application of sustainability
concerns during design and construction by all building stakeholders.
For further guidance in assessing construction’s sustainability, ISO 21929 and ISO 21931 series need
to be accounted. ISO 21929-1:2011 and ISO 21929-2:2015 provide framework, recommendations,
and guidelines for the development and selection of appropriate sustainability indicators for buildings
and civil engineering works, respectively. The proposed framework includes a list of environmental,
social, and economic impacts key indicators, for buildings’ sustainability evaluation and describes how
they should be used. Some of the indicators presented are mandatory while others may be helpful
when setting targets for and when assessing sustainable buildings. To aid the indicators selection both
standards provide rules for establishing a complete system of indicators. Despite, helping in the
identification and development of sustainability indicators, ISO 21929-1:2011 and ISO 21929-2:2015
do not give guidelines for the weighting or aggregating results, this must be performed by the users.
The proposed indicators are collected and presented in Table 2.3.
ISO 21929-1:2011 and ISO 21929-2:2015, for buildings and civil engineering works, respectively,
expose the methods recommended by ISO to quantify and assess the environmental indicators
screened in ISO 21929 series. Both standards highlight key issues to be assessed at every stage of the
construction life cycle, from design to deconstruction, as presented in Figure 2.1. The relevance
relationship of specific environmental issues as climate change, consumption of clean water, air
emissions or wind effect, to the different life cycle stages is presented. According to the level of this
relationship, addressing the specific environmental issue in a life cycle stage shall be mandatory. For
instance, climate change is mandatory in all life cycle stages, while sun shading and glare is only
mandatory to be addressed in use phase. Aspects related to project management are considered as
voluntary while the consideration of social aspects that are influenced by local environment are
additional and voluntary.
The elaboration of Environmental Product Declarations (EPD) to building products is standardised by
ISO 21930:2007, which is now under revision. This standard complements ISO 14025 for the type III
EPD of building products by providing the principles, specifications, and requirements. This type of
EPD are primarily intended to be used in business-to-business be communication, but they can also
be used in business-to-consumer communication. According to ISO 21930 indicators presented in
Table 2.4 shall be used to express the impacts and aspects related to building products.

C H A P T E R 2 | S U S T A I N A B L E A S S E S S M E N T T O O L S A N D N O R M A T I V E F R A M E W O R K
38
Table 2.3. Core indicators of ISO 21929-1:2011
Figure 2.1. Modular structure of the life-cycle stage of a building from the physical point of view (ISO, 2011a)
Sub -aspects considered
Sustainability field
Environmental Social Economic
Change deterioration
Depletion of
resources Health Satisfaction Equity Cultural
Value Economic
value Productivity
Access to services
- Public transportation - Personal modes of transportation - Green and open spaces - User relevant basic services
x x x x x x
Aesthetic quality - x x
Land - x
Accessibility - Building site - Building x
Harmful emissions
- Potential impact on climate change - Potential impact on the depletion of stratospheric ozone layer
x
Non-renewable resources - x
Fresh water - x
Waste - x
Indoor environment
- Indoor condition; - Indoor air quality
x x x
Safety - x x
Serviceability - x x x
Adaptability
- Adaptability for changed use purpose - Adaptability for climate change
x x
Costs - x x
Maintainability - x x

E A R L Y S T A G E D E S I G N M E T H O D O L O G Y T O E N S U R E L I F E C Y C L E S U S T A I N A B I L I T Y O F R E S I D E N T I A L B U I L D I N G S
39
Table 2.4. Environmental indicators in ISO 21930:2007
Environmental impacts Environmental impacts expressed in terms of the impact categories Use of resources and renewable primary energy
climate change (greenhouse gases) depletion of non-renewable energy resources depletion of the stratospheric ozone layer depletion of non-renewable material resources acidification of land and waste sources use of renewable material resources eutrophication use of renewable primary energy
Waste to disposal consumption of fresh water Emission to water, soil and to indoor air Other additional environmental information
ISO is developing a standard that aims at designing buildings having in mind their deconstruction and
disassembly – ISO/NP 20887. Implementing this standard will aid reduce waste disposal, promoting
materials reuse and recycling, and thus, reduce environmental impacts, and raise the buildings’
residual costs. There is not yet many information available regarding this new work item proposal.
In 2015, ISO 16745:2015 was published and two more standards in this series are under
development – ISO/DIS 16745-1 and ISO/DIS 16745-2. These seek to provide requirements and
guide buildings’ CO2 emissions quantification, during operation phase.
2.2.2 | European Standards – CEN
CEN Technical Committee 350 was created in 2005. It aimed at developing voluntary, harmonised
and horizontal approaches to assess and promote sustainable construction aspects, for both new and
existing construction works (CEN, 2016a). With this in mind, a framework was established to organise
and expose the indented scope of the standards, as shown in Figure 2.2. The standards under this TC
and their status standards are presented in Table 2.5.
Figure 2.2. Framework of CEN TC350 standardization

C H A P T E R 2 | S U S T A I N A B L E A S S E S S M E N T T O O L S A N D N O R M A T I V E F R A M E W O R K
40
Table 2.5. CEN/TC 350 Standards to buildings' sustainability
Number Name Status
CEN/TR 15941:2010 Sustainability of construction works - Environmental product declarations - Methodology for selection and use of generic data Published
EN 15643-1:2010 Sustainability of construction works - Sustainability assessment of buildings - Part 1: General framework Published
EN 15643-2:2011 Sustainability of construction works - Assessment of buildings - Part 2: Framework for the assessment of environmental performance Published
EN 15643-3:2012 Sustainability of Construction Works - Assessment of Buildings - Part 3: Framework for the assessment of social performance Published
EN 15643-4:2012 Sustainability of Construction Works - Assessment of Buildings - Part 4: Framework for the assessment of economic performance Published
EN 15804:2012 + A1:2013
Sustainability of construction works - Environmental product declarations - Core rules for the product category of construction products
Published
EN 15942:2011 Sustainability of construction works - Environmental product declarations - Communication format business-to-business Published
EN 16309:2014 + A1:2014
Sustainability of construction works - Assessment of social performance of buildings – Calculation methods Published
EN 15978:2011 Sustainability of construction works - Assessment of environmental performance of buildings - Calculation method Published
EN 16627:2015 Sustainability of construction works - Assessment of economic performance of buildings - Calculation methods Published
FprCEN/TR 16970 Sustainability of construction works - Guidance for the implementation of EN 15804
Under approval
FprCEN/TR 17005 Additional Indicators for the declaration of environmental performance of construction products and for the assessment of the environmental performance of buildings.
Under approval
prEN 15643-5 Sustainability of construction works - Sustainability assessment of buildings and civil engineering works - Part 5: Framework for the assessment of sustainability performance of civil engineering works
Under approval
This series of standard intend to enable comparison of sustainability assessment results assessments,
which do not occur with the different existing BSA tools. They are aimed to allow sustainability
assessment, including environmental, social, and economical performances of a building, to be made
concurrently and on an equal footing, based on the same technical characteristics and functionality of
the object of assessment. The concept of a BSA and the life cycle stages terminology has been defined
by CEN TC 350, as presented in Figure 2.3 and Figure 2.4, respectively. Figure 2.3 shows that the
assessment accounts for scenarios, functional and technical requirements at the building level,
determined and imposed by the clients’ brief and regulatory requirements. The evaluation of technical
and functional performance of the building is not in the scope of this TC standards. Nevertheless,
TC 350 acknowledges the importance of this characteristics and that they should be considered within
this framework by reference to the functional equivalent. The functional equivalent accounts the
technical and functional requirements and forms a basis for comparisons of the results of the
assessment.

E A R L Y S T A G E D E S I G N M E T H O D O L O G Y T O E N S U R E L I F E C Y C L E S U S T A I N A B I L I T Y O F R E S I D E N T I A L B U I L D I N G S
41
CEN TC 350 assumes LCA as the most effective tool analysis, since it encounters the whole impact
throughout all the building life cycle phases. CEN TC 350 committee is developing indicators, placing
more emphasis on environmental than social and economic indicators, since these latter are very
difficult to develop. Figure 2.4 is in line with these thoughts. It shows a modular distribution of a
buildings’ life cycle, considering four main groups: Module A – product and construction; Module B
– use stage; Module C – End-of-life, and Module D – beyond building life cycle. Each module is sub-
divided according to relevant events that occur in each module, as presented in Figure 2.3.
CEN/TR 15941:2010 (CEN, 2010a) provides the methodology to use the generic data needed to
elaborate an EPD. It specifies where and how the generic data should be used, which the reliable
sources are and how its quality should be assessed. However, the requirements for the use of generic
data are described in EN 15804:2012 (CEN, 2012c). This later provides core product category rules
(PCR) for Type III environmental declarations for all construction products and services for buildings
and other construction works. It provides a structure to ensure that all EPD of construction products,
construction services and construction processes are derived, verified, and presented in a harmonised
way. The information provided in the EPD must be verifiable and consistent based on LCA and related
technical data or scenarios. It also may cover different stages of the building life cycle, however, the
stages regarding the product stage (Raw materials supply, transport, and manufacturing) – A1-A3 –
are mandatory.
Figure 2.3. Concept of sustainability assessment of buildings(CEN, 2010b)

C H A P T E R 2 | S U S T A I N A B L E A S S E S S M E N T T O O L S A N D N O R M A T I V E F R A M E W O R K
42
Figure 2.4. Building life cycle stages according to CEN TC350
As in the ISO standards, CEN has a series of standards to provide guidance and requirements for BSA.
This series has five parts, the first four are intended to be applied to buildings, while the fifth is being
planned to be applied in other construction works. The first, EN 15643-1:2010 (CEN, 2010b) provides
the general framework, principles and requirements, for the three sustainability dimensions
considering technical characteristics and functionality of the buildings. The assessment is aimed at
quantifying the construction works’ contribution to sustainable construction. The proposed framework
and methods can be applied to all buildings’ typologies and to relevant environmental, social, and
economic aspects. The life-cycle phases covered by this standard vary depending on the buildings
stage; if a new building is assessed, the entire LC should be considered; if the assessment is preformed
to an existing building, then it should cover the remaining service life and end of life stage. EN 15643-
1:2010 drove the development of three other standards: EN 15643-2:2011 (CEN, 2011a), EN 15643-
3:2012 (CEN, 2012a) and EN 15643-4:2012 (CEN, 2012b). These three standards regard respectively
the framework for the assessment of environmental, social, and economic performance. According to
all them, the three dimensions of sustainability of buildings are essential in a systemic approach to a
sustainable assessment and hence all three dimensions shall be included in an assessment and
communication shall be made accordingly.
EN 15643-2:2011 beyond presenting the requirements for the environmental assessment, as the life-
cycle phases considered and their constraints, it sets the indicators that should be included in the
assessment (Table 2.6). EN 15643-3:2012 standard aims to evaluate the social impacts and aspects of
the building and its site and to aid the decision-making process of the client, user and designer when
addressing sustainability. These standard regards social aspects, for instance as health and wellbeing
or functional issues. Therefore, the technical and functional clients’ requirements should be considered

E A R L Y S T A G E D E S I G N M E T H O D O L O G Y T O E N S U R E L I F E C Y C L E S U S T A I N A B I L I T Y O F R E S I D E N T I A L B U I L D I N G S
43
as they will influence the assessment results. Table 2.6 shows the main social indicators that are
proposed by this standard. Finally, EN15643-4:2012 addresses the economic performance assessment.
Briefly, economic performance of a building shall include all relevant information on the costs
presented Table 2.7.
Table 2.6. Environmental and social indicators considered in EN 15643-2:2011 and EN 15643-3:2012
Environmental indicators considered in EN 15643-2:2011
Social indicators considered in EN 15643-3:2012
Indicators for environmental impacts Health and comfort Abiotic depletion potential Thermal performance Acidification of land and water resources Humidity Destruction of the stratospheric ozone layer Quality of water for use in buildings Eutrophication Indoor air quality Formation of ground-level ozone Visual comfort Global warming potential Acoustic performance Indicators for resource use Accessibility Use of non-renewable and renewable primary energy Accessibility for people with specific needs Use of secondary materials and fuels Loadings on neighbourhood Use of freshwater resources Noise Indicators for additional environmental information Safety and security
Components for reuse Resistance to climate change Materials for recycling and for energy recovery Fire safety Non-hazardous waste to disposal Security against intruders and vandalism Hazardous and radioactive waste to disposal Security against interruptions of utility supply Exported energy Maintenance Maintenance Requirement
Table 2.7. Cost information related to the building from EN 15643-4:2012
Cost information related to the building fabric Before Use Stage (Modules A0 – A5) Use Stage (Modules B1 - B5) Land costs Building related insurance costs Aggregated cost of products supplied at factory gate ready for construction Leases and Rentals payable to third parties
Costs incurred between factory and site Cyclical regulatory costs Professional fees Taxes Temporary and enabling works Subsidies and incentives
Construction of asset Revenue from sale of asset or elements, but not part of a final disposal
Initial adaptation or fit out of asset – fitting out or modification of new buildings Third party income during operation
Landscaping, external works on the cartilage Repairs and replacement of minor components/small areas
Taxes and other costs related to permission to build Replacement of major systems and components Subsidies and incentives Cleaning
Building related facility management costs Grounds maintenance - needs defining to be consistent with the environmental assessment
End of Life (Modules C1-C4) Redecoration
Deconstruction/ Dismantling, Demolition Disposal Inspections at end of lease period (excluding end of life final disposal)
Fees and Taxes End of lease All transport costs associated with the process of deconstruction and disposal of the built asset
Planned Adaptation or planned refurbishment of asset in use
Costs and/or revenues from reuse, recycling, and energy recovery at end of life
Revenue from sale land

C H A P T E R 2 | S U S T A I N A B L E A S S E S S M E N T T O O L S A N D N O R M A T I V E F R A M E W O R K
44
Table 2.7. Cost information related to the building from EN 15643-4:2012 (cont.)
Cost Information related to the building in operation USE Stage (Modules B6 – B7) Energy costs (default is for usage as defined by EPBD related standards) Water related costs Taxes Subsidies and incentives
To complement these three standard with calculation methods, three other standards were drawn,
EN 16309:2014 (CEN, 2014) for social aspects, EN 15978:2011 (CEN, 2011b) for environmental
impacts and EN 16627:2015 (CEN, 2015) for economic performance. CEN TC 350 has under
approval two other standards, which are aimed at complementing the existing ones with additional
indicators for the sustainability assessment and guidance of the implementation of EN 15804:2012
(CEN, 2012c), CEN/TR 16970:2016 (CEN, 2016b) and CEN/TR 17005:2016 (European
Committee for Standardization, 2016c), respectively.
2.3 | SUSTAINABILITY ASSESSMENT TOOLS
BSA tools should embrace the three main aspects of sustainability: environment, society, and economy
in a life cycle approach. Moreover, buildings must accomplish their own performance conditions as
usability, durability, safety and comfort (typically included in the social dimension) (Blok, Egmond,
Glaumann, & Gervasio, 2011). Nevertheless, the many existing BSA tools are quite different from one
another. Not only the scale of analysis varies, but also their timescale and scope. Some tend to address
only one life cycle phase, while others account for the whole building life cycle. The same happens
with building typology. Each tool tends to be specific for a building typology – office, residential, etc.
(Andrade & Bragança, 2012). Some are oriented towards building materials level, others towards
building products, construction elements, the whole building, or its neighbourhood.
Throughout the years, different studies have been published addressing the content of sustainability
assessment methodologies (Alyami & Rezgui, 2012; Berardi, 2012; Bunz, Henze, & Tiller, 2006;
Castro, Mateus, & Bragança, 2014; Chandratilake & Dias, 2013; Ding, 2008; Erlandsson & Borg,
2003; Fowler & Rauch, 2006; Haapio & Viitaniemi, 2008; W. L. Lee, 2013; Wallhagen, Glaumann,
Eriksson, & Westerberg, 2013). However, these comparisons tend to be more superficial, and do not
discuss tool details (such as issues and parameters) and the way they were conceived and designed.
Alyami and Rezgui (2012) pointed out the regionalism differences amongst well-known methodologies,
and compared converging criteria in order to establish a starting point for the development of a new
methodology to be applied in Saudi Arabia. Bunz et al. (2006) studied building life cycle phases
addressed during the assessment, whereas Ding (2008) analysed existing environmental assessment
tools based on their characteristics and limitations when assessing a building. It is worth mentioning
that these studies do not often express which building typology the subject methodologies are

E A R L Y S T A G E D E S I G N M E T H O D O L O G Y T O E N S U R E L I F E C Y C L E S U S T A I N A B I L I T Y O F R E S I D E N T I A L B U I L D I N G S
45
applicable to, and the comparisons are made regarding the scheme and not the specific methodology.
In cases where this happens, office buildings are typically considered.
BSA tools gather both quantitative and qualitative aspects. The formers are more practical and easily
measured, while the latter rely on subjective issues that depend on the aspirations of tool designers.
Even in quantitative aspects, BSA tools differ from one another in the calculation methods and issues
assessed. In fact, even the terminology used differs from tool to tool, hampering comparisons. This fact
is seldom addressed in comparisons and tool descriptions. The sustainability concept is already quite
subjective and non-consensual, and therefore big differences amongst tools that are intended to
quantify sustainability can hamper their use or jeopardise users’ trust.
Sustainability assessment methods can play an important role towards the competitiveness and
sustainability of the different construction solutions. This chapter section presents a comparison of
BSA tools. It describes the analysis and comparison made to BSA tools applicable to detached
dwellings. Residential buildings account for 75% of European building stock floor space, 64% of which
are single family houses. The remaining 25% correspond to the non-residential sector and is quite
heterogeneous. Nevertheless, housing floor area tends to increase over time as well as the demand for
single occupancy housing (BPIE, 2011). Together with the population increase, this leads towards clear
implications on future resource sustainability. The aim is to analyse and understand BSA tools methods
and their main objectives when quantifying the sustainability of single family buildings.
Property clients are becoming more aware of environmental issues and thus, BSA tools are often used
as a marketing tool rather than a way to assure that buildings were designed on a sustainable basis,
without any ulterior motive other than contributing to a more sustainable world. Despite this reality,
the study does not discuss the driving force behind each tool, but rather tries to understand the tools
scientific and methodological content, their applicability as well as how the tools differ from each other.
The comparison is based on eight critical aspects:
• Purpose of assessment;
• Sustainability dimensions considered;
• Indicators addressed;
• Life cycle phases considered by the indicators;
• Type of indicators;
• Measurements;
• Aggregation processes;
• Life cycle phases during which the assessment was carried out.

C H A P T E R 2 | S U S T A I N A B L E A S S E S S M E N T T O O L S A N D N O R M A T I V E F R A M E W O R K
46
2.3.1 | Procedure for comparison
To compare BSA tools, different aspects need to be addressed. In this work, a combination of different
approaches from several authors, such as Blok et al. (2011), Fowler and Rauch (2006) and Andrade
and Bragança (2012), was used. This comparison was based on the following questions:
• What is assessed?
• How is it assessed?
• When is the assessment performed?
Each of the questions is focused on one or more aspects, according to Table 2.8. Research was based
on literature review and on a comprehensive study of the tools’ manuals and auxiliary materials.
2.3.1.1 | Tools to be compared
The building sector is a major contributor to the environmental pressures with which the world is
dealing right now, pushing the development of tools to evaluate and promote buildings sustainability.
These tools enable to determine the level of sustainability of a building when compared to common
and best practices as well as the minimum requirements of each countries regulations. Nowadays, there
are hundreds of tools worldwide claiming to evaluate and rate buildings’ sustainability. Some even
promise to aid designers in developing more sustainable buildings. Literature review shows several
comparisons between the different methods (Chandratilake & Dias, 2013; Chang & Chen, 2012;
Glaumann, Malmqvist, & Wallhagen, 2011; Jönsson, 2000; Reed, Bilos, Wilkinson, & Schulte, 2009;
Shen, Shen, & Sun, 2012; Wallhagen et al., 2013), and case-studies presenting the results of using a
specific method to evaluate a building (Assefa, Glaumann, Malmqvist, & Eriksson, 2010; Bossink,
2007; Ferreira, Pinheiro, & de Brito, 2014; Huang, Bird, & Heidrich, 2009).
Table 2.8. Aspects used for comparison of BSA tools
Question Aspect Description
What is assessed? Purpose The methodologies address the whole building or just a part? Which typology of buildings do they assess?
Sustainability dimensions Are the three sustainability dimensions assessed? To what extent?
Indicators Which are the indicators included in the methodology?
Life cycle phases addressed Which are the life cycle phases considered during the assessment?
How is it assessed? Type of indicators Are the indicators quantitative or qualitative? Are they performance or prescriptive indicators?
Measurement How are the indicators measured?
Aggregation How is the aggregation made: through the sum up of credits or weighting factors with normalization?
When is the assessment performed? Life cycle phases In which life cycle phases are the methodologies
applicable to?

E A R L Y S T A G E D E S I G N M E T H O D O L O G Y T O E N S U R E L I F E C Y C L E S U S T A I N A B I L I T Y O F R E S I D E N T I A L B U I L D I N G S
47
The first tool to be released was BREEAM, in the nineties and since then, several other have been
developed worldwide (Cole, 2006; Ding, 2008). There are tools like BREEAM, LEED or Green Star
that started to focus only environmental aspects, but with their evolution, they now focus also on social
aspects (BRE Global Ltd, 2014; Green Building Council of Australia, 2014; U.S. Green Building
Council, 2014). Methodologies like SBTool or DGNB focus the three main themes of sustainability
(environment, society, and economy) (German Sustainable Building Council, 2010, 2014; Mateus &
Bragança, 2011; Mateus & Bragança, 2016). However, most of the methods cover environmental and
social aspects only, like CASBEE (Japan GreenBuild Council (JaGBC) & Japan Sustainable Building
Consortium (JSBC), 2014). On the other hand, there are tools like BEES that assess environmental
and economic aspects only. There also available tools that although not rating buildings’ sustainability,
they aid designers by assessing the life cycle environmental impact of the construction solutions chosen
as ATHENA, Eco-Quantum or EcoProp (Andrade & Bragança, 2012; ATHENA, 2014; Eco-
Quantum; Technical Research Centre of Finland, 2004).
This work focused on holistic and integrative approaches commonly used and/or well known in
Europe. In a preliminary and broad analysis, ten general systems were analysed:
• BREEAM;
• LEED;
• ATHENA;
• Eco-Quantum;
• SBToolPT;
• CASBEE;
• DGNB;
• EcoProp;
• OpenHouse;
• LEnSE.
The analysis started by identifying the object of assessment in each scheme. It regarded the evaluation
boundaries, such as building materials, elements, the whole building or even the whole neighbourhood.
This can vary from scheme to scheme. Its identification is quite important in order to select the tool
that best fits the scope and purpose of the intended assessment. Table 2.9 summarises the building
typologies addressed by each system and to which life cycle phases they are applicable.

C H A P T E R 2 | S U S T A I N A B L E A S S E S S M E N T T O O L S A N D N O R M A T I V E F R A M E W O R K
48
Table 2.9. General panorama of each BSA system related to the life cycle during which the assessment occurs and the type of buildings covered1
* - under development
Next, the group of tools was narrowed to six. Only those with an available scheme focusing on single
family houses and written in English or Portuguese were selected. These were:
• BREEAM: Code for Sustainable Homes, 2010;
• LEED: LEED for Homes v4;
• SBTool: SBToolPT-H v2009/2;
• CASBEE: CASBEE for Home (Detached House), 2007;
• DGNB: DGNB for small residential buildings, 2013;
• EcoProP 4.2.1.
The BREEAM Code for Sustainable Homes (CSH) derives from the first BSA tools to appear and
represents a building code in the UK; LEED for homes is a market-driven tool; SBToolPT-H is an
adaptation to the Portuguese reality of the internationally developed SBTool; CASBEE was developed
in a partnership between the Japanese government and industry; DGNB is the most recent tool and
based on European Union standards requirements; and EcoProP is not a rating system as such but a
tool to aid the construction of sustainable buildings at early design stages. Almost all the systems have
1 (ATHENA, 2014; Barbosa, Mateus, & Bragança, 2013; BRE Global Ltd, 2014; Danatzko, 2010; Dobbelsteen & Uffelen, 2008; Eco-Quantum; German Sustainable Building Council, 2010, 2014; International Initiative for a Sustainable Built Environment, 2014; Japan GreenBuild Council (JaGBC) & Japan Sustainable Building Consortium (JSBC), 2014; LEnSE Partners, 2006; OpenHouse, 2010; Technical Research Centre of Finland, 2004; U.S. Green Building Council, 2014)
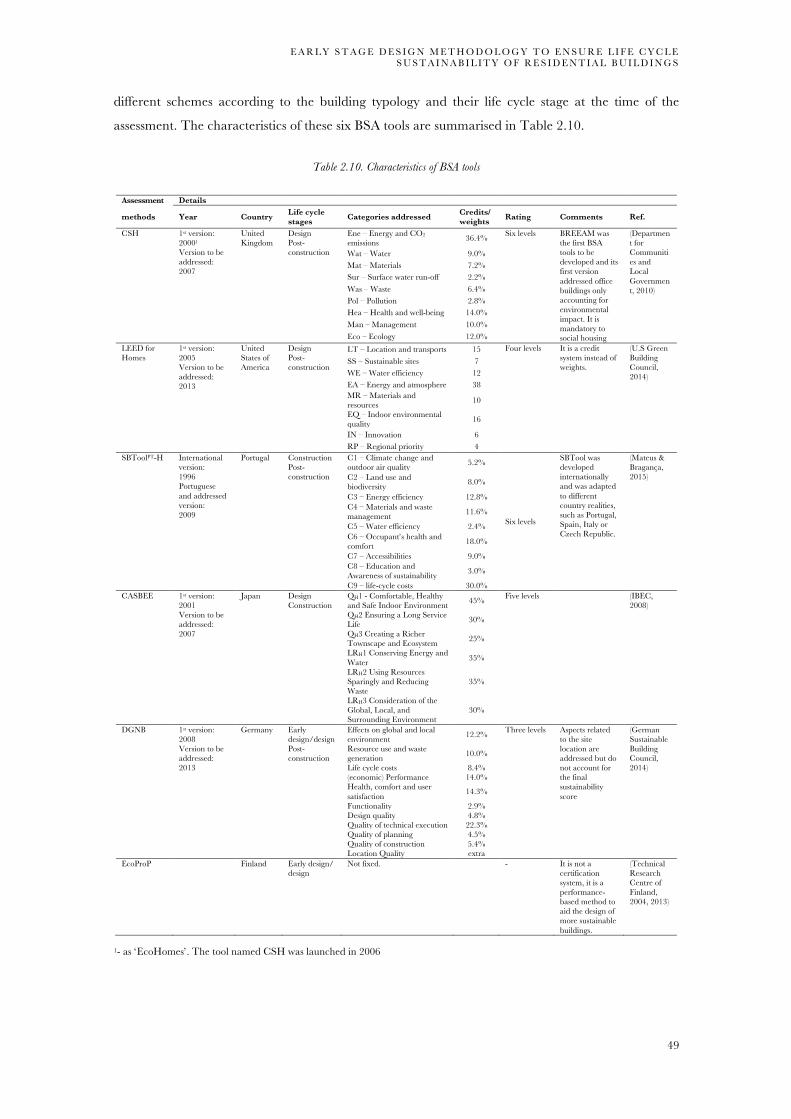
E A R L Y S T A G E D E S I G N M E T H O D O L O G Y T O E N S U R E L I F E C Y C L E S U S T A I N A B I L I T Y O F R E S I D E N T I A L B U I L D I N G S
49
different schemes according to the building typology and their life cycle stage at the time of the
assessment. The characteristics of these six BSA tools are summarised in Table 2.10.
Table 2.10. Characteristics of BSA tools
1- as ‘EcoHomes’. The tool named CSH was launched in 2006
Assessment Details
methods Year Country Life cycle stages Categories addressed Credits/
weights Rating Comments Ref.
CSH 1st version: 20001 Version to be addressed: 2007
United Kingdom
Design Post-construction
Ene – Energy and CO2 emissions 36.4% Six levels BREEAM was
the first BSA tools to be developed and its first version addressed office buildings only accounting for environmental impact. It is mandatory to social housing
(Department for Communities and Local Government, 2010)
Wat – Water 9.0% Mat – Materials 7.2% Sur – Surface water run-off 2.2% Was – Waste 6.4% Pol – Pollution 2.8% Hea – Health and well-being 14.0% Man – Management 10.0% Eco – Ecology 12.0%
LEED for Homes
1st version: 2005 Version to be addressed: 2013
United States of America
Design Post-construction
LT – Location and transports 15 Four levels It is a credit system instead of weights.
(U.S Green Building Council, 2014)
SS – Sustainable sites 7 WE – Water efficiency 12 EA – Energy and atmosphere 38 MR – Materials and resources 10
EQ – Indoor environmental quality 16
IN – Innovation 6 RP – Regional priority 4
SBToolPT-H International version: 1996 Portuguese and addressed version: 2009
Portugal Construction Post-construction
C1 – Climate change and outdoor air quality 5.2%
Six levels
SBTool was developed internationally and was adapted to different country realities, such as Portugal, Spain, Italy or Czech Republic.
(Mateus & Bragança, 2015) C2 – Land use and
biodiversity 8.0%
C3 – Energy efficiency 12.8% C4 – Materials and waste management 11.6%
C5 – Water efficiency 2.4% C6 – Occupant’s health and comfort 18.0%
C7 – Accessibilities 9.0% C8 – Education and Awareness of sustainability 3.0%
C9 – life-cycle costs 30.0% CASBEE 1st version:
2001 Version to be addressed: 2007
Japan Design Construction
QH1 - Comfortable, Healthy and Safe Indoor Environment 45% Five levels (IBEC,
2008) QH2 Ensuring a Long Service Life 30%
QH3 Creating a Richer Townscape and Ecosystem 25%
LRH1 Conserving Energy and Water 35%
LRH2 Using Resources Sparingly and Reducing Waste
35%
LRH3 Consideration of the Global, Local, and Surrounding Environment
30%
DGNB 1st version: 2008 Version to be addressed: 2013
Germany Early design/design Post-construction
Effects on global and local environment 12.2% Three levels Aspects related
to the site location are addressed but do not account for the final sustainability score
(German Sustainable Building Council, 2014)
Resource use and waste generation 10.0%
Life cycle costs 8.4% (economic) Performance 14.0% Health, comfort and user satisfaction 14.3%
Functionality 2.9% Design quality 4.8% Quality of technical execution 22.3% Quality of planning 4.5% Quality of construction 5.4% Location Quality extra
EcoProP Finland Early design/ design
Not fixed.
- It is not a certification system, it is a performance-based method to aid the design of more sustainable buildings.
(Technical Research Centre of Finland, 2004, 2013)

C H A P T E R 2 | S U S T A I N A B L E A S S E S S M E N T T O O L S A N D N O R M A T I V E F R A M E W O R K
50
2.3.2 | Results
2.3.2.1 | What is assessed?
Sustainability dimensions
The scope within each sustainability dimension is broad and can vary from tool to tool. All tools
included in this study address to some extent the environmental performance of a building, as
presented shortly. CSH, LEED for Homes and CASBEE for Homes do not consider economic aspects.
Only the SBToolPT, DGNB and EcoProP address all three sustainability dimensions.
Sustainability indicators
Sustainability indicators refer to impacts, positive and negative, arising from the building’s existence
(Bradley & Kibert, 1998). These impacts can occur at different levels: (i) indoor, affecting directly the
health and comfort of the inhabitants; (ii) locally, affecting the neighbourhood and building
surroundings; and (iii) globally, mainly related to environmental impacts that affect the whole planet.
Table 2.11 summarises the content of the subject BSA tools.
In order to ease the comparison of the tools, a common terminology was established, focusing on the
following categories:
• life cycle environmental impacts;
• energy performance,
• water efficiency;
• waste;
• materials and resources;
• site sustainability;
• transport;
• health and comfort;
• service quality;
• cultural and aesthetics;
• project management;
• economics.
Within each of these categories, several indicators were defined to reflect different aspects of the overall
category. The assessment process and a discussion of the indicator typology is presented later.

E A R L Y S T A G E D E S I G N M E T H O D O L O G Y T O E N S U R E L I F E C Y C L E S U S T A I N A B I L I T Y O F R E S I D E N T I A L B U I L D I N G S
51
Table 2.11. Main issues considered in the BSA tools and their evaluation method
Area Categories and issues Assessment methods
CSH LEED v4 SBToolPT DGNB EcoProP CASBEE
Envi
ronm
ent
Life Cycle Environmental impacts Global warming potential x - x x x x Eutrophication potential x - x x - - Acidification potential x - x x x - Stratospheric ozone depletion potential
x - x x - -
Photochemical ozone creation x - x x x - Depletion of abiotic resources-elements
x - - - x -
Depletion of abiotic resources-fossil fuel
x - - - x -
Water extraction x - - - - - Primary energy x - x x x - Energy Performance Renewable energy x x x x x x Energy demand x x x x x x Energy monitoring x x - - - x Low energy white goods x x - - - x Water Efficiency Re-use/recycling x x x x x x Water consumption x x x x x x Water monitoring - x - - - x Waste Construction waste management x x - - x x Operational waste management x - x - - - Materials and Resources Materials reuse/recycling x x x x - x Recycled content - x x - - x Renewable sources - x - - - x Responsible sourcing x x x x - x Site Sustainability Site Selection x x x - x - Land use x x x x x - Heat Island effect - x x - x x Noise control x - - - x x Development of community - x - - - - Local ecology/ biodiversity x x x - x x
Soci
al
Transports Public transports - x x x x - Bicycle comfort x x - - x - Health and comfort Thermal comfort - x x x x x Visual comfort x - x x x x Acoustics x - x x x x Indoor air quality - x x x x x Ventilation - x x - x x Water quality - - - - - - Service Quality Flexibility/adaptability x - - x x x Disable person’s access - - - x x x

C H A P T E R 2 | S U S T A I N A B L E A S S E S S M E N T T O O L S A N D N O R M A T I V E F R A M E W O R K
52
Table 2.11. Main issues considered in the BSA tools and their evaluation method (cont.)
Area Categories and issues Assessment methods
CSH LEED v4 SBToolPT DGNB EcoProP CASBEE
Soci
al
Safety and security x - - x x x Earthquake resistance - - - - x x Maintenance management - - - x x x Spatial efficiency - - - - x x User controllability - - - - x x Functionality - - - - x x Fire prevention - - - x x x Ease of disassembly, re-use or recycling - - - x x -
Durability - x - - x x Cultural & Aesthetics Culture & heritage - - - - x - Aesthetic quality - - - - x -
Tec
hnic
al Project Management
Quality of the project - x - x x - Construction phase x - - x x - Integrated planning - x - x x - Construction site impacts x x - - x -
Eco-
nom
i-ca
l
Economic aspects LCC - - x x x - Value Stability - - - x - -
The tools might seem superficially similar in some categories, but when studied in detail, it becomes
clear that they are often quite different from each other.
As can be seen in Table 2.11, LEED and CSH, pay more attention to environmental and energy-
related aspects, while CASBEE is more thorough on life and service quality. DGNB, as the newest
system, goes beyond the three sustainability pillars – environment, society, and economy – to embrace
technical, functional and process related aspects and coping with the new European standards for
building sustainability. EcoProP is a design aid tool, and therefore it is more comprehensive, reaching
several design specificities. SBToolPT-H was developed to evaluate home sustainability, based on the
international SBTool matrix, and thus encompasses environmental, economic, and social impacts.
The latter comprises essentially comfort related issues, not focusing on technical and functional aspects.
Looking closer at Table 2.11 it becomes clear that issues related to energy efficiency and renewability,
and water efficiency and reuse are considered by all six tools. On the other hand, only SBToolPT-H,
DGNB and EcoProP consider economic issues, while cultural and aesthetics is only taken into
consideration in EcoProP.
Within each category, even if the issues addressed are the same, the procedure to quantify them varies,
such as the assessment of life cycle environmental impacts. CHS and DGNB follow EN 15804:2012
categories and recommendations, whilst CSH also considers other environmental impact categories,

E A R L Y S T A G E D E S I G N M E T H O D O L O G Y T O E N S U R E L I F E C Y C L E S U S T A I N A B I L I T Y O F R E S I D E N T I A L B U I L D I N G S
53
giving them more than 50% of the total LCA weighting. On the other hand, CASBEE only considers
global warming potential. This issue is measured by considering the results from other CASBEE
indicators to estimate the life cycle CO2 emissions, encompassing construction, use, renovation,
demolition, and disposal phases. In addition to having different impact categories addressed in
different ways, the boundaries considered for the assessment are also distinctive.
Another relevant example is energy efficiency as it is significant for all tools. DGNB, SBToolPT-H,
EcoProP and CASBEE account for renewable energy used within the building, and assess the energy
demand during the use phase. In this way, not just the reduction of fossil fuel energy is rewarded, but
also the effective energy efficiency, which is often confused with the former (Araújo, Almeida, &
Bragança, 2013). In the CSH system, the main energy related indicators (‘Energy and CO2 emissions’
and ‘fabric energy efficiency’) account essentially for the consumption of non-renewable energy and
not for the real energy consumption reduction. Other energy related indicators, such as ‘energy
labelled white goods’ or ‘drying spaces’, acknowledge energy consumption reduction, no matter the
source. CSH, CASBEE and LEED underline that users’ behaviour can highly influence the energy
consumption, as the three tools promote the existence of an energy-consumption control device.
A major difference between the tools is the inclusion of service quality issues. These issues play an
important role in DGNB, EcoProP and CASBEE. DGNB is the newest tool and hence follows new
European Standards, giving emphasis to these new requirements and guidelines on how sustainability
should be assessed. CASBEE, in turn, takes into consideration functional quality and resilience issues,
as Japan is a country with a high incidence of natural disasters. EcoProP, as a design aid tool,
encompasses safety, stability, usability, and durability concerns as they represent legal requirements.
2.3.2.2 | Life cycle phases
The building life cycle can broadly be split in planning/design, production of building materials,
construction, use/operation, maintenance, demolition/deconstruction, and disposal. Single family
buildings are no exception from other building typologies. Each stage has a purpose, involving different
players and different sustainability issues. The life cycle approach confirms that improving one type of
impact at one stage can have negative impacts in another. This means that the more the impacts of
each life cycle are included in the assessment, the more accurate and correct the assessment will be,
and hence enrich the building’s sustainability. Regarding BSA tools for single-family buildings, they
tend to include the phases that represent a major role in building sustainability. In this sense,
Table 2.12 shows the life cycle phases considered and assessed by the six tools. DGNB, EcoProP and
CASBEE have the greater coverage, although the other tools include most of the major life cycle stages.
Considering all the tools, only EcoProP accounts for all life cycle stages and, together with DGNB and
LEED, cover the design stage. This phase is essentially considered in one single category, mainly
referred to as ‘project quality’. It considers if there is integrated planning or if sustainability principles
and specialists are taken into consideration. On the other hand, all tools cover the production phase.

C H A P T E R 2 | S U S T A I N A B L E A S S E S S M E N T T O O L S A N D N O R M A T I V E F R A M E W O R K
54
Table 2.12. Life cycle phases considered
Life cycle phases Assessment methods CSH LEED SBToolPT DGNB EcoProP CASBEE Project/ design x x x Production x x x x x x Construction x x x x x Use/ Operation x x x x x x Maintenance x x x x x Demolition/deconstruction x x Disposal x x x x x
The way the tools cover all stages varies. The same stage can be addressed by different criteria with
different evaluation methods. For instance, LEED is the only tool embedding the production phase
through the quantification of environmentally friendly products, as well as the consideration of the
distance from the production site to the building site. All the other tools considering this stage do it
through life cycle environmental assessment.
The construction phase is addressed either by LCA or by parameters accounting for the impacts in the
neighbourhood and waste production during construction activities. The SBToolPT-H is the only tool
that does not account for this phase, not even through LCA. All other tools adopt similar approaches.
None of the schemes addresses social aspects for the construction workers.
All the schemes take into consideration social and environmental aspects during the operational phase.
Maintenance is addressed in a similar way as construction by LCA and by a number of functional
features.
Regarding the last two phases, all schemes, except LEED, account for disposal, while EcoProP and
CASBEE consider only demolition. Disposal and demolition are considered by LCA. However, the
extent of this consideration depends on the environmental categories addressed in each scheme.
2.3.2.3 | How is it assessed?
Type of indicators and measurement
Each tool seeks to assess sustainability through a set of specific criteria, which can be actions taken
during design, inclusion of certain devices and actual performance of the building, amongst others.
The various tools do this in different ways, which makes comparisons of aggregated assessments
difficult. The life cycle stage in which a building is assessed constrains the nature, quality, and quantity
of available information. Thus, the diversity and non-standard procedures lead to different BSA tools
evaluating the same issue in different ways, further hampering the cross comparisons and
understanding of the results.

E A R L Y S T A G E D E S I G N M E T H O D O L O G Y T O E N S U R E L I F E C Y C L E S U S T A I N A B I L I T Y O F R E S I D E N T I A L B U I L D I N G S
55
According to Blok et al. (2011), indicators may be quantitative or qualitative, addressing
‘procedural/procedure’, ‘feature’ or ‘performance’ issues. Procedural indicators are designed to assess
actions taken to improve performance; Feature indicators seek to validate the existence of a certain
device or technical solution included in the building, without measuring the improvement on the
building’s performance. Finally, Performance indicators directly measure the subject issue and its
improvement, typically comparing it with the common solution. Performance indicators can be of two
kinds. The first - hypothetical performance - is assessed through estimation/simulation, typically
addressed during design. It should be confirmed after construction to validate the results. The second
considers those that address real performance after construction. Nevertheless, aspects such as primary
energy needs are addressed through software simulation, even in post-construction phases. This will
avoid undesired behaviour by the occupants affecting the buildings’ performance possibilities. On the
other hand, air-tightness or acoustic comfort are evaluated in situ and the effective performance is
quantified in the post-construction phase.
Indicators in all methodologies aim to address/reward a specific impact/benefit, which can seldom be
directly or exactly quantified. Thus, most methodologies rely on simplifications or indirect
methods/measures. BSA tools take into account measures that are intended to improve or influence
the wider impact of the building and which can be taken into consideration while designing the
building. This occurs, for instance, in LEED or the SBToolPT-H with regards to local biodiversity and
in CSH with energy efficiency measures. With this in mind, Table 2.13 shows how the six single, family
building sustainability assessment tools evaluate the sustainability criteria. To complement this data
and perceive the extension of the use of each evaluation approach and their relevance to the tool
assessment methodology, Figure 2.5 shows graphically the distribution of indicator typologies in each
BSA tools. Figure 2.5a presents the relation between indicator typologies and the total number of
indicators within each BSA tools, while Figure 2.5b presents the relation based on the importance
(weight) given to each indicator.
(a) (b)
Figure 2.5. Distribution of indicator typologies. (a) Relation between number of indicators addressed in a certain way and the total number of indicators. (b) Distribution of indicator typologies based on the weights given to those indicators
CSH LEED Hv4 SBToolPT DGNB EcoProP CASBEE0
20
40
60
80
100 PerformanceProcedureFeature
%
CSH LEED Hv4 SBToolPT DGNB CASBEE0
20
40
60
80
100 PerformanceProcedureFeature
%

C H A P T E R 2 | S U S T A I N A B L E A S S E S S M E N T T O O L S A N D N O R M A T I V E F R A M E W O R K
56
Table 2.13. Type of indicators
Categories Assessment methods CSH LEED v4 SBToolPT DGNB EcoProP CASBEE LCA � - � � � � Energy performance � £ � £ � � � � £; Water efficiency � £ £ � � � £ Waste �£ � £ - � � Materials and resources � � � � £ � � £ � £ - � £ Site sustainability � � � � £ � � £ � � � Transports £ - � £ � - Health & Comfort � � £ � £ � £ � � � � £ Service Quality £ � - � � £ � � � � £ Cultural & Aesthetics - - - - � - Project management � � � � - Economic aspects - - � � � - Others � £ � - � - -
Note: � - Performance; �- Procedure; £ - Feature
LCA related indicators are the only ones addressed by the same indicator typology by all tools –
Performance. The main aspects related to Energy Performance are also considered through Performance.
The SBToolPT-H uses mainly Performance indicators, which are present in all categories except in
‘Waste’ (Table 2.13). In addition, when considering Figure 2.5a and Figure 2.5b, greater importance
is given to those indicators.
CSH has six of the thirteen categories assessed by Performance indicators, six by Procedure and six by
Feature, as some categories are measured with more than one issue typology. LCA is only assessed by
Performance. Transport is assessed by Feature and Project Management by Procedure. All other categories
are addressed by more than one typology. Figure 2.5 allows verifying that although Performance issues
are fewer in number than Procedural and Feature issues, they are the main contributors to the overall
sustainability score.
LEED has only four out of thirteen categories addressed by Performance criteria. Only the ‘Waste’
category is considered by Performance. ‘Service Quality’ and ‘Project Management’ are Procedural
categories. Within categories, LEED has the same number of Performance and Procedural criteria that are
exceeded by the number of Feature indicators. This can be explained by the fact that LEED is a
checklist-based tool. Even though there are more Feature criteria than Performance criteria, the latter
have a greater contribution to the final score, as in all other tools (Figure 2.5).
DGNB has more Procedural indicators than the other three typologies. Only ‘Water’ and ‘Project
Management’ are addressed by this tool. Performance is the only assessment typology in ‘LCA’, ‘Energy
Performance’ and ‘Economic Aspects’. ‘Transport’, as in CSH, is considered through Feature
indicators. All other categories have a combination of assessment procedures.

E A R L Y S T A G E D E S I G N M E T H O D O L O G Y T O E N S U R E L I F E C Y C L E S U S T A I N A B I L I T Y O F R E S I D E N T I A L B U I L D I N G S
57
It is worth mentioning that CASBEE is quite different from other subject rating systems due to its
assessment procedure, which is divided into two main groups: environmental quality of the house itself
(Q), and environmental load imposed by the house on the external environment (L). CASBEE is the
most heterogeneous tool because it presents a greater variety of issues, as observed in both Table 2.13.
Type of indicatorsand Figure 2.5a, but with a better distribution amongst indicator types as the
number of issues addressed by Performance, Procedure and Feature are similar. The predominance of
Performance is seen in ‘Health and Comfort’ and ‘Energy Performance’. Feature indicators are mainly
found in ‘Water’, ‘Materials and Resources’, while Procedural indicators are mainly present in ‘Site
Sustainability’ and ‘Waste’.
Aggregation and weighting
Aggregation and weighting are used when there are trade-offs between the impacts considered.
Weights typically vary with the scope of the assessment and are often subjective. These weightings do
not always enjoy consensus between the tool’s designers and tool users. However, the weighting process
is inherent and a core step to sustainability evaluation, since it is responsible for establishing the overall
performance score of the assessed building (W. L. Lee, Chau, Yik, Burnett, & Tse, 2002). In addition,
weights vary over time as a consequence of market transformation, patterns and trends evolution
(Todd, Pyke, & Tufts, 2013). Different authors have tried to overcome this subjectivity. Malmqvist et
al. (2011) used quantitative indicators, but still aggregation was qualitative. Within the same line of
thought, Ding (2008) suggested the use of indicators instead of marks, but these would still need
aggregation to reach the overall score through weights.
Each of the BSA tools has its own aggregation and weighting system, as shown in Table 2.14. None of
the systems has its weights expressly and scientifically determined, bringing back the question/doubt
related to the subjectivity of the sustainability concept. CSH has both a credit scoring system and
weighting factors. The former is used to balance issues within each category, while weights are used to
aggregate categories into the final score. In addition, CSH encompasses mandatory credits as well as
interchangeable ones. LEED, in turn, uses a simple process of summing up the credits achieved in
each assessed criterion. As in CSH, LEED has few mandatory criteria that do not contribute with
credits to the final score, while other criteria are interchangeable. During design, the actors involved
can not only decide on the sustainability level aimed for the dwelling, but also pursue the criteria that
will lead them to their goal. SBToolPT-H adopted a weighting factor system, contrary to other systems
where weights are determined through a panel of experts. The weights were established based on the
principle of extent, intensity and duration of the impact assessed in each indicator. DGNB is also based
on a weighting factor system, although each criterion is assigned with points and only then multiplied
by a weighting factor. CASBEE has a complex and different aggregation system, when compared to
other tools. It separately addresses the environmental quality of the house itself (Q) and the
environmental load imposed by the house on the external environment (L). Different levels are

C H A P T E R 2 | S U S T A I N A B L E A S S E S S M E N T T O O L S A N D N O R M A T I V E F R A M E W O R K
58
addressed in a different way. A numerical score scale (from 1 to 5) is used in lower level criteria. These
values are then multiplied by weighting coefficients until reaching SQ (score for Q) and SLR (score for
L reduction), which may vary from 0 (zero) to 1. The overall score of the building is called BEE
(Building Environmental Efficiency) and results from Q/L= [25 x (SQ-1)] / [25 x (5 – SLR)].
According to Institute for Building Environment and Energy Conservation (2008), the weighting
factors for major items were statistically determined through questionnaires to stakeholders, including
owners, housing suppliers, administrative officials, and scholars, while medium and minor level
weighting coefficients result from discussions between specialists.
In order to ease the comparison amongst BSA tools weightings, Figure 2.6 presents the relative
contributions of each main sustainability category to the overall sustainability score of each BSA tools.
Some adjustments were needed to adapt the schemes’ specific categories to the ones adopted in this
work. EcoProP was not included in this comparison since it is not a rating system, and therefore has
no weighting factors.
Table 2.14. BSA tools levels of aggregation
Assessment method
Levels of aggregation Aggregation details
CSH 2 Issue – category – final score LEED 1 Credits – final score SBToolPT-H 3 Issue – indicator – category – final score DGNB 1 Issue –final score
CASBEE 5 Detailed item – minor item – medium item – category – SQ and SLR – BEE (final score)
Figure 2.6. Distribution of BSA tools weightings
Figure 2.6 clearly shows the divergence in the weightings between the tools. The weighting within
CHS and LEED appear to be the most alike while other tools are much more diverse. In SBToolPT-H,
the importance given to economic issues is quite evident, whereas in DGNB ‘Service Quality’ issue is
emphasised. CASBEE, with its different structure and weighting system, stands out by having a more
2.234.452.23
CSH LEED v4 SBToolPT-H SBTool DGNB CASBEE0
10
20
30
40
50
60
70
80
90
100LCIA
Energy performance
Water efficiency
Waste
Materials and resourcesSite sustainabilityTransports
Health & Comfort
Service QualityProject management
Economic aspectsOthers4.50
34.05
9.00
6.405.50
12.0
2.35
9.34
6.874.405.53
34.54
10.91
18.18
2.73
14.54
2.738.18
5.20
2.40
12.80
11.90
11.20
5.10
30.00
18.00
0.40
3.00
7.89
20.04
24.61
17.00
10.02
4.86
5.67
4.95
2.62
14.88
22.40
5.20
12.25
22.43
15.000.91
1.82
5.45
28.70
12.90
4.8
5.90
3.7
4.61.1
7.3
29.4
1.60
Cultural & Aesthetics
%

E A R L Y S T A G E D E S I G N M E T H O D O L O G Y T O E N S U R E L I F E C Y C L E S U S T A I N A B I L I T Y O F R E S I D E N T I A L B U I L D I N G S
59
balanced weight distribution, although it does exclude a few categories (Figure 2.6). On the other hand,
CSH aggregates more categories to the final sustainability score.
Although it is not the only category within the Environmental dimension, ‘LCA’ is included in the
BSA tools with an influence of less than 10% on the overall sustainability score, with DGNB being the
tool providing it with the highest rate (7.89%). CHS and LEED give high relevance to Energy,
attributing a weight to it that is superior to a third of the total score. An equivalent percentage is given
by the SBToolPT-H to economic aspects – 30%. Other considered relevant aspects of the
environmental dimension are ‘Water efficiency’ and ‘Site Sustainability’. ‘Water Efficiency’ is
considered as more relevant by both CSH and LEED than by the other three BSA tools. LEED
(18.52%) and CASBEE (22.50%) give prominence to ‘Site Sustainability’, corresponding to almost
twice the weight considered by CSH and SBToolPT-H. Most of the ‘Site Sustainability’ related aspects
considered by DGNB are not considered in the overall sustainability score by the tool. However, some
criteria from the issues that account for the final score in DGNB (2.23%) were considered to be under
the ‘Site Sustainability’ category. Briefly, environmental dimension is accounted for 72.6% in CSH,
71.82% in LEED, 40.00% in SBToolPT-H, 27.33% in DGNB, and 62.50% in CASBEE.
The increasing importance of social aspects for sustainability is visible through the emphasis given to
‘Health and Comfort’, which is around 20% in SBToolPT-H, DGNB and CASBEE – the most recent
tools - and slightly lower in LEED and CSH. Considering all categories under the social dimension,
DGNB gives greater importance to it as this dimension is accounted for 55.67% of the overall
sustainability score, followed by CASBEE with 37.50%, SBToolPT-H with 30.00%, LEED with
28.18% and, finally, CSH with 27.40%.
Economic aspects are still one of the most important problems and dilemmas when dealing with
sustainability. In fact, from these six BSA tools just two account directly for it - SBToolPT-H (30.00%)
and DGNB (17.00%). Therefore, it is quite interesting that all the other methods consider themselves
as “sustainability” assessment methods. Economic aspects within sustainability are being discussed
(Eichholtz, Kok, & Quigley, 2013; Ellis, 2009). Beyond the scarce publications studying the effects of
considering economic issues in sustainability, there are few that relate them to energy-efficiency
measures (Bonakdar, Dodoo, & Gustavsson, 2014; De Angelis, Pansa, & Serra, 2014). BRE and Cyrill
Sweett undertook a study showing that the environmental performance of a home building could be
increased in 1-2 sustainability levels for less than 2% additional cost (Abdul & Quartermaine, 2014).
However, considering this 2% initial cost increase in a life cycle could lead to a reduction in the
operational costs, and thus lead to a decrease of the whole life cycle costs of the dwelling. Nevertheless,
the social and cultural context to which these studies and these BSA tools are applicable is important
to bear in mind. ‘Cultural Heritage’ preservation and developing countries should have different
approaches and, once more, weights should be adjusted to local realities. Moreover, when accounting
for cultural heritage, only one of the tools included these issues in its assessment scheme – EcoProP.

C H A P T E R 2 | S U S T A I N A B L E A S S E S S M E N T T O O L S A N D N O R M A T I V E F R A M E W O R K
60
When accounting for both cultural and economic aspects, a balance needs to be found. These
discussions point out the need for a comprehensive study on sustainability constraints, such as finding
a balance between low environmental impact buildings, all the social pressures and the financial
availability to implement and maintain the intended sustainability measures. The economic value of
cultural heritage preservation is beginning to be discussed more widely (Bowitz & Ibenholt, 2009;
Sodangi, Khamdi, Idrus, Hammad, & AhmedUmar, 2014; Tuan & Navrud, 2008).
Beyond aggregation and weighting systems, rating levels are also quite different from tool to tool
(Table 2.15). Notwithstanding, all tools present a qualitative scale, mostly intended for end-users to
better understand the result and score achieved.
Table 2.15. Rating and scoring levels
Methodology Value achieved Qualitative scale CSH 36-47 Points Level 1 («) 48-56 Points Level 2 (««) 57-67 Points Level 3 («««) 68-83 Points Level 4 (««««) 84-89 Points Level 5 («««««) 90-107 Points Level 6 (««««««) LEED 45-49 Points Certified 50-59 Points Silver 60-79 Points Gold 80+ Points Platinum SBToolPT-H P < 0.00 E 0.00 ≤ P ≤ 0.10 D 0.10 < P ≤ 0.40 C 0.40 < P ≤ 0.70 B 0.70 < P ≤ 1.00 A P > 1.00 A+ DGNB ≥ 50% Bronze ≥ 65% Silver ≥ 89% Gold CASBEE BEE < 0.5 C – Poor («) 0.5 ≤ BEE < 1.0 B- - Fairly poor (««) 1.0 ≤ BEE < 1.5 B+ - Good («««) 1.5 ≤ BEE < 3.0 A – Very good (««««) BEE ≥ 3.0 S – Excellent («««««)
2.3.2.4 | When is the assessment performed?
When observing Table 2.9, one can verify that BSA tools are applicable to different life cycle stages.
Yet, when looking specifically at the methodologies for dwellings, the applicability falls essentially to
one of two phases: post-construction (new construction) or design phases. CSH, LEED, DGNB and
CASBEE proclaim to be applied during design and after construction. However, their applicability in
design is for designers to have an idea about the building performance, as no final certification is given
at this phase. To obtain this certificate, the assessment needs to be repeated to some extent and verified

E A R L Y S T A G E D E S I G N M E T H O D O L O G Y T O E N S U R E L I F E C Y C L E S U S T A I N A B I L I T Y O F R E S I D E N T I A L B U I L D I N G S
61
after construction. SBToolPT-H also follows this procedure. On the contrary, EcoProp (although not
a rating method) was specifically developed to be used during pre-design and design phases to aid
designers in the construction of a sustainable building and to know what to expect after construction
(not being used in post-construction).
2.3.3 | Discussion
This chapter started by analysing existing BSA tools schemes and then narrowed the scope of
assessment to those that could be applied to single family dwellings. The evaluation consisted in
determining the differences amongst methodologies, considering: (i) the purpose of assessment; (ii)
sustainability dimensions considered; (iii) indicators addressed; (iv) life cycle phases considered by the
indicators; (v) type of indicators; (vi) measurements; (vii) aggregation processes; and (vii) life cycle phases
during which the assessment was carried out. The chapter focused on the identification and
comparison of the tools, and not their consequences, when applied to single-family buildings.
This work highlighted that, although the main objectives of the different methodologies are similar,
the scope and means to achieve them are quite variable. When assessing the six BSA tools, all, except
EcoProP, intend to certify the buildings’ sustainability, but only after construction. Although they can
be applied during design, an effective certificate will only be issued after post-construction validation.
Multi-criteria assessment methods are needed to evaluate a building’s sustainability in order to assure
a realistic and holistic assessment. In addition, the life cycle phase during which the evaluation occurs
plays an important role in implementing and achieving sustainability goals. Although early design
stages are known to be crucial to a buildings’ life cycle sustainability, only ATHENA, EcoProP and
LEnSE were developed to be really applied in these phases. It is during early design stages that most
design outcomes are settled and incorporated in the final design. Early planning phases play an
important role in achieving building sustainability, as the potential of optimisation is higher, and the
impacts of building changes and construction costs are lower at this point (Bragança, Vieira, &
Andrade, 2014; Kovacic & Zoller, 2015). According to Petersen and Svendsen (2010), existing
simulation tools tend to compare design alternatives rather than give actual advice on how to achieve
a desirable performance, leading to extra time loss for designers to make iterations until a satisfactory
result is reached. When choosing design options, complexity and costs are directly involved and
depend on that. Creating different possibilities, comparing them and their performance is of major
importance for designers. The importance of considering sustainability concepts at early design stages
and the need for tools applicable to these phases has been discussed (Bogenstätter, 2000; Jrade & Jalaei,
2013; Markelj, Kitek Kuzman, Grošelj, & Zbašnik-Senegačnik, 2014; Oti & Tizani, 2015). All these
authors, though focusing on the importance of sustainability rating systems, point out that these are
not always applied to some crucial phases. Thus, BSA tools must be introduced as early as possible to
be truly useful, allowing interrelation between the design and assessment teams. Obviously, the
assessment cannot rely on detailed design information before it has been generated. However, several

C H A P T E R 2 | S U S T A I N A B L E A S S E S S M E N T T O O L S A N D N O R M A T I V E F R A M E W O R K
62
analysed systems rely on detailed data or in the commitment to achieve it, as in the case of
BREEAM/CSH, LEED, DGNB, SBToolPT-H and OpenHouse. This precludes their effective
application during early design. Although these tools are not applicable to conceptual phases, an
assessment can be made using them at the final design phases. At this point, a preliminary sustainability
score and certification can be produced, although it is not valid as final certification until re-evaluation
after construction. Design Certification is not the target of discussion in the literature but, as
aforementioned, this phase is essential to the success of the implementation of sustainability measures.
To what extent do measures in design change during/after construction? Should design teams be
recognised for including sustainable principles at early design stages? Are they really implemented?
Even if a building is designed and built to be sustainable, do users use it wisely and according to the
principles underlying it? Or do they exclude that advantage and a “sustainable” building becomes an
ordinary building due to misguided use? These questions can be pointed out when discussing
sustainability certification. Surprisingly, no study deals with the differences found between preliminary
certification/assessment, post-construction certification and real-use assessment. This could be an
interesting study to understand further, how sustainability methodologies deal with the evolution of a
building life cycle.
Considering sustainability as an interrelationship between environmental, social, and economic
concerns, all BSA tools should consider them to some extent during the assessment. On the other hand,
some might say that economic concerns can somehow be set aside if environmental and social concerns
are assured. Nevertheless, only SBToolPT-H, DGNB, EcoProP and LEnSE follow the first premise and
assess the three sustainability pillars. All the others only consider environment and society except
ATHENA, which only assesses environmental impacts.
The Weighting system is the part of the tools that ultimately defines the sustainability level of the
building. There is no consensus either in the approach to finding the weights or in the weights to be
given to each issue or category. None of the six BSA tools analysed in detail presents the same
aggregation and weighting system. When observing the weights assigned to the three pillars,
environmental aspects tend to get more weight than social and economic ones. This might be due to
the amount of existing research focused on buildings and life cycle environmental assessment. Within
the environmental categories, Energy and Site Sustainability are amongst the most important
categories for the set of BSA tools studied. From the tools analysed, only DGNB gives higher
importance to social issues than to environment. The SBToolPT-H assigns equal weights to social and
economic issues. The analysis of weights, weighting and scoring systems of each methodology shows
that there is still a long way to go to reach a consensus in weights and importance given to each
indicator in the evaluation of single-family buildings. Further investigation on how to objectively
establish weights and scores is absolutely necessary.

E A R L Y S T A G E D E S I G N M E T H O D O L O G Y T O E N S U R E L I F E C Y C L E S U S T A I N A B I L I T Y O F R E S I D E N T I A L B U I L D I N G S
63
Regarding the indicators assessed, CSH and EcoProP have the widest scope, while LEED has the
narrower. Considering the rating systems, although the indicators addressed in DGNB are fewer than
in CSH, their distribution among the evaluated categories seemed to be more balanced. It not only
assesses more issues under service quality, but also includes economic aspects, which does not happen
in CSH. However, it is noteworthy that each scheme acknowledges their local context. It is important
to stress that the adaptation to the local context is crucial, and due to this fact, BSA tools are not
exportable/importable without any adaptation. As aforementioned, only the SBTool method has been
internationally developed to be specifically adapted to different countries and different realities.
Regarding the reported life cycle phases, EcoProP is the only methodology considering all phases.
Considering the rating systems, DGNB and CASBEE consider more phases in their evaluation.
The study showed that none of the schemes is totally quantitative or qualitative. All have different
types of indicators and different ways to measure them, even if the scope is the same. This means that
measuring sustainability is still quite subjective, although there are now international standards trying
to overcome these shortcomings. Nevertheless, each methodology has its own outline and approach to
the assessment. LEED is based on a more ‘Feature’ and ‘Procedural methodology’, having a much more
immediate assessment. It can more easily guide designers to add/exclude a feature, and quickly know
the effect it will have on the final score. Nevertheless, this might conceal results or real data (as
consumptions) as it does not quantify the exact (or expected) performance of the building. SBToolPT-
H, DGNB and EcoProP are based more on Performance indicators, trying to really assess the behaviour
of the building. However, not all indicators can really assess the effect they are trying to measure.
Instead, they evaluate a potential effect or a way to minimize it. For example, the SBToolPT-H assesses
the type of containers and selective collection of waste, instead of quantifying the real waste production.
However, real waste production is very difficult to measure or predict, although having proper means
that promote recycling and waste reduction helps in foreseeing that waste production will be reduced.
Another example is the quantification of finishing materials that have low VOC emissions. The scope
of the indicator is to assess indoor air quality, but instead of assessing the concentration level of VOC
emissions or their effects, the use of finishing materials with low VOC emissions are promoted.
Amongst the six methodologies evaluated, only CSH presents a balance between the three types of
indicators – six Performance, six Feature and six Procedure/Procedural.
The reliability of these methods can easily be discussed. Does their application truly promote
sustainability? Are the addressed aspects enough to assure that? Are the results trustworthy? There are
several questions that may emerge from this study to which the answer can be rather complex. The
authors do not intend to defend a methodology that deprecates others.
The applicability of the methodologies depends heavily on the local country constraints, on their
development level, legal requirements and restrictions, cultural heritage, and climatic conditions, as
each methodology is tailored to the local conditions where it was developed and applied. Thus,

C H A P T E R 2 | S U S T A I N A B L E A S S E S S M E N T T O O L S A N D N O R M A T I V E F R A M E W O R K
64
sustainability assessment should be moulded to the reality of where it is being applied, but maintaining
the same overall principles and the interrelation and balance between environmental, social, and
economic constraints. Still, the implicit importance of balanced components should be adapted to local
reality. For instance, if there are tight regulations regarding non-renewable energy consumption, then
minimum requirements should be set in the building sustainability assessment. On the other hand, if
water scarcity is an issue in a country, then the weight given to water aspects shall be relevant to the
overall sustainability score.
2.4 | CONCLUDING REMARKS
This chapter aimed to present and analyse two main aspects: (i) international standards regarding
buildings’ sustainability and, (ii) comparison of existing BSA tools.
The building’s sustainability assessment is a wide field with too many variables and stakeholders
involved. Although all efforts sustainability assessment methods have been developed without a
standard and, even though different methodologies can include the same aspects, the approach to them
might be very different between them. Therefore, International standards organizations as ISO and
CEN have been struggling to publish standards that will certainly aid sustainability assessment.
However, not all the aspects and procedures are being followed by the existing methodologies. It is
hence essential to introduce standardisation recommendations into practical and used methods.
All BSA tools intend to assess and emphasise building sustainability quality, analysing a
multidisciplinary group of issues. It is interesting to analyse the differences within the methodologies
and the aspects considered by each. Thus, it is of great interest to study them and understand the ins
and outs of their frameworks and the main differences between them. According to the assessment
made, environmental concerns play a major role in the sustainability assessment of dwellings.
Nevertheless, the more recent the tools or their versions are, the more the concerns related to social
comfort, functional and technical aspects and economic issues are included in the assessment. The way
issues are considered by the tools is significantly diverse, hindering any comparison of sustainability
assessments made to different buildings and using different tools. In addition, variations in the purpose,
scope, aggregation, and weighting systems were found. The characteristics and differences between
the tools presented in this chapter provide researchers and stakeholders with useful information for the
development of new methods to quantify and aid the development of more sustainable built
environment. Additionally, this work raises concerns and questions that can encourage further
research and development in the field of sustainability and home BSA tools.
The work presented in this chapter conducted to the publication of the following two journal papers:

E A R L Y S T A G E D E S I G N M E T H O D O L O G Y T O E N S U R E L I F E C Y C L E S U S T A I N A B I L I T Y O F R E S I D E N T I A L B U I L D I N G S
65
• Sustainability assessment of dwellings – a comparison of methodologies.
Andrade, J., & Bragança, L. (2016). Civil Engineering and Environmental Systems, 33(2), 125-146.
doi: http://dx.doi.org/10.1080/10286608.2016.1145676
• Steel sustainability assessment — Do BSA tools really assess steel properties?
Andrade, J. B., Bragança, L., & Camões, A. (2016). Journal of Constructional Steel Research, 120,
106-116. doi: http://dx.doi.org/10.1016/j.jcsr.2016.01.011

C H A P T E R 2 | S U S T A I N A B L E A S S E S S M E N T T O O L S A N D N O R M A T I V E F R A M E W O R K
66
REFERENCES OF CHAPTER 2
(IEA), I. E. A. (2001). LCA methods for buildings. International Energy Agency. Retrieved from Annex 31 – Energy‐related environmental impact of buildings.
Abdul, Y., & Quartermaine, R. (2014). Delivering sustainable buildings: Savings and payback. United Kingdom: IHS BRE Press.
Alyami, S. H., & Rezgui, Y. (2012). Sustainable building assessment tool development approach. Sustainable Cities and Society, 5(0), 52-62. doi: 10.1016/j.scs.2012.05.004
Andrade, J. B., & Bragança , L. (2011). Analysis of the impacts of economic and social indicators to sustainability assessment. International Conference Sustainability of Constructions - Towards a better built environment - Final Conference of the COST Action C25, Innsbruck, Austria.
Andrade, J. B., & Bragança, L. (2012). Sustainability Assessment and Standardisation - Steel Buildings. Concepts and Methods for Steel Intensive Building Projects, Portugal.
Araújo, C., Almeida, M., & Bragança, L. (2013). Analysis of some Portuguese thermal regulation parameters. Energy and Buildings, 58(0), 141-150. doi: http://dx.doi.org/10.1016/j.enbuild.2012.11.024
Assefa, G., Glaumann, M., Malmqvist, T., & Eriksson, O. (2010). Quality versus impact: Comparing the environmental efficiency of building properties using the EcoEffect tool. Building and Environment, 45(5), 1095-1103. doi: DOI: 10.1016/j.buildenv.2009.10.001
ATHENA, (2014). Athena Sustainable Materials Institute web page. Retrieved from http://www.athenasmi.org/. [Accessed May 2014].
Barbosa, J. A., Mateus, R., & Bragança, L. (2013). Adaptation of SBToolPT to office buildings. International Journal of Sustainable Building Technology and Urban Development, 4(1), 89-97. doi: http://dx.doi.org/10.1080/2093761x.2012.759892
Berardi, U. (2012). Sustainability Assessment in the Construction Sector: Rating Systems and Rated Buildings. Sustainable Development, 20(6), 411-424. doi: http://dx.doi.org/10.1002/sd.532
Blok, R., Egmond, E. v., Glaumann, M., & Gervasio, H. (2011). General Framework for sustainability evaluation of the built environment. In L. Bragança, H. Koukkari, R. Blok, H. Gervásio, M. Veljkovic, Z. Plewako & R. P. Borg (Eds.), Summary Report of the Cooperative Activities of the COST Action C25 - Sustainability of Constructions - Integrated Approach to Life-time Structural Engineering (, ed., Vol. 1, pp. 3-30). Malta: Department of Civil & Structual Engineering of Faculty for the Built Environment, University of Malta.
Bogenstätter, U. (2000). Prediction and optimization of life-cycle costs in early design. Building Research & Information, 28(5-6), 376-386. doi: http://dx.doi.org/10.1080/096132100418528
Bonakdar, F., Dodoo, A., & Gustavsson, L. (2014). Cost-optimum analysis of building fabric renovation in a Swedish multi-story residential building. Energy and Buildings, 84(0), 662-673. doi: http://dx.doi.org/10.1016/j.enbuild.2014.09.003
Bossink, B. A. G. (2007). The interorganizational innovation processes of sustainable building: A Dutch case of joint building innovation in sustainability. Building and Environment, 42(12), 4086-4092. doi: http://dx.doi.org/10.1016/j.buildenv.2006.11.020
Bowitz, E., & Ibenholt, K. (2009). Economic impacts of cultural heritage – Research and perspectives. Journal of Cultural Heritage, 10(1), 1-8. doi: http://dx.doi.org/10.1016/j.culher.2008.09.002
Bradley, G. G., & Kibert, C. J. (1998). Developing indicators of sustainability: US experience. Building Research & Information, 26(1), 39-45. doi: http://dx.doi.org/10.1080/096132198370092
Bragança, L., Vieira, S. M., & Andrade, J. B. (2014). Early Stage Design Decisions: The Way to Achieve Sustainable Buildings at Lower Costs. The Scientific World Journal, 2014, 8. doi: http://dx.doi.org/10.1155/2014/365364
BRE Global Ltd, (2014). BREEAM: the Environmental Assessment Method for Buildings Around The World. Retrieved from http://www.breeam.org/. [Accessed April 2014].
Buildings Performance Institute Europe. (2011). Europe’s buildings under the microscope - A country-by-country review of the energy performance of buildings. Brussels,: BPIE.
Bunz, K. R., Henze, G. P., & Tiller, D. K. (2006). Survey of sustainable building design practices in North America, Europe, and Asia. Journal of Architectural Engineering, 12(1), 33-62. doi: http://dx.doi.org/10.1061/(ASCE)1076-0431(2006)12:1(33)
Castro, M. d. F., Mateus, R., & Bragança, L. (2014). A critical analysis of building sustainability assessment methods for healthcare buildings. Environment, Development and Sustainability, 1-32. doi: http://dx.doi.org/10.1007/s10668-014-9611-0
Chandratilake, S. R., & Dias, W. P. S. (2013). Sustainability rating systems for buildings: Comparisons and correlations. Energy, 59(0), 22-28. doi: http://dx.doi.org/10.1016/j.energy.2013.07.026

E A R L Y S T A G E D E S I G N M E T H O D O L O G Y T O E N S U R E L I F E C Y C L E S U S T A I N A B I L I T Y O F R E S I D E N T I A L B U I L D I N G S
67
Chang, Y. F., & Chen, S. Y. (2012). Constructing an architectural designer-oriented computer-aided design tool for smart home device (Vol. 121-126, pp. 4284-4289). Taichung.
Cole, R. J. (2006). Shared markets: coexisting building environmental assessment methods. Building Research & Information, 34(4), 357-371. doi: 10.1080/09613210600724624
Crawley, D., & Aho, I. (1999). Building environmental assessment methods: applications and development trends. Building Research & Information, 27(4), 300 - 308
Danatzko, J. M. (2010). Sustainable Structural Design. (Master Degree in Civil Engineering), The Ohio State University.
De Angelis, E., Pansa, G., & Serra, E. (2014). Research of Economic Sustainability of Different Energy Refurbishment Strategies for an Apartment Block Building. Energy Procedia, 48(0), 1449-1458. doi: http://dx.doi.org/10.1016/j.egypro.2014.02.164
Ding, G. K. C. (2008). Sustainable construction -The role of environmental assessment tools. Journal of Environmental Management, 86(3), 451-464. doi: http://dx.doi.org/10.1016/j.jenvman.2006.12.025
Dobbelsteen, A. v. d., & Uffelen, S. v. (2008). Model comparison of the Duch Green Building Tool. Delft. Retrieved from Dutch Green Building Council
Eco-Quantum). EcoQuantum. Retrieved from http://www.ivam.uva.nl/index.php?id=2&L=1. [Accessed December 2013].
Eichholtz, P., Kok, N., & Quigley, J. M. (2013). The Economics of Green Building. Review of Economics and Statistics, 95(1), 50-63. doi: http://www.mitpressjournals.org/loi/rest
Ellis, C. R. (2009). Who pays for Green? The economics of sustainable buildings. London, United Kingdom. Erlandsson, M., & Borg, M. (2003). Generic LCA-methodology applicable for buildings, constructions and
operation services--today practice and development needs. Building and Environment, 38(7), 919-938. doi: http://dx.doi.org/10.1016/s0360-1323(03)00031-3
European Committee for Standardization, CEN. (2010a). CEN/TR 15941:2010 - Sustainability of construction works - Environmental product declarations - Methodology for selection and use of generic data. Brussels: CEN.
European Committee for Standardization, CEN. (2010b). EN 15643-1:2010 - Sustainability of construction works - Sustainability assessment of buildings - Part 1: General framework. Brussels: CEN.
European Committee for Standardization, CEN. (2011a). EN 15643-2:2011 - Sustainability of construction works - Assessment of buildings - Part 2: Framework for the assessment of environmental performance. Brussels: CEN.
European Committee for Standardization, CEN. (2011b). EN 15978:2011 - Sustainability of construction works - Assessment of environmental performance of buildings - Calculation methods. Brussels: CEN.
European Committee for Standardization, CEN. (2012a). EN 15643-3:2012 - Sustainability of Construction Works - Assessment of Buildings - Part 3: Framework for the assessment of social performance. Brussels: CEN.
European Committee for Standardization, CEN. (2012b). EN 15643-4:2012 - Sustainability of Construction Works - Assessment of Buildings - Part 4: Framework for the assessment of economic performance. Brussels: CEN.
European Committee for Standardization, CEN. (2012c). EN 15804:2012 - Sustainability of construction works - Environmental product declarations - Core rules for the product category of construction products. Brussels: CEN.
European Committee for Standardization, CEN. (2014). EN 16309:2014 - Sustainability of construction works - Assessment of social performance of buildings - Calculation methods. Brussels: CEN.
European Committee for Standardization, CEN. (2015). EN 16627:2015 - Sustainability of construction works - Assessment of economic performance of buildings - Calculation methods. Brussels: CEN.
European Committee for Standardization, (2016a). CEN/TC 350: Sustainability of construction works - Published standards. Retrieved from http://www.cen.eu/cen/Sectors/TechnicalCommitteesWorkshops/CENTechnicalCommittees/Pages/Standards.aspx?param=481830&title=Sustainability%20of%20construction%20works. [Accessed March 2016].
European Committee for Standardization, CEN. (2016b). CEN/TR 16970:2016 - Sustainability of construction works - Guidance for the implementation of EN 15804. Brussels: CEN.
European Committee for Standardization, CEN. (2016c). CEN/TR 17005:2016 - Sustainability of construction works - Additional environmental impact categories and indicators - Background information and possibilities - Evaluation of the possibility of adding environmental impact categories and related indicators and calculation methods for the assessment of the environmental performance of buildings. Brussels: CEN.

C H A P T E R 2 | S U S T A I N A B L E A S S E S S M E N T T O O L S A N D N O R M A T I V E F R A M E W O R K
68
Ferreira, J., Pinheiro, M. D., & de Brito, J. (2014). Portuguese sustainable construction assessment tools benchmarked with BREEAM and LEED: An energy analysis. Energy and Buildings, 69(0), 451-463. doi: http://dx.doi.org/10.1016/j.enbuild.2013.11.039
Fowler, K. M., & Rauch, E. M. (2006). Sustainable Building Rating Systems Summary. Richland, Washington, USA.
German Sustainable Building Council. (2010). The DGNB Brochure. German Sustainable Building Council, (2014). DGNB System. Retrieved from
http://www.dgnb.de/_en/certification-system/index.php. [Accessed January 2014]. Glaumann, M., Malmqvist, T., & Wallhagen, M. (2011). Selecting environmental assessment tool for buildings. SB11
Helsinki World Sustainable Building Conference, Helsinki (Finland). Green Building Council of Australia, (2014). Green Star homepage. Retrieved from
http://www.gbca.org.au/green-star/. [Accessed August 2014]. Haapio, A., & Viitaniemi, P. (2008). A critical review of building environmental assessment tools.
Environmental Impact Assessment Review, 28(7), 469-482. doi: http://dx.doi.org/10.1016/j.eiar.2008.01.002
Huang, Y., Bird, R., & Heidrich, O. (2009). Development of a life cycle assessment tool for construction and maintenance of asphalt pavements. Journal of Cleaner Production, 17(2), 283-296. doi: DOI: 10.1016/j.jclepro.2008.06.005
Institute for Building Environment and Energy Conservation. (2008). CASBEE for Home (Detached House) - Technical Manual 2007 Edition (1st ed.). Tokyo, Japan: IBEC.
International Initiative for a Sustainable Built Environment, iiSBE. (2014). iiSBE SBTool 2012. Retrieved from http://www.iisbe.org/. [Accessed May 2014].
International Organization for Standardization, ISO. (1997). ISO 14040:1997 - Environmental management - life cycle assessment - Principles and framework. Geneva, Switzerland: ISO.
International Organization for Standardization, ISO. (1998). ISO 14041:1998 - Environmental management - life cycle assessment - Goal and scope definition and inventory analysis. Geneva, Switzerland: ISO.
International Organization for Standardization, ISO. (2000a). ISO 14042:2000 - Environmental management - life cycle assessment - Life cycle impact assessment. Geneva, Switzerland: ISO.
International Organization for Standardization, ISO. (2000b). ISO 14043:2000 - Environmental management - life cycle assessment - Life cycle interpretation. Geneva, Switzerland: ISO.
International Organization for Standardization, ISO. (2006a). ISO 14040:2006 - Environmental management - life cycle assessment - Principles and framework. Geneva, Switzerland: ISO.
International Organization for Standardization, ISO. (2006b). ISO 14044:2006 - Environmental management - life cycle assessment - Requirements and guidelines. Geneva, Switzerland: ISO.
International Organization for Standardization, ISO. (2008). ISO 15686-5:2008 - Buildings and constructed assets - Service life planning - Part 5: Life-cycle costing. Geneva, Switzerland: ISO.
International Organization for Standardization, ISO. (2011a). ISO 21929-1:2011 - Sustainability in building construction - Sustainability indicators - Part 1: Framework for the development of indicators and a core set of indicators for buildings. Geneva, Switzerland: ISO.
International Organization for Standardization, (2011b). TC 59 - Buildings and civil engineering works. Retrieved from http://www.iso.org/iso/iso_catalogue/catalogue_tc/catalogue_tc_browse.htm?commid=49070. [Accessed July 2011].
Japan GreenBuild Council (JaGBC), & Japan Sustainable Building Consortium (JSBC), (2014). Comprehensive Assessment System for Built Environment Efficiency (CASBEE). Retrieved from http://www.ibec.or.jp/CASBEE/english/index.htm. [Accessed March 2014].
Jönsson, Å. (2000). Tools and methods for environmental assessment of building products--methodological analysis of six selected approaches. Building and Environment, 35(3), 223-238. doi: 10.1016/s0360-1323(99)00016-5
Jrade, A., & Jalaei, F. (2013). Integrating building information modelling with sustainability to design building projects at the conceptual stage. Building Simulation, 6(4), 429-444. doi: 10.1007/s12273-013-0120-0
Kaatz, E., Root, D. S., Bowen, P. A., & Hill, R. C. (2006). Advancing key outcomes of sustainability building assessment. Building Research & Information, 34(4), 308-320. doi: http://dx.doi.org/10.1080/09613210600724608
Kovacic, I., & Zoller, V. (2015). Building life cycle optimization tools for early design phases. Energy, 92, Part 3, 409-419. doi: http://dx.doi.org/10.1016/j.energy.2015.03.027
Lee, W. L. (2013). A comprehensive review of metrics of building environmental assessment schemes. Energy and Buildings, 62. doi: http://dx.doi.org/10.1016/j.enbuild.2013.03.014

E A R L Y S T A G E D E S I G N M E T H O D O L O G Y T O E N S U R E L I F E C Y C L E S U S T A I N A B I L I T Y O F R E S I D E N T I A L B U I L D I N G S
69
Lee, W. L., Chau, C. K., Yik, F. W. H., Burnett, J., & Tse, M. S. (2002). On the study of the credit-weighting scale in a building environmental assessment scheme. Building and Environment, 37(12), 1385-1396. doi: http://dx.doi.org/10.1016/s0360-1323(02)00006-9
LEnSE Partners. (2006). Sustainability assessment of buildings - Issues, scope and structure. Belgium. Malmqvist, T., Glaumann, M., Svenfelt, Å., Carlson, P. O., Erlandsson, M., Andersson, J., . . . Malmström,
T. G. (2011). A Swedish environmental rating tool for buildings. Energy, 36(4), 1893-1899. doi: http://dx.doi.org/10.1016/j.energy.2010.08.040
Markelj, J., Kitek Kuzman, M., Grošelj, P., & Zbašnik-Senegačnik, M. (2014). A Simplified Method for Evaluating Building Sustainability in the Early Design Phase for Architects. Sustainability, 6(12), 8775-8795. doi: http://dx.doi.org/10.3390/su6128775
Mateus, R., & Bragança, L. (2011). Sustainability assessment and rating of buildings: Developing the methodology SBToolPT-H. Building and Environment, 46(10), 1962-1971. doi: http://dx.doi.org/10.1016/j.buildenv.2011.04.023
Mateus, R., & Bragança, L. (2016). Manual de avaliação SBToolPT-H. V2016/1. Portugal: iiSBE Portugal. Mateus, R., Bragança, L., Blok, R., Glaumann, M., Wetzel, C., Bikas, D., . . . Aktuglu, Y. K. (2011). Use
of rating systems in the process towards sustainable construction. In L. Bragança, H. Koukkari, R. Blok, H. Gervásio, M. Veljkovic, Z. Plewako & R. P. Borg (Eds.), Summary Report of the Cooperative Activities of the COST Action C25 - Sustainability of Constructions - Integrated Approach to Life-time Structural Engineering (Vol. 1, pp. 51-97). Malta: Cost.
Mateus, R., Braganca, L., & Koukkari, H. (2008). Sustainability Assessment and rating of Portuguese buildings. In G. Foliente, T. Luetzkendorf, P. Newton & P. Paevere (Eds.), CIB Co-sponsored: World SB08 Melbourne: World Sustainable Building Conference (Vol. Volume 2, pp. p.959-966). Melbourne (Australia): CSIRO- Commonwealth Scientific and Industrial Research Organisation, Australia.
OpenHouse, (2010). Open House Project. Retrieved from http://www.openhouse-fp7.eu/. [Accessed June 2013 2013].
Oti, A. H., & Tizani, W. (2015). BIM extension for the sustainability appraisal of conceptual steel design. Advanced Engineering Informatics, 29(1), 28-46. doi: http://dx.doi.org/10.1016/j.aei.2014.09.001
Petersen, S., & Svendsen, S. (2010). Method and simulation program informed decisions in the early stages of building design. Energy and Buildings, 42(7), 1113-1119. doi: http://dx.doi.org/10.1016/j.enbuild.2010.02.002
Reed, R., Bilos, A., Wilkinson, S., & Schulte, K.-W. (2009). International Comparison of Sustainable Rating Tools. The Journal of Sustainable Real Estate, 1(1), 1-22
Shen, W., Shen, Q., & Sun, Q. (2012). Building Information Modeling-based user activity simulation and evaluation method for improving designer–user communications. Automation in Construction, 21(0), 148-160. doi: 10.1016/j.autcon.2011.05.022
Sodangi, M., Khamdi, M. F., Idrus, A., Hammad, D. B., & AhmedUmar, A. (2014). Best Practice Criteria for Sustainable Maintenance Management of Heritage Buildings in Malaysia. Procedia Engineering, 77(0), 11-19. doi: http://dx.doi.org/10.1016/j.proeng.2014.07.017
Tarja Häkkinen et al. (2012). Sustainability and performance assessment and benchmarking of buildings - final report. Finland: VTT Technical Research Centre of Finland.
Technical Research Centre of Finland, VTT. (2004). EcoProp Brochure. Filand. Todd, J. A., Pyke, C., & Tufts, R. (2013). Implications of trends in LEED usage: rating system design and
market transformation. Building Research & Information, 41(4), 384-400. doi: http://dx.doi.org/10.1080/09613218.2013.775565
Tuan, T. H., & Navrud, S. (2008). Capturing the benefits of preserving cultural heritage. Journal of Cultural Heritage, 9(3), 326-337. doi: http://dx.doi.org/10.1016/j.culher.2008.05.001
U.S. Green Building Council, (2014). LEED homepage. Retrieved from http://www.usgbc.org/leed. [Accessed January 2014].
Wallhagen, M., Glaumann, M., Eriksson, O., & Westerberg, U. (2013). Framework for Detailed Comparison of Building Environmental Assessment Tools. Buildings, 3(1), 39-60


71
3 DESIGN STAGES OF BUILDINGS – �
EARLY DESIGN
3.1 | INTRODUCTION
The need to build homes through a sustainable approach has been already discussed in Chapter 1. As
Walker (2006) stated, sustainability criteria should not be an add-in after construction but, instead, it
should be included in the project design, since the beginning as any other requirement considered.
The benefits of doing so are the possibility to improve life quality with lower environmental impacts
and controlled costs (Brophy & Lewis, 2011). When choosing design options, complexity and costs are
directly involved and depended on them. Design phases are those where out-of-the-box solutions can
be studied and implemented to improve sustainable performance, and there are dozens of them. For
this reason, if design is not properly informed, solutions can be missed hampering greater results
(Petersen & Svendsen, 2010). Creating different possibilities, comparing them and their performance
is of main importance for designers. This allows designers to find long-term solutions that assure users’
well-being, minimising the needs for natural resources exploitation and with economic savings.
Different studies have shown that the earlier sustainability measures are accounted, the greater the
building’s performance will be and at the lower costs (Bogenstätter, 2000; Kovacic & Zoller, 2015;
Nielsen, Jensen, Larsen, & Nissen, 2016). Figure 3.1 depicts how introducing sustainability concerns
early in the design, raises the project resources optimisation and the impact of changes in the building
occur at lower costs.

C H A P T E R 3 | L I F E C Y C L E P H A S E S O F B U I L D I N G S - E A R L Y D E S I G N
72
Figure 3.1. Influence of design decisions on life-cycle impacts and costs (adapted from Kohler and Moffatt (2003))
The output of this chapter basis the development of concepts towards the desired tool to enable
designers comparing and evaluating the consequences of different design solutions, based on
preliminary data, and to ease cooperation between various partners and client, and possibly yield a
sustainable and high performance building through its life cycle.
3.2 | EARLY DESIGN STAGES – THE ROLE TO SUSTAINABLE DESIGN
A building’s project follows general criteria that allow its development on subsequent stages; usually,
main criteria respond to functional, economic, social, and time requirements. However, those are not
enough to create a consistent base to achieve optimal results for the building. New criteria and
approach, which are usually not considered, can bring advantages to the project, favouring
improvement of its performance and reducing its final cost (Deru & Torcellini, 2004). The sooner the
project goals are defined and the new criteria are integrated, the more sustainable the building will be.
This chapter section aims to emphasise the importance of integrated design process towards
sustainable design. For this, identification of design project phases is presented, focusing on the
importance and ability of early phases to influence the sustainability performance and life cost over
project life.
3.2.1 | Design process
Sustainability building research shows that most important decisions concerning buildings
performance are taken during initial design phases, even if not all the information is available (Kohler
& Moffatt, 2003; Son & Kim, 2015; Zeiler, Quanjel, Velden, & Wortel, 2010).
A building design, beyond having as final objective the development of a building, has the same
ambition and dilemmas as a project of any other kind. Hence, in a first stage it must be considered just

E A R L Y S T A G E D E S I G N M E T H O D O L O G Y T O E N S U R E L I F E C Y C L E S U S T A I N A B I L I T Y O F R E S I D E N T I A L B U I L D I N G S
73
as a project, which was defined by Kerzner (1984), as any undertaking that involves a complex set of
activities and tasks guided by: (i) specific objectives based on a specification; (ii) a specific start and
completion date and; (iii) specific funding requirements and the consumption of resources such
material, equipment, money, human resources, and time. The design process can be defined as a
method of selection and synthesis of ideas and perspectives of those involved, and it should result into
a set of clearly defined goals and concepts to be applied during all the design phases. These goals
should induce guidelines to plan, organise, and manage the whole procedure to achieve better results.
Trumpf (2007) said sustainable design demands for an integrated design process (IDP) and a more
involved approach rather than a conventional one. Keeler and Burke (2009) stated that IDP and green
design should be thought of as equivalent terms. Here, audaciously it is aimed to take a step further
and wider the equivalence to sustainable design rather than green design.
Conventional design has a sequential (or linear) approach, in which the different disciplines do not
iterate with each other, as each specific goal is assigned to a different member of the design team. This
approach may hamper the project improvement over time, as information is made available too late
in the project process. Low interaction between design team members is recurrent and thus, iterations
in the project are scarce. Performance goals that exceed legal requirements are often not established,
making it difficult to design a sustainable building through this approach. Regarding costs, most of
them are established during conceptual phases, although this phase only requires few resources. This
dichotomy, of having too much important decisions to make where too little information is available,
highlights the importance of early design and the inevitability to embrace a new design strategy (Buur
& Andreasen, 1989; Hartog, 2003) (as cited in Zeiler et al., 2010).
Contrarily, an integrated design project approach, considers building requiring all design team
members to be involved and work holistically (Larsson, 2004, 2009). In IDP, project goals are set early
in the process making it easier and cost-effectively incorporated in the design. The different specialities
work interconnected, committed in accomplishing those goals. The design process is not linear, there
are feedback loops that aid at improving project quality, and all the design steps have the same starting
point: the set goals (Figure 3.2). IDP is a mean to enhance professionalism and client’s orientation; its
aim is to satisfy real client needs and to leave the design process open to creative and innovative
solutions. Thus, all technicians needed for project development should be part of the project team;
their contribution is vital for a genuine ecological design. According to the USA National Institute of
Building Sciences (2012), to achieve a successful holist project, IPD should consider eight goals
balanced with each other: accessibility, aesthetics, cost-effectiveness, functionality and operability,
historic preservation, productivity, safety and security, and sustainability.

C H A P T E R 3 | L I F E C Y C L E P H A S E S O F B U I L D I N G S - E A R L Y D E S I G N
74
Figure 3.2. Representation of IDP model, (adapted from Larsson, 2009)
Relevant experts should be involved from the first outline of the project until the removal phase. Once
established the working basis, the team can begin working on finding design solutions to reach all goals.
IDP depends on collaborative work, developing performance-based buildings with a lifecycle thinking.
A performance approach is defined as “a practice of thinking and working in terms of ends rather than
means” (CIB, 1982). This approach concerns the building or building material’s function rather than
how it should be constructed and it does not stop with the conclusion of the construction works. It is a
function of time, including use phase performance requirements (Perfection Consortium, 2011).
The main project goals should be defined early in design to set meaningful targets against which
options and levels of achievement should be assessed, enforcing a sustained work and effort by all team.
This enables identifying measurable criteria to assist designers defining the solutions that would fulfil
the project goals, with minimal environmental impacts and costs. When project briefing is poor or
incomplete the probability to fail sustainable design increases (Chandramohan, Narayanan, Gaurav,
& Krishna, 2012; Robichaud & Anantatmula, 2011). Also, if the goals are not easily measurable and
understandable, limitations and inefficacy to their achievement could occur (Deru & Torcellini, 2004).
This depicts the importance of high-quality planning and the need to have a tool that enables the
design team to validate their work and aid the decision-making towards the sustainable goals.
Therefore, it is essential to consider IDP when aiming at a sustainable design. Strategies to integrate
sustainable criteria will reduce energy consumption and environmental pollution, influencing

E A R L Y S T A G E D E S I G N M E T H O D O L O G Y T O E N S U R E L I F E C Y C L E S U S T A I N A B I L I T Y O F R E S I D E N T I A L B U I L D I N G S
75
performance, and reducing its final cost, bringing benefits during building life-cycle. The effect of these
issues will bring advantages on social, environmental and economics spheres. In order to understand
when and how a design aid tool could be developed and used at early design, the following sections
explore the nature of buildings’ life cycle phases and the possibility to act in them towards sustainable
built environment.
3.2.1.1 | Design phases
A building project comprises by a series of consecutive actions. These actions can be gathered in stages,
by their level of priority, establishing each phase of the project. It is important to consider the value of
each action or goal, predicting its importance on buildings performance and its influence on the project
final cost, in order to implement each one at the appropriate moment. Huovila (1999) mentioned that
a performance approach is essential to manage life cycle requirements of a building during its
conception. Figure 3.3 schematically represents the stages of a building design within the building’s
life cycle. Considering literature, it can be regarded that building project phases are generally the same,
even though different authors name it differently. To ease understanding, the terminology given to the
design phases follow, as much as possible, the nomenclature in RIBA Outline Plan of Work 2007/13
(RIBA, 2013) together with the one presented in Bragança, Vieira, and Andrade (2014).
Before starting the project, a stage zero can be defined – Strategic Definition. It aims at evaluating and
defining the project’s objectives before the detailed brief. This phase is particularly relevant in
sustainable design of both new and refurbishment building designs. It aids defining the sustainability
strategy and site’s potential regarding its existing facilities and ecologic value. With the right questions,
several alternatives to the site, building extensions, refurbishments or new buildings can be established
and discussed. When sites are pre-developed, this phase is quite relevant. Design team can perform
inspection and diagnosis actions on existing constructions, to assess their conservation and safety
conditions, and gather as much information of the existing building as possible. This pre-evaluation
and discussion, allows a properly definition of the project’s scope and briefing process (RIBA, 2013).
Figure 3.3. Stages of a buildings design process

C H A P T E R 3 | L I F E C Y C L E P H A S E S O F B U I L D I N G S - E A R L Y D E S I G N
76
The second phase is the Conceptual stage which splits broadly into three main tasks: (i) appraisal, (ii)
design brief, and (iii) concept design. This phase gathers the ‘preparation and brief’ and ‘concept
design’ stages of RIBA plan of work 2013. Appraisal lies in the identification of client’s requirements
and identification of the project team, allowing to set up the project’s objectives as quality goals,
outcomes, performance level, sustainability targets, and budget. The design team should understand
the clients’ requirements, including environmental ones, and encourage them towards green design to
set patterns, performance targets and standard profiles; this phase is crucial for successful application
of sustainable design principles. Expert technicians should provide architects with the best advice and
contribute with their knowledge to improve buildings performance. The use of passive solar systems
should be maximised, regarding both lifecycle and initial cost, and only then active systems should be
considered. The client must be made aware of the difference between initial and lifecycle costs, gaining
consciousness that spending more on higher quality components and techniques is often worthwhile:
it will improve environmental performance, reduce energy consumption and reduce lifecycle costs
(Abdul-Kadir & Price, 1995; Brophy & Lewis, 2011; Bunz, Henze, & Tiller, 2006; Hanna &
Skiffington, 2010; Haroglu, Glass, & Thorpe, 2009; New Zealand Ministry for the Environment, 2008;
"Portaria de 7 de Feveiro de 1972," ; RIBA, 2011; Wakita, Linde, & Bakhoum, 2011).
The design briefing is a mutually informative phase as building design goals are defined. Here, clients
and project team share information to develop initial concepts; the architectural programming defines
key requirements and constraints towards project quality. The type of architecture, formal and
functional aspects, and indoor and outdoor quality are discussed. Information about the site must be
made available and if it is not appropriate for construction, elsewhere must be suggested; subjects such
as the building functionality, environmental and spatial performance, comfort practices, energy
requirements, etc. should be addressed, as well as concerns about building use, heating, cooling,
lighting, ventilation, water, waste, site works, and materials. Additionally, this phase considers the
procurement method, and project and sustainability procedures, which deal with building design
lifetime, organisational structure, maintenance, project cost, and timescale (Brophy & Lewis, 2011;
RIBA, 2006; Hanna & Skiffington, 2010; Haroglu et al., 2009; New Zealand Ministry for the
Environment, 2008; "Portaria de 7 de Feveiro de 1972," ; RIBA, 2011; Wakita et al., 2011). Design
briefing aims at putting in practice the clients’ instructions by preparing the design to receive the
subsequent data. At these moment, the design team should examine the site, consider the chosen
approach, and analyse its feasibility; if necessary, alternative strategies should be developed.
Architectural programming evolved and thoughts about building users, their activities and
interconnections initiate.
The implementation of the earlier set out objectives is held in the following project step - concept
design. Several publications emphasise the importance of this phase and attribute such emphasis to
the performance of the building in its operational phase (Bunz et al., 2006). However, decision-making
tools are rare (Haroglu et al., 2009; Macmillan, Steele, Austin, Kirby, & Robin, 2001). At this phase,

E A R L Y S T A G E D E S I G N M E T H O D O L O G Y T O E N S U R E L I F E C Y C L E S U S T A I N A B I L I T Y O F R E S I D E N T I A L B U I L D I N G S
77
all clients’ interests, and design team members such as architects, engineers and all needed specialists
are involved. This initial phase puts into practice the clients’ instructions and exposes the project team
proposal; decisions at this early stage are of the utmost importance while project is provisional and
open to change. At this moment, graphic representation must be initiated presenting the architectural
solutions, a sketch of the building must be submitted, representing the sequence of operations to
perform, translating the development of initial concept and proposing solutions for the overall forms.
General technical solutions and sizing criteria must be defined. The constraints arising from the
occupation of land and urban demands should be considered, materials, technologies, and
construction processes less harmful to the environment should be regarded. The proposed solutions
should facilitate the subsequent proposals for adaptation of the complementary technical studies. The
energy management must be conceived, in order to get an optimal performance and minimize power
consumption. Design team can select alternative solutions, using concepts, systems, or tools in line with
site climate characteristics, form, and function, providing comfort. Materials and type of construction
must begin to be thought based on sustainable criteria (cost, durability, quality and proximity of
suppliers, quantity of generated waste, modularity/standard). The design team should present an
approximate timetable and examine the proposal assuring the fulfilment of the overall budget. If
possible, interactive studies of design concepts should be made, in order to evaluate their performance
(Brophy & Lewis, 2011; Bunz et al., 2006; Hanna & Skiffington, 2010; Haroglu et al., 2009; New
Zealand Ministry for the Environment, 2008; "Portaria de 7 de Feveiro de 1972," ; RIBA, 2011;
Wakita et al., 2011).
Hence, it is hereby understood as the Conceptual Phase of the building, in which the overall system
configuration is defined, and schematic drawings and layouts will provide an early project
configuration. At this stage, the availability of data is very poor and any assessment should be based
mainly on assumptions. At this stage of design, there are no drawings or any other details about the
building. The only information about the building shape is the area of construction and the height of
the building. From these elements, all other data need to be estimated. Based on the available input
data, the following aspects need to be fulfilled in this stage: the selection of the type of the superstructure
of the building; a bill of materials for the structure (estimation); an estimation of bill of materials for
the envelope (e.g., areas of external and internal walls, area of floors, area of roof, etc).
The next project phase begins after the approval of sketch studies; the design team initiates
implementing the working drawings for the construction of the project – Pre-design phase. This stage
can also split in two moments, the preliminary project and basic project.
In preliminary project, the general shape of the building is developed through plans, sections, and
elevations; the provisional information addressed in earlier phases is confirmed or modified. The
chosen solution must be compatible with initial requirements and within the various applicable
regulations; the functional relationships between different elements, spaces, and volumes must be

C H A P T E R 3 | L I F E C Y C L E P H A S E S O F B U I L D I N G S - E A R L Y D E S I G N
78
examined, as well as the base programming, according to any amendments agreed between client and
design team. The building gets closer to its final form and layout, its general composition, and
subdivision is defined and its broad dimensions are decided. Also, the communication system and basic
movement are established as well as the building’s flexibility for use and possibilities of expansion. The
construction technology is generally defined and materials are proposed during the meetings with
clients. Aspects like exterior and interior wall finishing, flooring, plumbing fixtures, hardware design,
type of masonry, roofing materials, etc., shall be decided at this stage. Building equipment as types of
windows and doors and their manufacturer, the mechanical system, electrical fixtures are also to be
identified in this phase. This kind of information, when taken together, facilitates an estimate of
construction cost. Still, work of every technical specialist must be coordinated, the public authorities
must be consulted and initial investigations of comfort and environment should be confirmed (Brophy
& Lewis, 2011; New Zealand Ministry for the Environment, 2008; RIBA, 2011).
The data available at this stage enables a better definition of the structural system. In this stage, it is
expected to have information (drawings) about the plans and elevations of the building. The detail
level of the building enables a much more accurate definition of the bill of materials. Based on the
available input data, a complete bill of materials for the structure and envelope and the definition of
the building orientation need to be fulfilled in this stage.
The basic project, project development phase, or design development (New Zealand Ministry for the
Environment, 2008) consists of the almost definite design; disposal and sizing are determinative, as
well as everything needed to clarify the work; specialities experts must be integrated and form changes
are enabled to adapt to technical details.
The enforcement/execution phase is also known as the project (Abdul-Kadir & Price, 1995) the
detailed design (New Zealand Ministry for the Environment, 2008) or the technical design (RIBA,
2011). The enforcement/execution phase is defined by the depth characterization of needed work
information. At this phase, details and specifications are prepared to coordinate project components
and elements, as well as information for statutory standards, sustainability assessment and construction
safety. This phase has only one single moment named detailed project. At this moment, design
solutions adopted are detailed, particularly ones related to the external envelope; technical
specifications and building components are defined, as well as necessary details for understanding,
implementation and execution of work must be represented. The compatibility between all design
elements must be ensured.
The tender/proposal phase can also be called tender procedure (Abdul-Kadir & Price, 1995), and
engagement of contractors (New Zealand Ministry for the Environment, 2008) or preconstruction
(RIBA, 2011).

E A R L Y S T A G E D E S I G N M E T H O D O L O G Y T O E N S U R E L I F E C Y C L E S U S T A I N A B I L I T Y O F R E S I D E N T I A L B U I L D I N G S
79
In conventional design process, these steps can be understood as a linear process. However, sequential
work routines may be unable to support adequate design optimisation efforts during decoupled phases,
leading to higher expenditure. In this approach, the architect and the client agree on a design concept,
consisting of a general massing schema, orientation, fenestration, and the general exterior appearance,
in addition to basic materials. The structural, building physics, and mechanical and electrical engineers
are then asked to implement the design and to suggest appropriate systems. Although this is vastly over
simplified, this kind of process is one followed by most general-purpose design companies. On the
other hand, a sustainable design needs an integrated design process; it requires the involvement of the
whole design team and the iteration between phases. The design team must maintain a high level of
communication throughout the design process and must work well together to resolve all issues and
concerns on the project. Accordingly, the behaviour of the design team is critical and their members
must be able to establish a collaborative framework for the project.
3.2.2 | Decision support
The increasing demand for more efficient building is continuously increasing and, as a result, designers
must include sustainability criteria in their building projects, as previously debated. It has been cleared
out in the previous sections that fundamental sustainability goals should be established early in design
to set meaningful targets, in order to ease their implementation and save costs. Thus, options and levels
of achievement should be assessed against those goals. So far, no constraints. Setting goals and
implementing them does not look so hard. However, it really might be. Setting targets as to energy
demand, indoor air quality, low environmental impact materials and life cycle costs, may often be
conflicting. Thus, supporting decision-making and guiding design towards the achievement of the set
goals, through a design aid tool is imperative (Østergård, Jensen, & Maagaard, 2016). This is not an
easy task (Attia, Gratia, De Herde, & Hensen, 2012). Early design deals with coarse and few data while
most of the existing tools require detailed data that are often unavailable at these stages.
The decision-making process has been described to have six steps, by Bazerman and Moore (2009):
(i) problem definition, (ii) criteria identification, (iii) criteria weighting, (iv) alternatives generation,
(v) rating each alternative in each criterion and, (vi) optimal decision computation. These steps connect
with the design stages abovementioned, defining the specific moments requiring decision-making.
Although it can be found in the literature that such tools are utmost necessary, their existence is still
poor (Baba, 2013). The existing ones, when applied, intend to validate and rationalise over decisions
already made rather than supporting the supporting the decision (Hopfe & Hensen, 2009).
Each designer works in a different way. Usually, a tool can be used to satisfy a certain task, and another
one is used for a different need even if they overlap functions. Considering that a member of the design
team can proceed this way, imagining all team members also do it, shows how difficult it is to gather
all data, share it and take decisions on them. Building information modelling (BIM) is emerging over

C H A P T E R 3 | L I F E C Y C L E P H A S E S O F B U I L D I N G S - E A R L Y D E S I G N
80
the last few years, emphasising knowledge sharing among the design team. It works as an online single
data repository that can be accessed, used, and upgraded by all actors, throughout the life cycle of the
building (Barlish & Sullivan, 2012; Cheung, Rihan, Tah, Duce, & Kurul, 2012). BIM is an added value
to building project design and construction as it intends to promote design and construction efficiency,
aiding delivering buildings with better performance. Beyond facilitating collaborative work among the
project team members, this technology allows including sustainability criteria in the design. Thus, it
aids IDP implementation as well as the sustainable design. However, the use of such technology is far
from being a common practice, despite its rising use. The literature argues it is mainly used in
large-scale projects, while in smaller enterprises and projects it remains scarce (Arayici et al., 2011).
BIM integrates with primarily designing tools such as for instance Revit or ArchiCAD, or specialised
tools as EnergyPlus for energy assessment, Structuralworks for structural design, etc. The key factor is
its interoperability among tools, allowing work sharing and improvement. Nevertheless, early decision-
making supported in these systems is still not implemented; early knowledge integration in
computational support is still required (Cavieres, Gentry, & Al-Haddad, 2011). Cheung et al. (2012)
presented a multi-attribute tool to be used in SketchUp, aimed at supporting early architectural stage
models’ decision, to build lower environmental impact buildings according to costs models. Although
useful, the tool only regards a part of environmental impact criteria and uses only investment costs as
a comparison. Social and LCC criteria rather than investment costs are left out of the tool.
Bearing in mind what has been said so far, the need to develop an early sustainable design support
tool is undeniable. Establishing a sustainable performance goal before conceptual design, as said, is of
foremost relevance towards its accomplishment. The use of sustainable target value (STV) framework
in design, as a parallel method to target costing in building design, is defended by Russell-Smith,
Lepech, Fruchter, and Littman (2015). The goal of this framework is to reduce buildings’ life cycle
environmental impacts by setting a target for those during design. This concept of setting targets at the
project beginning is in line with the IDP design, as seen in Figure 3.2. As stated earlier, research should
dare to go beyond environmental criteria, and aiming at setting targets to the three sustainability
cornerstones, as an author’s belief that sustainability concept should only be used when environmental,
social as an economic field are assured and inter-balanced.
In this sense, establishing sustainability checkpoints at each design phase can aid achieving the STV
defined at the beginning of the building design. RIBA (2011) gave a useful aid on this matter,
publishing a guide to green overlaying aspects to their plan of work. It is in the appraisal phase that
awareness to sustainability should be highlighted and sustainable goals should be established.
Agreement on which sustainability criteria the design team project will focus and set the target values
to those should be stated. Selection, if desired, of a formal sustainability assessment method and/or
design framework, to aid achieving the desired target should be warned at this stage. Also, LCC
constraints should be bared in mind during appraisal, as well as the building’s lifespan. During design
briefing, targets set on appraisal should be amended if necessary, and also included in the project initial

E A R L Y S T A G E D E S I G N M E T H O D O L O G Y T O E N S U R E L I F E C Y C L E S U S T A I N A B I L I T Y O F R E S I D E N T I A L B U I L D I N G S
81
brief document, and distributed among all design team. Simple assessment allowing for solutions
comparison can and should be carried out. Questions regarding specific sustainability criteria should
be put on the table, and measuring methods should be selected. In the concept phase, decisions based
on the stated targets should be made to implement the necessary design solutions. Formal sustainability
pre-assessment and identification of key areas of design focus should be performed at this stage.
3.2.3 | Discussion of the design process
This section aims at highlighting the importance of holistic and integrated design process towards
lifecycle sustainable design. A more complex design process assures its high quality by gathering a
multidisciplinary team who seeks to encompass all necessary disciplines attaining for sustainability
goals and preparing the project for its best performance. It is important to mention that the sooner the
sustainability goals are established and dealt with, the easier it will be implemented and the costs will
be controlled. Thus, earlier decisions on project process have the deepest influence on its performance.
For this reason, this study was made describing and clarifying the contents of buildings’ design early
phases. The literature identifies mainly the same phases, although they have different nomenclature.
Several initial project stages were analysed. The conceptual stage begins when the client meets the
design team and the objectives of the project are defined. Represents a preliminary design phase of the
building, in which the overall system configuration is defined, and schematics drawings and layouts
will provide an early project configuration, type of architecture and formal and functional aspects;
specific data are lack. Pre-design stage starts with the implementation of the working drawings, the
general form of the building is developed through plans, sections, and elevations; the provisional
information addressed in the conceptual phase is confirmed or modified.
It has argued that the earlier the sustainable criteria are implemented in design process, the higher is
the chance of their success, regarding achievement of greater lifecycle sustainability performance at
reduced costs. A project that is thought since its beginning considering the buildings whole life, has its
needs counted early and its cost is foreseen. Gathering a design team should encompass all expert
technicians in order of a major responsibility in achieving early planned sustainability goals.
3.3 | SUSTAINABILITY DEALT WITH IN DESIGN – PORTUGUESE
REALITY
As seen, most of the buildings’ influence over the environment and life quality is determined during
early design stages. Although are countless BSA methods around the world, only a few studies address
early design sustainability (Markelj, Kitek Kuzman, Grošelj, & Zbašnik-Senegačnik, 2014; Oti &
Tizani, 2015; Weytjens, 2009). Often, the lack of ways to proof the benefits of adopting sustainability
measures during early design, hamper their application, as designers are unable to convince clients
otherwise. It is necessary to deep the study in the role of sustainability thinking during early design,

C H A P T E R 3 | L I F E C Y C L E P H A S E S O F B U I L D I N G S - E A R L Y D E S I G N
82
from the designers’ perspective, to understand their drivers and constraints, and to figure out at which
point they are aware of sustainability construction principles.
Most of the studies surveying designers, regard the use of specific tools or methods, instead of the
aspects most considered during design. The most studies relate to the use LCA, energy simulation
tools, and LCC. Østergård et al. (2016) reviewed existing building simulations tools and software used
both by academia and commercial services, to support early design decision. Han and Srebric (2015)
found that energy simulation tools are more used than LCA. Tian, Chen, Tang, Wang, and Shi (2015)
found that these energy tools used at conceptual design stage, do not fully address the designer’s needs.
Bogenstätter (2000) attempt to predict the use of LCC at early design stages. In Italy, a survey was
made to predict the use of eco-design principles by architects and engineers. The study found that
designers have high environmental awareness but a systematic use of eco-design approach is far from
being fully accomplished (Annunziata, Testa, Iraldo, & Frey, 2016). Heravi, Fathi, and Faeghi (2015)
researched the use of sustainability indicators of petrochemical industrial buildings, but specifically for
the use in early design. Al-Gahtani, Alsulaihi, El-Hawary, and Marzouk (2016) surveyed designers to
propose a generic framework for office buildings in Saudi Arabia.
These studies showed that a comprehensive approach to sustainability dimensions, in early design is
scarce. If environmental concerns are often accounted, as energy consumption, health and comfort
are lacking. There is the need to encounter all the three– environmental, social, and economic – to
have an integrated and holistic design. Only in this away, it will be possible to understand the
interactions among them and work to improve all, without compromising the others. Therefore, this
survey study intended to provide a view to real context of designers’ work and to identify what needs
to be done to improve designs’ quality towards sustainable design.
3.3.1 | Research methodology and survey design
A study was carried out for understanding if and to what extent Portuguese designers account for
sustainability principles in their single family building projects and if they are aware they are doing so.
The fact that single family houses represent 48% of EU building stock is only one of the many reasons
why they were chosen as target building typology (Buildings Performance Institute Europe, 2011). The
use of questionnaire has been considered effective in similar studies (Al-Gahtani et al., 2016; Han &
Srebric, 2015; Mansour & Radford, 2016). Before distributing the questionnaires, an extensive
literature review of existing BSA tools and sustainability indicators was performed. The findings were
then treated to build a pool of parameters, free of duplications (J. Andrade & Bragança, 2016). Next,
a preliminary questionnaire was prepared and distributed among building sustainability experts, in
order to survey its first version reliability. This step allowed a better preparation of the questionnaire,
as it helped to verify the sustainability indicators to be included, to adequate the questions, and to
determine the time needed for answering. Figure 3.4. presents the research method flowchart.

E A R L Y S T A G E D E S I G N M E T H O D O L O G Y T O E N S U R E L I F E C Y C L E S U S T A I N A B I L I T Y O F R E S I D E N T I A L B U I L D I N G S
83
Figure 3.4. Methodology schematic diagram
3.3.1.1 | Pool of indicators
As seen in Chapter 2 there are countless BSA tools, with different scopes, and assessment and weighting
methods. From these tools, it is possible to count more than five hundred indicators. Often different
tools have various parameters, although, after a deep analysis of their content and objective, it is
observable that the parameters are practically the same (J. Andrade & Bragança, 2016).
The deep study presented in Chapter 2 allowed to narrow the pool of parameters, and to set a starting
point to select the indicators to include in the questionnaires. Table 3.1 comparatively summarises the
key sustainability categories found in the main BSA tools analysed. Moreover, a literature review was
carried out to identify relevant criteria that were not largely discussed in the BSA tools but, somehow
were worth mentioning. The manipulation of the pool of indicators led to a fifty-one parameters
selection distributed among twelve categories: culture, accessibility, health and comfort, safety and
health of workers, aesthetics, functionality, process quality, costs, project management, energy
efficiency, site sustainability, and materials and resources use (Table 3.2).
Table 3.1. Comparison of sustainability categories included in different BSA tools (J. B. Andrade, Bragança, & Camões, 2016)
Categories Assessment methods CSH LEED v4 SBToolPT DGNB EcoProP CASBEE
Life cycle environmental impacts x - x x x x Energy Performance x x x x x x Water Efficiency x x x x x x Waste x x x - x x Materials and Resources x x x x - x Site Sustainability x x x x x x Transports x x x x x - Health and comfort x x x x x x Service Quality x x - x x x Cultural & Aesthetics - - - - x - Project Management x x - x x - Economic aspects - - x x x -
Literature reviewof BSA
Data manipulation ofsustainability criteria
Preliminary questionnaireelaboration Experts survey
Surveyok ?
Designers’ surveyResults analysisConclusions andrecommendations
no
yes

C H A P T E R 3 | L I F E C Y C L E P H A S E S O F B U I L D I N G S - E A R L Y D E S I G N
84
Table 3.2. Indicators included in the final questionnaire
Indicator Indicator Culture Life cycle cost Cl-1 Integration of cultural heritage C-1 Initial cost Cl-2 Integration of built heritage C-2 Operation and maintenance cost Cl-3 Respect for the genius loci C-3 Deconstruction cost Cl-4 Innovation C-4 Resettlement cost Accessibility C-5 Local community cost-benefit
A-1 Access to public transport C-6 Investment in new materials and technologies
A-2 Access to amenities Project management A-3 Barrier-free access PM-1 Synergies with other actors Health and comfort PM-2 Products’ warranty HC-1 Thermal comfort PM-3 Project duration HC-2 Acoustic comfort PM-4 Project complexity HC-3 Indoor air quality Energy efficiency HC-4 Visual comfort EE-1 Low CO2 emission Safety, security and health of workers and local population EE-2 Efficiency
SH -1 Workers’ safety and health EE-3 Energy needs SH-2 Workers’ training EE-4 Nearly or zero carbon technologies SH-3 Community impact EE-5 Consumptions monitoring SH-4 Local work Site sustainability Aesthetics SS-1 Site selection Ae-1 Art within architecture SS-2 Noise control Functionality SS-3 Rainwater retaining F-1 Space efficiency SS-4 Local ecology F-2 Flexibility and adaptability SS-5 Regional impacts F-3 Ease of cleaning and maintenance Materials and resources F-4 Users’ control MR-1 Life cycle impact F-5 Ease of deconstruction MR-2 Materials re-use Process quality MR-3 Recycled content PQ-1 Project preparation quality MR-4 Responsible sourcing PQ-2 Integrated planning MR-5 Equipment efficiency PQ-3 Utilization requirements specification MR-6 Re-use of rain and grey water PQ-4 Construction activity warranty
3.3.1.2 | Survey design
The final questionnaire comprised the following three parts, following the outputs of the preliminary
questionnaire, (a questionnaire sample is available in Appendix 1):
• Respondents’ background, as main activity, experience years, geographical work area and
familiarity with sustainability concepts and assessment tools;
• Gather the respondents’ view of sustainability through a free text question;
• A series of multiple selection questions comprising environmental, social, and economic
indicators, used during project design.
An asymmetric five-point Likert scale was used, ranging from never (1) to always (5), to identify the
relevance given to each sustainability aspect. Two additional selection options were added to this scale:

E A R L Y S T A G E D E S I G N M E T H O D O L O G Y T O E N S U R E L I F E C Y C L E S U S T A I N A B I L I T Y O F R E S I D E N T I A L B U I L D I N G S
85
“It should be considered” and “no opinion”. The first was used to identify indicators that are never
used by designers, but they thought they should be using them, while the second was used to determine
the indicators that designers did not have an opinion, either they should be used or not. Also, in each
multiple selection questions that gathered a group of indicators, a textbox was included where
respondents could provide information that was not pre-defined and it was used by them in project
design. Additionally, a brief description of each indicator was provided to avoid misunderstandings.
The questionnaire was disseminated online, to ease access to it and to aid collecting as many answers
as possible, from June to December 2015. Respondents were engaged through e-mail invitation, direct
contact, disclosure in social networks’ websites and conferences. Fifty-one surveys were completed.
3.3.2 | Results/survey analysis
3.3.2.1 | Participants background
From the fifty-one completed and received questionnaires, one was not valid and therefore excluded
from this analysis. As depicted from Table 3.3 most of the respondents were civil engineers (42%) and
architects (36%). Professions considered under “other” were, for instance, mechanical engineering,
researcher, or product development engineering. Work experience is also an important aspect to
consider, as it might show the respondents’ openness and awareness to sustainability aspects
(Table 3.4). Most the respondents had more than five years of experience (56%), and only 18% had
less than one year.
Another relevant aspect was the location where the participants have projects, as it might also influence
the use of sustainability aspects. This might occur due to local requirements, or even clients’ awareness,
reflecting in their willing, as this may differ according to regional conditions, such as culture, climate,
or local policies. More than 50% of respondents work in the north of Portugal, and nearly 20% also
work abroad (Table 3.5).
Table 3.3. Professions of respondents
Profession Civil Engineer 21 (42%) Architect 18 (36%) Environmental Engineer 5 (10%) Materials' Engineer 1 (2%) Other 5 (10%)
Table 3.4. Work experience of respondents
Work experience (years) Less than 1 year 9 (18%) 1 to 5 years 13 (26%) More than 5 years 28 (56%)
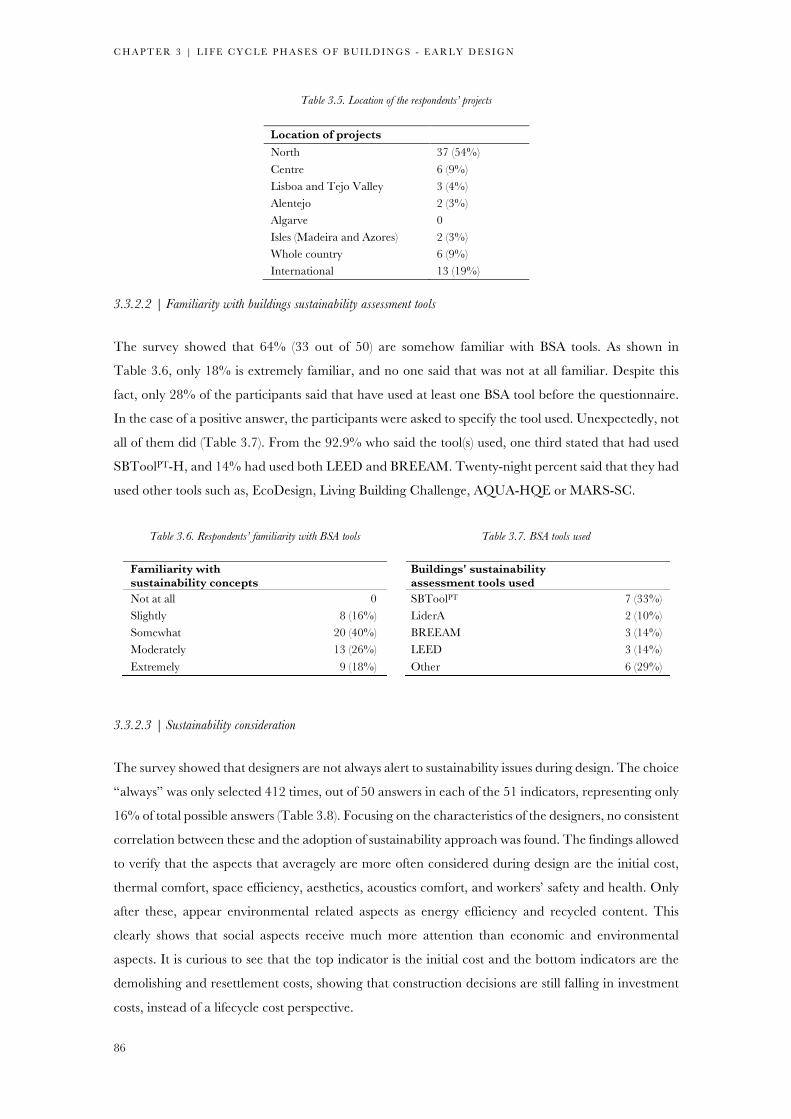
C H A P T E R 3 | L I F E C Y C L E P H A S E S O F B U I L D I N G S - E A R L Y D E S I G N
86
Table 3.5. Location of the respondents’ projects
Location of projects North 37 (54%) Centre 6 (9%) Lisboa and Tejo Valley 3 (4%) Alentejo 2 (3%) Algarve 0 Isles (Madeira and Azores) 2 (3%) Whole country 6 (9%) International 13 (19%)
3.3.2.2 | Familiarity with buildings sustainability assessment tools
The survey showed that 64% (33 out of 50) are somehow familiar with BSA tools. As shown in
Table 3.6, only 18% is extremely familiar, and no one said that was not at all familiar. Despite this
fact, only 28% of the participants said that have used at least one BSA tool before the questionnaire.
In the case of a positive answer, the participants were asked to specify the tool used. Unexpectedly, not
all of them did (Table 3.7). From the 92.9% who said the tool(s) used, one third stated that had used
SBToolPT-H, and 14% had used both LEED and BREEAM. Twenty-night percent said that they had
used other tools such as, EcoDesign, Living Building Challenge, AQUA-HQE or MARS-SC.
3.3.2.3 | Sustainability consideration
The survey showed that designers are not always alert to sustainability issues during design. The choice
“always” was only selected 412 times, out of 50 answers in each of the 51 indicators, representing only
16% of total possible answers (Table 3.8). Focusing on the characteristics of the designers, no consistent
correlation between these and the adoption of sustainability approach was found. The findings allowed
to verify that the aspects that averagely are more often considered during design are the initial cost,
thermal comfort, space efficiency, aesthetics, acoustics comfort, and workers’ safety and health. Only
after these, appear environmental related aspects as energy efficiency and recycled content. This
clearly shows that social aspects receive much more attention than economic and environmental
aspects. It is curious to see that the top indicator is the initial cost and the bottom indicators are the
demolishing and resettlement costs, showing that construction decisions are still falling in investment
costs, instead of a lifecycle cost perspective.
Table 3.6. Respondents’ familiarity with BSA tools
Familiarity with sustainability concepts
Not at all 0 Slightly 8 (16%) Somewhat 20 (40%) Moderately 13 (26%) Extremely 9 (18%)
Table 3.7. BSA tools used
Buildings' sustainability assessment tools used
SBToolPT 7 (33%) LiderA 2 (10%) BREEAM 3 (14%) LEED 3 (14%) Other 6 (29%)

E A R L Y S T A G E D E S I G N M E T H O D O L O G Y T O E N S U R E L I F E C Y C L E S U S T A I N A B I L I T Y O F R E S I D E N T I A L B U I L D I N G S
87
Table 3.8. Summary statistics

C H A P T E R 3 | L I F E C Y C L E P H A S E S O F B U I L D I N G S - E A R L Y D E S I G N
88
Table 3.8. Summary statistics (cont.)
3.3.2.4 | Sustainability categories analysis
The results were statistically analysed category by category, to understand how designers consider
sustainability aspects. To avoid the traditional approach to sustainability where typically the
mentioning order is environmental, social, and economic aspects, the questionnaire primarily asked
about social aspects followed by the economic and environmental ones. Supplemental data can be
found in Appendix 2.
The analysis of cultural related aspects showed that a major part of the participants assumes never to
use culture related aspects (42%), but it is followed by almost a quarter of the participants stating that
they always use them. Figure 3.5 shows a clear separation between those participants whom often
consider cultural aspects from those whom rarely consider them. None of the cultural indicators was
stated to be used “sometimes”. The results obtained are quite uniform among indicators.
The same occurs in “Accessibility” category. The results obtained in each indicator are quite similar
among them (Figure 3.6 (a)). Most of the participants, around 50%, assumed to “sometimes” and
“often” consider accessibility aspects. Only one-quarter of the participants affirms always to consider
accessibility aspects, and only 18% assume to do it in barrier-free accessibility. These are mainly
architects, as depicted in Figure 3.6.

E A R L Y S T A G E D E S I G N M E T H O D O L O G Y T O E N S U R E L I F E C Y C L E S U S T A I N A B I L I T Y O F R E S I D E N T I A L B U I L D I N G S
89
Figure 3.5. Cultural category results
(a) (b)
(c) (d)
Figure 3.6. Accessibility category results. (a) Summary all of results. Answers given by each profession to: (b) ‘Access to public transportation’; (c) ‘Access to amenities’ and; (d) ‘Barrier-free accessibility’.
Clearly, health and comfort aspects are those more often considered during design. In average, more
than 50% of the respondents “often” or “always” account for the four aspects during design
(Figure 3.7 (a)). Thermal comfort is the most considered indicator is this category. In fact, it is the
second most used indicator from all the 51 included in the survey; it is only exceeded by initial cost.
The answer “never”, in this category was mainly given by civil engineers and other professionals. Only
5% of architects gave this answer, but only in visual comfort (Figure 3.7 (e)). Visual comfort, contrarily
to the other indicators is clearly more valorised by architects. This may occur as other professionals
might mistakenly think their specialities cannot have influence in this aspect.
The respondents assumed to consider comfort aspects of the workers during design mainly only
sometimes, rarely, or even never (Figure 3.8). The aspect considered more often is the workers’ safety
and health, while local work is claimed to be always considered by only 8% of the respondents.
Architects were the ones acknowledging more the workers’ safety and health, with a difference bigger
than 15% of “always” from civil engineers and other professionals. The activity developed by the
34%
46%
46%
42%
22%
8%
14%
16%
12%
14%
18%
22%
30%
28%
22%
18%
0% 20% 40% 60% 80% 100%
Cl-1
Cl-2
Cl-3
Cl-4
1. Never
2. Rarely
3. Sometimes
4. Often
5. Always
22%
22%
18%
12%
14%
12%
26%
28%
26%
24%
26%
22%
14%
8%
18%
0% 20% 40% 60% 80% 100%
A-1
A-2
A-3
1. Never
2. Rarely
3. Sometimes
4. Often
5. Always 0%
20%
40%
60%
80%
100%
1 2 3 4 5Architects Civil Eng. Others
0%
20%
40%
60%
80%
100%
1 2 3 4 5Architects Civil Eng. Others
0%
20%
40%
60%
80%
100%
1 2 3 4 5Architects Civil Eng. Others

C H A P T E R 3 | L I F E C Y C L E P H A S E S O F B U I L D I N G S - E A R L Y D E S I G N
90
designers does not seem to have high impact in the answers given. Only architects and civil engineers
always account for workers’ training, but the former are almost the double of the later.
Most respondents showed worries with buildings aesthetics. Art within architecture is at least often
used by more than 60% of the respondents, and this worry is always felt by 50% of the architects.
(a)
(b) (c)
(d) (e)
Figure 3.7. Health and comfort category results. (a) Summary all of results. Answers given by each profession to: (b) ‘Thermal comfort’; (c) ‘Acoustic comfort’; (d) ‘Indoor air quality’ and; (e) ‘Visual comfort’.
Figure 3.8. Safety, security and health of workers and local population category results
8%
10%
10%
20%
8%
18%
6%
10%
16%
22%
24%
48%
38%
24%
26%
34%
28%
26%
20%
0% 20% 40% 60% 80% 100%
HC-1
HC-2
HC-3
HC-4
1. Never
2. Rarely
3. Sometimes
4. Often
5. Always
0%
20%
40%
60%
80%
100%
1 2 3 4 5
Architects Civil Eng. Others
0%
20%
40%
60%
80%
100%
1 2 3 4 5
Architects Civil Eng. Others
0%
20%
40%
60%
80%
100%
1 2 3 4 5Civil Eng. Architects Others
0%
20%
40%
60%
80%
100%
1 2 3 4 5Architects Civil Eng. Others
12%
24%
28%
28%
8%
24%
30%
18%
24%
22%
20%
30%
24%
12%
4%
10%
30%
16%
12%
8%
0% 20% 40% 60% 80% 100%
SH-1
SH-2
SH-3
SH-4
1. Never
2. Rarely
3. Sometimes
4. Often
5. Always

E A R L Y S T A G E D E S I G N M E T H O D O L O G Y T O E N S U R E L I F E C Y C L E S U S T A I N A B I L I T Y O F R E S I D E N T I A L B U I L D I N G S
91
In the functional category, results demonstrate that designers give a relative importance to space
efficiency while ‘design for ease deconstruction’ is often neglected (Figure 3.9). Sixty-eight percent of
the participants consider at least often space efficiency aspects, while 66% assume to account never or
rarely for deconstruction aspects. Flexibility and adaptability achieved similar results to space
efficiency, with more than 50% of ‘other professions’ assuming to use it just sometimes. Architects are
undoubtedly the ones that most consider space efficiency during design. Ease of cleaning and
maintenance and users’ control, got similar results, both in total and per profession, with around a
third of the respondents if these aspects are considered just sometimes.
As depicted from Table 3.8 and Figure 3.10 the results achieved in the project quality category are
quite homogeneous between indicators, in which half of the respondents assume to consider these
sometimes or often, while the other half is distributed among the other three possible responses – never,
rarely, and always. Civil engineers are the ones giving more importance to the quality of the project
preparation and the requirements specification. It is interesting to verify that integrated planning is
always used by just a few over a quarter of the participants.
Figure 3.9. Functionality category results
Figure 3.10. Project quality category results
Results show that life cycle costs category had both the most considered aspects and some of the lowest,
as illustrated in Figure 3.11. Initial cost is often and always considered by 78% of the participants,
representing the most considered indicator among all. Contrastingly, investment in new technologies,
resettlement and deconstruction costs are among the indicators less considered during building design.
Only around a quarter of the participants stated that they often or always account for these costs.
These results highlight that initial costs still have a major weight in decision-making rather than the
6%
6%
14%
12%
40%
6%
20%
18%
10%
26%
18%
28%
32%
38%
20%
30%
30%
20%
24%
6%
38%
16%
14%
10%
8%
0% 20% 40% 60% 80% 100%
F-1
F-2
F-3
F-4
F-5
1. Never
2. Rarely
3. Sometimes
4. Often
5. Always
14%
20%
16%
20%
12%
16%
18%
20%
26%
26%
28%
18%
24%
26%
20%
22%
24%
12%
14%
16%
0% 20% 40% 60% 80% 100%
PQ-1
PQ-2
PQ-3
PQ-4
1. Never
2. Rarely
3. Sometimes
4. Often
5. Always

C H A P T E R 3 | L I F E C Y C L E P H A S E S O F B U I L D I N G S - E A R L Y D E S I G N
92
adoption of a lifecycle approach. Even though the awareness about operation and maintenance costs
is increasing, other relevant costs occurring during the buildings’ life cycle are often mistreated. By
their answers, designers reveal not to have knowledge that by potentially investing in new materials or
technologies, operation and maintenance costs can reduce and thus decrease life cycle costs.
In what concerns project management, the results are quite similar among the different indicators
surveyed. Only ‘synergies with other actors’, is less considered when compared to the other three
indicators, as shown in Figure 3.12 and Table 3.8. The main responses to the other indicators are
focused in ‘sometimes’ and ‘often’. Looking to both, ‘synergies’ and ‘integrated project’ indicators, it
is clear that a long road is still there to travel towards full integrated design project.
(a)
(b) (c)
(d) (e)
Figure 3.11. Life cycle costs category results: (a) Summary all of results. Answers given by each profession to: (b) ‘Initial cost’; (c) ‘Operation and maintenance costs’; (d) ‘Deconstruction costs’; (e) ‘Resettlement costs’; (f) ‘Local society cost-benefit’ and; (g)
‘Investment in innovative materials and processes’
6%
14%
46%
36%
30%
12%
6%
20%
22%
26%
38%
34%
6%
30%
14%
22%
14%
38%
22%
20%
8%
6%
6%
6%
56%
14%
4%
6%
8%
6%
0% 20% 40% 60% 80% 100%
C-1
C-2
C-3
C-4
C-5
C-6
1. Never
2. Rarely
3. Sometimes
4. Often
5. Always
0%
20%
40%
60%
80%
100%
1 2 3 4 5Architects Civil Eng. Others
0%
20%
40%
60%
80%
100%
1 2 3 4 5Architects Civil Eng. Others
0%
20%
40%
60%
80%
100%
1 2 3 4 5Architects Civil Eng. Others
0%
20%
40%
60%
80%
100%
1 2 3 4 5Architects Civil Eng. Others

E A R L Y S T A G E D E S I G N M E T H O D O L O G Y T O E N S U R E L I F E C Y C L E S U S T A I N A B I L I T Y O F R E S I D E N T I A L B U I L D I N G S
93
(f) (g)
Figure 3.11. Life cycle costs category results: (a) Summary all of results. Answers given by each profession to: (b) ‘Initial cost’; (c) ‘Operation and maintenance costs’; (d) ‘Deconstruction costs’; (e) ‘Resettlement costs’; (f) ‘Local society cost-benefit’ and; (g)
‘Investment in innovative materials and processes’ (cont.)
Figure 3.12. Life cycle costs category results
Designers aim to build more energy efficient buildings but, none of the indicators addressed got more
than one-quarter of designers giving the ‘always’ answer (Figure 3.13). The two most considered
aspects are the building’s efficiency and the energy needs. Reducing CO2 emissions or considering low
carbon technologies are far from being a common concern during design. This fact is alarming as
according to the recent European Directives buildings will have to be nearly zero energy by January
2021 ("Directive 2010/31/EU," 2010). Eventually, designers should change their approach regarding
these aspects to fulfil the EPBD requirements.
Site sustainability aspects are rarely or just sometimes considered by most the participants. According
to a designer’s comment, the site choice is often made by the owner and thus, it does not depend on
the designers’ work. Civil engineers are the ones that most consider site choice. This might be due to
their role in the projects’ design. Even though they do not select the site, they do need to have its
characteristics in mind when dimensioning structures and infrastructures. Regarding noise control, the
answers given by the three groups of professionals were alike. Local ecology is more often rarely
considered. The 8% of respondents, who assure always to consider it, were architects and other
professionals.
The results of materials and resource use had great expectation. One of the most well-known
environmental aspects, LCA is still barely used by designers. More than 50% of the respondents
assume to “never” or “rarely” use LCA. The same occurred with the other materials and resources
use indicators apart from equipment efficiency, which is more usually accounted than the others. The
0%
20%
40%
60%
80%
100%
1 2 3 4 5Architects Civil Eng. Others
0%
20%
40%
60%
80%
100%
1 2 3 4 5Architects Civil Eng. Others
12%
10%
12%
10%
32%
16%
4%
12%
30%
26%
36%
32%
8%
32%
32%
20%
14%
14%
12%
14%
0% 20% 40% 60% 80% 100%
PM-1
PM-2
PM-3
PM-4
1. Never
2. Rarely
3. Sometimes
4. Often
5. Always
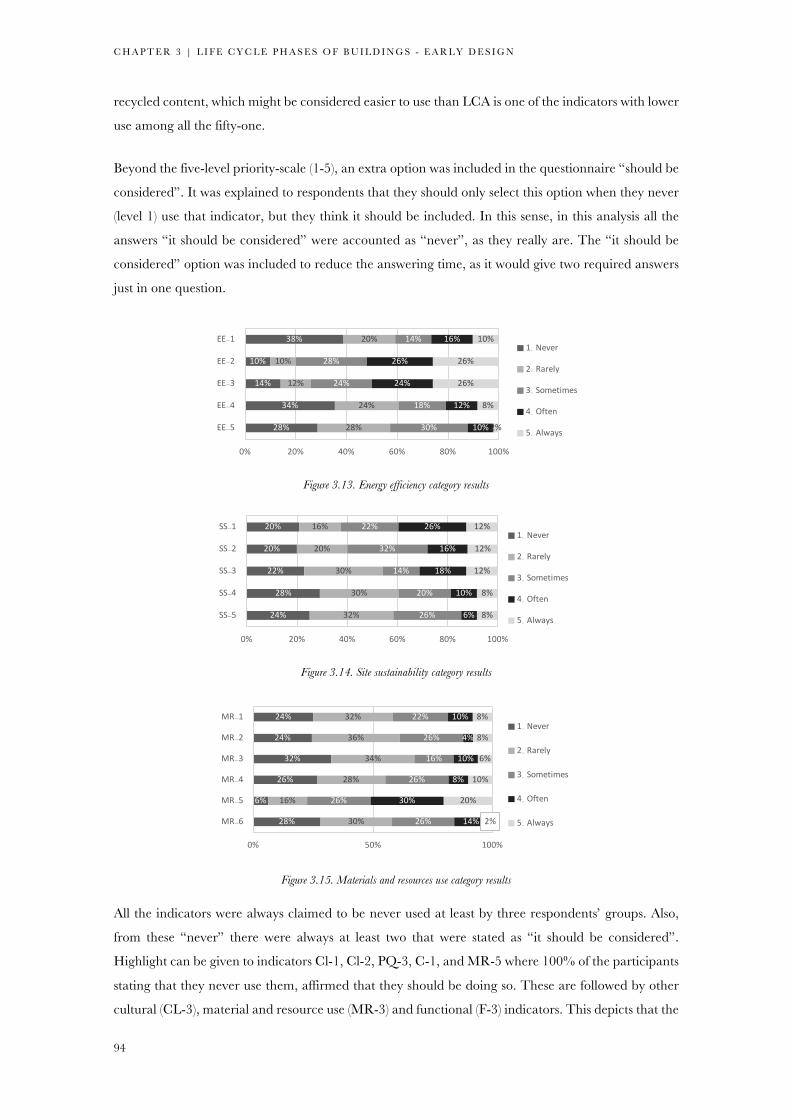
C H A P T E R 3 | L I F E C Y C L E P H A S E S O F B U I L D I N G S - E A R L Y D E S I G N
94
recycled content, which might be considered easier to use than LCA is one of the indicators with lower
use among all the fifty-one.
Beyond the five-level priority-scale (1-5), an extra option was included in the questionnaire “should be
considered”. It was explained to respondents that they should only select this option when they never
(level 1) use that indicator, but they think it should be included. In this sense, in this analysis all the
answers “it should be considered” were accounted as “never”, as they really are. The “it should be
considered” option was included to reduce the answering time, as it would give two required answers
just in one question.
Figure 3.13. Energy efficiency category results
Figure 3.14. Site sustainability category results
Figure 3.15. Materials and resources use category results
All the indicators were always claimed to be never used at least by three respondents’ groups. Also,
from these “never” there were always at least two that were stated as “it should be considered”.
Highlight can be given to indicators Cl-1, Cl-2, PQ-3, C-1, and MR-5 where 100% of the participants
stating that they never use them, affirmed that they should be doing so. These are followed by other
cultural (CL-3), material and resource use (MR-3) and functional (F-3) indicators. This depicts that the
38%
10%
14%
34%
28%
20%
10%
12%
24%
28%
14%
28%
24%
18%
30%
16%
26%
24%
12%
10%
10%
26%
26%
8%
2%
0% 20% 40% 60% 80% 100%
EE-1
EE-2
EE-3
EE-4
EE-5
1. Never
2. Rarely
3. Sometimes
4. Often
5. Always
20%
20%
22%
28%
24%
16%
20%
30%
30%
32%
22%
32%
14%
20%
26%
26%
16%
18%
10%
6%
12%
12%
12%
8%
8%
0% 20% 40% 60% 80% 100%
SS-1
SS-2
SS-3
SS-4
SS-5
1. Never
2. Rarely
3. Sometimes
4. Often
5. Always
24%
24%
32%
26%
6%
28%
32%
36%
34%
28%
16%
30%
22%
26%
16%
26%
26%
26%
10%
4%
10%
8%
30%
14%
8%
8%
6%
10%
20%
2%
0% 50% 100%
MR-1
MR-2
MR-3
MR-4
MR-5
MR-6
1. Never
2. Rarely
3. Sometimes
4. Often
5. Always

E A R L Y S T A G E D E S I G N M E T H O D O L O G Y T O E N S U R E L I F E C Y C L E S U S T A I N A B I L I T Y O F R E S I D E N T I A L B U I L D I N G S
95
initial cost (C-1) is a relevant aspect and that operation and maintenance cost should be considered in
these phases, even though this does not happen. However, some concern to change these actions has
been shown. The same goes for ‘equipment efficiency’, in which only 6.0% off all respondents assume
not to consider. The recycled content indicator MR-3 stands out as having one of the higher
percentages, with 32% of the participants considering that they never use it, even though they should.
This achievement is only followed by those respondents that consider it rarely.
If almost all the respondents that do not use, consider that they should, and if the highest answer
percentage is “rarely”, this shows that designers assume even though they almost do not use it, they
should be using it more, if not always.
Looking at all the answers given, the option “it should be considered” appears to have special relevance
in indicators Cl-2 and Cl-3, as approximately 50% of the respondents gave this answer. This shows
the raising awareness of the local construction context. Some participants stated that it is essential from
a perspective of being necessary to renovate and increase the history of the material and immaterial
local heritage. The lower impact of “it should be considered” was found in the indicators F-1 and F-2
which got only 4.0% of the total answers, but two-thirds of the “never” answers.
No frequency was found in the “other” parameters added by respondents. In fact, there were just a
few entries, and none of them appeared twice. Comments on options of other indicators were only
given in the Cultural category, such as contemporaneity, or the capacity for context integration. The
highest answer given to “others” was on SS-1 (10%), even though no suggestion has been given, which
is not significant. Despite that in other categories, participants (in low percentage) said that they rarely
use other option (some even said never), they did not specify which were. It was possible to observe
that this happened mainly in the same respondent’s answers, he/she answered almost in all that she/he
did not use or rarely used another indicator. Almost all the participants, around 94.7% in each
question, preferred not to answer to the options inquiry. With this in mind, it is possible to assure that
the authors’ selection of indicators was well executed and suitable to the project reality, as no flaws or
recurrences were detected on the identification of indicators that should have been included.
3.3.3 | Discussion of Portuguese reality
Several ideas and questions had come up from this analysis, which are worth of discussion. Firstly, it
is important to refer the number of designers that has already used a BSA tool, which is less than a
third of the respondents. Even with the raising of awareness, the legal requirements getting tighter,
and the extensive use and publicity of concepts as “green design”, “eco-design”, “sustainable
construction”, or “energy efficiency”, there are only a few designers that consciously apply and use
sustainability methods, and ways of verifying it. Truth to be told, if all these concepts were internalised
in the daily practice of AEC practitioners, as they should, there would be no need for BSA tools.
Somewhere in the evolution of AEC, concepts were lost. If looking at vernacular architecture, one can

C H A P T E R 3 | L I F E C Y C L E P H A S E S O F B U I L D I N G S - E A R L Y D E S I G N
96
see that, for instance, passive solar design concepts are there, while looking for some current buildings,
there are none. Thus, more practical work and dissemination of assessment methods need to be carried
out to improve the use and evaluation of the performance of sustainability aspects.
The Severity Index results enabled raking the indicators according to their level of use by the designers
and thus, identifying the ones most used. Having initial costs as the first indicator and deconstruction
and resettlement costs as the last ones reveals that traditional approach to project design is still
dominating. This result confirms the concept of LCC is not yet well disseminated, as stated by Goh
and Sun (2016). It shows the stakeholders reluctance in having a long term thinking and projecting
possible savings for whole the life cycle even if investing a little more. Nevertheless, the 46% of
designers who assumed never to use operation and maintenance costs, pointed that they should be
doing so. In this sense, much deep commitment is needed to pursue a consciously shift to LCC
approach. Kirkham (2005) described how considering LCC in decision making could improve design
and operation of buildings, being one primary step towards sustainable design. It is expected that
studies like Araújo, Almeida, Bragança, and Barbosa (2016) will bring a useful aid in doing so, as they
are trying to implement an LCC-benefit method to each sustainable measure to be implemented.
Having these tools available in the market is a promising way to improve LCC approach and hence
promote sustainable design.
The fact that thermal comfort is the designers’ second choice depicts that this awareness might by a
consequence of legal requirements regarding this aspect. EPBD ("Directive 2010/31/EU," 2010)
although being aimed to control energy efficiency, imposes several measures that directly affect
thermal comfort. Also, thermal comfort has become one of the most dealt with aspects of sustainability.
Thermal comfort and energy efficiency are often confused with each other and considered as the major
aspect of sustainability. Even with this frequently mistaken concept, it is a significant step to achieving
more comfortable and pleasant to live in buildings.
Following the achievements from other studies (Annunziata, 2016), the survey results showed a
deficiency in the application of environmental concerns during design. The absence of environmental
indicators in the top considered indicators by the designers, confirms this fact. Also, the analysis of the
“should be considered” aspects, depicted that aspects as “LCA”, “recycled content”, do not achieve
one hundred percent of the “never” answers, meaning that they are not seen as relevant to all
designers. The environmental aspect that is getting 100% of the “never” as “it should be considered”
is the efficiency of equipment. The awareness already raised is still not sufficient to foster the adoption
of environmental thinking into building sector. Social criteria, related to health and comfort and space
efficiency are among the principal concerns of designers, before environmental questions.
The findings demonstrated that synergies with other actors and integrated design are not yet
established as conventional practice, even though project’s quality is a criterion of concern. These
results highlight that if sustainable consciousness is encouraged through all stakeholders in the

E A R L Y S T A G E D E S I G N M E T H O D O L O G Y T O E N S U R E L I F E C Y C L E S U S T A I N A B I L I T Y O F R E S I D E N T I A L B U I L D I N G S
97
buildings’ supply chain, it will be easier and faster to implement the use of sustainable design criteria.
This effect can lead actors to impose sustainable measures to other actors, sequentially.
The results achieved do not allow directly to exclude any sustainability criteria from a possible list to
an early design sustainability tool, as the questionnaire was not aimed to survey the importance
designers give to each criterion but to access what they do account during design. It was possible to
verify that despite stating they do not account for sustainability aspects, designers, in fact, do it. Only
just a few of the criteria accounted was assumed to be never used, and when a major part of the
designers assumed to do so, they affirmed that they should be doing that. This confirms the need to
promote an efficient sustainable design approach, proofing the importance of developing a tool to aid
designers, at early design decision making, towards sustainability.
Overall, the study pointed the current practice of Portuguese single family designers during projecting.
The online survey gathered responses from 50 professionals involved in whole building design. No
significant correlation was found between designers’ characteristics (activity and years of experience)
and the use of sustainable criteria. The more relevant criteria got similar answers from all professionals.
The findings prove that although awareness is rising, accounting for sustainability criteria, mainly
materials and resources use, life cycle costs other than investment costs, still requires support and
improvement. Designers still prioritise financial investment criteria rather than environmental ones
during building design.
3.4 | CONCLUDING REMARKS
First, the project design phases were detailed. Screening the design life cycle aided in comprehending
which information is available and possible to be gather in early phases, considering the general view
of the building. This information supports the definition of the sustainability criteria to be considered
during project early stages. Briefly, the two phases in the scope of this research consist in:
• Conceptual phase: it begins when the client meets the design team and the objectives of the
project are defined. It represents a preliminary design phase of the building, in which the
overall system configuration is defined and schematic drawings and layouts will provide an
early project configuration, type of architecture, and formal and functional aspects. It lacks
specific data;
• Pre-design phase: it starts with the implementation of the working drawings; the general shape
of the building is developed through plans, sections, and elevations; the provisional
information addressed in the conceptual phase is confirmed or modified.
The survey study presented confirms the need to promote an effective sustainable design approach,
proofing the importance of developing a tool to aid designers, at early design decision making, towards

C H A P T E R 3 | L I F E C Y C L E P H A S E S O F B U I L D I N G S - E A R L Y D E S I G N
98
sustainability. To select possible criteria to include in an early design tool, there was the need to
complement this study with deeper analysis to the premises of each criterion. The deeper analysis
allowed to verify if only the designers’ commitment was necessary or if it would aid choosing design
solutions that would improve the buildings final performance. Detail on the identification and selection
of indicators is described in the following chapter.
The work carried out to complete this chapter conducted to the publication of the following published
journal paper:
• Early Stage Design Decisions: The Way to Achieve Sustainable Buildings at
Lower Costs. Bragança, L., Vieira, S. M., & Andrade, J. B. (2014). The Scientific World
Journal, 2014, 8. doi: http://dx.doi.org/10.1155/2014/365364

E A R L Y S T A G E D E S I G N M E T H O D O L O G Y T O E N S U R E L I F E C Y C L E S U S T A I N A B I L I T Y O F R E S I D E N T I A L B U I L D I N G S
99
REFERENCES OF CHAPTER 3
Abdul-Kadir, M. R., & Price, A. D. F. (1995). Conceptual phase of construction projects. International Journal of Project Management, 13(6), 387-393. doi: 10.1016/0263-7863(96)81776-5
Al-Gahtani, K., Alsulaihi, I., El-Hawary, M., & Marzouk, M. (2016). Investigating sustainability parameters of administrative buildings in Saudi Arabia. Technological Forecasting and Social Change, 105, 41-48. doi: http://dx.doi.org/10.1016/j.techfore.2016.01.016
Andrade, J., & Bragança, L. (2016). Sustainability assessment of dwellings – a comparison of methodologies. Civil Engineering and Environmental Systems, 33(2), 125-146. doi: http://dx.doi.org/10.1080/10286608.2016.1145676
Andrade, J. B., Bragança, L., & Camões, A. (2016). Steel sustainability assessment — Do BSA tools really assess steel properties? Journal of Constructional Steel Research, 120, 106-116. doi: http://dx.doi.org/10.1016/j.jcsr.2016.01.011
Annunziata, E., Testa, F., Iraldo, F., & Frey, M. (2016). Environmental responsibility in building design: an Italian regional study. Journal of Cleaner Production, 112, 639-648. doi: http://dx.doi.org/10.1016/j.jclepro.2015.07.137
Araújo, C., Almeida, M., Bragança, L., & Barbosa, J. A. (2016). Cost–benefit analysis method for building solutions. Applied Energy, 173, 124-133. doi: http://dx.doi.org/10.1016/j.apenergy.2016.04.005
Arayici, Y., Coates, P., Koskela, L., Kagioglou, M., Usher, C., & O'Reilly, K. (2011). Technology adoption in the BIM implementation for lean architectural practice. Automation in Construction, 20(2), 189-195. doi: http://dx.doi.org/10.1016/j.autcon.2010.09.016
Attia, S., Gratia, E., De Herde, A., & Hensen, J. L. M. (2012). Simulation-based decision support tool for early stages of zero-energy building design. Energy and Buildings, 49, 2-15. doi: http://dx.doi.org/10.1016/j.enbuild.2012.01.028
Baba, A. (2013). Architects Requirements of Decision Support Tools to deliver Low Impact Housing Design in the UK: Insights and Recommendations. Journal of Environment and Earth Science, 3(12), 11
Barlish, K., & Sullivan, K. (2012). How to measure the benefits of BIM — A case study approach. Automation in Construction, 24(0), 149-159. doi: http://dx.doi.org/10.1016/j.autcon.2012.02.008
Bazerman, M. H., & Moore, D. A. (2009). Judgment in Managerial Decision Making (7th ed.). USA: John Wiley & Sons, Inc.
Bogenstätter, U. (2000). Prediction and optimization of life-cycle costs in early design. Building Research & Information, 28(5-6), 376-386. doi: http://dx.doi.org/10.1080/096132100418528
Bragança, L., Vieira, S. M., & Andrade, J. B. (2014). Early Stage Design Decisions: The Way to Achieve Sustainable Buildings at Lower Costs. The Scientific World Journal, 2014, 8. doi: http://dx.doi.org/10.1155/2014/365364
Brophy, V., & Lewis, J. O. (2011). A green Vitruvius: Principles and practise of sustainable architectural design (2nd Edition ed.). United Kingdom: Earthscan.
Buildings Performance Institute Europe. (2011). Europe’s buildings under the microscope - A country-by-country review of the energy performance of buildings. Brussels,: BPIE.
Bunz, K. R., Henze, G. P., & Tiller, D. K. (2006). Survey of sustainable building design practices in North America, Europe, and Asia. Journal of Architectural Engineering, 12(1), 33-62. doi: http://dx.doi.org/10.1061/(ASCE)1076-0431(2006)12:1(33)
Buur, J., & Andreasen, M. M. (1989). Design models in mechatronic product development. Design Studies, 10(3), 155-162. doi: http://dx.doi.org/10.1016/0142-694X(89)90033-1
Cavieres, A., Gentry, R., & Al-Haddad, T. (2011). Knowledge-based parametric tools for concrete masonry walls: Conceptual design and preliminary structural analysis. Automation in Construction, 20(6), 716-728. doi: http://dx.doi.org/10.1016/j.autcon.2011.01.003
Chandramohan, A., Narayanan, S. L., Gaurav, A., & Krishna, N. (2012). Cost and time overrun analysis for green construction projects. International Journal of Green Economics, 6(2), 167-177. doi: doi:10.1504/IJGE.2012.050340
Cheung, F. K. T., Rihan, J., Tah, J., Duce, D., & Kurul, E. (2012). Early stage multi-level cost estimation for schematic BIM models. Automation in Construction, 27(0), 67-77. doi: http://dx.doi.org/10.1016/j.autcon.2012.05.008
Deru, M., & Torcellini, P. (2004). Improving Sustainability of Buildings Through a Performance-Based Design Approach. World Renewable Energy Congress VIII and Expo, Denver, USA.
Directive 2010/31/EU, of the European Parliament and of the Council of 19 May 2010 on the energy performance of buildings (recast), Official Journal of the European Union, (European Union 2010 18.6.2010).

C H A P T E R 3 | L I F E C Y C L E P H A S E S O F B U I L D I N G S - E A R L Y D E S I G N
100
Goh, B. H., & Sun, Y. (2016). The development of life-cycle costing for buildings. Building Research & Information, 44(3), 319-333. doi: http://dx.doi.org/10.1080/09613218.2014.993566
Han, G., & Srebric, J. (2015). Comparison of survey and numerical sensitivity analysis results to assess the role of life cycle analyses from building designers’ perspectives. Energy and Buildings, 108, 463-469. doi: http://dx.doi.org/10.1016/j.enbuild.2015.09.017
Hanna, A. S., & Skiffington, M. A. (2010). Effect of preconstruction planning effort on sheet metal project performance. Journal of Construction Engineering and Management, 136(2), 235-241
Haroglu, H., Glass, J., & Thorpe, T. (2009). A study of professional perspectives on structural frame selection. Construction Management and Economics, 27(12), 1209-1217
Hartog, J. P. d. (2003). Designing indoor climate, a thesis on the integration of indoor climate analysis in architectural design. (PhD thesis), Delft University, The Nederlands.
Heravi, G., Fathi, M., & Faeghi, S. (2015). Evaluation of sustainability indicators of industrial buildings focused on petrochemical projects. Journal of Cleaner Production, 109, 92-107. doi: http://dx.doi.org/10.1016/j.jclepro.2015.06.133
Hopfe, C., & Hensen, J. (2009). Experiences testing enhanced building performance simulation prototypes on potential user group. 11th IBPSA Building Simulation Conference,, Glasgow, Scotland.
Huovila, P. (1999). Managing the Life Cycle Requirements of Facilities CIB W078 WORKSHOP (pp. approx. 7 p.). Rotterdam (Netherlands): in-house publishing.
International Council for Research and Innovation in Building and Construction. (1982). Working with the performance approach in building. Rotterdam, The Netherlands.
Keeler, M., & Burke, B. (2009). Fundamentals of Integrated Design for Sustainable Building (1st ed. ed.). United Statesof America: Wiley.
Kerzner, H. R. (1984). Project Management: A Systems Approach to Planning, Scheduling, and Controlling (2nd ed.). United States of America: Van Nostrand Reinhold.
Kirkham, R. J. (2005). Re‐engineering the whole life cycle costing process. Construction Management and Economics, 23(1), 9-14. doi: http://dx.doi.org/10.1080/01446190410001678765
Kohler, N., & Moffatt, S. (2003). Life-cycle analysis of the built environment. UNEP Industry and Environment, 26, 17-21.
Kovacic, I., & Zoller, V. (2015). Building life cycle optimization tools for early design phases. Energy, 92, Part 3, 409-419. doi: http://dx.doi.org/10.1016/j.energy.2015.03.027
Larsson, N. (2004). Integrated design process. Ottawa: iiSBE. Larsson, N. (2009). The Integrated Design Process: History and Analysis. Canada. Macmillan, S., Steele, J., Austin, S., Kirby, P., & Robin, S. (2001). Development and verification of a
generic framework for conceptual design. Design Studies, 22(2), 169-191. doi: http://dx.doi.org/10.1016/s0142-694x(00)00025-9
Mansour, O. E., & Radford, S. K. (2016). Rethinking the environmental and experiential categories of sustainable building design: a conjoint analysis. Building and Environment, 98, 47-54. doi: http://dx.doi.org/10.1016/j.buildenv.2015.12.014
Markelj, J., Kitek Kuzman, M., Grošelj, P., & Zbašnik-Senegačnik, M. (2014). A Simplified Method for Evaluating Building Sustainability in the Early Design Phase for Architects. Sustainability, 6(12), 8775-8795. doi: http://dx.doi.org/10.3390/su6128775
National Institute of Building Sciences, (2012). Whole Building Design Guide. Retrieved from http://www.wbdg.org/wbdg_approach.php. [Accessed May 2016 2016].
New Zealand Ministry for the Environment. (2008). Integrated Whole Building Design Guidelines. Wellington, New Zealand: eCubed Building Workshop Ltd.
Nielsen, A. N., Jensen, R. L., Larsen, T. S., & Nissen, S. B. (2016). Early stage decision support for sustainable building renovation – A review. Building and Environment. doi: http://dx.doi.org/10.1016/j.buildenv.2016.04.009
Østergård, T., Jensen, R. L., & Maagaard, S. E. (2016). Building simulations supporting decision making in early design – A review. Renewable and Sustainable Energy Reviews, 61, 187-201. doi: http://dx.doi.org/10.1016/j.rser.2016.03.045
Oti, A. H., & Tizani, W. (2015). BIM extension for the sustainability appraisal of conceptual steel design. Advanced Engineering Informatics, 29(1), 28-46. doi: http://dx.doi.org/10.1016/j.aei.2014.09.001
Perfection Consortium. ( 2011). PERFECTION – Performance Indicators for Health, Comfort and safety of the Indoor Environment. In FP7 EU Project Grant number 212998 (Ed.).
Petersen, S., & Svendsen, S. (2010). Method and simulation program informed decisions in the early stages of building design. Energy and Buildings, 42(7), 1113-1119. doi: http://dx.doi.org/10.1016/j.enbuild.2010.02.002
Portaria de 7 de Feveiro de 1972, Suplemento ao Diário do Governo, n.º 35, 2.ª Série, de 11 de Fevereiro de 1972 (Portugal 1972).

E A R L Y S T A G E D E S I G N M E T H O D O L O G Y T O E N S U R E L I F E C Y C L E S U S T A I N A B I L I T Y O F R E S I D E N T I A L B U I L D I N G S
101
Robichaud, L. B., & Anantatmula, V. S. (2011). Greening Project Management Practices for Sustainable Construction. Journal of Management in Engineering, 27(1), 48-57. doi: 10.1061/(ASCE)ME.1943-5479.0000030
Royal Institute of British Architects. (2011). Green Overlay to the RIBA Outline Plan of Work. London, United Kingdom: RIBA.
Royal Institute of British Architects. (2013). RIBA Plan of Work 2013 Overview. London, United Kingdom: RIBA.
Russell-Smith, S. V., Lepech, M. D., Fruchter, R., & Littman, A. (2015). Impact of progressive sustainable target value assessment on building design decisions. Building and Environment, 85(0), 52-60. doi: http://dx.doi.org/10.1016/j.buildenv.2014.11.011
Son, H., & Kim, C. (2015). Early prediction of the performance of green building projects using pre-project planning variables: data mining approaches. Journal of Cleaner Production, 109, 144-151. doi: http://dx.doi.org/10.1016/j.jclepro.2014.08.071
Tian, Z. C., Chen, W. Q., Tang, P., Wang, J. G., & Shi, X. (2015). Building Energy Optimization Tools and Their Applicability in Architectural Conceptual Design Stage. Energy Procedia, 78, 2572-2577. doi: http://dx.doi.org/10.1016/j.egypro.2015.11.288
Trumpf, H. (2007). An approach for an Integrated Design Process focussed on Sustainable Buildings. Action C25: Sustainability of Constructions – Integrated Approach to Life-time Structural Engunneering, Lisbon, Portugal.
Wakita, O. A., Linde, R. M., & Bakhoum, N. R. (2011). The Professional Practice of Architectural Working Drawings (4th ed.). USA: John Wiley & Sons, Inc.,.
Walker, S. (2006). Sustainable by design: Explorations in Theory and Practice. London, UK: Earthscan. Weytjens, L. (2009). Analysis of the impact of sustainability related design parameters in the architectural design process. A
case study research. 3rd International Conference on Smart and Sustainable Built Environments (SASBE 2009), Delft, Netherlands.
Zeiler, W., Quanjel, E., Velden, J., & Wortel, W. (2010). Flexible design proces innovation: Integral building design method Proceedings: TG62 - Special Track 18th CIB World Building Congress, May 2010, Salford, UK (Vol. 353). Rotterdam (Netherlands): in-house publishing.


103
4 EARLY STAGE SUSTAINABILITY DECISION
SUPPORT MODEL FOR HOMES
4.1 | INTRODUCTION
As stated at the beginning of this thesis, buildings have various impacts on natural and social
environments. Through sustainable architecture, it is possible to encourage and promote a sustainable
way of life. As Sassi (2006) pointed out, there are two main aims for sustainable design that should be
followed for attaining a more sustainable world. Firstly, environmental impact caused by buildings
should be minimised throughout their life cycle; secondly, buildings should positively contribute to
people’s well-being by addressing and being adaptable to their needs.
This chapter introduces the approach and the structure of the early stage support tool for the
sustainable design of homes developed within this research work, attaining to achieve the
abovementioned objectives. The following chapters present the development of the tool.
The primary goal of this tool is to aid designers at early design stages, building more sustainable homes
by making them aware of how sustainability, across its three cornerstones – environment, society, and
economy – is deeply linked to all design criteria, constraints, and decisions. Additionally, the tool was
thought to increase awareness across all stakeholders, promoting and encouraging the adoption of
more efficient solutions. The tool shall allow designers to compare design alternatives and verify the

C H A P T E R 4 | E A R L Y S T A G E S U S T A I N A B I L I T Y D E C I S I O N S U P P O R T M O D E L F O R H O M E S
104
most sustainable choice. This can output two perspectives: i) quantification of each alternative
performance and, ii) aiding decision-making through comparison of those alternatives sustainable
behaviour at each indicator level.
As seen from the previous chapters, there is still no existing tool truly capable of being used at early
design stages to guide designers’ decisions when data is scarce. Existing BSA tools were developed to
account for the sustainable performance of buildings, based on a certain data detail level, which is
inexistent at early stages. Moreover, these phases are the ones comprising more possibilities to adopt
easily sustainability measures at lower costs and resources needs easily. Criteria to be analysed within
a sustainability assessment is not also standardised, although international agendas are trying to do so.
For this reason, it was necessary to select specific traits to be considered in the tool. The rationale for
this selection is also presented in this chapter.
Designing a sustainable home is not a straightforward process, nor there is a unique recipe for that.
Each design decision, as for example, designing the structure, establishing internal layout, or defining
technologies, has environmental, social, and economic impacts, and vice-versa, which quite often can
restrain the decisions to be made. Thus, the sustainable design requires an iterative approach, which
is enabled by the tool developed in this thesis.
This chapter introduces the framework for the tool developed within this research work, for early stage
design decision support for sustainable homes. It focuses the main goal and scope of the tool as well as
the selection process of the indicators to include in the tool.
The main findings were then used as the basis for the development of the indicators quantification
process, presented in Chapter 5.
4.2 | FRAMEWORK PROPOSAL FOR EARLY STAGE SUSTAINABILITY
DESIGN MODEL
4.2.1 | Aim and scope
The proposed approach aims at establishing a method to aid designers’ decision-making since early
stages, considering environmental, social, and economic criteria, attaining for a sustainable built
environment. The approach has two main viewpoints: i) quantification and ii) decision making. Both
share the same goal, to improve built environment sustainability, through new residential buildings,
and to empower designers with sustainability consciousness for further works.
The quantification viewpoint aims at measuring, as much as possible, the potential impacts of the
design alternatives throughout the buildings life cycle, to understand the weight that each decision has
on the whole building sustainability. This evaluation allows decisions to be made more consciously,

E A R L Y S T A G E D E S I G N M E T H O D O L O G Y T O E N S U R E L I F E C Y C L E S U S T A I N A B I L I T Y O F R E S I D E N T I A L B U I L D I N G S
105
enabling performance improvements, and foreseeing the building’s potential sustainability impact.
This occurs at the indicator level, quantifying the performance of each alternative.
The decision-making viewpoint provides valuable information for the decision-making process
throughout the building design, by comparing design alternatives. Especially at early stages, designers
encounter many cross-road doubt points, whether going one way, choosing one alternative, or
choosing a path over another represents crucial steps in building design and sustainability. This tool
will enable those alternatives’ performance to be compared, facilitating the decision. Thus, the tool
works as a decision-making support tool, guiding designers’ decisions towards more sustainable
buildings.
The approach established had the following premises:
• Be simple and easy to use. Although meant to be a guide to sustainable buildings, the tool
cannot be exhaustive in its guidance for several reasons. First, it could hamper its use;
designers could think that it would delay the design instead of helping to pursue a better
design. On the other hand, the data available at early stages is scarce and fuzzy. Finally, the
tool is not intended to evaluate the overall building sustainability nor award a sustainability
certificate, but to compare alternative solutions’ performances guiding decision making.
• Be in line with international standards for sustainable construction. Although simple to use,
the tool should follow the CEN and ISO standard’s guidelines for sustainable buildings.
• Embrace the three sustainability dimensions: environment, society, and economy, presenting
a comprehensive list of indicators, but not compromising its use by the list length.
• Be specific for single family buildings. It was decided in this way to ease its use and results
understanding. Also, accounting for the work volume needed for the development of the
indicators, having more than one could compromise the fruitful tool development.
Nevertheless, application to a small multi-family residential building is also possible as the
problems and conditions for these buildings are similar to single family houses.
• Allow the simultaneity of quantitative and qualitative criteria through performance, feature,
and procedure indicators.
• Be adapted to Portuguese context, without compromising its further adaptation of other
countries.
• Be possible to validate the tool. After development, the tool should be validated and tested
through a case study, by applying an external BSA tool to proof the efficiency of the tool here
proposed.
The following designation was given to the tool and will be used from now on whenever identification
is needed: Early Stage Model for Sustainable Design – EasyMode.

C H A P T E R 4 | E A R L Y S T A G E S U S T A I N A B I L I T Y D E C I S I O N S U P P O R T M O D E L F O R H O M E S
106
EasyMode approach adopted the basic concept of Performance Based Building (PBB), where: (i)
performance approach is thought and worked in terms of ends rather than means and, (ii) performance
concerns what a building or building product is expected to do and not with prescribing how it is to
be constructed (CIB, 1982). PBB has two key characteristics that justify the election of this approach
for the tool:
• Use of two languages, one is the clients’ requirements (demand) and, the capability to meet
the demand and perform as required (supply);
• Need for validation and verification of results against performance targets.
Conceptually, the dialogue between clients and suppliers can be seen as two halves of a whole, where
the functional or performance half should match the one representing the solution (Szigeti & Davis,
2005) (Figure 4.1). The functional concept comprises the goals to be satisfied, while the solution
concept is the technical materialisation satisfying those requirements. Developing those solutions is
goal of the design. EasyMode shall aid the decision-making to elect the solution concept that better
matches the functional needs and performance requirements. In this tool, the attained sustainability
requirements are the upper half, and the alternatives are to be compared are in the lower half.
EasyMode will provide the first steps towards validating that the design solutions chosen meet the
demanded requirements (Figure 4.2). In the later stages of design, BSA tools and other simulation
software shall be used to enrich and detail the project design.
Figure 4.1. ‘Hamburger’ model (retrieved from Szigeti and Davis (2005)
Figure 4.2. Filled ‘hamburger’ model - translation and validation (retrieved from Szigeti and Davis (2005))

E A R L Y S T A G E D E S I G N M E T H O D O L O G Y T O E N S U R E L I F E C Y C L E S U S T A I N A B I L I T Y O F R E S I D E N T I A L B U I L D I N G S
107
EasyMode will aid building more sustainable homes since early stage design, contributing to costs and
time saving further on the project. This tool is oriented for early design, it does not allow for detailed
assessment nor awards a sustainability certificate. This procedure can be done with any existing BSA
tool, if desired, whenever the data available is enough to do so or after construction.
EasyMode aims to make a thorough assessment of the sustainability-related performance of homes. It
will allow homes to attain for greater sustainability performance if various factors in relevant fields are
well balanced in its design than a building designed for a specific purpose. It does not reject efforts
made focusing a specific aspect, but it intends to raise the basic levels of efforts in all sustainability-
related aspects; specialisation can be a second step.
4.2.2 | Evaluation boundaries
EasyMode boundary system covers not just the building itself but also its external works, within the area
of the building’s site (curtilage) and its foundations, as recommended by EN 15643-2:2011 (Figure 4.3).
The equipment that is not directly related to the house, such as refrigerator or ovens, is excluded from
the assessment, whereas heating and cooling systems and hot water preparation systems are accounted.
In what regards the time boundary, EasyMode addresses all the building’s life cycle stages (Figure 4.4).
As the tool is aimed for single family buildings, the time boundary goes through raw materials
extraction to building’s demolition/dismantling. When there is no established Reference Service Life
(RSL), EasyMode considers a period of fifty years.
Figure 4.3. EasyMode boundary system

C H A P T E R 4 | E A R L Y S T A G E S U S T A I N A B I L I T Y D E C I S I O N S U P P O R T M O D E L F O R H O M E S
108
Figure 4.4. Life cycle phases and related impacts considered in EasyMode
4.2.3 | Structure
EasyMode delivers the guidance required to understand the sustainability implications in planning and
building homes. Sustainable building design requires a comprehensive and integrated approach basis
supporting a holistic perspective. Designers should understand the whole sustainability concept, be
able to deconstruct it in its parts and learn about their share to the whole. Once this knowledge is
acquired, they can use those parts to build new wholes.
The tool is structured in seven fundamental branches, which form the seven main categories of the
sustainability guidance (Figure 4.6):
• Project quality and management: Adopting of integrated building design; the whole must be
understood as well as its parts to pursue sustainability;
• Place: Adapting to local conditions; needs site study regarding natural environment, climate,
local community structure and human activities;
• Selection of materials: Preferring low impact materials, components, and technologies, and
having environmental goals to drive the planning process;
• Efficiency: Preserving resources such as water and energy, by designing buildings that
enable efficient use of resources and less waste generation;
• Health and comfort: Choosing design solutions that promote well-being and comfort, from
thermal comfort to indoor air quality;
• Functionality: Making design choices that improve building’s functionality, such as space
efficiency, maintenance, or adaptability to improve all sustainability goals;
• Life cycle costing: Balancing all life cycle costs allows more informed decisions than just
considering investment cost.

E A R L Y S T A G E D E S I G N M E T H O D O L O G Y T O E N S U R E L I F E C Y C L E S U S T A I N A B I L I T Y O F R E S I D E N T I A L B U I L D I N G S
109
These categories can broadly be grouped into five areas: (i) ‘Environmental’ comprising Selection of
materials and Efficiency; (ii) ‘Social and Functional’ consisting of Health and Comfort, and
Functionality; (iii) ‘Economical’ covering Life-cycle costing; (iv) ‘Location’ encompassing Place
category and; (v) ‘Technical’ accounting for Project quality and management. Each of the seven
categories is further divided into one or two topics. Each topic represents the sustainability indicators
to be evaluated. A total of nineteen indicators is allocated to these categories.
No final aggregated overall sustainability score is given by EasyMode, as the tool is not intended to
certify the building’s sustainability. Making a parallelism with LCA quantifications, mid-points were
preferred instead of end-points, aiming to avoid results subjectivity by giving weights to each indicator.
Nevertheless, several BSA tools in the market can be used to certify the building, if desired, and after
the early stage decisions have been made with the help of EasyMode. EasyMode is an aiding tool for
designers; its use is not intended for marketing labelling.
The first step in the planning process should be the definition of the goals, objectives, and criteria, as
the subsequent design stages rely on this information as well as on the defined strategy. Until now,
these goals could be established based both on stakeholders believes and criteria of existing BSA tools.
However, the BSA tools’ criteria cannot be used to pursue those goals, because they were originally
designed to evaluate finished buildings, instead of serving as design guidelines (Ding, 2008). EasyMode
is then intended to enable establishing and pursuing the goals early in the design. Thus, it is flexible
enough to accommodate designer’s needs. The tool does not impose a sequence order for the
assessment. Instead, designers can decide the criteria to assess and the order to do so. Moreover, the
indicators’ evaluation procedure might change from one indicator to the other. This flexibility allows
stakeholders to establish their goals and attain to accomplish them (Figure 4.5).
Figure 4.5. EasyMode workflow
Projectqualityandmanagement Place Selectionof
materials Efficiency Healthandcomfort Functionality Lifecycle
costing
Initialdefined alternative Other designalternative
Quantification
Comparison
Sustainabilityperformance
Objectivesandvisionstatement
Quantification
Sustainabilityperformance
Bestalternative foreachindicator

C H A P T E R 4 | E A R L Y S T A G E S U S T A I N A B I L I T Y D E C I S I O N S U P P O R T M O D E L F O R H O M E S
110
EasyMode indicators’ structure was developed in similarity with Alanne (2004) knapsack model
(Figure 4.6), with the objective of aiding designers to select the most suitable actions for the established
goals in the conceptual phase of a single family detached building project. The sustainability criteria
are structured in a decision-tree where: categories indicate general and strategic objectives, indicators
represent more detailed issues and, whenever needed, sub-indicators represent more accurate
measures. As aforesaid, indicators can be both quantitative and qualitative.
As said, the tool encompasses nineteen indicators. They aim at allowing for characterisation and
quantification of the sustainability criteria needed to assure the planning of a sustainable building,
through a simple yet accurate and useful way. According to ISO/TS 21929-2:2015 (ISO, 2015) in the
sustainable construction field, indicators are defined as “quantitative, qualitative or descriptive
measures representative of one or more impact categories or classes of economic, environmental or
social issues of concern, to which analysis (assessment) results may be assigned. An indicator is intended
to be relevant and representative of a wider, more complex issue, which it helps to illustrate. The use
of indicators reduces the complexity of an issue that is to be assessed, and also allows the assessment of
issues that in themselves are not measurable.” Each category gathers different indicators that are on
the same topic.
Table 4.1 depicts the list of indicators included in the tool. The rationale behind the indicators selection
is presented shortly in this Chapter 5.
Figure 4.6. Sustainability criteria tree (adapted from Alanne (2004))

E A R L Y S T A G E D E S I G N M E T H O D O L O G Y T O E N S U R E L I F E C Y C L E S U S T A I N A B I L I T Y O F R E S I D E N T I A L B U I L D I N G S
111
Table 4.1. Proposed structure for EasyMode
Area Category Indicator Sub-indicator
Environmental
C1. Selection of materials
I1. Life Cycle Environmental impact
I1.1 Global warming potential I1.2 Ozone depletion potential I1.3 Acidification potential I1.4 Eutrophication potential I1.5 Photochemical ozone creation potential I1.6 Abiotic resource depletion potential I1.7 Total primary energy
I2. Certified products and responsible sourcing I3. Recycle and reuse of materials and components I4. Heat island effect
C2. Efficiency I5. Energy efficiency
I5.1 Energy needs I5.2 Local production
I6. Water efficiency I7. Waste reduction
Social and Functional
C3. Health and comfort
I8. Thermal comfort
I8.1 Operative temperature I8.2 Vertical air temperature difference I8.3 Floor surface temperature range I8.4 Draught rate I8.5 Radiant temperature asymmetry
I9. Visual comfort
I10. Acoustic comfort
I10.1 Insulation index for exterior airborne noise I10.2 Sound insulation levels for internal walls and floors I10.3 Internal noise
I11. Indoor air quality I11.1 Airborne Emissions I11.2 Ventilation
C4. Functionality
I12. Space efficiency I12.1 Use of available area I12.2 Area availability per occupant
I13. Adaptability I13.1 Flexibility provision I13.2 Adaptability capacity potential
I14. Design for all
I15. Maintainability
I15.1 Cleaning I15.2 Maintenance plan and commissioning I15.3 Ease of maintenance
Location C5. Place I16. Efficient land use
I16.1 Reuse of previously built or contaminated land I16.2 Implantation efficiency I16.3 Soil permeability I16.4 Native fauna species
I17. Cultural value
Technical C6. Project quality and management I18. Passive design
I18.1 Building orientation I18.2 Design and shape I18.3 Solar design strategies
Economical C7. Life cycle costing I19. Life cycle cost I19.1 Investment cost I19.2 Operating costs I19.3 End-of-life costs

C H A P T E R 4 | E A R L Y S T A G E S U S T A I N A B I L I T Y D E C I S I O N S U P P O R T M O D E L F O R H O M E S
112
4.2.4 | Evaluation process
The tool is presented as a Microsoft Excel workbook. Each Category is on a separate worksheet, where
the indicators’ evaluation process is implemented and a cover page is also presented, where users are
requested for the primary input data, as presented in Figure 4.7.
Figure 4.7. EasyMode workbook
The evaluation framework process is organised in three main steps: (i) input, (ii) engine and, (iii) output
(Figure 4.8). Although this order obviously needs to be followed– it is not possible to have results if no
input is given – there is not a sequential order to calculate the indicators. Users can select the indicators
to be evaluated and evaluate them in whatever order. This justifies the step-back arrows at the bottom
of Figure 4.8 scheme.
The input stage, as depicted by the name, consists of gathering the general data regarding the building.
This stage represents the basis for the indicators evaluation. After inserting the data, designers can start
the evaluation. If specific data is needed for a certain indicator, it will be required in its evaluation.
The general input interface should ask for the following topics:
• Building typology (number of habitable rooms other than kitchen and living/dining room);
• Location/climatic zone;
• Building characteristics.
Each topic gathers different information as depicted in Table 4.2.

E A R L Y S T A G E D E S I G N M E T H O D O L O G Y T O E N S U R E L I F E C Y C L E S U S T A I N A B I L I T Y O F R E S I D E N T I A L B U I L D I N G S
113
Figure 4.8. Flowchart of EasyMode
Table 4.2. General input data needed in EasyMode
General information Details Building typology Building type Select from the list (T1, T2, T3...) Location County Select from a list Characteristics of the Building Size of the plot Total area of the site (m2) Maximum net land use index Maximum area or land percentage legally available for construction Total area of building Estimation of the total area of the building (m2) Number of floors Specific value, estimated Number of rooms Specific value, estimated Number of inhabitants Specific value, estimated Building orientation Specify the orientation of the main façade Budget available/investment cost Estimated cost (€) Materials Main construction solution Select from the list (database)
The engine represents the calculations stage, which is not visible to the users, but at the same time is
the most important part of the tool. The algorithm implemented in each indicator differs from
indicator to indicator. Chapter 5 presents the algorithms in detail. In most of the indicators, additional
alternatives can be added, or different scenarios can be analysed to compare performances and aid
decision-making. Depending on the indicators, designers can be able to identify previously the
performance level they are attaining to achieve, instead of inserting the data and having the
performance level at the end. In this way, the tool guides the users through design towards their goals.

C H A P T E R 4 | E A R L Y S T A G E S U S T A I N A B I L I T Y D E C I S I O N S U P P O R T M O D E L F O R H O M E S
114
The performance on each indicator is given through an indicative level scale from one to three, being
one the minimum performance and three the highest performance achievable (Table 4.3). A simple
scale was selected to ease understating, save time and to make the tool more user-friendly. Using this
simple scale to rank the results is possible for architects, and designers in general, to identify if the
solutions they are studying have a desired performance or not, and vice-versa, establish the sought
performance level and determine the measures needed to accomplish that goal. Nevertheless, it was
found that for some indicators, a performance scale was not necessary while for others, an additional
level was required. The reasons behind these adjustments vary. For instance, for indicators such as I1
‘Life cycle environmental impact’, I5.1 ‘Energy needs’ or I18.1 ‘Solar design strategies’ the results of
the alternative solutions are easily compared without recurring to levels, and the concept of ‘the less,
the better’ applies to the first two indicators and the one of ‘the more, the better’ applies to the third,
both without restrictions. For indicators, such as I18.1 ‘Building orientation’ or I14 ‘Design for all’ an
additional level was added due to the assessment constraints and to improve the acknowledgement of
the designer’s efforts. More detail on this necessity is given in the indicators calculation procedure
description.
Table 4.3. Performance levels established for each indicator
Performance levels Description Level 1 Fair Level 2 Good Level 3 Excellent
The concept of the so-called ‘factor four rule’ was mostly applied, to establish the indicative
performance levels. This means that ‘resource productivity can – and should – grow fourfold, while
the wealth extracted from one unit of natural resources can quadruple’ (von Weizsäcker, Lovins, &
Lovins, 1998). This represents quadrupling or more the resources productivity, meaning that,
ultimately with one-fourth of the resources (impacts) the same benefit is possible, leading to a more
sustainable solution. Thus, it was considered that sustainability levels can improve in sectors of 25% of
a conventional value, for a given indicator. More detail can be found in the calculation procedure
presentation (Chapter 5).
When alternatives are added, the tool then ranks their performance according to the three
performance levels. No weighting process is carried out; results are displayed individually, as mid-point
indicators.
Finally, the output stage presents the evaluation results. Results are presented in two ways: a graphical
representation aiding the results’ interpretation and a small written summary description provides
detail on the achievements.

E A R L Y S T A G E D E S I G N M E T H O D O L O G Y T O E N S U R E L I F E C Y C L E S U S T A I N A B I L I T Y O F R E S I D E N T I A L B U I L D I N G S
115
4.3 | SELECTION OF INDICATORS
As said, EasyMode relies on indicators to perform its sustainability evaluation. The selection process
based on the actual state of the art, regarding existing BSA tools, international standards and, inquiries
to designers. Detail on the BSA tools and international standards approaches, and indicators was given
in Chapter 2. The following five principles were considered in the selection process:
• Indicators should be internationally recognised for building sustainability assessment (ISO
and CEN);
• The whole building life cycle (raw materials extraction, construction, use, maintenance and,
disposal) should be accounted;
• Indicators’ frequency in existing BSA tools;
• Consideration of regional characteristics and relevance for designers;
• Cover all sustainability dimensions.
The literature on sustainability reveals two broad approaches (Bell & Morse, 2010; Oltean-Dumbrava,
Watts, & Miah, 2014): top-down and bottom-up. The first is expert-led, scientifically-based, and
commonly used in environmental or economic fields, acknowledging the need for quantitative
indicators. On the other hand, the bottom-up approach is based on a community-driven participatory
method, emphasising the relevance of the social and cultural context (Reed, Fraser, & Dougill, 2006).
Both approaches have strengths and weaknesses. Indicators arising from top-down methods are
rigorous, and mathematically obtained, but often fail in engaging local communities. Indicators from
bottom-up are perceived from local contexts. Typically, the first tends to be more accurate, while the
second is more easily understood. In this study, a hybrid methodology is proposed to gather the
knowledge from both sides, strengthening EasyMode acceptability. The relevance and benefits of
adopting both trends are recognised by different authors (Bell & Morse, 2010; Fraser, Dougill, Mabee,
Reed, & McAlpine, 2006). Reed et al. (2006) suggested that including both is vital to provide a better
understanding of economic, social, and environmental system interactions required to provide more
informed inputs to local sustainable development initiatives.
The first step was to find correspondence between both, ISO 21929-1:2011 main sustainability
indicators and the ones from CEN 15643 series. Table 4.4 shows that the aspects considered by both
are quite similar, although the names given to each category varies. With this analysis, it was possible
to answer the first requisite for the indicators’ selection: “to establish internationally recognised criteria
as core indicators”. The fifth requisite was to cover all sustainability dimensions. Table 4.4 proves that
accounting for all the criteria presented there, the three dimensions covering is assured.

C H A P T E R 4 | E A R L Y S T A G E S U S T A I N A B I L I T Y D E C I S I O N S U P P O R T M O D E L F O R H O M E S
116
Table 4.4. Similarity between ISO and CEN sustainability impact categories and proposed categories for the presented tool
ISO 21929-1 CEN 15643 series • Harmful emissions • Life cycle environmental impacts • Sourcing of materials • Fresh water
• Resource use • Non-renewable resources • Land • Loads on the neighbourhood • Aesthetic quality • Waste • Other environmental information • Indoor environment • Health and comfort • Adaptability • Adaptability • Maintainability • Maintenance • Serviceability • Safety • Safety and security • Accessibility
• Accessibility • Access to services • Costs • Life cycle costs • Stakeholder involvement
Legend: • Environmental • Social
• Economic • Other
The second step was to understand the frequency of the core criteria in existing BSA tools. The tools
considered were the ones discussed and presented in Chapter 22. To ease understanding, it was decided
to use the general denomination, for the impact categories, used in Chapter 2 findings. Table 4.5
summarises this analysis and depicts both, the potential impacts of each category and the number of
methodologies in which a category is accounted.
Table 4.5 and Table 4.4 support that by accounting for all these categories, the requirement for
assuring that the indicators cover all sustainability dimensions is fulfilled. Table 4.5 shows a higher
incidence on environmental concerns than social and economic ones. This result is expectable since
all sustainability concerns started from having consciousness of the environmental degradation. The
need to raise this concept was exactly due to that; if no harm were being done to the environment, the
need to balance people’s life quality and economic growth, with environment protection would be a
no-needed question. Therefore, even accounting for social and economic concerns, for the obvious
reasons, it only makes sense if all the accounted aspects at bottom-line affect the environment.
Matching the findings from Table 4.4 and Table 4.5, it outcomes that all the impact categories
presented should be accounted, because all account for the core indicators proposed by CEN and ISO,
and involve all sustainability dimensions. Table 2.11 in Chapter 2 depicts the main criteria considered
within the described categories, in each BSA tool. The analysis of this list, and all the work presented
in Chapter 2 represented the first steps towards identifying the criteria to be included in EasyMode.
2 SBToolPT-H, LEED for homes v4, Code for Sustainable Homes, DGNB for homes and CASBEE for detached houses

E A R L Y S T A G E D E S I G N M E T H O D O L O G Y T O E N S U R E L I F E C Y C L E S U S T A I N A B I L I T Y O F R E S I D E N T I A L B U I L D I N G S
117
Table 4.5. Potential impacts proposed by ISO 21929:2010 versus the main sustainability categories addressed by the main BSA tools
It was important to bear in mind that the indicators should also: (i) account for all life cycle stages, (ii)
be relevant to the regional characteristics and, (iii) be relevant to designers. Table 4.5 shows that BSA
tools account mainly for environmental and comfort aspects (Figure 4.9). From these, most regard the
effects of the selected materials upon the environment and well-being of inhabitants. As said, a
sustainable building is more than the sum of its parts’ sustainability; it is not just an assembly made of
sustainable materials but rather one in which the selected materials are optimised in the design process
for greater sustainability (Weisenberger, 2011). Sustainable materials alone do not assure the building’s
sustainability or efficiency, although it can be boosted with their selection (Aretoulis, Kalfakakou, &
Striagka, 2010). Therefore, the project team actions and their approaches during design should also
be considered during sustainability assessments and endorsements. In this sense, it was decided to
include in EasyMode, indicators that could advise the project team to design sustainable buildings
through design, such as passive design, hiring a sustainability advisor, or integrated design, before
selecting low-impact materials. These approaches and design principles will effectively assure savings
in energy needs, improve inhabitants’ pleasantness and comfort, and aid team members during
sustainability-related decisions (Chen, Yang, & Zhang, 2015; Keeler & Vaidya, 2016). Therefore, to
form ‘Project quality and Management’ category in EasyMode, it was decided to include a
recommendation for considering sustainability advisor and the following indicators:
• Passive design:
o Building orientation and implementation;
o Design and shape;
o Solar design strategies.
Environmental Economic Social
Change and/or
deterioration
Use/ depletion of
resources
Economic Value Productivity Health Satisfaction Equity Cultural
Value
Life cycle environmental impacts � �
Energy performance �
Water efficiency � Waste � Materials & resources � � Site sustainability � � Transport � � Health and comfort � � �
Service quality � ¤ ¤ � ¤ ¤ Cultural and aesthetics ¢ ¢
Project management � � � � � � �
Economics �
Legend: � More than 4 BSA tools account for at least 50% of the indicators1 in this category; �More than 4 BSA tools account the category but only a few accounts for at least 50% of the indicators1 in this category; ¤ At least 3 BSA tools account more than 50% of the indicators1 in this category � At least 3 BSA tools account the category but only a few accounts for more than 50% of the indicators1 in this category ¢ 2 BSA tools or less account for this category
1 According to the listed indicators in Error! Reference source not found.. Main issues considered in the BSAT and their evaluation method (Chapter 2)

C H A P T E R 4 | E A R L Y S T A G E S U S T A I N A B I L I T Y D E C I S I O N S U P P O R T M O D E L F O R H O M E S
118
Figure 4.9. Differences between Green Design aspects, common sustainability assessment aspects and Sustainable building
Following the same reasoning, aspects related to buildings’ functionality, should be accounted in
sustainability assessment methods. Both ISO and CEN recommend it, and there are tools already
doing so. However, this is not the common practice among those. The tools addressing more criteria
related to serviceability and functionality are EcoProP, CASBEE, and DGNB (Table 2.11). Also, as
seen in the previous chapters, initial design criteria shall account for functional aspects.
One may say countless functional aspects could be dealt with, and that they are not directly related to
sustainability concerns and legal requirements are accounting for specific functional and serviceable
criteria. CEN 15643-1:2000 (CEN, 2010) defends that technical and functional performances are
deeply related to environmental, social and economic performances and that their interrelationship is
a prerequisite for BSA. Thus, it should be considered in the concept of sustainability assessment. The
functional aspects that were found in both, international standards and BSA tools are the following:
• Flexibility and adaptability;
• Disabled people access;
• Safety and security;
• Earthquake resistance;
• Maintenance management;
• Spatial efficiency;
• User controllability;
• Fire prevention;
• Ease of disassembly, reuse or recycling;
• Durability.

E A R L Y S T A G E D E S I G N M E T H O D O L O G Y T O E N S U R E L I F E C Y C L E S U S T A I N A B I L I T Y O F R E S I D E N T I A L B U I L D I N G S
119
Table 4.6 presents the impact of these criteria on the three sustainability dimensions, considering
surpassing legal requirements whenever existent and accounting for those during early design.
Table 4.6. Impact of functionality aspects in sustainability concerns (Hauke, Kuhnhenne, Lawson, Veljkovic, & Siebers, 2016)
Indicators Environment Economy Society Flexibility and adaptability x x x Disabled people access x Safety and security x Earthquake resistance x Maintenance management x x x Spatial efficiency x x x User controllability x x Fire prevention x Ease of disassembly, re-use or recycling x x x
Durability x x x
The national legislation cover aspects like earthquake and fire resistance or disabled people access.
Thus, their consideration during early design stages is already mandatory. Also, the improvement on
their performance has little impact on the environment. In this sense, for the time being, it was decided
to leave them out of EasyMode. This does not invalidate their inclusion in future versions of the tool.
On the other hand, flexibility and adaptability, spatial efficiency, ease of disassembly, reuse, recycling,
and durability have a greater environmental impact (Gosling, Sassi, Naim, & Lark, 2013) and are not
legally covered. Also, flexibility, adaptability, and space efficiency when dealt with at early design can
extend the building’s service life while promoting occupiers’ life quality and comfort (more rationale
in Chapter5). Moreover, according to the questionnaire results (Chapter 3), these functionality aspects
are quite relevant for designers. Ease of disassembly, reuse or recycling aid extending the building
service life and prolonging its materials lifecycle, reducing their environmental burden. Also, allowing
reuse or recycling of building parts when they are no longer needed, generates economic value, that
otherwise could not exist if all building materials were landfilled. Maintenance management has a
great impact in the buildings’ operation phase environmental impact (more rationale in Chapter5).
Although no great relevance was given to this criterion in the designers’ questionnaire, based on the
state of the art, it was decided to account for maintenance aspects in EasyMode.
It was decided not to include safety and security, and the user controllability indicators, as their
specificity to not have great influence in the building design and so not being deemed required at early
design stages.
Social criteria comprise the highest subjectivity within the three sustainability dimensions.
Nevertheless, these need to be considered when dealing with sustainability. It would make no sense,
not to include comfort issues, when the primary aim of a building, specially a residential building, is to
promote comfort and shelter. All the BSA tools and the international standards account for (i) thermal

C H A P T E R 4 | E A R L Y S T A G E S U S T A I N A B I L I T Y D E C I S I O N S U P P O R T M O D E L F O R H O M E S
120
comfort, (ii) acoustic comfort; (iii) visual comfort or; (iv) indoor air quality. Typically, these require
more accurate data for the assessment than the one usually available at early stages. However, an effort
was made to include these criteria in EasyMode. Also, these were among the most considered criteria
by project teams, according to the questionnaire made (see Chapter 3).
Undoubtedly, aspects related to materials’ environmental impact are mandatory in a sustainability
guidance. International standards recommended it, and BSA tools consider them. Resources use as
energy, water or waste production are also under consideration in both standards and BSA tools.
Indicators as resources use, waste, and other environmental outputs are difficult to include in early
design, especially because specific materials are not yet decided, being impossible to have that data
available. Even if knowing the materials in advance, an EPD would be required to have such data.
As seen in both BSA tools and standards’ recommendations, site sustainability issues should also be
accounted. However, aspects like access to public transports or amenities near the building site do not
depend on home designer’s decisions and work. In this sense, these were left out of EasyMode, although
their contribution to sustainability is unquestionable.
The questionnaire allowed identifying sustainability criteria that although never considered in project
designs, designers assumed they should be considering it. The aspects related to culture lead this
willingness; followed by materials recycled content, ease of deconstruction and deconstruction costs.
After this first exclusion and mandatory inclusions a first version of the indicators list was created,
based on the questionnaires, BSA tools and international standards. This list was considered to
extensive to its target – early stages and some of the indicators would be considered: (i) too difficult to
address at these stages, due to their specificities or (ii) not requiring an assessment but rather only a
recommendation to account for specific details. The first were thus excluded from the tool, at least for
its first version and the second were included in a preliminary list of principles/recommendations to
be given to designers willing to use EasyMode, as basis to start a sustainable project.
Table 4.7 depicts the differences among the first version of the list and the final one. It is important to
mention that indicators’ terminology adopted in EasyMode, as presented in Table 4.1, are not all
coincident with the ones shown in Table 4.7 although the scope of them is considered.
Even with a reduced list of indicators, Table 4.8 depicts that EasyMode is in line with CEN
recommendations and with BSA tools for homes. The main differences between CEN
recommendations and EasyMode are related to: (i) economic aspects, (ii) those deliberately left out of
the assessment due to their unsuitability to early stages and (iii) issues not so relevant in the assessment
of homes’ sustainability. This latter, are for instance related to hazardous operational waste, that is
much more relevant for industrial or healthcare buildings.

E A R L Y S T A G E D E S I G N M E T H O D O L O G Y T O E N S U R E L I F E C Y C L E S U S T A I N A B I L I T Y O F R E S I D E N T I A L B U I L D I N G S
121
Table 4.7. First version of the list of indicators to use EasyMode. Blue indicators are those excluded from the final list but included in the initial recommendations; yellow indictors are the ones excluded due to their level of detail and lack of relevance in early design
Life Cycle Environmental impacts Service Quality Global warming potential Flexibility/adaptability Eutrophication potential Disable person’s access Acidification potential Safety and security
Stratospheric ozone depletion potential Maintenance management
Photochemical ozone creation Spatial efficiency Depletion of abiotic resources-elements Ease of disassembly, re-use or recycling
Depletion of abiotic resources-fossil fuel Cultural & Aesthetics
Water extraction Aesthetic quality Primary energy Integration of cultural heritage
Energy Performance Integration of built heritage Renewable energy Respect for the genius loci Energy demand Innovation
Energy monitoring Project quality and Management Low energy white goods Quality of the project Low CO2 emission Construction phase
Water Efficiency Integrated planning
Re-use/recycling Synergies with other actors Water consumption Products’ warranty Water monitoring Project duration
Waste Project complexity Construction waste management Construction site impacts Operational waste management Passive design
Materials and Resources Sustainability advisor
Materials reuse/recycling Safety, security and health of workers and local population
Recycled content Workers’ safety and health Renewable sources Workers’ training Responsible sourcing Community impact Equipment efficiency Local work Site Sustainability Economic aspects Land use Value Stability Heat island effect Initial cost Noise control Operation and maintenance cost Development of community Deconstruction cost Rainwater retaining Resettlement cost Local ecology/ biodiversity Local community cost-benefit
Health and comfort Investment in new materials and technologies Thermal comfort Visual comfort Acoustics Indoor air quality Ventilation Water quality

C H A P T E R 4 | E A R L Y S T A G E S U S T A I N A B I L I T Y D E C I S I O N S U P P O R T M O D E L F O R H O M E S
122
Table 4.8. Comparison of main issues considered in each BSA tools and in the proposed EasyMode method, using the denomination proposed by CEN
Categories and issues Assessment methods
CSH LEED v4 SBToolPT DGNB EcoProP CASBEE EasyMode
Environmental performance
Environmental impacts Global warming potential x x x x x x Depletion potential of the stratospheric ozone layer x x x x x
Acidification potential of land and water x x x x x
Eutrophication potential, x x x x Formation potential of tropospheric ozone photochemical oxidants
x x x x x
Abiotic Resource Depletion Potential x x x x
Resource use Renewable primary energy excluding energy resources used as raw material
x x x x x
Use of renewable primary energy resources used as raw material
Use of non- renewable primary energy excluding primary energy resources used as raw material
x x x x x
Use of non- renewable primary energy used as raw material
Use of secondary material x x x x Use of renewable secondary fuels
Use of non- renewable secondary fuels
Use of net fresh water x x x x x x x
Waste Non-hazardous waste to disposal x x x x x x
Hazardous waste to disposal Radioactive waste
Other outputs Components for re-use x x x x x x
Materials for recycling x Materials for energy recovery (not being waste incineration)
Exported energy
Social Performance
Accessibility For people with specific needs x x x x
To building services x
Adaptability To accommodate individual user requirements x x x x x
To accommodate the change of user requirements x x x x x
To accommodate technical changes x x x x x
To accommodate the change of use x x x x x

E A R L Y S T A G E D E S I G N M E T H O D O L O G Y T O E N S U R E L I F E C Y C L E S U S T A I N A B I L I T Y O F R E S I D E N T I A L B U I L D I N G S
123
Table 4.8. Comparison of main issues considered in each BSA tools and in the proposed EasyMode method, using the denomination proposed by CEN (cont.)
Categories and issues Assessment methods
CSH LEED v4 SBToolPT DGNB EcoProP CASBEE EasyMode
Health and comfort Thermal characteristics x x x x x x x Characteristics of indoor air quality x x x x x x
Acoustic characteristics x x x x x x Characteristics of visual comfort x x x x x x
Spatial characteristics x x x
Loadings on neighbourhood Noise x Emissions Glare/ Overshadowing x
Shocks/vibrations
Maintenance Maintenance Operations x x x x
Safety and security Resistance to climate change x x x Accidental actions Personal safety and security against intruders and vandalism
x x x
Security against interruptions of utility supply x x
Economic performance Economic aspects before use stage x x Costs directly related to the purchase or rental of the site x
Cost of products supplied at factory gate ready for construction
x
Costs incurred between factory and site x
Professional fees x Temporary and enabling work x
Initial adaptation or fit out of asset x
Landscaping, external works on the curtilage x
Taxes and other costs related to permission to build x
Subsidies and incentives x Economic aspects and impacts excluding the building in operation at the Use Stage
x
Building-related insurance costs x
Leases and rentals payable to third parties
Cyclical regulatory costs Taxes Subsidies and incentives Revenue from sale of asset or elements, but not part of a final disposal
Third party income during operation
Repairs and replacement of minor components/small areas

C H A P T E R 4 | E A R L Y S T A G E S U S T A I N A B I L I T Y D E C I S I O N S U P P O R T M O D E L F O R H O M E S
124
Table 4.8. Comparison of main issues considered in each BSA tools and in the proposed EasyMode method, using the denomination proposed by CEN (cont.)
Categories and issues Assessment methods
CSH LEED v4 SBToolPT DGNB EcoProP CASBEE EasyMode
Replacement or refurbishment of major systems and components
x
Adaptation or subsequent fit out of asset – fitting out or modification of existing buildings
Cleaning x Grounds maintenance x Redecoration Disposal Inspections at end of lease period (excluding end of life final disposal)
End of lease Planned adaptation or planned refurbishment of asset in use
Building-related facility management costs
Economic aspects and impacts of the building operational use
Operational energy costs x x Operational water costs x x Taxes x x Subsidies and incentives x Economic aspects and impacts at the End of Life x x
Deconstruction/ dismantling, demolition x
All transport costs associated with the process of deconstruction and disposal of the built asset
Fees & taxes Costs and/or revenues from reuse, recycling, and energy recovery at end of life
Revenue from sale land
4.4 | CONCLUDING REMARKS
This chapter presented a novel sustainable design methodology for supporting early design stages
decision-making in single family buildings. Previous chapters showed the relevance of acting at early
stages towards sustainable design, and how sustainability is dealt with by designers and BSA tools.
Those chapters allowed the identification of a gap between both worlds: Sustainability assessment and
design. The work presented in this chapter is the first set regarding the minimisation of this gap,
through the presentation of EasyMode.
EasyMode is aimed at guiding designers throughout the implementation of sustainability goals and
established targets during early design. The tool allows quantification of sustainability concerns and
enables alternatives comparison aiding, in this way, the decision-making process. The Easymode
framework is in line with CEN TC350 standards for sustainability assessment, showing its adequacy

E A R L Y S T A G E D E S I G N M E T H O D O L O G Y T O E N S U R E L I F E C Y C L E S U S T A I N A B I L I T Y O F R E S I D E N T I A L B U I L D I N G S
125
and actuality for real-world use. It is intended to be simple and practical to be used by designers,
attaining to give them the basis for (start) designing sustainable homes since early stages. The approach
adopted follows the principles of Performance Based Building by the adoption of two languages: the
clients’ needs and the capability to meet that performance, and the necessity of validation and
verification against targets using specific tools.
The tool focuses single family buildings, comprising all the building life cycle stages through seven
categories: project quality and management, place, selection of materials, efficiency, health and
comfort, functionality, and life-cycle costing, that together account for nineteen sustainability
indicators. First, objectives, targets and aims should be established together with the client and only
then, the tool can be used to guide designers targeting on suppressing those thresholds.
To identify the indicators to include in EasyMode it was necessary to analyse the existing sustainability
assessment standards and tools as well as the project teams’ actions. The level of detail of the indicators
was also analysed as at early design not all aspects are relevant or possible of being addressed. This
analysis led to the nineteen indicators presented in this chapter.
After having the tool’s structure and framework, the procedure to account for the indicators can be
carried out. This work is presented in the following chapter of this thesis.

C H A P T E R 4 | E A R L Y S T A G E S U S T A I N A B I L I T Y D E C I S I O N S U P P O R T M O D E L F O R H O M E S
126
REFERENCES OF CHAPTER 4
Alanne, K. (2004). Selection of renovation actions using multi-criteria “knapsack” model. Automation in Construction, 13(3), 377-391. doi: http://dx.doi.org/10.1016/j.autcon.2003.12.004
Bell, S., & Morse, S. (2010). Breaking through the Glass Ceiling: Who really cares about sustainability indicators? Local Environment, 6(3), 291-309. doi: http://dx.doi.org/10.1080/13549830120073284
Chen, X., Yang, H., & Zhang, W. (2015). A comprehensive sensitivity study of major passive design parameters for the public rental housing development in Hong Kong. Energy, 93, Part 2, 1804-1818. doi: http://dx.doi.org/10.1016/j.energy.2015.10.061
Ding, G. K. C. (2008). Sustainable construction -The role of environmental assessment tools. Journal of Environmental Management, 86(3), 451-464. doi: http://dx.doi.org/10.1016/j.jenvman.2006.12.025
European Committee for Standardization, CEN. (2010). EN 15643-1:2010 - Sustainability of construction works - Sustainability assessment of buildings - Part 1: General framework. Brussels: CEN.
Fraser, E. D. G., Dougill, A. J., Mabee, W. E., Reed, M., & McAlpine, P. (2006). Bottom up and top down: Analysis of participatory processes for sustainability indicator identification as a pathway to community empowerment and sustainable environmental management. Journal of Environmental Management, 78(2), 114-127. doi: http://dx.doi.org/10.1016/j.jenvman.2005.04.009
Gosling, J., Sassi, P., Naim, M., & Lark, R. (2013). Adaptable buildings: A systems approach. Sustainable Cities and Society, 7(0), 44-51. doi: http://dx.doi.org/10.1016/j.scs.2012.11.002
Hauke, B., Kuhnhenne, M., Lawson, M., Veljkovic, M., & Siebers, R. (2016). What does ‘sustainable construction’ mean? An overview. In B. Hauke, M. Kuhnhenne, M. Lawson, M. Veljkovic & R. Siebers (Eds.), Sustainable Steel Buildings: A Practical Guide for Structures and Envelopes (pp. 1-12). Germany: John Wiley & Sons, Ltd.
International Council for Research and Innovation in Building and Construction. (1982). Working with the performance approach in building. Rotterdam, The Netherlands.
International Organization for Standardization, ISO. (2011). ISO 21929-1:2011 - Sustainability in building construction - Sustainability indicators - Part 1: Framework for the development of indicators and a core set of indicators for buildings. Geneva, Switzerland: ISO.
International Organization for Standardization, ISO. (2015). ISO 21929-2:2015 - Sustainability in building construction - Sustainability indicators -- Part 2: Framework for the development of indicators for civil engineering works. Geneva, Switzerland: ISO.
Keeler, M., & Vaidya, P. (2016). Fundamentals of Integrated Design for Sustainable Buildings (Second ed.). USA: John Wiley & Sons, Inc. .
Oltean-Dumbrava, C., Watts, G. R., & Miah, A. H. S. (2014). “Top-Down-Bottom-Up” Methodology as a Common Approach to Defining Bespoke Sets of Sustainability Assessment Criteria for the Built Environment. Journal of Management in Engineering, 30(1), 19-31. doi: doi:10.1061/(ASCE)ME.1943-5479.0000169
Reed, M. S., Fraser, E. D. G., & Dougill, A. J. (2006). An adaptive learning process for developing and applying sustainability indicators with local communities. Ecological Economics, 59(4), 406-418. doi: http://dx.doi.org/10.1016/j.ecolecon.2005.11.008
Sassi, P. (2006). Strategies for sustainable architecture. London; New York: Taylor & Francis. Szigeti, F. o., & Davis, G. (2005). Performance Based Building: Conceptual Framework - Final report. The
Netherlands. Retrieved from EU-funded Performance Based Building Network. von Weizsäcker, E. U., Lovins, A. B., & Lovins, L. H. (1998). Factor Four: Doubling Wealth, Halving Resource
Use - A Report to the Club of Rome. United Kingdom: Earthscan.

127
5 EARLY STAGE MODEL FOR SUSTAINABLE
DESIGN – EASYMODE
5.1 | INTRODUCTION
Throughout this chapter, one can find the reasoning for the selected indicators and their calculation
procedure. Each section of this chapter regards a sustainability category following the given framework
in Table 4.1. These sections are equally organised. First, a brief description of the indicators purpose
is presented, followed by its applicability to early design. At last, the developed calculation procedure
is depicted. In those indicators requiring in-depth studied to the development of their calculation
procedure, this latter is described previously to the calculation procedure presentation.
The calculation procedures presented here ground the implantation of the EasyMode tool as the
operating Microsoft Excel workbook. A digital support version of the workbook is attached to this
document. Also, a print screen of the tool is shown in Appendix 3.
5.2 | INDICATORS APPROACH
While developing the indicators, it was found that some could benefit from the same approach. In this
sense, the main approaches used are presented in this section to ease understanding and to avoid
repetition.

C H A P T E R 5 | E A R L Y S T A G E M O D E L F O R S U S T A I N A B L E D E S I G N – E A S Y M O D E
128
5.2.1 | Efforts approach
There are aspects where data availability at early stages is insufficient to carry out a detailed
assessment. Also, due to the nature of the assessing criteria, indicators may be of different types under
the same assessment tool, as shown in Chapter 2. There can be quantitative (performance) and
qualitative (procedure and feature). At early stages, most of the times it is only possible to quantify
designers’ intentions instead of real achievements, hence several indicators are procedure or feature ones.
Thus, for these cases, the ‘efforts approach’ was developed (Figure 5.1).
This approach presents different efforts with which designers can compromise. Depending on the
indicators’ aim, the number of efforts needed to achieve a certain performance level varies. This
relation is individually described in the development of each indicator.
The evaluation of this approach can follow one of two paths – descriptive or indicative. The descriptive
path enables designers to select those efforts they are willing to attain. On the other hand, the indicative
path aids designers establishing the efforts needed to achieve the desired level. Thus, following the
indicative path designers stipulate the performance level to attain and get the indication of how many
efforts should be surpassed while selecting the descriptive path they can indicate the efforts they are
willing to implement, obtaining the corresponding performance level. Alternatives can then be
considered and performances compared. Figure 5.2 presents an example of how an indicator
workbook with the efforts approach looks like.
Figure 5.1 Effort indicators methodology flowchart
Figure 5.2 EasyMode print screen for effort indicators path selection
FINISH
Indicationordescription?
Setperformanceleveltoattain
Selection ofthedesiredefforts
IndicationoftheN.ofeffortstosatisfy
Results Adjustefforts?
ChangeeffortstosatisfyCalculationofnewperformancelevelNewLevel
yes
no
Indication
Description
Morealternatives?
yes
no
Solution or 1 2 3
1 no Level 2 2 Two efforts should be implemented
Level 2 2
Performance Level
Select the efforts? Select level? Total score
Effort Selected Obtained level
Effort

E A R L Y S T A G E D E S I G N M E T H O D O L O G Y T O E N S U R E L I F E C Y C L E S U S T A I N A B I L I T Y O F R E S I D E N T I A L B U I L D I N G S
129
5.2.2 | Quantitative approach
Similarly, to the ‘efforts approach’, the ‘quantitative approach’ was developed and used in several
indicators. The principles behind the efforts and quantitative approach are the same: designers can
either follow a descriptive or indicative path. Nevertheless, in this ‘quantitative approach’ a real value
should be given, instead of an effort proposal (Figure 5.3). In this case, calculations or values
comparison is carried out by EasyMode according to the indicator scope and the values or indicative
level selected (Figure 5.4).
Figure 5.3. EasyMode print screen for qualitative approach indicators
Figure 5.4 Quantification approach flowchart
5.3 | SELECTION OF MATERIALS
Within ‘Selection of materials’ two groups indicators are considered: (i) life cycle impact assessment
and, (ii) environmentally preferable products. The first considers the life cycle environmental impact
caused by the building materials, and the second accounts for (i) responsible sourcing, (ii) reused
materials and recycled content and, (iii) heat island mitigation.
The next sections describe the need to account for these indicators and propose a calculation
procedure applicable at early design.
Solution or Select level? Kitchen Living rooms Bedroom Additional effort Obtained level
1 yes 2% 2.0% 2% yes Level 3 3
Introduce ADF value?
ADFPerformance Level
FINISH
Indicationorquantification
?
Setperformanceleveltoattain
Indicatethevalue
IndicationoftheN.ofeffortstosatisfy
Results Adjustefforts?
ChangevaluetoattainCalculationofnewperformancelevelNewLevel
yes
no
Indication
Quantification
Morealternatives?
yes
no

C H A P T E R 5 | E A R L Y S T A G E M O D E L F O R S U S T A I N A B L E D E S I G N – E A S Y M O D E
130
5.3.1 | LCA in early design process
The importance of considering an LCA approach in early design stages is undeniable in pursuing
sustainable design (Kohler & Moffatt, 2003). Major decisions are made throughout these stages, and
thus, environmental concerns should be dealt with as soon as possible. However, traditionally,
assessing environmental aspects requires the existence of the building bill of materials and construction
processes, which are not available in early design phases. Also, LCA calculations are often time-
consuming, demanding data inventory and requiring expert knowledge, making it almost inaccessible
to designers who want to have an expedite way to evaluate or compare the life cycle environmental
impact of the construction solution they are about to use.
The type of materials and construction solutions can highly contribute to reducing or increasing the
buildings’ impact on the environment. LCA is broadly accepted as the most accurate method to
evaluate the building’s life cycle environmental impact in sustainability assessment methods (Mateus,
2009). However, most of the existing sustainability assessment tools addressing LCA, are to be used
after design (Andrade & Bragança, 2016). Literature also shows studies avoiding the use of LCA in
early design, recurring to basic rules (Luttropp & Lagerstedt, 2006) and Ecodesign decision boxes
(Ostad-Ahmad-Ghorabi, Bey, & Wimmer, 2008). On the other hand, the research on methods to
include LCA at early design in a way designers can understand is growing. Basbagill, Flager, Lepech,
and Fischer (2013) proposed a methodology for applying LCA during early design to aid reducing the
embodied impacts. To simplify, the authors considered only global warming potential (GWP), rather
than considering more environmental impact categories, as proposed, for instance, by the CEN
standards. Bribián, Usón, and Scarpellini (2009) suggested a simplified LCA method that accounts
only for embodied energy. Notwithstanding, Marsh (2016) research for the same purpose – strategies
to adopt LCA at early design – showed that GWP is not enough to represent all the environmental
impact categories recommended. According to this analysis, it is essential to present and evaluate the
solutions’ consequences in three environmental impact categories: GWP, total primary energy (TPE),
and acidification potential (AP). Embodied energy plays a significant role in the buildings’ life cycle
energy requirements. Aye, Ngo, Crawford, Gammampila, and Mendis (2012) study showed that 32%
of the total building life cycle primary energy needs regard embodied energy. This percentage is
particularly relevant and tends to rise when a European Directive is imposing that all buildings are
nearly zero energy buildings (at the operational stage) by the beginning of 2021 ("Directive
2010/31/EU," 2010).
Including life cycle environmental impact assessment, in early design can thus generate controversy
since design variables are not yet defined, and LCA should be an accurate and detail evaluation
(Gervásio, Santos, Martins, & Simões da Silva, 2014). Therefore, the aim of this work is to propose a
method to include LCA in early design decision-making process, through an easy and practical tool
that can be used and understood by all project team members.

E A R L Y S T A G E D E S I G N M E T H O D O L O G Y T O E N S U R E L I F E C Y C L E S U S T A I N A B I L I T Y O F R E S I D E N T I A L B U I L D I N G S
131
5.3.2 | How BSA tools address LCA
To understand how LCA can incorporate sustainability assessment, beyond reviewing research papers
(Basbagill et al., 2013; Bribián et al., 2009; Gervásio et al., 2014; Marsh, 2016) and specific LCA tools
for construction works, existing BSA tools were also studied. The tools considering LCA directly, do
not allow comparison of alternatives, but rather evaluate the chosen solution, in its final form. This
process requires the buildings’ bill of materials, which is incompatible with early stages, as required in
the present study.
There are two types of approaches when applying LCA, problem-oriented (midpoints) and
damage-oriented (endpoints), which can be combined (Bare, Hofstetter, Pennington, & de Haes, 2000;
Buyle, Braet, & Audenaert, 2013). The midpoint approach uses values in the middle of the
environmental mechanism, pointing cause-effect relations. Environmental impact categories are
individually accounted and represented (GWP, AP, EP, etc.). The endpoint approach is at the end of
the mechanism, using characterisation factors (weights) to aggregate the midpoints into more broad
categories, which can then be aggregated as well into an overall score. The first allows for a more
comprehensive assessment, enabling a complete analysis of the environmental panorama, while the
second is easier to understand, but are less transparent, as it reflects the relative importance of each
environmental category.
BSA tools as CSH uses the endpoint approach to evaluating the home’s life cycle environmental
impact. The SBToolPT-H performs both, midpoint and endpoint methodologies, within its first
indicator P1, but the results are only presented in the endpoint approach. In this case, only the assessor
has access to the midpoint results, as they are not revealed in the final certificate. Nevertheless, during
midpoint approach, the achieved impacts per category are benchmarked and compared with the
conventional and best practices, allowing verifying percentage improvement. In its turn, DGNB
adopted a midpoint approach. Here, the impacts obtained are benchmarked with the standard
solution only. CASBEE only considers GWP, and LEED thus not consider LCA directly. CSH,
SBToolPT-H, and DGNB address almost the same environmental impact categories.
Although with different approaches in quantifying the building’s LC environmental impact, all the
tools mentioned above require the building’s bill of materials and hence, none of the methods is
suitable for early design.
5.3.3 | LCA methodological framework
Choosing building elements, their components, and characteristics (thermal behaviour, thickness,
density, etc.) highly influences not just the buildings’ operational functional performance but also, its
life cycle environmental impact (Bribián, Capilla, & Usón, 2011; Çomaklı & Yüksel, 2004; Su, Luo,
Li, & Huang, 2016). Typically, these choices are not based on the environmental performance of the
C H A P T E R 5 | E A R L Y S T A G E M O D E L F O R S U S T A I N A B L E D E S I G N – E A S Y M O D E
132
solutions. They are rather made based on designers and constructors’ experience in working with a
specific solution and in their costs, without, of course, compromising the functional performance of
the building. To perform a LCA, designers need expedite tools that allow quick comparisons between
design alternatives. As said before, the demand for precise data to perform an LCA can be considered
as a critical aspect against its use in early design. Nevertheless, if simplifications are made, and
databases are available, this evaluation can be more easily included in the early design.
EasyMode LCA approach aims at enabling designers quickly to identify the environmental implications
of their construction solutions choices, through a simple but accurate LCA comparison. Therefore, an
LCA database was used to gather the building elements for comparison in the tool. The database
developed by Bragança and Mateus (2012) was the cornerstone data-source for the building elements’
environmental profiles (EP) as well as the developments made under the European Project ‘Sustainable
Buildings in Steel (SB_Steel, 2010-2013). Nevertheless, additional materials’ EP were added to the
database as found needed. This latter was obtained by the author, following the methodology next
presented.
LCA has a declared uncertainty that cannot be neglected, due to data accuracy and variability (Su et
al., 2016). In this sense, CEN standards recommend the use of environmental product declarations
(EPD). However, these are not always available or are inexistent for several materials. Literature shows
that despite the use of EPD is preferable, the use of European generic data is acceptable and has a
methodological validity (Silvestre, Lasvaux, Hodková, de Brito, & Pinheiro, 2015). Therefore, as this
study applies to early design, where detail data is scarce, the use of generic data from European
databases is acceptable. Even if there is a lack of accuracy in the data, a comparison between
construction solutions is still possible and valid.
5.3.3.1 | Scope of the analysis and environmental impact categories
The quantification of the potential life cycle environmental impacts was carried out following the
European guidelines from EN 15978:2011 for sustainability construction works (CEN, 2011b). In its
turn, this standard recommends the methodological procedure presented in ISO 14040:2006 and
ISO 14044:2006 (ISO, 2006a, 2006b) for the life cycle impacts quantification.
Complying with CEN standard recommendation, eight environmental impact categories were
quantified and included in the materials’ EP, as shown in Table 5.1. The sum of the abiotic resource
depletion potential of fossil fuels (NRE) and primary renewable energy (RE) gives an indication of the
total primary energy (TPE).

E A R L Y S T A G E D E S I G N M E T H O D O L O G Y T O E N S U R E L I F E C Y C L E S U S T A I N A B I L I T Y O F R E S I D E N T I A L B U I L D I N G S
133
Table 5.1. Indicators describing environmental impacts and embodied energy
Indicator Unit Global warming potential, GWP kg CO2 equiv Depletion potential of the stratospheric ozone layer, ODP kg CFC 11 equiv Acidification potential of land and water; AP kg SO2- equiv Eutrophication potential, EP kg (PO4)3- equiv Formation potential of tropospheric ozone photochemical oxidants, POCP kg C2H4 equiv Abiotic Resource Depletion Potential for elements; ADP kg Sb equiv Abiotic Resource Depletion Potential of fossil fuels; NR MJ Renewable primary energy, RE MJ
5.3.3.2 | Calculation method
The SimaPro v8.0 software was used to quantify the environmental impacts of the building materials
included in the materials EP database. The programme comprises life cycle inventory (LCI) databases
required for the LCA quantification. The methods used for this quantification were the ‘CML 2
baseline 2000’ for ODP, AP, EP and POCP, ‘Cumulative Energy Demand’ (CED) for NR and RE,
and ‘IPCC 2001 GWP’ for the GWP. A problem-oriented approach was used for the calculation of
mid-point impact category indicators.
5.3.3.3 | Functional unit
The functional equivalent represents the basis for the solutions comparison. For this work, it was
defined as 1 m2 of building element with the same function, except the load-bearing structure which
was considered as per kg.
5.3.3.4 | System boundaries
The LCA boundaries follow the aforementioned standard, comprehending the materials’ production
stage (Modules A1 - A3); transport to and from site stage (Module A4); use stage (Modules B1 - B5),
end of life stage (Modules C1 - C4) and; the benefits and loads beyond the system, due to recycling
processes (Module D). This modular approach suggested by EN 15978:2011, was schematically
presented in Chapter 2 Figure 2.4. Each EP comprehends a cradle-to-grave analysis plus recycling –
Module A1 to D – assessment. The maintenance scenarios were defined individually to each building
element according to the materials lifespan.
5.3.3.5 | Reference service period
It is essential to bear in mind that building’s service life assumptions influence its life cycle
environmental impact (Grant, Ries, & Kibert, 2014). Also, there is the need to differentiate the
building’s lifespan from the lifespan of its components (Marsh, 2016).The building’s lifespan regards
the service life prediction, i.e., the expected period in which the building is performing its many
functions correctly. This period can last for 30, 50, 100, or more years. Nevertheless, the life

C H A P T E R 5 | E A R L Y S T A G E M O D E L F O R S U S T A I N A B L E D E S I G N – E A S Y M O D E
134
expectancy of some building materials and elements can be less than that and, hence replacement and
refurbishment actions will be needed. The building’s lifespan is conditioned by the materials
conservation state, especially from those comprising the load-bearing structure.
Therefore, it is essential to define the expected service life of the building, in which the building
elements will be used. This consideration will allow determining the reference study period (RSP)
which, by default corresponds to the required service life. Following this guide from EN 15978:2011,
the selected RSP was 50 years. If a material used in a building component has a lifespan smaller than
50 years, than replacement scenarios were considered to accomplish the RSP defined.
5.3.4 | LCA in EasyMode
The life cycle environmental impact of construction solutions should be considered during design
decision-making process, aiding designers developing sustainable buildings since the beginning.
Designers should be able to compare easily alternative solutions to evaluate the better solution with
the less impact over the environment. For instance, the results could be used as benchmarks in the
identification of solutions that, with the same U-value, could have a lower environmental impact. This
analysis promotes integrated design. For instance, designers can verify if increasing the insulation
thickness to reduce energy needs, has a significant impact in the buildings’ environmental LC impact,
or if the increase is marginal and energy benefits are considerable. Realising that choosing one material
instead of other can substantially contribute to reducing the impact on the environment, can lead
designers to start developing new solutions with new materials, promoting more conscientious supply
chain.
Although major impacts are still related to the operational phase, production phase relevance is rising,
especially due to the increasing energy efficiency in operation phase that can drastically reduce the
need for primary energy. In this sense, simplified LCA is crucial in early design to support the use of
low impact solutions.
As said before, LCA calculations are laborious and require expertise. Thus, its use during building
design is still residual. Implementing a simplified LCA, allowing designers for a quick and easy
evaluation of buildings’ potential LC impact, can facilitate its inclusion building design decision-
making.
5.3.4.1 | Calculation procedure
The previous sections showed how the database, of materials and construction solutions potential
environmental impacts, was created to be used in early design stages. Having in mind the aforesaid, a
framework was developed aiming to include the LCA into the sustainability tool (Figure 5.5).

E A R L Y S T A G E D E S I G N M E T H O D O L O G Y T O E N S U R E L I F E C Y C L E S U S T A I N A B I L I T Y O F R E S I D E N T I A L B U I L D I N G S
135
Figure 5.5. Schematic of LCA indicator evaluation framework
Designers should describe the construction elements they want to assess: (i) exterior wall, (ii) internal
walls, (iii) roof, (iv) ground floor, (v) interior floor and, (vi) primary structure. To do so, designers can
detail the materials that constitute their building element and their thicknesses, considering, for
instance, three layers: external, insulating and internal layers. After, the type of analysis required
should be indicated, through the definition of the LC stages, to be included in the assessment and the
RSP.
To ease the understanding of the analysis results, it was decided to present, by default, only three
environmental categories, while the other are only shown if required. This decision was made based
on the findings of Marsh (2016). The study found that there is a correlation between environmental
impact categories and that, presenting only GWP, AP and TPE can give a general panorama of the
total environmental impact. TPE was found not to have any relevant correlation, and thus, it needs to
be presented; GWP has a strong positive correlation with the AP and the NRE, together with a
negative correlation in the ratio of the RE to the TPE, notwithstanding with GWP documented
importance. Finally, AP has a high correlation with all environmental impact categories, except TPE
and RE. With this in mind, all the other categories, are only included in this assessment, if required by
the design team.
After deciding whether to add more environmental impact categories into the assessment, designers
can add alternatives, if a comparison is required.
The tool then calculates the potential environmental impacts of the selected solutions, making use of
the database to obtain the LCA values. The total impact for each environmental impact category is
obtained through equations Eq. 5.1 and Eq. 5.2.
%&"'$ = %)*+,-./0#
+ !345
×7)*+,-80#
Eq. 5.1
where Icat T represents the total impact in the environmental impact category i (unit of the impact/m2);
ImpactCG i is the cradle-to-gate impact for category i obtained in the database (unit of the impact/m2);
Identificationofmaterials per layer
Selectionof buildingelements
Selectionof scope of theanalysis
Identificationofbuilding RSP
Selectionof Environmentalimpact categories
Morealternatives?Database of Building
elements andmaterials
Quantificationofenvironmental impacts
Report
yes
no

C H A P T E R 5 | E A R L Y S T A G E M O D E L F O R S U S T A I N A B L E D E S I G N – E A S Y M O D E
136
RSP is the reference service life of the building (years); D is the durability of the materials (years); impactmi
is the maintenance impact for category i obtained in the database (unit of the impact/m2).
%&"'/:;"< =%&"'$!34
Eq. 5.2
where Icat/year is the total impact in the environmental impact category i per year throughout the
buildings’ life cycle.
When the solutions are defined by layers, the impact value available in the database 7)*+,-/8= should
be multiplied by the thickness t (m) given by the tool user, as presented in equation Eq. 5.3.
%)*+,-# = 7)*+,-/8=×- Eq. 5.3
Beyond presenting the impacts of each building element individually, the tool also calculates the total
impacts of whole building solutions (Ibuilding), through equation Eq. 5.4, where j represents the building
element.
%>?#@A#BC = %&"'/:;"<DD
Eq. 5.4
Results are then presented in both table and graphical representations. The graphical representation
enables non-technical LCA professionals to better understand the results and visualise which of the
alternatives has a lower LC environmental impact. The table gives the environmental impact per
square metre of solution per year. The results from the different alternatives, show directly the impacts
rather than associating them with performance levels. Therefore, in this indicator, no performance
levels are considered.
5.3.5 | Certified products and responsible sourcing
Sustainability expectations for building design can regard not only design techniques but also the
selection of materials should be cautioned. Environmental impacts, labour and welfare conditions and
possible and fare economy in the global supply chain need to be accounted. With this in mind, an
effort should be made to assure that AEC industry is obtaining its products responsibly. The concept
of responsible sourcing represents an essential mean to track down, and manage sustainable and ethical
objectives throughout the products supply chain, enabling better sustainable procurements’ practices
and attainment of sustainability goals (Glass, Achour, Parry, & Nicholson, 2011). The implementation
of responsible sourcing schemes as well as other environmental and social certifications systems,
represent a significant improvement for AEC industry. These systems acknowledge those who practice
sustainable and ethical production process throughout the supply chain, representing a step forward
the inclusion of sustainability criteria in the decision-making process.

E A R L Y S T A G E D E S I G N M E T H O D O L O G Y T O E N S U R E L I F E C Y C L E S U S T A I N A B I L I T Y O F R E S I D E N T I A L B U I L D I N G S
137
Organic-based products resulting from foresting and agriculture can be the only being both, truly
sustainable and responsible for a myriad of natural environment stresses. The exponential stress forests
had been through drove the development of environmental initiatives to promote sustainable
exploitation and use of resources. The aim was to protect both fauna & flora, and the people depending
on forests, being environmentally and socially responsible. Nevertheless, preserving forests is essential
to maintain human life on Earth. With this, different certification systems were created. FSC (Forest
Stewardship Council), PEFC (Programme for the Endorsement of Forest Certification) or SFI
(Sustainable Forestry Initiative) are examples of international schemes to allow for processing route
tracking of forest products, enabling the implementation of a chain of custody (CoC) certification.
These certificates assure compliance with the sustainable foresting principles through production,
processing, and distribution stages (FSC, 2016; PEFC, 2016; SFI, 2016). Beyond wood products and
CoC certification systems, other construction products can, and are, certifiable to assure a responsible
production process, accounting for environmental concerns. EU Eco-label certifies several products
regarding their low environmental impact. The existence of Environmental Product Declarations
(EPD), being voluntary, also shows the interest of producers in promoting more sustainable products.
When the products are not certified nor have EPD, manufacturers’ certifications can denote if the
product and its production process are environmentally responsible. Selecting responsible sources for
materials supply contributes for increasing market consciousness and aids reducing the buildings’
impact on the environment and society. There are several certificates that users can look for in
companies to identify the ones with environmental and social responsibilities, like ISO 14001, EMAS
or OHSAS 18000. ISO 14001 is the internationally agreed standard for setting out requirements for
environmental management system of production processes and companies. The implementation of
this principle and its certification proves the organisations’ commitment to reducing environmental
impacts while being more efficient and productive. EMAS (Eco-Management Audit System) is the
European certification system, although applicable worldwide as ISO 14001. It proves that companies
are working to improve their environmental performance. OHSAS 18001 regards occupational health
and safety, evidencing good work conditions for companies’ employees.
More broadly, as previously mentioned, responsible sourcing schemes assure responsibility throughout
all supply chain, which cannot be guaranteed by the former systems. Thus, choosing materials and
products with environmental and social responsible-sourcing recognised certificates improves
buildings’ quality and sustainable performance. In the UK, there are two documents, BES 6001 and
BS 8902, which set out a standard framework and certification schemes for construction materials,
respectively, regarding responsible sourcing. Although not applicable directly to Portugal, they show
manufacturers accreditation for they products. BSA tools as CSH, CASBEE, DGNB, SBToolPT-H, or
LEED already account for materials responsible sourcing, showing the relevance of these to the
buildings’ sustainability.

C H A P T E R 5 | E A R L Y S T A G E M O D E L F O R S U S T A I N A B L E D E S I G N – E A S Y M O D E
138
5.3.5.1 | Certified products and responsible sourcing in early design
In EasyMode, certification and responsible sourcing are considered together, regardless of the materials'
constitution. Reused materials and recycled contents are addressed in a different criterion. This
indicator aims to improve the sustainability of construction products by encouraging the use of
responsible sourced and certified products. Considering responsibly sourced materials and certified
products aids recognise the relevance of low environmental impact materials, improves supply chain
sustainability, and reduces the home's environmental impact.
When dealing with early design, it is impossible to verify if the materials and products used are certified
or responsibly sourced, as there are no materials definitions at this point. However, it was thought to
be of importance to bring awareness to this topic at these stages. One may say that if this awareness
rises, the probability to apply responsibly sourced materials increases, thus improving the buildings
sustainability just by remembering that this choice can, and should, be made. In this sense, no
quantifications are made, only recommendations for its use, recognising that if a sustainability
certification is aimed in due time, this aspect shall be accounted and the higher the amount of
responsibly sourced materials the higher the score achieved.
5.3.5.2 | Calculation procedure
EasyMode addresses only the intention to use certified and responsibly sourced materials, using the
efforts approach. Designers are asked if they willing to used certified and responsibly sourced materials,
and if so they are retrieved with a list of certificates to look for within materials and manufacturers
alternatives (Table 5.2). Table 5.3 shows the indicative performance levels established.
Table 5.2. Efforts to be considered under certified products and responsible sourcing indicator
Effort n. Description 1 Wood or wood-based products certified by FSC, PEFC or similar (reused or reclaimed) 2 Manufacturers certified by ISO 14001 or EMAS, and OHSAS 1800 3 Manufacturers are certified with responsible sourcing schemes 4 Other products are certified with relevant and acknowledge certification systems (p. ex. Eco-label)
Table 5.3. Performance levels for certified products and responsible sourcing indicator
Level Description Level 1 Fulfil effort 1 Level 2 Fulfil effort 1 and effort 2 or 4 Level 3 Fulfil level 2 and at least one more effort
5.3.6 | Recycle and reuse of materials and components
A way to achieve better life cycle environmental performance is to prefer the use of reused, reclaimed,
and recycled materials. Avoiding virgin materials extraction has a great impact in mitigating natural

E A R L Y S T A G E D E S I G N M E T H O D O L O G Y T O E N S U R E L I F E C Y C L E S U S T A I N A B I L I T Y O F R E S I D E N T I A L B U I L D I N G S
139
resources depletion, waste production and in diverting waste from landfill or incineration. Together
with responsible sourcing, choosing to reuse materials or use those with recycled content can indeed
reduce the embodied environmental impact of a building. It is doing the right thing, with the proper
means. Also, reducing construction waste is imperative, as this industry was responsible for 32.7% of
the EU waste production in 2012 (European Commission, 2016b). When designing a building, if highly
efficient technologies are adopted and implemented, but the building is built using just new materials,
even if its life cycle impact is lower than a conventional building, it cannot be considered as a truly
sustainable building, as it is not respecting the concepts/principles of sustainability.
Reclaimed and reused materials are preferable to recycled ones, as these latter require energy and
materials consumption to be treated and transformed to be usable again, while the former are directly
usable. Nevertheless, when it is impossible to reuse one may give priority to recycled materials.
Recycling implies fewer resources consumption than producing from raw materials (is important to
bear in mind that a product with a high recycled content does not necessary have a low environmental
impact) Also, it allows closing the materials life cycle, rather than having a linear one. According to
ISO 14021:2016, a product’s recycled content is “the percentage by weight, of recycled material used
in the production of a product or package.” This standard considers two types of recycling pre- and
post-consumer, and only these can be part of the recycled content. Pre-consumer materials are those
diverting from the waste stream in a production process (industrial by-products); from these, are
excluded those that are a waste in a process but have the potential to be used again in the same process
that originated it. Post-consumer materials are those arising after used by the market and that can no
longer satisfy their purpose. Materials that are returned by the distribution chain are also included
(ISO, 2016).
Recycling construction waste is still a challenge, mainly for two reasons. In one hand, demolishing
instead of deconstructing means that materials get mixed, and thus, it is almost impossible to separate
and divert those with recycling and reuse potential from being downcycled or landfilled. On the other
hand, concrete and masonry elements can only be downcycled, i.e., the transformation process
generates products of less quality and reduced functionality. In this sense, it is important to do both,
promote easy ways to deconstruct buildings instead of demolishing, reuse and reclaim what it is
possible to, and promote recycling of the other components. The more a building is made of reused
and recycled materials, and the more those materials remain in the cycle (closed life cycle), the lower
the natural resources depletion will be, less waste will be produced, and hence, the more sustainable
the industry will be.
Considering the use of these materials is then imperative to aid attaining sustainable goals.
BSA tools do account for recycled content and materials reuse. SBToolPT-H considers both in different
parameters. CASBEE recommends the use of materials that reduce resources’ consumption and waste
generation. LEED accounts for preferable environmental materials, in which products that contain at

C H A P T E R 5 | E A R L Y S T A G E M O D E L F O R S U S T A I N A B L E D E S I G N – E A S Y M O D E
140
least 25% reclaimed material, and at least 25% post-consumer or 50% pre-consumer content are
rewarded. CSH and DGNB do not account for recycled content and reuse of materials directly.
Recycled content can be included in the LCA calculations, depending on the scenarios considered.
The fact that, decisions upon materials are not typically made during the early design brings space for
improvement. One can say that it is unnecessary to include this criterion at these stages, since no
relevant actions are taken upon, but, on the other hand, this might be the opportunity to improve the
action in this topic. If no materials are defined yet, it means possibilities are countless. Thus, bringing
this subject to early discussion can drive designers select them more conscientiously and with less effort
shortly, than what it would be necessary if materials were already defined. It can also divert reusable
materials, existent on site, from being sent to waste collection centres.
Therefore, this indicator intends to increase the use of materials and building products that minimise
natural resources depletion, through reuse, recycled and recyclable content, and industrial by-products
content in materials and building products.
5.3.6.1 | Calculation procedure
This indicator is intended to improve the sustainability of construction products by encouraging the
reuse and use of materials with recycled content. The aim of addressing such concerns is to aid
recognise the relevance of low environmental impact materials, improve a circular economy, and
reduce the home’s environmental impact. To do so, the quantitative approach was adopted. The tool
presents recommendations to reuse existing materials and to select materials with higher recycled
content. Reference values regarding recycled content (pre- and post-consumer) and possibility to be
reused or recycled are given to designers. Recycled content or reusability of materials may varu, and
intrinsically relate to the type of material and its producer. In addition, the quantity of each
material/product used differs from building to building and, at early design, materials’ quantities are
still unknown. In this sense, indicative performance levels were established based on the reference
values. Each performance level corresponds to a quarter of achievement of the reference value – at
least 25%, 50%, and 75%, respectively (Table 5.4). The reference values were obtained considering
SBToolPT-H best practices for recycled content (Mateus & Bragança, 2016), WRAP (2008) and
materials fact sheets.
Table 5.4. Performance levels for certified products and responsible sourcing indicator
Level Description Level 1 ≥ 25 % of reference recycled content Level 2 ≥ 50 % of reference recycled content Level 3 ≥ 75 % of reference recycled content
Then, minimum requirements to achieve that level are suggested. One could say that this approach is
inaccurate as diminishing the recycled content of one material and, at the same time, increase another

E A R L Y S T A G E D E S I G N M E T H O D O L O G Y T O E N S U R E L I F E C Y C L E S U S T A I N A B I L I T Y O F R E S I D E N T I A L B U I L D I N G S
141
could lead to the similar results. If fact, it is true, but EasyMode intends to guide designers to be more
conscientious in their decisions, not to give them a certain recipe for sustainable design. The provided
results are hence indicative of a possible way to achieve designers’ ambitions, but they are not the only
formula to do that. Moreover, after getting the suggestions, designers can change the recycled content
amounts. If they choose so, the performance level will be given upon the new values. The results are
presented at both material level and building level per kilogramme. Figure 5.6 depicts this framework.
Eq. 5.5 and Eq. 5.6 present the calculations required to achieve the indicative performance levels.
Figure 5.7 illustrates how the tool approaches this indicator.
Figure 5.6. Recycled content and reused materials indicator framework
RC# = RC<;G×+ Eq. 5.5
where RCi is the percentage of recycled content needed for the material i to achieve the attaining
performance level; RCref is the reference percentage of recycled content for the material i retrieved
from the database and; a is the minimum percentage of achievement needed for each percentage level,
it can take the values 0.25, 0.50, or 0.75.
RC$ =!H#I
Eq. 5.6
where RCT is the total recycled content of the building per kg; and n is the number of materials
considered in the analysis (each material is equivalent to 1 kg).
Figure 5.7. Use of reused and recycled materials.
5.3.7 | Heat island
Urban microclimate, known as urban heat island effect (UHI), was defined as the difference between
the temperature of an urban area and its surrounding area. According to Oke (1982), the mean annual
Import fromLCA?
Creatematerials listautomatically
Selectionof materials
Identificationofperformance level attained
Calculationof recycledcontent % needed Results
Adjustpercentages?FINISH
Insert new percentageCalculationof newperformance levelNew Level
yes
no
yes
no
Solution 1
Materials/product Reused%ofrecycledcontentREF.
%recycledcontentNEEDED
Laminatedwood(exterior) yes 90 67.5rock/mineralwool(100-180) yes 50 37.5Stone yes 0 0Concrete 0 0

C H A P T E R 5 | E A R L Y S T A G E M O D E L F O R S U S T A I N A B L E D E S I G N – E A S Y M O D E
142
temperature of central urban areas is 1ºC to 3ºC higher than its shrouding rural areas. This effect is
driven by the solar radiance absorption through the city structures, during the day and its realise during
night time. Thus, improving green areas, high reflective coating materials and promoting ground
shading aids reducing UHI (Fallmann, Forkel, & Emeis, 2016). The temperature rising in the urban
area increases the buildings’ cooling needs during summer and decreases the heating needs during
winter. However, beyond this environmental and economic impacts, it affects social wellbeing in both
internal and external environments. Documented cases show that UHI has contributed to an increase
in the mortality during heat waves (Heaviside, Vardoulakis, & Cai, 2016) and other adverse effects of
UHI, (Chatzidimitriou & Yannas, 2016; Gago, Roldan, Pacheco-Torres, & Ordóñez, 2013; Han,
Taylor, & Pisello, 2015; O’Malley, Piroozfar, Farr, & Pomponi, 2015). All regard green areas, trees
and vegetation, water surfaces, green roofs and facades, permeable pavements, shading, and albedo as
key factors to reduce UHI. SBToolPT-H, DGNB, LEED, and CASBEE account for UHI in their
procedures. The four tools recommend hardscapes with high albedo, maximisation of green areas and
water surfaces, and shading devices.
5.3.7.1 | Heat island effect in early design
Although the heat island effect aspect is not mentioned as an indicator in the CEN standards for
building’s sustainability assessment, it was decided to include it as a recommendation for early design
stages, for two reasons. In one hand, this inclusion regards the passive measures that designers can
implement, without additional costs, to improve buildings efficiency and its surroundings. On the
contrary, this indicator is accounted by several sustainability assessment methods. Thus, if one wants
to certify the buildings’ sustainability, it is essential to bear in mind the effects of UHI.
Accounting for UHI during early design, aids to plan the green areas, the shading devices, the building
exposition to predominant winds in summer, the consideration of green facades and roofs, and the
selection of hardscapes coating materials. Simple design actions can induce high energy savings and
promote more indoor and outdoor pleasant spaces.
5.3.7.2 | Calculation procedure
EasyMode, aims to aid reducing UHI through design; intending at reducing energy spent to conquer
higher cooling needs and improving health in the home’s surroundings.
To go in line with the literature recommendations, more than green area and a high albedo for the
guidance given in this indicator were considered. In fact, there is still research alerting for the side
effects of high-albedo coating materials, as the easiest way to avoid UHI (Yang, Wang, & Kaloush,
2015). With this in mind, it was thought that the aspects considered in CASBEE (Institute for Building
Environment and Energy Conservation, 2008) could be adopted in this tool. Recommended ratios
were established based on literature benchmarking (Institute for Building Environment and Energy

E A R L Y S T A G E D E S I G N M E T H O D O L O G Y T O E N S U R E L I F E C Y C L E S U S T A I N A B I L I T Y O F R E S I D E N T I A L B U I L D I N G S
143
Conservation, 2008; Mateus & Bragança, 2009). In this sense, the indicative performance levels
acknowledge, one, two and three efforts to be made, respectively, Level 1, 2, and 3 (Table 5.5).
Similarly, to the previous indicators, designers are asked to which performance level they are attaining
to, and suggestions are made accordingly.
Table 5.5. Performance levels heat island effect indicator
Level Description Level 1 One effort from the list should be implemented Level 2 Two efforts from list should be implemented Level 3 Three or more efforts should be implemented
The efforts are intended to aid reducing the thermal load on surrounding areas. Based on the
performance level attained, one, two, three or more of the following efforts need to be implemented
throughout the design (Table 5.6). The calculations next presented are not intended to be used during
early design. Instead, they present the method designers should follow if committed with their
accomplishment. Still, designer can use the procedure to evaluate if their plans are in line with the
recommendations.
Table 5.6. Efforts to be considered under heat island effect indicator
No. Effort
1
Some measures have been taken to reduce the thermal impact on the surrounding area so as to ensure smooth ventilation in the neighbourhoods
[1] The building is set back in response to the prevailing wind direction in summer. Ratio of setback from the site boundary to the building height: 30% or more
2
The thermal impact on the surrounding area is reduced by maintaining a green area (including water surfaces) at the site (either [1] or [2] should be implemented).
[1] Efforts have been made to create as much shade from the sun as possible at the site by arranging medium-height/tall trees, pilotis, eaves, or pergolas. Lateral projecting area: 20% or more [2] Rise of temperature on or near the ground surface is mitigated by arranging lawns, grass, shrubs, or ponds and covering materials with good water retainability, water permeability are used for the ground surface. Permeable area ratio: 40% or more
3 The thermal impact on the surrounding area is reduced by choosing the appropriate surface cover
[1] Covering materials with sunlight reflectivity are used for the ground surface. Ratio of area covered by high albedo materials: 40% or more
4
The thermal impact on the surrounding area is reduced by choosing the appropriate exterior materials (either [1] or [2] should implemented).
[1] Rooftop: Rooftop greening area ratio: 20% or more Or roofing materials with good sunlight reflectivity and longwave radiation efficiency are selected: 20% or more [2] Exterior wall surfaces: Ratio of green area to the total surface area of the exterior wall surfaces facing east, west, and south: 20% or more Or exterior wall materials with good sunlight reflectivity and longwave radiation efficiency: 20% or more
Improve leeward area
The home should be setback from the prevailing wind direction in summer at least 30% (Institute for
Building Environment and Energy Conservation, 2008). By promoting the leeward area, it will
improve ventilation in the neighbourhood.

C H A P T E R 5 | E A R L Y S T A G E M O D E L F O R S U S T A I N A B L E D E S I G N – E A S Y M O D E
144
The ratio of the setback of the wall is given by Eq. 5.7. Figure 5.8 illustrates the buildings setback
measurements.
Sb =LM + LNO
Eq. 5.7
where Sb is the setback ratio; d1 and d2 are the setbacks of walls directly facing the prevailing wind
direction in summer and; H is the foreseen maximum height of the house (Figure 5.8).
Green and permeable area improvement
Improving green areas as well as water surfaces and shading, and highly water-retaining pavements
will prevent heat accumulation on site and the building while preventing surface water run-off.
Figure 5.8. Diagram of the house setback from prevailing wind direction (based on (Institute for Building Environment and Energy Conservation, 2008))
Shading improvement
The ratio of lateral projecting areas created by trees, pergolas or other shading devices, should be at
least 20% of the total site area and is calculated by Eq. 5.8 (Institute for Building Environment and
Energy Conservation, 2008).
S" = 3' + 3PQQ
Eq. 5.8
where Sa is the lateral projecting shading ratio; St and Sp are the lateral projecting area of medium-
height/tall trees and piloti/eaves/pergolas, respectively, and; AA is the total area of the site (allotment
area).
Permeable area (green areas, water-retaining and permeable materials)
The ratio of the permeable areas to the total site area is given by Eq. 5.9 and should be at least 40%
(Mateus & Bragança, 2009).
■ DescriptionEfforts that contribute to reduction of the thermal load outside the site are evaluated. The efforts that have
been made are confirmed, and an assessment is conducted based on evaluation points.
1) Consideration is given to the area leeward of the site to reduce the thermal effect on the area outside the site.
[1] The setback of the house from the prevailing wind direction (most frequent wind direction) in summer isevaluated.
Ratio of setback of wall:
(d1 + d2) / H × 100% ≧ 30%
*d1, d2: Setback of walls directly facingthe prevailing wind direction insummer
H: Maximum height of the house
*Methods of confirming the prevailing winddirection in summer:(a) Use data from an observation point
close to the site.● An Automated Meteorological Data
Acquisition System (AMEDAS) point● Fire station, etc.
(b) When (a) is not available, regionalmeteorological data managed by themunicipality can be used.
*Distance of wall used for evaluationThe wind direction and setback of the
wall are set as shown in the diagram atright.
Wind direction: If the wind direction is at anoblique angle to the site or the building,the representative wind direction isdetermined within the area shown in thediagram (A, B, C, D).
Direction of measured distance: Thedirection that runs directly against theprevailing wind direction:● ① when the prevailing wind direction is
A or B, or ● ② when the prevailing wind direction is
C or D.
149
CASBEE for Home (Detached House) Rating Criteria
Setback of wall: d1 Setback of wall: d2
Prevailing summer wind
Height of house: H
Setback of wall: d1 Setback of wall: d2
Prevailing wind direction B in summer
Prevailing w
ind direction C in sum
mer
Prevailing w
ind direction D in sum
mer
Prevailing wind direction A in summer
Measured distance direction ①
②
Measured distance
direction

E A R L Y S T A G E D E S I G N M E T H O D O L O G Y T O E N S U R E L I F E C Y C L E S U S T A I N A B I L I T Y O F R E S I D E N T I A L B U I L D I N G S
145
AP< = QC<;;B + QS"';< + QP
QQ Eq. 5.9
where Apr is the permeable area ratio; Agreen is the green area; Awater is the water surface area; Ap is the
area covered with water-retaining and water permeable materials.
High albedo
Choosing hardscapes coating materials with high albedo, increases solar radiance reflection and thus
aids controlling heat accumulation.
The ratio of area covered with high reflectance is given by Eq. 5.10 and should be at least 40% (Mateus
& Bragança, 2009). A material should have a reflectance at least of 60% to be accountable in this
point. Table 5.7 presents a few examples of coating materials reflectivity.
A"@>< = QC<;;B + Q"@>
QQ Eq. 5.10
where Aalbr is high albedo area ratio; Agreen is the green area; Aalb is the area covered with high reflectance
materials.
Green roofs and facades
Recurring to cool or green roofs and facades enables to reduce the thermal effect of the site on the
surrounding area.
Green roofs
The ratio of the greenery of the roof or cool solution to the total roof area is given by Eq. 5.11 and
should be at least 20% (Institute for Building Environment and Energy Conservation, 2008).
G<< = QC< + Q&<
Q< Eq. 5.11
where Grr is green roof area ratio; Agr is the greenery roof area; Acr is the cool roof area; Ar is the total
roof area.
Table 5.7. Solar reflectance mean values of coating materials (Mateus & Bragança, 2009)
Material Colour Reflectance (%) Galvanized steel Yellow 44 Dark blue 32

C H A P T E R 5 | E A R L Y S T A G E M O D E L F O R S U S T A I N A B L E D E S I G N – E A S Y M O D E
146
Material Colour Reflectance (%) White 61 Light grey 38 Dark grey 30 Brownish orange 20 No paint 73 Green 22 Red 38 Aluminium Yellow 56 Light blue 51 Dark blue 35 Beige 56 Grey 49 Brownish orange 29 Ivory 59 No paint 73 Dark green 31 Red 46 Mortar and concretes Light grey 33 Dark grey 13 Ochre 30 Red 22 Reversed cover Dark coloured aggregates 10 Light coloured aggregates 35 Bitumen emulsion Light coloured granulates 25 Black 5 Asphalt membrane White coating 70 Black 15 PVC membrane Blue 60 Beige 45 White 75 Grey 25 Black 5 Ceramic tile White coating 70 Red 68 Cement mortar tile White 74 No paint 25 Red 20 Zinc No paint 68
Exterior walls surface
The ratio of the green or with high reflectivity exterior walls surfaces to the total exterior wall surfaces
area, is given by Eq. 5.12 and should be at least 20% (Institute for Building Environment and Energy
Conservation, 2008).
GS< = QCS + Q&S
QS Eq. 5.12
where Gwr is green walls area ratio; Agr is the greenery exterior wall area; Acw is the cool exterior walls
area; Aw is the total exterior walls area.

E A R L Y S T A G E D E S I G N M E T H O D O L O G Y T O E N S U R E L I F E C Y C L E S U S T A I N A B I L I T Y O F R E S I D E N T I A L B U I L D I N G S
147
5.4 | EFFICIENCY
Efficiency category is aimed to reduce resources’ usage during the operational phase through design.
In this sense, this category considers three main indicators: (i) Energy, (ii) Water and, (iii) Waste. Energy
indicator is further divided into two sub-indicators: Energy needs and Local production.
The next sections describe the indicators needs and present the proposed procedure to account them
in EasyMode.
5.4.1 | Energy efficiency
The role of energy consumption in sustainability is undeniable, and it is not just wildly discussed as it
is on all political agendas. Buildings are responsible for, roughly 32% of the final energy consumption
and nearly 40% of primary energy in Europe ("Directive 2010/31/EU," 2010). Improving the
buildings’ construction quality and use, up to 42% final energy consumption decrease would be
achieved, as well as less 35% of emission of GHG (ECORYS, 2014).
The EBPD-recast requires all new buildings in EU member states to be ‘nearly zero-energy buildings’
(nZEB) by January 2021. To comply with these requirements and with the European energy targets
for 2030 and 2050 (ECF, 2010; EC, 2014) design teams needs to optimise design. To achieve nZEB
performance levels, a two-step holistic approach is recommended. First, the energy consumption
should be reduced as much as possible through highly efficient envelopes and passive design measures.
Only then, the second step should be put into practice that is satisfying the remaining energy needs
recurring to renewable energy sources with highly efficient equipment (Figure 5.9).
Figure 5.9. Holistic approach to nZEB
The transposition of the EPBD-recast for the national regulation was made through the Decree-law
n. 118/2013 ("Decreto-Lei n.º 118/2013," 2013). This establishes the Energy Certification System
Energy
supply
RES
EnergyconsumptionEnergy efficiency
Energyefficentsystems
PassiveTechnics+
Energy
Productio
n

C H A P T E R 5 | E A R L Y S T A G E M O D E L F O R S U S T A I N A B L E D E S I G N – E A S Y M O D E
148
(ECS) and the Regulation for the Energy Performance of Dwellings (REH)3. This document is
complemented with several other regulation statutes that set thresholds and calculation procedures for
the thermal and energy performances. REH sets the maximum energy requirements, establishing
performance levels according to a reference building that depends on the building under study. It
enables determining the annual global primary energy needs (Ntc) through the quantification of the
nominal annual energy needs for heating (Ni), cooling (Nv), and DHW production for a given building.
The Ntc corresponds to the energy requirements to maintain the building in the reference thermal
comfort conditions and DHW preparation. Following EPBD-recast recommendations, these needs
should be reduced as much as possible through design. Some measures that can be implemented
towards this goal are:
• Position the building to the best orientation to maximise solar gains;
• Endow the building with solar shading devices to reduce Summer solar gains;
• Improve envelope insulation and airtightness;
• Use low emissivity glazing;
• Highly efficient equipment.
Whenever the comfort conditions cannot be met just through design techniques, energy systems will
be required to assist the building. Following EPBD-recast recommendations, these should be
renewable energy systems (RES).
Nowadays, there are several technologies to produce renewable energy locally. Since the transposition
of the former EPBD, with the Regulation of the Thermal Performance Characteristics of Buildings
(RCCTE) ("Decreto-Lei nº 80/2006," 2006) it is mandatory for new buildings to have installed solar
energy systems for DHW production. With the new relegation – REH – these systems should enable
at least an equal contribution of renewable energy than that calculated based on a standard solar
collector with the characteristics defined in Portaria n. 349-B/2013 ("Portaria 349-B/2013," 2013).
Recurring to RES enables reducing the building’s emission of GHG and contributes to diminishing
raw materials exploitation, thus reducing the building environmental footprint. Thus, foreseen the
inclusion of RES during the building design enables the building to satisfy the new demands for energy
efficiency and nZEB, comply with legal requirements and contributes to improving the building’s
sustainability. Some examples of systems that can be used are (i) solar collector; (ii) photovoltaic panels;
(iii) wind turbines; (iv) micro-hydrogenerators; (v) biomass heating systems or; (vi) passive cooling
system or air heating through buried pipes.
Assistance in decision-making and guidance towards highly efficient design is of utmost importance in
early phases of design (Attia, Gratia, De Herde, & Hensen, 2012; Hygh, DeCarolis, Hill, & Ranjithan,
3 From the Portuguese Regulamento de desempenho Energético dos edifícios de Habitação

E A R L Y S T A G E D E S I G N M E T H O D O L O G Y T O E N S U R E L I F E C Y C L E S U S T A I N A B I L I T Y O F R E S I D E N T I A L B U I L D I N G S
149
2012). Energy simulation is a powerful tool to model and preview building energy requirements.
However, conducting such simulation requires deep simulation and energy expertise, time, and a vast
amount of data not available at early stages (Hygh et al., 2012). As emphasised throughout this thesis,
despite its difficulty, predicting design consequences for the building life cycle, at early design phases,
it is crucial to improving the buildings’ sustainability (Østergård, Jensen, & Maagaard, 2016).
5.4.1.1 | Energy efficiency in early design
There are several attempts to establish a method enabling energy quantification at early design phases
(Attia et al., 2012; Bogenstätter, 2000; Carlos & Nepomuceno, 2012; H. J. Kang, 2015; Nielsen, 2005;
Østergård et al., 2016; Petersen & Svendsen, 2010; SB_Steel, 2010-2013). Nevertheless, some of these
methods require the finished project to perform the assessment, enabling a sensitive assessment at early
design, even with fuzzy and incomplete data. The level of data detail, require expert knowledge,
hampering its use by design practitioners. Also, several studies focus only air-conditioning energy
requirements, addressing the energy needed to domestic hot water (DHW) preparation (Santos,
Martins, Gervásio, & Simões da Silva, 2014).
Despite this, a method was recently developed in a European Project, established a simple yet easy to
use tool to quantify energy requirements at early stages. SB_Steel – The Sustainable Building Project in Steel
(SB_Steel, 2010-2013), where the University of Minho was one of the consortium partners, developed
a decision-making platform to aid selecting steel-intensive solutions in the early phases of a building
project, based on LCA and energy needs quantification. The developed tool is freely available on the
internet (ESSAT, 2014). It enables a simplified LCA and energy quantification at two distinct early
design stages concept and preliminary. The tool is simple and easy to use. Thus, it can be used by
anyone interest, even if not having deep knowledge in environmental impact quantification and energy
calculations. Although the tool was developed for steel-intensive solutions, it has now more building
solutions enabling a more broadly used. The method developed within SB_Steel for the energy
quantification was published by Santos et al. (2014).
Briefly, the energy module calculates the energy needs, on a monthly basis, for heating, cooling, and
DHW production. ISO 13790 provides the general framework for the calculations for the heating and
cooling needs, while EN 15316-3-1 was followed for the estimation of DHW production needs.
The energy needs for space heating and cooling (kWh) calculations base on Eq. 5.13 and Eq. 5.14. All
the parcels in those equations followed the recommendations in ISO 13790:2008.
UV,BA,&XB',8 = UV,'<,8 + UV,Y;,8 − [V,CB,8 ∙ UV,CB,8 Eq. 5.13
U.,BA,&XB',8 = U.,CB,8 − [.,]^,8 ∙ U.,'<,8 + U.,Y;,8 Eq. 5.14

C H A P T E R 5 | E A R L Y S T A G E M O D E L F O R S U S T A I N A B L E D E S I G N – E A S Y M O D E
150
where, UV,BA is the heating energy need (kWh); U.,BA is the cooling energy need (kWh); U'< is the total
heat transfer by transmission (kWh); UY; is the total heat transfer by ventilation (kWh); [V,CB is the gain
utilization factor (-); [.,]^ is the loss utilization factor (-) and; the subscripts cont and m means continuous
heating/cooling and monthly, respectively.
The energy need for DHW production is dependent on the building type, its floor area and
temperature difference between the inlet water (_`,a) and the one required at the tapping point (_`,').
For that, equation Eq. 5.15 is used, following EN 15316-3-1 (2007) requirements.
UbV`,BA,8 = 4.182 ∙ h̀ ,8 ∙ _`,' − _`,a Eq. 5.15
where, UbV`,BA,8 is the DHW production energy need (MJ/month), and h̀ ,8 is the monthly DHW
volume need (m3/month) as set in EN 15316-3-1 (2007).
The daily DHW volume needs for a single family building is given by Eq. 5.16. h̀ ,8 can be obtained
using this equation, multiplying it by the number of days in a given month.
h̀ = +×ij×10lm Eq. 5.16
where a is the unit requirement based on litres of water at 60°C/day, and NU is the number of units to
be considered. Both parameters depend on the floor area as in equation Eq. 5.17and Eq. 5.18.
If,QG > 30)N, -ℎsI+ =tN×@B uv lMtw
uv Eq. 5.17
If,15 ≤ QG ≤ 30)N, -ℎsI+ = 2 Eq. 5.18
The energy need does not consider the efficacy of the building system providing the service required.
Therefore, to obtain the amount of energy required to satisfy the building’s energy needs, these should
be divided by the equipment efficiency. In this sense, the sum of all energy use can determine the total
energy consumption in kWh/year, as given by Eq. 5.19.
U$X',&XB^ =UV,BA[V,^Y^
+U.,BA[.,^Y^
+ UbV`,BA
[bV`,^Y^ Eq. 5.19
To obtain the primary energy a conversion factor, Fpu, multiply the energy consumption, according to
Eq. 5.20 kWhEP/year. Dividing either U$X',&XB^ or U$X',P<#8 by the net internal area the consumptions
are then given per square metre.
U$X',P<#8 = zV,P? ∙ UV,&XB^ + z.,P? ∙ U.,&XB^ + zbV`,P? ∙ UbV`,&XB^ Eq. 5.20

E A R L Y S T A G E D E S I G N M E T H O D O L O G Y T O E N S U R E L I F E C Y C L E S U S T A I N A B I L I T Y O F R E S I D E N T I A L B U I L D I N G S
151
Table 5.9 depicts the default values for the systems’ efficiency used in the SB_Steel tool. This
calculation procedure was retrieved from the tool’s user manual (SB_Steel - Sustainable Building
Project in Steel, 2010-2013). Table 5.10 presents the conversion factors (Fpu) used in EasyMode,
following REH recommendations.
Table 5.8 Heating, cooling, and DHW systems efficiencies and energy source used
Function System hsys Type of Energy Heating Electric resistance 1.00 Electricity Gas Fuel Heater 0.87 Gas fuel Liquid Fuel Heater 0.80 Liquid fuel Solid Fuel Heater 0.60 Solid fuel Split (Heating) 4.00 Electricity Cooling Split (Cooling) 3.00 Electricity
Refrigeration machine (compression cycle) 3.00 Electricity
Refrigeration machine (absorption cycle) 0.80 Electricity
DHW Electric boiler 0.90 Electricity Gas boiler 0.60 Gas fuel
Stand-alone heater condensation 0.72 Gas fuel
Stand-alone heater 0.40 Gas fuel
Table 5.9 Conversion factor from energy use to primary energy ("Despacho n.º 15793-D/2013," 2013)
Energy type Fpu [kWEP/kWh]
Electricity 2.5 Gas, liquid, or solid fuel 1.0
5.4.1.2 | Calculation procedure
The main aim of this indicator is to improve the buildings’ energy efficiency, promoting nZEB design
and reduce environmental impacts arising from its use. Doing so, it would be possible to improve the
buildings life cycle environmental impacts, reduce costs associated with energy consumption, thus
improving life quality.
Following EPBD-recast, EasyMode addresses energy efficiency through two sub-indicators: (i) Energy
needs and (ii) local renewable production, which calculation procedures are next presented.
Energy needs
As stated before, it is possible to foresee the energy needs early in the design. This sub-indicator intends
to guide designers select the construction solutions and techniques that reduce as much as possible the
building’s dependency on energy. The evaluation compares different alternative energy requirements,
using SB_Steel tool as a basis. As this tool is freely available on-line and performs the assessment
required in EasyMode, it was decided not to transpose the whole model to the EasyMode spreadsheet.
Instead, it is recommended accessing the web page of the SB_Steel tool and carry out the assessment

C H A P T E R 5 | E A R L Y S T A G E M O D E L F O R S U S T A I N A B L E D E S I G N – E A S Y M O D E
152
there – http://www.onesource.pt/sbsteel/site/. Alternatives comparison is possible on the website.
Nevertheless, EasyMode requests adding the results’ data in the spreadsheet to use overall data
collection and linkage with other indicators.
Therefore, the subsequent steps compose this sub-indicator procedure:
• Access SB_Steel tool web page;
• Indicate the number of alternatives to be compared;
• For each alternative fulfil the results table with the following data for heating, cooling and
DHW preparation systems: the main energy source, energy needs, energy delivered, and
renewable energy (Figure 5.10);
• Comparison of obtained results.
Energy source
Energy (kWh/m2·year) Need Delivered Renewable Heating Cooling DHW
Figure 5.10. Example of energy needs results table in EasyMode
Local energy production
After reducing the energy needs to the minimum possible, the remaining to assure comfort shall be
fulfilled through renewable sources. Thus, the aim of this sub-indicator is to acknowledge the designers’
efforts to plan the implementation of RES at early design stages. The performance of this sub-indicator
is assessed estimating the amount of renewable energy produced in the building (or building site) (Er).
The procedure intends then to quantify the contribution of renewable energy (PEr) to the total energy
requirements. Based on the retrieved data from the SB_Steel tool, in the previous indicator, EasyMode
automatically quantifies the total Er (kWh/m2·year) using Eq. 5.21.
{< = {<V + {<. + {<bV` Eq. 5.21
where {<Vis the contribution of renewable energy for heating (kWh/m2·year), {<.is the contribution
of renewable energy for cooling (kWh/m2·year), and {<bV`is the contribution of renewable energy
for DHW preparation (kWh/m2·year).
At the same time, the EasyMode estimates the building’s total primary energy requirements according
to Eq. 5.20. PEr (%) is than obtained through Eq. 5.22.

E A R L Y S T A G E D E S I G N M E T H O D O L O G Y T O E N S U R E L I F E C Y C L E S U S T A I N A B I L I T Y O F R E S I D E N T I A L B U I L D I N G S
153
4{< = {<
U$X',P<#8×100 Eq. 5.22
Performance levels were established considering the following: (i) the baseline threshold as meeting
more than fifty percent of the primary energy required for DHW preparation (QDHW’) (conventional
practice in SBToolPT-H (Mateus & Bragança, 2016)) and; (ii) the threshold for the higher level as
meeting at least total energy requirements of the building as presented in Table 5.10.
Table 5.10. Performance level description for local energy production
Level Description Level 1 Er > 50% of QDHW’ Level 2 75% of QDHW’ ≤ Er < U$X',P<#8 Level 3 Er ≥ U$X',P<#8
5.4.2 | Water efficiency
Water is a fundamental element for life. Nevertheless, its availability is becoming scarce in some
regions due to the continuing population growth, extreme resource consumption, urbanisation and
industrialisation, and reduced access. Climate change is also deeply responsible for water stress, and
the tendency is to increase. Several densely-inhabited world regions are at serious risk of increasing
their water stress. Only 0.5% of the global water is clean and available to consume (WBCSD, 2009).
Nowadays, 11% of the world’s population remain without access to an improved source of drinking
water, while consumption of contaminated water is still responsible for 70% of all diseases. Sanitary
concerns and gender equity are both also related to water availability.
For these reasons, water is a critical aspect that needs to be secured and seriously accounted to assure
long-term sustainable management of water resources and ensure peoples’ life quality.
Although water consumption is essentially due to agriculture and industry, household consumption is
also a prominent sector needing improvement as abundant inefficiencies can be felt. A human being
requires at least 20 litres of water per day to assure basic hygiene and food needs (WHO, 2016). The
United Nations advice that consuming 50 litres of potable water per person per day is reasonable. In
continental Portugal, household consumption was 172 litres per person a day in 2009 (INE, 2012),
which is more than three times of the recommended amount.
Portugal, not being in the worst scenario compared to other countries, has regions where projections
for water scarcity are meaningful (Wessman, 2011). The Portuguese government transposed in 2005
the European Directive regarding the framework for Community action in water policy, aiming to
implement more efficient water systems, and improve water quality and consumption. In the last years,
a national plan for efficient water use has been implemented, and results are already being felt. Water

C H A P T E R 5 | E A R L Y S T A G E M O D E L F O R S U S T A I N A B L E D E S I G N – E A S Y M O D E
154
losses in water supply have been reduced in the three sectors, industry, agriculture and urban supply,
as well as the total consumption (APA, 2012).
Most of this household consumption is not for drinking purposes, and approximately 85% of
residential water usage is wasted. There are no recent data, regarding the actual household water
consumption. The data found, has more than fifteen years, but it can be used as an indication. It shows
that household water consumption has mainly for shower and tap use (Figure 5.11).
To reduce inefficient water use and avoid the use potable water in less noble activities, PNUEA aims
to implement restrictive measures to the use of public water in households. As for instance: (i)
adjustment of faucets, showers, toilets, dishwasher and washing machine and; (ii) adjustment,
restrictions or forbiddance to use public potable water supply to outdoor pavement and cars washing,
garden watering, and to fill swimming pools, lakes and water surfaces. With this in mind, PNUEA
recommends and acknowledges water reuse and recycling within a household.
Figure 5.11. Daily household water use in Portugal (Vieira, Almeida, Baptista, & Ribeiro, 2007)
Measures to save water within a house can be divided into three main groups (i) adopted materials
with low virtual water; (i) implement grey and rainwater reuse systems and; (iii) utilise efficient water
fittings (taps, cleaning machines, toilets, showers, etc.) (Mateus & Bragança, 2006). A fourth group can
be added, as consumption monitoring and leak detection systems can also contribute to a more water
efficient use. Virtual water is the amount of fresh water needed to produce a product at the location
where it is produced. It is a concept similar to embodied energy. The total amount of water required
to produce a product an individual consumes is the water footprint (Bokalders & Block, 2010).
There are several certification systems to acknowledge fittings’ efficiency. In Portugal, there is the
Associação Nacional para a Qualidade nas Instalações Perdiais (ANQIP) – National association for
water supply quality – that has a ranking system aimed to certify and label water efficiency of products.
It is based on a scale from A++ to E, where A++ corresponds to the higher efficiency (Figure 5.12). It
targets shower fittings, taps (kitchen and bathroom), toilet flushes, and other. At European level, there
is the will to promote the European Water Label which principles are similar to ANQIP’s. ANQIP
also sets the requirements and certifies domestic water reuse systems, both for rain and grey water.
28%
4%
32%
16%
8%
2% 10%
toilet
losses
shower
tap
washingmachine
dishwasher

E A R L Y S T A G E D E S I G N M E T H O D O L O G Y T O E N S U R E L I F E C Y C L E S U S T A I N A B I L I T Y O F R E S I D E N T I A L B U I L D I N G S
155
Figure 5.12. Example of ANQIP water efficiency label (@ANQIP)
Beyond the benefits of preserving freshwater resources by controlling water wastage, household water
reuse can contribute to both, reduce water bill and water stress. Both rainwater and a part of
wastewater can be used inside the house in toilet flushes and washing machines, and outside for
outdoor cleaning activities (cars, pavements, etc.) and garden irrigation. The level of treatment needed
depends on the water composition and in its destined reuse (Jabornig, 2014).
Wastewater can be divided into two types: blackwater and greywater. Blackwater origins in toilets,
thus its biological and chemical load is high. Its treatment within the house would require huge
investments and thus it is typically discharged into the public wastewater supply system. Greywater is
all the wastewater that does not include blackwater. It comes from showers and bathtubs, washbasins,
kitchen sinks, and washing machines both for laundry and dishes. These typically have less biological
load than blackwater. Nevertheless, only a part of greywater can be considered for recycling, the one
even less polluted, meaning the water resulting from showers, bathtubs, and washbasins; under certain
conditions, washing machines and kitchen sink discharges can also be considered. In Portugal,
greywater can be used for toilets if bath water quality is met after treatment. For washing machine use,
beyond bath water quality requirements reusable water should also be used at least at 55ºC. For garden
irrigation, the quality requirements are less restrictive. If watering plants for raw consumption, national
requirements for agriculture water use quality shall be followed (ANQIP, 2011). ANQIP does not have
recommendations for outdoor use other than irrigation. According to Muthukumaran, Baskaran, and
Sexton (2011) up to 77% of potable water can be saved if greywater is reused.
Beyond greywater, rainwater can be harvested and used for the same destinations inside and outside
the house. However, contrarily to greywater reuse, rainwater can thus aid reduce potable water use
but together with green roofs represent a measure to reduce peak flows from drainage storm water
systems. The microbiological and chemical load of this water is typically inferior to the one present in
greywater, thus treatment requirements are lower than the latter. ANQIP states that rainwater can be
used for car or pavements wash, be used in firefighting systems, HVAC, etc. For irrigation, outdoor
washings, or toilets, the water should meet bath water quality requirements. In the case of washing

C H A P T E R 5 | E A R L Y S T A G E M O D E L F O R S U S T A I N A B L E D E S I G N – E A S Y M O D E
156
machines, adequate machines should be used and well as a micro-filter of 100 µm in the rainwater
intake (ANQIP, 2015).
5.4.2.1 | Water efficiency in early design
There are not scientific publications regarding how to include water efficiency early in the design.
Nevertheless, approaches for implementing a water life cycle approach in later design stages have been
proposed by Stephan and Crawford (2014). Bokalders and Block (2010) and Keeler and Vaidya (2016)
in their books address water conservation, providing ideas on how to improve buildings sustainability
through water savings. None of the books is specific to homes. While the first focusses more in water-
saving technologies and fittings, the second accounts for site design for water preservation and quality.
Designers should think of water conservation solutions to reduce building and landscape water use and
promote water recycling through, water storage systems (natural or human made), treatment solutions
on site and building (Keeler & Vaidya, 2016).
Among all the life cycle stages, BSA tools mainly account for operation phase in when dealing with
water efficiency. These tools provide mostly a qualitative assessment rather than quantifying life cycle
water requirements. Buildings’ embodied water is often left out of the assessment, although CEN
EN 15643-2:2011 (CEN, 2011a) recommends its assessment. All the tools addressed throughout this
study account for water efficiency, mostly using water saving devices and grey- and rainwater reuse.
For instance, SBToolPT-H and CASBEE account for potable water use and sewage generation in two
different indicators. One accounting for total water use, through acknowledging the use of water saving
fittings and another accounting for water reuse.
Accounting for operational water efficiency may not always be done realistically. Typically, the
assessment is based on the devices installed in the building and statistical data for common water
consumption per capita. Water consumption efficiency depends on the devices installed, but it is also
greatly affected by the users’ behaviour. If a water tap is left open, it will conduce to water inefficiency.
Nevertheless, if the tap has low water flow rate, the amount of water spent would be less than if the
tap had a greater water flow.
At early design, it is not relevant to determined that a specific shower or toilet flush device will be
selected to be used. Rather, the implementation of water saving systems can be discussed and thought
about at this stage.
If there are simple measures that can be adopted at any time, there are also others, which can only be
easily implemented in a household if included in the design project. Even those post-construction
measures, if decided and established during design, they can contribute to economic savings
(investment in new devices and excessive water consumption repercussion in water bill) as well as

E A R L Y S T A G E D E S I G N M E T H O D O L O G Y T O E N S U R E L I F E C Y C L E S U S T A I N A B I L I T Y O F R E S I D E N T I A L B U I L D I N G S
157
environmental savings (reduced water consumption since the beginning of the house operation,
materials savings as there is not the need to substitute devices).
5.4.2.2 | Calculation procedure
When accounting for water consumption and sewage production during the operational phase, only
the measures that can be influenced by design are considered. Besides, as in early stages, there are no
detail data, it is not possible to account for a performance-based evaluation. Instead, a feature
evaluation could aid implementing systems that are more efficient and promote debate among design
actors. Examples of efficient water fittings and systems should also be given to ease and inform
decision-making. With this in mind, the evaluation procedure followed the efforts approach. Three
indicative performance levels were established, and each represents the commitment to implement,
one, two or three measures depending on the target goal.
Implementing just effort n. 1 can input up to 41.5% potable water use decrease and consequently
reduce the amount of sewage produced. Implementing effort n. 2 or n. 3 together with effort 1 induces
a reduction of more than 48% (ANQIP, 2011) while implementing the three measures can reduce the
use of potable water up to 77% (Muthukumaran et al., 2011).
The efforts intend to aid reducing potable water consumption and sewage production. Based on the
performance level attained one, two or three of the following efforts need to be accounted during
design (Table 5.11). The calculations next presented are not intended to be used during early design.
Instead, they present the method designers should follow if they are committed with their
accomplishment. Still, a designer can use the procedure to evaluate if their plans are in line with the
recommendations.
Table 5.11. Efforts' description for water efficiency indicator
Effort n. Description 1 Use of water-saving fittings 2 Reuse of rainwater 3 Reuse of greywater
Water-saving fittings
Implementing water-saving fittings in bathrooms, kitchens, washrooms and outdoors contributes to
reducing the amount of water that is wasted becoming sewage. ANQIP proposes water efficiency
performance levels, according to the fitting typology and water flow. Table 5.12 summarises these
recommendations, but only for the higher performance levels.

C H A P T E R 5 | E A R L Y S T A G E M O D E L F O R S U S T A I N A B L E D E S I G N – E A S Y M O D E
158
Table 5.12. Water flow (Q) according to water efficiency performance levels4 for water consumption devices (l/min)
Performance level Washbasin Kitchen sink Toilet flush5 Shower A+ Q ≤ 2.0 Q ≤ 4.0 5.0 (for A++ its 4.0) Q ≤ 5.0 A 2.0 < Q ≤ 4.0 4.0 < Q ≤ 6.0 6.0 5.0 < Q ≤7.2 B 4.0 < Q ≤ 6.0 6.0 < Q ≤ 9.0 7.0 7.2 < Q ≤9.0 C 6.0 < Q ≤ 9.0 9.0 < Q ≤ 12.0 9.0 9,0 < Q ≤15.0 D 9.0 < Q ≤ 12.0 12.0 < Q ≤ 15.0 - 15.0 < Q ≤30.0
To forecast the amount of water consumed by each inhabitant in a year equation Eq. 5.23 can be used,
excluding the use of washing and dishwasher machines.
|} = U×-×}×*×365�
GÄM
×10lm Eq. 5.23
where WU is the water use per year per number of occupants (m3/p∙year); Q is the water flow of fixture
f (l/min); t is the time in minutes in which the fixture f is in use (min); U is the number of times fixture
f is used in a day per occupant and; p is the proportion of f in the house, meaning if only one type of
tap is used p=1, whereas if there are two types of taps, p=0.5. In the case of toilet flush, consider
U×- = discharge (total if it is single-discharge device or the medium volume if it is a dual-flush system).
According to SBToolPT-H a good practice to attain would be a WU not greater than 22 m3/p∙year.
Rainwater reuse
Collecting and reusing rainwater aids reducing the amount of potable water consumed within the
house. The main aim of this procedure is to maximise the recovery of rainwater for the different
possible uses. The procedure next presented is a simple guide to estimate the volume of the reservoir.
If planning to install a complete system, it is recommended following ANQIP guideline ETA 0701_v9
(2015). According to it, to estimate easily the reservoir volume (V) equations Eq. 5.24 to Eq. 5.26 shall
be used.
h = Å7I hMÇÉhN Eq. 5.24
hM = 0.0015×4×Q×i Eq. 5.25
hN = 0.003×iX×HuÑ×i Eq. 5.26
where V1 is the useful volume (l); P is the average annual precipitation in the site (mm); A is the water
catchment area (m2); N is the maximum number of days the water can be retained in the reservoir
4 When the tap has an eco-stop or an aerator the correspondent performance level is one level higher than the one shown, when it has both, it scores to two levels above. 5 Nominal volume (l). If the toilet has an interrupter for flushing consider one level below the one given and if it is complete please consider two levels below.

E A R L Y S T A G E D E S I G N M E T H O D O L O G Y T O E N S U R E L I F E C Y C L E S U S T A I N A B I L I T Y O F R E S I D E N T I A L B U I L D I N G S
159
(typically 20 to 30 days, but up to 90 if significant use for irrigation); V2 is the used water volume (l); No
is the number of occupants and; CAE is the estimated annual consumption (l).
Greywater recycling and reuse
As for rainwater, recycling greywater greatly contributes to decreasing both, the amount of potable
water used and the sewage production. In order to install a greywater recycling and use system, the
ANQIP guideline ETA 0905_V1 (2011) should be followed. According to ANQIP, 70% of the potable
water used turns into greywater, from which 68.6% correspond to the reuse potential, meaning 48%
from the total water consumption. Fifty-two percent up to 73% of the potentially recovered greywater
can be used for toilet flushing.
5.4.3 | Waste Reduction
Current statistic reveals that 4 710 464 tonnes of municipal waste (MW) were produced in Portugal
during 2014 (INE, 2014b). This represents that almost half of a tonne of MW has produced per person
in a year, meaning 1.2 kg/p∙day. Municipal waste means (European Commission, 2015):
• mixed waste and separately collected waste from households including (i) paper and
cardboard, glass metals, plastics, bio-waste, wood, textiles, waste electrical and electronic
equipment, waste batteries and accumulators; (ii) bulky waste, including white goods,
mattresses, furniture; (iii) garden waste, including leaves, grass clipping;
• mixed waste and separately collected waste from other sources that are comparable to
household waste in nature, composition, and quantity;
• market cleansing waste and waste from street cleaning services, including street sweepings,
the content of litter containers, waste from park and garden maintenance.
Figure 5.13 depicts the typical content regarding the percentage of MW. EU by its Waste Framework
Directive is requiring member states to promote waste prevention action plans, materials recycling
targets for the different waste streams, as part of the ambitious Circular Economy Package adopted.
Briefly, member states should achieve 65% recycling of MW, 75% recycling of packaging waste and
reduce landfill to a maximum of 10% of MW all by 2030 (European Commission, 2016a).

C H A P T E R 5 | E A R L Y S T A G E M O D E L F O R S U S T A I N A B L E D E S I G N – E A S Y M O D E
160
Figure 5.13 Municipal waste content shares. The exterior ring corresponds to the fractions that the waste should be sorted into, while the internal ring depicts the MW contents shares per weight (Bokalders & Block, 2010)
Portugal has implemented the PERSU 2020: Plano Estratégico para os Resíduos Urbanos 2014-2020, the
third version of the national plan to reduce waste production. This plan is in line with EU targets,
setting a decrease of 35% of biodegradable waste disposal on landfill, increase the preparation for
reuse, and recycling of municipal waste up to 50% and guarantee a minimum of 45 kg per capita of
waste selectively collected (INE, 2016). Studies show improvements in MW sorting, increasing waste
recycling rates and reducing waste to landfill, when separate waste streams are introduced near homes
and when awareness is raised (Miliute-Plepiene & Plepys, 2015; Rousta, Bolton, Lundin, & Dahlén,
2015; Shearer, Gatersleben, Morse, Smyth, & Hunt). Portugal has still a long way to go to reach the
established targets; the current proportion of MW that is still going to landfill is almost half (48.9%).
The MW being separately collected is 13.4% of the total MW produced. There are municipalities in
the country, such as Maia or Crato that have implemented great environmental policies, resulting in
the areas with greater proportions being diverted from landfill, 38% and 36% respectively.
To encourage families to reduce waste production and to recycle the one produced, it is fundamental
to provide enough storage areas within a home that reflect the users’ needs and the recyclable waste
streams that are collected separately by local waste authorities.
In this sense, the waste reduction indicator aims at reducing both production and landfill disposal of
waste. It is intended to drive designers providing sufficient interior and exterior waste disposal and
storage to promote waste recycling thus reducing landfilled waste, in the operational phase.
It is noteworthy that waste is also produced during construction and demolition phases. The latter will
be considered within the design for ease of disassembling. However, recommendations given for
construction can also be accounted for deconstruction and demolition.
Construction is one of the most relevant industry sectors for waste production, as already discussed in
the introductory chapters. In Portugal, it was responsible for the production of 627 997 tonnes of waste

E A R L Y S T A G E D E S I G N M E T H O D O L O G Y T O E N S U R E L I F E C Y C L E S U S T A I N A B I L I T Y O F R E S I D E N T I A L B U I L D I N G S
161
in 2015, from which, more than 95% was recovered (INE, 2015). Most of this waste is non-
hazardous (99%). Although construction waste represents an important share in the total waste
production, it has decided to consider it only in the recommendations of the tool, instead of evaluating
at this stage. This decision is greatly related to the difficulty of quantifying the amount of waste to be
sorted during construction at early design. However, recommendation on how to attain producing less
waste and recycling the one produced.
5.4.3.1 | Waste reduction in early design
Construction and operational waste are often considered in BSA tools, although not all account for
both. CEN EN 15643-2:2011 recommends accounting for waste to disposal and materials for
recycling, not specifying the life cycle phases of its production (CEN, 2011a). The methods used by
BSA tools to quantify both are diverse from each other. While operational waste quantification is made
mainly by feature indicators, addressing design adequacy to waste separation, construction waste is
accounted mainly by the amount of waste diverted from landfill. At early design, such approach for
construction waste is not possible.
At these stages, only directions on how to integrate dedicated space for fixed units to store recyclable
waste, during the design, and recommendations for construction waste management can be given. For
operational waste quantification, given the above-mentioned state of the art, the range of waste sorting
containers should be compatible with local authorities’ waste collection systems, thus to improve waste
recovery; typically, the following should be considered: paper and cardboard; plastics; glass; metals
(tins and cans); textiles (clothes and shoes); vegetable oils (from kitchen) and; batteries.
Considering the Portuguese waste collection system, plastics, and metals (packaging materials) are
collected together. Even though most local authorities do not collect composting material from homes,
it was decided to consider this fraction for separate collection because it has a great share on MW.
Composting can be done in the home, or the waste can be ceded to local community gardens or
neighbours until local authorities start collecting it if desired.
5.4.3.2 | Calculation procedure
Due to the unpredictability of waste generation, as these are independent of designers’ choices, only
the actions they take to promote recycling and waste reduction can be accounted in this indicator. For
this reason, the evaluation shall be feature based. Thus, this indicator follows the ‘effort approach’.
Three indicative performance levels were established, and each represents the commitment to
implement, two, three, and four or more measures depending on the target goal. Each effort is
intended to support designers finding the solutions to encourage occupants to reduce waste production
and recycle the one produced by providing appropriate well-suited waste storage (Table 5.13).

C H A P T E R 5 | E A R L Y S T A G E M O D E L F O R S U S T A I N A B L E D E S I G N – E A S Y M O D E
162
Table 5.13. Efforts considered to promote recycling and waste generation reduction.
Effort n. Description
1
Local authority for waste collection was been consulted to identify the waste collection patterns and design accordingly. (implement [2] if [1] is obtained).
[1] The building design will incorporate an external location suitable for waste collection and storage, according to the given number of recyclable streams, type, and size of waste collection containers
[2] The individual containers should have at least 40 l each (6,5 l/hab) and at least a total of 28 l/hab
2
Household waste recycling is promoted by planning at least one dedicated location for waste bins in the house internal space. If only one space is provided it should be in the kitchen (close to the non-recyclable waste bin) or located adjacent to the kitchen, e.g. in a utility room or connected garage.
[1] Provide waste containers corresponding to the number of recycling streams given by the authorities or, if none is said, at least three individual recycling bins (paper, glass, and packaging) Volume: 15 L or more, each (at least 18 L/hab total)
3 Household waste recycling is improved by planning additional measures
[1] Planning a reservoir for storage of vegetable oils (oil storage container).
4 [2] Planning a reservoir for storage of used batteries (used batteries container)
5
Organic household waste recycling is promoted through provision of dedicated external facilities for storage or composting of household compostable waste (either [1] or [2] should implemented).
[1] Provide external composting facilities [2] Adequate internal container space (large enough to hold at least a 7 l container), for storing segregated compostable organic material in the kitchen.
To promote and encourage occupants to recycle, it is essential to adequate household waste separation
to the local waste collection schemes. As Ando and Gosselin (2005) stated and Bernstad (2014)
defended more recently, convenience is a leading aspect in improving household waste separation. In
this sense, consulting local authorities to identify the waste collection patterns, to design the dedicated
waste separation space according to the given collected waste streams, was included, as an effort to
reward. This consultation should drive designers to determine exterior and interior spaces for the waste
containers needed.
Timlett and Williams (2009) concluded the absence of necessary conditions to take part in waste
recycling is a major obstacle for households to recycle. At the same time, these authors found that once
the recycling habit is implemented, it is hard to abandon it. In this sense, a rewarding effort was
established, to acknowledge the inclusion of a dedicated space with defined containers for waste
sorting, during design. This should follow the local authorities collecting system, or at least have three
containers other than the undifferentiated waste bin. Typically, those three should be for paper and
cardboard, packaging, and glass.
When designers account the individual collection of batteries, vegetable oil, and compostable
materials, diverting them from landfill, extra ‘points’ are given. Table 5.13 shows the efforts list
considered in this indicator and Table 5.14 presents the indicative performance levels.

E A R L Y S T A G E D E S I G N M E T H O D O L O G Y T O E N S U R E L I F E C Y C L E S U S T A I N A B I L I T Y O F R E S I D E N T I A L B U I L D I N G S
163
Table 5.14. Performance level description for waste reduction
Level Description Level 1 Two efforts should be implemented Level 2 Three efforts should be implemented Level 3 Four or more efforts should be implemented
Additional guidelines are provided to whoever wants to improve construction waste management and
recycling at this life cycle stage. The following examples are given in the EasyMode to divert waste
from landfill:
• Reducing onsite processing by using pre-cut materials, etc.;
• Sorting by-products;
• Reusing material on site (in situ or for new applications);
• Reusing material on other sites;
• Salvaging or reclaiming materials for reuse;
• Returning material to the supplier via a ‘take-back’ scheme;
• Recovering material from the site by an approved waste management contractor and
subsequently being recycled or sent for energy recovery.
5.5 | HEALTH AND COMFORT
Health and comfort category account for four indicators: (i) thermal comfort, (ii) visual comfort, (iii)
acoustic comfort and, (iv) indoor air quality. Next, the rationale and calculation procedure for their
inclusion in EasyMode is presented.
5.5.1 | Thermal Comfort
Thermal comfort is a key criterion when assuring occupants’ well-being within living spaces. At the
same, it plays a major role in the building’s design and systems required to regulate indoor
environment conditions (Wille & Woolf, 2015). Homes should be able to adjust for seasonal changes,
occupiers’ preferences, and for global climate change, which are predictable throughout the homes’
lifetime. ISO 7730:2005 defines thermal comfort as ‘that condition of mind which expresses satisfaction with
the thermal environment’, and it depends on the balance between the thermal energy of the body and the
surrounding environment. The indoor thermal condition is affected by the air temperature, mean
radiant temperature, relative air humidity, and air velocity. Intrinsic to occupants, there is clothing
(clo) and physical activity levels – metabolism (met). All these affect the perception of comfort.
Internal body temperature is maintained constant at 36.7ºC through metabolism, to compensate heat
lost to the surrounding. Clothing helps to control the heat exchange. When this balance is not kept
stable, the body temperature can raise or drop, promoting thermal stress situations which can lead

C H A P T E R 5 | E A R L Y S T A G E M O D E L F O R S U S T A I N A B L E D E S I G N – E A S Y M O D E
164
simply to thermal discomfort, which has not medical implications, or in more severe cases can lead to
hyperthermia and hypothermia.
Discomfort, either warm or cool, causes dissatisfaction. Individual differences enforce the impossibility
to specify a thermal environment that satisfies everybody; there will always be dissatisfied occupants.
Nevertheless, it is possible to design buildings where the indoor environment is predicted to be pleasant
to a percentage of the occupants (ISO, 2005). The quantification of this dissatisfaction is given by the
Predicted Mean Vote (PMV) and Predicted Percentage of Dissatisfied (PPD), following the calculation
methods described in ISO 7730:2005. PMV illustrates the mean value of the vote of a group of persons
regarding the thermal environment, through a seven-point thermal sensation scale. This scale was
developed by Gagge et al. (1994) as cited by (Mateus, 2009). PPD index predicts the number of people
dissatisfied with the thermal environment, those who feel warm, hot, cool, or cold (3, 2, -2, and -3 from
Gagge’s scale). Due to the individual constraints, even with a zero PMV, there will be a PPD of 5%.
EN 15251 established four thermal comfort categories according to the predictable indoor
temperatures. Category I regards the highest expectation level, being recommended for buildings for
very sensitive and fragile persons, where high comfort levels are needed. In contrast, category IV
corresponds to the lowest comfort level, as the temperatures are out of the desirable range and thus, it
should only be accepted for a limited period. Category II regards a good practice, being the
recommended when designing new buildings, as its temperature range meets the expectations of most
occupants (Mateus, 2009). For each category it is defined operative and recommended indoor
temperatures (for energy calculations) for both seasons (heating and cooling), PPD and PMV, the
vertical air temperature variance (head to ankle), the range of floor temperature, and the radiant
temperature asymmetry (CEN, 2007; ISO, 2005). Table 5.15, Figure 5.14 and Table 5.16 summarise
the design principles established.
Table 5.15. Recommended design values for indoor temperature of residential buildings with HVAC systems and temperature range for energy calculations (in bold are presented the recommended values for design for new buildings) (CEN, 2007)
Type of space Category
Operative temperature ºC Temperature range ºC Min. Heating season (~1.0 clo)
Max. Cooling season (~0.5 clo)
Heating season (~1.0 clo)
Cooling season (~0.5 clo)
Living spaces Sedentary ~1.2 met
I 21.0 25.5 21.0 – 25.0 23.5 – 25.5 II 20.0 26.0 20.0 – 25.0 23.0 – 26.0 III 18.0 27.0 18.0 – 25.0 22.0 – 27.0
Other spaces Standing/walking ~ 1.6 met
I 18.0 18.0 – 25.0 II 16.0 16.0 – 25.0 III 14.0 14.0 – 25.0

E A R L Y S T A G E D E S I G N M E T H O D O L O G Y T O E N S U R E L I F E C Y C L E S U S T A I N A B I L I T Y O F R E S I D E N T I A L B U I L D I N G S
165
Figure 5.14. Acceptable design values for operative indoor temperature during cooling season of residential buildings without cooling system, as a function of the exponentially-weighted running mean of the outdoor temperature (CEN, 2007)
Table 5.16. Recommended design values for PPD, PMV, Vertical air temperature difference between head and ankles, range of floor temperature (CEN, 2007; ISO, 2005)
Category
Thermal state of the body as a whole
Vertical air temperature differenceª
°C
Floor surface temperature
range
Draught rateb
Radiant temperature asymmetry ºC
PPD % PMV Warm
ceiling Cool wall
Cool ceiling
Warm wall
I < 6 -0.2 < PMV < 0.2 < 2 19 to 29 10% < 5 < 10 < 14 < 23
II < 10 -0.5 < PMV < 0.5 < 3 19 to 29 20% <5 < 10 < 14 < 23
III < 15 -0.7 < PMV < 0.7 < 4 17 to 31 30% <7 < 13 < 18 < 35
IV > 15 PMV< -0.7 or 0.7<PMV
> 4 < 17 to > 31 > 30% > 7 > 13 > 18 > 35
ª 1.1 and 0.1 m above the floor b percentage of people predicted to be bothered by draught
In the dynamic energy analysis, an hourly calculation shall be made according to EN 15251:2007. In
those, the midpoint of the temperature range should be used as a target value, although the indoor
temperature might fluctuate within the range according to the energy saving features or control
algorithm (CEN, 2007).
In Portugal, due to its climate conditions, it is possible to prevent overheating during the cooling season
with proper dimensioning of passive means, avoiding the need for mechanical cooling systems. As
presented in the passive design category, dimensioning and orientation of windows, solar shading,
thermal inertia, night cooling, etc., contribute to unplugged cooling. Therefore, CEN 15251:2007
recommendations presented in Figure 5.14 shall be adopted when designing new residential buildings.
Nevertheless, when the adaptive temperatures exposed cannot be assured only through passive design,
a mechanical cooling system should be previewed. In such cases, the recommendations to follow are
the ones shown in Table 5.15. For a building to be classified in a category, 95% of its usable rooms
cannot exceed the category’s operative temperature limits in more than 5% of the season period (CEN,
2007). Table 5.17 presents the recommended floor temperatures according to the finishing materials.
182022242628303234
8 10 12 14 16 18 20 22 24 26 28 30
COMFO
RTTEMPE
RATU
RE,To°C
RUNNINGMEANOUTDOOR TEMPERATURE,Trm °C
III_maxII_maxI_maxI_minII_minIII_min

C H A P T E R 5 | E A R L Y S T A G E M O D E L F O R S U S T A I N A B L E D E S I G N – E A S Y M O D E
166
Table 5.17. Comfortable floor temperatures (Olessen, 1997)
Floor construction1 Optional floor temperature
Recommended floor temp. interval – less than 15% dissatisfied
1 min 10 min 1 min 10 min Wooden floor used in the experiment 26.5 25.5 23 28 Concrete floor used in the experiment 28.5 27 26 28.5 Textile layer 19 24 20 28 Wilson-carpet 21 24.5 21 28 Sisal carpet 23 25 22.5 28 Needled felt sheet 22 25 22 28 5 mm cork 24 26 23 28 Pinewood floor 25 25 22.5 28 Oakwood floor 26 26 24.5 28 Vinyl-asbestos tile 30 28.5 27.5 29 PVC-sheet with felt underlay 28 27 25.5 28 2.5 hard linoleum on wood 28 26 24 28 Painted concrete floor 30 28.5 27.5 29 Marble 30 29 28 29.5
1 – under-layer assumed as concrete
5.5.1.1 | Thermal comfort in early design
This indicator aims to encourage a thorough consideration of thermal comfort-related aspects, early
in the design, as they are crucial for the occupiers’ well-being and reveal the need for additional
measures to manage unpleasant thermal environments aiding to design and implement them.
Aiming for a more sustainable building, to assure thermal comfort, passive design measures should be
applied during design. Main recommendations to improve thermal comfort corroborate the design
principles described in the passive design category, such as:
• Great insulation levels, minimal thermal bridges, and high-performance windows;
• Exceptional airtightness levels;
• Openable windows and ventilation devices to promote natural cross ventilation;
• Solar shading.
Wille and Woolf (2015) suggested the use of Table 5.16 parameters and the risk of overheating to
perform the thermal comfort assessment. Additionally, it is suggested using the Table 5.15 reference
values to complement and ease the evaluation at early design stages. It is important to bear in mind
that highly insulated dwellings are at risk of overheating in cooling seasons, thus efforts must be taken
for whole life design optimisation (McLeod, Hopfe, & Kwan, 2013; Zero Carbon Hub, 2016). When
looking to BSA tools, thermal comfort evaluations, is alike among different tools and requires data
from energy and thermal analysis, as expected. For instance, SBToolPT-H considers only the operative
indoor temperatures while DGNB also considers draught, asymmetry of radiation temperature and
flooring temperature, relative humidity and, vertical thermal gradient.

E A R L Y S T A G E D E S I G N M E T H O D O L O G Y T O E N S U R E L I F E C Y C L E S U S T A I N A B I L I T Y O F R E S I D E N T I A L B U I L D I N G S
167
To cope with EasyMode premises, this approach cannot be followed because, at the time EasyMode is
intended to be used, no thermal analysis have been carried out. Moreover, the adoption of passive
design measures was already considered in indicator I.19. Thus, a qualitative approach was chosen to
evaluate the thermal comfort indicator in EasyMode. It is based on the parameters recommended for
each of the categories for thermal comfort.
5.5.1.2 | Calculation procedure
For the assessment of thermal comfort, the following criteria are evaluated:
• Operative temperature (heating and cooling seasons) – it is intended to evaluate the occupiers
comfort temperature.
• Vertical temperature difference – vertical temperature variance between ankles and neck, as
a high difference can cause discomfort. The sub-indicator evaluates this variance.
• Floor surface temperature range – if the floor is too cool or too warm, it can cause discomfort,
especially when using light indoor shoes. The sub-indicator assesses the intended floor
temperature.
• Radiant temperature asymmetry – A high radiant asymmetry caused by warm or cool walls
and ceilings can be uncomfortable. This sub-indicator qualifies those temperatures.
• Draught rate – the existence of draught can drive to uncomfortable spaces. This sub-indicator
evaluates the percentage of people predicted to be bothered by draught.
Here, only efforts and intentions are addressed. Designers shall indicate the thermal comfort category
they are willing to attain and, based on that, indicative performance levels are given following the
qualitative approach. Indicative performance levels follow the inverse performance of each category,
meaning that Level 1 corresponds to category IV and Level 4 corresponds to category I (Table 5.18).
Each parameter is addressed individually; no aggregation or weighting is taken. The requirements are
the ones presented in the previous Table 5.15, Table 5.16 and Figure 5.14.
Table 5.18. Performance level description for thermal comfort
Level Description Level 1 Attain Category IV requirements Level 2 Attain Category III requirements Level 3 Attain Category II requirements Level 4 Attain Category I requirements
The four sub-indicators are presented to designers whom shall select the level to attain or specify the
design values sought. The tool will then identify the category to follow or in which level the input
values are within, following the qualitative approach assessment. In the case of operative temperature,
heating and cooling seasons are addressed separately. In addition, the tool users need to indicate if a
mechanical cooling system is to be implemented or not, following different recommendations

C H A P T E R 5 | E A R L Y S T A G E M O D E L F O R S U S T A I N A B L E D E S I G N – E A S Y M O D E
168
accordingly. After identifying one solution, users are asked if alternatives should be introduced, and
then results are compared.
5.5.2 | Visual Comfort
Daylight is a key aspect of health conditions and is one of the most sought-after qualities of a home
(BRE, 2015). Lighting in a building can have three main functions: health and safety, visual
performance, and aesthetics (Howarth, 2005). Exposure to light is essential for several physiological
processes, such as maintenance of circadian rhythms, sleep quality, balances mood, reduce depression,
and other psychic conditions. Furthermore, light brings a sense of safety, and daylight provision inside
buildings provides well-being through contact with the outside. Secondly, the light should be sufficient
in a room to allow a task to be properly performed. There are existing standards, recommendations,
and regulations for the illuminance needed in different indoor workspaces, accounting for flicker, glare,
luminance, illuminance, colour rendering, or daylight entrance. A pleasant environment contributes
to reducing stress and improve work productivity.
Beyond psychologic and biologic benefits, promoting daylight in indoor environment contributes to
energy savings (Hunt, 1980; Richardson, Thomson, Infield, & Delahunty, 2009). Hunt (1980)
previewed the probability of switching on the lights according to the time of the day and the daylight
factor of the room (Figure 5.15), adjusted by an orientation factor.
Figure 5.15. Probability of switching on the lights depending on daytime, daylight and orientation (Hunt, 1980)

E A R L Y S T A G E D E S I G N M E T H O D O L O G Y T O E N S U R E L I F E C Y C L E S U S T A I N A B I L I T Y O F R E S I D E N T I A L B U I L D I N G S
169
Average Daylight Factor (ADF) means the “ratio of total daylight flux incident on the working plane,
expressed as a percentage of the outdoor illuminance on a horizontal plane due to an unobstructed”
(ISO, 2004) and can be calculated through the simplified equation (Eq. 5.27) as proposed by Littlefair
(1998) (as cited in Mateus & Bragança, 2016). Table 5.19 shows the recommendations of
BS 8206-2:2008 (BSI, 2008) for ADF in dwellings.
Q5z =Å ∙ QS ∙ Ö ∙ _Q ∙ (1 − !)N
Eq. 5.27
where M is a correlation factor for dirt; Aw is the total area of all windows or roof lights (not including
frames); θ is the angle of the visible sky; T is the glass transmittance factor; A is the total area of interior
surfaces and; R is the weighted average reflectance of interior surfaces.
Table 5.19. Recommended average daylight factors for dwellings (BSI, 2008)
Room ADF
Average Minimum Kitchen 2.0% 0.6% Living rooms (living room, dining room, home office, etc.) 1.5% 0.5%
Bedrooms 1.0% 0.3%
ADF can be used to evaluate the perception of how a room is illuminated. Brotas and Wilson (2007)
summarise the rule of thumb for the ADF values, which are also recalled by the British standard BS
8206 (Mooney, 2010) corroborating Hunt (1980) findings:
• Below 2%, additional artificial lighting is required during daylight time;
• Between 2% and 5% space will be lit, though artificial lighting may be required for visual
accuracy;
• Above 5% space will be significantly illuminated, and artificial lighting will sparingly be
needed. However, it might compromise the buildings’ thermal behaviour, leading to
additional energy needs.
The same authors presented a new parameter – Average Total Daylight Factor (Ö5) – which could be
used at early design stages, as a useful and expedite method to estimate the window sizes, as these are
directly proportional, according to the desired daylight income. An initial estimation of Ö5 as a quarter
of the recommended ADF was proposed. Ö5 is obtained through the equation Eq. 5.28.
Ö5 =à ∙ QS ∙ ÖQ ∙ (1 − !)
Eq. 5.28

C H A P T E R 5 | E A R L Y S T A G E M O D E L F O R S U S T A I N A B L E D E S I G N – E A S Y M O D E
170
where k is the ratio of total vertical illuminance (Etv) to global horizontal illuminance (Egh), Aw is the
net glazed area of windows; T is the diffuse light transmittance of glazing; A is the total area of interior
surfaces and; R is the weighted average reflectance of interior surfaces.
Even though, Brotas and Wilson (2007) recommend the use of this parameter at early design stages,
its direct use in EasyMode is not possible, as the total area of interior rooms is not available. Still, recall
on Ö5 can be made, encouraging its use to estimate the glazing area needed.
BSA tools, such as CSH and SBToolPT-H, use ADF as a mean to quantify the visual comfort. ISO has
an underdevelopment standard for daylight opening design process in order to ensure sustainability
principles in visual environment.
More than just following a requirement compliance approach, designers should work for ensuring
good daylight and low energy consumption through integrated design process. A well-designed
building enables daylight enhancement without jeopardising energy efficiency. The level of daylight
entering a building deeply depends on how the building is conceived: windows’ size and position,
rooms’ proportions, building’s orientation, finishing coatings, etc. Thus, during design, there are
several measures than can be put into practice to deal with daylight designing properly. For instance,
preferring tall narrow windows provides better daylight distribution than low wide ones, or use light
shelves shading the main part of a window but enabling light to reach deeper points in a room (Brophy
& Lewis, 2011). Other solutions beyond windows can be sought to improve daylit spaces. Roof lighting,
for instance, is an effective source of daylight. Additionally, light re-directing systems contribute to
improving spatial natural light distribution, minimising the perceived need for artificial lighting.
5.5.2.1 | Visual comfort in early design
Designing for daylight improvement requires the involvement of the different stakeholders – architects,
thermal engineer, contractor, sustainability advisor – early in the project, and should be considered
from the very onset. Solving poor daylighting at later stages is an unsuccessful task. Early in the project,
it is possible to use the rule of thumb measures to aid instant feedback and then use simulation methods
to improve data accuracy (The Department of the Environment, 1998). Also, strategies, as the
following examples can be thought out:
• Use of daylight systems other than windows:
o Skylights;
o Solar ducts;
• External reflectors;
• Reflective blinds;
• Atrium;
• Avoid high depth rooms;

E A R L Y S T A G E D E S I G N M E T H O D O L O G Y T O E N S U R E L I F E C Y C L E S U S T A I N A B I L I T Y O F R E S I D E N T I A L B U I L D I N G S
171
• Select tall and narrow windows instead of low wide ones;
• Preview shading systems, to both, avoid spaces from overheating during summer and allow
daylight income.
In BSA tools, such as SBToolPT-H and CSH the average daylight factor is used as a mean to evaluate
the visual comfort of homes. CHS also considers the income of direct light in at least 80% of working
areas of kitchens and living rooms.
5.5.2.2 | Calculation procedure
The aim of visual comfort indicator in EasyMode is to promote the access to daylight, which aids
improving inhabitants' wellbeing and life quality and reducing costs and energy spent on artificial
lighting. Foreseeing daylight during early design, it would improve the occupiers’ comfort, health,
wellbeing, and reduce costs and environmental impacts resulting from artificial lighting.
As an easy way to give advice on daylight design and recommendation on the ADF to attain were
established as a qualitative measure for visual comfort. Considering the existing recommendations and
studies abovementioned three indicative performance levels were established (Table 5.20). To avoid
the use of artificial lighting for visual enhancement, and additional effort was established, meaning that
if designers attain to at least 80% of the working plane in the kitchen and living areas receive direct
light from the sky. If the thresholds of a level are achieved and the additional effort is attained, then
the following level is given. An ADF of 3% to attain level 3, was considered as the one to be used in
Portugal not to comprise the energy efficiency performance by Santos (2001) (as cited in Mateus, 2009).
As in similar indicators, designers shall either indicate the level to attain and be retrieved with which
requirement to follow or indicate the foreseen ADF value they are willing to attain and be retrieved
with the corresponding indicative performance level. As in the other indicators, design alternatives can
be tested, and results can be compared. As soon as EN 17037 is released, the evaluation process shall
be revised to follow the standard recommendations.
Table 5.20. Performance level description for visual comfort
Level Description
Level 1
ADF should be at least: • 2.0% in kitchens; • 1.5% in living rooms; • 1.0% in bedrooms
Level 2 All rooms should have an ADF of at least 2%
Level 3 All rooms should have an ADF of at least 3% And at least 80% the working plane in kitchen and living rooms receives direct light from the sky.

C H A P T E R 5 | E A R L Y S T A G E M O D E L F O R S U S T A I N A B L E D E S I G N – E A S Y M O D E
172
5.5.3 | Acoustic Comfort
An import aspect of homes and their design is the ability to create comfort and pleasant indoor
environments. This aim is only achieved if noise is managed adequately. Exposure to high levels of
noise affects health and wellbeing both, temporary and permanently, in more severe cases. Continued
exposure to noise may induce health problems such hypertension, stress, sleep disorders, fatigue,
hearing loss, cardiac rhythm increase, anxiety, irritability, and other biological effects.
Sound insulation performance requirements for urban and building scales can be found in General
Regulation of Noise 6 (RGR) – Decree-law n. 9/2007 – and Regulation of Acoustic Requirements of
Buildings 7 (RRAE) – Decree-law n. 96/2008. The first stipulates the maximum noise levels per
activity, controlling noise pollution aiming at protecting health and well-being conditions. The second
regulates the acoustic comfort within buildings. It establishes the minimum requirements for sound
insulation of the different building elements, protecting the indoor environment from exterior noise.
Within a dwelling, there are no legal recommendations for the sound insulation between rooms.
Table 5.21 depicts legal requirements applied to family buildings. Within these, sound insulation
indexes do not imply, unless for equipment born noise.
Table 5.21. Legal requirements for sound insulation in dwellings
Elements Insulation index Envelope Sensible zone D2m,n,w ≥ 28 dB Mixed zone D2m,n,w ≥ 33 dB Equipment LAR ≤ 27 dB (A) (continuous operation) Living rooms and bedrooms LAR ≤ 32 dB (A) (intermittent operation) LAR ≤ 40 dB (A) (emergency generator)
5.5.3.1 | Acoustic comfort in early design
Most BSA tools when evaluating acoustic comfort, consider only outside born noises. One can say that
this is reasonable as, assessing homes, it is one’s responsibility to either to make noise or not. Also,
regarding noise definition, a sound is only considered as a noise if it has no interest for the listener.
Thus, within a home, if inside born noise does not compromises the surroundings, and it is pleasuring
within the home, it makes no sense to account for it in a BSA. However, not all the sound born within
a dwelling is pleasant for its occupiers, such as apparatus noises, or enabling living areas noise not to
disturb other sound sensitive spaces (p. ex. bedroom). In this sense, in EasyMode, rather than just
6 Regulamento Geral do Ruído 7 Regulamento dos Requisitos Acústicos dos Edifícios

E A R L Y S T A G E D E S I G N M E T H O D O L O G Y T O E N S U R E L I F E C Y C L E S U S T A I N A B I L I T Y O F R E S I D E N T I A L B U I L D I N G S
173
promoting noise insulation for external noises, it is intended to stimulate designers to control noise
within the home, promoting quiet environments and enabling people to use their homes pleasantly.
5.5.3.2 | Calculation procedure
Acoustic comfort indicator is intended to encourage the adoption of highly sound insulated solutions,
reducing noise disturbance from inside and outside born sounds. The aim is to improve the occupants’
comfort, health, and wellbeing conditions, and promote social cohesion between neighbours. As
dealing with detached dwellings, legal requirements are only applied to the sound insulation index of
exterior airborne noise. Going beyond legal requirements and aiming at improving occupiers’ comfort,
weighted sound pressure level and the sound insulation index for internal noise are also addressed.
To establish the preferable levels the requirements and premises of RGR and RRAE were used. In
the case of the sound insulation index for exterior airborne noise, surpassing the minimum legal value
was considered as the lower level. For the other two levels, an increment of 3 dB and 6 dB, regarding
the value of the mixed zone regulation, was considered, respectively for Level 2 and 3. The increase
of 3 dB and 6 dB are equivalent to reducing half and for a quarter, the sound energy that reaches the
receptor, respectively. This principle was used for the other two parameters. Table 5.22 presents the
preferable levels for the three parameters considered in Acoustic comfort.
Sound insulation for internal walls and floors’ performance levels, were defined considering the
minimum requirements for sound insulation for partition walls between two dwellings. Nevertheless,
it was considered that within the same home, the requirements could be not so tight and thus, a
reduction of 2 dB for Level 3 was considered. In order not to compromise comfort, the other two levels
were established reducing 3 dB and 5 dB from Level 3 to Level 2 and Level 1, respectively.
In the case of indoor sound pressure level, it was decided to consider different levels for the different
areas of the home (living areas and bedrooms), to assure quiet environments and the possibility to rest
without disturbance from other rooms in the house. Systems such as heating or ventilation and supply
infrastructure may increase the noise levels of the home. Though, if careful design, selection and
commissioning those impacts can be minimised. In this sense, the evaluation or consideration of
internal noise level should be regarded as having those systems working.
The preference levels were established considering the range recommendations of EN 15251:2007
(CEN, 2007). In this case, the ‘3 dB rule’ was not applied to respect the range given in the standard,
and to include the default design value in the intermediate level.

C H A P T E R 5 | E A R L Y S T A G E M O D E L F O R S U S T A I N A B L E D E S I G N – E A S Y M O D E
174
Table 5.22. Preference levels for acoustic comfort
Level
Description
Sound insulation level for exterior airborne noise (dB)
Sound insulation for internal walls and floors (dB)
Indoor weighted sound pressure level (dB (A))
Living rooms Bedrooms (at night time)
Level 1 D2m,nT,w > 331 D2m,nT,w > 282 43 ≤ DnT,W < 45 40 ≤ LAReq < 36 35 ≤ LAReq < 30
Level 2 36 ≤ D2m,nT,w < 39 45 ≤ DnT,W < 48 36 ≤ LAReq ≤ 32 30 ≤ LAReq < 25 Level 3 D2m,nT,w ≥ 39 DnT,W ≥ 48 LAReq < 32 LAReq ≤ 25
1 - mixed zone | 2 – sensible zone
Following the method used in the previous indicators, through the quantification approach, designers
shall either, indicate the level to attain, receiving the requirements for that level or indicate the specific
value for each parameter, getting the corresponding level. Alternatives can be added.
5.5.4 | Indoor air quality
Indoor air quality (IAQ) is an essential aspect of any building, not just for homes. It is a major
determinant of populations’ health and wellbeing. Today, when most of one’s time is spent indoors,
exposure to airborne pollutants can endanger occupiers’ health. Respiratory diseases, allergies,
poisoning, infectious diseases, or productivity decrease can all be related to indoor pollution. Everyone
has the right to healthy indoor air (WHO, 2000).
Several building materials, such as coatings, furnishings or even cleaning products release several
substances that can be toxic for the buildings’ occupiers, especially volatile organic compounds (VOC).
A wide range of VOC can be emitted during the first years of the building add, afterwards, cleaning
products can represent a continuous source of them. Thus, the amount of released pollutants can be
reduced by selecting low pollutant content and low emission products. The toxicity of VOC varies;
not all VOC are toxic and some in small concentrations can be harmful. In this sense, whenever
possible, VOC should be evaluated individually.
Nevertheless, there are other substances, gaseous or solid, that can pollute the indoor environment.
The WHO established guidelines for IAQ focusing on different chemicals, such as various VOC,
radon, nitrogen dioxide, or carbon monoxide (WHO, 2010).
Ventilation also plays a major role in assuring IAQ. Whenever this is not sufficient to dilute and remove
pollutant substances, IAQ will be compromised. Also, ventilation can itself be a source of indoor
contamination, if systems maintenance is neglected (Keeler & Vaidya, 2016). Natural ventilation
should be primarily preferred instead of mechanical ventilation. It can be equally efficient in assuring
IAQ while not needing energy consumption.

E A R L Y S T A G E D E S I G N M E T H O D O L O G Y T O E N S U R E L I F E C Y C L E S U S T A I N A B I L I T Y O F R E S I D E N T I A L B U I L D I N G S
175
Microbial growth is also an important aspect to consider. Mould formation originates in improper
design and constructions, from condensations or leaks of the building enclosure. Legionella can also
arise if watering systems are not appropriately maintained and commissioned.
5.5.4.1 | Indoor air quality in early design
In this sense, design decisions are crucial for IAQ, and this should be considered from the early stages.
Integrated design should be followed when approaching IAQ goals, as it interferes with different
specialities, architects, structural, thermal, and mechanical engineers, and interior designers. Some of
the initial goals can focus on (Keeler & Burke, 2009; Mateus & Bragança, 2006):
• Building orientation, location of openings;
• Selection of HVAC system;
• Selection of ventilation rates, ensuring adequate ventilation and comfort;
• Determination of thermal requirements;
• Design enclosure to minimise condensations, and water infiltration;
• Establishment of commissioning program;
• Selection of low-emission coating materials, water-based instead of solved-based;
• Prefer natural wood and fibreboards without formaldehyde;
• Favour materials without chlorofluorocarbons (CFC) and hydrochlorofluorocarbons (HCFC);
At early design, it is not possible to quantify the concentration of air pollutants, as data is unavailable,
and thus, only recommendations on how to avoid them and reference concentration values can be
given and assessed. The focus in this indicator was given to chemical substances emitted by building
materials and to ventilation. Other design aspects that may influence IAQ are addressed in the passive
design indicator.
Thus, this indicator in EasyMode accounts for airborne emissions, through a feature indicator approach.
5.5.4.2 | Calculation procedure
The IAQ indicator aims at improving indoor health and wellbeing by avoiding the emission and
formation of indoor air pollutants within the building. Through proper IAQ design, occupiers’
exposure to air pollutants is reduced and awareness is raised to indoor air pollutants from building
furnishings and cleaning products.
Airborne emissions
The aim of this sub-indicator is to minimise the emissions from building materials products. This is
quantified through the efforts approach. Designers should compromise in selecting low-emitting

C H A P T E R 5 | E A R L Y S T A G E M O D E L F O R S U S T A I N A B L E D E S I G N – E A S Y M O D E
176
finishing materials. Table 5.23 list the efforts to attain. Awareness is raised for WHO recommended
exposure rate (< 0.05 mg/m3) for home of formaldehyde. The performance levels were established
according to Table 5.24.
Designers shall either indicate the level they are willing to attain, receiving the requirements for that
level or indicate the specific efforts to attain, getting the corresponding level. Alternatives can be added
and compared.
Table 5.23. Efforts for selecting low emissions building products
No. Efforts
1 Wood-based products have a E1 classification according to EM 13986 (formaldehyde concentration ≤ 8mg/100g) or 0.08 mg/m3)
2 Interior paints and varnishes have VOC content not greater than 8% (in mass) 3
A formaldehyde content not greater than 0.06 mg/m3
Flooring materials 4 Ceiling, walls, and insulation materials 5 Interior adhesives & sealants
Table 5.24. Preference levels for airborne emissions
Level Description Level 1 Two efforts from list should be implemented Level 2 Three efforts should be implemented Level 3 Four or more efforts should be implemented
5.6 | FUNCTIONALITY
The Functionality category encompasses indicators related to easiness in using the building, as its
suitability for its users, accessibility, or maintenance. It comprises four main indicators:
• Space efficiency;
• Adaptability and flexibility;
• Accessibility;
• Maintenance.
In the next sections, a description of these indicators is presented as well as the calculation procedure
to account them in EasyMode.
5.6.1 | Space Efficiency
Space efficiency (SE) is often related just to land use issues. However, it goes well beyond that, and it
is not a frequent issue on the buildings projects’ agendas (Wilde & Dobbelsteen, 2004). High SE is
fundamental to boost sustainable built environment, as it affects the accomplishment of the goals
defined for the three sustainability cornerstones. The correlation of SE and the environment is

E A R L Y S T A G E D E S I G N M E T H O D O L O G Y T O E N S U R E L I F E C Y C L E S U S T A I N A B I L I T Y O F R E S I D E N T I A L B U I L D I N G S
177
undeniable and quite accepted. The fewer land use per capita the more ‘environmental friendly’ the
building is, less materials consumed, less raw materials exploited and less natural soil disturbed. The
smaller the area is, the less amount of energy will be required for heating and cooling, lighting,
ventilating, etc. It is possible to have the same usable area with less land use, if appropriate construction
solutions are chosen and if good design is performed (Luís Bragança, Joana Andrade, & Ricardo
Mateus, 2016). In the economic side, greater profitability is possible with higher SE, especially in areas
where property prices are high. Besides, construction and operational costs can reduce if SE is
improved, and restricted areas can be avoided. Social aspects are the ones most influenced by SE. User
satisfaction, productivity, or well-being are all affected by SE. An efficient space enables pleasant
indoor environment and clearly arranged design.
The space efficiency of any building depends on three factors: (i) amount of space, area, or volume,
(ii) actual and potential number of users and, (iii) space usage duration.
Space planning and efficiency should be a conscious target of a housing project as it is crucial for its
design. It should take into account user satisfaction, building’s primary function, and not just the ratio
of gross floor area to net floor area, so to promote informed decision-making and more efficient spaces
(UK Higher Education Space Management Group, 2006). Inhabitants’ life quality can enhance
through well-designed space planning and room arrangement. Housing is a process, not something
static; it is in constant actualisation and evolution. Lifestyle necessities and the number of inhabitants
constrain the amount of space required in housing. A floor plan that meets the needs of a young couple
may not satisfy the necessities of an elderly one requiring a more accessible space. People and their
lifestyles change over time. Thus, if a floor plan is well designed, it could satisfy households for longer
periods, perhaps throughout their entire lifetime. This ability to adapt recalls design for life concept
that is closely related to efficient space planning and space adaptability (Memken, Gdrber-Dyar, &
Crull, 1997; Roberts-Hughes, 2011).
Although the outline of two or more building alternatives can be similar in the overall area and volume,
the way space is distributed, and the internal layout is made, can easily constrain the available usable
area (Ashworth & Perera, 2015). Hence, beyond construction solutions choices or area limitations by
legal requirements, the designer role is crucial for a fruitful and efficient space planning.
When dealing with homes and their usable space, it is relevant to analyse how families are living in
their houses. According to the last Census 2011, Portugal has about 5 879 756 households from which
3 991 112 are Classic Family Households (CFH). A single or multiple rooms in a permanent building
compose a CFH, having an independent entrance with direct access. An average CFH has 109.02 m2
of usable area (flats and dwellings).
In Portugal, the average number of family members is 2.58, which is a little higher than the European
average, 2.4 (INE, 2014a; Oliveira, 2012). If the average Portuguese family has 2.58 people, the

C H A P T E R 5 | E A R L Y S T A G E M O D E L F O R S U S T A I N A B L E D E S I G N – E A S Y M O D E
178
average usable area per capita would be 42.25 m2. Nevertheless, this value is not realistic and using it
would be imprudent. These values are quite significant compared to what was expected. This variance
might express that the Portuguese housing quality is improving and, at the same time, it reflects a
reduction in the number of people in a family core. It is important to mention that, more than one-fifth
of the families is nowadays one-person family, while the classic families (2 people) are less than
one-third, and the nuclear families are less than fifty percent. The Census statistic also shows that
classic families with five or more people are only 6.5% of the total amount of classic families.
Figure 5.16 presents the distribution of the Portuguese families’ dimensions. Figure 5.17 shows the
distribution of classic Portuguese families8 per usable area echelon per inhabitant. Census do not
differentiate the different areas’ typologies, nor the type of dwellings (detached, from flat). Thus, it is
not possible to estimate the averages areas – gross external area, net internal area, and net usable area
- for a housing typology only through census data. Also, it does not allow an estimation of the available
square metres per person.
Figure 5.16. Distribution of classic families per dimension (n. of family members) in the Portuguese CFH; decennial 2011 (INE, 2014a)
Figure 5.17. Distribution of classic families per usable area echelon per inhabitant, in the CFH in Portugal; decennial 2011 (INE, 2014a)
8 Group of people who live together in the same dwelling and be kinfolk, being able to occupy the whole dwelling or just part of it. It is also considered as a ‘classic family’ any independent person whom occupies a whole dwelling or just part of it (INE, 2014a).
21.4%
31.6%
23.9%
16.6%
6.5%
1 person
2 people
3 people
4 people
5 or more people
1.9% 2.9% 7.3%
15.3%
19.8% 27.3%
10.4%
15.1% less than 10m²
10m² to less than 15 m²
15m² to less than 20 m²
20m² to less than 30 m²
30m² to less than 40 m²
40m² to less than 60 m²
60m² to less than 80 m²
80m² or more

E A R L Y S T A G E D E S I G N M E T H O D O L O G Y T O E N S U R E L I F E C Y C L E S U S T A I N A B I L I T Y O F R E S I D E N T I A L B U I L D I N G S
179
Oliveira (2012) characterised the Portuguese housing stock, verifying that the average areas of
Portuguese detached houses were the ones presented in Table 5.25. These figures are quite bigger than
the minimum requirements set by the Portuguese regulation – RGEU. The author also determined
the ratios of area per capita, presenting them both for the net internal area (NIA) and net usable area
(NUA) per capita, 28.83 m2 and 20.00 m2, respectively. This means that the NUA per capita is 30% less
than the NIA per capita. Noteworthy, the NUA per capita was found to be equal regardless the house
typology and number of rooms, contrarily to the other ratio. The size of homes has been increasing
throughout the years. If the average area before 1945 was 86.58 m2, nowadays is 151.59 m2 (Enerdata,
2016). According to the same database, the average usable area per capita in residential buildings was
38.59 m2. This author also presents the averages areas for hygiene, living and working, circulation,
household tasks, rest, and exterior (Table 5.26).
Table 5.25. Average areas for Portuguese detached houses (Oliveira, 2012)
Area Average (m2) % Gross external area 255.15 100.00 Net internal area 173.00 68.04 Net usable area 122.08 44.78
Table 5.26. Average areas for Portuguese detached houses, for principal activities performed within the home (Oliveira, 2012)
Area Average (m2) % Hygiene area 16.68 9.64 Living and working area 28.94 50.06 Circulation area 14.97 25.90 Household activities area 13.14 22.7 3 Rest area 33.32 57.64 Exterior area 10.83 -
BSA tools rarely address space efficiency, with this terminology. Instead, they often account for land
use. This latter is given by the ratio of the total usable area with the gross floor area. DGNB, Open
house* and CSH consider this ratio. CASBEE considers space efficiency, accounting for the interior
usable area – ‘size and layout of rooms’. The aim is to ‘evaluate the appropriate size of the floor area of the
house and whether the core living rooms are secured’ (Institute for Building Environment and Energy
Conservation, 2008). The goal is to have at least 55 m2 per inhabitant plus 25 m2 for each additional
inhabitant. Open House* and DGNB* follow the same procedure. Both state that the area should be
handled as economical as possible but, at the same time, promoting environmental optimisation and
contributing to improving social sector through interaction in the working environment. They address
area efficiency through the ratio of the usable floor area to the total floor area. SBToolPT for office
buildings – SBToolPT-S – addresses “land use efficiency” not area efficiency. Nevertheless, the goal is
similar to Open House* and DGNB*. SBToolPT-S does not address how the built area is used. It
recognises buildings with high built area, even if it is not considered as net usable area. The version of
SBToolPT for homes – SBToolPT-H – has a similar calculation method.

C H A P T E R 5 | E A R L Y S T A G E M O D E L F O R S U S T A I N A B L E D E S I G N – E A S Y M O D E
180
5.6.1.1 | Addressing space efficiency in pre-design
The way a building is designed, its geometry, rooms’ arrangement, and other layout aspects might
influence area efficiency. Moreover, to the author’s understanding space efficiency, in particular, the
ratio of GEA to NIA, and to NUA, may also be influenced by the construction solution used. Different
construction solutions require different spaces, due to beams, columns, and other compounds. The
thickness of a wall in brick masonry or plasterboard with steel framed structure varies, and hence, the
available area to be effectively used will vary. Typically, external masonry walls have 30 cm thickness,
while lighter solutions as light steel framed solutions have around 20 cm (Bragança & Mateus, 2012).
This means that using a cold-formed steel structure wall instead of masonry will save one-third of the
area occupied by the latter. This area will then be available to improve rooms’ usable area.
At early design stages, it may not be yet defined the exact number of rooms (that lead to the net usable
area) or even the net floor area. A parametric study was carried out, seeking to analyse if the ratio of
net floor area to gross floor area was dependent on the construction typology and if there was a trend
for the ratio value to any construction typology. To the author knowledge, there are no studies relating
building construction solutions to the buildings’ ratio of GEA to NIA and to NUA. With this in mind,
several single, family dwellings were investigated according to their construction technology, to
evaluate a possible relation between GEA and NIA and/or NUA according to its construction
typology.
The aim of this work was to have a mathematical formula to aid designers understanding how they
could improve space efficiency before defining the rooms disposal and area.
The construction solutions analysed were:
• timber framed;
• light steel framing;
• stone masonry and timber;
• reinforced concrete and brick.
Table 5.27 presents the principal characteristics and materials of each typology and their core role in
the building components.

E A R L Y S T A G E D E S I G N M E T H O D O L O G Y T O E N S U R E L I F E C Y C L E S U S T A I N A B I L I T Y O F R E S I D E N T I A L B U I L D I N G S
181
Table 5.27. Construction Technologies main characteristics.
Main structure
External walls
Interior walls
Ground floor
Upper floor Roof
Timber building Timber
Timber frame; OSB; rock wool; ETICS; plasterboard
Timber; OSB; plasterboard; cork insulation
Mortar slab Timber; beams; OSB
Timber beams; OSB
Timber trusses and beam
Light steel framing Light steel
OSB; rock wool; ETICS; gypsum board
Gypsum board; rock wool
Mortar slab, XPS, cast concrete, OSB, air cavity, rock wool, Gypsum board, steel
OSB, air, rock wool, gypsum board, light steel
Plaster board, reinforced concrete, corrugated sheet, anti-condensation membrane, gravel
Stone masonry and timber
Stone masonry
Stone masonry
Timber; OSB; gypsum board
Timber beams
Timber beams
Timber trusses and beams
Concrete Reinforced concrete
Reinforced concrete
Reinforced concrete
Reinforced concrete
Reinforced concrete
Reinforced concrete
Parametric analysis and formula calibration
For the abovementioned, an attempt was made to calibrate a relation between NIA and NUA, and
GEA depending on the construction technology. To do so, seventy real single family building projects
were analysed. Table 5.28 lists the distribution of the examined buildings per their construction
technology. To have an analysis as close as possible to reality, different building sizes were addressed
for each construction technology. All the buildings were analysed in a view to getting the following
("Decreto-Lei n.º 38:382/1951," 1951; UK Higher Education Space Management Group, 2006):
• gross external area, GEA9;
• gross internal area, GIA10;
• net internal area, NIA11;
• net usable area; NUA12;
• walls area, WA13;
• non-usable area, nUA14.
9 Gross External Area (GEA) – total surface of the building, measured externally at each floor. It includes all spaces within the building, as balconies, ancillary areas, roof terraces, and perimeter wall thickness 10 Gross internal area (GIA) – area of the building measured to the internal perimeter of the envelope walls, at each floor. It includes all the internal areas, including the internal and partition walls thickness. It excludes envelope walls thickness and external areas as balconies or terraces 11 Net internal area (NIA) – The sum of the room areas within a building. It includes usable areas, vertical and horizontal circulation area, embedded furniture, ancillary rooms, and sanitary facilities. It excludes the thickness of internal and partition walls. 12 Net usable area (NUA) – The area within a building available for people to use and ‘live-in’. It excludes circulation areas, sanitary facilities, non-habitable rooms (rooms without natural light), and ancillary rooms. It is measured to the internal face of the walls delimitating the room 13 ‘Wall area’ (WA) – area occupied by the wall in horizontal projection. It is the difference between the GEA and NIA 14 Non-usable area (nUA) – complimentary area of a building. It is the area that is need inside a building but is not considered as net usable area. It is the difference between net internal area and net usable area.

C H A P T E R 5 | E A R L Y S T A G E M O D E L F O R S U S T A I N A B L E D E S I G N – E A S Y M O D E
182
Table 5.28. Distribution of analysed buildings per their construction technology.
Construction Technology Buildings analysed (n.) Timber building 10 Light steel framing 30 Stone masonry and timber 15 Concrete 15
For each construction solution, the following ratios were obtained: NIA to GEA, NUA to GEA, NUA
to NIA, WA to GEA, and nUA to GEA and a graphical representation of the distribution (GEA, NUA)
and (GEA, NIA) was carried out.
To understand if there were any relation between these areas at national regulations the minimum
areas allowed for homes according to the Portuguese Regulation for Urban Buildings (RGEU)
("Decreto-Lei n.º 38:382/1951,") were targeted with the same analysis. The graphical analysis allowed
predicting and finding the ratios NIA/GEA, and NUA/GEA to each construction technology.
To establish the performance levels, a statistical analysis was conducted. According to Castro, Mateus,
Serôdio, and Bragança (2015), benchmarks for an indicator can be defined through to the quartile
distribution. The conventional practice is considered as the median (med.) of the assessed data. The best
practice corresponds either to the upper or lower limit of the 50% middle values, depending on the
indicators idea ‘the higher, the better or, the lower, the better’, respectively. To this study, the best
practice is the bottom limit of the first quartile, meaning the boundary of the 50% intermediate values.
The median value is chosen instead of the average, as the former is the midpoint of a frequency
distribution and thus, the probability of falling above or below it, is the same (Castro et al., 2015).
5.6.1.2 | Results
General Assessment
First, a general analysis of the data was performed, regardless the construction solution assessed. An
average of 20.76 m2 usable area per capita was reached, representing 55% of the GEA (Table 5.29) for
single family buildings. The former value is in line with the literature. Oliveira (2012) presented an
NUA per capita of 20 m2 for the same building typology. According to the Entranze project, in 2008
the average usable are per occupier in residential buildings in Portugal was 38.59 m2 (Enerdata, 2016).
Although this latter is greater than the one obtained in this study, this difference may be justified. While
the present study focused single family houses, the Entranze value gathers single family and multifamily
buildings. To justify this, the value of 20.78 m2/p shown by Oliveira (2012) is similar to the value
obtained in this study, regards only single family buildings. The average usable area obtained is
approximately 95 m2. According to last Census (INE, 2014a), the average NUA of a residential
building is 109.02 m2. Oliveira (2012) presents an average of 122.08 m2 NUA for detached houses and
Entranze points this value to 116 m2. The obtained value in this study might be lower than the ones

E A R L Y S T A G E D E S I G N M E T H O D O L O G Y T O E N S U R E L I F E C Y C L E S U S T A I N A B I L I T Y O F R E S I D E N T I A L B U I L D I N G S
183
presented in the literature, as half of the homes assessed are modular buildings, which are typically
smaller than in-situ constructed buildings. The conventional practice resulted in being lower than the
average, 20.76 m2/p and total NUA being 54% of the GEA.
Figure 5.18 depicts the graphic representation of this analysis. From Figure 5.18(a) it is possible to
verify the panoply of areas. For instance, 25% of the assessed buildings have a GEA between 274.43 m2
and 534.44 m2 while other 25% have a GEA between 26.58 m2 and 84 m2. A right deviation is clearly
seen for all area’s typologies. Figure 3(b) shows the same analysis but for the ratios obtained. In this
case, no apparent deviation is seen, except in GIA/GEA ratio where a left deviation of the results is
evident. Performance levels for these ratios can be established based on this graph. As the closer the
ratio is to one, the better, meaning that most of the building area is available for use, the best practice is
the upper limit of the 50% intermediate values. In this sense, establishing a performance-based
assessment, four performance levels can be defined, as presented in Table 5.30 and exemplified in
Figure 5.19.
Table 5.29. Statistical analysis for space efficiency analysis
GEA (m2)
GIA (m2)
NIA (m2)
NUA (m2)
GIA/GEA
WA (m2)
nUA (m2)
NIA/p
NUA/p
NIA/GEA
NUA/GEA
NUA/GIA
Av. 188.36 153.36 141.27 95.37 0.82 49.11 45.24 30.46 21.16 0.75 0.55 0.67 Med. 148.57 117.18 110.50 88.75 0.84 38.88 26.38 29.40 20.76 0.79 0.54 0.66 Q1 534.44 479.04 462.41 241.90 1.00 208.00 308.88 77.07 38.96 0.94 0.78 0.87 Q2 274.43 234.84 215.09 128.00 0.87 71.03 70.74 38.22 25.60 0.82 0.67 0.79 Q3 148.57 117.18 110.50 88.75 0.84 38.88 26.19 29.37 20.70 0.78 0.54 0.66 Q4 84.00 67.30 62.30 50.00 0.79 12.86 8.92 21.85 17.96 0.69 0.48 0.60
(a) (b)
Figure 5.18. Statistical distribution of obtained data; (a) distribution of different areas assessment for all houses addressed; (b) distribution of the obtained ratios, accounting for all buildings.
050
100150200250300350400450500550
GEA GIA NIA NUA WA nUA
m2
20%
30%
40%
50%
60%
70%
80%
90%
100%
GIA/GEA NIA/GFA NUA/GEA NUA/GIA

C H A P T E R 5 | E A R L Y S T A G E M O D E L F O R S U S T A I N A B L E D E S I G N – E A S Y M O D E
184
Differences among construction solutions
The construction solutions were analysed individually. Table 5.31 summarises the data collection and
ratios obtained. To understand better the results different graph representations were drawn.
Figure 5.20 shows the relation between NIA and GEA, and NUA and GEA, respectively, for each
construction technology, addressed.
Table 5.31. Data collection for space efficiency
Const. techn.
GEA GIA NIA NUA GIA/GEA WA WA NIA/
GEA NUA/GEA
NUA/GIA nUA nUA NIA/
p NUA/
p (m2) (m2) (m2) (m2) - (m2) % - - - (m2) (m2) % %
Modular 43.00 36.00 33.12 26.90 0.84 9.88 22.98 0.77 0.63 0.75 6.22 0.14 33.12 26.90 Timber 45.70 36.60 36.60 28.80 0.80 9.10 19.91 0.80 0.63 0.79 7.80 0.17 36.60 28.80 (MT) 64.55 55.70 51.78 42.71 0.86 12.77 19.78 0.80 0.66 0.77 9.07 0.14 25.89 21.36
10 84.25 72.50 52.40 44.60 0.86 31.85 37.80 0.62 0.53 0.62 7.80 0.09 17.47 14.87 107.60 94.00 87.34 79.35 0.87 20.26 18.83 0.81 0.74 0.84 7.99 0.07 29.11 26.45 105.75 91.81 87.38 74.78 0.87 18.37 17.37 0.83 0.71 0.81 12.60 0.12 21.85 18.70 105.95 91.81 87.38 74.78 0.87 18.57 17.53 0.82 0.71 0.81 12.60 0.12 21.85 18.70
125.45 109.30 101.31 94.31 0.87 24.14 19.24 0.81 0.75 0.86 7.00 0.06 20.26 18.86 125.45 109.30 101.31 94.31 0.87 24.14 19.24 0.81 0.75 0.86 7.00 0.06 20.26 18.86 164.85 151.00 140.60 128.00 0.92 24.25 14.71 0.85 0.78 0.85 12.60 0.08 28.12 25.60
Light 69.00 54.96 47.30 41.30 0.80 21.70 31.45 0.69 0.60 0.75 6.00 0.09 23.65 20.65 steel 26.58 21.93 22.00 18.80 0.83 4.58 17.23 0.83 0.71 0.86 3.20 0.12 11.00 9.40 framing 28.14 22.30 22.30 19.10 0.79 5.84 20.75 0.79 0.68 0.86 3.20 0.11 11.15 9.55
(LSF) 28.14 22.30 22.30 19.10 0.79 5.84 20.75 0.79 0.68 0.86 3.20 0.11 11.15 9.55 30 72.00 64.20 58.87 50.00 0.89 13.13 18.24 0.82 0.69 0.78 8.87 0.12 29.44 25.00 75.00 65.38 60.80 38.00 0.87 14.20 18.93 0.81 0.51 0.58 22.80 0.30 30.40 19.00 84.00 78.60 75.40 62.00 0.94 8.60 10.24 0.90 0.74 0.79 13.40 0.16 37.70 31.00
56.00 47.63 46.60 41.10 0.85 9.40 16.79 0.83 0.73 0.86 5.50 0.10 23.30 20.55 87.00 65.56 52.10 41.20 0.75 34.90 40.11 0.60 0.47 0.63 10.90 0.13 26.05 20.60 116.00 94.51 79.70 53.15 0.81 36.30 31.29 0.69 0.46 0.56 26.55 0.23 39.85 26.58
160.00 134.50 115.30 88.75 0.84 44.70 27.94 0.72 0.55 0.66 26.55 0.17 38.43 29.58 41.28 32.70 32.60 26.20 0.79 8.68 21.03 0.79 0.63 0.80 6.40 0.16 10.87 8.73 39.72 32.27 32.20 25.80 0.81 7.52 18.93 0.81 0.65 0.80 6.40 0.16 10.73 8.60 75.00 65.38 62.30 47.00 0.87 12.70 16.93 0.83 0.63 0.72 15.30 0.20 20.77 15.67
84.00 78.60 76.40 63.00 0.94 7.60 9.05 0.91 0.75 0.80 13.40 0.16 25.47 21.00 184.00 183.60 166.10 107.75 1.00 17.90 9.73 0.90 0.59 0.59 58.35 0.32 41.53 26.94 120.00 113.64 112.45 83.15 0.95 7.55 6.29 0.94 0.69 0.73 29.30 0.24 28.11 20.79
Table 5.30. Performance level’s establishment per quartiles
Performance levels Equivalent quartile
Level 1 Q3 Level 2 Q2 Level 3 Q1
Figure 5.19. Benchmarking for NUA per occupant

E A R L Y S T A G E D E S I G N M E T H O D O L O G Y T O E N S U R E L I F E C Y C L E S U S T A I N A B I L I T Y O F R E S I D E N T I A L B U I L D I N G S
185
Table 5.31. Data collection for space efficiency (cont.)
Const. techn.
GEA GIA NIA NUA GIA/GEA WA WA NIA/
GEA NUA/GEA
NUA/GIA nUA nUA NIA/
p NUA/
p (m2) (m2) (m2) (m2) - (m2) % - - - (m2) (m2) % %
120.00 107.30 110.50 93.50 0.89 9.50 7.92 0.92 0.78 0.87 17.00 0.14 27.63 23.38 142.00 120.72 90.90 76.00 0.85 51.10 35.99 0.64 0.54 0.63 14.90 0.10 22.73 19.00 207.00 179.80 151.60 125.60 0.87 55.40 26.76 0.73 0.61 0.70 26.00 0.13 30.32 25.12
116.00 98.50 70.45 63.15 0.85 45.55 39.27 0.61 0.54 0.64 7.30 0.06 14.09 12.63 122.90 87.40 84.30 53.55 0.71 38.60 31.41 0.69 0.44 0.61 30.75 0.25 42.15 26.78 184.00 129.37 124.85 83.70 0.70 59.15 32.15 0.68 0.45 0.65 41.15 0.22 41.62 27.90 214.00 152.12 147.55 100.20 0.71 66.45 31.05 0.69 0.47 0.66 47.35 0.22 36.89 25.05
233.00 177.44 166.25 114.30 0.76 66.75 28.65 0.71 0.49 0.64 51.95 0.22 33.25 22.86 64.80 45.23 53.05 30.70 0.70 11.75 18.13 0.82 0.47 0.68 22.35 0.34 53.05 30.70 43.00 36.00 33.12 26.90 0.84 9.88 22.98 0.77 0.63 0.75 6.22 0.14 33.12 26.90
45.70 36.60 36.60 28.80 0.80 9.10 19.91 0.80 0.63 0.79 7.80 0.17 36.60 28.80 64.55 55.70 51.78 42.71 0.86 12.77 19.78 0.80 0.66 0.77 9.07 0.14 25.89 21.36
Stone 84.25 72.50 52.40 44.60 0.86 31.85 37.80 0.62 0.53 0.62 7.80 0.09 17.47 14.87
mansory 107.60 94.00 87.34 79.35 0.87 20.26 18.83 0.81 0.74 0.84 7.99 0.07 29.11 26.45 + timber 105.75 91.81 87.38 74.78 0.87 18.37 17.37 0.83 0.71 0.81 12.60 0.12 21.85 18.70 (STm) 105.95 91.81 87.38 74.78 0.87 18.57 17.53 0.82 0.71 0.81 12.60 0.12 21.85 18.70 15 125.45 109.30 101.31 94.31 0.87 24.14 19.24 0.81 0.75 0.86 7.00 0.06 20.26 18.86
125.45 109.30 101.31 94.31 0.87 24.14 19.24 0.81 0.75 0.86 7.00 0.06 20.26 18.86 164.85 151.00 140.60 128.00 0.92 24.25 14.71 0.85 0.78 0.85 12.60 0.08 28.12 25.60
Stone 69.00 54.96 47.30 41.30 0.80 21.70 31.45 0.69 0.60 0.75 6.00 0.09 23.65 20.65
mansory 26.58 21.93 22.00 18.80 0.83 4.58 17.23 0.83 0.71 0.86 3.20 0.12 11.00 9.40 + timber 28.14 22.30 22.30 19.10 0.79 5.84 20.75 0.79 0.68 0.86 3.20 0.11 11.15 9.55 (STm) 28.14 22.30 22.30 19.10 0.79 5.84 20.75 0.79 0.68 0.86 3.20 0.11 11.15 9.55
15 72.00 64.20 58.87 50.00 0.89 13.13 18.24 0.82 0.69 0.78 8.87 0.12 29.44 25.00 75.00 65.38 60.80 38.00 0.87 14.20 18.93 0.81 0.51 0.58 22.80 0.30 30.40 19.00 84.00 78.60 75.40 62.00 0.94 8.60 10.24 0.90 0.74 0.79 13.40 0.16 37.70 31.00 56.00 47.63 46.60 41.10 0.85 9.40 16.79 0.83 0.73 0.86 5.50 0.10 23.30 20.55
Reinf, 87.00 65.56 52.10 41.20 0.75 34.90 40.11 0.60 0.47 0.63 10.90 0.13 26.05 20.60 Conc. 116.00 94.51 79.70 53.15 0.81 36.30 31.29 0.69 0.46 0.56 26.55 0.23 39.85 26.58 + brick 160.00 134.5 115.30 88.75 0.84 44.70 27.94 0.72 0.55 0.66 26.55 0.17 38.43 29.58
masonry 41.28 32.70 32.60 26.20 0.79 8.68 21.03 0.79 0.63 0.80 6.40 0.16 10.87 8.73 (rCBm) 39.72 32.27 32.20 25.80 0.81 7.52 18.93 0.81 0.65 0.80 6.40 0.16 10.73 8.60 15 75.00 65.38 62.30 47.00 0.87 12.70 16.93 0.83 0.63 0.72 15.30 0.20 20.77 15.67
84.00 78.60 76.40 63.00 0.94 7.60 9.05 0.91 0.75 0.80 13.40 0.16 25.47 21.00 184.00 183.60 166.10 107.75 1.00 17.90 9.73 0.90 0.59 0.59 58.35 0.32 41.53 26.94 120.00 113.64 112.45 83.15 0.95 7.55 6.29 0.94 0.69 0.73 29.30 0.24 28.11 20.79 120.00 107.30 110.50 93.50 0.89 9.50 7.92 0.92 0.78 0.87 17.00 0.14 27.63 23.38
142.00 120.72 90.90 76.00 0.85 51.10 35.99 0.64 0.54 0.63 14.90 0.10 22.73 19.00 207.00 179.80 151.60 125.60 0.87 55.40 26.76 0.73 0.61 0.70 26.00 0.13 30.32 25.12 116.00 98.50 70.45 63.15 0.85 45.55 39.27 0.61 0.54 0.64 7.30 0.06 14.09 12.63
122.90 87.40 84.30 53.55 0.71 38.60 31.41 0.69 0.44 0.61 30.75 0.25 42.15 26.78 184.00 129.37 124.85 83.70 0.70 59.15 32.15 0.68 0.45 0.65 41.15 0.22 41.62 27.90
Figure 5.20 show that NIA/GEA and NUA/GEA relations look similar among the construction
technologies. Nevertheless, it is possible to trace different trend lines and verify that the behaviour of
the solutions is somewhat distinct from each other. The construction solution with the greater slope of
the trend line is the most efficient solution. From Figure 5.21 it is possible to see that the modular
solutions are in general the most efficient to promote greater usable areas. Timber used as modular
construction is, in most of the cases, the most efficient solution. To rank the solutions accounting for
their efficiency, we would have the following hierarchy:
• Modular timber;
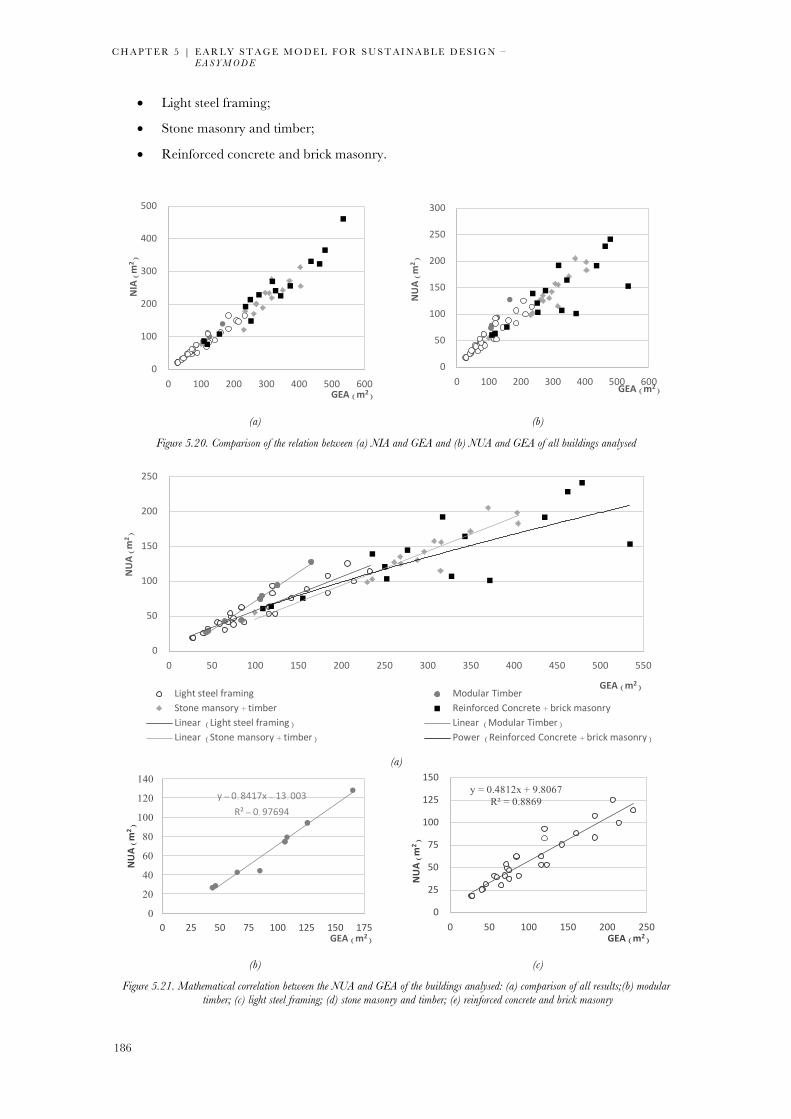
C H A P T E R 5 | E A R L Y S T A G E M O D E L F O R S U S T A I N A B L E D E S I G N – E A S Y M O D E
186
• Light steel framing;
• Stone masonry and timber;
• Reinforced concrete and brick masonry.
(a) (b)
Figure 5.20. Comparison of the relation between (a) NIA and GEA and (b) NUA and GEA of all buildings analysed
(a)
(b) (c)
Figure 5.21. Mathematical correlation between the NUA and GEA of the buildings analysed: (a) comparison of all results;(b) modular timber; (c) light steel framing; (d) stone masonry and timber; (e) reinforced concrete and brick masonry
0
100
200
300
400
500
0 100 200 300 400 500 600
NIA(m
2 )
GEA (m2)
0
50
100
150
200
250
300
0 100 200 300 400 500 600
NUA(m
2 )
GEA (m2)
0
50
100
150
200
250
0 50 100 150 200 250 300 350 400 450 500 550
NUA(m
2 )
GEA (m2)Light steel framing Modular TimberStone mansory + timber Reinforced Concrete + brick masonryLinear (Light steel framing) Linear (Modular Timber)Linear (Stone mansory + timber) Power (Reinforced Concrete + brick masonry)
y = 0.8417x - 13.003R² = 0.97694
0
20
40
60
80
100
120
140
0 25 50 75 100 125 150 175
NUA(m
2 )
GEA (m2)
y = 0.4812x + 9.8067R² = 0.8869
0
25
50
75
100
125
150
0 50 100 150 200 250
NUA(m
2 )
GEA (m2)

E A R L Y S T A G E D E S I G N M E T H O D O L O G Y T O E N S U R E L I F E C Y C L E S U S T A I N A B I L I T Y O F R E S I D E N T I A L B U I L D I N G S
187
(d) (e)
Figure 5.21. Mathematical correlation between the NUA and GEA of the buildings analysed: (a) comparison of all results;(b) modular timber; (c) light steel framing; (d) stone masonry and timber; (e) reinforced concrete and brick masonry (comt.)
Nevertheless, there are specific points where one solution becomes more efficient than the other.
Figure 5.22 shows this efficiency inversion points between the different solutions analysed. For GEA
between 35 m2 and 63 m2, the most effective construction solution is LSF. In fact, LSF is more efficient
even for smaller GEA. However, this area was used as the threshold, as it is the minimum allowed
GEA for permanent homes, according to the Portuguese legislation (Figure 5.22a). As can be seen in
Figure 5.22b, rCBm is less efficient than MT for GEA greater than 66.40 m2. Being rCBm more
efficient in smaller GEA was not expected, as the areas occupied by walls is typically higher in this
construction solutions. In fact, when looking at Table 5.31, one can see that WA is mostly higher in
rCBm and SmT than in the modular solutions. These differences might occur due to the characteristic
equation choose. In order to have a more reliable coefficient of determination (R2), a power trend line
was selected instead of a linear one. If more rCBm small buildings had been assessed, this result could
have been avoided. This unexpected trend was also seen when comparing rCBm and LSF. For GEA
values ranging from 38.32 to 113.88 m2 rCBm is more efficient than LSF (Figure 5.22c-d).
When comparing LSF with SmT, this latter would only be more efficient than the LSF for GEA greater
than 1450 m2, which is a quite big area for a single, family house. Similarly, SmT is only more efficient
than MT for GEA smaller than 25.73 m2. As the minimum GEA allowed by the Portuguese law is
35 m2, MT was considered more efficient than SmT. rCBm is more efficient than SmT solutions until
240.14 m2 GEA (Figure 5.22e).
y = 0.4907x - 3.9709R² = 0.87797
0
50
100
150
200
250
0 100 200 300 400 500
NUA(m
2 )
GEA (m2)
y = 1.7709x0.7596R² = 0.74065
0
50
100
150
200
250
0 100 200 300 400 500 600
NUA(m
2 )
GEA (m2)

C H A P T E R 5 | E A R L Y S T A G E M O D E L F O R S U S T A I N A B L E D E S I G N – E A S Y M O D E
188
Int. point: GEA= 63.27; NUA = 40.25 m2 Int. point: GEA= 66.40; NUA = 42.88 m2
(a) (b)
Int. point: GEA= 38.32; NUA = 28.25 m2 Int. point: GEA= 113.88; NUA = 64.61 m2
(c) (d)
Int. point: GEA=240.14; NUA = 113.87 m2
(e)
Figure 5.22. Efficiency inversion points between the different construction solutions. (a) Inversion point between timber and light steel framing solutions; (b) inversion point between timber and reinforced concrete + brick masonry solutions
Table 5.32 presents the Portuguese minimum legal requirements for housing areas. For homes with a
maximum of six bedrooms, the areas are established. To all with more than that, the areas are obtained
according to the total number of bedrooms. To all these, the GEA should be at least 1.6·NUA, meaning
that it is 72.8 + 14.4x, where x is the number of bedrooms in the house. Also, this means that the ratio
of NUA to GEA should be at least 62.5% by law, in all houses with more than six bedrooms. There is
0
10
20
30
40
50
60
0 25 50 75 100 125
NUA(m
2 )
GEA (m2)M Timber LSFLinear (M Timber) Linear (LSF)
10
20
30
40
50
60
0 25 50 75 100 125
NUA(m
2 )
GEA (m2)M Timber Concrete
Linear (M Timber) Power (Concrete)
25
27
29
31
33
30 35 40 45 50
NUA(m
2 )
GEA (m2)LSF ConcreteLinear (LSF) Power (Concrete)
60
62
64
66
68
70
100 105 110 115 120 125 130
NUA(m
2 )
GEA (m2)LSF ConcreteLinear (LSF) Power (Concrete)
80
90
100
110
120
130
140
205 215 225 235 245 255 265 275
NUA(m
2 )
GEA (m2)Stone + timber ConcreteLinear (Stone + timber) Power (Concrete)

E A R L Y S T A G E D E S I G N M E T H O D O L O G Y T O E N S U R E L I F E C Y C L E S U S T A I N A B I L I T Y O F R E S I D E N T I A L B U I L D I N G S
189
no mandatory NUA per occupant. This value depends on the number of bedrooms in the house, like
all the other minimum required areas.
This rank can occur due to several aspects:
• The building areas from technologies a) and b) are smaller than the ones from the other
techniques c) and d) and, for this reason, different results could be seen if more similar areas
were used.
• Buildings from a) and b) are a modular construction; which can mean that the fact their
efficiency can be related to the modularity rather than to the construction technology.
Table 5.32. Minimum legal areas imposed by Portuguese ("Decreto-lei 650/75," 1975)
Typ. GEA NIA NUA NIA/GEA NUA/GEA WA WA/NUA nUA nUA/NUA (m2) (m2) (m2) (%) (%) (m2) (%) (m2) (%)
T0 35.00 25.5 16,00 72.86 45.71 9.50 27.14 19,00 54.29 T1 52.00 34.00 26.50 65.38 50.96 18.00 34.62 25.50 49.04 T2 72.00 47.00 37.50 65.28 52.08 25.00 34.72 34.50 47.92 T3 91.00 59.00 46.50 64.84 51.10 32.00 35.16 44.50 48.90 T4 105.00 64.50 46.50 61.43 44.29 40.50 38.57 58.50 55.71
T5 122.00 80,00 66.00 65.57 54.10 42,00 34.43 56,00 45.90 T6 134.00 88.50 72.50 66.04 54.10 45.50 33.96 61.50 45.90
Tx >6 1.6i}Q 49.5+ 10ä 45.5 + 9ä
49.5 + 10ä72.8 + 14.4ä
62.5 23.3 + 4.4ä 23.3 + 4.4ä45.5 + 9ä
27.3 + 5.4ä 27.3 + 5.4ä45.5 + 9ä
Making a strict analysis of the ratio of NUA to GEA can be restrictive and underestimate the need for
ancillary spaces. In Portugal, it is quite common for dwellings to have auxiliary rooms such as laundry
or pantry rooms. Nevertheless, in countries where the square metre price is high, the use of these rooms
might not be so common, as space efficiency is more valorised.
As it is possible to see in the figures presented, greater disparity between GEA and NUA occurs in
rCBm solutions. As said, in rCBm the coefficient of determination for the trend line, obtained is
relatively small when compared to the other construction solutions analysed. From Figure 5.21e it is
quite easy to verify that two buildings with approximately the same GEA, one has almost half NUA
than the other. There are many reasons why this can happen. At first, the results can be analysed
considering the applicability for the construction solutions assessed. Both MT and LSF are modular
solutions. These have a different design, being more sparing regarding the building area, and hence
having the need to be more efficient when using it. Furthermore, the buildings assessed in this typology
are smaller than the ones in the other two construction solutions. This means that, in a building
smaller, the need/availability of non-usable area is reduced. SmT is a traditional construction system
in the north of Portugal, which was mainly used during XVIII century. All the buildings analysed in
this solution are old buildings that were recently rehabilitated. This can mean that internal design
could have been changed to improve rooms’ areas, proofing that these buildings are adaptable for

C H A P T E R 5 | E A R L Y S T A G E M O D E L F O R S U S T A I N A B L E D E S I G N – E A S Y M O D E
190
nowadays uses. As these buildings were already built, restrictions such as space, shape, layout, or
structure could drive to more careful and efficient design. In its turn rCBm, is the most common
construction solution nowadays, becoming the most used solution. During several years, houses were,
and still are, mainly made with this solution. Another reason of this to happen is the low
representativeness of buildings for each echelon of GEA.
5.6.1.3 | Development of Space Efficiency Indicator
Space efficiency is a major aspect when dealing with homes. It aids defining the home’s suitability for
an individual, beyond all other social, environmental, and economic benefits as already discussed. To
deal with SE in early design is thus, of foremost concern and it should regard both, environmental and
social impacts. The economic aspects are handled in the life cycle cost indicator. Existing BSA tools
deal with SE especially from the environmental side, often regarding it as land use efficiency, when
correctly, the less land is used, the better. Only CASBEE considers it more with a social perspective.
More recently, research is being carried out to improve the way BSA tools deal with space efficiency.
Barbosa, Araújo, Mateus, and Bragança (2015) proposed a new method to assess space efficiency,
reducing land use by using smart interior design. The authors suggest the use of convertible solutions,
efficient furniture, and corroborate the idea that it is during early design stages that solutions should
be predicted to improve sustainability performance. This kind of solutions should be thought of design
brief and concept. Before reaching these steps, space efficiency thoughts should have been already
considered, even if few data are available. To study interior design, such as efficient furniture, and
convertible spaces and layout, it is essential to understand how far these ideas can go. The area
availability should be previously foreseen. Construction solutions to do not take full credit in defining
the usable area of a building, but choosing the right solution can aid improve its size. It is also important
to bear in mind the need for a comfortable living is influenced by the area availability per person in
each home.
With this in mind, the previously presented study allowed developing a simple procedure to aid
determining the best construction solutions to improve space efficiency. The aim was to develop a
quantitative indicator, based on the existing data at the time of the assessment, to guide designers into
a more efficient space design. To do so, considering what has been done by previous tools and the
study presented above, two aspects shall be included in the assessment: (i) use of available area and,
(ii) area availability per inhabitant. There are other possible parameters to address SE, but those are
highly connected to the buildings’ layout and architecture, and clients’ needs. These would be
impossible to include in this assessment for two main reasons. First, at early design stage, there are no
internal plans. Thus, it would be in unwise to add them at this stage. Secondly, it might bring
subjectivity to the tool, as one’s client needs may not be the same as other clients and thus, what is
efficient to one may not be to the other. Next, the calculation procedure to each parameter is
presented.

E A R L Y S T A G E D E S I G N M E T H O D O L O G Y T O E N S U R E L I F E C Y C L E S U S T A I N A B I L I T Y O F R E S I D E N T I A L B U I L D I N G S
191
5.6.1.4 | Calculation procedure
Use of available area
The study previously presented determined trend lines for the ratios of NIA to GEA and NUA to
GEA, for the different construction solutions. It enabled estimating an expected NIA and NUA based
on the GEA prediction to each construction solutions. Making these values available to designers allow
them to choose and guide their design according to the most efficient solution.
As input for the assessment, the designer should give the following data:
• Construction solution is foreseen to be used;
• Allotment area;
• Maximum net land use index or;
• Maximum gross external area;
• Performance level to attain.
Figure 5.23 depicts the assessment flowchart.
Figure 5.23. Use of available area indicator assessment flowchart
With this data, the EasyMode estimates NUA for the given construction solution, through the respective
equation from Eq. 5.29 to Eq. 5.32.. Equations Eq. 5.29 to Eq. 5.32 were obtained for modular
timber (MT), light steel framing (LSF), stone masonry + timber (SmT) and reinforced concrete + brick
masonry (rCBm), respectively, regarding the relation between NUA and GEA (Figure 5.21). At the
same time, EasyMode calculates the NUA for the other construction solutions with the remaining
equations. For all the solutions, the tool will also calculate NIA, WA, and nUA using the equations
Eq. 5.33. to Eq. 5.38. Equations Eq. 5.33. to Eq. 5.36. were obtained for modular timber (MT), light
steel framing (LSF), stone masonry + timber (SmT) and reinforced concrete + brick masonry (rCBm),
• Allotmentarea• Constructionsolution• Maxlanduseindex
CalculationofforeseenNetUsableArea
Results:Obtainedperformancelevel
Addalternatives? FINISH
InsertnewNUAvalue
Calculationofnewperformancelevel
NewLevel
yes no
Quantificationorindication?
• Max.Grossexternalarea• Leveltoattain
Indication
Quantification
ChangeNUAor
performancelevel?
ChangeNUA
Performancelevel

C H A P T E R 5 | E A R L Y S T A G E M O D E L F O R S U S T A I N A B L E D E S I G N – E A S Y M O D E
192
respectively, regarding the relation between NIA and GEA (Figure 5.20). Equations Eq. 5.37. and
Eq. 5.38.were defined through the definition of WA and nUA, respectively.
i}Qå$ = 0.8417×ç{Q– 13.003 Eq. 5.29.
i}Qèê� = 0.4812×ç{Q + 9.8067 Eq. 5.30.
i}Qê8$ = 0.4907×ç{Q − 3.9709 Eq. 5.31.
i}Q<.ë8 = 1.7709×ç{Qw.íìît Eq. 5.32.
i%Qå$ = 0.8725×ç{Q − 6.9285 Eq. 5.33.
i%Qèê� = 0.7051×ç{Q + 5.8614 Eq. 5.34.
i%Qê8$ = 0.7321×ç{Q– 2.5876 Eq. 5.35.
i%Q<.ë8 = 0.7947×ç{Q − 10.933 Eq. 5.36.
|Q = ç{Q − i%Q Eq. 5.37.
I}Q = i%Q − i}Q Eq. 5.38.
EasyMode then shows designers the results of the calculations allowing them to visualise which should
be the best construction solution, given their GEA and the performance level there are pursuing.
Performance levels were established considering the previous study results (Table 5.29), following the
Table 5.30 establishments. EasyMode requirements for each performance level are in Table 5.33.
Although EasyMode automatically suggests another construction solution if better results can be
achieved, tool users can still add alternatives. They can verify, for instance, the performance level for
another NUA. With this new NUA, EasyMode calculates the maximum and minimum values of NIA,
WA, and nUA and the corresponding performance level. The equations used for this calculation result
from the previews study relation between NUA and NIA, and are represented by Eq. 5.39. to Eq. 5.42.
EasyMode can ranks the different options, allowing users to verify the different outcomes.
i%Qå$ = 1.0349×i}Q + 6.667 Eq. 5.39.
i%Qèê� = 1.3888×i}Q − 4.0473 Eq. 5.40.
i%Qê8$ = 1.5037×i}QM.wwï Eq. 5.41.
i%Q<.ë8 = 1.3319×i}QM.wñm Eq. 5.42.

E A R L Y S T A G E D E S I G N M E T H O D O L O G Y T O E N S U R E L I F E C Y C L E S U S T A I N A B I L I T Y O F R E S I D E N T I A L B U I L D I N G S
193
Table 5.33. Performance levels for the indicator use of available area
Level Description Level 1 48 % < NUA/GEA ≤ 54% Level 2 54% < NUA/GEA ≤ 67% Level 3 NUA/GEA > 67%
Area availability per occupant
This indicator aims to provide sufficient internal space per occupiers, improving their wellbeing
through enough space for their needs.
The parametric analysis carried out allowed determining the performance levels presented in
Table 5.34 they are in line with Table 5.30 establishments. The higher the area per person the better.
Three levels were established having as thresholds the values obtained for conventional practice and best
practice. A note will be presented to the users, remembering that NUA/p can be improved with the
interior design options; the given value is just an estimation. Also, designers shall be advised that they
can attempt to achieve a higher performance level if the NUA/p value is improved.
The tool needs as input the foreseen number of occupiers and the NUA achieved in the previous
parameter. The designer should give the former while the tool automatically generates the latter
(Figure 5.24), using the quantitative approach.
Figure 5.24. Area availability assessment flowchart
As in similar indicators, designers shall either indicate the level to attain and be retrieved with which
requirement to follow or indicate the NUA/p their willing to attain and be retrieved with the
corresponding indicative performance level. As in the other indicators, design alternatives can be tested
and results can be compared.
Table 5.34. Performance level's establishment according to quartile distribution of area availability per occupant
Performance levels Description (m2/p) Level 1 18.08 < NUA/p ≤ 20.76 Level 2 20.76 < NUA/p ≤ 25.60 Level 3 NUA/p > 25.60
Building properties:n. occupantsNUA foreseen
Calculationof NUA perperson
Performance levelachieved
Morealternatives
?
FINISH
yes
no

C H A P T E R 5 | E A R L Y S T A G E M O D E L F O R S U S T A I N A B L E D E S I G N – E A S Y M O D E
194
5.6.2 | Adaptability
The sustainability concept involves a long-term perspective. Since life continually changes, buildings
should be able to cope with their inhabitants needs for change, being adaptable to new requirements.
Nonetheless, conventional buildings are not designed to meet the changing requirements, often leading
to premature demolition (Durmisevic, 2006). Promoting demolition activities, no matter the
transformation needs, involves waste disposal, which reduction is aimed at 70% by the European
Commission, through reuse, recycling, and valorisation by 2020 ("Directive 2008/98/EC," 2008). The
adaptability or lack of it in buildings directly affects the environment, society, and economy. Raw
materials and energy are needed to replace the existing, air emissions and noise are released, also
affecting air quality. If existing buildings are better taken care of and reused, their life expectancy
extends, and less energy is used (Conejos, Langston, & Smith, 2014). Flexible and adaptable buildings
enable not just recycle and reusing existing buildings, resulting in an overall embodied energy saving,
but also, they allow up-recycle of these buildings into urban regeneration projects. Preserving built
heritage benefits cultural identity, sense of belonging, and even has economic welfares, as the tourism
boosts local economies, which is often driven by the cultural heritage of the city. Tweed and Sutherland
(2007) assumed the importance of built environment from a generation to the following, as it works as
a repository of cultural meanings. This represents an additional aspect of promoting adaptability. On
the economic side, there is a big economy fed by waste production; someone must pay to dispose of
waste (or even to recycle it), to perform the demolishing activity and to buy the new materials. If
flexibility is foreseen during design, maintenance and refurbish activities will have its time and cost
reduced (Gosling, Naim, Sassi, Iosif, & Lark, 2008; Slaughter, 2001).
Buildings were often built as a piece to be kept as they were designed to be, but the everyday practice
was shown that time shifts mind-sets and needs, and if the buildings do not embed that change their
service life ends. If the building optimisation fails, their life expectancy may not be fully exploited,
which is not sustainable (Bullen & Love, 2010). Commonly, the buildings’ components are not
programmed to be reused or reconfigured, and materials are often composed of mixtures hampering
recycling. ‘If a building doesn’t support change and reuse, you have only an illusion of sustainability’ (Croxton, 2003).
The buildings should embed change, adjust to new requirements, be adaptable and flexible. It extends
their service life, bringing balance to the three-armed scale of sustainability (Durmisevic, 2006).
Adaptability can be seen as a design characteristic which embodies spatial, structural, and service
strategies, allowing the physical artefact a level of malleability to respond to users’ needs over time,
according to Schmidt III, Eguchi, Austin, and Gibb (2010), enable improving the building’s lifespan.
Adaptability can be defined as the capacity to adjust and suit new situations (Schmidt III et al., 2010).
Although this definition could suggest a straightforward interpretation, there are several versions
throughout the literature, despite their common ground: possibility to cope with change. Schmidt III
et al. (2010) defines adaptability as “the capacity of a building to accommodate effectively, the evolving

E A R L Y S T A G E D E S I G N M E T H O D O L O G Y T O E N S U R E L I F E C Y C L E S U S T A I N A B I L I T Y O F R E S I D E N T I A L B U I L D I N G S
195
demands of its context, thus maximising value through life”, saying that adaptability gathers four
characteristics: the capacity for change, fit for purpose, value and time. Till and Schneider (2005) use
the word “flexible” instead of “adaptable” and defines a flexible housing as “housing that can adapt to
the changing needs of users”. Støa (2012) sets three concepts – generality, flexibility and elasticity – to
distinguish his concept of adaptability. Manewa, Pasquire, Gibb, Ross, and Siriwardena (2013) define
adaptable buildings as “dynamic systems that carry the capacity to accommodate a set of evolving
demands regarding space, function, and componentry”.
Thus, buildings’ adaptability can be said as a cornerstone to sustainability. The assumption is that the
building is more sustainable if its transformation capacity is higher (Figure 5.25).
Figure 5.25. Relation between building conversion capacity and sustainability (Durmisevic, 2006)
Design for Disassembly (DfD) practice emerged as the design and planning of buildings to ease future
changes, and total or partial dismantlement or deconstruction, enabling materials and components
recovery, reuse, and recycle (Guy, Ciarimboli, & Hamer Center for Community, 2008; Rios, Chong,
& Grau, 2015; Webster, 2007). Adopting such design practice, aids pursuing the target of closing
materials loops (circular economy), as it remains one of the most challenging efforts of sustainable
buildings (Kibert, 2013). Durmisevic (2006) developed a method to assess the building’s transformation
capacity based on their disassembly potential. Davico (2013) presented an evaluation method to
evaluate the level of a project’s flexibility (AGFP).
John Habraken proposed the concept of Open Building in 1961, to design buildings in which separate
systems are created to allow optimal freedom for layout and installation modifications (Dekker, 1998;
Kendall, 1999). Habraken said 'We should not to forecast what will happen, but try to make provisions for the
unforeseen' (as cited in Cuperus, 2001). The author suggested that to accommodate unknown future
changes, different levels of decision making should be considered in the design process: tissue, support,
and infill, respectively, urban fabric, containing base buildings with their fit-outs. Based on this layer
concept Brand, 1994 (as cited in Guy et al., 2008) presented a framework and nomenclature for
building layers, that have different changing times, different flexibility performances and thus should
be accounted when dealing with design for flexibility.
These are described as the six S’s system of Site - Structure - Skin - Services - Space Plan – Stuff (Figure 5.26).
According to Davico (2013) and Živković and Jovanović (2012), the project aspects that most affect
the buildings’ flexibility are building implementation, form, structure and size, circulation and

C H A P T E R 5 | E A R L Y S T A G E M O D E L F O R S U S T A I N A B L E D E S I G N – E A S Y M O D E
196
technical systems positions, and usable areas size. The level of separation between buildings’
components and materials and their function also influences the level of buildings transformation
capacity. Nevertheless, a building should not be too flexible, as it could also hamper its benefits
(Bokalders & Block, 2010; Durmisevic, 2006).
Figure 5.26. Stewart Brand’s Six S’s diagram (adapted from Guy et al., 2008)
Adaptability is, to some extent, addressed in BSA tools. It is accounted mainly by (i) ease of disassembly
and deconstruction, (ii) spatial structure (iii) indoor height clearance, (iv) accessibility of utilities cables
and conducts and, (v) modularity (Luis Bragança, Joana Andrade, & Ricardo Mateus, 2016).
Nevertheless, most of the BSA tools addressing these aspects apply to office buildings, not homes. Also,
ISO and CEN standards engage the relevance of adaptability to sustainability. In ISO 21929-1:2011
buildings’ adaptability is defined as the “ability to be changed or modified to make suitable for a particular purpose.
Adaptability includes aspects of flexibility and convertibility” (ISO, 2011b). EN 16309:2014 says adaptability
should be covered in the social category assessment addressing “the provisions included in the building that
allow it to be modified to make it suitable for a particular purpose, which may be a change of use or adaptation of its
current use” (CEN, 2014). The buildings adaptability shall stand with the following goals:
• To accommodate individual user requirements;
• To accommodate the change of user requirements;
• To accommodate technical changes;
• To accommodate the change of use.
The same standard presents measures that could be quantified to assess building’s adaptability:
• Minimisation of internal load-bearing-elements (columns, internal walls);
• Ease of demolition/demountability of internal building elements;
• Redundancy in load-bearing capacity;
• Accessibility/demountability of pipes and cables;
• Provision of space for additional pipes and cables required for a change of use;
• Provisions for possible future equipment (e.g. elevators).
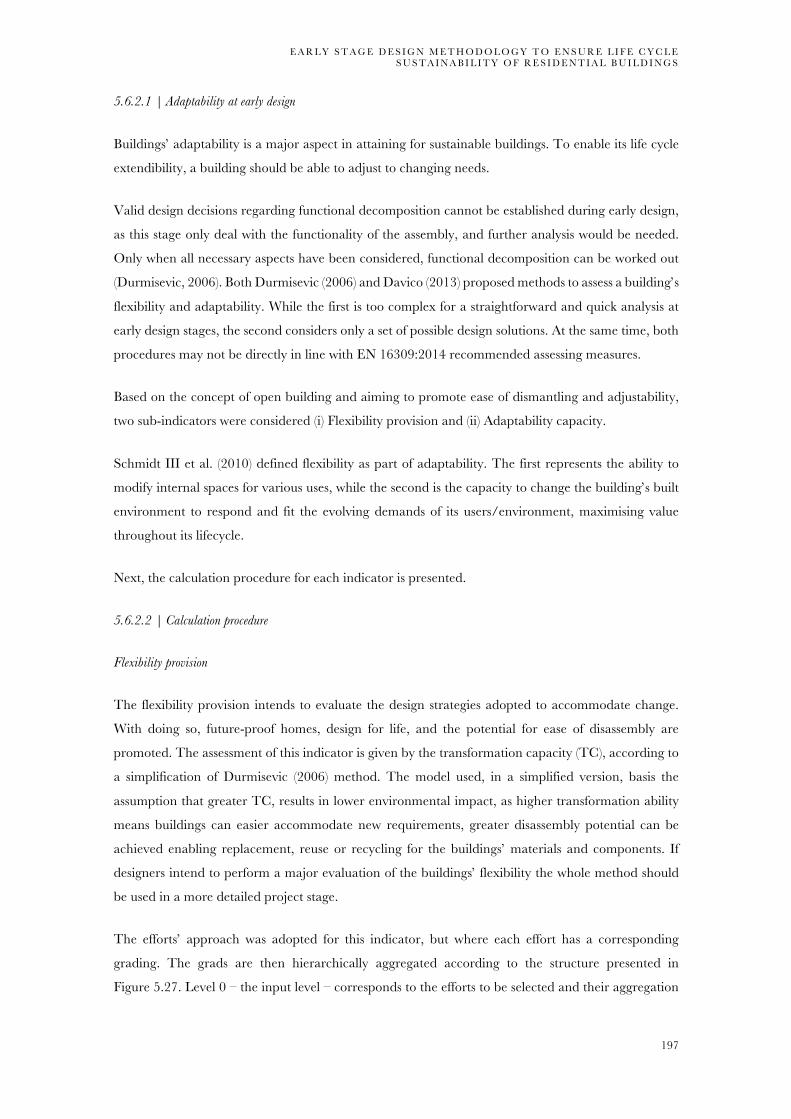
E A R L Y S T A G E D E S I G N M E T H O D O L O G Y T O E N S U R E L I F E C Y C L E S U S T A I N A B I L I T Y O F R E S I D E N T I A L B U I L D I N G S
197
5.6.2.1 | Adaptability at early design
Buildings’ adaptability is a major aspect in attaining for sustainable buildings. To enable its life cycle
extendibility, a building should be able to adjust to changing needs.
Valid design decisions regarding functional decomposition cannot be established during early design,
as this stage only deal with the functionality of the assembly, and further analysis would be needed.
Only when all necessary aspects have been considered, functional decomposition can be worked out
(Durmisevic, 2006). Both Durmisevic (2006) and Davico (2013) proposed methods to assess a building’s
flexibility and adaptability. While the first is too complex for a straightforward and quick analysis at
early design stages, the second considers only a set of possible design solutions. At the same time, both
procedures may not be directly in line with EN 16309:2014 recommended assessing measures.
Based on the concept of open building and aiming to promote ease of dismantling and adjustability,
two sub-indicators were considered (i) Flexibility provision and (ii) Adaptability capacity.
Schmidt III et al. (2010) defined flexibility as part of adaptability. The first represents the ability to
modify internal spaces for various uses, while the second is the capacity to change the building’s built
environment to respond and fit the evolving demands of its users/environment, maximising value
throughout its lifecycle.
Next, the calculation procedure for each indicator is presented.
5.6.2.2 | Calculation procedure
Flexibility provision
The flexibility provision intends to evaluate the design strategies adopted to accommodate change.
With doing so, future-proof homes, design for life, and the potential for ease of disassembly are
promoted. The assessment of this indicator is given by the transformation capacity (TC), according to
a simplification of Durmisevic (2006) method. The model used, in a simplified version, basis the
assumption that greater TC, results in lower environmental impact, as higher transformation ability
means buildings can easier accommodate new requirements, greater disassembly potential can be
achieved enabling replacement, reuse or recycling for the buildings’ materials and components. If
designers intend to perform a major evaluation of the buildings’ flexibility the whole method should
be used in a more detailed project stage.
The efforts’ approach was adopted for this indicator, but where each effort has a corresponding
grading. The grads are then hierarchically aggregated according to the structure presented in
Figure 5.27. Level 0 – the input level – corresponds to the efforts to be selected and their aggregation

C H A P T E R 5 | E A R L Y S T A G E M O D E L F O R S U S T A I N A B L E D E S I G N – E A S Y M O D E
198
to level 1 is obtained through Eq. 5.43. In the aggregation processes to achieve the TC Eq. 5.44 is used
to aggregate the DfD aspects from Level 1 to Level 4.
Figure 5.27. The hierarchical structure adopted in Durmisevic (2006) model.
5^"ó =ò#B
#ÄM
I Eq. 5.43
where Dsak is the result of the Disassembly sub-aspect k, gi is grading from the independent variables i
selected from Level 0 and n is the number of i selected.
ôD = ö#×5õ5#
B
#ÄM
Eq. 5.44
where Lj is the result corresponding to each Design for Disassembly aspect DfDi of each hierarchical
level (Level 2 to Level 4) according to Figure 5.27 and Wi is the corresponding grading.
The model used, was simplified to be easy and practical to use within a whole sustainability assessment.
A complete analysis is recommended in later design stages if one is willing to pursue high TC. The
simplification occurred at two levels:
• Fewer input levels were used in EasyMode than the ones suggested by Durmisevic (2006);
• The aggregation process was simplified, only following the dependency nodes from
Figure 5.27 and not the interdependency node discussed by the author.
209
Transformable Building Structures Chapter 6
Figure 6.02b: list of design fordisassembly aspects and correspondingsub-aspects
Figure 6.02a: hierarchical structures ofthe Knowledge Model

E A R L Y S T A G E D E S I G N M E T H O D O L O G Y T O E N S U R E L I F E C Y C L E S U S T A I N A B I L I T Y O F R E S I D E N T I A L B U I L D I N G S
199
Considering this simplification, the weights of each level were converted to a percentage (0-100%)
scale, according to their relevance for the final score. The weights of the withdrawn aspects were
equitably distributed among the remaining aspects in the same level.
The simplification was based in both, withdrawn those aspects that do not contribute to a more
functional and easily convertible building, and give priority to those considered in existing post-design
BSA Tools (Barbosa, Mateus, & Bragança, 2013; International Initiative for a Sustainable Built
Environment, 2014; OpenHouse, 2010). Also, to ease understanding, some terminology was changed.
Table 5.35 presents the considered aspects and the correspondent weights. Designers should select
which aspect their willing to implement and will be retrieved with the corresponding TC value.
Table 5.35. Aspects considered with flexibility indicator and corresponding grading
Level 3 Level 2 Level 1 Level 0 Material Levels
Functional decomposition 0.667 Functional separation
0.56 Separation of functions 1
[0.5] Decisions whether two or more functions are integrated into one building product or whether separate products are carriers of separate functions provide the first indication about a building’s transformability.
Integration of functions with the same life cycle into one elements
0.6
Integration of functions with the different life cycle into one elements
0.1
Functional dependence
0.44 Modular zoning 1
Planned interpenetration of installations and load-bearing elements
0.8
Unplanned interpenetration of installations and load-bearing element by provision of a free zone
0.2
Systematisation 0.333 Structure and materials
0.5 Components 1
Aspects of systematisation deal with decisions about creation of clusters according to their life cycle performance requirements, and on the level of integration of material levels.
Elements/components 0.8
Elements
0.6
Materials/elements/components
0.4
Clustering 0.5
Clustering according to function 1

C H A P T E R 5 | E A R L Y S T A G E M O D E L F O R S U S T A I N A B L E D E S I G N – E A S Y M O D E
200
Table 5.35. Aspects considered with flexibility indicator and corresponding grading (cont.)
Level 3 Level 2 Level 1 Level 0
Clustering according to material life cycle 0.6
Clustering for fast assembly
0.3
Interfaces Assembly 0.333 Assembly direction based on assembly type
0.56 Parallel – open assembly
1
[0.5]
Stuck assembly
0.6
Base element in stuck assembly
0.4
Assembly sequences regarding material levels
0.43 Component/component
1
Component/element 0.8 Element/component 0.6 Element/element 0.5 Material/component 0.3 Connections 0.667 Type of connection 0.5 Accessory external
connection 1
Direct connection with additional fixing devices
0.8
Direct integral connections with inserts
0.6
Accessory internal connection
0.4
Accessibility to fixing and intermediary
0.5 Accessible 1 Accessible with
additional operations causing no damage
0.8
Accessible with additional operations causing reparable damage
0.6
Accessible with additional operations causing partly damage
0.4
The indicative performance levels follow Durmisevic (2006) performance categories, in reverse order;
category 3 corresponds to Level 1 and so forth (Table 5.36). As in any other indicator, alternatives can
be added and results compared.
Table 5.36. Indicative performance levels for flexibility provision
Level Description Level 1 TC ≤ 33% Low transformation capacity. Level 2 33% < TC < 67% Medium disassembly capacity. Level 3 TC ≥ 67% High disassembly capacity
172
Transformable Building StructuresChapter 5
It is possible to recognise relational patterns within structures that illustrate thisorder. The position of a relation informs us about dependency between functionalgroups. The third aspect, which plays a role in independence and exchangeabilityof elements, is the base element. The hierarchy within the structure defines theorder, which represents the load path through the building. This means that ahierarchy also implies a dependency, based on gravity. Loads can be transferredthrough the building directly from one element to another. In this way all elementsbecome dependent on each other. Independence within a structure can be achievedby introducing a third part, which acts as a base element and takes over the loadbearing function. This principle can also be applied when providing integrity toother functions in the building. The base element is simply an intermediarybetween different functions and surrounding elements.
5.3.1 Relational patterns
Traditional buildings were characterised by complex relational diagrams, whichrepresented maximal integration of all building elements into one dependentstructure.In such an environment, substitution of one element could have considerableconsequences on related parts at their connections.The most important aspect that influences the disassembly potential of structures,is the number of relations. Distinction can be made between six relational patternsthat result in six types of assemblies:1. closed assembly , 2. layered assembly, 3. stuck assembly, 4. table assembly5. open assembly, 6. shared assembly (Figure 5.13).
5.13: Classification of assembliesaccording to the type of relationalpatterns

E A R L Y S T A G E D E S I G N M E T H O D O L O G Y T O E N S U R E L I F E C Y C L E S U S T A I N A B I L I T Y O F R E S I D E N T I A L B U I L D I N G S
201
Adaptability capacity
The adaptability capacity aims to quantify the availability of space to be changed and adapted
according to the occupiers’ needs, following the open building concept. The assessment of this
indicator is given by the globally adaptable space, meaning the percentage of built area available to be
transformed. To the scope of this indicator, the adaptable area can be considered as the resulting area
given by the difference between the net internal area and the internal fixed area. This latter represents
the area that is static and cannot be transformed. With this in mind, the Global Adaptable Space
(GAS) is given by the ratio of the adaptable area to the gross external area, through Eq. 5.45 after
Davico (2013).
çQ3 =i%Q − %zQ
ç{Q Eq. 5.45
where NIA is the net internal area (m2), IFA is the internal fixed area (m2), and GEA is the gross external
area (m2).
The calculation can be carried out through one of two ways. First, if the adaptable are is known, GAS
is obtained through the given values according to Eq. 5.45.Second, if designers have not yet an
estimation of the adaptable area, GAS can be estimated according to the intended performance level,
based on the calculations made in the I13 (space efficiency) for NIA and GFA, and in an estimation of
the IFA. When more accurate data is not available, the IFA can be estimated as the area corresponding
to kitchens and bathrooms, as it typically corresponds to those (Davico, 2013). According to Oliveira
(2012) in single family buildings, 9.64% of NIA corresponds to bathrooms, and 13.14% regards
household activity spaces (kitchens, pantries, utility rooms, etc.). Thus, 77.22% of the NIA can be
considered as the maximum area available to be transformed, when no other data is given.
Designers are thus asked to add the NIA and IFA areas or to select default calculation, with which the
GSA is automatically calculated. Ideally, considering Eq. 5.45.,a building to be fully adaptable, its
adaptable areas should equal its net internal area. Thus, GSA performance would be as greater as was
closer to NIA to GEA ratio value. In this sense, and applying the factor four rule (von Weizsäcker,
Lovins, & Lovins, 1998) the indicative performance levels for GSA follow Table 5.47 insights. In this
sub-indicator it was decided to include four levels, to reward designs that even though do not achieve
the 25% threshold had an effort to introduce some adaptability to the building.
Table 5.37. Indicative performance levels for adaptability capacity
Level Description Level 1 GSA < 25 % of NIA/GEA Level 2 25% ≤ GSA < 50 % of NIA/GEA Level 3 50% ≤ GSA < 75 % of NIA/GEA Level 4 GSA ≥ 75% of NIA/GEA

C H A P T E R 5 | E A R L Y S T A G E M O D E L F O R S U S T A I N A B L E D E S I G N – E A S Y M O D E
202
Additional alternatives can be added. If so, EasyMode will automatically calculate each alterative
performance level and present the results comparison.
5.6.3 | Design for all
There are eighty million Europeans with a disability, meaning one in four European has a relative
with a disability. The increasing life expectancy and the decreasing birth rate contribute to raising the
proportion of the population aged 65 years and over. It is expected that 20.4% of the EU population
is at least 65 years old by 2020 and until 2050 this proportion will rise to 28.1% (Eurostat, 2015). This
ageing of the population brings age-associated disabilities as mobility reduction (Mustaquim, 2015).
Both disabilities, driven by age or not, input challenges in the housing sector.
The traditional design of spaces often carries multiple barriers to daily activities of people with
disability, such as bathing, climbing steps or completing household activities. Nevertheless, attention
to accessibility issues is increasing and many actors, like architects, engineers, or researchers, are
committed to making spaces more usable for people with disabilities (Gossett, Mirza, Barnds, & Feidt,
2009; Iwarsson & Ståhl, 2003). Accessible, universal design and design for all are expressions used to
refer to features in a building for people with or without disabilities (Center for Universal Design -
College of Design - North Carolina State University, 2006).
‘Accessible’ is commonly applied when a dwelling complies with legal requirements for accessible
housing. This compliance includes, for instance, space for a wheelchair, ramps next to stairs, bathing
features, non-slip floors, and so forth. The term accessibility is typically understood as ‘removal of
barriers’ and ‘addition of special features’ (Gossett et al., 2009). On the other hand, Design for All
(DfA) is related to features that can be used by all, regardless their abilities or disabilities, aiming to
assure as many people can use a building as possible (CEN & CENELEC, 2014). The intent of this
concept is to simplify everyone’s life, irrespective of their age, size or ability, by allowing more housing
be usable by more people at little or no extra cost’ (Center for Universal Design 2000). It is regarded
as ‘design for human diversity, social inclusion and equality’ by the European Institute for Design and Disability
(EIDD) (as cited in Persson, Åhman, Yngling, & Gulliksen, 2015).
Ulme (2013) provides an essential background of the design for all concept and its evolution. He states
that “Universal design is an "early project", not an idea that has arisen after the project implementation, followed by
environmental adaptation”. Design for all is to keep in mind that buildings being designed should be
accessible by all at any time without environmental adaptations. It was even stated as being crucial to
sustainable development (EIDD, 2004). Gossett et al. (2009) found an improvement of ‘indoor air
quality’ and flexibility of rooms’ seating furniture, it is recyclability and regional sourced when assessing
the sustainability and design for all correlation.

E A R L Y S T A G E D E S I G N M E T H O D O L O G Y T O E N S U R E L I F E C Y C L E S U S T A I N A B I L I T Y O F R E S I D E N T I A L B U I L D I N G S
203
It is undeniable that DfA principles can easily contribute to a more sustainable built environment.
Building a lifetime home that can be effortlessly used throughout the occupiers’ life avoids, for instance,
modification works, contributing to reduce the buildings’ environmental impacts, and promoting life
quality.
The relation of DfA and early design project has already been corroborated by many authors (Aragall,
Neumann, & Sagramola, 2013). It is important to study DfA principles to understand better its concept
and to better apply it. There are seven that make designs universally usable (Mustaquim, 2015):
• Equitable use: the design does not neglect, exclude, or stigmatise any group of users;
• Flexibility in use: the design should present a broad range of personal choices and their
abilities;
• Simple and intuitive use: the design should be easy to understand, regardless of the user’s
experience, acquaintance, language skills, or their present level of focusing;
• Perceptible information: the design communicates necessary information effectively to the
user, regardless of ambient conditions or the user’s sensory abilities;
• Tolerance for error: the design diminishes hazards and the adverse costs of unintentional or
unintended events;
• Low physical effort: the design should enable proficiently use and with comfort, with the
smallest amount of tiredness;
• Size and space for approach and use: the design should allow appropriate size and space for
approach, reach, manipulation, and use, regardless of the user’s body size, posture, or
mobility.
The Centre of Universal Design in North Carolina, have defined a way to evaluate how well products,
like buildings or others, are satisfying design for all guidelines (The Center for Universal Design, 2003):
• Evaluating product usability throughout its life cycle: packaging, instructions, set-up, use,
maintenance, and disposal;
• Developing product testing and focus group methodologies for use with individuals of diverse
ages and abilities;
• Promoting the universal design features of products to potential customers;
• Identifying universal design features of products for design competitions and award programs.
Both European and International standards address barrier-free access in buildings. At the national
level, there is Decree-law n. 163/2006 imposing the minimum requirements for mobility for all within
buildings. At a European scale, EN 16309 (CEN, 2014) considers accessibility as an essential aspect of
the social performance assessment in a sustainability evaluation. Even though this standard does not
present specific design codes for accessibility design but acknowledges its necessity in (i) approach to

C H A P T E R 5 | E A R L Y S T A G E M O D E L F O R S U S T A I N A B L E D E S I G N – E A S Y M O D E
204
the building; (ii) entrance and movement inside the building; (iii) access to building services. The
standard depicts that the assessment of accessibility can be done by ISO/DIS 21542 or with the
standards in development by CEN BT WG 207. It is foreseen that by 2017 new standards regarding
accessibility and design for all, are released by CEN.
More broadly, ISO 21542:2011 guides accessibility and usability of buildings, although it is not
applicable to single family buildings15. In the absence of a specific standard for this building typology,
ISO 21542:2011 was be used as a reference.
Table 5.38 summarises the most important aspects considered by the Portuguese regulation and by
the ISO 21542:2011. The table shows the standard is more restrictive than Decree-law n. 163/2006.
This restriction can be due to the publication date; ISO is newer than the Portuguese regulation and
because the former is not intended for single family buildings (although being here considered as a
guideline on so).
Some BSA tools for homes tackle accessibility issues, as CASBEE or CSH. Both see accessibility
through an ageing needs perspective. CASBEE sees barrier-free design more from an ageing needs
perspective, although also considering wheelchair mobility. It concerns efforts made to accommodate
deterioration of physical functions because of the ageing of occupants. In the Perfection project
(Perfection Consortium, 2011) the main purpose is to reach a building that is accessible to all by
promoting DfA through (i) approach to the building; (ii) entrance to the building; (iii) movement inside
the building; (iv) facilities of the building and; (v) communication in the building. It accounts for local
regulation as the minimum level, EU requirements as better quality and DfA as the maximum level.
Table 5.38. Summary of requirements for homes16 accessibility by DL 163/2006 and ISO 21542:2011
Feature Portuguese DL 163/2006 ISO 21542:2011
Entrance allow 360° manoeuvring r ≥ 1.5 m
r ≥ 1.5 m ≥ 0.6 m at the latch side of the door. when 180° manoeuvring necessary ≥ 1.6 m x 2.15 m
Hallways W ≥ 1.1 m or W ≥ 0.9 m if L ≤ 1.5 m and no lateral doors
W ≥ 1.2 m (preference W ≥ 1.8 m) Space for 180° turn – w ≥ 1.5 m
Kitchen allow 360° manoeuvring W ≥ 1.2 m
allow 360° manoeuvring – r ≥ 1.5 m free space – W ≥ 1.3 m L ≥ 0.8 m (footprint of a wheelchair user) other specification different from dimensions
Bathroom
≥ 1 complete bathroom (toilet, bidet, washbasin, bathtub or shower base with at least 0.8 m width) allow 360° manoeuvring
Stairs W ≥ 1.0 m W of flight ≥ 1.2 m W of landing ≥ 1.2 m
W free ≥ 1.5 m W of flight ≥ 1.2 m W of landing ≥ 1.5 m
15 According to ISO, work is being done that way, to develop a standard specifically to single family buildings. 16 ISO 21542:2011 does not deal with single family buildings.

E A R L Y S T A G E D E S I G N M E T H O D O L O G Y T O E N S U R E L I F E C Y C L E S U S T A I N A B I L I T Y O F R E S I D E N T I A L B U I L D I N G S
205
5.6.3.1 | Addressing accessibility/design for all in pre-design
Including of this indicator in a sustainability assessment can be discussed. One may say that
accessibility as part of social comfort and quality of life is inherent to sustainability, and thus, it should
be considered. In the other hand, some may say that barrier-free design is a design feature that does
not have an impact on the environmental performance of the building and already is foreseen in
requirements. Thus, it could not make sense to include it in EasyMode.
Contrarily to what may be thought of by many, barrier-free design, or the more embracing term
‘design for all’ has environmental, social, and economic implications, as aforementioned. EIDD as
even stated that it is essential for sustainable development (European Institute for Design and Disability
- Design for all Europe, 2004) and Gossett et al. (2009) analysed their dependency. If dealt with during
design stages, possible maintenance/transformation costs can reduce, as possible actions were already
accounted. This consideration would avoid waste production, use of new materials, pay for the work,
and so forth. Also, even if no incident happens, getting old reduces mobility, driving new needs of
mobility around the home. If the home is designed accounting those needs since its project, its lifetime
can enlarge and thus, reduce costs and environmental impacts and promote life quality.
As the author shares this opinion, designing for all and eventual mobility reduction scenarios,
contributes to improving homes’ sustainability, and thus, the topic is accounted in this work.
As previously said, design for all is a design subject rather than an after-construction aspect regarding
design suitable for all, not just for disable or older people. In this sense, the author chooses to address
this aspect as a guide to ‘design for all’ rather than providing requirements for accessibility. Moreover,
for this reason, the author aimed to go beyond the national and European guidelines for accessibility.
Next, the calculation procedure is exposed and detailed.
5.6.3.2 | Calculation procedure
As dealing with early design stages, the method to include design for all in the EasyMode was defined
as a verification list. The indicator is obtained by the percentage of accessible spaces within the home
(PAs), through the qualitative approach.
EasyMode guides the designers to choose which performance level they are attempting to achieve,
depending on the percentage of usable area that is intended to be accessible to either ISO 21542:2011
or DfA guidelines. To obtain the indicative performance level, designers should establish whether each
room typology – bathrooms/toilet, kitchen, or corridors – is accessible or not, following equation
Eq. 5.46., according to ISO 21542:2011 and DfA principles. When a room is considered accessible
through design for all, it is automatically considered accessible through ISO. The opposite is not valid.

C H A P T E R 5 | E A R L Y S T A G E M O D E L F O R S U S T A I N A B L E D E S I G N – E A S Y M O D E
206
4Q^# = !"#
!#$×100 Eq. 5.46.
where PAsi is the percentage of accessible spaces with the home, !"# is the number of accessible rooms
in room typology i and !#$ is the total number of rooms in the room typology i.
The total percentage of accessible space (PAs) is the sum of the all the accessible rooms. The indicative
performance levels are achieved following Table 5.34 recommendations. It was decided to include
adding a fourth performance level to acknowledge the efforts to promote DfA. For all other levels, the
factor four rule applies.
Table 5.39. Performance levels for accessibility
Level Description Level 1 25% ≤ PAs < 50% according to ISO 21542:2011 requirements Level 2 50% ≤ PAs < 75% according to ISO 21542:2011 requirements Level 3 PAs ≥ 75% according to ISO 21542:2011 requirements
5.6.4 | Maintenance
Maintenance is interwoven with buildings’ sustainability. Without proper maintenance, even the most
efficiently designed building will decay until collapse (Keung & Yiu, 2015). Thus, to extend the
buildings life cycle and improve its sustainability it is essential to consider maintenance activities during
its lifecycle, foreseeing them in the design (Haapio & Viitaniemi, 2008; Lewis, Elmualim, & Riley,
2011; Pulselli, Simoncini, Pulselli, & Bastianoni, 2007; Williams & Dair, 2007). According to Sivo and
Ladiana (2010), there is a common basis for maintenance and sustainability; both share the same
values and goals for a post-industrial ideology and culture.
The materials’ durability defines a building’s capability of preserving its properties over time, having
thus, a direct impact in its lifetime. In this sense, it is essential for the building’s lifetime performance,
and it should be considered during the design. The higher the materials’ durability is, the lower the
time and resources required to maintain it (BRE Scotland, 2006; Mora, 2007). Choosing materials
with greater quality may lead to higher acquisition costs, but it is essential to reduce maintenance costs
(Kovacic & Zoller, 2015). Local environmental characteristics such as rain, wind, sunlight, snow, and
so forth, will contribute to the materials decay and therefore maintenance will be required. Depending
on the degradation level of the building materials and products, the intervention costs rise
exponentially (Sitter Law). Thus, periodic maintenance, which requires modest spending, can
effectively abate costly repairs, controlling the lifecycle cost of the building (Barros, 2008; Province of
Manitoba). Moreover, maintenance and durability can expand a component’s lifecycle, slowing down
the path from resource to waste.

E A R L Y S T A G E D E S I G N M E T H O D O L O G Y T O E N S U R E L I F E C Y C L E S U S T A I N A B I L I T Y O F R E S I D E N T I A L B U I L D I N G S
207
5.6.4.1 | Maintenance at early design
The importance of considering maintenance activities at early design stages and in BSA tools is
defended not just in the scientific community (Haapio & Viitaniemi, 2008; Kreiner, Passer, &
Wallbaum, 2015; Kylili, Fokaides, & Lopez Jimenez, 2016; Sivo & Ladiana, 2010) but also in the
International Standards (CEN, 2012a; ISO, 2011a).
According to EN 15643-3:2012, maintainability is the ‘ability of a component, an assembled system, or a
construction work to be retained in a state in which it can perform its required functions or be restored to such a state when
a fault occurs’; maintenance means the ‘combination of all technical and associated administrative actions during the
service life to retain a building or an assembled system in a state in which it can perform its required functions’. These
actions include cleaning, servicing, repairing, repainting, replacing parts where needed, etc. (CEN,
2012a). ISO 15686-1:2000 states the decisions critical to service life (SL) should be taken at the earliest
stages of design. Service life planning is essential to ensure that the SL meets or exceed the design life
(DL) (ISO, 2011a). To seek so, planning cyclical maintenance should be anticipated at the design stage.
According to this standard, the maintenance activities that should be accounted in planning are:
• Change of interior finishing;
• Removal/change of partitioning;
• Replacement and change of services installations;
• Change of roof waterproofing;
• Partial removal or replacement of load-bearing elements.
The EU supports that maintenance operations shall be evaluated through its consequences for users
and neighbourhood. EN 16309:2014 endorses that the following aspects shall be assessed:
• Provision of an operation, maintenance and cleaning plan and log book for the building;
• Health and comfort impacts for the users during maintenance;
• Frequency and time needed for regular maintenance;
• Usability of the building while maintenance tasks are being carried.
Hence, addressing maintenance shall be based on the estimated service. EN 16309:2014 recommends
following the guides and rules from ISO 15686-1:2011 series including factors such as:
• Resistance to pollutants, corrosion;
• Weather effects;
• Necessary cleaning;
• Ease of access;
• Accessibility without dismantling/removal of other building components.

C H A P T E R 5 | E A R L Y S T A G E M O D E L F O R S U S T A I N A B L E D E S I G N – E A S Y M O D E
208
The SL of inaccessible components of the building should meet or exceed the building’s SL, to remain
functional throughout it, but the service life of accessible parts may be shorter (ISO, 2011a). When this
occurs, they need maintenance or refurbishment. ISO 15686-1:2011 recommends the minimum
design lives for building components according to Table 5.40.
Maintenance activities and planning are addressed throughout the several BSA tools. Commissioning,
when addressed, is considered separately. BSA tools considering these aspects are CASBEE, Open
House*, SBTool, and DGNB.
Table 5.40. Suggested minimum design lives for components (ISO, 2011)
Design life of building
Inaccessible or structural components
Components where replacement is
expensive or difficult
Major replaceable components
Building services
150 150 100 40 25 100 100 100 40 25 60 60 60 40 25 25 25 25 25 25 15 15 15 15 15 10 10 10 10 10
Note: easy to replace components may have DL of 3 or 6 years.
5.6.4.2 | Maintenance in EasyMode
In EasyMode, a detailed assessment is not possible for maintenance activities. In one hand, there is few
data regarding the building major elements and systems, hampering a comprehensive evaluation. In
other hand, designers at this stage, require a straightforward and practical yet accurate method to
guide and evaluate their early decisions. Corroborating this fact is SBTool International, as for a
dwelling assessment in project phase, maintenance aspects are not even considered.
Materials durability, resistance to pollution and weather and ease of access are main aspects when
seeking to improve building sustainability quality (CEN, 2011a; 2014; ISO, 2011a). Hence, these
aspects were considered and are explained shortly in this work.
This indicator intends to address how easy can a building be maintained and how to plan for
maintenance to happen. Keeping a maintenance plan up-to-date, easy maintenance and cleaning
operations prevent significant impacts on the daily life of occupants, on the environment and the life-
cycle costs of the building.
Building design should be such that the building, its equipment and systems require little maintenance.
For instance, preference should be given to smooth and uniform finishing materials. Glass components
that need considerable cleaning works should be donated with easy accesses or cleaning enablers; often
glass is in high weights and needs cleaning on both sides.

E A R L Y S T A G E D E S I G N M E T H O D O L O G Y T O E N S U R E L I F E C Y C L E S U S T A I N A B I L I T Y O F R E S I D E N T I A L B U I L D I N G S
209
With this in mind, the maintenance indicator includes three main aspects that are thought to be of
major importance to consider when designing a building:
• Cleaning necessities;
• Building commissioning/maintenance plan;
• Ease of maintenance.
Cleaning activities embed resources consumption (energy, water, materials), costs, and social impacts
(disruption of daily activities). Lowering cleaning requirements, the maintenance costs can diminish,
environmental impacts reduce and social quality can increase. Building design decisions can easily
guide per se to more efficient cleaning activities.
Keeping a maintenance plan (periodic inspections) or having the building commissioned ensures that
building facilities and systems operate according to design intent and in their major efficiency. It avoids
greater expenditures by preventing bigger problems that could be solved with small repairs and
replacements. Also, it helps in prolonging the service life of the house, and hence diminishing
environmental impacts and life cycle costs. For instance, if the roof tiles are inspected periodically, and
few broken ones are replaced, water infiltrations, which could damage other building elements or
systems that would then require repair or replacement, will be avoided. Building commissioning is not
commonly linked to detached houses but having a detailed maintenance plan, with schedules and key
elements and systems to be periodically inspected is essentially having a commission plan for the
building (Caffi & Rejna, 2000; Sivo & Ladiana, 2010).
The evaluation procedure aims to provide a guide to implement a maintenance plan (building
commissioning plan) and to acknowledge the effort devoted to it. During the building life cycle phases,
there is the need for different commissioning plans, according to the three main stages: (i) design; (ii)
construction and (iii) operation. Both design and construction phases commissioning are
recommended in the maintenance planning and commissioning sub-indicator.
Next, the calculation procedure to each parameter is presented.
5.6.4.3 | Calculation procedure
Cleaning
Glass surfaces need to be cleaned from time to time, to keep aesthetics, allow daylight penetration, and
so forth. Exterior cleaning can be a quite difficult task, dangerous and hence expensive service when
the access to them is not adequately covered during design phases. To consider that a glass surface is
easily accessible one of the two following aspects should be included during design: (i) exterior glass
surface can be safely cleaned from the inside and; (ii) the distance of the upper edge of the glass surface

C H A P T E R 5 | E A R L Y S T A G E M O D E L F O R S U S T A I N A B L E D E S I G N – E A S Y M O D E
210
to the floor should not be more than 2.5 m. (the distance can be to a balcony or the ground floor).
Figure 5.28 is a schematic representation of easily accessible glass surfaces.
This sub-indicator is qualitatively assessed, by the expected percentage of the exterior glass surface
that is easily accessible for cleaning (PSa) using the quantitative approach. Thus, designers can either
indicate the percentage they are willing to attain, or indicate the performance level and get the
corresponding required percentage. Table 5.41. presents the indicative performance levels, based on
OpenHouse (2010). It was decided to include a fourth level to reward design that fully considers easy
cleaning. As in all other indicators, design can add alternatives and compare the results.
Figure 5.28. Schematic representation of cleaning accessibility of external glass surfaces
Table 5.41. Performance level's establishment according to area percentage
Performance levels Description
Level 1 More than 10% of the external glass surface is not easily accessible (basket cranes, climbing belts etc. are needed)
Level 2 Less than 90% of external glass surface is easily accessible and the rest have catwalks or ladders.
Level 3 More than 90% of external glass surface is easily accessible and the rest have catwalks or ladders.
Level 4 All the glass area is easily accessible for cleaning
Maintenance plan and commissioning
A maintenance plan and commissioning intend to promote life cycle thinking by establishing the needs
for maintenance during design. It is important to bear in mind that a team should be assigned during
design for the dimensioning, installation, and trials of the building systems (heating, hot water
preparation, supplies, and so forth) during construction and building delivery.
This indicator is qualitatively assessed, using the efforts approach. These are intended to aid defining
the goals to attain towards establishing maintenance and commissioning plans (Table 5.42).
Nevertheless, supplementary information will be given to designers, to aid achieving a better indicative
performance level. Table 5.43 summarises main aspects to be commissioned. It is not intended to be
an exhaustive list but an aid. The list is not exhaustive but summarises most important aspects to be
commissioned (Table 5.44). Alternatives can be added and achieved performances compared.
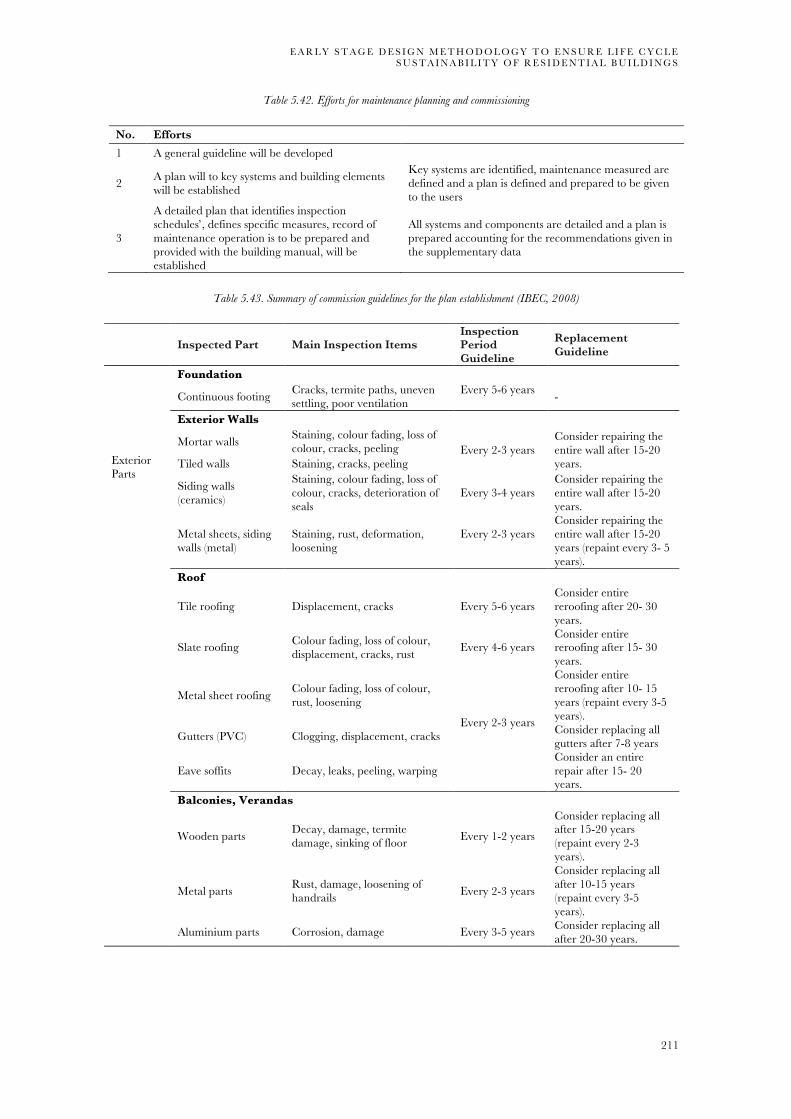
E A R L Y S T A G E D E S I G N M E T H O D O L O G Y T O E N S U R E L I F E C Y C L E S U S T A I N A B I L I T Y O F R E S I D E N T I A L B U I L D I N G S
211
Table 5.42. Efforts for maintenance planning and commissioning
No. Efforts
1 A general guideline will be developed
2 A plan will to key systems and building elements will be established
Key systems are identified, maintenance measured are defined and a plan is defined and prepared to be given to the users
3
A detailed plan that identifies inspection schedules’, defines specific measures, record of maintenance operation is to be prepared and provided with the building manual, will be established
All systems and components are detailed and a plan is prepared accounting for the recommendations given in the supplementary data
Table 5.43. Summary of commission guidelines for the plan establishment (IBEC, 2008)
Inspected Part Main Inspection Items Inspection Period Guideline
Replacement Guideline
Exterior Parts
Foundation
Continuous footing Cracks, termite paths, uneven settling, poor ventilation
Every 5-6 years -
Exterior Walls
Mortar walls Staining, colour fading, loss of colour, cracks, peeling Every 2-3 years
Consider repairing the entire wall after 15-20 years. Tiled walls Staining, cracks, peeling
Siding walls (ceramics)
Staining, colour fading, loss of colour, cracks, deterioration of seals
Every 3-4 years Consider repairing the entire wall after 15-20 years.
Metal sheets, siding walls (metal)
Staining, rust, deformation, loosening
Every 2-3 years
Consider repairing the entire wall after 15-20 years (repaint every 3- 5 years).
Roof
Tile roofing Displacement, cracks Every 5-6 years Consider entire reroofing after 20- 30 years.
Slate roofing Colour fading, loss of colour, displacement, cracks, rust Every 4-6 years
Consider entire reroofing after 15- 30 years.
Metal sheet roofing Colour fading, loss of colour, rust, loosening
Every 2-3 years
Consider entire reroofing after 10- 15 years (repaint every 3-5 years).
Gutters (PVC) Clogging, displacement, cracks Consider replacing all gutters after 7-8 years
Eave soffits Decay, leaks, peeling, warping Consider an entire repair after 15- 20 years.
Balconies, Verandas
Wooden parts Decay, damage, termite damage, sinking of floor Every 1-2 years
Consider replacing all after 15-20 years (repaint every 2-3 years).
Metal parts Rust, damage, loosening of
handrails Every 2-3 years
Consider replacing all after 10-15 years (repaint every 3-5 years).
Aluminium parts Corrosion, damage Every 3-5 years Consider replacing all after 20-30 years.

C H A P T E R 5 | E A R L Y S T A G E M O D E L F O R S U S T A I N A B L E D E S I G N – E A S Y M O D E
212
Table 5.43. Summary of commission guidelines for the plan establishment (IBEC, 2008) (cont.)
Inspected Part Main Inspection Items Inspection Period Guideline
Replacement Guideline
Structural Frames
Flooring, Frames, Roof trusses
Base, flooring Decay, rust, termite damage, sinking of floor, creaking Every 4-5 years
Consider replacing all except base after 20-30 years (reapply preservative treatment and termite repellent after 5-10 years).
Structural Frames
Pillars, beams Decay, damage, termite damage, cracks, slanting, deformation
Every 10-15 years
-
Walls (interior) Cracks, leaks, joint fractures, decay, termite damage, rust
Ceilings, roof trusses Decay, rust, peeling, warping,
leaks, termite damage, cracks
Stairs Sinking, decay, rust, termite damage, cracks
External Work and Others
Others
Mailbox Unstable fixing, damage, corrosion, deformation
Every year
Consider complete replacement after 10-25 years.
Gates, fences Slanting, peeling, cracks - Alarm equipment
Malfunction, damage Consider complete replacement after 12-18 years Security equipment
Indoor Parts
Floor Finish
Wood floor Creaking, warping, dirt As needed Consider according to conditions.
Carpeted floor Mould, mites, dirt Full-scale cleaning every 1-2 years
Consider re-carpeting every 6-10 years.
Tatami floor Unevenness, mites, discoloration, dirt
Tatami drying 1-2 times a year, tatami reversal every 2-3 years.
2-3 years after reversal
Vinyl floor Peeling (curling), dirt, cracks due to deterioration As needed Consider according to
conditions. Entrance floor Dirt and cracks on tiles etc., peeling
Wall Finish Walls with vinyl wallpaper Mould, peeling, dirt
As needed Consider according to conditions.
Walls with textile-type wallpaper Wooden board walls, fancy plywood walls
Loosening, peeling, discoloration, dirt, cracks
Fibber-/sand-coated walls Peeling, dirt
Indoor Parts
Ceiling Finish Japanese-style room ceiling (fancy plywood boards with spaces in between) Staining, dirt As needed Consider according to
conditions. Western-style room ceiling (vinyl-wallpapered finish)

E A R L Y S T A G E D E S I G N M E T H O D O L O G Y T O E N S U R E L I F E C Y C L E S U S T A I N A B I L I T Y O F R E S I D E N T I A L B U I L D I N G S
213
Table 5.43. Summary of commission guidelines for the plan establishment (IBEC, 2008) (cont.)
Inspected Part Main Inspection Items Inspection Period Guideline
Replacement Guideline
Fixtures
Exterior Fixtures Entrance fixtures Gaps, opening/closing
malfunction, corrosion, problems with attached metal parts Every 2-3
years
Consider replacing after 15-30 years (adjust fit as needed).
Aluminium sashes
Rain shutter doors, screen doors Rust, decay, fitting problems
Wooden parts of window frames, door storage cases, etc.
Decay, leaks, caulking problems Every 2-3 years
Consider when replacing exterior fixtures.
Fixtures
Interior Fixtures
Wooden fixtures Gaps, opening/closing malfunction, problems with attached metal parts
Every 2-3 years
Consider replacing after 10-20 years (adjust fit as needed).
Sliding paper doors, sliding paper screens
Gaps, opening/closing malfunction, damage, dirt
Change paper screens every 1-3 years.
Consider replacing after 10-20 years (adjust fit as needed).
Facilities
Plumbing Facilities
Water-supply pipes Leaks, rusty water
Every year
Consider replacing all after 15-20 years.
Faucet equipment Leaks, wear of packings, degradation of plastic parts
Consider replacing after 10-15 years (replace packings every 3-5 years).
Drainpipes, traps Leaks, clogging, bad odour
Consider replacing all after 15-20 years.
Kitchen sink, bathroom facilities
Leaks, cracks, corrosion, poor ventilation, rust, wear of sealing, dirt
Toilet Lavatory basin and tank leaks, bad odour, mould, poor ventilation, patina on metal parts, clogging
Bathroom
Tile finish Cracks in tiles, dirt, mould, deterioration of sealing, clogging of drain outlet Every year Consider replacing all
after 10-15 years. Unit bath Cracks in joint parts, gaps, dirt,
mould, clogging of drain outlet Gas Facilities
Gas pipes Gas leaks, deterioration, and aging of pipes
Every year Aging and deterioration of pipes
Consider replacing all after 15-20 years.
Hot-water supply equipment
Water leaks, gas leaks, problems with equipment
Consider replacing after 10 years.
Others Ventilation equipment (fans) Malfunction
Every year
Consider replacing all after 15-20 years.
TV reception equipment (antennas, etc.)
Unstable fixing, damage, rust, deformation
Consider replacing all after 12-18 years.
Electrical equipment (outlets, etc.)
Malfunction, damage Consider replacing all after 15-20 years.
(Note) The Inspection Period Guideline and Replacement Guideline vary significantly depending on the conditions of the building site, construction cost, and usage conditions as well as the degree of daily checks and maintenance. The figures listed above are rough general guidelines.

C H A P T E R 5 | E A R L Y S T A G E M O D E L F O R S U S T A I N A B L E D E S I G N – E A S Y M O D E
214
Table 5.44. Performance level's establishment according to level of detail given to a maintenance plan elaboration
Performance level Description Level 1 Effort n. 1 will be implemented Level 2 Effort n. 2 will be implemented Level 3 Effort n. 3 will be implemented
Ease of maintenance
Ease of maintenance sub-indicator aims at evaluating how easy it is to replace and access the supply
pipes, cables and wires, and main building structure. As the previous sub-indicator, this is also
addressed through the efforts approach. The efforts aim to assure that building structure of accessible
for maintenance or its service life is assured to be at least equal to the building’s design life and intends
to drive designers to select construction solutions that enable easy access to services supply (Table 5.45).
The building performance will be higher if more measures are implemented. The indicative
performance levels follow the description shown in Table 5.46. As in all other indicators, designers can
compare alterative solutions.
Table 5.45. Efforts for ease of maintenance
No. Efforts
1
Access to specific areas
[1] Easy access to roof and/or terraces will be created for maintenance activities
2 [2] Load-bearing primary structure will be made easily accessible or after removing attached components for maintenance activities
3 [3] Supply networks will not be buried and mixed allowing easy access and replacement
4 Openings for inspection [1] Different openings will be crates to ease cleaning and inspection
5 Building systems [1] Technical areas will be planned to facilitate the access to building systems will be planned to ease future maintenance activities
6 Other
Table 5.46. Performance level's establishment according the number of measure to be taken to ease the access to the services supply wires and pipes
Performance levels Access to supply wires and pipes Level 1 Two efforts will be taken Level 2 Three efforts will be taken Level 3 Four or more efforts will be taken
5.7 | PLACE
The site natural conditions, geography and environment should guide the building’s planning and
construction. Local fauna and flora, hydrology, microclimate, geography, and geology should be
studied to improve the building’s sustainability. As already presented adapting the building to local
conditions, improve wellbeing and reduces energy needs. Also, a place character should be followed.
This category focuses land use, local ecology and. It consists of two main indicators: (i) efficient land

E A R L Y S T A G E D E S I G N M E T H O D O L O G Y T O E N S U R E L I F E C Y C L E S U S T A I N A B I L I T Y O F R E S I D E N T I A L B U I L D I N G S
215
use, and (ii) cultural value. Efficient land use indicator encompasses four sub-indicators: (i) reuse of
previously built or contaminated land; (ii) implementation optimisation; (iii) soil permeability and; (iv)
native flora species. The cultural value focuses on the preservation of local identity, heritage, and sense
of belonging, in one indicator only.
5.7.1 | Initial recommendations
When designing a building, it is essential to carry out a deep analysis of the site previously, as its
conditions and constraints should drive the design. An area should be understood to provide the
conditions for planning (Bokalders & Block, 2010). Layout and construction technologies should be in
line with the site’s geology, topography, and climate conditions. Briefly, the following significant
aspects should be considered when planning a building:
• Adaptation to natural surroundings:
o Local conditions;
o Geology and topography;
o Hydrology;
o Flora and fauna;
o Adaptation to climate.
• Social fabric:
o Sustainable municipality (amenities);
o Traffic;
o People;
o Cultural values.
Adaptation to natural surrounding is substantially dealt with in this category but also considered
indirectly in other categories’ indicators such as passive design.
From the social fabric side, there are several aspects that not being in the scope of designers’
responsibilities nor capabilities to improve, under sustainability principles. For instance, the vicinity to
amenities or public transports network to depend on the designers’ efforts, thus, their efforts to plan a
sustainable building should not be hampered by the inadequacy of those aspects for a given site.
Nevertheless, preserving local cultural values and its genius loci is in the designers’ hands to cope with.
Aspects like noise control to the exterior during construction and operation, or designers can account
the building's contribution to the community development. Noise control during operational phase
has been considered in health and comfort category. During construction, it is important to bear in
mind that noise should be avoided and monitored as much as possible.

C H A P T E R 5 | E A R L Y S T A G E M O D E L F O R S U S T A I N A B L E D E S I G N – E A S Y M O D E
216
For community development, building or rehabilitating a home can improve the neighbourhood
development. It contributes to preserving and regenerating the neighbourhood, improving quality of
life, social cohesion, and sense of security (Martinelli, Battisti, & Matzarakis, 2015). Also, the settlement
of a new family aids invigorating local economies through daily households’ purchases.
5.7.2 | Efficient land use
To promote urban sustainability the environmental impacts should not be spread to the outside of the
urban space (Pacione, 2003; Steemers, 2003). Land use has increased more than what it was required
by the population growth, making the available areas scarcer and diminishing natural biodiversity and
ecosystems. Meaning that built area per capita increased as the land taken from forests and agriculture
for urban sprawl occurred. There are major environmental, social, and economic problems related to
urban sprawl. Soil sealing is the permanent covering of the land surface of any impermeable and semi-
impermeable artificial material (Prokop, Jobstmann, & Schönbauer, 2011). It represents a major threat
regarding both permanent loss of soil as a resource and its substantial impacts on soil functionality
(European Environmental Agency, 2006). Soil sealing is highly linked with land take or consumption,
which is regarded as the development of open areas (p. ex. agricultural land and forests) into build-up
areas. EU studies shown that between 1990 and 2006 there was an increase of 8.8% in soil sealing. In
2006, the total sealed soil in EU corresponded to an average of 200 m2 per citizen. Thus, actions must
be taken to comply with EU target for 2050 - have no land take (European Commission, 2012). Soil
sealing results in several environmental and social problems. It exerts major pressure on water
resources, reducing the amount of rainfall absorbed, increasing the time taken for water to reach rivers,
which thus, increases water surface runoff and flood risks (Pauleit & Duhme, 2000; Pistocchi, Calzolari,
Malucelli, & Ungaro, 2015). Also, it drives loss of fertile agricultural areas (Ciro Gardi, Panagos, Van
Liedekerke, Bosco, & De Brogniez, 2014), causes changes in carbon storage (Pouyat, Yesilonis, &
Nowak, 2006; Sallustio, Quatrini, Geneletti, Corona, & Marchetti, 2015), promotes habitat
fragmentation and biodiversity loss, and improves loss of urban green areas (C. Gardi, Jeffery, &
Saltelli, 2013; Turbé et al., 2010). Also, as cities expand new infrastructures are required, the travelling
distances increase, meaning more CO2 emissions from traffic, more time spent in home-work-home
travelling and more expenses with travel costs (Mateus & Bragança, 2011). Looking to buildings, from
the environmental side the smaller the built area per person is, the more efficient the building is.
Meaning that an urban area to lodge the same number of people would require much more area if all
the buildings were single family. Nevertheless, within a given allotment area, the ratio of the gross area,
should be as close to one as possible (Andrade & Bragança, 2016). This would make sure no land is
unexploited, making land use more efficient. However, most land use evaluations are centred in the
ratio of gross floor area and the allotment area which does not truly enable buildings comparison. In
this sense, different authors have proposed that new criteria should be included in the land use
evaluation than just assessing the gross floor area (Barbosa, Bragança, & Mateus, 2015; Saari, Tissari,
Valkama, & Seppanen, 2006).

E A R L Y S T A G E D E S I G N M E T H O D O L O G Y T O E N S U R E L I F E C Y C L E S U S T A I N A B I L I T Y O F R E S I D E N T I A L B U I L D I N G S
217
The urban sprawl, social demography over time, and the inadaptability of buildings drove buildings
abandonment and new construction expansion. It is frequent to see many derelict buildings in city
centres. The sites were those buildings are can be considered as brownfields. A brownfield can be
defined as previously developed land that is derelict and possibly contaminated but has a potential for
being redeveloped. These sites are often in infill locations, contrarily to greenfield land (Wedding &
Crawford-Brown, 2007). If looking only for the residential built environment, considering that 87% of
it are single family buildings, at least 647 061 potential brownfields are arising from vacant homes.
Re-developing these spaces instead of using greenfield can be noteworthy. Urban sprawl is avoided,
promoting all the environmental benefits associated with it (Loures & Vaz, 2016; Sassi, 2006). When
recurring to greenfield land for new construction, it often promotes urban sprawl, disturbing natural
ecosystems and affecting its biodiversity (Pauleit & Duhme, 2000).
Moreover, it is important to bear in mind that every time a building in erected it potentially endangers
the ecologic value of the site. Recommendations are given for the use of lands of low ecologic value.
This value depends on existing fauna and flora species, and watercourses (Department for
Communities and Local Government, 2010). In Portugal, the areas with greater ecological values are
protected by the different documents comprising the national territory plans. At the national level,
there is defined a National Protected Areas Network (RNAP), preserving areas of high ecological value
from being jeopardised. At municipal levels, each County has its Municipal Master Plan which
indicates the areas that can be developed and those that do not.
In this sense, when planning a building, it is essential to study the building’s implementation and
design, aiming to diminish ecological impacts if not improving whenever possible. It is known that the
design team does not select the site and thus, the fact that it is previously developed does not depend
on designers’ choice. However, a building sustainability also depends on it. Nevertheless, if a site has
a previously developed area, its full re-development is in the hand of designers to promote.
Another relevant aspect of land use is its role in the local biodiversity, as already mentioned. To
preserve and enhance it, beyond avoiding urban sprawl and expansion of sealed soil by redeveloping
brownfields and promoting soil permeability either a green or brown fields, it is essential to improve
the site fauna and flora preservation. A way to do it is to use native plant species in the exterior gardens.
Native species are those originating from a specific place and have been there for several generations.
These are perfectly adapted to local climate and co-existing fauna and flora, thus do not require
especial care. For this reason, native species are of major relevance for local biodiversity. Portugal has
in action a plan and legislation to control the invasion of non-indigenous species ("Decreto-Lei n.º
565/99," 1999).
Most of BSA tools consider land use aspects in their assessment procedures (Andrade & Bragança,
2016; Huo, Yu, & Wu, 2017). It is assessed by a group of criteria direct or indirectly, such as the share
of previously developed land in the building site; land use efficiency by the ratio of gross floor area and

C H A P T E R 5 | E A R L Y S T A G E M O D E L F O R S U S T A I N A B L E D E S I G N – E A S Y M O D E
218
the allotment area; soil sealing index or use of native species (Department for Communities and Local
Government, 2010; German Sustainable Building Council, 2014; Mateus & Bragança, 2016; U.S
Green Building Council, 2014).
5.7.2.1 | Efficient land use in EasyMode
This indicator aims to promote effective use of the site, ensuring the preservation or even enhancement
of its ecological value. By considering it, designers contribute to minimise the building’s environmental
impact, avoids the use greenfield sites, valorise sites already developed and rehabilitation works.
Additionally, promoting interaction with natural environment improves awareness to its benefits.
This indicator encompasses four sub-indicators: (i) reuse of previously built or contaminated land;
(ii) implementation optimisation; (iii) soil permeability and; (iv) native flora species as presented next.
5.7.2.2 | Calculation procedure
Reuse of previously developed or contaminated land
In early design phases, the assessment of previously developed land is possible. Even if the exact areas
to be intervened are not defined, estimation of a percentage is possible. The evaluation of this indicator
is given by the proportion of an area previously developed, within the allotment area. To the scope of
this indicator, an area can be considered as previously developed if it was occupied by a permanent
structure or was previously contaminated with industrial waste (but has been remediated before
construction). Agricultural or forestry buildings, built-up areas in parks or recreational areas or areas
in which it was decided to build in for control reasons (sites as mineral extraction, landfill, and so forth)
cannot be considered within previously developed land (BRE, 2015).
With this in mind, the percentage of previously developed area (PPDA) can be achieved through one
of two ways. First, if designers do not have an estimation of the intervened area, but can roughly
estimate how much of the allotment area is pre-developed, the PPDA is given by this estimation.
Second, if the areas to be intervened and pre-developed are known, PPDA is obtained by Eq. 5.47.
445Q =45Q%Q
×100 Eq. 5.47
where PDA is the previously developed area (m2), and IA is the area to be intervened (m2). The IA is
the sum of the total deployment area and the changed landscape area not considered in the former.
Designers are thus asked to add the intervened and pre-developed areas, in percentage or square
metres, with which the PPDA is calculated automatically. The indicative performance comprises three
levels as shown in Table 5.47, following the factor four rule (von Weizsäcker et al., 1998).

E A R L Y S T A G E D E S I G N M E T H O D O L O G Y T O E N S U R E L I F E C Y C L E S U S T A I N A B I L I T Y O F R E S I D E N T I A L B U I L D I N G S
219
Table 5.47. Indicative performance levels for Reuse of previously developed or contaminated land
Level Description Level 1 25% ≤ PPDA < 50% Level 2 50% ≤ PPDA < 75% Level 3 PPDA ≥ 75%
Additional alternatives can be added. If so, EasyMode will automatically calculate each alternative
performance level and present the results comparison.
Implantation efficiency
At early design, it is possible to quantify the efficacy of land use. This sub-indicator can aid designers
guarantee the best use of the site, bearing in mind the legal requirements. It was developed considering
the Portuguese land use and soil occupation indexes provided by the Municipal Master Plans (MMP)
and the need to consider the number of predicted occupiers.
The Occupation Efficiency (OE) was determined by affecting the Occupation Density (OD) for
housing, which relates the Number of Occupants (No) to the gross external area (GEA), as defined by
Eq. 5.48 (occupant/m2), with the site dependent indexes iLU (Eq. 5.49) – land use index – and iso
(Eq. 5.50) – soil occupation index –established by the MMP to evaluate the construction capacity of
the land.
ú5 =iXç{Q
Eq. 5.48
7èj =ç{QQQ
Eq. 5.49
7êa =Ö5QQQ
Eq. 5.50
where AA is the allotment area17 (m2), GEA is the gross external area (m2), TDA is the total deployment
area18 (m2), and No is the number of occupants.
Considering an environmental perspective, the closer iSU and iSO are to 1 and the higher the OD, the
better. This assumption for the OD may conflict with comfort needs. However, indicator I13.2 (area
availability per occupant) can balance this matter. There are legal maximum and minimum requisites
that cannot be neglected. MMP impose a maximum iLU and a minimum GEA per building typology
(depended on the number of bedrooms), which is indirectly related to the number of occupants per
17 AA – allotment area – a portion of delimited territory in horizontal projection by a closed polyline resulting from an allotment operation approved under Decreto Regulamentar 9/2009. 18 TDA – total deployment area – the sum of the deployment areas of all existing or planned buildings, which are corresponding to the soil area occupied by the building, contained within a closed polygon which comprises the exterior perimeter of contact of the building with the soil and the outer perimeter of the exterior walls of the basement floors

C H A P T E R 5 | E A R L Y S T A G E M O D E L F O R S U S T A I N A B L E D E S I G N – E A S Y M O D E
220
building. On the other hand, no limitations are given to iso other than land impermeability. The TDA
is roughly related to the impermeable area of a building development. As EasyMode has a dedicated
sub-indictor to soil permeability, to avoid double accounting, it was decided to withdraw iSO from
‘implantation efficiency’ although keeping the denomination. Moreover, to ease understanding, it was
decided to reverse OD so to have square meters per person, instead of the opposite. Perhaps having a
35 m2/p value is more readable and understandable than having 0.03 p/m2 besides, one either has
one person in a place or none, considering just parts of a person would not make sense. Thus, the IE
indicator was established according to equation Eq. 5.51.
%{# = 7èjB×1ú5#
Eq. 5.51
The OD for housing allows the technician to have a wider perception of the implementation efficiency
without accounting for comfort issues, which depend on the construction typology and respective
minimum GEA (RGEU, "Decreto-Lei n.º 38:382/1951," 1951). The IE formulation can be simplified:
%{# =ç{QQQ
×ç{QiX#
=ç{QN
QQ×iX# Eq. 5.51
In this sense, designers are requested to indicate the following:
• expected GEA;
• expected building typology (n. of bedrooms);
• Maximum allowed land use index;
• Expected number of occupants.
The indicative performance levels are dependent on the building typology and location. In this sense,
the factor four rule was applied to the IE - IEl (legal IE) - calculated with the legal values for 7èj8"ù
and 1/ODmin for the given place and building typology, according to Table 5.48.
Table 5.48. Indicative performance level for implantation efficiency
Level Description Level 1 > 25% IEi < 50% of IEl Level 2 ≥ 50% IEi < 75% of IEl Level 3 IEi ≥ 75% of IEl
Soil permeability
To cope with EU 2050 targets and due to its relevance and applicability at early design phases,
evaluation of soil sealing was included in EasyMode. Its main aim is to promote soil permeability,
reducing the adverse impacts of artificially sealed surfaces. The assessment considers the soil
permeability index (SPi), given by the ratio of the permeable area of the building and the minimum
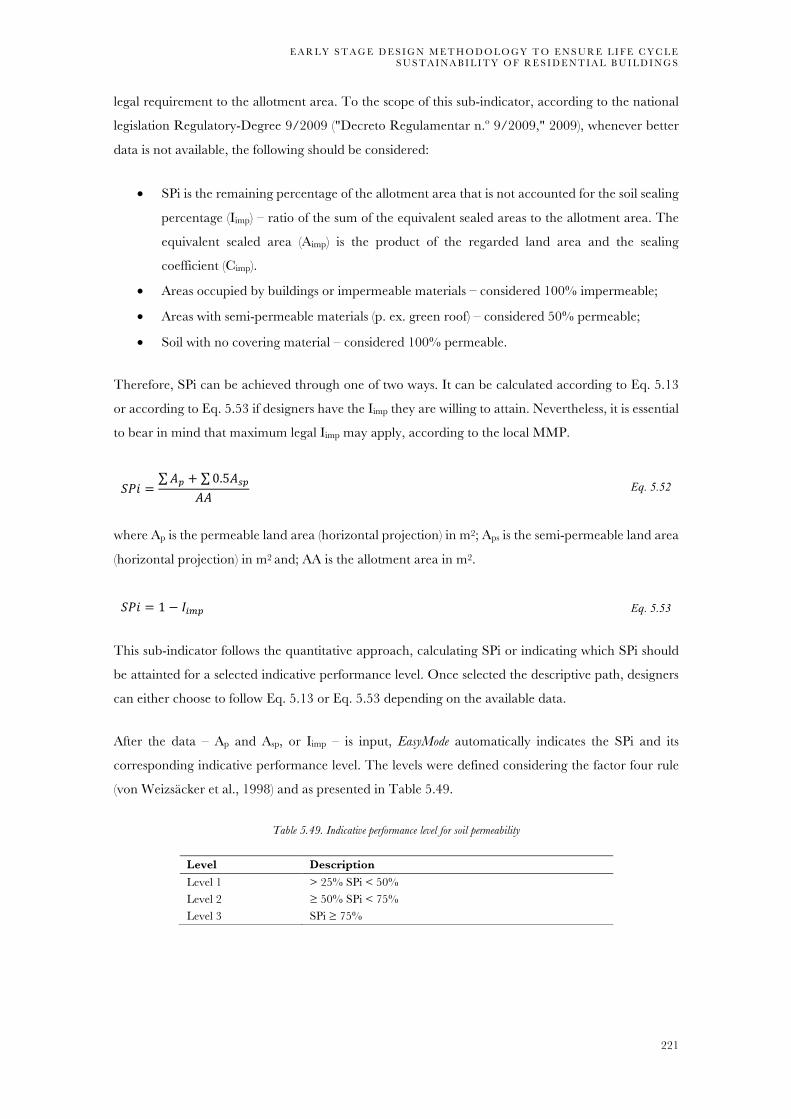
E A R L Y S T A G E D E S I G N M E T H O D O L O G Y T O E N S U R E L I F E C Y C L E S U S T A I N A B I L I T Y O F R E S I D E N T I A L B U I L D I N G S
221
legal requirement to the allotment area. To the scope of this sub-indicator, according to the national
legislation Regulatory-Degree 9/2009 ("Decreto Regulamentar n.º 9/2009," 2009), whenever better
data is not available, the following should be considered:
• SPi is the remaining percentage of the allotment area that is not accounted for the soil sealing
percentage (Iimp) – ratio of the sum of the equivalent sealed areas to the allotment area. The
equivalent sealed area (Aimp) is the product of the regarded land area and the sealing
coefficient (Cimp).
• Areas occupied by buildings or impermeable materials – considered 100% impermeable;
• Areas with semi-permeable materials (p. ex. green roof) – considered 50% permeable;
• Soil with no covering material – considered 100% permeable.
Therefore, SPi can be achieved through one of two ways. It can be calculated according to Eq. 5.13
or according to Eq. 5.53 if designers have the Iimp they are willing to attain. Nevertheless, it is essential
to bear in mind that maximum legal Iimp may apply, according to the local MMP.
347 =QP + 0.5Q^P
QQ Eq. 5.52
where Ap is the permeable land area (horizontal projection) in m2; Aps is the semi-permeable land area
(horizontal projection) in m2 and; AA is the allotment area in m2.
347 = 1 − %#8P Eq. 5.53
This sub-indicator follows the quantitative approach, calculating SPi or indicating which SPi should
be attainted for a selected indicative performance level. Once selected the descriptive path, designers
can either choose to follow Eq. 5.13 or Eq. 5.53 depending on the available data.
After the data – Ap and Asp, or Iimp – is input, EasyMode automatically indicates the SPi and its
corresponding indicative performance level. The levels were defined considering the factor four rule
(von Weizsäcker et al., 1998) and as presented in Table 5.49.
Table 5.49. Indicative performance level for soil permeability
Level Description Level 1 > 25% SPi < 50% Level 2 ≥ 50% SPi < 75% Level 3 SPi ≥ 75%

C H A P T E R 5 | E A R L Y S T A G E M O D E L F O R S U S T A I N A B L E D E S I G N – E A S Y M O D E
222
Native flora species
This sub-indicator is qualitatively evaluated through the verification of the efforts presented in
Table 5.23. The efforts’ approach is then used in this quantification. The indicative performance levels
follow the description shown in Table 5.51. As in all other indicators, designers can compare
alternative solutions.
Table 5.50. Efforts for improving biodiversity through native species use
No. Efforts 1 Efforts are made to ensure continuity of existing greenery
2 Efforts are made to ensure that new greenery corresponds to native plant species (at least 30% of green area should be filled with native species)
3
Efforts will be made to promote local fauna and flora development, for e.g.: 1. ensure spaces for wild birds to hide or nest; 2. ensure trees to feed wild birds; 3. maintain watering areas for wild birds to drink water or bathe; 4. porous materials are effectively used to allow small animals to live and
grow.
Table 5.51. Indicative performance level for native species
Level Description Level 1 Effort n. 1 will be implemented Level 2 Two efforts will be implemented Level 3 The three efforts will be implemented
5.7.3 | Cultural value
Sustainability should not be considered without taking into account cultural values. Cultural customs
and traditions shape the perceptions of quality of life and well-being, having the potential to trigger
the behavioural changes needed to attain sustainability (Masri, Yunus, & Ahmad, 2016; Opoku, 2015).
In 1995, UNESCO defined cultural pillar of community development as the whole complex “of
distinctive spiritual, material, intellectual and emotional features that characterise a society or social group. It includes not
only the arts and letters but also modes of life, the fundamental rights of the human being, value systems, traditions and
beliefs.” (Duxbury, Gillette, & Pepper, 2007). Moreover, culture is now acknowledged as relevant for
people’s quality of life, promotes history preservation, protects cultural symbols and identity, sense of
belonging, and genius loci (Bullen & Love, 2010; Tweed & Sutherland, 2007). Preserving the culture
heritage, thus improves social, environmental, and economic conditions of the place. Heritage
buildings preservation is crucial since they represent past periods in time; they are evidence of the
people’s lifestyle and culture living in or around it. Their conservation enables future generations to
understand where they are coming from (Mısırlısoy & Günçe, 2016). Also, it stimulates urban
development and attracts visitors and investors. The tourism sector has increasing in the past decades,
and cultural tourism accounts for 40% of the world tourism venues (The Getty Conservation Institute,

E A R L Y S T A G E D E S I G N M E T H O D O L O G Y T O E N S U R E L I F E C Y C L E S U S T A I N A B I L I T Y O F R E S I D E N T I A L B U I L D I N G S
223
2002; UNESCO, 2012). Teller and Bond (2002) emphasise that protecting heritage is not converting
cities into a museum. Instead, new socio-economic uses should be found for heritage buildings to
maintain local development and sustainable activity cycles. Moreover, preserving culture reduces
environmental impacts by conserving the historic environment and promoting creative design (Opoku,
2015). The Portuguese legislation corroborates the need to encompass urban renovation actions, to
promote building energy efficiency, habitability, functionality, improved indoor air quality, regenerate
urban infrastructures and gardens, and protect local history and heritage ("Lei n.º 32/2012," 2012).
Hawkes (2001) presented culture as the fourth cornerstone of sustainable development. Integrating
culture criteria is vital in providing a more holistic approach to sustainable development Scammon
(2012). The built environment is a significant part of a place’s historical identity. From economic side,
cultural heritage enables inclusive economy, attracts investment and increases local employment
through tourism-related jobs, rehabilitation and construction activities. While perverting built
heritage, it contributes to sustainable urban development within the communities’ identity. From
environmental side, it diminishes built environmental impact by reducing raw materials exploitation
through existing building’s conservation and the use of local materials and costumes (Opoku, 2015).
Buildings should be designed to meet users social and cultural need while having in mind all the other
environmental, economic and social goals (Al-Jamea, 2014). In this sense, culture is essential for
attaining sustainable built environment.
Although culture is emerging out of the social domain, it is still uneasy to quantify and find cultural
criteria addressed in BSA tools. CASBEE for new construction v2010 (Institute for Building
Environment and Energy Conservation, 2010) is the only having an indicator to evaluate the attention
given to the local character and improvement of comfort. Subsequently to CASBEE, Japan developed
an approach to acknowledge the intangible aspects crucial to life quality and well-being (AIJ & IBEC,
2005 as cited in Masri et al., 2016; Nagashima, 1999). This ‘Glocal Architecture’ as it has been called,
addresses within the ‘local’ paradigm appreciation and love of place, Genius Loci (spirit, the essence of
the place), “Feng-shui – Fudo” (wind and water, landscape, climate, and earth), and appreciation of
Nature principles.
5.7.3.1 | Calculation procedure
EasyMode aims to give a contribution to include cultural values in the assessment of sustainably
designed homes. Although in early design phases it is not possible to quantify the measures taken, these
are the perfect stages to account for culture. Considering it early in the project enables its fruitful
completion throughout the building design and construction. EasyMode will thus evaluate the efforts
that designers are willing to attain to improve culture integration in the building design.

C H A P T E R 5 | E A R L Y S T A G E M O D E L F O R S U S T A I N A B L E D E S I G N – E A S Y M O D E
224
Therefore, the cultural value indicator intends to promote the preservation of the local identity, aiming
to improve cultural heritage preservation, well-being, social cohesion and reduce environmental
impacts.
To account for this indicator, it was necessary to adopt a quality assessment method as, to the author
knowledge, there is no quantifiable approach to this subject. To cope with that, the efforts approach
was implemented. The efforts aim to assist establishing the goals to sought throughout the design
towards cultural value preservation and integration (Table 5.52). The efforts selection was based on
the ones presented by the Institute for Building Environment and Energy Conservation (2010). The
indicative performance levels follow the description shown in Table 5.53. As in all other indicators,
designers can compare alternative solutions.
Table 5.52. Efforts for improving cultural value preservation
No. Efforts
1 Conversation of local character, history, and culture
[1] Conservation of historic built spaces Historic interior or exteriors spaces will be preserved, restored or regenerated [2] Use of locally-significant materials Local materials will be partially used in the building (structure, interior finishes or exterior spaces)
2 Integration with surrounding landscape through positioning and design of the building
Building features will be designed in harmony with surrounding landscape
3 Conservation of historic landscape
Historic landscape is maintained and will be conserved, restored or recreated of the exterior of historic buildings and the existing natural environment the area
Table 5.53.Indicative performance level for cultural value preservation
Level Description Level 1 One effort will be implemented Level 2 Two efforts will be implemented Level 3 The three efforts will be implemented
The following are examples of what to consider in each effort and specific measures that could be used
in attaining the goals established (Institute for Building Environment and Energy Conservation, 2010):
• Conservation of the local character, history, and culture: a local culture heritage reflects the way of life
of the community. It is important to keep and revival those resources while building modern
environments, and use of local materials. Local memory should be maintained and passed
from generation to generation.
o preserve, restore and regenerate existing historical building spaces or remains;
o use materials that are traditionally used or linked to the site (local stones, tiles,
roof-tops, etc.);

E A R L Y S T A G E D E S I G N M E T H O D O L O G Y T O E N S U R E L I F E C Y C L E S U S T A I N A B I L I T Y O F R E S I D E N T I A L B U I L D I N G S
225
• Harmonise the positioning and form of the building with nearby urban context: Buildings aesthetics, shape,
and location are fundamental for the building’s integration with the surrounding landscapes.
Evaluation in this effort is based on the following:
o Positions of wall lines of adjacent buildings with a view to consistency of wall lines in
the urban context;
o How the building will look from the street, and avoid oppressive atmosphere, such as
reducing the number of floors in roadside portions of the building;
o Consider the skyline formed with surrounding building groups;
o Make the aesthetic design of building rooftops, openings, walls, etc. harmonise with
the urban context;
o Consider the effect of the building's colour on the surrounding scenery;
o Avoid harming the urban scenery with the size and colouration of the building;
o If there is equipment on the roof or top of the building, consider how it is viewed
from the surroundings.
• Conservation of historic landscape: If appropriate propose and evaluate conservation measures for
historic landscapes that reflect local history and culture. These can be achieved with the
preservation and enhancement of the following:
o Historic structures which contributed to forming the scenery of the region;
o Existing plants and trees, landforms, springs.
5.8 | PROJECT QUALITY AND MANAGEMENT
This category aims to address the aspects that can aid improve the projects’ efficacy and quality. Due
EasyMode objective, only the passive design was addressed as an indicator within this category.
Nevertheless, designers should be aware that embracing an integrated design process and team, can
truly aid attaining a sustainable design. To cope with those aims, it is highly recommended that a
sustainability advisor is included in the team. The sustainability advisor will guide the design team
towards more sustainable decision and aid finding the best solutions to achieve the proposed objectives.
The next sections present the passive design indicator. It is divided into three sub-indicators:
(ii) orientation; (ii) design and shape and, (iii) solar design strategies. The first section depicts
recommendations that should be given to designers to guide them through the design, consisting of
those criteria that cannot be quantified at early design, but thoughts should be provided about those.

C H A P T E R 5 | E A R L Y S T A G E M O D E L F O R S U S T A I N A B L E D E S I G N – E A S Y M O D E
226
5.8.1 | Passive Design
Passive design19 outlines buildings’ architecture and is a major influencing factor of the buildings’
energy performance. It is proclaimed as the first step in making buildings resilient towards climate
change and low-energy (Keeler & Vaidya, 2016). When aiming to design a low-energy building the
first step should be to reduce loads through design, only when efficient systems to manage the energy
loads, and local production systems should be considered (Figure 5.29). Design to reduce energy
demand enables minimal residual loads, resulting in smaller heating, ventilation, and air conditioning
(HVAC) systems, which decreases investment and operational costs. Passive design process
encompasses a myriad of strategies across all design stages which need to be accounted by the design
team, especially in the early stages. Brophy and Lewis (2011) book exploits these strategies exhaustively
for each design stage. Table 5.54 summarises the strategies presented there for the early stages.
Current EU regulations aim for 20% of reduction of greenhouse gas emissions, increase of the
renewable sources share, and increase in energy efficiency by 2020. By 2019 new buildings occupied
and owned by public authorities should be nearly zero-energy (nZEB), and by 2021 all the buildings
this measure becomes valid for all new buildings ("Directive 2010/31/EU," 2010).
Figure 5.29. Process for low-energy building design (adapted from Keeler and Vaidya (2016))
19 Passive design is often confounded with the PassivHaus (passive house) Standard. This latter is based on the former principles, but sets minimum requirements to attain a certain performance level given by the standard. In this work, passive design principles are considered rather than the PassivHaus requirements.

E A R L Y S T A G E D E S I G N M E T H O D O L O G Y T O E N S U R E L I F E C Y C L E S U S T A I N A B I L I T Y O F R E S I D E N T I A L B U I L D I N G S
227
Table 5.54. Green strategies to be considered at early design (Brophy & Lewis, 2011)
Strategy Description
Green Strategies
Compact volume Optimised orientation (South) Shading systems in southern facade glazing areas Cross natural ventilation Envelop low thermal conductivity, high insulation thickness Low emissivity glazing Window frame with thermal break and airtight
Form factor Ratio of the external surface area (A) to the internal Treated Floor Area (TFA). It influences the energy exchange between inside and outside environments.
Building form Building volumes can shade Southern facades, avoiding direct sun radiation during summer and letting this enter during Winter.
Orientation Maximize sunlight income during Winter and minimise its incidence in Summer. Prevailing winds should be considered.
Solar Exposure and protection
Analysis of solar diagrams to design properly each facade according to its orientation. Design the elements considering the solar height in Summer and Winter to effectively use solar radiation.
Space distribution Less used spaces should be in more exposed zones, for these to work as thermal damping spaces.
Surrounding spaces Surrounding buildings, gardens or roads should be studied as they have influence in the building. Geographic and microclimate aspects should also be considered.
Despite this awareness, these targets are not enough to achieve the Paris’ COP21 Agreement’s pledges:
limit global temperature rise to under 2ºC above pre-industrial temperature level, encouraging a 1.5ºC
limit (UNFCCC, 2014). This means mainstreaming highly-efficient, near-zero, net-zero energy and
plus-energy buildings, and a massive renovation of existing building stock by 2050 are necessary to
avoid at least 50% of the estimated energy consumption growth (UNFCCC, 2014). Currently, the
building sector is responsible for over 30% of total final energy consumption, accounting for half the
global electricity demand and 30% of the global energy-related CO2 emissions (IEA, 2016).
The passive design thus plays a major role towards these objectives. As said, it is the first set of a holistic
approach towards low-energy buildings. Different studies address passive design and its role in
buildings’ sustainability (Dan et al., 2016; Pacheco, Ordóñez, & Martínez, 2012; Tibi, Ghaddar, &
Ghali, 2012). Chen, Yang, and Lu (2015) compared passive design approaches in different BSA tools,
concluding that these are not as valorised as building energy simulation approaches and that these
should be further promoted. This study highlights the relevance of passive design in EasyMode tool.
The main objective of passive design is to intensely reduce space heating and cooling energy demand
while creating indoor comfort (temperature and air quality). Research shows that passive design
strategies encompass building orientation, shape, and geometry, glazing and shading, envelope, and
solar strategies (Dan et al., 2016; Pacheco et al., 2012; Tibi et al., 2012). These tactics are directly
influenced and depend on local climatic conditions (Brophy & Lewis, 2011; Pacheco et al., 2012).

C H A P T E R 5 | E A R L Y S T A G E M O D E L F O R S U S T A I N A B L E D E S I G N – E A S Y M O D E
228
To the scope of EasyMode, passive design was included considering:
• Building orientation and implementation;
• Design and shape;
• Solar design strategies.
5.8.1.1 | Building orientation
Building orientation intends to assess and advice designer’s decision-making in selecting the best
orientation and considering site conditions.
Orientation is the most important parameter of design aspect contributing to the building energy
requirements and is essential to integrating other solar techniques at later design stages (Morrissey,
Moore, & Horne, 2011; Pacheco et al., 2012). In the Northern hemisphere, typically the best
orientation is south. Passivhaus says the building should be orientated along the east/west axis so that
the building faces within 30º of due South (BRE). Nevertheless, it might have some deviations, and it
is not always to possible orientate the building as desired. Thus, EasyMode indents to aid designers
compare different orientations and guide her/him through the process.
To aid designers orientate their buildings, it was necessary to study the best orientation a building
should have in each Portuguese region. For that, a quick analysis was performed using Autodesk®
Weather software tool, using the Energy Plus weather files for Portuguese cities (Bragança, Coimbra,
Évora, Faro, Funchal, Lajes, Lisboa and Porto). Table 5.55 shows the angles from the North-South
axis for the compromise orientation (best intake of solar radiation during winter with reduced intake
during summer), under and over-heated periods and the range of the best orientation.
Table 5.55.Best orientation study for Portuguese main regions
Location Compromise Underheated Period Overheated Period Best orientation range Bragança 177.5º 170.0º 155.0º Coimbra 180.0º 172.5º 135.0º [155.0º-195.0º] Évora 182.5º 175.0º 120.0º [167.5º-195.0º] Faro 175.0º 172.5º 120.0º [155.0º-197.5º] Funchal 147.5 147.5º 100.0º [140.0º-205.5º] Lajes 167.5 167.5º 122.5º [175.0º-198.0º] Lisboa 175.0º 162.5º 117.5º [152.5º-207.5º] Porto 172.5 º 172.5º 117.5º [157.5º-192.5º]
Calculation procedure
The indicator provides designers with the best orientation range according to a given location,
enabling them to assess and compare different latitudes. Figure 5.30 presents the procedure workflow.

E A R L Y S T A G E D E S I G N M E T H O D O L O G Y T O E N S U R E L I F E C Y C L E S U S T A I N A B I L I T Y O F R E S I D E N T I A L B U I L D I N G S
229
Figure 5.30. Framework for building orientation guidance
The performance level to be achieved is obtained according to Figure 5.31. The best performance
(Level 4) can be obtained if the building orientation matches the south angle (180º) or if it is within the
25% angle around South. Level 3 is given to those greater than 25% but within the 50% possible
orientations around South. Level 2 is given to those greater than 50% but within 75% of the South
range and Level 1 is to all falling in the 75% to 100% range (Table 5.56).
Figure 5.31. Orientation range explanation
Table 5.56. Performance level description for building orientation assessment
Level Description Level 1 > 75% and ≤ 100% of South angle range (135°-225°) Level 2 > 50% and ≤ 75% of South angle range (146.3°-213.8°) Level 3 > 25% and ≤ 50% of South angle range (151.5° - 202.5°) Level 4 ≤ 25% of South range (168.8° - 191.3°)
5.8.1.2 | Design and shape
Design and shape indicator includes aspects related to the building form and envelope. When
designing a façade, the following should be considered (Brophy & Lewis, 2011):
• Thermal, solar, and light transmission properties of the elements;
Identify building location Building orientation (degree)
Performance level achieved
More alternatives?
REPORT
yes
no

C H A P T E R 5 | E A R L Y S T A G E M O D E L F O R S U S T A I N A B L E D E S I G N – E A S Y M O D E
230
• Control of openings, for heat losses and gains;
• Potential for thermal collection and storage;
• Glazing ratios.
Within the passive design of a single family building, it is desired that the building envelope aids
controlling the inside comfort (air quality and temperature) at reduced energy consumption. To
promote this, the following are considered in EasyMode:
• Building envelope:
o U-values of the different elements;
o Thermal bridges treatment;
o Airtightness (recommendation only).
U-value
Good U-values need to be achieved in order to follow passive design principles. For instance,
Passivhaus standard imposes a maximum U-value of 0.15 W/m2K for walls, floors and roofs, and a
maximum U-value of 0.85 W/m2K for complete window installations (BRE). The Portuguese
regulation obliges construction solutions to target a maximum U-value. These values are quite
significant when compared to the reference values (Table 5.57). In this sense, these latter were used as
the reference for the indicative performance levels (Table 5.58).
Table 5.57. Superficial reference thermal transmittance coefficients for envelop and glazing elements for Portugal: Uref [W/m2·K] ("Portaria 349-B/2013," 2013)
Zone Continental Portugal Autonomous regions I1 I2 I3 I1 I2 I3
In contact with exterior or non-usable spaces with btr > 0.70
Vertical opaque elements 0.50 0.40 0.35 0.70 0.60 0.45
Horizontal opaque elements 0.40 0.35 0.30 0.45 0.40 0.35
In contact with other buildings or non-usable spaces with btr ≤ 0.70
Vertical opaque elements 0.80 0.70 0.60 0.90 0.80 0.70
Horizontal opaque elements 0.60 0.60 0.50 0.70 0.70 0.60
Glazing 2.80 2.40 2.20 2.80 2.40 2.20 Elements in contact with soil 0.50
Table 5.58. Performance level description for building solutions thermal transmittance coefficient
Level Description Level 1 ≥ 75% and < of reference U-value Level 2 ≥ 50% and < 75% of reference U-value Level 3 ≥ 25% and < 50% of reference U-value Level 4 ≤ 25% of reference U-value
Having in mind the abovementioned, a framework was developed aiming to include the U-value
quantification in EasyMode tool (Figure 5.5). Designers should describe the construction elements they

E A R L Y S T A G E D E S I G N M E T H O D O L O G Y T O E N S U R E L I F E C Y C L E S U S T A I N A B I L I T Y O F R E S I D E N T I A L B U I L D I N G S
231
want to assess: (i) exterior wall, (ii) roof and, (iv) ground floor, and identify the geographical region of
the site (continental Portugal or autonomous regions) and the winter climatic zone (I1, I2, or I3)
according to REH recommendations. EasyMode then estimates the U-value of the construction
solutions identified based on Eq. 5.54 after the Portuguese regulation ("Despacho n.º 15793-K/2013,"
2013). This value is calculated for each of the construction solutions identified and thus, each solution
has its indicative performance level.
Figure 5.32. Schematic of U-value evaluation framework
} = 1
!^# + !DD + !^; [W/m2·K] Eq. 5.54
where, Rj is the thermal resistance of layer j; Rsi is the internal thermal resistance, and Rse is the exterior
thermal resistance, all in m2·K/W. Rsi and Rse value are given in the thermal regulation ("Decreto-Lei
n.º 118/2013," 2013). The thermal resistances of the layers are obtained through Eq. 5.55.
! = -û
[m2·K/W] Eq. 5.55
where t (m) is the material thickness and l (W/m·K) is the thermal conductivity of the material, which
can be found in the materials database.
If the ground floor is in contact with the soil, the U-value quantification should follow the REH
calculation procedure as presented in ("Decreto-Lei n.º 118/2013," 2013). For this first version of
EasyMode, it was considered that all ground floors are elevated, and thus only Eq. 5.54 was used. Future
versions of EasyMode should include this calculation.
Results are then presented in both table and graphical representation, according to the construction
solution. The graphical representation enables non-technical energy professionals to understand the
results better and visualise which of the alternatives assessed has greater performance. The table gives
the exact thermal transmittance coefficient (W/m2·K) of the construction solutions under assessment.
ImportfromLCA?
Creatematerialslistautomatically CalculationofU-value Results
AddAlternatives?
yes
no
yes
no
Identificationofmaterialsperlayer
DatabaseofBuildingelementsandmaterials Report

C H A P T E R 5 | E A R L Y S T A G E M O D E L F O R S U S T A I N A B L E D E S I G N – E A S Y M O D E
232
Airtightness
Airtightness highly affects the inhabitants’ comfort and energy consumption; it can influence from
10% to 27% the heating demand (Meiss & Feijó-Muñoz, 2015; Ramos et al., 2015). According to the
Portuguese legislation, the airtightness of a residential building must be at least 0.4 air changes per
hour (ACH) in the heating season, while for the PassivHaus standard it should not be higher than 0.6
ACH. Regardless this range and the many studies on building airtightness, there is no indication of
best value to attain. In this sense, only the recommendation to set the building airtightness between
0.4 and 0.6 is suggested in EasyMode. Moreover, additional information is given to aid designer assure
the desired ACH (Table 5.59).
Thermal bridge
All thermal bridges should be designed out as much as possible. This means that insulation should be
continuous around the building envelope, positively reducing thermal losses. The surpassing the
Portuguese legal values for the flat thermal bridge should be the minimum requirement for a building
to be able to be eligible for a Sustainability label. Thus, for indicative purposes, this requisite is
considered as the minimum for Level 1. As the greater performance, the PassivHaus standard
requirement was considered – Psi (Ψ) not higher than 0.01 W/m·K (Table 5.60).
Table 5.59. Additional information for building airtightness rate
Additional information Early in the project define the line of the airtightness barrier • It can be useful to take plans and sections and draw a continuous red line that passes through all the elements
that separate heated and unheated spaces • It is useful at an early stage to identify critical details that will have a bearing on the airtightness barrier. • Details should be thoroughly worked out at design stage and not ‘left-to-chance’ later in site. • Think in 3D and explore around every corner. • Clearly identify the location of the air barrier on the drawings as an ‘airtightness line’. • Tightly manage the design implementation by appointing an ‘Airtightness Champion’ to coordinate between
consultants and to coordinate with the contractor’s ‘Airtightness Champion’ who will coordinate between trade sub-contractors.
• If the design team is inexperienced, it might also be prudent to appoint an independent adviser. • Specify airtight components, membranes, seals, and jointing methods. • Check interfaces between components and between trades or work packages to ensure the continuity of the
air barrier.
Table 5.60. Performance level description for building thermal bridge treatment
Level Description Level 1 ≥ 75% and < of legal Ψ Level 2 ≥ 50% and < 75% of legal Ψ Level 3 ≥ 25% and < 50% of legal Ψ Level 4 Ψ ≤ 0.01 W/m·K

E A R L Y S T A G E D E S I G N M E T H O D O L O G Y T O E N S U R E L I F E C Y C L E S U S T A I N A B I L I T Y O F R E S I D E N T I A L B U I L D I N G S
233
5.8.1.3 | Solar design strategies
As stated earlier in this chapter, solar gains are a crucial factor to consider during design. Passive solar
strategies can improve the buildings’ heating, cooling, and lighting demands. At this stage of the project
development only efforts can be quantified; in the consecutive stages, more detail and specific tools
can be used to achieve the desired targets. There are dozens of possible strategies to adopt and thus it
is impossible to list them all. The project will benefit as much as how many strategies are implemented
and with their efficacy. The broadness of this indicator allows considering as many passive solar
strategies as desired, surpassing the fact that not all strategies can be easily accounted at early stages
and at the same time, allowing them to be recalled at early design.
In this sense, no indicative performance levels were established, and it was assumed that the building
would be more sustainable if more efforts are intended to be implemented. With the impossibility to
list all possible solar strategies, it was decided accepted efforts proposed by the designers, others than
the ones listed in Table 5.61.
Table 5.61. Efforts to be considered for solar design strategies quantification
No. Effort 1 Glazing will be carefully planned to be optimised
on the south façade and reduced in North. Also, the selected glazing elements should minimise unwanted heat losses through windows.
[1] Low U-value glazing will be implemented
2 [2] Glazing area distribution: maximise south exposure and reduce north
3 Shading. Through improving solar gains in winter to reduce heating demand can cause overheating during summer. Thus, proper shading should be design to reduce direct solar gains during summer
[1] Exterior shading, fixed or movable
4 [2] Shading through greenery and landscape works
5 Architectonic elements.
[1] Tromb Wall 6 [2] Atria 7 [3] Others
8 Passive cooling [1] Geothermal heat exchange [2] Night cooling
9 Thermal energy storage 10 Other
5.9 | LIFE CYCLE COSTING
In the next sections is presented the life cycle cost indicator. It is divided into three sub-indicators: (ii)
investment costs; (ii) operational costs and, (iii) end-of-life costs. A description of these sub-indicators
is presented as well as the calculation procedure to account them in EasyMode.

C H A P T E R 5 | E A R L Y S T A G E M O D E L F O R S U S T A I N A B L E D E S I G N – E A S Y M O D E
234
5.9.1 | Life cycle cost
EN 15643-4:2012 sets the framework for the assessment of the economic performance of buildings,
recommending the inclusion of all the costs arising during the building’s lifecycle (CEN, 2012b). The
assessment of a building’s economic performance should then include all the relevant data from
Module A to Module D, including:
• economic aspects and impacts at the Before Use Stage (Modules A0 and A1 – A5);
• economic aspects and impacts excluding the building in operation at the Use Stage (Modules
B1 – B5);
• economic aspects and impacts of the building operational use (Modules B6 – B7);
• economic aspects and impacts at the End of Life (Modules C1 – C4 and D).
EN 16627:2015 gives the calculation methods to do so (CEN, 2015). However, no practical
mathematical procedure is given.
One major barrier to sustainable building design is still the flawed idea that sustainable buildings are
more costly than conventional ones as typically only investment costs are accounted during design.
The questionnaires carried out in Chapter 3, show that investment costs are still one of the most
considered aspects during the design while the costs arising from use stage and end-of-life are not so
pronouncedly considered. The crucial role of early design stages for the building LCC was already
discussed at the beginning of this thesis. Bogenstätter (2000) arguments that early design phases can
determine up to 80% operation costs.
Most of the current methods developed for LCC carry out an economic evaluation of specific aspects,
mostly energy-related technologies (J. H. Kang, 2017; Lutz et al., 2006; Milan, Bojesen, & Nielsen,
2012). The existing studies assessing building’s LCC, typically use existing data and estimations (Islam,
Jollands, & Setunge, 2015). Ribas (2015) developed a method to quantify the costs arising before use
stage (module A0-A5), based upon CEN normative framework. Still, this is not directly applicable to
the early design, since the buildings construction budget is required. A design-oriented LCC analysis
for holistic evaluation of the whole building in early design phases, based on ISO or CEN normative
framework as pro-active tool is lacking (Kovacic & Zoller, 2015). Developing such a comprehensive
method to quantify the life cycle costing of a building, early in the project is a highly complex work.
Alone, it would require the whole time available for the development of this thesis. In this sense, the
following are insights on how to drive the project team to account for life cycle costs (LCC) rather than
just considering the clients’ investment budget.

E A R L Y S T A G E D E S I G N M E T H O D O L O G Y T O E N S U R E L I F E C Y C L E S U S T A I N A B I L I T Y O F R E S I D E N T I A L B U I L D I N G S
235
5.9.1.1 | Life cycle costing at early design
As said, LCC analysis at early design is scarce although this stage is responsible for most costs arising
in a building life cycle. Investment, maintenance, repair, and end-of-life costs can be reduced
depending on the decisions made at this stage. Adopting passive design measures, reusing existing
components, and promoting flexibility, are a few examples of how to reduce both investment and
operation costs. Also, if demountability is promoted and the building materials are recyclable, the
building components preserve economic value for reuse or recycling.
When looking to BSA tools, only SBToolPT-H and DGNB consider LCC directly (German Sustainable
Building Council, 2014; Mateus & Bragança, 2016). While SBToolPT-H considers investment costs
and annual recurrent costs from operational water and energy, DGNB also deals with maintenance
and end-of-life. Nevertheless, Kovacic and Zoller (2015) reveal that DBNB’s LCC accountability is
not suitable for planning investments or financing. From their study, they proposed an adaptation of
this procedure to ease considering LCC in early design.
5.9.1.2 | Calculation procedure
Accounting for all economic aspects recurring from the building life cycle promotes a life cycle thinking
instead of just considering investment costs, which can often be misleading. Thus, the aim of including
such aspects in EasyMode is to promote less costly buildings and improve the thought on operational
costs during design.
Based on the recommendations of CEN normative framework for buildings’ economic performance
assessment, three sub-indicators were considered: (i) investment costs; (ii) operational costs and,
(iii) end-of-life costs.
According to EN 15643-4:2012 the economic performance of a building can be accounted through
two indicators: costs over the life cycle and financial value over the life cycle. While the first accounts
for the costs related to the building over its life cycle, the second considers income values. To the scope
of EasyMode, for the time being, only the life cycle cost was considered.
The procedure adopted aims to be indicative rather than give exact LCC values, and it is based on the
foreseen investment costs and the data for operational energy and water consumption base upon local
rates and foreseen needs (indicators I5 and I6). A more detail analysis, recurring to specialised software
such BIM tools should be used in later design stages.
Investment costs (Module A) should be considered, early in the design, using the foreseen client’s
investment costs. To quantify the operational costs, it is essential to consider a given reference study
period (RSP). Typically, the RSP should equal the required service life of the building.

C H A P T E R 5 | E A R L Y S T A G E M O D E L F O R S U S T A I N A B L E D E S I G N – E A S Y M O D E
236
To quantify future investment, the value should be discounted to enable comparability with today’s
values. For that, Net Present Value (NPV) is a standard in LCC analysis (Davis Langdon Management
Consulting, 2007; Heralova, 2014; Kovacic & Zoller, 2015). Nevertheless, EN 16627:2015
recommends that the costs and incomes be calculated initially without applying any discount or
escalation rate; this way, obtaining the nominal value. The present value (PV) is the present-day
equivalence of a future cost, i.e. the amount of money required today to finance future investments, at
an interest rate (Davis Langdon Management Consulting, 2007; Islam et al., 2015), given by the
equation Eq. 5.56.
4h =H'
(1 + L)'
ü
'Äw
Eq. 5.56
where Ct is the sum of all relevant costs less any positive cash flows occurring in period t, d is the decimal
discount rate (interest rate), and N is thenumber of periods comprising the study period.
Investment costs
This sub-indicator is quantified using the clients’ budget, due to lack of more accurate data at early
phases, through the Investment Cost (IC) in €/m2, which corresponds to the economic aspects at the
Before Use Stage (Module A).
Designers should input the client’s budget (CB), and EasyMode calculates the IC according to Eq. 5.57
in €/m2.
%H =Hëç{Q
Eq. 5.57
To obtain the indicative performance levels, the Survey on Bank appraisals on housing published by
(INE, 2017) was consulted. SBToolPT-H uses the same data for benchmarking purposes (Mateus &
Bragança, 2016). Ribas, Morais, and Cachim (2016) developed benchmarks for each parameter
developed, and the sum of those could be used. However, this does not differentiate the values for
single family buildings from flats. This separation is relevant as according to the INE survey, the
average cost per square meters for single family buildings is quite lower than flats. Using a normalised
value could lead to misguided evaluations. In this sense, the mean value of the average 25% lower
figures for houses from January 2011 to January 2017, was used as the threshold for the higher
performance level (Level 3), as in SBToolPT-H for the best practice benchmark. The threshold for the
lowest level (Level 1) was obtained by the mean value of the overall average figures for houses in the
same period, as in SBToolPT-H for the conventional practice benchmark. The mean level is the range
between Level 1 and Level 3, as shown in Table 5.20. As in all other indicators, alternative solutions
can be added for comparison.

E A R L Y S T A G E D E S I G N M E T H O D O L O G Y T O E N S U R E L I F E C Y C L E S U S T A I N A B I L I T Y O F R E S I D E N T I A L B U I L D I N G S
237
In a later design stage, designers should use more detail software to perform more comprehensive
analysis of the initial costs so to achieve a more accurate LCC.
Table 5.62. Preference levels investment costs
Level Description Level 1 IC ≥ 979 €/m2 Level 2 979 > IC > 644 €/m2 Level 3 IC ≤ 644 €/m2
Operational costs
To quantify this sub-indicator, due to lack of accurate data at early phases, only operational water and
energy use were considered. The economic aspects from the other modules B1 – B5 are complex to
quantify, especially in early design. Nevertheless, an estimation of maintenance costs can be added.
Also, EN 16627:2015 should be consulted to verify which costs to include when performing an overall
operational costs assessment, at later design stages. This sub-indicator is quantified by the Operational
Cost (OC) in €/m2, which corresponds to the economic aspects of the building operational use
(Modules B6 – B7).
Operational energy and water use costs can be greatly reduced if appropriate design and technology
are implemented, as dealt with in I5 and I6.
Designers shall input the following:
• Energy delivered for heating, cooling, and domestic hot water preparation from I.5 (Energy
efficiency indicator);
• Foreseen energy rates (€/kWh);
• WU, from I6 (Water efficiency indicator);
• Foreseen tariff for water, wastewater and municipal waste (€/m3) for the building location.
The PV of operational costs (OC) is given by equation Eq. 5.58 in €/m2 as follows.
úH ={H
1 + L 'ü
'ÄM
+|H1 + L '
ü
'ÄM
Eq. 5.58
where EC is the energy costs and WC is the water costs, both in €/m2·year. Maintenance costs can be
added if considered.
Energy and water costs calculation procedure is next presented. As in indicator I.1, no performance
levels were used. Only alternatives can be compared. Thus, as in any other indicator alternatives can
be added can compared.

C H A P T E R 5 | E A R L Y S T A G E M O D E L F O R S U S T A I N A B L E D E S I G N – E A S Y M O D E
238
Energy costs
The annual EC is obtained through the equation Eq. 5.59 in €/m2·year.
{H = {†;"'×Ö†;"' + {&XX@×Ö&XX@ + ({bV` − {^X@"<)×ÖbV` − {<;B×Ö<;B Eq. 5.59
where Eheat, Ecool, and EDHW are respectively the delivered energy for heating, cooling, and domestic
hot water preparation (kWh/m2·year), Esolar is the delivered energy for DHW arising from a solar
panel, Eren is the renewable energy produced in the building, Ti, Ts and Tren correspond to the cost of
1 kWh of the energy source for the corresponding energy need (€/kWh).
Water cost
The annual WC is calculated by EasyMode using equation Eq. 5.60 in €/m2·year.
|H = |} −|}<;?^;A ×iX
i%Q×(ÖS + ÖSS + Öå`) Eq. 5.60
Where WU is the foreseen water use (m3/p·year); WUreused is the amount of water foreseen to be reused
if any water reuse device is planned (I5), that when in lack of more accurate data, if willing to
implement a reuse system it can be considered as the total amount of water needed for toilet flushes
(m3/p·year); NO is the number of occupants; NIA is the net internal area (m2); TW, TWW, and TMW are
respectively the water, waste water and municipal waste tariffs (€/m3).
Maintenance costs
Designers can make a quick estimation of maintenance costs (MC), to verify which alternative is less
costly. To do so, they can assign a cost to each maintenance activity defined to implement indicator
I6.2 (Maintenance plan) or identify and assign a cost, to the appropriate activities from Table 5.43.
Thus, designers can select the desired number of replacement or maintenance activities, estimate a
value for each and indicate the period of occurrence. To calculate the number of replacements or
periodic maintenance activities equation Eq. 5.61 is used.
i°D =!s¢3ôD{3ôD − 1
Eq. 5.61
Where NRj is the number of replacements/maintenance activity for product j, ESLj is the estimated
service life for product j, and ReqSLj is the required service life of the building.
Then the MC can be estimated by the sum of each maintenance activity PV for the corresponding NRj,
using equation Eq. 5.62, in €/m2.

E A R L Y S T A G E D E S I G N M E T H O D O L O G Y T O E N S U R E L I F E C Y C L E S U S T A I N A B I L I T Y O F R E S I D E N T I A L B U I L D I N G S
239
ÅH = ÅHD =)HD
1 + L ü£§
ü
D
Eq. 5.62
Where mCj is the unitary cost of the maintenance activity j.
End-of-life costs
End-of-life costs (EoL) sub-indicator is prescriptive. Designers should only state their wiliness to
consider end-of-life costs in further design phases. No calculations are made, due to the absence of
accurate and reliable literature data that would be required to carry out a more precise assessment.
Nevertheless, it was decided to keep I19.3 as the first step towards think life cycle thinking.
Overall LCC
To make aware of the relevance of costs other than investment costs, the overall indicative LCC value
is presented. In this way, designers can verify the effect of their choices to ‘real’ cost of the building,
rather than just in the client’s investment. The LCC is obtained using equation Eq. 5.63. Although
EasyMode does not perform the EoL quantification, it is shown in the equation for awareness purposes.
ôHH = %H + úH + {ÇôH Eq. 5.63
5.10 | CONCLUDING REMARKS
This chapter described and contextualised the algorithms for each indicator addressed in EasyMode.
The calculation procedures here presented, were implemented in Microsoft Excel workbook. EasyMode
addresses sustainability aspects at early design stages dealing with the lack of data to estimate the
buildings’ performance over its lifecycle. Thus, simplifications and assumptions were required.
Moreover, EasyMode is intended to be straightforward and practical to use, hence complex calculations
that could retract designers from using it, were avoided. One main aim of EasyMode is to enable
comparison of design alternatives regarding the sustainability factors under evaluation. In this way,
EasyMode can guide designers through the decision-making process towards more sustainable choices.
It is worth mentioning that the assessments made within EasyMode have comparison purposes.
Therefore, the possible absolute errors can be dismissed, on the contrary to the relative evaluations in
each indicator.
Most of the indicators encompass sub-indicators, which are addressed individually. Due to the lack of
accurate data in early design, several indicators and sub-indicators were developed using a prescriptive
or procedural approach. For this reason, a generic approach was created and used in several indicators
– efforts approach. This approach enabled the inclusion of indicators that otherwise could not be

C H A P T E R 5 | E A R L Y S T A G E M O D E L F O R S U S T A I N A B L E D E S I G N – E A S Y M O D E
240
included in the EasyMode framework. It consists of setting goals to be attained during further design
stages, through a descriptive or indicative path. Twelve indicators/sub-indicators were developed
using this approach. These are mainly related to those aspects that are not easily quantifiable. To those
where a quantifiable procedure would be possible in later design stages, a quantitative approach was
developed. This approach is similar to the former but enables designers to set the target values they
are willing to attain, or to select an indicative performance level retrieving the corresponding value.
Fifteen indicators use this approach, being the ones numerically measurable. All the other indicators
have their specific approaches due to their specificities, such as I1. Life cycle assessment, I5. Energy
efficiency, or I12. Space efficiency.
The developments from this chapter resulted in EasyMode development and implementation. The
implementation in a Microsoft Excel Workbook enables easier distribution and use among design
practitioners. Also, it allows EasyMode future maintenance and upgrades.
The validation of EasyMode algorithms and efficacy is presented in the next chapter.

E A R L Y S T A G E D E S I G N M E T H O D O L O G Y T O E N S U R E L I F E C Y C L E S U S T A I N A B I L I T Y O F R E S I D E N T I A L B U I L D I N G S
241
REFERENCES OF CHAPTER 5
Agência Portuguesa do Ambiente, I. P. (2012). Plano Nacional para o Uso Eficiente da Água: Implementação 2012-2020 (PNUEA). Portugal: Governo de Portugual.
Al-Jamea, M. (2014). Towards social and cultural sustainability in the designs of contemporary Saudi houses. International Journal of Sustainable Human Development, 2(1), 35-43
Ando, A. W., & Gosselin, A. Y. (2005). Recycling in Multifamily Dwellings: Does Convenience Matter? Economic Inquiry, 43(2), 426-438. doi: 10.1093/ei/cbi029
Andrade, J., & Bragança, L. (2016). Sustainability assessment of dwellings – a comparison of methodologies. Civil Engineering and Environmental Systems, 33(2), 125-146. doi: http://dx.doi.org/10.1080/10286608.2016.1145676
Aragall, F., Neumann, P., & Sagramola, S. (2013). Design for All in progress, from theory to practice. Luxembourg: EuCan http://www.eca.lu/.
Ashworth, A., & Perera, S. (2015). Cost studies of buildings (6th edition ed.). London and New York: Routledge. Associação Nacional para a Qualidade nas Instalações Prediais, ANQIP. (2011). ETA 0905 - Sistemas
prediais de reutilização e reciclagem de águas cinzentas (SPRAC). Portugal: ANQIP. Associação Nacional para a Qualidade nas Instalações Prediais, ANQIP. (2015). ETA 0701 - Sistemas de
aproveitamento de águas pluviais em edifícios (SAAP). Portugal: ANQIP. Attia, S., Gratia, E., De Herde, A., & Hensen, J. L. M. (2012). Simulation-based decision support tool for
early stages of zero-energy building design. Energy and Buildings, 49, 2-15. doi: http://dx.doi.org/10.1016/j.enbuild.2012.01.028
Aye, L., Ngo, T., Crawford, R. H., Gammampila, R., & Mendis, P. (2012). Life cycle greenhouse gas emissions and energy analysis of prefabricated reusable building modules. Energy and Buildings, 47(0), 159-168. doi: http://dx.doi.org/10.1016/j.enbuild.2011.11.049
Barbosa, J. A., Araújo, C., Mateus, R., & Bragança, L. (2015). Smart interior design of buildings and its relationship to land use. Architectural Engineering and Design Management, 12(2), 97-106. doi: http://dx.doi.org/10.1080/17452007.2015.1120187
Barbosa, J. A., Bragança, L., & Mateus, R. (2015). Assessment of Land Use Efficiency Using BSA Tools: Development of a New Index. Journal of Urban Planning and Development, 141(2), 04014020. doi: http://dx.doi.org/10.1061/(asce)up.1943-5444.0000208
Barbosa, J. A., Mateus, R., & Bragança, L. (2013). Adaptation of SBToolPT to office buildings. International Journal of Sustainable Building Technology and Urban Development, 4(1), 89-97. doi: http://dx.doi.org/10.1080/2093761x.2012.759892
Bare, J. C., Hofstetter, P., Pennington, D. W., & de Haes, H. A. U. (2000). Midpoints versus endpoints: The sacrifices and benefits. The International Journal of Life Cycle Assessment, 5(6), 319-326. doi: http://dx.doi.org/10.1007/bf02978665
Barros, P. M. L. (2008). Processos de manutenção técnica de edifícios – plano de manutenção: coberturas. (Mestrado Integrado em Engenharia Civil), Faculdade de Engenharia da Universidade do Porto, Porto, Portugal.
Basbagill, J., Flager, F., Lepech, M., & Fischer, M. (2013). Application of life-cycle assessment to early stage building design for reduced embodied environmental impacts. Building and Environment, 60(0), 81-92. doi: http://dx.doi.org/10.1016/j.buildenv.2012.11.009
Bernstad, A. (2014). Household food waste separation behavior and the importance of convenience. Waste Management, 34(7), 1317-1323. doi: http://dx.doi.org/10.1016/j.wasman.2014.03.013
Bogenstätter, U. (2000). Prediction and optimization of life-cycle costs in early design. Building Research & Information, 28(5-6), 376-386. doi: http://dx.doi.org/10.1080/096132100418528
Bokalders, V., & Block, M. (2010). The Whole Building Handbook - How to design healthy, efficient and sustainable buildings (1st ed.). UK and USA: Earthscan co-published with RIBA Publishing
Bragança, L., Andrade, J., & Mateus, R. (2016). Planning and Constructing. In B. Hauke, M. Kuhnhenne, M. Lawson & M. Veljkovi (Eds.), Sustainable Steel Buildings: A Practical Guide for Structures and Envelopes (pp. 99-102): John Wiley & Sons Inc.
Bragança, L., Andrade, J., & Mateus, R. (2016). Sustainable Building Quality. In B. Hauke, M. Kuhnhenne, M. Lawson & M. Veljkovi (Eds.), Sustainable Steel Buildings: A Practical Guide for Structures and Envelopes (pp. 102-116): John Wiley & Sons Inc.
Bragança, L., & Mateus, R. (2012). Life cycle analysis of buildings - Environmental impact of building elements (1st ed.). Portugal: Multicomp.
BRE. Passivhaus primer: Designer's guide - A guide for the design team and local authorities. United Kingdom: http://www.passivhaus.org.uk/.

C H A P T E R 5 | E A R L Y S T A G E M O D E L F O R S U S T A I N A B L E D E S I G N – E A S Y M O D E
242
BRE. Passivhaus primer: Introduction - An aid to understanding the key principles of the Passivhaus Standard. United Kingdom: http://www.passivhaus.org.uk/.
BRE. (2015). Home Quality Mark - Technical Manual SD232:1.0 (Beta England) - 2015 (pp. 222). Engalnd: BRE.
BRE Scotland. (2006). Design life of buildings - A scoping study. Glasgow, United Kingdom: S. B. S. Agency http://www.gov.scot/resource/doc/217736/0091011.pdf.
Bribián, I. Z., Capilla, A. V., & Usón, A. A. (2011). Life cycle assessment of building materials: Comparative analysis of energy and environmental impacts and evaluation of the eco-efficiency improvement potential. Building and Environment, 46(5), 1133-1140. doi: http://dx.doi.org/10.1016/j.buildenv.2010.12.002
Bribián, I. Z., Usón, A. A., & Scarpellini, S. (2009). Life cycle assessment in buildings: State-of-the-art and simplified LCA methodology as a complement for building certification. Building and Environment, 44(12), 2510-2520. doi: http://dx.doi.org/10.1016/j.buildenv.2009.05.001
British Standards Institution, BSI. (2008). BS 8206-2:2008 - Lighting for buildings. Code of practice for daylighting. United Kingdom: BSI.
Brophy, V., & Lewis, J. O. (2011). A green Vitruvius: Principles and practise of sustainable architectural design (2nd Edition ed.). United Kingdom: Earthscan.
Brotas, L., & Wilson, M. (2007). The average total daylight factor. XII National Conference on Lighting - Light’2007, Varna, Bulgaria.
Building Research Establishment Ltd, BRE. (2015). Home Quality Mark - Technical Manual SD232: 1.0 (Beta England) - 2015. United Kingdom: BRE.
Bullen, P. A., & Love, P. E. D. (2010). The rhetoric of adaptive reuse or reality of demolition: Views from the field. Cities, 27(4), 215-224. doi: http://dx.doi.org/10.1016/j.cities.2009.12.005
Buyle, M., Braet, J., & Audenaert, A. (2013). Life cycle assessment in the construction sector: A review. Renewable and Sustainable Energy Reviews, 26(0), 379-388. doi: http://dx.doi.org/10.1016/j.rser.2013.05.001
Caffi, V., & Rejna, M. G. (2000). Maintenance design and scheduling to support sustainable construction. International Conference Sustainable Building 2000, Rotterdam (Netherlands).
Carlos, J. S., & Nepomuceno, M. C. S. (2012). A simple methodology to predict heating load at an early design stage of dwellings. Energy and Buildings, 55, 198-207. doi: 10.1016/j.enbuild.2012.06.033
Castro, M., Mateus, R., Serôdio, F., & Bragança, L. (2015). Development of Benchmarks for Operating Costs and Resources Consumption to be Used in Healthcare Building Sustainability Assessment Methods. Sustainability, 7(10), 13222. doi: http://dx.doi.org/10.3390/su71013222
Center for Universal Design - College of Design - North Carolina State University. (2006). DEFINITIONS: Accessible, Adaptable, and Universal Design Factsheet. North Carolina, USA.
Center for Universal Design , N. C., State University,. (2000). Universal Design - Housing for the lifespan of all people. Raleigh, North Carolina.
Chatzidimitriou, A., & Yannas, S. (2016). Microclimate design for open spaces: Ranking urban design effects on pedestrian thermal comfort in summer. Sustainable Cities and Society, 26, 27-47. doi: http://dx.doi.org/10.1016/j.scs.2016.05.004
Chen, X., Yang, H., & Lu, L. (2015). A comprehensive review on passive design approaches in green building rating tools. Renewable and Sustainable Energy Reviews, 50, 1425-1436. doi: http://dx.doi.org/10.1016/j.rser.2015.06.003
Çomaklı, K., & Yüksel, B. (2004). Environmental impact of thermal insulation thickness in buildings. Applied Thermal Engineering, 24(5–6), 933-940. doi: http://dx.doi.org/10.1016/j.applthermaleng.2003.10.020
Conejos, S., Langston, C., & Smith, J. (2014). Designing for better building adaptability: A comparison of adaptSTAR and ARP models. Habitat International, 41(0), 85-91. doi: http://dx.doi.org/10.1016/j.habitatint.2013.07.002
Croxton. (2003). Architectural Record, 147 Cuperus, Y. (2001). An Introduction to Open Building. In G. Ballard & D. Chua (Eds.), 9th Annual Conference
of the International Group for Lean Construction. Singapore, Singapore. Dan, D., Tanasa, C., Stoian, V., Brata, S., Stoian, D., Nagy Gyorgy, T., & Florut, S. C. (2016). Passive
house design—An efficient solution for residential buildings in Romania. Energy for Sustainable Development, 32, 99-109. doi: http://dx.doi.org/10.1016/j.esd.2016.03.007
Davico, A. (2013). Avaliação da flexibilidade dos espaços de habitação: influência das divisórias e mobiliário. (Philosophy Doctor), Universidade do Minho, Portugal.
Davis Langdon Management Consulting. (2007). Life cycle costing (LCC) as a contribution to sustainable construction: a common methodology - Literature review. Ref. Ares(2014)1138357.

E A R L Y S T A G E D E S I G N M E T H O D O L O G Y T O E N S U R E L I F E C Y C L E S U S T A I N A B I L I T Y O F R E S I D E N T I A L B U I L D I N G S
243
Decreto Regulamentar n.º 9/2009 do Ministério do Ambiente, do Ordenamento do Território e do Desenvolvimento Regional, Diário da República n.º 104/2009, Série I de 2009-05-29 3366 - 3380 (2009).
Decreto-lei 650/75 Alteração ao Regime Geral das Edificações Urbanas, Diário da Républica 1ª serie - n.º 267 de 18 de Novembro de 1975 (Portugal 1975).
Decreto-Lei n.º 38:382 Regulamento Geral das Edificações Urbanas. Ministério das Obras Públicas, Diário do Governo, 1ª Série 166 de 7 de Agosto de 1951 715–729 (Portugal 1951).
Decreto-Lei n.º 118/2013 do Ministério da Economia e do Emprego, Diário da República n.º 159/2013, Série I de 2013-08-20 4988 - 5005 (Portugal 2013).
Decreto-Lei n.º 163/2006 do Ministério do Trabalho e da Solidariedade Social, Diário da República n.º 152/2006, Série I de 2006-08-08 5670 - 5689 (Portugal 2006).
Decreto-Lei n.º 565/99 do Ministério do Ambiente, Diário da República n.º 295/1999, Série I-A de 1999-12-21 9100 - 9115 (Portugal 1999).
Decreto-Lei n.º 9/2007 do Ministério do Ambiente, do Ordenamento do Território e do Desenvolvimento Regional, Diário da República n.º 12/2007, Série I de 2007-01-17 389 - 398 (Portugal 2007).
Decreto-Lei nº 80/2006 Regulamento das Características de Comportamento Térmico dos Edifícios (RCCTE), Diário da República n.º 67/2006, Série I-A de Abril de 2006 2468 - 2513 (2006).
Dekker, K. (1998). Open Building Systems: a case study. Building Research & Information, 26(5), 311-318. doi: http://dx.doi.org/10.1080/096132198369797
Department for Communities and Local Government. (2010). Code for Sustainable Homes - Technical Guide. London, UK.
Despacho (extrato) n.º 15793-D/2013 do Ministério do Ambiente, Ordenamento do Território e Energia - Direção-Geral de Energia e Geologia, Diário da República n.º 234/2013, 3º Suplemento, Série II de 2013-12-03 35088-(35058) a 35088-(35087) (Portugal 2013).
Despacho n.º 15793-K/2013 do Ministério do Ambiente, Ordenamento do Território e Energia - Direção-Geral de Energia e Geologia, Diário da República n.º 234/2013, 3º Suplemento, Série II de 2013-12-03 35088-(35058) a 35088-(35087) (Portugal 2013).
Directive 2008/98/EC of ohe European Parliament and of the Council of 19 November 2008 on waste and repealing certain Directives, Oficial Jornal of the European Union, (European Union 2008 22.11.2008).
Directive 2010/31/EU, of the European Parliament and of the Council of 19 May 2010 on the energy performance of buildings (recast), Official Journal of the European Union, (European Union 2010 18.6.2010).
Durmisevic, E. (2006). Transformable Building Structures. (Doctor), Delft University of Technology, Delft, The Netherlands.
Duxbury, N., Gillette, E., & Pepper, K. (2007). Exploring the Cultural Dimenstions of Sustainability. Canada: https://www.creativecity.ca/database/files/library/Creative_City_News_E.pdf.
ECORYS. (2014). Resource efficiency in the building sector. Rotterdam, the Netherlands: http://ec.europa.eu/environment/eussd/pdf/Resource efficiency in the building sector.pdf.
Enerdata. (2016). ENTRANZE - Average size of Dwelling. http://www.entranze.enerdata.eu/ - /average-size-of-dwelling.html
ESSAT, (2014). Early Stage Sustainability Assessment Tool de- veloped under the framework of the SB Steel (Sustainable Building Project in Steel) research project (RFSR- CT-2010-00027). Retrieved from http://www.onesource.pt/sbsteel/site/.
European Climate Foundation. (2010). Roadmap 2050: a practical guide to a prosperous, low-carbon Europe. Europe: http://www.roadmap2050.eu/attachments/files/Volume1_fullreport_PressPack.pdf.
European Commission. (2012). Guidelines on best practice to limit, mitigate or compensate soil sealing. Belgium. Retrieved from Publications O ce of the European Union,: http://ec.europa.eu/environment/soil/sealing_guidelines.htm.
European Commission. (2014). 2030 climate and energy goals for a competitive, secure and low-carbon EU economy. http://europa.eu/rapid/press-release_IP-14-54_en.htm.
European Commission. (2015). Directive of the European Parliament and of the Council amending Directive 2008/98/EC on waste. Brussels: EU Retrieved from http://eur-lex.europa.eu/legal-content/EN/TXT/?uri=CELEX:52015PC0595.
European Commission, (2016a, 14/09/2016). Waste - Review of Waste policy and legislation. Retrieved from http://ec.europa.eu/environment/waste/target_review.htm. [Accessed October 2016].
European Commission, (2016b, 23rd July 2015). Waste Generation. Retrieved from http://ec.europa.eu/eurostat/web/waste/data/main-tables. [Accessed June 2016].

C H A P T E R 5 | E A R L Y S T A G E M O D E L F O R S U S T A I N A B L E D E S I G N – E A S Y M O D E
244
European Committe for standardization, CEN. (2007). EN 15251:2007 - Indoor environmental input parameters for design and assessment of energy performance of buildings addressing indoor air quality, thermal environment, lighting and acoustics. Belgium: CEN.
European Committe for Standardization, & European Committe for Electrotechnical Standardization. (2014). Work Programme 2015 - European Standardization and related activities. Luxemburg, Belgium: Sarah Penny - CEN and CENELEC.
European Committee for Standardization, CEN. (2011a). EN 15643-2:2011 - Sustainability of construction works - Assessment of buildings - Part 2: Framework for the assessment of environmental performance. Brussels: CEN.
European Committee for Standardization, CEN. (2011b). EN 15978:2011 - Sustainability of construction works - Assessment of environmental performance of buildings - Calculation methods. Brussels: CEN.
European Committee for Standardization, CEN. (2012a). EN 15643-3:2012 - Sustainability of Construction Works - Assessment of Buildings - Part 3: Framework for the assessment of social performance. Brussels: CEN.
European Committee for Standardization, CEN. (2012b). EN 15643-4:2012 - Sustainability of Construction Works - Assessment of Buildings - Part 4: Framework for the assessment of economic performance. Brussels: CEN.
European Committee for Standardization, CEN. (2014). EN 16309:2014 - Sustainability of construction works - Assessment of social performance of buildings - Calculation methods. Brussels: CEN.
European Committee for Standardization, CEN. (2015). EN 16627:2015 - Sustainability of construction works - Assessment of economic performance of buildings - Calculation methods. Brussels: CEN.
European Environmental Agency. (2006). Urban sprawl in Europe: The ignored challenge (EEA Report N. 10/2006). Copenhagen: Office for Official Publications of the European Communities. Retrieved from EEA Report: http://www.eea.europa.eu/publications/eea_report_2006_10.
European Institute for Design and Disability - Design for all Europe. (2004). The EIDD Stockholm Declaration 2004. Adopted on 9 May 2004, at the Annual General Meeting of the EIDD: EIDD.
Fallmann, J., Forkel, R., & Emeis, S. (2016). Secondary effects of urban heat island mitigation measures on air quality. Atmospheric Environment, 125, Part A, 199-211. doi: http://dx.doi.org/10.1016/j.atmosenv.2015.10.094
Forest Stewardship Council, G. D., FSC. (2016). FSC - Forests for all forever. Retrieved from http://www.fsc.org/. [Accessed June 2016].
Gago, E. J., Roldan, J., Pacheco-Torres, R., & Ordóñez, J. (2013). The city and urban heat islands: A review of strategies to mitigate adverse effects. Renewable and Sustainable Energy Reviews, 25, 749-758. doi: http://dx.doi.org/10.1016/j.rser.2013.05.057
Gardi, C., Jeffery, S., & Saltelli, A. (2013). An estimate of potential threats levels to soil biodiversity in EU. Glob Chang Biol, 19(5), 1538-1548. doi: http://dx.doi.org/10.1111/gcb.12159
Gardi, C., Panagos, P., Van Liedekerke, M., Bosco, C., & De Brogniez, D. (2014). Land take and food security: assessment of land take on the agricultural production in Europe. Journal of Environmental Planning and Management, 58(5), 898-912. doi: http://dx.doi.org/10.1080/09640568.2014.899490
German Sustainable Building Council, (2014). DGNB System. Retrieved from http://www.dgnb.de/_en/certification-system/index.php. [Accessed January 2014].
Gervásio, H., Santos, P., Martins, R., & Simões da Silva, L. (2014). A macro-component approach for the assessment of building sustainability in early stages of design. Building and Environment, 73(0), 256-270. doi: http://dx.doi.org/10.1016/j.buildenv.2013.12.015
Glass, J., Achour, N., Parry, T., & Nicholson, I. (2011). The role of responsible sourcing in creating a sustainable construction supply-chain. Management and Innovation for a Sustainable Built Environment, Amsterdam, The Netherlands.
Gosling, J., Naim, M., Sassi, P., Iosif, L., & Lark, R. (2008). Flexible buildings for an adaptable and sustainable future. In A. Dainty (Ed.), Proceedings 24th Annual ARCOM Conference (Vol. 1, pp. 115–124). Cardiff, UK: Association of Researchers in Construction Management.
Gossett, A., Mirza, M., Barnds, A. K., & Feidt, D. (2009). Beyond access: a case study on the intersection between accessibility, sustainability, and universal design (Vol. 4).
Grant, A., Ries, R., & Kibert, C. (2014). Life Cycle Assessment and Service Life Prediction. Journal of Industrial Ecology, 18(2), 187-200. doi: http://dx.doi.org/10.1111/jiec.12089
Guy, B., Ciarimboli, N., & Hamer Center for Community, D. (2008). DfD : design for disassembly in the built environment : a guide to closed-loop design and building. [University Park, Penn.]: Hamer Center.

E A R L Y S T A G E D E S I G N M E T H O D O L O G Y T O E N S U R E L I F E C Y C L E S U S T A I N A B I L I T Y O F R E S I D E N T I A L B U I L D I N G S
245
Haapio, A., & Viitaniemi, P. (2008). A critical review of building environmental assessment tools. Environmental Impact Assessment Review, 28(7), 469-482. doi: http://dx.doi.org/10.1016/j.eiar.2008.01.002
Han, Y., Taylor, J. E., & Pisello, A. L. (2015). Toward mitigating urban heat island effects: Investigating the thermal-energy impact of bio-inspired retro-reflective building envelopes in dense urban settings. Energy and Buildings, 102, 380-389. doi: http://dx.doi.org/10.1016/j.enbuild.2015.05.040
Hawkes, J. (2001). The Fourth Pillar of Sustainability: Culture’s essential role in public planning. Australia: Common Ground Publishing Pty Ltd in association with the Cultural Development Network (Vic).
Heaviside, C., Vardoulakis, S., & Cai, X.-M. (2016). Attribution of mortality to the urban heat island during heatwaves in the West Midlands, UK. Environmental Health, 15(1), 49-59. doi: http://dx.doi.org/10.1186/s12940-016-0100-9
Heralova, R. S. (2014). Life Cycle Cost Optimization Within Decision Making on Alternative Designs of Public Buildings. Procedia Engineering, 85, 454-463. doi: http://dx.doi.org/10.1016/j.proeng.2014.10.572
Howarth, P. A. (2005). Assessment of the visual environment. In J. R. Wilson & N. Corlett (Eds.), Assessment and design of the physical workplace (3rd ed., pp. 663-692): CRC Press.
Hunt, D. R. G. (1980). Predicting artificial lighting use - a method based upon observed patterns of behaviour. Lighting Research & Technology, 12(1), 7-14. doi: http://dx.doi.org/10.1177/096032718001200102
Huo, X., Yu, A. T. W., & Wu, Z. (2017). A comparative analysis of site planning and design among green building rating tools. Journal of Cleaner Production, 147, 352-359. doi: http://dx.doi.org/10.1016/j.jclepro.2017.01.099
Hygh, J. S., DeCarolis, J. F., Hill, D. B., & Ranjithan, S. R. (2012). Multivariate regression as an energy assessment tool in early building design. Building and Environment, 57, 165-175. doi: 10.1016/j.buildenv.2012.04.021
Institute for Building Environment and Energy Conservation. (2008). CASBEE for Home (Detached House) - Technical Manual 2007 Edition (1st ed.). Tokyo, Japan: IBEC.
Institute for Building Environment and Energy Conservation. (2010). CASBEE for new contruction - Technical Manual 2010. Japan.
Instituto Nacional de Estatística. (2012). Consumo de água por habitante. Retrieved June 2016, from INE https://www.ine.pt/xportal/xmain?xpid=INE&xpgid=ine_indicadores&indOcorrCod=0001877&contexto=bd&selTab=tab2
Instituto Nacional de Estatística. (2014a). Censos 2011. Retrieved July 2016 http://censos.ine.pt/ Instituto Nacional de Estatística. (2014b). Resíduos urbanos recolhidos (t) por Localização geográfica
(NUTS - 2013), Tipo de recolha e Tipo de destino (resíduos); Anual Retrieved October 2016, from INE, Portugal https://www.ine.pt/xportal/xmain?xpid=INE&xpgid=ine_indicadores&indOcorrCod=0008659&contexto=bd&selTab=tab2
Instituto Nacional de Estatística. (2015). Resíduos sectoriais produzidos (t) por Actividade económica (CAE Rev. 3) e Tipo de operação de gestão de resíduos; Anual Retrieved October 2016, from INE, Portugal https://www.ine.pt/xportal/xmain?xpid=INE&xpgid=ine_indicadores&indOcorrCod=0008659&contexto=bd&selTab=tab2
Instituto Nacional de Estatística. (2016). Estatísticas dos Resíduos 2014. Lisboa, Portugal: INE. Instituto Nacional de Estatística. (2017). Inquérito à Avaliação Bancária na Habitação. Portugal: INE
https://www.ine.pt/xportal/xmain?xpid=INE&xpgid=ine_destaques&DESTAQUESdest_boui=274750936&DESTAQUESmodo=2.
International Energy Agency (IEA). (2016). Tracking Clean Energy Progress 2016 - Energy Technology Perspectives 2016 Excerpt IEA Input to the Clean Energy Ministerial. France: http://www.iea.org/.
International Initiative for a Sustainable Built Environment, iiSBE. (2014). iiSBE SBTool 2012. Retrieved from http://www.iisbe.org/. [Accessed May 2014].
International Organization for Standardization, ISO. (2004). ISO 15469:2004 CIE S 011/E:2003 - Spatial distribution of daylight — CIE standard general sky. Switzerland: ISO.
International Organization for Standardization, ISO. (2005). ISO 7730:2005 - Ergonomics of the thermal environment — Analytical determination and interpretation of thermal comfort using calculation of the PMV and PPD indices and local thermal comfort criteria. Switzerland: ISO.
International Organization for Standardization, ISO. (2006a). ISO 14040:2006 - Environmental management - life cycle assessment - Principles and framework. Geneva, Switzerland: ISO.

C H A P T E R 5 | E A R L Y S T A G E M O D E L F O R S U S T A I N A B L E D E S I G N – E A S Y M O D E
246
International Organization for Standardization, ISO. (2006b). ISO 14044:2006 - Environmental management - life cycle assessment - Requirements and guidelines. Geneva, Switzerland: ISO.
International Organization for Standardization, ISO. (2011a). ISO 15686-1: 2011 Buildings and constructed assets - Service life planning - Part 1: General principles and framework. Geneva, Switzerland: ISO.
International Organization for Standardization, ISO. (2011b). ISO 21929-1:2011 - Sustainability in building construction - Sustainability indicators - Part 1: Framework for the development of indicators and a core set of indicators for buildings. Geneva, Switzerland: ISO.
International Organization for Standardization, ISO. (2016). ISO 14021:2016 - Environmental labels and declarations - Self-declared environmental claims (Type II environmental labelling). Geneva, Switzerland: ISO.
Islam, H., Jollands, M., & Setunge, S. (2015). Life cycle assessment and life cycle cost implication of residential buildings—A review. Renewable and Sustainable Energy Reviews, 42, 129-140. doi: http://dx.doi.org/10.1016/j.rser.2014.10.006
Iwarsson, S., & Ståhl, A. (2003). Accessibility, usability and universal design—positioning and definition of concepts describing person-environment relationships. Disability and Rehabilitation, 25(2), 57-66. doi: http://dx.doi.org/10.1080/dre.25.2.57.66
Jabornig, S. (2014). Overview and feasibility of advanced grey water treatment systems for single households (Vol. 11).
Kang, H. J. (2015). Development of a Decision Support Tool for nZEB (nearly Zero Emission Building) at the Early Design Stage. Journal of Asian Architecture and Building Engineering, 14(2), 475-481. doi: 10.3130/jaabe.14.475
Kang, J. H. (2017). Development of an Nearly Zero Emission Building (nZEB) Life Cycle Cost Assessment Tool for Fast Decision Making in the Early Design Phase. Energies, 10(1). doi: 10.3390/en10010059
Keeler, M., & Burke, B. (2009). Fundamentals of Integrated Design for Sustainable Building (1st ed. ed.). United Statesof America: Wiley.
Keeler, M., & Vaidya, P. (2016). Fundamentals of Integrated Design for Sustainable Buildings (Second ed.). USA: John Wiley & Sons, Inc. .
Kendall, S. (1999). Open Building: An Approach to Sustainable Architecture. Journal of Urban Technology, 6(3), 1-16. doi: 10.1080/10630739983551
Keung, C. W., & Yiu, T. W. (2015). Potential for long-term sustainability: A visit of bidding objectives and strategies from maintenance contractor’s perspective. Facilities, 33(3-4), 177-194. doi: http://dx.doi.org/10.1108/F-07-2013-0056
Kibert, C. J. (2013). Sustainable Construction: Green Building Design and Delivery (3rd. ed.). New Jersey, USA: John Wiley & Sons, Inc.
Kohler, N., & Moffatt, S. (2003). Life-cycle analysis of the built environment. UNEP Industry and Environment, 26, 17-21.
Kovacic, I., & Zoller, V. (2015). Building life cycle optimization tools for early design phases. Energy, 92, Part 3, 409-419. doi: http://dx.doi.org/10.1016/j.energy.2015.03.027
Kreiner, H., Passer, A., & Wallbaum, H. (2015). A new systemic approach to improve the sustainability performance of office buildings in the early design stage. Energy and Buildings, 109, 385-396. doi: http://dx.doi.org/10.1016/j.enbuild.2015.09.040
Kylili, A., Fokaides, P. A., & Lopez Jimenez, P. A. (2016). Key Performance Indicators (KPIs) approach in buildings renovation for the sustainability of the built environment: A review. Renewable and Sustainable Energy Reviews, 56, 906-915. doi: http://dx.doi.org/10.1016/j.rser.2015.11.096
Lei n.º 32/2012 da Assembleia da República, Diário da República n.º 157/2012, Série I de 2012-08-14 4452-4483 (Portugal 2012).
Lewis, A., Elmualim, A., & Riley, D. (2011). Linking energy and maintenance management for sustainability through three American case studies. Facilities, 29(5/6), 243-254. doi: http://dx.doi.org/10.1108/02632771111120547
Loures, L., & Vaz, E. (2016). Exploring expert perception towards brownfield redevelopment benefits according to their typology. Habitat International. doi: http://dx.doi.org/10.1016/j.habitatint.2016.11.003
Luttropp, C., & Lagerstedt, J. (2006). EcoDesign and The Ten Golden Rules: generic advice for merging environmental aspects into product development. Journal of Cleaner Production, 14(15–16), 1396-1408. doi: http://dx.doi.org/10.1016/j.jclepro.2005.11.022
Lutz, J., Lekov, A., Chan, P., Whitehead, C. D., Meyers, S., & McMahon, J. (2006). Life-cycle cost analysis of energy efficiency design options for residential furnaces and boilers. Energy, 31(2-3), 311-329. doi: 10.1016/j.energy.2005.02.002

E A R L Y S T A G E D E S I G N M E T H O D O L O G Y T O E N S U R E L I F E C Y C L E S U S T A I N A B I L I T Y O F R E S I D E N T I A L B U I L D I N G S
247
Manewa, A., Pasquire, C., Gibb, A., Ross, A., & Siriwardena, M. (2013). Adaptable Buildings: Striving Towards a Sustainable Future. People and the Planet
Marsh, R. (2016). LCA profiles for building components: strategies for the early design process. Building Research & Information, 44(4), 358-375. doi: http://dx.doi.org/10.1080/09613218.2016.1102013
Martinelli, L., Battisti, A., & Matzarakis, A. (2015). Multicriteria analysis model for urban open space renovation: An application for Rome. Sustainable Cities and Society, 14, e10-e20. doi: http://dx.doi.org/10.1016/j.scs.2014.07.002
Masri, M., Yunus, R. M., & Ahmad, S. S. (2016). Underlying Concerns of Socio-cultural Aspects in Green Building Rating Systems towards Improving Quality of Life. Procedia - Social and Behavioral Sciences, 222, 710-719. doi: http://dx.doi.org/10.1016/j.sbspro.2016.05.232
Mateus, R. (2009). Avaliação da Sustentabilidade da Construção - Propostas para o desenvolvimento de edifícios mais sustentáveis. (Philosophy Doctor), Universidade do Minho, Guimarães.
Mateus, R., & Bragança, L. (2006). Tecnologias Construtivas para a Sustentabilidade da Construção (Vol. 5). Porto: Edições Ecopy.
Mateus, R., & Bragança, L. (2009). Evaluation Guide: SBToolPT-H Methodology (English Edition) V2009/2: iiSBE Portugal.
Mateus, R., & Bragança, L. (2011). Sustainability assessment and rating of buildings: Developing the methodology SBToolPT-H. Building and Environment, 46(10), 1962-1971. doi: http://dx.doi.org/10.1016/j.buildenv.2011.04.023
Mateus, R., & Bragança, L. (2016). Manual de avaliação SBToolPT-H. V2016/1. Portugal: iiSBE Portugal. McLeod, R. S., Hopfe, C. J., & Kwan, A. (2013). An investigation into future performance and overheating
risks in Passivhaus dwellings. Building and Environment, 70, 189-209. doi: http://dx.doi.org/10.1016/j.buildenv.2013.08.024
Meiss, A., & Feijó-Muñoz, J. (2015). The energy impact of infiltration: a study on buildings located in north central Spain. Energy Efficiency, 8(1), 51-64. doi: 10.1007/s12053-014-9270-x
Memken, J. A., Gdrber-Dyar, C., & Crull, S. (1997). Space Planning in Residential Design. Housing and Society, 24(3), 69-93. doi: 1http://dx.doi.org/0.1080/08882746.1997.11430278
Milan, C., Bojesen, C., & Nielsen, M. P. (2012). A cost optimization model for 100% renewable residential energy supply systems. Energy, 48(1), 118-127. doi: 10.1016/j.energy.2012.05.034
Miliute-Plepiene, J., & Plepys, A. (2015). Does food sorting prevents and improves sorting of household waste? A case in Sweden. Journal of Cleaner Production, 101, 182-192. doi: http://dx.doi.org/10.1016/j.jclepro.2015.04.013
Mısırlısoy, D., & Günçe, K. (2016). Adaptive reuse strategies for heritage buildings: A holistic approach. Sustainable Cities and Society, 26, 91-98. doi: http://dx.doi.org/10.1016/j.scs.2016.05.017
Mooney, D. (2010). Why is Daylight design the Cinderella of Building Modelling. In Advances in Daylight Simulation - A joint event by the CIBSE Building Simulation Group and the CIBSE Daylight Group (Ed.). United Kingdom: CIBSE.
Mora, E. P. (2007). Life cycle, sustainability and the transcendent quality of building materials. Building and Environment, 42(3), 1329-1334. doi: http://dx.doi.org/10.1016/j.buildenv.2005.11.004
Morrissey, J., Moore, T., & Horne, R. E. (2011). Affordable passive solar design in a temperate climate: An experiment in residential building orientation. Renewable Energy, 36(2), 568-577. doi: http://dx.doi.org/10.1016/j.renene.2010.08.013
Mustaquim, M. M. (2015). A Study of Universal Design in Everyday Life of Elderly Adults. Procedia Computer Science, 67, 57-66. doi: http://dx.doi.org/10.1016/j.procs.2015.09.249
Muthukumaran, S., Baskaran, K., & Sexton, N. (2011). Quantification of potable water savings by residential water conservation and reuse – A case study. Resources, Conservation and Recycling, 55(11), 945-952. doi: http://dx.doi.org/10.1016/j.resconrec.2011.04.013
Nagashima, K. (1999). Glocal Approach Toward Architecture of the Future. In XX UIA Beijing Congress (Ed.). Japan: Union Internationale des Architectes and the Japan Institute of Architects.
Nielsen, T. R. (2005). Simple tool to evaluate energy demand and indoor environment in the early stages of building design. Solar Energy, 78(1), 73-83. doi: http://dx.doi.org/10.1016/j.solener.2004.06.016
O’Malley, C., Piroozfar, P., Farr, E. R. P., & Pomponi, F. (2015). Urban Heat Island (UHI) mitigating strategies: A case-based comparative analysis. Sustainable Cities and Society, 19, 222-235. doi: http://dx.doi.org/10.1016/j.scs.2015.05.009
Oke, T. R. (1982). The energetic basis of the urban heat island. Quarterly Journal of the Royal Meteorological Society, 108(455), 1-24
Olessen, B. W. (1997). Thermal comfort requirements for floors occupied by people with bare feet. ASHRAE Transactions 83(2451), 41-57

C H A P T E R 5 | E A R L Y S T A G E M O D E L F O R S U S T A I N A B L E D E S I G N – E A S Y M O D E
248
Oliveira, A. (2012). A Casa Compreensiva: A convivencialidade na concepção arquitectónica das tipologias de habitação em Portugal continental. (Doctoral Degree in Social Sciences Doctoral Thesis), Universidade Fernando Pessoa, Porto.
OpenHouse, (2010). Open House Project. Retrieved from http://www.openhouse-fp7.eu/. [Accessed June 2013 2013].
Opoku, A. (2015). The Role of Culture in a Sustainable Built Environment, 37-52. doi: http://dx.doi.org/10.1007/978-3-319-14002-5_3
Ostad-Ahmad-Ghorabi, H., Bey, N., & Wimmer, W. (2008). Parametric ecodesign e an integrative approach for implementing ecodesign into decisive early design stages. International design conference e design 2008, Dubrovnik, Croatia.
Østergård, T., Jensen, R. L., & Maagaard, S. E. (2016). Building simulations supporting decision making in early design – A review. Renewable and Sustainable Energy Reviews, 61, 187-201. doi: http://dx.doi.org/10.1016/j.rser.2016.03.045
Pacheco, R., Ordóñez, J., & Martínez, G. (2012). Energy efficient design of building: A review. Renewable and Sustainable Energy Reviews, 16(6), 3559-3573. doi: http://dx.doi.org/10.1016/j.rser.2012.03.045
Pacione, M. (2003). Urban environmental quality and human wellbeing - a social geographical perspective. Landscape and Urban Planning, 65(1-2), 21-32. doi: http://dx.doi.org/10.1016/S0169-2046(02)00234-7
Pauleit, S., & Duhme, F. (2000). Assessing the environmental performance of land cover types for urban planning. Landscape and Urban Planning, 52(1), 1-20. doi: http://dx.doi.org/10.1016/S0169-2046(00)00109-2
Perfection Consortium. ( 2011). PERFECTION – Performance Indicators for Health, Comfort and safety of the Indoor Environment. In FP7 EU Project Grant number 212998 (Ed.).
Persson, H., Åhman, H., Yngling, A., & Gulliksen, J. (2015). Universal design, inclusive design, accessible design, design for all: different concepts—one goal? On the concept of accessibility—historical, methodological and philosophical aspects. Universal Access in the Information Society, 14(4), 505-526. doi: http://dx.doi.org/10.1007/s10209-014-0358-z
Petersen, S., & Svendsen, S. (2010). Method and simulation program informed decisions in the early stages of building design. Energy and Buildings, 42(7), 1113-1119. doi: http://dx.doi.org/10.1016/j.enbuild.2010.02.002
Pistocchi, A., Calzolari, C., Malucelli, F., & Ungaro, F. (2015). Soil sealing and flood risks in the plains of Emilia-Romagna, Italy. Journal of Hydrology: Regional Studies, 4, 398-409. doi: http://dx.doi.org/10.1016/j.ejrh.2015.06.021
Portaria 349-B/2013 do Ministério do Ambiente, Ordenamento do Território e Energia, Diário da República n.º 232/2013, 1º Suplemento, Série I de 2013-11-29 6624-(6618) a 6624-(6629) (Portugal 2013).
Pouyat, R. V., Yesilonis, I. D., & Nowak, D. J. (2006). Carbon storage by urban soils in the United States. J Environ Qual, 35(4), 1566-1575. doi: http://dx.doi.org/10.2134/jeq2005.0215
Programme for the Endorsement of Forest Certification, PEFC. (2016). PEFC web page. Retrieved from http://www.pefc.org/. [Accessed June 2016].
Prokop, G., Jobstmann, H., & Schönbauer, A. (2011). Report on best practices for limiting soil sealing and mitigating its effects (Technical Report - 2011 - 050). Retrieved from Report for European Commission (DG Environment): http://ec.europa.eu/environment/archives/soil/pdf/sealing/Soil sealing - Final Report.pdf.
Province of Manitoba. Heritage building maintenance manual. In M. Heritage Buildings Unit (Ed.). Cadana.
Pulselli, R. M., Simoncini, E., Pulselli, F. M., & Bastianoni, S. (2007). Emergy analysis of building manufacturing, maintenance and use: Em-building indices to evaluate housing sustainability. Energy and Buildings, 39(5), 620-628. doi: http://dx.doi.org/10.1016/j.enbuild.2006.10.004
Ramos, N. M. M., Almeida, R. M. S. F., Curado, A., Pereira, P. F., Manuel, S., & Maia, J. (2015). Airtightness and ventilation in a mild climate country rehabilitated social housing buildings – What users want and what they get. Building and Environment, 92, 97-110. doi: http://dx.doi.org/10.1016/j.buildenv.2015.04.016
Ribas, D. A. (2015). Metodologia de avaliação da sustentabilidade económica de edifícios com base no ciclo de vida. (Philosophy Doctor), Universidade de Aveiro, Aveiro, Portugal.
Ribas, D. A., Morais, M. M., & Cachim, P. B. (2016). Definition of benchmarks for the assessment of the economic performance of buildings Advances and Trends in Engineering Sciences and Technologies II (pp. 623-630): CRC Press.

E A R L Y S T A G E D E S I G N M E T H O D O L O G Y T O E N S U R E L I F E C Y C L E S U S T A I N A B I L I T Y O F R E S I D E N T I A L B U I L D I N G S
249
Richardson, I., Thomson, M., Infield, D., & Delahunty, A. (2009). Domestic lighting: A high-resolution energy demand model. Energy and Buildings, 41(7), 781-789. doi: 10.1016/j.enbuild.2009.02.010
Rios, F. C., Chong, W. K., & Grau, D. (2015). Design for Disassembly and Deconstruction - Challenges and Opportunities. Defining the Future of Sustainability and Resilience in Design, Engineering and Construction, 118, 1296-1304. doi: http://dx.doi.org/10.1016/j.proeng.2015.08.485
Roberts-Hughes, R. (2011). The Case for Space: the size of England's new homes. London, United Kingdom: RIBA.
Rousta, K., Bolton, K., Lundin, M., & Dahlén, L. (2015). Quantitative assessment of distance to collection point and improved sorting information on source separation of household waste. Waste Management, 40, 22-30. doi: http://dx.doi.org/10.1016/j.wasman.2015.03.005
Saari, A., Tissari, T., Valkama, E., & Seppanen, O. (2006). The effect of a redesigned floor plan, occupant density and the quality of indoor climate on the cost of space, productivity and sick leave in an office building - A case study. Building and Environment, 41(12), 1961-1972. doi: http://dx.doi.org/10.1016/j.buildenv.2005.07.012
Sallustio, L., Quatrini, V., Geneletti, D., Corona, P., & Marchetti, M. (2015). Assessing land take by urban development and its impact on carbon storage: Findings from two case studies in Italy. Environmental Impact Assessment Review, 54, 80-90. doi: http://dx.doi.org/10.1016/j.eiar.2015.05.006
Santos, P., Martins, R., Gervásio, H., & Simões da Silva, L. (2014). Assessment of building operational energy at early stages of design – A monthly quasi-steady-state approach. Energy and Buildings, 79(0), 58-73. doi: http://dx.doi.org/10.1016/j.enbuild.2014.02.084
Sassi, P. (2006). Strategies for sustainable architecture. London; New York: Taylor & Francis. SB_Steel - Sustainable Building Project in Steel. (2010-2013). Research project supported by European
Community’s Research Fund for Coal and Steel (RFCS) under grant agreement: RFSR-CT-2010-00027.
Scammon, D. (2012). Sustainability and Culture: How do they work together? : http://www.academia.edu/1817961/Sustainability_and_Culture_How_do_they_work_together.
Schmidt III, R., Eguchi, T., Austin, S., & Gibb, A. (2010). What is the meaning of Adaptability in the building industry? O&SB 2010, 233
Shearer, L., Gatersleben, B., Morse, S., Smyth, M., & Hunt, S. A problem unstuck? Evaluating the effectiveness of sticker prompts for encouraging household food waste recycling behaviour. Waste Management. doi: http://dx.doi.org/10.1016/j.wasman.2016.09.036
Silvestre, J. D., Lasvaux, S., Hodková, J., de Brito, J., & Pinheiro, M. D. (2015). NativeLCA - a systematic approach for the selection of environmental datasets as generic data: application to construction products in a national context. The International Journal of Life Cycle Assessment, 20(6), 731-750. doi: http://dx.doi.org/10.1007/s11367-015-0885-8
Sivo, M. D., & Ladiana, D. (2010). Building Maintenance: A Technology For Resource Conservation. In S. Hernández, C. A. Brebbia & W. P. De Wilde (Eds.), Eco-Architecture III - Harmonisation Between Architecure and Nature (Vol. 128, pp. 435-446). Southampton, United Kingdom: WIT Press.
Slaughter, E. S. (2001). Design strategies to increase building flexibility. Building Research & Information, 29(3), 208-217. doi: http://dx.doi.org/10.1080/09613210010027693
Statistical Office of the European Communities, (2015, January 2016). EUROPOP2013 - Population projections. Retrieved from http://ec.europa.eu/eurostat/web/population-demography-migration-projections/population-projections-/database.
Steemers, K. (2003). Cities, energy and comfort: a PLEA 2000 review. Energy and Buildings, 35(1), 1-2. doi: http://dx.doi.org/10.1016/S0378-7788(02)00074-9
Stephan, A., & Crawford, R. H. (2014). A comprehensive life cycle water analysis framework for residential buildings (Vol. 42).
Støa, E. (2012). Adaptable Housing. In S. J. Smith (Ed.), International Encyclopedia of Housing and Home (pp. 51-57). San Diego: Elsevier.
Su, X., Luo, Z., Li, Y., & Huang, C. (2016). Life cycle inventory comparison of different building insulation materials and uncertainty analysis. Journal of Cleaner Production, 112, Part 1, 275-281. doi: http://dx.doi.org/10.1016/j.jclepro.2015.08.113
Sustainable Forest Iniciative Inc., SFI. (2016). SFI webpage. Retrieved from http://www.sfiprogram.org/. [Accessed June 2016].
Teller, J., & Bond, A. (2002). Review of present European environmental policies and legislation involving cultural heritage. Environmental Impact Assessment Review, 22(6), 611-632. doi: http://dx.doi.org/10.1016/S0195-9255(02)00009-4

C H A P T E R 5 | E A R L Y S T A G E M O D E L F O R S U S T A I N A B L E D E S I G N – E A S Y M O D E
250
The Center for Universal Design, N. C. S. U. (2003). A Guide to Evaluating the Universal Design Performance of Products. United States of America: The Center for Universal Design, North Carolina State University.
The Department of the Environment, T. a. t. R. (1998). Desktop guide to daylighting – for architects. United Kingdom: BRE http://www.cibse.org/getmedia/19b5aa2a-309f-4e8d-8e72-07b5c4c4cf72/GPG245-Desktop-Guide-to-Daylighting-for-Architects.pdf.aspx.
The Getty Conservation Institute. (2002). Assessing the Values of Cultural Heritage. Los Angles, USA: http://www.getty.edu/conservation/publications_resources/pdf_publications/pdf/assessing.pdf.
Tibi, G., Ghaddar, N., & Ghali, K. (2012). Sustainable design guidelines for detached housing in the Lebanese inland region. International Journal of Sustainable Built Environment, 1(2), 177-193. doi: http://dx.doi.org/10.1016/j.ijsbe.2013.06.001
Till, J., & Schneider, T. (2005). Flexible housing: the means to the end. arq: Architectural Research Quarterly, 9(3-4), 287-296. doi: http://dx.doi.org/10.1017/S1359135505000345
Timlett, R. E., & Williams, I. D. (2009). The impact of transient populations on recycling behaviour in a densely populated urban environment. Resources, Conservation and Recycling, 53(9), 498-506. doi: http://dx.doi.org/10.1016/j.resconrec.2009.03.010
Turbé, A., Toni, A. d., Benito, P., Lavelle, P., Lavelle, P., Camacho, N. R., . . . Mudgal, S. (2010). Soil biodiversity: functions, threats and tools for policy makers (Technical Report - 2010 - 049). Bio Intelligence Service, IDR & NIOO. Retrieved from Report for European Commission (DG Environment): http://ec.europa.eu/environment/archives/soil/pdf/biodiversity_report.pdf.
Tweed, C., & Sutherland, M. (2007). Built cultural heritage and sustainable urban development. Landscape and Urban Planning, 83(1), 62-69. doi: http://dx.doi.org/10.1016/j.landurbplan.2007.05.008
U.S Green Building Council, (2014). LEED v4 for Homes Design and Construction. Retrieved from http://www.usgbc.org/articles/getting-know-leed-homes-design-and-construction. [Accessed June 2014].
UK Higher Education Space Management Group. (2006). Promoting space efficiency in building design. United Kingdom.
Ulme, A. (2013). Universal Design and Sustainable Spatial Development (Vol. 8). UNESCO. (2012). Culture: a driver and an enabler for sustainable development. Retrieved from UN System Task
Team on the Post-2015 UN Development agenda: http://www.unesco.org/new/fileadmin/MULTIMEDIA/HQ/post2015/pdf/Think_Piece_Culture.pdf.
United Nations Framework Convention on Climate Change (UNFCCC), (2014). summary of the Paris Agreement. Retrieved from http://bigpicture.unfccc.int/ - content-the-paris-agreemen. [Accessed November 2016].
Vieira, P., Almeida, M. d. C., Baptista, J. M., & Ribeiro, R. (2007). Household water use: a Portuguese field study. Water Science and Technology: Water Supply, 7(5-6), 193-202. doi: 10.2166/ws.2007.098
von Weizsäcker, E. U., Lovins, A. B., & Lovins, L. H. (1998). Factor Four: Doubling Wealth, Halving Resource Use - A Report to the Club of Rome. United Kingdom: Earthscan.
Webster, M. D. (2007). Structural Design for Adaptability and Deconstruction: A Strategy for Closing the Materials Loop and Increasing Building Value. Structures Congress: New Horizons and Better Practices, Long Beach, California.
Wedding, G. C., & Crawford-Brown, D. (2007). Measuring site-level success in brownfield redevelopments: a focus on sustainability and green building. J Environ Manage, 85(2), 483-495. doi: http://dx.doi.org/10.1016/j.jenvman.2006.10.018
Wessman, H. (2011). Water footprint ‐ description and the state‐of‐the‐art. Finland. Wilde, S. d., & Dobbelsteen, A. v. d. (2004). Space use optimisation and sustainability—environmental
comparison of international cases. Journal of Environmental Management, 73(2), 91-101. doi: http://dx.doi.org/10.1016/j.jenvman.2004.06.003
Wille, L. F., & Woolf, D. (2015). Thermal and occupant comfort. In C. J. Hopfe & R. S. McLeod (Eds.), The Passivhaus Designer’s Manual: A technical guide to low and zero energy buildings (1st. ed., pp. 31-48). New York, USA: Routledge.
Williams, K., & Dair, C. (2007). What is stopping sustainable building in England? Barriers experienced by stakeholders in delivering sustainable developments. Sustainable Development, 15(3), 135-147. doi: http://dx.doi.org/10.1002/sd.308
World Business Council for Sustainable Development, WBCSD. (2009). Facts and trends: Water v.2 (pp. 16). Switzerland.

E A R L Y S T A G E D E S I G N M E T H O D O L O G Y T O E N S U R E L I F E C Y C L E S U S T A I N A B I L I T Y O F R E S I D E N T I A L B U I L D I N G S
251
World Health Organization, WHO. (2016). Water Sanitation Health. Retrieved from http://www.who.int/water_sanitation_health/emergencies/qa/emergencies_qa5/en/. [Accessed June 2016].
World Health Organization Regional Office for Europe. (2000). The Right to Healthy Indoor Air. Copenhagen, Denmark: http://www.euro.who.int/document/e69828.pdf.
World Health Organization regional Office for Europe. (2010). WHO guidelines for indoor air quality: selected pollutants. Copenhagen, Denmark: World Health Organization.
WRAP, T. W. R. A. P. a. A. R. L. (2008). Choosing construction products - Guide to the recycled content of mainstream construction products (GB Version 4.1 ed.). Oxon, Reino Unido: The Waste & Resources Action Programme.
Yang, J., Wang, Z.-H., & Kaloush, K. E. (2015). Environmental impacts of reflective materials: Is high albedo a ‘silver bullet’ for mitigating urban heat island? Renewable and Sustainable Energy Reviews, 47, 830-843. doi: http://dx.doi.org/10.1016/j.rser.2015.03.092
Zero Carbon Hub. (2016). Solutions to Overheating in Homes - Evidence Review. United Kingdom: http://www.zerocarbonhub.org/.
Živković, M., & Jovanović, G. (2012). A method for evaluating the degree of housing unit flexibility in multi-family housing. Facta Universitatis - Architecture and Civil Engineering, 10(1), 17-32. doi: http://dx.doi.org/10.2298/FUACE1201017Z

253
6 EASYMODE VERIFICATION
6.1 | INTRODUCTION
This chapter aims at providing the verification and validation of the developed tool within this thesis
– EasyMode.
Due to time constrains, it was impossible to carry out the validation using a starting project. Therefore,
the EasyMode validation was conducted by a case study, through a three-step process. In the first, the
case study was assessed using a third-party independent tool – SBToolPT-H v2016/1 – to verify its
sustainability performance. Then, the same case study was examined using EasyMode, verifying the
improvements that would have been possible if the early design was carried out using the tool. Finally,
a second sustainability assessment was performed to the case study, but now considering the potential
changes driven by EasyMode. Results of this second evaluation were compared with the results from
the first assessment and conclusions were drawn.
The case study is a simple family building located in Coimbra county, in Portugal. It is a two-storey
building, with a light steel frame structure. Detail on the building is given previously to the assessments.
6.2 | BUILDING DESCRIPTION
The case study is a light steel framing dwelling located in Coimbra, Portugal. It was designed and built
within the Affordable Houses Project, launched by Arcelor Mittal in 2009 (Murtinho et al., 2010). The

C H A P T E R 6 | E A S Y M O D E V A L I D A T I O N
254
building was developed by a team of several architects and engineers from the University of Coimbra.
It was designed for a standard family, consisting of a two-floor house with three bedrooms. The lower
floor holds the common part of the house, whereas the upper floor embraces the bedrooms.
Durability and adaptability were considered since pre-design. It was planned that the building should
be able to be easily increased. It was decided to define a maximum rectangular area – 9.6 m ́ 12.6 m –
for the house implementation, fully respecting a modular set predicted. The main façade of the
building is facing west, but the southern façade has the highest glazing area.
The house is a two-story single family dwelling in light steel framing with three bedrooms, one living-
room, kitchen and two bathrooms. Each floor is shaped like an “L”, overlapped in the body of the
letter, resulting in a building with a “C” shape (Figure 6.1). There is a covered parking inside the
parcel, under the overlapping of the two “LL”. The main dimensions, in the plane, are 12.30 ´
9.30 m2, each floor is approximately 2.65 m high, and the roof’s slope is 0º. Figure 6.2 shows the
building’s exterior architecture while Figure 6.3 represents the building’s floor plan.
Figure 6.1. Schematics representing the building's shape
(a) (b)
(c)
Figure 6.2. 3D representation of the building; the three pictures show the different façade of the building (CoolHaven, 2017)

E A R L Y S T A G E D E S I G N M E T H O D O L O G Y T O E N S U R E L I F E C Y C L E S U S T A I N A B I L I T Y O F R E S I D E N T I A L B U I L D I N G S
255
(a) (b)
Figure 6.3. Building’s floor plan; (a) ground floor plan and, (b) first floor plan (adapted from CoolHaven, 2017)
The building’s exterior walls are composed by, from outside to inside: (i) one layer of Oriented Strand
Board (OSB) panels with 11 mm thick; (ii) air layer with 30 mm thickness; (iii) two panels of rock wool
140 mm thick and (iv) one layer of gypsum board 15 mm thick. Internal walls are made by two gypsum
boards, one in each side, and the gap between is filled by an air layer of 30 mm thickness and a layer
of rock wool 70 mm thick. The internal floor is made by the upper finishing (10 mm), one OSB panel
with 18 mm thickness, an air layer of 380 mm thick, rock wool layer with 40 mm thick and a layer of
gypsum board (15 mm). The building’s ground floor is composed of a layer of gravel followed by a
light concrete slab with 180 mm thick, a layer of XPS (40 mm), 40 mm thick of cast concrete and the
floor finishing of 10 mm thickness. The terrace floor is composed of a top layer of mortar slab (30 mm)
followed by an XPS layer with 30 mm thickness, an air gap (30 mm), cast concrete of 40 mm thick, an
OSB panel of 40 mm thick, another air gap of 80 mm, rock wool with 120 mm thickness and a gypsum
board of 15 mm thick. Finally, the building’s external floor is made of EPS layer of 50 mm thick
covered by the exterior finishing (3 mm), an OSB panel of 13 mm thick, an air layer with 183 mm
thickness, 120 mm thick rock wool, air layer of 80 mm thick and an OSB panel of 18 mm thick. The
house’s steel frame is clad by the rock wool insulation panels to assure high thermal and acoustic
performance. The building’s envelope is covered by external thermal insulation composite system
(ETICS). The main characteristics of the house are presented in Table 6.1.

C H A P T E R 6 | E A S Y M O D E V A L I D A T I O N
256
Table 6.1. Case study building description
General information Details Building typology T3 (equivalent to 3 bedrooms) Location Coimbra Climatic zone I1, V2 (Csa, in Köppen Geiger climate classification) Maximum land use index 0.45 Characteristics Number of occupants 4 Number of floors 2 Allotment area 352.56 m2 Deployment area 100.80 m2 Gross floor area 159.00 m2 Net internal area 128.17 m2 Net usable area 106.14 m2 Green area 215.20 m2 Building orientation South Heating energy needs 53.36 kWh/m2·year Cooling energy needs 6.13 kWh/m2·year DHW energy needs 36.31 kWh/m2·year Total primary energy needs 2.39 kWh/m2·year Investment cost € 88 757.32 Materials Structure Light steel frame Insolation EPS and rock wool Renewable energy systems Solar collector for DWH production Heating system Liquid fuel boiler Cooling system Natural ventilation DHW production system Solar collector supported by liquid fuel boiler. Other Lifespan 50 Years
6.3 | FIRST SUSTAINABILITY ASSESSMENT – SBTool P T -H
The building was first evaluated using SBToolPT-H BSA tool, version 2016/1. This tool has already
been described in Chapter 2 and some additional thoughts about it throughout Chapter 5. A detailed
description of SBToolPT-H procedure can be found in the tool’s manual (Mateus & Bragança, 2016).
Due to data availability, some assumptions were required during the assessment. To normalise the
assessment and avoid assessment inaccuracies in the three steps, the assumptions defined in this step
were reproduced in the following two EasyMode validation steps. Those were:
• Building is in county capital (zone 2);
• No cement replacement materials were used in the concrete;
• Paints and varnish have low VOC content;
• Organic based products as MDF or OSB are certified.
Table 6.2 and Table 6.3 depict the achieved results in each category and respective parameters within
SBToolPT-H. The overall results from categories, dimensions, and final score are depicted in Table 6.4.

E A R L Y S T A G E D E S I G N M E T H O D O L O G Y T O E N S U R E L I F E C Y C L E S U S T A I N A B I L I T Y O F R E S I D E N T I A L B U I L D I N G S
257
Table 6.2. Case study first SBToolPT-H assessment: results from parameters assessment
Category Parameter Evaluation Weight (%)
Weighted value
C1 – Climate change and outdoor air quality
P1 Aggregate value of the environmental impacts of life cycle per m2 of useful area of pavement and per year
0.12 100 0.12
C2 – Use of floor and biodiversity
P2 Percentage utilized in the available liquid rate of utilization 1.25 (1.2) 38 0.456
P3 Index of waterproofing 0.70 5 0.035
P4 Percentage of area of intervention previously contaminated or built 0.00 6 0.000
P5 Percentage of green areas occupied by autochthonous plants 0.27 24 0.066
P6 Percentage of area in plan with reflectance equal or greater than 60 0.46 27 0.124
C3 – Energy P7 Consumption of non-renewable primary
energy in stage of use 0.80 50 0.397
P8 Amount of energy that is produced in the building through renewable sources -0.05 50 -0.027
C4 – Materials and solid wastes
P9 Percentage by weight of materials reused in the construction of the building 0.00 25 0.000
P10 Percentage by weight of recycled materials used in the construction of the building
0.78 25 0.190
P11 Percentage by cost of organic products that are certified 17.14 (1.2) 28 0.336
P12 Percentage by mass of cement replacement materials in the concrete 0.17 18 0.030
P13 Index of selective deposition efficiency of household waste 0.00 4 0.00
C5 – Water
P14 Volume of potable water consumed annually per capita 0.97 64 0.621
P15 Percentage of reduction in the consumption of potable water with recourse to recycled and/or reused water
0.00 36 0.000
C6 – Health and comfort of users
P16 Potential of natural ventilation 2.0 (1.2) 12 0.144
P17 Percentage by weight of finishing materials with low VOC content 1.05 12 0.130
P18 Level of annual average thermal comfort 0.80 32 0.26 P19 Average of the medium daylight factor 2.28 (1.2) 25 0.300 P20 Average level of acoustic isolation 0.67 19 0.127
C7 – Accessibility P21 Index of accessibility to public transport 0.26 55 0.141 P22 Index of accessibility to amenities 2.8 (1.2) 45 0.540
C8 – Awareness and education for sustainability
P23 Availability of the user guide of the building 1.08 100 1.083
C9 – Life cycle costs P24 Initial investment cost 0.68 50 0.340
P25 Usage costs 0.80 50 0.400

C H A P T E R 6 | E A S Y M O D E V A L I D A T I O N
258
Table 6.3. Case study first SBToolPT-H assessment: results for Categories
Dimension Category Evaluation Weight (%)
Weighted value
D1 – Environment
C1 Climate change and outdoor air quality 0.119 (C) 12 0.016 C2 Use of floor and biodiversity 0.681 (B) 19 0.136 C3 Energy 0.371 (C) 32 0.119 C4 Materials and solid waste 0.560 (B) 29 0.162 C5 Water 0.621 (B) 6 0.037
D2 – Social
C6 Health and comfort of users 0.952 (A) 60 0.571 C7 Accessibility 0.681 (B) 30 0.204
C8 Awareness and education for sustainability 1.083 (A+) 10 1.083
D3 – Economic C9 Life cycle costs 0.740 (A) 100 0.740
Table 6.4. Case study first SBToolPT-H assessment: Final quantification – Sustainability level
Dimension Evaluation Weight (%)
Weighted value
D1 Environment 0.470 (C) 40 0.188 D2 Social 0.884 (B) 30 0.265 D3 Economic 0.733 (A) 30 0.222 Overall Sustainability Level 0.675 (B)
As it can be seen, the case study building has a sustainability performance level of B.
6.4 | EASYMODE APPLICATION
This section presents the assessment of the case study using EasyMode. As it aims to mimic early design,
not all the data used in the previous assessment would be available. In fact, EasyMode should be able
to aid setting the data that then would be available to BSA for certification purposes.
For this purpose, the building was considered as a rectangular shape with a width-to-length ratio of
1:2 with the following glazing percentage:
• North-oriented: 20%;
• East-oriented: 10%;
• South-oriented: 25%;
• West-oriented: 8%.
The first step was to introduce the main available data in the EasyMode workbook, as seen in Figure 6.4.

E A R L Y S T A G E D E S I G N M E T H O D O L O G Y T O E N S U R E L I F E C Y C L E S U S T A I N A B I L I T Y O F R E S I D E N T I A L B U I L D I N G S
259
Figure 6.4. Input data spreadsheet- EasyMode case-study
6.4.1 | Environmental assessment
This section regards the assessment of all indicators related the environmental area, corresponding to
categories C1 ‘Selection of materials’ and C2 ‘Efficiency’.
6.4.1.1 | C1 Selection of materials
The first analysis carried out was to indicator I1 Life cycle environmental impact. The simplified
construction solutions were introduced in the EasyMode, identifying the main components of each
building element, retrieved from the database and their thickness whenever applied (Figure 6.5).
To understand the potentialities of EasyMode, it was essential to compare the results of the case study
building solutions with an alternative. The alternative solution was the defined as the conventional
solution used in SBToolPT-H, as summarised in Table 6.5.
Table 6.5. Solution 2 building elements description for LCA assessment
Building element Description
External walls Double wall of hollow brick masonry (11 +15 cm), air-gap partially filled with XPS (4 cm), plastered on both sides with cement mortar (1.5 cm), and painted with two layers of plastic paint.
Internal walls Hollow brick masonry (11 cm), plastered on both sides with cement mortar (1.5 cm) and two layers of plastic paint.
Ground floor Gravel (20 cm), concrete (15 cm) PVC membrane (1.8 kg/m2), regularization layer of cement mortar (5 cm), cement paste (1 cm), and ceramic tile.
Internal floors lightweight slab of pre-stressed concrete beams and ceramic blocks, concrete compression layer and layer of cement mortar regularization (5 cm), cement paste (1 cm) and ceramic tiles, and for the ceilings plaster (1.5 cm), including painting.
Roof Lightweight slab of pre-stressed concrete beams and ceramic blocks with levelling floor cement mortar (5 cm), and ceramic tiles
Structure Reinforced concrete (100 kg/m3) Glazing two-foiled window (4 mm glass + 6 mm air box + 8 mm glass) with aluminium frames
Project Title Case Study
Owner Affordable House project
Location CoimbraTypology T3N. Inhabitants 4Allotment area 352.56 m 2
IUL max 0.45Number of Floors (forseen) 2Construction area 159 m 2
Light steel framing
Rooms Default Determined
N. Bedrooms 3N. Living rooms 1N. Kitchens 1N. WC 2
Construction typology

C H A P T E R 6 | E A S Y M O D E V A L I D A T I O N
260
Figure 6.5. Input for I1 assessment in EasyMode case-study
The result achieved for each environmental impact category selected, for the given RSP (50 years) for
each solution is presented in Table 6.6. It is visible that solution 1 has a better environmental
performance. In this sense, no changes were recommended to be implemented in this indicator.
Table 6.6. Results from EasyMode indicator I1
Environmental impact category Solution 1 Solution 2
GWP (KgCO2/m2×year) 9.34 ´ 101 6.60 ´ 102 AP (KgSO2/m2×year) 2.66 ´ 10-1 1.52 TPE (MJ/m2×year) 8.35 ´ 102 5.30 ´ 103 EP (kg PO4/m2×year) 3.31 ´ 10-2 2.74 ´ 10-1 ODP (kgCFC-11/m2×year) 1.66 ´ 10-4 3.48 ´ 10-5 POCP (kg.C2H4/m2×year) 1.86 ´ 10-2 6.83 ´ 10-2
E A R L Y S T A G E D E S I G N M E T H O D O L O G Y T O E N S U R E L I F E C Y C L E S U S T A I N A B I L I T Y O F R E S I D E N T I A L B U I L D I N G S
261
In indicator I2. Certified Product and responsible sourcing two alternatives were analysed:
• Solution 1: effort 1 ‘Wood or wood-based products certified by FSC, PEFC or similar (reused
or reclaimed)’ was selected;
• Solution 2: effort 1 and effort 2 ‘Manufacturers certified by ISO 14001 or EMAS, and
OHSAS 1800’.
The comparison of the solutions revealed that solution 2 is indeed more sustainable (Level 2) than
solution 1 (Level 1). Nevertheless, attaining just for effort 1 would mean that designers were attaining
to have all wood-based products certified.
When analysing indicator I3. Recycled and reuse of materials and components, the given recommendations of
recycled content were analysed for the materials used in the construction solutions considered in I1.
Given the EasyMode recommendations to attain for Level 3, it was decided to improve the recycled
content of three materials used:
• Improve OSB and MDF recycled content to 90%;
• Improve the recycle content of the ceramic tile to 80%.
In I4. Heat island the efforts should be selected, and alternatives can be compared. Two solutions were
addressed; Solution 1 corresponding to what was implemented in the case study and; Solution 2
attaining for EasyMode Level 3, as follows:
• Solution 1: effort 2.1 was selected – “arranging lawns, grass, shrubs, or ponds and covering
materials with good water retainability or water permeability are used for the ground surface.”
• Solution 2: the effort selected in Solution 1 plus effort 3 “Covering materials with sunlight
reflectivity are used for the ground surface” and effort 4.2 “roofing materials with good
sunlight reflectivity and longwave radiation efficiency are selected.”
The solutions comparison showed that Solution 1 would achieve an indicative performance in Level
1 while Solution 2 would reach Level 3. Thus, the improvements from Solution 1 to Solution 2 were
accounted, in the second SBToolPT-H analysis.
6.4.1.2 | C2 Efficiency
I5. Energy Efficiency indicator comprises two sub-indicators: I5.1 Energy needs and I5.2 Local production.
For the first, EasyMode recommends the use of the ESSAT tool developed within the SB_Steel
European Project freely available online at http://www.onesource.pt/sbsteel/site/. The assessment
was assumed as being for the conceptual stage and considering the building data already presented.
Additionally, the information presented in Table 6.7 was required to perform the assessment.

C H A P T E R 6 | E A S Y M O D E V A L I D A T I O N
262
Table 6.7. Additional data for the energy assessment with SB_Steel tool
Aspects Detail
Indoor conditions
Heating set point: 20 ºC Cooling set point: 25 ºC Air flow rate, heating: 0.6 ac/h Air flow rate, cooling: 1.2 ac/h
Renewable energy electricity production: 0 kWh/Year For DHW: 1757 kWh/Year
Additional envelope information
Shading device: Exterior opaque wood device (no insulation) Light (default) Colour of opaque envelope: light Ground floor type: suspended Soil type: default
Table 6.8 shows the data retrieved from the energy assessment and added to EasyMode.
An alternative solution was tested, considering a more conventional practice for the construction
solutions, similar20 to the one considered in I1. Just the construction solutions were changed, all the
other data was kept equal to the first solution. Table 6.9 shows the results from this Solution 2.
Comparing the results, as seen in the print screen from the EasyMode spreadsheet (Figure 6.6) it is
possible to verify that Solution 2 has greater performance, for space cooling and heating.
Table 6.8. Results from energy assessment with SB_Steel tool to solution 1 (kWh/m2·year)
Need Delivered Renewable Primary1 Heating 4.8 6.0 0.0 6.0 Cooling 12.6 4.5 0.0 11.5 DHW 14.8 16.9 7.7 16.9
1- in kWhEP/m2·year
Table 6.9. Results from energy assessment with SB_Steel tool to solution 2 (kWh/m2·year)
Need Delivered Renewable Primary1 Heating 4.4 5.5 0.0 5.5 Cooling 8.7 2.9 0.0 7.3 DHW 14.8 16.9 7.7 16.9
1- in kWhEP/m2·year
Figure 6.6. Graphical representation of energy efficiency indicator in EasyMode
20 The consideration of equal solutions was not possible due to database constrains of the SB_Steel tool.
4.8 4.4
12.68.7
14.814.8
0
10
20
30
40
1 2
Energy
-Ne
ed(kWh/m
2 .year
) DHV
Cooling
Heating

E A R L Y S T A G E D E S I G N M E T H O D O L O G Y T O E N S U R E L I F E C Y C L E S U S T A I N A B I L I T Y O F R E S I D E N T I A L B U I L D I N G S
263
To avoid hampering the environmental life cycle impact due to construction solutions’ changes, the
recommendations would be to improve passive cooling measures, as the major differences regarding
the cooling needs. These changes cannot be quantified within simplified models such as these, but in
later stages, their efficacy can be quantitatively evaluated. Within EasyMode, a qualitative
acknowledgement can be accounted in I18.3 Solar design strategies. Thus, no changes quantifiable in the
SBToolPT-H energy indicators, were added in the second analysis. Nevertheless, more tests and
alternatives can be tested. For instance, for the same construction solution alternative insulation
material or thickness, shading devices can be tested, verifying the differences imposed to the energy
requirements. If increasing the insulation thickness reduces energy heating needs, then a simple
valuation can be done to verify if with a life cycle thinking it is worth it or not (comparing the higher
acquisition costs due by the thickness augmenting versus the decrease in the cost driven by the
reduction on the energy need). This simple analysis, supported by accurate thermal and energy
calculations, can deeply contribute to the building’s energy efficiency improvement.
The I5.2 assessment revealed that local renewable energy production contributes 23.1% to the total
primary energy needs of the building, but it was not sufficient to achieve the Level 1 threshold. Testing
an alternative solution where, instead of 7.7 kWh/m2·year the renewable contribution, the renewable
energy considered was the energy that would be needed to fulfil an equivalent to all energy required
for DHW preparation. This would increase to Level 2 with a total renewable contribution of 50.6%.
The assessment of I6. Water Efficiency was carried out considering two solutions:
• Solution 1 to attain for Level 1 – selection of the effort “Use of water-saving fittings”, which
matches the case study practice;
• Solution 2, attaining for Level 2 – considering the one above and “reusing rainwater”.
This Solution 2 improvement was considered in the second SBToolPT-H analysis. Nevertheless,
EasyMode guides designers to, test the effect of different fittings in later stages, as different water saving
performances can result from effort “Use of water-saving fittings” depending on the fitting efficiency.
Regarding the assessment I7. Waste reduction, it was verified that no design resolutions regarding
operational waste were taken, and thus, no performance level would be achieved as such. In this sense,
two alternatives were studied to improve the buildings’ sustainability. As this indicator is an effort
approach, it was decided to select the level to achieve instead of pre-selecting the efforts. Solution 1
was intended for Level 1 and Solution 2 to Level 3. For Solution 1, two efforts were required. It was
decided to select the easiest ones: plan dedicated containers for waste recycling as, paper, glass, and
packaging (effort n. 2), and a reservoir for used vegetable oils (effort n.3). For Solution 2, four efforts
were required. So, additionally to the ones of Solution 1 it was decided to plan a battery container
(effort n. 4) and one for compostable material (effort n. 5). Implementing such measures is not a time
nor money consuming task, and thus, the implementation of Solution 2 efforts was recommended.

C H A P T E R 6 | E A S Y M O D E V A L I D A T I O N
264
6.4.2 | Social and Functional assessment
6.4.2.1 | C3 Health and comfort
The first indicator in this category is the I8. Thermal comfort. It includes five sub-indicators that although
seemingly quite detailed for an early design, they just present guidance for a more accurate thermal
behaviour analysis, in later stages. It is not often to have cautions analysis; typically, these intend just
to assure legal requirements are accomplished, instead of guiding the search for better design solutions.
EasyMode indents to set the tone for so. In this sense, for all the five sub-indicators it was decided to
attain Level 3, resulting in the recommendations shown in Table 6.10.
Table 6.10. EasyMode recommendations for thermal comfort
Sub-indicator EasyMode recommendation
I8.1 Operative temperature
Set the minimum operative temperature in the heating season to 20ºC ; In the cooling season: with no mechanical cooling system, the maximum operative temperature should be 29.72ºC or 26ºC if a cooling system is used.
I8.2 Vertical air temperature Vertical air temperature difference should be less than 3ºC. I8.3 Floor surface temperature range The floor surface temperature should range between 19ºC and 29ºC. I8.4 Draught rate Draught rate should be in the 20%.
I8.5 Radian temperature asymmetry
The temperature asymmetry in: • Warm ceiling should be less than 5ºC; • Cool wall should be less than 10ºC; • Cool ceiling should be less than 14ºC; • Warm wall should be less than 23ºC.
These recommendations can drive the home to be more comfortable, and hence improve its
sustainability, although the recommendations of all sub-indicators except I8.1 are not quantifiable in
the BSA certification tool in use – SBToolPT-H. The main recommendations from I8.1 considering
the Level 3 threshold correspond to the ones adopted in the original building design.
The assessment of I9. Visual Comfort started with the evaluation of the original designed solution,
retrieving its performance – Level 4. As the highest level was already accomplished, no additional
recommendations were drawn.
I10. Acoustic comfort consists of three sub-indicators. I10.1 Insulation index for exterior airborne noise, I10.2
Sound insulation levels for internal walls and floors and, I10.3 Internal noise assessment followed the same
procedure as I9. In I10.1 the performance level achieved by the solution was a Level 2 with insulation
to the exterior airborne noise of 37 dB(A). In order to improve the building’s performance, an
improvement of 2 dB could be needed. In I10.2 the performance corresponded to Level 1 with a sound
insulation level of 43 dB. As in the previous, with an increase of 2 dB, it would be possible to raise to
Level 2. As no data was available for I10.3 Internal noise, it was decided to set the target to attain Level 2.
For that, the design should target the following: the internal noise should be between 32 dB(A) and

E A R L Y S T A G E D E S I G N M E T H O D O L O G Y T O E N S U R E L I F E C Y C L E S U S T A I N A B I L I T Y O F R E S I D E N T I A L B U I L D I N G S
265
36 dB(A) in the living rooms, while in bedrooms it should be between 25 dB(A) and 30 dB(A).
SBToolPT-H only quantifies the results from I10.1.
I11. Indoor air quality is an effort indicator. A first solution was assessed using the project’s known data,
and alternative solutions were then tested. It was considered that wood-based products were certified
and that finishing materials would have low VOC content. Thus, achieving a Level 3 performance.
The possible alternative would be to have certified manufacturers. As EasyMode does not stipulate how
many materials should follow the recommendations, it was decided to consider that all eligible
materials and components should attain the low VOC and the wood-based certification.
6.4.2.2 | C4 Functionality
The sustainability aspects accounted in this category are not addressed in SBToolPT-H as it does not
enrol functional aspects. Nevertheless, these are relevant for the building’s sustainability, and other
BSA systems account for those. In this sense, the results and recommendations arising from indicators
from I12 to I15 are next presented.
I12. Space efficiency comprises the evaluation of two sub-indicators. To carry out the assessment of I12.1
Use of available area a first analysis was made. Here, after identifying the building GEA and the foreseen
construction solution, it was obtained a Level 2 performance, corresponding to NUA = 86.32 m2. As
it is known (from the building’s data), a greater NUA was possible. Thus, an alternative solution was
created to test the performance level of the house real NUA (≈108 m2), achieving a Level 3. Table 6.11
summarises the evaluation results. The recommendation is then to pursue with the 108 m2 of NUA.
Then, the NUA from Solution 2 was used in the evaluation of I12.2. Area availability per occupant,
resulting in 27 m2/p, which corresponds to the indicative performance of Level 3. As the greater
performance was achieved, no alternatives were tested.
I13. Adaptability comprises two sub-indicators. In the first, I13.1 Flexibility provision a performance level
of Level 2 “medium disassembly capacity” was achieved (TC = 51.56%), by considering the efforts on
Table 6.12. As to raise one level the TC would need to increase to at least 67%, which is a great
change, hence no additional alternatives were added.
Table 6.11. I12.1 Space efficiency data summary
Alternatives Performance level NUA (m2) NUA/GEA NIA (m2) WA (m2) nUA
(m2) Solution 1 Level 2 86.32 54.29% 117.97 41.03 31.65
Solution 2 Level 3 108.00 67.92% max 131.06 27.94 23.06 min 120.48 38.52 12.48

C H A P T E R 6 | E A S Y M O D E V A L I D A T I O N
266
Table 6.12. I12.2 Functional provision efforts
Selected Efforts Material Levels
Functional decomposition Functional separation Integration of functions with the different
life cycle into one elements
Functional dependence Planned interpenetration of installations and load-bearing elements
Systematisation Structure and materials
Elements/components . Materials/elements/components Clustering Clustering for fast assembly
Interfaces Assembly Assembly direction based on assembly type Base element in stuck assembly
Assembly sequences regarding material levels
Component/element Material/component Connections
Type of connection Accessory external connection
Direct integral connections with inserts Accessory internal connection
Accessibility to fixing and intermediary
Accessible with additional operations causing no damage
Accessible with additional operations causing reparable damage
For the assessment of I13.2 adaptability capacity, it was considered that the area dedicated to the
kitchen, bathrooms, and stairs was fixed. Through a rough estimation, this could totalise 30 m2,
corresponding to 62% of adaptable area – Level 3. As more than a half of the area was considered as
adaptable, the values were accepted, and no alternatives were studied.
In the I14. Design for all indicator two alternative solutions were analysed. Table 6.13. shows the
assumptions for each solution. The assessment revealed that both had the same performance level,
although the accessibility percentage is higher in Solution 2.
The I15. Maintainability enrols three indicators. The I15.1 Cleaning assessment was carried out selecting
a performance level to get a recommendation. Two alternatives were tested, as presented in
Table 6.14. Following the original design, the building would achieve Level 1, as there are no catwalks
or ladders, for the external glass surface that it is not easily accessible. Therefore, adding these latter
would improve the buildings’ sustainability.
Table 6.13. Assumptions for I14. evaluation
Areas accessible Solution 1 Solution 2 Bathrooms 33.33% (one of three) - ISO 100% - ISO Kitchen 100% - ISO 100% - DfA Rooms 25% (living room) - DfA 100% - ISO Corridors 50% (ground floor) - ISO 100% - DfA Total 81% 100% Level Level 3 Level 3
E A R L Y S T A G E D E S I G N M E T H O D O L O G Y T O E N S U R E L I F E C Y C L E S U S T A I N A B I L I T Y O F R E S I D E N T I A L B U I L D I N G S
267
Table 6.14. I15.1 cleaning evaluation
Alternatives Performance level selected Recommendation
Solution 1 Level 2 Less than 90% of external glass surface is easily accessible and the rest have catwalks or ladders.
Solution 2 Level 3 More than 90% of external glass surface is easily accessible and the rest have catwalks or ladders.
The evaluation of I15.2 Maintenance plan and commissioning allowed verifying that by elaborating a
maintenance plan, even if simple, contributes to the home’s sustainability and that it can be easily
implemented if all technicians are involved. I15.2 recommendations may not be so easily implemented
if greater performance levels are attained. Nevertheless, the building original design already had one
of the efforts fulfilled, regarding the planned technical area. Thus, to accomplish Level 1, one more
effort would be necessary and, from the list presented, effort n. 4 ‘preview inspection openings to ease
cleaning and inspection’ was selected.
6.4.3 | Location assessment
6.4.3.1 | C5 Place
I16. Efficient land use accounts four sub-indicators. As the site where the home was built did not have
any pre-construction I16.1 Reuse of previously built or contaminated land evaluation did not achieve any level,
and no recommendation was provided. In I16.2 Implantation efficiency the data from the original project
was assessed, achieving the highest performance level – Level 3. In this case, no additional
recommendations were given. For I16.3 Soil permeability, the same approach was used. Here, the
performance achieved was Level 2 with 61.08% of permeable soil. An alternative solution was tested,
considering that the exterior pathways were semi-permeable. Just by this change, the permeable area
increased to 76.85%, improving the performance to Level 3. Thus, a recommendation was considered
– to make the exterior pathways at least with semi-permeable materials. In I16.4 Native fauna species, a
solution based on the original project data was created, achieving Level 1. Then, a second solution
was tested, increasing the efforts to attain. The effort selected was the preservation of existing fauna.
In this way, the home’s performance improved to Level 2. Also, an improvement in the area with
native species could be increased.
In what regards I17. Cultural value, not all the efforts were applicable. Thus, a solution was tested
considering that two efforts could be implemented, achieving Level 2. The efforts which resulted in
recommendations were the design the building features in harmony with the surrounding landscape”
and use of local materials.
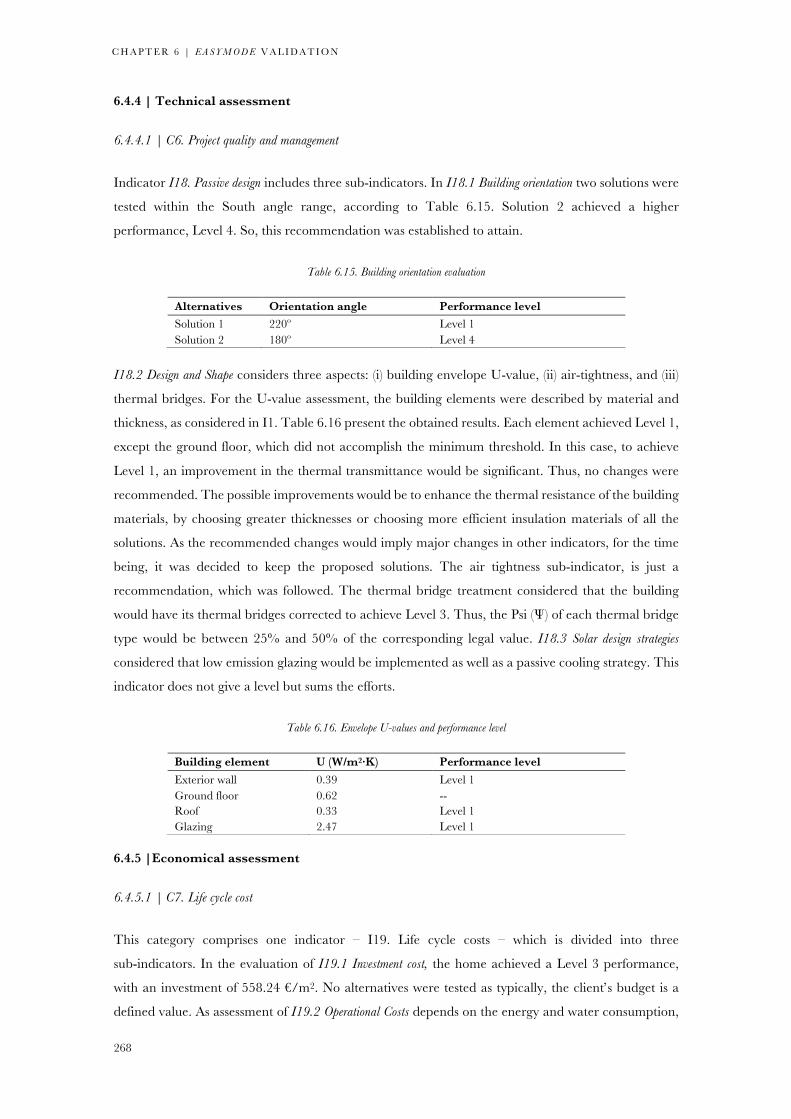
C H A P T E R 6 | E A S Y M O D E V A L I D A T I O N
268
6.4.4 | Technical assessment
6.4.4.1 | C6. Project quality and management
Indicator I18. Passive design includes three sub-indicators. In I18.1 Building orientation two solutions were
tested within the South angle range, according to Table 6.15. Solution 2 achieved a higher
performance, Level 4. So, this recommendation was established to attain.
Table 6.15. Building orientation evaluation
Alternatives Orientation angle Performance level Solution 1 220º Level 1 Solution 2 180º Level 4
I18.2 Design and Shape considers three aspects: (i) building envelope U-value, (ii) air-tightness, and (iii)
thermal bridges. For the U-value assessment, the building elements were described by material and
thickness, as considered in I1. Table 6.16 present the obtained results. Each element achieved Level 1,
except the ground floor, which did not accomplish the minimum threshold. In this case, to achieve
Level 1, an improvement in the thermal transmittance would be significant. Thus, no changes were
recommended. The possible improvements would be to enhance the thermal resistance of the building
materials, by choosing greater thicknesses or choosing more efficient insulation materials of all the
solutions. As the recommended changes would imply major changes in other indicators, for the time
being, it was decided to keep the proposed solutions. The air tightness sub-indicator, is just a
recommendation, which was followed. The thermal bridge treatment considered that the building
would have its thermal bridges corrected to achieve Level 3. Thus, the Psi (Ψ) of each thermal bridge
type would be between 25% and 50% of the corresponding legal value. I18.3 Solar design strategies
considered that low emission glazing would be implemented as well as a passive cooling strategy. This
indicator does not give a level but sums the efforts.
Table 6.16. Envelope U-values and performance level
Building element U (W/m2·K) Performance level Exterior wall 0.39 Level 1 Ground floor 0.62 -- Roof 0.33 Level 1 Glazing 2.47 Level 1
6.4.5 | Economical assessment
6.4.5.1 | C7. Life cycle cost
This category comprises one indicator – I19. Life cycle costs – which is divided into three
sub-indicators. In the evaluation of I19.1 Investment cost, the home achieved a Level 3 performance,
with an investment of 558.24 €/m2. No alternatives were tested as typically, the client’s budget is a
defined value. As assessment of I19.2 Operational Costs depends on the energy and water consumption,

E A R L Y S T A G E D E S I G N M E T H O D O L O G Y T O E N S U R E L I F E C Y C L E S U S T A I N A B I L I T Y O F R E S I D E N T I A L B U I L D I N G S
269
no alternatives were tested, only the original design solution was considered. To verify the effect of
maintenance activities in the LCC, the following generic scenarios were assumed (Table 6.17). Thus,
considering the energy and water consumption and the maintenance activities, the OC obtained was
246.96 €/m2 for the fifty years RSP. In I19.3 End of life costs the recommendation was accepted,
meaning that an effort would be made to consider EoL during the project design.
Table 6.17. Maintenance activities scenarios
Maintenance activity Cost (€/unit) Periodicity (year)
M1 100 5 M2 1500 8 M3 700 15
6.4.6 | Assessment summary
Table 6.18 summarises the assessment results and recommendation, from the selected solutions. The
table shows that several recommendations arise from the EasyMode use. To verify if these truly aid
pursuing a more sustainable design, a second assessment with SBToolPT-H was conducted as shortly
presented. It is important to highlight that the EasyMode purpose is of comparative nature, and possible
absolute errors are not relevant, but only the accuracy of the relative assessments.
Table 6.18. EasyMode evaluation summary
Category Indicator Evaluation Recommendation
C1. Selection of materials
I1. Life cycle Environmental impact N.A.1 Use the ones proposed
I2. Certified products and responsible sourcing Level 1 Have all wood-based products certified
I3. Recycle and reuse of materials and components Level 3 Improve recycled content of OSB, MDF and
ceramic tile
I4. Heat island effect Level 3
Arranging lawns, grass, shrubs, or ponds and covering materials with good water retainability or water permeability are used for the ground surface; Covering materials with sunlight reflectivity are used for the ground surface and; roofing materials with good sunlight reflectivity and longwave radiation efficiency are selected
C2. Efficiency
I3.1 Energy needs N. A. Remain with the proposed ones
I3.2 Local production Level 2 Improve renewable energy contribution to fulfil the energy equivalent to the energy required for the DHW preparation
I6. Water efficiency Level 2 Use of water-saving fittings and reuse rain water
C3. Health and comfort
I7. Waste reduction Level 3
Plan dedicated containers for waste recycling as, paper, glass and packaging, reservoir for used vegetable oils; batteries container and compostable material container
I8.1 Operative temperature Level 3
Set the minimum operative temperature in the heating season to 20ºC ; In the cooling season: with no mechanical cooling system, the maximum operative temperature should be 29.72ºC or 26ºC if a cooling system is used

C H A P T E R 6 | E A S Y M O D E V A L I D A T I O N
270
Table 6.18. EasyMode evaluation summary (cont.)
Category Indicator Evaluation Recommendation
C3. Health and comfort
I8.2 Vertical air temperature Level 3 Vertical air temperature difference should be less than 3ºC.
I8.3 Floor surface temperature range Level 3 The floor surface temperature should range
between 19ºC and 29ºC. I8.4 Draught rate Level 3 Draught rate should be in the 20%.
I8.5 Radian temperature asymmetry Level 3
The temperature asymmetry in: • Warm ceiling should be less than 5ºC; • Cool wall should be less than 10ºC; • Cool ceiling should be less than 14ºC; • Warm wall should be less than 23ºC.
I9. Visual comfort Level 4 Use the solution proposed I10.1 Insulation index for exterior airborne noise Level 1 Improve 1 dB
I10.2 Sound insulation levels for internal walls and floors Level 1 Improve 1 dB
I10.3 Internal noise Level 2
the internal noise should be between 32 dB(A) and 36 dB(A) in the living rooms, while in bedrooms it should be between 25 dB(A) and 30 dB(A)
I11.1 Airborne Emissions Level 3 Wood based products are certified and finishing materials have low VOC content
C4. Functionality
I12.1 Use of available area Level 3 Attain for NUA = 108 m2 I12.2 Area availability per occupant Level 3 For 4 inhabitants considering the above
NUA the area would be 27 m2/p
I13.1 Flexibility provision Level 2
Consider the following: • Integration of functions with the
different life cycle into one elements • Planned interpenetration of
installations and load-bearing elements • Elements/components • Materials/elements/components • Clustering for fast assembly • Base element in stuck assembly • Component/element • Material/component • Accessory external connection • Direct integral connections with inserts • Accessory internal connection • Accessible with additional operations
causing no damage • Accessible with additional operations
causing reparable damage I13.2 Adaptability capacity potential Level 3 Attain for 62% of adaptable area (30 m2 of
fixed area)
I14. Design for all Level 3 All bathrooms and rooms follow ISO recommendation and the kitchen and corridors follow design for all
I15.1 Cleaning Level 3 More than 90% of external glass surface is easily accessible and the rest have catwalks or ladders.
I15.2 Maintenance plan and commissioning Level 2 Add preview inspection openings to ease
cleaning and inspection I15.3 Ease of maintenance Level 2 Add inspection openings
C5. Place
I16.1 Reuse of previously built or contaminated land -- Not possible to change
I16.2 Implantation efficiency Level 3 Use the areas proposed
I16.3 Soil permeability Level 3 Use at least semi-permeable materials in the exterior pathways
I16.4Native fauna species Level 2 Preserve existing fauna and increase the area dedicated to native species

E A R L Y S T A G E D E S I G N M E T H O D O L O G Y T O E N S U R E L I F E C Y C L E S U S T A I N A B I L I T Y O F R E S I D E N T I A L B U I L D I N G S
271
Table 6.18. EasyMode evaluation summary (cont.)
Category Indicator Evaluation Recommendation
I17. Cultural value Level 2
Use of locally-significant materials Local materials will be partially used in the building and Building features will be designed in harmony with surrounding landscape
C6. Project quality and management
I18.1 Building orientation Level 4 Building orientation angle: 180º
I18.2 Design and shape U-value: use the solutions proposed. Air-tightness: 0.4 ACH Thermal bridge: 25% to 50% of legal Psi
I18.3 Solar design strategies N.A. Low emissivity glazing and passive cooling strategy.
C7. Life cycle costing
I19.1 Investment cost Level 3 Use the value proposed I19.2 Operating costs N.A. -- I19.3 End-of-life costs N.A. Consider EoL during project design
1 – Not applicable
6.5 | SECOND SUSTAINABILITY ASSESSMENT – SBTool P T -H
The procedure followed the same approach as in the first assessment but considering EasyMode
recommendations. Table 6.19 and Table 6.20 depict the achieved results in each category and
respective parameters within SBToolPT-H.
Category 1 score did not change as no recommendation from EasyMode was implemented.
Just by considering that all building surfaces would have a high reflectance, even though SBToolPT-H
just considers horizontal projections, withdrawing the façades improvement, P6 had a significant
improvement in its performance. Only with this improvement, category C2 performance raised from
a B to an A score. The recommended improvements in the area dedicated to native species improved
P5 performance from C to B. Also, raising the permeable area, P3 achieved the higher performance
score A+. With all these improvements Category 2 improved its performance one score – A.
Category C3 performance improved due to the rise in the renewable energy contribution, driven by
EasyMode comparisons. This improvement allowed C3 to ameliorate from a C level to a B.
In Category 4 an improvement in P10 result can be seen from the first analysis, although within this
case study no reflection on the overall performance was seen, as this parameter had already an
outstanding performance. Comparing with conventional practice, P10 performance could have an
improvement of 100%. From the improvements recommended by EasyMode regarding the recycled
content an improvement of almost 24% in P10 result. Although by itself, it was not enough to raise
the performance level score – P10 stayed with score A – it contributed to improving the overall
category C4 performance. P11 had no changes due to EasyMode I.11 indicator because all materials
were already certified. P13 greatly improved due to EasyMode use. The ease of implementing the
recommendation, drove the performance to raise from 0 to 1, thus, improving from D to A level.
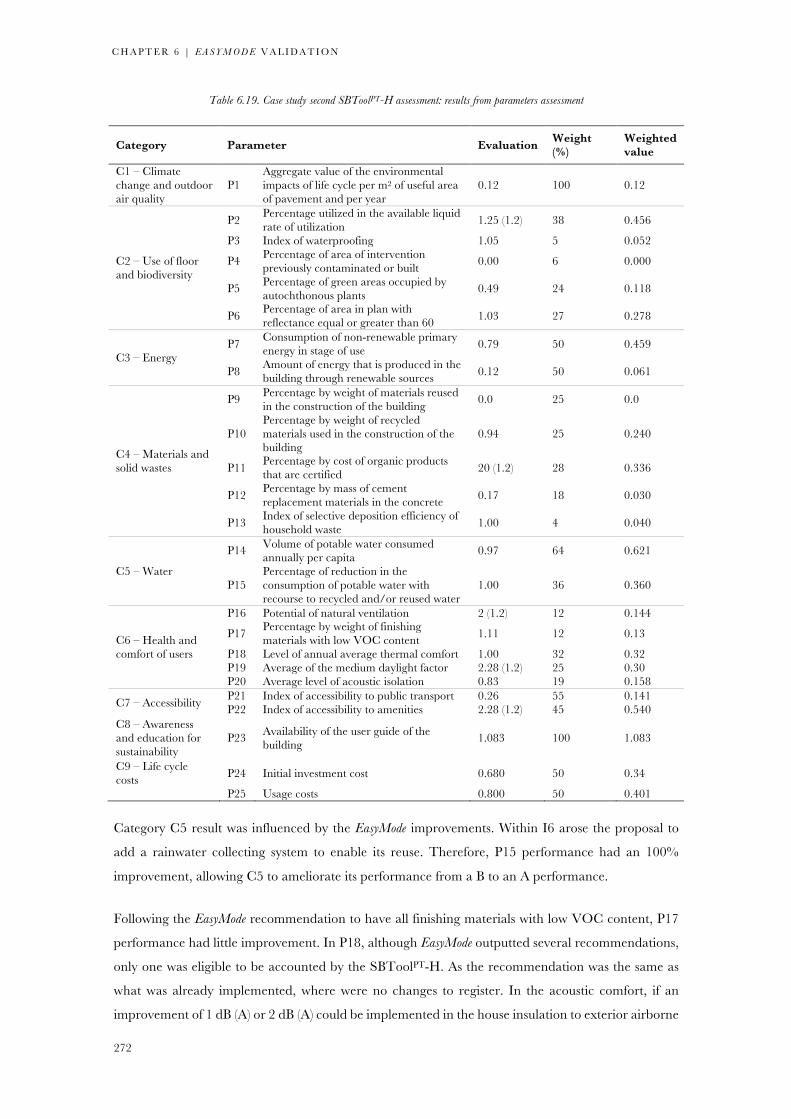
C H A P T E R 6 | E A S Y M O D E V A L I D A T I O N
272
Table 6.19. Case study second SBToolPT-H assessment: results from parameters assessment
Category Parameter Evaluation Weight (%)
Weighted value
C1 – Climate change and outdoor air quality
P1 Aggregate value of the environmental impacts of life cycle per m2 of useful area of pavement and per year
0.12 100 0.12
C2 – Use of floor and biodiversity
P2 Percentage utilized in the available liquid rate of utilization 1.25 (1.2) 38 0.456
P3 Index of waterproofing 1.05 5 0.052
P4 Percentage of area of intervention previously contaminated or built 0.00 6 0.000
P5 Percentage of green areas occupied by autochthonous plants 0.49 24 0.118
P6 Percentage of area in plan with reflectance equal or greater than 60 1.03 27 0.278
C3 – Energy P7 Consumption of non-renewable primary
energy in stage of use 0.79 50 0.459
P8 Amount of energy that is produced in the building through renewable sources 0.12 50 0.061
C4 – Materials and solid wastes
P9 Percentage by weight of materials reused in the construction of the building 0.0 25 0.0
P10 Percentage by weight of recycled materials used in the construction of the building
0.94 25 0.240
P11 Percentage by cost of organic products that are certified 20 (1.2) 28 0.336
P12 Percentage by mass of cement replacement materials in the concrete 0.17 18 0.030
P13 Index of selective deposition efficiency of household waste 1.00 4 0.040
C5 – Water
P14 Volume of potable water consumed annually per capita 0.97 64 0.621
P15 Percentage of reduction in the consumption of potable water with recourse to recycled and/or reused water
1.00 36 0.360
C6 – Health and comfort of users
P16 Potential of natural ventilation 2 (1.2) 12 0.144
P17 Percentage by weight of finishing materials with low VOC content 1.11 12 0.13
P18 Level of annual average thermal comfort 1.00 32 0.32 P19 Average of the medium daylight factor 2.28 (1.2) 25 0.30 P20 Average level of acoustic isolation 0.83 19 0.158
C7 – Accessibility P21 Index of accessibility to public transport 0.26 55 0.141 P22 Index of accessibility to amenities 2.28 (1.2) 45 0.540
C8 – Awareness and education for sustainability
P23 Availability of the user guide of the building 1.083 100 1.083
C9 – Life cycle costs P24 Initial investment cost 0.680 50 0.34
P25 Usage costs 0.800 50 0.401
Category C5 result was influenced by the EasyMode improvements. Within I6 arose the proposal to
add a rainwater collecting system to enable its reuse. Therefore, P15 performance had an 100%
improvement, allowing C5 to ameliorate its performance from a B to an A performance.
Following the EasyMode recommendation to have all finishing materials with low VOC content, P17
performance had little improvement. In P18, although EasyMode outputted several recommendations,
only one was eligible to be accounted by the SBToolPT-H. As the recommendation was the same as
what was already implemented, where were no changes to register. In the acoustic comfort, if an
improvement of 1 dB (A) or 2 dB (A) could be implemented in the house insulation to exterior airborne
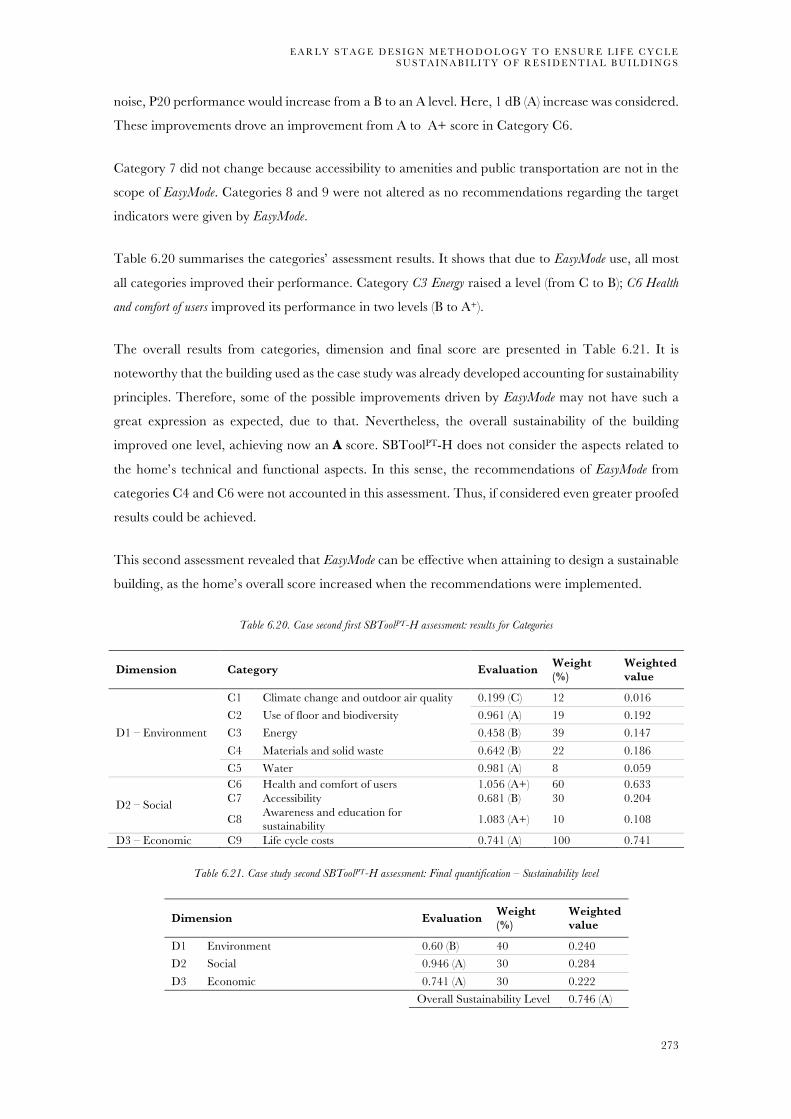
E A R L Y S T A G E D E S I G N M E T H O D O L O G Y T O E N S U R E L I F E C Y C L E S U S T A I N A B I L I T Y O F R E S I D E N T I A L B U I L D I N G S
273
noise, P20 performance would increase from a B to an A level. Here, 1 dB (A) increase was considered.
These improvements drove an improvement from A to A+ score in Category C6.
Category 7 did not change because accessibility to amenities and public transportation are not in the
scope of EasyMode. Categories 8 and 9 were not altered as no recommendations regarding the target
indicators were given by EasyMode.
Table 6.20 summarises the categories’ assessment results. It shows that due to EasyMode use, all most
all categories improved their performance. Category C3 Energy raised a level (from C to B); C6 Health
and comfort of users improved its performance in two levels (B to A+).
The overall results from categories, dimension and final score are presented in Table 6.21. It is
noteworthy that the building used as the case study was already developed accounting for sustainability
principles. Therefore, some of the possible improvements driven by EasyMode may not have such a
great expression as expected, due to that. Nevertheless, the overall sustainability of the building
improved one level, achieving now an A score. SBToolPT-H does not consider the aspects related to
the home’s technical and functional aspects. In this sense, the recommendations of EasyMode from
categories C4 and C6 were not accounted in this assessment. Thus, if considered even greater proofed
results could be achieved.
This second assessment revealed that EasyMode can be effective when attaining to design a sustainable
building, as the home’s overall score increased when the recommendations were implemented.
Table 6.20. Case second first SBToolPT-H assessment: results for Categories
Dimension Category Evaluation Weight (%)
Weighted value
D1 – Environment
C1 Climate change and outdoor air quality 0.199 (C) 12 0.016 C2 Use of floor and biodiversity 0.961 (A) 19 0.192 C3 Energy 0.458 (B) 39 0.147 C4 Materials and solid waste 0.642 (B) 22 0.186 C5 Water 0.981 (A) 8 0.059
D2 – Social
C6 Health and comfort of users 1.056 (A+) 60 0.633 C7 Accessibility 0.681 (B) 30 0.204
C8 Awareness and education for sustainability 1.083 (A+) 10 0.108
D3 – Economic C9 Life cycle costs 0.741 (A) 100 0.741
Table 6.21. Case study second SBToolPT-H assessment: Final quantification – Sustainability level
Dimension Evaluation Weight (%)
Weighted value
D1 Environment 0.60 (B) 40 0.240 D2 Social 0.946 (A) 30 0.284 D3 Economic 0.741 (A) 30 0.222 Overall Sustainability Level 0.746 (A)

C H A P T E R 6 | E A S Y M O D E V A L I D A T I O N
274
6.6 | CONCLUDING REMARKS
This chapter presented the validation of EasyMode through a case study. Briefly, it consisted in assessing
the sustainability performance of a home, using an independent BSA tool.; then, applying EasyMode as
if the design process was starting, retrieving the sustainability recommendations; Repeat the
sustainability assessment using the tool of the first assessment, but considering the EasyMode
recommendations and verifying if improvements were felt.
No regression in the parameters and categories performance of SBToolPT-H was found after
considering EasyMode recommendations. On the contrary, several improvements occurred. There
were some parameters in which the performance was unaffected mainly due to two reasons: the scope
of the parameters was not within EasyMode evaluation scope, or it was decided not to pursue greater
performances, resulting in no improvement recommendations.
Through the case study, it was possible to verify that not all EasyMode recommendations are directly
acknowledged in BSA tools assessment procedure. It does not mean that the recommendations should
not be followed, as these could not contribute to achieving a better sustainability score. In fact, this
occurrence can be driven by two main aspects. Firstly, EasyMode recommendations should be given
attention to, during all the design process in order to implement them better and truly understand
their potentialities. These considerations and calculations during design phase were not performed in
this case study. Thus, their accurate or quantitative contribution may not be reflected in the final
SBToolPT-H assessment. On the other hand, sustainability involves a myriad of concepts and aspects
which make it almost impossible to account for all. Nevertheless, BSA tools could be updated to
consider and valorise more the passive design solutions, than what is being considered until now.
Finally, the application of this case study evidenced that using a sustainability-adding tool, such as
EasyMode, truly contributes to more sustainable buildings. As it was mentioned and verified by the first
assessment, the home used as the case study was already originally designed with sustainability
concerns. However, the simple application of EasyMode could improve its sustainability performance
even more, as the overall performance raised from a B to an A score. Hence, the validly, efficacy and
convenience of EasyMode was confirmed. The main objective of this thesis was thus achieved.

E A R L Y S T A G E D E S I G N M E T H O D O L O G Y T O E N S U R E L I F E C Y C L E S U S T A I N A B I L I T Y O F R E S I D E N T I A L B U I L D I N G S
275
REFERENCES OF CHAPTER 6
CoolHaven, (2017). Coolhaven. Retrieved from http://www.cool-haven.com/. [Accessed December 2016]. Mateus, R., & Bragança, L. (2016). Manual de avaliação SBToolPT-H. V2016/1. Portugal: iiSBE Portugal. Murtinho, V., Correia, A., Ferreira, H., Simões Da Silva, L., Gervásio, H., Rebelo, C., . . . Rigueiro, C.
(2010). Affordable houses: Architectural concepts of a modular steel residential house. In Cruz (Ed.), ICSA2010 –International Conference on Structures and Architecture (pp. 1291-1297). Guimarães, Portugal: Taylor & Francis Group.


277
7 CONCLUSIONS & FUTURE DEVELOPMENTS
7.1 | CONCLUSIONS
This chapter presents the major findings of the work carried out to accomplish this thesis goal.
Afterwards, the open issues resulting from the work are highlighted as possible future research in this
field.
The relevance of buildings to people’s life and their burden on the environment depicts the need to
address those under sustainability principles. Change is essential to pursuit a more sustainable world.
Although there are several building sustainability assessment tools and international standards
recommending the criteria to be included in the former, real practice shows that it has not been
enough. The outcome of this thesis fulfils this gap, through EasyMode. This tool will aid designers
accounting for sustainable principles since the beginning of the project. It will assure conscientiously
made decisions concerning sustainability. Additionally, EasyMode contributes to increasing awareness
across all stakeholders, promoting and encouraging the adoption of more efficient solutions. The tool
will allow designers to compare design alternatives, verifying the most sustainable choice. Acting so
early in the project, not just improves the possibilities to promote sustainability, but it also reduces the
possible associated costs.
The main achievements of the work carried out to accomplish the EasyMode development are
summarised below.
C H A P T E R 7 | C O N C L U S I O N S & F U T U R E D E V E L O P M E N T S
278
Chapter 2 reviewed the state-of-the-art regarding sustainability assessment tools, and international
recommendations to pursue sustainable design. Despite these standards, BSA tools still evaluate
sustainability in different ways. The way BSA tools consider sustainability criteria is significantly
diverse, hindering any comparison of sustainability assessments made to various buildings using
different tools. In addition, variations in the purpose, scope, aggregation, and weighting systems were
found. Moreover, in-depth analysis enabled verifying that all tools require several and detail data about
the building, hampering their use during in early design phases. Also, it allowed scrutinising the
common indicators included in BSA tools and those recommended by ISO and CEN standards. This
step based the following chapters, as it aided setting up the indicators list to survey designers with.
Chapter 3 depicted the framework of building design process and how sustainability criteria can be
addressed at early stages. Additionally, a survey was carried out to comprehend how designers perceive
the concept of sustainability and address its issues during their work. Screening the design life cycle
aided recognising the information availability at early phases, considering the general view of the
building. This data supported defining the sustainability aspects to be considered during the project’s
early stages. The survey to the Portuguese designers corroborated the need for a sustainable and
efficient design approach for early design. The findings prove that although awareness is rising,
accounting already for sustainability criteria as materials and resources use, and life cycle costs other
than investment, it still requires support and improvement. Designers still prioritise financial
investment criteria rather than environmental ones during building design. The survey aided
identifying the indicators to include in the tool, although a supplemental analysis was needed to deep
the knowledge in the indicators’ scope.
Chapter 4 presented the framework of newly developed sustainable design methodology - Early Stage
Model for Sustainable Design – EasyMode. EasyMode establishes a method to aid designers’
decision making since early design stages, considering environmental, social, and economic criteria,
attaining for a sustainable built environment. The tool allows quantification of sustainability concerns
and enables alternatives comparison. The approach followed two main viewpoints: quantification and
decision making. The quantification enables estimating the potential impacts of the design solutions
throughout their lifecycle. This evaluation takes place at the indicator level, assessing the performance
of each alternative. The decision-making viewpoint provides valuable information for the
decision-making process throughout the building design, by comparing the performances of design
alternatives. EasyMode development was based on the following premises: (i) straightforward, practical,
and easy to use; (ii) in line with CEN TC350 standards; (iii) comprise the three sustainability
dimensions; (iv) specific for homes; (v) allow simultaneity of quantitative and qualitative criteria; (vii)
in line with Portuguese regulations and reality and; (viii) enable to validation.
The tool adopted the two languages of Performance Based Building approach: the clients’ needs and
the capability to meet that performance, and the necessity of validation and verification against targets

E A R L Y S T A G E D E S I G N M E T H O D O L O G Y T O E N S U R E L I F E C Y C L E S U S T A I N A B I L I T Y O F R E S I D E N T I A L B U I L D I N G S
279
using specific tools. EasyMode physical system boundary considers the building and its external works,
within the building site and its foundations, as recommended by EN 15643-2:2011. The time
boundary regards the whole building life, with a default reference service life of fifty years.
This chapter also depicted the identification and selection of indicators to be included in EasyMode.
The indicators were selected considering the following requisites: (i) be recognised in international BSA
standards; (ii) address the whole building life cycle; (iii) presence in existing BSA tools; (iv) consider
regional characteristics and; (v) cover all sustainability dimensions. The selection process accounted
for the deep review of existing standards and tools (Chapter 2), the survey to designers (chapter 3) and
a deep analysis to sustainability indicators required data and calculation procedures. From these,
nineteen indicators were selected to be included in the EasyMode framework (summarised in Table 7.1).
These were distributed among seven main categories, which are gathered in five areas. The EasyMode
seven fundamental categories are: (i) Project quality and management – the whole must be understood
as well as its parts to pursue sustainability; (ii) Place – consider site conditions, ecology and social
constrains; (iii) Selection of materials – select low-impact and high-performance materials, components
and technologies, promote efficient use of resources; (iv) Efficiency – reduce resources exploitation,
such as water and energy, by designing buildings that enable efficient use of resources and less waste
generation; (v) Health and comfort – promote well-being and comfort, from thermal comfort to indoor
air quality; (iv) Functionality – improve building’s functionality, such as space efficiency and
adaptability potential and; (vi) Life cycle costing – consider life cycle costs for more informed decisions.
Table 7.1. Summary of EasyMode indicators framework21
Area Category Indicator
Environment
C1. Selection of materials
I1. Life Cycle Environmental impact I2. Certified products and responsible sourcing I3. Recycle and reuse of materials and components I4. Heat island effect
C2. Efficiency I5. Energy efficiency I6. Water use I7. Waste production
Social and Functional
C3. Health and comfort
I8. Thermal comfort I9. Visual comfort I10. Acoustic comfort I11. Indoor air quality
C4. Functionality
I12. Space efficiency I13. Adaptability I14. Accessibility/design for all I15. Maintenance management
Location C5. Place I16. Efficient use I17. Cultural value
Technical C6. Project quality and management I18. Passive design Economic C7. Life cycle costing I19. Life cycle cost
21 For further detail please see Table 4.1, p. 109

C H A P T E R 7 | C O N C L U S I O N S & F U T U R E D E V E L O P M E N T S
280
The evaluation framework was organised in three main steps: (i) input, (ii) engine and, (iii) output. The
first consists of gathering the generic building data (typology, location, climate, main characteristics,
etc.), establishing the assessment base. The engine corresponds to the calculation stage; despite not
visible to the users, it is the most important part of the tool. The output presents the solutions’
performance. All indicators allow comparison of alternative solutions’ performances. Designers are not
obliged to evaluate all the indicators; they can choose the ones to do so. An indicative performance
three-level scale is used in each indicator to enable alternative comparison and to aid setting
sustainability goals; being Level 1 the minimum performance and Level 3 the highest. For several
indicators, the factor-four rule was used to set the thresholds for each indicative performance level.
Nevertheless, EasyMode does not weight nor aggregates indicators in an overall score; results are
displayed individually, as mid-point indicators.
Chapter 5 gave context and demonstrated how EasyMode indicators evaluation process was developed.
The calculation procedures presented are the basis for the Microsoft Excel workbook where the tool
was implemented. Most of the indicators account for sub-indicators addressed individually. As said
before, early design phases deal with data unavailability and uncertainty. Also, the scope of several
indicators, do not allow quantitative assessments. Thus, in many indicators, it was necessary to adopt
a prescriptive or procedural approach. In those, the ‘efforts approach’ was used. It consists of setting
goals to be attained during further design stages, through a descriptive or indicative path. In the first
stage designers are asked to select the efforts they are willing to attain, while in the second, they are
asked to establish the indicative performance level they are willing to achieve. In this second stage, the
necessary efforts are suggested to designers. Twelve indicators were developed using this approach:
I2. Certified products and responsible sourcing; I4. Heat island effect; I6. Water efficiency; I7. Waste
reduction; I11. Indoor air quality; I15.1 Cleaning; I15.2 Maintenance plan and commissioning; I15.3
Ease of maintenance; I16.4 Native flora species; I17. Cultural value; I18.3 Solar design strategies and;
I19.3 End-of-life costs. Another approach adopted in different indicators was the ‘quantitative
approach’. It is similar to the efforts approach, but instead of defining or asking for an effort, a specific
value is required. The fifteen indicators/sub-indicators using this approach were: I3. Recycle and reuse
of materials and components; I8.1 operative temperature; I8.2 Vertical air temperature; I8.3 Floor
surface temperature range; I8.4 Draught rate; I8.5 Radian temperature asymmetry; I9. Visual
comfort; I10.1 Insulation index for exterior airborne noise; I10.2 Sound insulation levels for internal
walls and floors; I10.3 Internal noise; I13.1 Flexibility provision; I13.2 Adaptability capacity potential;
I14. Design for all; I16.3 Soil permeability and; I18.2 Design and shape. All the remaining indicators
were addressed using a specific approach for each, being all performance-based indicators. These are:
I1. Life cycle environmental impact; I5. Energy efficiency; I12. Space efficiency; I16.1 Reuse of
previously developed or contaminated land; I16.2 Implantation efficiency; I19.1 Investment costs and;
I19.2 Operation costs.

E A R L Y S T A G E D E S I G N M E T H O D O L O G Y T O E N S U R E L I F E C Y C L E S U S T A I N A B I L I T Y O F R E S I D E N T I A L B U I L D I N G S
281
After the development of each indicator, EasyMode was validated as presented in Chapter 6. EasyMode
validation was carried out through a case-study evaluation. A single family building project was used
as a case-study building. The validation was conducted through a three-step process. The first, the
housing project was subjected to a sustainability assessment using a third-party independent tool –
SBToolPT-H v2016/1 – to verify its sustainability level. Then, the project was examined using
EasyMode, verifying the improvements that would have been possible if the project was carried out
using this tool. Finally, a second sustainability assessment to the house was performed, considering the
improvements driven by the EasyMode application. The comparison of this latter assessment result with
the first allowed evidencing the efficacy and usefulness of EasyMode in early design towards efficient,
sustainable design.
7.2 | FUTURE DEVELOPMENTS
Despite the accomplishment of the goals established, sustainable design, early design support tools,
and EasyMode have still a vast field of possibilities for further research and improvement.
In EasyMode scope, some aspects that deserve further attention:
• The tool could benefit from being implemented in a dedicated software. It would ease its use
and dissemination. Also, a user manual could be developed, indicating the steps to perform
the assessment and presenting a case study for better understanding and tool testing.
• Database improvement through the inclusion of more construction materials and solutions.
Open source would be the ideal path for the database, allowing its enrichment and data
sharing.
• The tool could benefit from having the energy calculation procedure directly implemented in
the spreadsheet, instead of recurring to SB_Steel tool to perform the calculations. It would
ease construction solutions comparison throughout the EasyMode assessment.
• For the time being, the tool could be improved to be applicable also in rehabilitation projects,
as they now represent 27.7%22 of the housing construction activities in Europe.
• A more comprehensive method to quantify building’s LCC should be developed. Making a
deep study to construction costs, the database could be improved with costs, and maintenance
periods, simplifying obtaining the data to preview building use phase and end-of-life costs.
More broadly, sustainable design at early stages research could benefit from deeper knowledge in the
field of each indicator, such as standards improvement, to complement tools such EasyMode¸ in
empowering designers with sustainability concepts. This could encourage designers to include
22 European Construction Industry Federation (FIEC). (2016). Key Figures Activity 2015 – Construction in Europe. Brussels: FIEC.

C H A P T E R 7 | C O N C L U S I O N S & F U T U R E D E V E L O P M E N T S
282
sustainable goals since early design and pursue sustainable design. More than using sustainability
performance as a sales market tool, as often done with existing BSA tools, sustainability principles
should be used as personal values and contributions for a better and sustainable society.
Finally, I hope that with EasyMode, designers can fearlessly attempt to establish sustainability goals
early in the project and pursue them throughout. I hope it may provide them with the basis for
improving their knowledge and conscientiousness of sustainability goals. To finish, I can only wish to
have contributed both to scientific research and architecture, engineering and construction industry
towards a more sustainable design and society.

283
Appendix 1 QUESTINONAIRE SAMPLE
[in Portuguese]


24/01/17, 01:31Sustentabilidade no projecto de habitações
Página 1 de 14https://docs.google.com/forms/d/136V1e7H5sV5Vb-Cv5uyapN002jdKhvBcmmssTw1tcRA/printform
Sustentabilidade no projecto de habitações
A resposta a este inquérito terá como tempo máximo 15 minutos.
A realização deste inquérito encontra-se enquadrada no âmbito do desenvolvimento da tese de doutoramento com o tema “Metodologia para a sustentabilidade de habitações aplicável às fases iniciais do projecto", em desenvolvimento na Universidade do Minho.
O presente questionário pretende identificar quais os principais princípios de sustentabilidade que actualmente são considerados pelas equipas de projecto, bem como as principais dificuldades com que se deparam na sua implementação.
A sua participação é essencial para o desenvolvimento deste trabalho, pelo que lhe pedíamos, por favor, que respondesse com o maior rigor possível.
Os dados obtidos serão apenas utilizados para fins estatísticos no âmbito deste trabalho.
*Required
Informação geral
1. Área de actuação e/ou desenvolvimento de projectosem PortugalTick all that apply.
Norte
Centro
Lisboa e Vale do Tejo
Alentejo
Algarve
Ilhas
Todo o país
2. Tick all that apply.
Internacional

24/01/17, 01:31Sustentabilidade no projecto de habitações
Página 2 de 14https://docs.google.com/forms/d/136V1e7H5sV5Vb-Cv5uyapN002jdKhvBcmmssTw1tcRA/printform
3. Função desempenhada *Mark only one oval.
Engenharia civil
Engenharia do ambiente
Engenharia de materiais
Urbanismo
Arquitectura
Other:
4. Anos de experiência na área *Mark only one oval.
Com menos de 1 ano de experiência
Entre 1 a 5 anos de experiência
Com mais de 5 anos de experiência
5. Está familiarizado com o conceito e métodos de construção sustentável? *Mark only one oval.
Muito
Bastante
Razoavelmente
Mal
Nada
6. Alguma vez utilizou uma metodologia de avaliação de sustentabilidade? *Mark only one oval.
Sim
Não
7. Qual?
Skip to question 8.
Sustentabilidade na construção
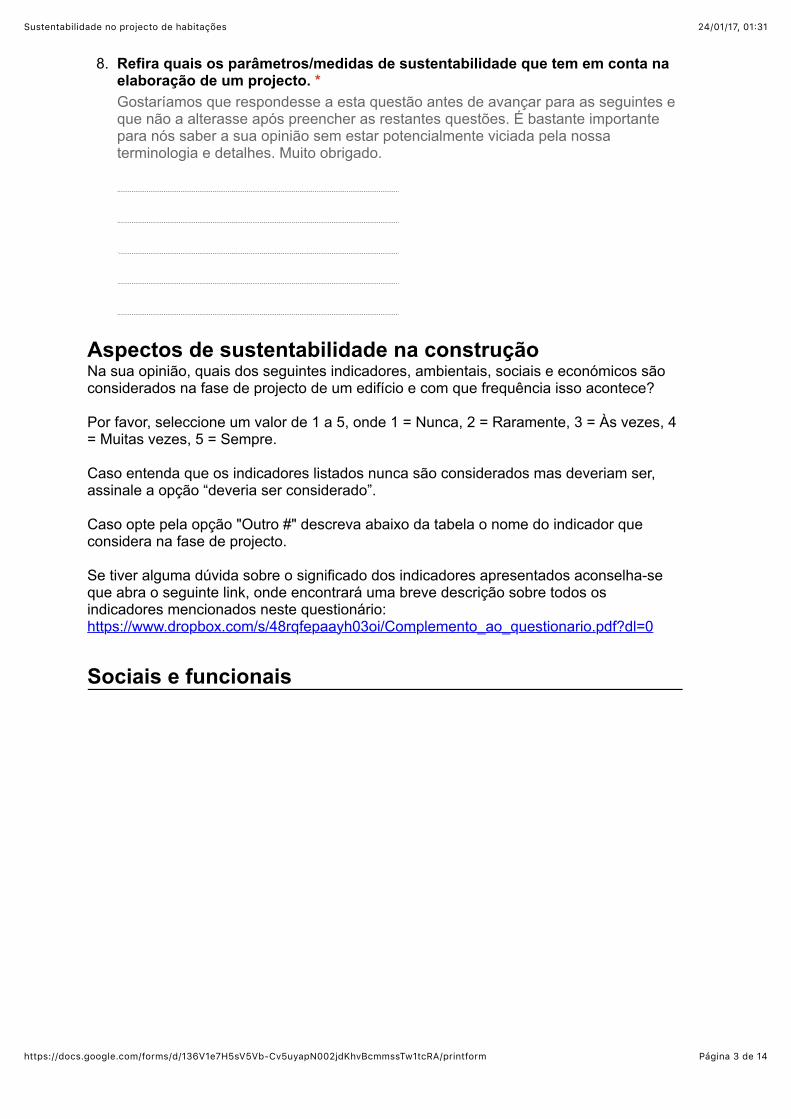
24/01/17, 01:31Sustentabilidade no projecto de habitações
Página 3 de 14https://docs.google.com/forms/d/136V1e7H5sV5Vb-Cv5uyapN002jdKhvBcmmssTw1tcRA/printform
8. Refira quais os parâmetros/medidas de sustentabilidade que tem em conta naelaboração de um projecto. *Gostaríamos que respondesse a esta questão antes de avançar para as seguintes eque não a alterasse após preencher as restantes questões. É bastante importantepara nós saber a sua opinião sem estar potencialmente viciada pela nossaterminologia e detalhes. Muito obrigado.
Aspectos de sustentabilidade na construçãoNa sua opinião, quais dos seguintes indicadores, ambientais, sociais e económicos são considerados na fase de projecto de um edifício e com que frequência isso acontece?
Por favor, seleccione um valor de 1 a 5, onde 1 = Nunca, 2 = Raramente, 3 = Às vezes, 4 = Muitas vezes, 5 = Sempre.
Caso entenda que os indicadores listados nunca são considerados mas deveriam ser, assinale a opção “deveria ser considerado”.
Caso opte pela opção "Outro #" descreva abaixo da tabela o nome do indicador que considera na fase de projecto.
Se tiver alguma dúvida sobre o significado dos indicadores apresentados aconselha-se que abra o seguinte link, onde encontrará uma breve descrição sobre todos os indicadores mencionados neste questionário: https://www.dropbox.com/s/48rqfepaayh03oi/Complemento_ao_questionario.pdf?dl=0
Sociais e funcionais

24/01/17, 01:31Sustentabilidade no projecto de habitações
Página 4 de 14https://docs.google.com/forms/d/136V1e7H5sV5Vb-Cv5uyapN002jdKhvBcmmssTw1tcRA/printform
9. 1) CulturaMark only one oval per row.
1.Nunca
2.Raramente
3. Àsvezes
4.Muitasvezes
5.Sempre
Deveria serconsiderado
Semopinião
Integração dopatrimónioculturalIntegraçãopatrimónioconstruídoRespeito peloscostumes ebeleza do local InovaçãoOutro #1Outro #2
10. Outro #1
11. Outro #2
12. Comentários

24/01/17, 01:31Sustentabilidade no projecto de habitações
Página 5 de 14https://docs.google.com/forms/d/136V1e7H5sV5Vb-Cv5uyapN002jdKhvBcmmssTw1tcRA/printform
13. 2) AcessibilidadeMark only one oval per row.
1.Nunca
2.Raramente
3. Àsvezes
4.Muitasvezes
5.Sempre
Deveria serconsiderado
Semopinião
Acesso atransportespúblicos Acesso aamenidadesAcessibilidade“sem-barreiras”Outro #1Outro #2
14. Outro #1
15. Outro #2
16. Comentários
17. 3) Bem-estar, saúde e confortoMark only one oval per row.
1.Nunca
2.Raramente
3. Àsvezes
4.Muitasvezes
5.Sempre
Deveria serconsiderado
Semopinião
ConfortotérmicoConfortoacústicoQualidade do arinteriorConforto visualOutro #1Outro #2

24/01/17, 01:31Sustentabilidade no projecto de habitações
Página 6 de 14https://docs.google.com/forms/d/136V1e7H5sV5Vb-Cv5uyapN002jdKhvBcmmssTw1tcRA/printform
18. Outro #1
19. Outro #2
20. Comentários
21. 4) Segurança, saúde e integração social dos trabalhadores durante aconstrução, manutenção e desmantelamento do edifícioMark only one oval per row.
1.Nunca
2.Raramente
3. Àsvezes
4.Muitasvezes
5.Sempre
Deveria serconsiderado
Semopinião
Saúde esegurança dostrabalhadoresFormação dostrabalhadores Impacto nacomunidadeTrabalho localOutro #1Outro #2
22. Outro #1
23. Outro #2

24/01/17, 01:31Sustentabilidade no projecto de habitações
Página 7 de 14https://docs.google.com/forms/d/136V1e7H5sV5Vb-Cv5uyapN002jdKhvBcmmssTw1tcRA/printform
24. Comentários
25. 5) Estética do edifícioMark only one oval per row.
1.Nunca
2.Raramente
3. Àsvezes
4.Muitasvezes
5.Sempre
Deveria serconsiderado
Semopinião
Arte naarquitecturaOutro #1Outro #2
26. Outro #1
27. Outro #2
28. Comentários

24/01/17, 01:31Sustentabilidade no projecto de habitações
Página 8 de 14https://docs.google.com/forms/d/136V1e7H5sV5Vb-Cv5uyapN002jdKhvBcmmssTw1tcRA/printform
29. 6) FuncionalidadeMark only one oval per row.
1.Nunca
2.Raramente
3. Àsvezes
4.Muitasvezes
5.Sempre
Deveria serconsiderado
Semopinião
Eficiência doespaço Flexibilidade eadaptabilidadeFacilidade delimpeza emanutenção doedifícioControlabilidadepelos utilizadores Facilidade dedesconstrução,reciclagem edesmantelamento Outro #1Outro #2
30. Outro #1
31. Outro #2
32. Comentários

24/01/17, 01:31Sustentabilidade no projecto de habitações
Página 9 de 14https://docs.google.com/forms/d/136V1e7H5sV5Vb-Cv5uyapN002jdKhvBcmmssTw1tcRA/printform
33. 7) Qualidade do processoMark only one oval per row.
1.Nunca
2.Raramente
3. Àsvezes
4.Muitasvezes
5.Sempre
Deveria serconsiderado
Semopinião
Qualidade dapreparação doprojecto PlaneamentointegradoEspecificaçãodos requisitospara utilizaçãoe operaçãooptimizadas Garantia dequalidade dasactividades deconstrução Outro #1Outro #2
34. Outro #1
35. Outro #2
36. Comentários
Económicos
Na sua opinião, quais dos seguintes indicadores, ambientais, sociais e económicos são considerados na fase de projecto de um edifício e com que frequência isso acontece?
Descrição dos indicadores: https://www.dropbox.com/s/48rqfepaayh03oi/Complemento_ao_questionario.pdf?dl=0

24/01/17, 01:31Sustentabilidade no projecto de habitações
Página 10 de 14https://docs.google.com/forms/d/136V1e7H5sV5Vb-Cv5uyapN002jdKhvBcmmssTw1tcRA/printform
37. 8) CustosMark only one oval per row.
1.Nunca
2.Raramente
3. Àsvezes
4.Muitasvezes
5.Sempre
Deveria serconsiderado
Semopinião
Custo inicialCustos deoperação emanutençãoCustos dedesconstruçãoe/oudesmantelamentoCustos derealojamentoCusto-beneficiopara a sociedadelocalInvestimento emnovos materiais eprocessosOutro #1Outro #2
38. Outro #1
39. Outro #2
40. Comentários

24/01/17, 01:31Sustentabilidade no projecto de habitações
Página 11 de 14https://docs.google.com/forms/d/136V1e7H5sV5Vb-Cv5uyapN002jdKhvBcmmssTw1tcRA/printform
41. 9) Gestão do processoMark only one oval per row.
1.Nunca
2.Raramente
3. Àsvezes
4.Muitasvezes
5.Sempre
Deveria serconsiderado
Semopinião
Sinergias comoutros actoresGarantia dosprodutosDuração doprojectoComplexidadedo projectoOutro #1Outro #2
42. Outro #1
43. Outro #2
44. Comentários
Ambientais
Na sua opinião, quais dos seguintes indicadores, ambientais, sociais e económicos são considerados na fase de projecto de um edifício e com que frequência isso acontece?
Descrição dos indicadores: https://www.dropbox.com/s/48rqfepaayh03oi/Complemento_ao_questionario.pdf?dl=0

24/01/17, 01:31Sustentabilidade no projecto de habitações
Página 12 de 14https://docs.google.com/forms/d/136V1e7H5sV5Vb-Cv5uyapN002jdKhvBcmmssTw1tcRA/printform
45. 10) Eficiência EnergéticaMark only one oval per row.
1.Nunca
2.Raramente
3. Àsvezes
4.Muitasvezes
5.Sempre
Deveria serconsiderado
Semopinião
Baixa emissãode CO2EficiênciaNecessidadesde energiaTecnologias debaixo ou nulocarbonoMonitorizaçãode consumosOutro #1Outro #2
46. Outro #1
47. Outro #2
48. Comentários

24/01/17, 01:31Sustentabilidade no projecto de habitações
Página 13 de 14https://docs.google.com/forms/d/136V1e7H5sV5Vb-Cv5uyapN002jdKhvBcmmssTw1tcRA/printform
49. 11) Sustentabilidade localMark only one oval per row.
1.Nunca
2.Raramente
3. Àsvezes
4.Muitasvezes
5.Sempre
Deveria serconsiderado
Semopinião
Escolha do localControlo do ruídoRetenção de águaspluviaisEcologialocal/biodiversidadeImpactos regionaisOutro #1Outro #2
50. Outro #1
51. Outro #2
52. Comentários

24/01/17, 01:31Sustentabilidade no projecto de habitações
Página 14 de 14https://docs.google.com/forms/d/136V1e7H5sV5Vb-Cv5uyapN002jdKhvBcmmssTw1tcRA/printform
Powered by
53. 12) Materiais e RecursosMark only one oval per row.
1.Nunca
2.Raramente
3. Àsvezes
4.Muitasvezes
5.Sempre
Deveria serconsiderado
Semopinião
Impactoambiental deciclo de vidaReutilização demateriaisConteúdorecicladoUtilização demateriais defontesresponsáveisEficiência dosequipamentosAproveitamentode águaspluviais ecinzentasOutro #1Outro #2
54. Outro #1
55. Outro #2
56. Comentários

1"
COMPLEMENTO AO QUESTIONÁRIO A seguinte lista apresenta uma descrição breve de cada parâmetro citado no questionário, de forma a ajudar a compreender o seu significado. Selecione (click) sobre o indicador que pretende e será encaminhado para a sua descrição.
INDICADORES*SOCIAIS*E*FUNCIONAIS* 2"|"Cultura" 2"
Integração"do"património"cultural" 2"Integração"património"construído" 2"Respeito"pelos"costumes"e"beleza"do"local"2"Inovação" 2"
|"Acessibilidade" 2"Acesso"a"transportes"públicos" 2"Acesso"a"amenidades" 2"Acessibilidade"“sem?barreiras”" 2"
|"Bem3estar,"saúde"e"conforto" 2"Conforto"térmico" 2"Conforto"acústico" 2"Qualidade"do"ar"interior" 2"Conforto"visual" 2"
|"Segurança,"saúde"e"integração"social"dos"
trabalhadores"durante"a"construção,"
manutenção"e"desmantelamento"do"edifício"3"Saúde"e"segurança"dos"trabalhadores" 3"Formação"dos"trabalhadores" 3"Impacto"na"comunidade" 3"Trabalho"local" 3"
|"Estética"do"edifício" 3"|"Funcionalidade" 3"
Eficiência"do"espaço" 3"Flexibilidade"e"adaptabilidade" 3"Facilidade"de"limpeza"e"manutenção"do"edifício" 3"Controlabilidade"pelos"utilizadores" 3"Facilidade"de"desconstrução,"reciclagem"e"desmantelamento" 3"
|"Qualidade"do"processo" 4"Qualidade"da"preparação"do"projecto" 4"Planeamento"integrado" 4"Especificação"dos"requisitos"para"utilização"e"operação"optimizadas" 4"Garantia"de"qualidade"das"actividades"de"construção" 4"
INDICADORES*ECONÓMICOS* 4"|"Custos" 4"
Custo"inicial" 4"Custos"de"operação"e"manutenção" 4"Custos"de"desconstrução"e/ou"desmantelamento" 4"Custos"de"realojamento" 4"Custo/beneficio"para"a"sociedade"local" 4"Investimento"em"novos"materiais"e"processos" 4"
|"Gestão"do"processo" 5"Sinergias"com"outros"actores" 5"Garantia"dos"produtos" 5"Duração"do"projecto" 5"Complexidade"do"projecto" 5"
INDICADORES*AMBIENTAIS* 5"|"Eficiência"Energética" 5"
Baixa"emissão"de"CO2" 5"Eficiência" 5"Necessidades"de"energia" 5"Tecnologias"de"baixo"ou"nulo"carbono" 5"Monitorização"de"consumos" 5"
|"Sustentabilidade"local" 5"Escolha"do"local" 5"Controlo"do"ruído" 5"Retenção"de"águas"pluviais" 5"Ecologia"local/biodiversidade" 6"Impactos"regionais" 6"
|"Materiais"e"Recursos" 6"Impacto"ambiental"de"ciclo"de"vida" 6"Reutilização"de"materiais" 6"Conteúdo"reciclado" 6"Utilização"de"materiais"de"fontes"responsáveis" 6"Eficiência"dos"equipamentos" 6"Aproveitamento"de"águas"pluviais"e"cinzentas" 6"

2"
Indicadores sociais e funcionais | Cultura Integração do património cultural Garantir a compatibilidade do edifício com os valores culturais quer do local onde está inserido quer dos futuros utilizadores. Integração património construído Garantir a manutenção do valor patrimonial existente no edifício. Garantir a compatibilidade do edifício com o património envolvente. Respeito pelos costumes e beleza do local Garantir o enquadramento do edifício na evolvente existente; preservação da traça local Inovação Incorporação de novas medidas e técnicas que permitam preservar os bens culturais e patrimoniais do local e dos utilizadores. | Acessibilidade Acesso a transportes públicos Assegurar proximidade e acesso simples á rede de transportes públicos, que satisfaça as necessidades dos utilizadores do edifício. Acesso a amenidades Promover a existência e fácil acesso a amenidades básicas nas imediações do edifício. Acessibilidade “sem-barreiras” Assegurar que o edifício pode ser facilmente utilizado por pessoas com mobilidade de reduzida, a curto e a longo prazo. | Bem-estar, saúde e conforto Conforto térmico Garantir condições de temperatura e humidade relativa adequadas Conforto acústico Garantir condições de isolamento sonoro, quer de origem no exterior quer no interior Qualidade do ar interior Garantir que o ar interior não é prejudicial à saúde e bem-estar dos ocupantes do edifício evitando elevadas concentrações de poluentes como compostos orgânicos voláteis (presentes em muitos materiais de acabamentos), CO2; ou ainda promoção de ventilação natural/mecânica. Conforto visual Incorporar medidas que contribuam para, por exemplo, existência de iluminação natural e artificial por todo o edifício e em divisões mais utilizadas; vista para o exterior e controlo de excesso de brilho causado pelas iluminações natural e artificial.

3"
| Segurança, saúde e integração social dos trabalhadores durante a construção, manutenção e desmantelamento do edifício Saúde e segurança dos trabalhadores Garantia das condições de trabalho para quem executa o edifício: escolha de empresas certificadas; consideração do tempo despendido e frequência de acidentes e incidentes; segurança das infra-estruturas, etc. Formação dos trabalhadores Para assegurar que as habitações são construídas com elevada qualidade é necessário garantir que a equipa de execução compreende as decisões e medidas adoptadas em projecto bem como os riscos e suas consequências, que podem ocorrer. Assim encoraja-se sessões de formação para trabalhadores e relatos das acções no decorrer da obra. Impacto na comunidade Pretende avaliar a influência social que o edifico e o seu período de construção têm no local onde este vai ser inserido. Se o beneficia, como o faz, etc. Trabalho local Promover a sustentabilidade local, assegurando que as empresas e pessoas envolvidas na execução do edifício pertencem ao local onde o edifico vai ser inserido | Estética do edifício Arte na arquitectura São os elementos arquitectónicos que dão qualidade e expressão aos edifícios, tornando-os únicos, permitindo assim intensificar a relação entre o edifício e o público (utilizadores e não utilizadores). | Funcionalidade Eficiência do espaço Assegurar que os espaços respondem às necessidades dos utilizadores, assegurando ao mesmo tempo o menor impacto ambiental possível. Flexibilidade e adaptabilidade Assegurar o interior do edifício pode ser facilmente convertido de forma a dar resposta a novas necessidades dos utilizadores ou para receber novas funções. Implica que as operações devem ter tempo de execução mais reduzido, consumir menos recursos e produzir menos resíduos, o impacto da conversão no dia-a-dia dos utilizadores é menor, etc. (Ex. modularidade, local de implementação de tubagens e cablagem, etc.) Facilidade de limpeza e manutenção do edifício Garantir que o edifício é pensado para que quer a sua limpeza (interior e exterior) e a sua manutenção (reparação de tubagens/cabelagem, reparação de equipamentos, pintura, etc) seja facilitada não exigindo consumo desnecessário de recursos. (ex. ter na cobertura pontos de suporte para limpeza de vão envidraçados pelo exterior; ter janelas de visita planeadas para tubagens e cabos; fazer levantamento prévio do local onde estes estão. Controlabilidade pelos utilizadores Maximizar a capacidade dos utilizadores em influenciar e regular, de acordo com as suas necessidades, aspectos como: ventilação, temperatura interior, protecção solar, iluminação natural e artificial, visão interior-exterior e vice-versa. Promover a existência de equipamentos que permitam ao utilizador verificar facilmente os seus consumos (agua, electricidade, etc) de forma a incentivar a sua redução. Facilidade de desconstrução, reciclagem e desmantelamento

4"
Assegurar a redução da produção de resíduos enviados para aterro a quando da eliminação do edifício. Para tal, garantir que a forma como o edifício é construído, permite uma separação simples dos seus componentes, permitindo enviar materiais para reciclagem adequada ou reutilizar partes do edifício em novos edifícios. | Qualidade do processo Qualidade da preparação do projecto Assegurar que o projecto é preparado com detalhe e rigor, evitando assim que existam mal-entendidos, erros e problemas durante a fase de construção. Contribui para reduzir o tempo de construção, reduz os custos e os recursos utilizados. Para além disso, num projecto que se quer sustentável é necessário ter-se em atenção os objectivos a que se propõem e assegurar que estes são cumpridos durante a fase de utilização. Necessidade de detalhar todos os aspectos focados nos outros indicadores. Planeamento integrado O planeamento integrado permite uma abordagem multidisciplinar a todas as fases de ciclo de vida do edifício. A execução de um projecto sustentável requer maior envolvimento dos vários intervenientes e um planeamento mais detalhado e rigoroso. Desta forma, é necessária uma comunicação mais próxima e regular entre todos, bem como um maior acompanhamento durante todo o ciclo de vida do projecto e execução do edifício. Especificação dos requisitos para utilização e operação optimizadas Assegurar que os requisitos e boas práticas de utilização do edifício e seus sistemas são transmitidos aos futuros utilizadores, de forma a garantir que o edifício poderá ser efectivamente utilizado de forma regrada e consciente, permitindo assim que seja sustentável. Garantia de qualidade das actividades de construção Assegurar que as actividades de construção se regem pelos mesmos princípios de sustentabilidade, assegurando planos de gestão de resíduos, plano de redução de ruido, protecção do ambiente e pessoas na envolvente da obra. Indicadores económicos | Custos Custo inicial Garantir custo inicial equilibrado e dentro das possibilidades de investimento do dono de obra. Custos de operação e manutenção Assegurar que os custos de manutenção e operação do edifício (custo de electricidade, água, resíduos, taxa de ocupação, operações de manutenção, etc) são tidos em conta durante a fase de projecto, e se possível reduzidos. Custos de desconstrução e/ou desmantelamento Custo de desconstrução do edifício, valor residual dos seus componentes e sistemas. Custos de realojamento Custo de realojamento dos utilizadores quando as operações de manutenção exigem que estes não permaneçam no edifício. Custo/beneficio para a sociedade local Beneficio que o edifício traz para a comunidade em que está inserido. Investimento em novos materiais e processos Valor investido em novos materiais e processos que permitirão melhorar a qualidade e sustentabilidade do edifício.

5"
| Gestão do processo Sinergias com outros actores Escolha de outros actores é feita de forma cuidada, de forma ter o máximo envolvimento e compromisso por parte de todos os actores envolvidos, e assim alcançar melhor os objectivos de sustentabilidade a que se propõem. Garantia dos produtos Garantir que são utilizados produtos de qualidade que têm garantias por parte dos seus produtores. Duração do projecto Fazer gestão da duração do projecto, garantindo o cumprimento dos prazos estabelecidos, que levam a que o orçamento seja melhor gerido e cumprido. Complexidade do projecto Quanto mais complexo é o projecto, mais apertado deverá ser a sua gestão Indicadores Ambientais | Eficiência Energética Baixa emissão de CO2 Garantir que são utilizadas, no edifício, soluções construtivas que permitam minimizar as emissões de dióxido de carbono durante a utilização do edifício Eficiência Assegurar a escolha de soluções que reduzam os consumos de energia (utilizar fontes renováveis não é garantia de eficiência), água e materiais e produção de resíduos. Necessidades de energia Garantir que são avaliadas e minimizadas as necessidades de energia para aquecimento e arrefecimento, pelo menos. (ex. adopção de medidas solares passivas) Tecnologias de baixo ou nulo carbono Assegurar que a energia necessária ao funcionamento do edifício provem de fontes com zero ou baixo carbono (quer sejam produção local ou não) Monitorização de consumos Assegurar que os utilizadores tenham um papel activo na redução do consumo de energia e água por serem incluídos dispositivos que mostrem em tempo real os consumos. | Sustentabilidade local Escolha do local Promoção da utilização de locais previamente construídos ou contaminados. Garantir que os locais escolhidos não se encontram em zonas protegidas, leitos de cheia, com valor ecológico relevante. Avaliação dos riscos do local (sismo, cheias, incêndios, tempestades, derrocadas, etc…) Controlo do ruído Evitar que o ruído durante a execução e utilização do edifício afecte a comunidade envolvente. Ter conhecimento das condições acústicas do local previamente á existência do edifico, para que esta não venha a penalizar os seus utilizadores. Retenção de águas pluviais Promoção da retenção de águas pluviais de forma a evitar os picos de cheia e a promover a sua condução correcta e fluída para os sistemas municipais de recolha de águas pluviais.

6"
Ecologia local/biodiversidade Promoção da preservação e, sempre que possível, melhoria da biodiversidade do local. Manutenção de fauna e flora autóctone Impactos regionais Assegurar que a implementação do edifício no local terá impacto neutro ou positivo. Promoção da economia local, comunidade, condições sociais, etc. | Materiais e Recursos Impacto ambiental de ciclo de vida Garantir que os materiais e produtos utilizados possuem um impacte ambiental reduzido, ao longo do seu ciclo de vida."Considerando várias categorias de impacte, como por exemplo, Potencial de aquecimento global; Potencial de Oxidação fotoquímica; Potencial depleção camada de ozono; Potencial de acidificação; Potencial de eutrofização; Potencial de depleção abiótico; Uso de energia renovável; uso de energia não renovável… Reutilização de materiais Garantir a reutilização de materiais. Conteúdo reciclado Garantir a utilização de materiais reciclados e recicláveis. Utilização de materiais de fontes responsáveis Assegurar que os produtos utilizados provêm de cadeias de produção responsáveis (ambiental e socialmente), cujos processos de produção sejam certificados, bem como os próprios produtos. (ex: certificação ISO 14001, EMAS, OHSAS 18001, FSC, PEFC, rótulo CRI, ANQIP, rótulo ecológico comunitário, etc) Eficiência dos equipamentos Assegurar que são estipulados e implementados princípios de redução do consumo de recursos, como sendo a escolha de electrodomésticos, de instalações sanitárias e de cozinha, que contribuam para a redução do consumo de água e de energia, e da promoção da redução da produção de resíduos. Aproveitamento de águas pluviais e cinzentas Assegurar o uso eficiente da água através da introdução de sistemas de recolha e aproveitamento de águas pluviais e cinzentas.

305
Appendix 2 SUMPLEMENTAL QUESTIONAIRS’ DATA ANALYSIS


307
Supplemental Data 1. Questionnaires - number of answers

308
Supplemental Data 1. Questionnaires - number of answers (cont.)

309
Supplemental Data 2. Questionnaires answers distribution by indicator and by group of respondents – Culture
38.9%
5.6% 11.1%
44.4%
23.8%
42.9%
14.3% 19.0%
45.5%
18.2%
9.1%
27.3%
0%
20%
40%
60%
1 2 3 4 5
Cultural Integration
Architects Civil Eng. Others
33.3%
16.7%
44.4% 47.6%
19.0% 14.3%
19.0%
63.6%
9.1% 9.1%
18.2%
0%
20%
40%
60%
80%
1 2 3 4 5
Built heritage
Architects Civil Eng. Others
33.3%
0.0%
27.8%
38.9%
57.1%
23.8%
14.3% 9.5%
54.5%
18.2%
9.1%
18.2%
0%
20%
40%
60%
1 2 3 4 5
Respect genius loci
Architects Civil Eng. Others
44.4%
11.1%
22.2% 22.2%
38.1%
23.8% 23.8%
14.3%
45.5%
18.2% 18.2% 18.2%
0%
20%
40%
60%
1 2 3 4 5
Innovation
Architects Civil Eng. Series5
38.9% 33.3% 33.3% 44.4%
5.6% 11.1% 11.1%
16.7% 27.8%
22.2% 44.4% 44.4% 38.9%
22.2%
0%
20%
40%
60%
80%
100%
Cl-1. Integration of culturalheritage
Cl-2. Integration of built heritage Cl-3. Respect for the genius loci Cl-4. Inovation
Architects
1. Never 2. Rarely 3. Sometimes 4. Often 5. Always
23.8% 47.6% 57.1%
38.1%
42.9% 19.0%
23.8%
23.8%
14.3% 14.3% 14.3%
23.8%
19.0% 19.0% 9.5% 14.3%
0%
20%
40%
60%
80%
100%
Cl-1. Integration of culturalheritage
Cl-2. Integration of built heritage Cl-3. Respect for the genius loci Cl-4. Inovation
Civil Engineers
1. Never 2. Rarely 3. Sometimes 4. Often 5. Always

310
Supplemental Data 2. Questionnaires answers distribution by indicator and by group of respondents – Culture (cont.)
Supplemental Data 3. Questionnaires answers distribution by indicator and by group of respondents – Accessibility
45.5% 63.6%
54.5% 45.5%
18.2%
9.1% 18.2%
18.2%
9.1% 9.1% 9.1%
18.2%
27.3% 18.2% 18.2% 18.2%
0%
20%
40%
60%
80%
100%
Cl-1. Integration of culturalheritage
Cl-2. Integration of built heritage Cl-3. Respect for the genius loci Cl-4. Inovation
Others
1. Never 2. Rarely 3. Sometimes 4. Often 5. Always
16.7% 16.7%
27.8%
11.1%
27.8% 23.8%
9.5%
33.3% 28.6%
4.8%
27.3%
9…
18.2%
36.4%
9.1%
0%
10%
20%
30%
40%
1 2 3 4 5
Access to public transportation
Architects Civil Eng. Others
22.2%
16.7%
22.2% 22.2%
16.7%
23.8%
14.3%
33.3%
23.8%
4.8%
18.2%
9.1%
36.4% 36.4%
0%
10%
20%
30%
40%
1 2 3 4 5
Access to amenities
Architects Civil Eng. Others
5.6% 5.6%
22.2%
33.3% 33.3% 28.6%
19.0%
28.6%
14.3% 9.5%
18.2%
9.1%
36.4%
18.2%
9.1%
0%
10%
20%
30%
40%
1 2 3 4 5
Barrier free
Architects Civil Eng. Others
16.7% 22.2% 5.6%
16.7% 16.7%
5.6%
27.8% 22.2%
22.2%
11.1% 22.2%
33.3%
27.8% 16.7%
33.3%
0%
25%
50%
75%
100%
A-1. Access to public transport A-2. Access to amenities A-3. Barrier-free access
Architects
1. Never 2. Rarely 3. Sometimes 4. Often 5. Always

311
Supplemental Data 3. Questionnaires answers distribution by indicator and by group of respondents – Accessibility (cont.)
Supplemental Data 4. Questionnaires answers distribution by indicator and by group of respondents – Health and Comfort
23.8% 23.8% 28.6%
9.5% 14.3% 19.0%
33.3% 33.3% 28.6%
28.6% 23.8% 14.3%
4.8% 4.8% 9.5%
0%
25%
50%
75%
100%
A-1. Access to public transport A-2. Access to amenities A-3. Barrier-free access
Civil Engineers
1. Never 2. Rarely 3. Sometimes 4. Often 5. Always
27.3% 18.2% 18.2%
9.1% 9.1% 9.1%
18.2% 36.4% 36.4%
36.4% 36.4% 18.2%
9.1% 9.1%
0%
25%
50%
75%
100%
A-1. Access to public transport A-2. Access to amenities A-3. Barrier-free access
Others
1. Never 2. Rarely 3. Sometimes 4. Often 5. Always
22.2% 27.8%
50.0%
9.5% 4.8%
66.7%
23.8% 18.2%
54.5%
27.3%
0%
10%
20%
30%
40%
50%
60%
70%
1 2 3 4 5
thermal comfort
Architects Civil Eng. Others
11.1% 16.7%
33.3%
38.9%
14.3% 9.5%
19.0%
38.1%
23.8%
27.3%
9.1%
45.5%
18.2%
0%
10%
20%
30%
40%
50%
1 2 3 4 5
Acoustic comfort
Architects Civil Eng. Others
22.2%
11.1%
22.2%
44.4%
14.3% 14.3%
42.9%
23.8%
9.5%
18.2%
27.3% 27.3% 27.3%
0%
10%
20%
30%
40%
50%
1 2 3 4 5
Indoor air Quality
Civil Eng. Architects Others
5.6% 5.6%
16.7% 22.2%
44.4%
28.6%
4.8%
42.9%
23.8%
4.8%
36.4%
9.1%
36.4%
9.1%
0%
10%
20%
30%
40%
50%
1 2 3 4 5
Visual Comfort
Architects Civil Eng. Others

312
Supplemental Data 4. Questionnaires answers distribution by indicator and by group of respondents – Health and Comfort (cont.)
Supplemental Data 5. Questionnaires answers distribution by indicator and by group of respondents – Safety and security of workers
5.6% 11.1% 22.2% 5.6% 22.2%
16.7% 11.1%
16.7%
27.8% 33.3% 22.2% 22.2%
50.0% 38.9% 44.4% 44.4%
0%
25%
50%
75%
100%
HC-1. Thermal comfort HC-2. Acoustic comfort HC-3. Indoor air quality HC-4. Visual comfort
Architects
1. Never 2. Rarely 3. Sometimes 4. Often 5. Always
9.5% 14.3% 14.3% 28.6%
0.0% 9.5% 14.3%
4.8%
4.8%
19.0%
42.9% 42.9% 66.7%
38.1%
23.8% 23.8% 23.8% 23.8% 9.5% 4.8%
0%
25%
50%
75%
100%
HC-1. Thermal comfort HC-2. Acoustic comfort HC-3. Indoor air quality HC-4. Visual comfort
Civil Engineers
1. Never 2. Rarely 3. Sometimes 4. Often 5. Always
18.2% 27.3% 18.2%
36.4% 0.0%
27.3%
9.1%
9.1%
54.5%
45.5% 27.3% 36.4%
27.3% 18.2% 27.3%
9.1%
0%
25%
50%
75%
100%
HC-1. Thermal comfort HC-2. Acoustic comfort HC-3. Indoor air quality HC-4. Visual comfort
Others
1. Never 2. Rarely 3. Sometimes 4. Often 5. Always
5.6%
16.7%
27.8%
5.6%
38.9%
14.3%
28.6% 38.1%
23.8% 18.2%
9.1%
18.2%
27.3% 27.3%
0%
10%
20%
30%
40%
50%
1 2 3 4 5
Health & safty of workers
Architects Civil Eng. Others
27.8%
16.7%
22.2%
27.8%
14.3%
33.3% 28.6%
14.3% 14.3%
36.4%
18.2% 18.2%
27.3%
0%
10%
20%
30%
40%
1 2 3 4 5
Workers ' training
Architects Civil Eng. Others

313
Supplemental Data 5. Questionnaires answers distribution by indicator and by group of respondents – Safety and security of workers (cont.)
27.8% 22.2%
16.7% 16.7%
33.3% 33.3%
23.8%
4.8% 9.5%
18.2%
45.5%
18.2%
9.1% 9.1%
0%
10%
20%
30%
40%
50%
1 2 3 4 5
Community impact
Architects Civil Eng. Others
33.3%
5.6%
27.8%
11.1% 11.1%
28.6% 28.6% 23.8%
14.3%
4.8%
18.2%
27.3%
45.5%
9.1%
0%
10%
20%
30%
40%
50%
1 2 3 4 5
Local work
Architects Civil Eng. Others
5.6% 27.8% 27.8% 33.3% 16.7%
16.7% 22.2%
5.6% 27.8%
22.2% 16.7%
27.8% 5.6%
0.0% 0.0% 11.1% 38.9%
27.8% 16.7% 11.1%
0%
25%
50%
75%
100%
SH-1. Workers' Safety and Health SH-2. Workers' training SH-3. Community impact SH-4. Local work
Architects
1. Never 2. Rarely 3. Sometimes 4. Often 5. Always
14.3% 14.3% 33.3% 28.6%
33.3%
33.3% 28.6%
28.6%
28.6%
23.8% 23.8%
38.1%
14.3% 4.8% 14.3% 23.8% 14.3% 9.5% 4.8%
0%
25%
50%
75%
100%
SH-1. Workers' Safety and Health SH-2. Workers' training SH-3. Community impact SH-4. Local work
Civil Engineer
1. Never 2. Rarely 3. Sometimes 4. Often 5. Always
18.2% 36.4%
18.2% 18.2%
9.1%
18.2% 45.5%
27.3% 18.2%
18.2% 18.2%
45.5% 27.3%
27.3% 9.1% 27.3% 9.1% 9.1%
0%
25%
50%
75%
100%
SH-1. Workers' Safety and Health SH-2. Workers' training SH-3. Community impact SH-4. Local work
Others
1. Never 2. Rarely 3. Sometimes 4. Often 5. Always

314
Supplemental Data 6. Questionnaires answers distribution by indicator and by group of respondents – Aesthetics
5.6% 11.1%
33.3%
50.0%
4.8% 4.8%
23.8%
47.6%
23.8% 18.2%
9.1%
36.4%
18.2% 18.2%
0%
10%
20%
30%
40%
50%
60%
1 2 3 4 5
art within architecture
Architects Civil Eng. Others
5.6% 11.1% 33.3% 50.0%
0% 10% 20% 30% 40% 50% 60% 70% 80% 90% 100%
Ae-1.Art withinarchitecture
Architects
1. Never 2. Rarely 3. Sometimes 4. Often 5. Always
4.8% 4.8% 47.6% 23.8%
0% 10% 20% 30% 40% 50% 60% 70% 80% 90% 100%
Ae-1.Art withinarchitecture
Civil Engineers
1. Never 2. Rarely 3. Sometimes 4. Often 5. Always
18.2% 9.1% 18.2% 18.2%
0% 10% 20% 30% 40% 50% 60% 70% 80% 90% 100%
Ae-1.Artwithin
architecture
Others
1. Never 2. Rarely 3. Sometimes 4. Often 5. Always

315
Supplemental Data 7. Questionnaires answers distribution by indicator and by group of respondents – Functionality
5.6% 11.1%
16.7% 11.1%
55.6%
4.8%
19.0%
42.9%
33.3%
18.2% 18.2%
45.5%
18.2%
0%
10%
20%
30%
40%
50%
60%
1 2 3 4 5
Space efficiency
Architects Civil Eng. Others
5.6%
22.2% 22.2%
27.8% 22.2%
4.8%
23.8% 23.8%
38.1%
14.3% 9.1%
9.1%
54.5%
18.2% 9.1%
0%
10%
20%
30%
40%
50%
60%
1 2 3 4 5
flexibility and adaptability
Architects Civil Eng. Others
5.6%
27.8% 27.8%
22.2%
16.7%
23.8%
9.5%
38.1%
23.8%
4.8% 9.1%
18.2%
27.3%
18.2%
27.3%
0%
10%
20%
30%
40%
1 2 3 4 5
ease of cleaning andmaintenance
Architects Civil Eng. Others
11.1% 11.1%
27.8% 33.3%
16.7%
9.5%
14.3%
42.9%
19.0%
9.5%
18.2%
9.1%
45.5%
18.2%
0%
10%
20%
30%
40%
50%
1 2 3 4 5
users ' control
Architects Civil Eng. Others
38.9%
22.2% 22.2%
5.6% 11.1%
42.9%
33.3%
14.3% 9.5%
4.8%
36.4%
27.3% 27.3%
9.1%
0%
10%
20%
30%
40%
50%
1 2 3 4 5
ease of deconstruction
Architects Civil Eng. Others
5.6% 5.6% 5.6% 11.1%
38.9% 11.1%
22.2% 27.8% 11.1%
22.2%
16.7%
22.2% 27.8%
27.8%
22.2%
11.1%
27.8% 22.2%
33.3%
5.6%
55.6%
22.2% 16.7% 16.7% 11.1%
0%
25%
50%
75%
100%
F-1. Space efficiency F-2. Flexibility andadaptability
F-3. Ease of cleaning andmaintenance
F-4. Users’ control F-5. Ease ofdeconstruction
Architects
1. Never 2. Rarely 3. Sometimes 4. Often 5. Always

316
Supplemental Data 7. Questionnaires answers distribution by indicator and by group of respondents – Functionality (cont.)
Supplemental Data 8. Questionnaires answers distribution by indicator and by group of respondents – Project quality
0.0% 4.8% 23.8%
9.5%
42.9%
4.8%
23.8%
9.5% 14.3%
33.3%
19.0%
23.8%
38.1% 42.9%
14.3%
42.9%
38.1%
23.8% 19.0% 9.5%
33.3% 14.3% 4.8% 9.5% 4.8%
0%
25%
50%
75%
100%
F-1. Space efficiency F-2. Flexibility andadaptability
F-3. Ease of cleaning andmaintenance
F-4. Users’ control F-5. Ease ofdeconstruction
Civil Engineers
1. Never 2. Rarely 3. Sometimes 4. Often 5. Always
18.2% 9.1% 9.1%
18.2% 36.4%
9.1% 18.2%
9.1%
27.3%
18.2%
54.5% 27.3%
45.5%
27.3%
45.5%
18.2%
18.2%
18.2% 18.2% 9.1%
27.3% 9.1%
0%
25%
50%
75%
100%
F-1. Space efficiency F-2. Flexibility andadaptability
F-3. Ease of cleaning andmaintenance
F-4. Users’ control F-5. Ease ofdeconstruction
Others
1. Never 2. Rarely 3. Sometimes 4. Often 5. Always
5.6%
16.7% 11.1%
33.3% 33.3%
14.3%
4.8%
42.9%
23.8% 19.0%
27.3%
18.2% 27.3%
9.1% 18.2%
0%
10%
20%
30%
40%
50%
1 2 3 4 5
Project preparation quality
Architects Civil Eng. Others
5.6%
22.2%
27.8% 27.8%
16.7%
23.8%
14.3%
28.6% 28.6%
9.5%
36.4%
18.2% 18.2%
18.2%
9.1%
0%
10%
20%
30%
40%
1 2 3 4 5
Integrated planning
Architects Civil Eng. Others
22.2%
11.1% 16.7%
27.8%
16.7%
4.8%
23.8%
38.1%
14.3%
19.0% 27.3% 27.3% 27.3%
18.2%
0%
10%
20%
30%
40%
1 2 3 4 5
Requirements specification
Architects Civil Eng. Others
22.2%
11.1%
16.7%
22.2% 22.2% 19.0%
28.6%
14.3%
23.8%
14.3% 18.2%
27.3% 27.3%
18.2%
9.1%
0%
10%
20%
30%
40%
1 2 3 4 5
Procecess warranty
Architects Civil Eng. Others

317
Supplemental Data 8. Questionnaires answers distribution by indicator and by group of respondents – Project quality (cont.)
5.6% 5.6% 22.2% 22.2% 16.7% 22.2%
11.1% 11.1% 11.1%
27.8% 16.7% 16.7% 33.3%
27.8% 27.8% 22.2%
33.3% 16.7% 16.7% 22.2%
0%
25%
50%
75%
100%
PQ-1. Project preparationquality
PQ-2. Integrated planning PQ-3. Utilization requirementsspecification
PQ-4. Construction activitywarranty
Architects
1. Never 2. Rarely 3. Sometimes 4. Often 5. Always
14.3% 23.8%
4.8% 19.0%
4.8%
14.3%
23.8%
28.6% 42.9%
28.6% 38.1% 14.3%
23.8% 28.6% 14.3% 23.8%
19.0% 9.5%
19.0% 14.3%
0%
25%
50%
75%
100%
PQ-1. Project preparationquality
PQ-2. Integrated planning PQ-3. Utilization requirementsspecification
PQ-4. Construction activitywarranty
Civil Engineers
1. Never 2. Rarely 3. Sometimes 4. Often 5. Always
27.3% 36.4%
27.3% 18.2%
18.2% 18.2%
27.3% 27.3%
27.3% 18.2%
27.3% 27.3%
9.1% 18.2%
18.2% 18.2%
18.2% 9.1% 9.1%
0%
25%
50%
75%
100%
PQ-1. Project preparationquality
PQ-2. Integrated planning PQ-3. Utilization requirementsspecification
PQ-4. Construction activitywarranty
Others
1. Never 2. Rarely 3. Sometimes 4. Often 5. Always

318
Supplemental Data 9. Questionnaires answers distribution by indicator and by group of respondents – Life cycle costs
5.6% 11.1%
22.2%
61.1%
4.8% 4.8% 4.8%
28.6%
57.1%
18.2% 9.1% 18.2%
45.5%
0%
10%
20%
30%
40%
50%
60%
70%
1 2 3 4 5
Inicial Cost
Architects Civil Eng. Others
16.7%
11.1%
33.3%
11.1%
27.8%
9.5%
38.1% 28.6%
19.0%
9.5%
18.2%
9.1%
27.3%
36.4%
0%
10%
20%
30%
40%
1 2 3 4 5
Operation andmaintenance Cost
Architects Civil Eng. Others
44.4%
33.3%
16.7%
5.6%
52.4%
19.0%
4.8%
19.0%
4.8%
45.5%
9.1%
27.3%
0%
10%
20%
30%
40%
50%
60%
1 2 3 4 5
Demolition Cost
Architects Civil Eng. Others
33.3%
27.8% 27.8%
5.6% 5.6%
38.1%
23.8% 19.0%
9.5% 9.5%
36.4% 36.4%
18.2%
0%
10%
20%
30%
40%
1 2 3 4 5
Resettlement Cost
Architects Civil Eng. Others
33.3% 33.3% 16.7%
5.6% 11.1%
38.1%
14.3% 9.5%
4.8% 18.2%
54.5%
9.1% 9.1%
0%
10%
20%
30%
40%
50%
60%
1 2 3 4 5
Cost-benefit for local society
Architects Civil Eng. Others
11.1%
22.2%
50.0%
5.6% 11.1%
4.8%
57.1%
33.3%
4.8%
27.3% 18.2%
27.3% 9.1%
9.1%
0%
10%
20%
30%
40%
50%
60%
1 2 3 4 5
Investment in inovative materials andproccesses
Architects Civil Eng. Others
0.0% 16.7%
44.4% 33.3% 33.3% 11.1% 5.6%
11.1%
33.3% 27.8% 33.3%
22.2% 11.1%
33.3%
16.7% 27.8% 16.7%
50.0%
22.2%
11.1%
5.6% 5.6% 5.6%
61.1%
27.8% 5.6% 5.6% 11.1% 11.1%
0%
25%
50%
75%
100%
C-1. Initial cost C-2. Operation andmaintenance cost
C-3. Deconstructioncost
C-4. Resettlementcost
C-5. Local communitycost-benefit
C-6. Investment innew materials and
technologies
Architects
1. Never 2. Rarely 3. Sometimes 4. Often 5. Always

319
Supplemental Data 9. Questionnaires answers distribution by indicator and by group of respondents – Life cycle costs (cont.)
Supplemental Data 10. Questionnaires answers distribution by indicator and by group of respondents – Project Management
4.8% 9.5%
52.4% 38.1% 33.3%
4.8% 4.8%
38.1%
19.0% 23.8% 38.1%
57.1%
4.8%
28.6% 4.8% 19.0%
14.3% 33.3%
28.6%
19.0% 19.0% 9.5% 9.5% 4.8%
57.1%
9.5% 4.8% 9.5% 4.8%
0%
25%
50%
75%
100%
C-1. Initial cost C-2. Operation andmaintenance cost
C-3. Deconstructioncost
C-4. Resettlementcost
C-5. Local communitycost-benefit
C-6. Investment innew materials and
technologies
Civil Engineers
1. Never 2. Rarely 3. Sometimes 4. Often 5. Always
18.2% 18.2%
45.5% 36.4%
18.2% 27.3% 9.1% 9.1%
9.1% 36.4% 54.5%
18.2% 27.3%
27.3% 18.2% 9.1%
27.3%
18.2%
36.4% 9.1% 45.5%
9.1% 9.1%
0%
25%
50%
75%
100%
C-1. Initial cost C-2. Operation andmaintenance cost
C-3. Deconstructioncost
C-4. Resettlementcost
C-5. Local communitycost-benefit
C-6. Investment innew materials and
technologies
Others
1. Never 2. Rarely 3. Sometimes 4. Often 5. Always
11.1%
27.8% 22.2%
11.1%
27.8%
9.5%
42.9% 33.3%
4.8% 9.5%
18.2% 18.2%
45.5%
9.1%
0%
10%
20%
30%
40%
50%
1 2 3 4 5
Sinergies with other actors
Architects Civil Eng. Others
11.1% 11.1%
22.2% 27.8% 27.8%
4.8%
28.6% 28.6%
42.9%
18.2%
36.4%
18.2% 18.2%
0%
10%
20%
30%
40%
50%
1 2 3 4 5
Products warranty
Architects Civil Eng. Others
5.6% 5.6%
27.8% 33.3% 27.8%
14.3%
4.8%
38.1% 42.9%
4.8%
18.2%
54.5%
9.1%
0%
10%
20%
30%
40%
50%
60%
1 2 3 4 5
Project duration
Architects Civil Eng. Others
5.6% 5.6%
27.8%
22.2%
27.8%
9.5% 14.3%
33.3% 28.6%
9.5%
18.2% 18.2%
45.5%
0%
10%
20%
30%
40%
50%
1 2 3 4 5
Project complexity
Architects Civil Eng. Others

320
Supplemental Data 10. Questionnaires answers distribution by indicator and by group of respondents – Project Management (cont.)
Supplemental Data 11. Questionnaires answers distribution by indicator and by group of respondents – Energy Efficiency
11.1% 11.1% 5.6% 5.6%
27.8% 11.1%
5.6% 5.6%
22.2%
22.2% 27.8% 27.8%
11.1% 27.8% 33.3% 22.2%
27.8% 27.8% 27.8% 27.8%
0%
25%
50%
75%
100%
PM-1. Synergies with other actors PM-2. Products’ warranty PM-3. Project duration PM-4. Project complexity
Architects
1. Never 2. Rarely 3. Sometimes 4. Often 5. Always
9.5% 4.8% 14.3% 9.5%
42.9%
28.6% 4.8% 14.3%
33.3%
28.6% 38.1%
33.3%
4.8% 42.9%
42.9% 28.6%
9.5% 4.8% 9.5%
0%
25%
50%
75%
100%
PM-1. Synergies with other actors PM-2. Products’ warranty PM-3. Project duration PM-4. Project complexity
Civil Engineers
1. Never 2. Rarely 3. Sometimes 4. Often 5. Always
18.2% 18.2% 18.2% 18.2%
18.2% 18.2%
45.5%
36.4%
54.5%
45.5%
9.1%
18.2%
9.1% 18.2%
0%
25%
50%
75%
100%
PM-1. Synergies with other actors PM-2. Products’ warranty PM-3. Project duration PM-4. Project complexity
Others
1. Never 2. Rarely 3. Sometimes 4. Often 5. Always
50.0%
22.2%
5.6%
22.2%
33.3% 38.1%
9.5%
19.0% 27.3% 27.3%
9.1%
27.3%
9.1%
0%
10%
20%
30%
40%
50%
60%
1 2 3 4 5
Low CO2 emission
Architects Civil Eng. Others
5.6% 5.6%
38.9%
22.2% 27.8%
14.3% 9.5%
28.6% 28.6%
23.8%
9.1%
18.2% 18.2% 27.3%
27.3%
0%
10%
20%
30%
40%
50%
1 2 3 4 5
Efficiency
Architects Civil Eng. Others

321
Supplemental Data 11. Questionnaires answers distribution by indicator and by group of respondents – Energy Efficiency (cont.)
11.1%
22.2% 16.7% 16.7%
33.3%
14.3%
9.5%
33.3%
23.8% 23.8%
18.2%
27.3% 36.4%
18.2%
0%
10%
20%
30%
40%
1 2 3 4 5
Energy needs
Architects Civil Eng. Others
44.4%
11.1% 16.7%
16.7% 5.6%
33.3% 33.3%
19.0%
4.8% 9.5%
27.3% 27.3%
18.2% 18.2%
9.1%
0%
10%
20%
30%
40%
50%
1 2 3 4 5
Zero or nearly zero carbon technologies
Architects Civil Eng. Others
38.9%
27.8% 22.2%
5.6% 5.6%
23.8%
28.6%
42.9%
4.8%
18.2%
27.3% 27.3% 27.3%
0%
10%
20%
30%
40%
50%
1 2 3 4 5
Consumption monitoring
Architects Civil Eng. Others
50.0%
5.6% 11.1%
44.4% 38.9% 5.6%
22.2%
11.1% 27.8% 22.2%
38.9% 16.7%
16.7% 22.2% 5.6%
22.2% 16.7%
16.7% 5.6% 22.2% 27.8% 33.3%
5.6% 5.6%
0%
25%
50%
75%
100%
EE-1. Low CO2 emission EE-2. Efficiency EE-3. Energy needs EE-4. Nearly or zerocarbon technologies
EE-5. Consumptionsmonitoring
Architects
1. Never 2. Rarely 3. Sometimes 4. Often 5. Always
33.3% 14.3% 14.3%
33.3% 23.8%
38.1%
9.5% 9.5%
33.3%
28.6%
9.5%
28.6% 33.3%
19.0% 42.9%
19.0%
28.6% 23.8%
4.8% 4.8%
23.8% 23.8% 9.5%
0%
25%
50%
75%
100%
EE-1. Low CO2 emission EE-2. Efficiency EE-3. Energy needs EE-4. Nearly or zerocarbon technologies
EE-5. Consumptionsmonitoring
Civil Engineers
1. Never 2. Rarely 3. Sometimes 4. Often 5. Always

322
Supplemental Data 11. Questionnaires answers distribution by indicator and by group of respondents – Energy Efficiency (cont.)
Supplemental Data 12. Questionnaires answers distribution by indicator and by group of respondents – Site Sustainability
27.3% 9.1% 18.2% 27.3%
18.2%
27.3%
18.2%
27.3% 27.3%
9.1%
18.2% 27.3%
18.2% 27.3%
27.3%
27.3% 36.4%
18.2% 27.3% 9.1%
27.3% 18.2% 9.1%
0%
25%
50%
75%
100%
EE-1. Low CO2 emission EE-2. Efficiency EE-3. Energy needs EE-4. Nearly or zerocarbon technologies
EE-5. Consumptionsmonitoring
Others
1. Never 2. Rarely 3. Sometimes 4. Often 5. Always
33.3%
22.2%
11.1% 11.1%
22.2%
14.3% 9.5%
28.6%
42.9%
4.8% 9.1%
18.2%
36.4%
18.2%
9.1%
0%
10%
20%
30%
40%
50%
1 2 3 4 5
Site choice
Architects Civil Eng. Others
16.7% 22.2%
33.3%
5.6%
22.2%
28.6%
19.0%
28.6% 23.8%
4.8% 9.1%
27.3%
36.4%
18.2%
9.1%
0%
10%
20%
30%
40%
1 2 3 4 5
Noise control
Architects Civil Eng. Others
33.3%
16.7% 16.7% 16.7% 16.7%
19.0%
33.3%
19.0% 19.0%
4.8% 9.1%
54.5%
18.2% 18.2%
0%
10%
20%
30%
40%
50%
60%
1 2 3 4 5
Rainfall control
Architects Civil Eng. Others
38.9%
16.7% 22.2%
5.6%
16.7%
23.8%
38.1%
23.8%
9.5%
18.2%
45.5%
9.1%
18.2%
9.1%
0%
10%
20%
30%
40%
50%
1 2 3 4 5
Local ecology
Architects Civil Eng. Others
27.8% 33.3%
16.7%
5.6%
16.7% 23.8%
33.3% 33.3%
4.8%
18.2%
36.4%
27.3%
9.1% 9.1%
0%
10%
20%
30%
40%
1 2 3 4 5
Regional impacts
Architects Civil Eng. Others

323
Supplemental Data 12. Questionnaires answers distribution by indicator and by group of respondents – Site Sustainability (cont.)
Supplemental Data 13. Questionnaires answers distribution by indicator and by group of respondents – Material Resources
33.3% 16.7%
33.3% 38.9% 27.8%
22.2%
22.2%
16.7% 16.7% 33.3%
11.1% 33.3% 16.7%
22.2% 16.7% 11.1% 5.6% 16.7% 5.6% 5.6%
22.2% 22.2% 16.7% 16.7% 16.7%
0%
25%
50%
75%
100%
Site selection SS-2. Noise control SS-3. Rainwater retaining SS-4. Local ecology SS-5. Regional impacts
Architects
1. Never 2. Rarely 3. Sometimes 4. Often 5. Always
14.3% 28.6% 19.0% 23.8% 23.8%
9.5%
19.0% 33.3% 38.1% 33.3% 28.6%
28.6% 19.0%
23.8% 33.3% 42.9% 23.8% 19.0%
9.5% 4.8% 4.8% 4.8% 4.8%
0%
25%
50%
75%
100%
Site selection SS-2. Noise control SS-3. Rainwater retaining SS-4. Local ecology SS-5. Regional impacts
Civil Engineers
1. Never 2. Rarely 3. Sometimes 4. Often 5. Always
9.1% 9.1% 9.1% 18.2% 18.2% 18.2% 27.3%
54.5% 45.5% 36.4%
36.4% 36.4%
9.1% 27.3% 18.2% 18.2%
18.2% 18.2% 9.1%
9.1% 9.1% 18.2% 9.1% 9.1%
0%
25%
50%
75%
100%
Site selection SS-2. Noise control SS-3. Rainwater retaining SS-4. Local ecology SS-5. Regional impacts
Others
1. Never 2. Rarely 3. Sometimes 4. Often 5. Always
22.2% 27.8%
27.8%
11.1% 11.1%
28.6% 38.1%
14.3% 9.5%
4.8%
27.3% 27.3% 27.3%
9.1% 9.1%
0%
10%
20%
30%
40%
1 2 3 4 5
LCA
Architects Civil Eng. Others
11.1%
50.0%
22.2%
5.6% 11.1%
33.3%
23.8%
33.3%
9.5%
36.4% 36.4%
18.2%
9.1%
0%
10%
20%
30%
40%
50%
60%
1 2 3 4 5
Materials reuse
Architects Civil Eng. Others

324
Supplemental Data 13. Questionnaires answers distribution by indicator and by group of respondents – Material Resources (cont.)
27.8%
44.4%
16.7%
5.6% 5.6%
42.9%
23.8%
14.3% 14.3%
4.8%
18.2%
36.4%
27.3%
9.1%
9.1%
0%
10%
20%
30%
40%
50%
1 2 3 4 5
Recycled content
Architects Civil Eng. Others
22.2%
38.9%
22.2%
5.6%
11.1%
38.1%
19.0%
28.6%
4.8%
14.3%
9.1%
27.3%
36.4%
18.2%
0%
10%
20%
30%
40%
50%
1 2 3 4 5
Responsible source
Architects Civil Eng. Others
11.1%
22.2% 11.1%
27.8% 27.8%
14.3%
33.3%
38.1%
14.3% 9.1%
9.1%
45.5%
18.2% 18.2%
0%
10%
20%
30%
40%
50%
1 2 3 4 5
Equipement efficiency
Architects Civil Eng. Others
33.3%
22.2%
11.1%
27.8%
5.6%
23.8%
38.1% 38.1%
4.8%
27.3%
36.4%
27.3%
9.1%
0%
10%
20%
30%
40%
1 2 3 4 5
Rain and grey water recycling
Architects Civil Eng. Others
22.2% 11.1%
27.8% 22.2% 11.1%
33.3%
27.8% 50.0%
44.4% 38.9%
22.2%
22.2%
27.8% 22.2%
16.7% 22.2%
11.1%
11.1%
11.1% 5.6% 5.6%
5.6%
27.8%
27.8%
11.1% 11.1% 5.6% 11.1% 27.8%
5.6%
0%
25%
50%
75%
100%
MR-1. Life cycleimpact
MR-2. Materials re-use
MR-3. Recycledcontent
MR-4. Responsiblesourcing
MR-5. Equipmentefficiency
MR-6. Re-use of rainand grey water
Architects
1. Never 2. Rarely 3. Sometimes 4. Often 5. Always
28.6% 33.3% 42.9%
38.1% 23.8%
38.1% 23.8%
23.8%
19.0%
14.3%
38.1%
14.3% 33.3% 14.3%
28.6%
33.3%
38.1%
9.5% 14.3% 4.8%
38.1%
4.8% 4.8% 9.5% 4.8% 14.3% 14.3%
0%
25%
50%
75%
100%
MR-1. Life cycleimpact
MR-2. Materials re-use
MR-3. Recycledcontent
MR-4. Responsiblesourcing
MR-5. Equipmentefficiency
MR-6. Re-use of rainand grey water
Civil Engineers
1. Never 2. Rarely 3. Sometimes 4. Often 5. Always

325
Supplemental Data 13. Questionnaires answers distribution by indicator and by group of respondents – Material Resources (cont.)
27.3% 36.4%
18.2% 9.1% 9.1%
27.3%
27.3%
36.4%
36.4%
27.3%
9.1%
36.4%
27.3%
18.2%
27.3% 36.4%
45.5%
27.3% 9.1%
9.1% 9.1% 18.2%
18.2%
9.1% 9.1% 9.1% 18.2%
0%
25%
50%
75%
100%
MR-1. Life cycleimpact
MR-2. Materials re-use
MR-3. Recycledcontent
MR-4. Responsiblesourcing
MR-5. Equipmentefficiency
MR-6. Re-use of rainand grey water
Others
1. Never 2. Rarely 3. Sometimes 4. Often 5. Always


327
Appendix 3 EASYMODE WORKBOOK


EASYMODE Early Stage Model for Sustainable Design Tool for sustainable design and asssessment
Project Title
Owner
LocationTypologyNumber of Occupants (No) (-)Allotment Area (AA) (m2)ILUmax (-)Number of Floors (forseen) (-)Gross External Area (GEA) (m2)Minimum Occupation Density (ODmin) #N/A (m2/occupant)
Rooms Default Determined
N. Bedrooms 0N. Living rooms 1N. Kitchens 1N. WC 4
Construction typology

Indicator Life cycle environmental impact
Aim Reduce the building's environmental life cycle impact
Benefit Diminishe harm to the environmentImprove natural environmental conditionsReduce raw materials exploitation
Methodology
Analyse alternatives ?
ComparativeNumber of Alternatives
0
Thickness (m) Thickness (m)1 0,152 0,15
0,04 0,04
Thickness (m) Thickness (m)0,15 0,150,15 0,150,04 0,04
Thickness (m)0,150,150,04
Thickness (m)0,150,15 Building's service life (years) 500,04 Include maintenance? yes
Include end-of-life? yes
1
Exterior wall Interior wall Internal floor Ground floor Roof StructureCradle to Gate (CtG)CtG + Maintenace Cradle to Gate (CtG) CtG + Maintenace Cradle to Gate (CtG)CtG + Maintenace Cradle to Gate (CtG)CtG + Maintenace Cradle to Gate (CtG)CtG + Maintenace Cradle to Gate (CtG)
GWP (kg Sb eq)/m2 1,22E+02 4,88E+00 1,37E+01 5,46E-01 1,37E+01 5,46E-01 1,37E+01 5,46E-01 1,37E+01 5,46E-01 2,92E+02AP (kg Sb eq)/m2 6,96E-01 2,78E-02 7,78E-02 3,11E-03 7,78E-02 3,11E-03 7,78E-02 3,11E-03 7,78E-02 3,11E-03 1,66E+00TPE (kg Sb eq)/m2 1,89E+03 7,55E+01 2,11E+02 8,44E+00 2,11E+02 8,44E+00 2,11E+02 8,44E+00 2,11E+02 8,44E+00 4,03E+03EP (kg Sb eq)/m2 3,73E-02 1,49E-03 4,17E-03 1,67E-04 4,17E-03 1,67E-04 4,17E-03 1,67E-04 4,17E-03 1,67E-04 8,92E-02ADP (kg Sb eq)/m2 8,78E-01 3,51E-02 9,82E-02 3,93E-03 9,82E-02 3,93E-03 9,82E-02 3,93E-03 9,82E-02 3,93E-03 2,10E+00ODP (kg Sb eq)/m2 5,10E-06 2,04E-07 5,70E-07 2,28E-08 5,70E-07 2,28E-08 5,70E-07 2,28E-08 5,70E-07 1,74E-04 1,22E-05POCP (kg Sb eq)/m2 7,76E-02 3,10E-03 8,68E-03 3,47E-04 8,68E-03 3,47E-04 8,68E-03 3,47E-04 8,68E-03 3,47E-04 1,86E-01
Environmental impact categories
Solution
Other rock/mineral wool (20-35)
Insulation layer rock/mineral wool (20-35)Interior layer rock/mineral wool (20-35)
Glazed openingsExterior layer rock/mineral wool (20-35)
Other rock/mineral wool (20-35) Other rock/mineral wool (20-35)Interior layer rock/mineral wool (20-35) Interior layer rock/mineral wool (20-35)Insulation layer rock/mineral wool (20-35) Insulation layer rock/mineral wool (20-35)
Roof StructureExterior layer rock/mineral wool (20-35) Exterior layer rock/mineral wool (20-35)
Other rock/mineral wool (20-35) Other rock/mineral wool (20-35)Interior layer rock/mineral wool (20-35) Interior layer rock/mineral wool (20-35)Insulation layer rock/mineral wool (20-35) Insulation layer rock/mineral wool (20-35)Exterior layer rock/mineral wool (20-35) Exterior layer rock/mineral wool (20-35)Ground floor Internal floor
Other rock/mineral wool (20-35) Other rock/mineral wool (20-35)Interior layer rock/mineral wool (20-35) Interior layer rock/mineral wool (20-35)Insulation layer rock/mineral wool (20-35) Insulation layer rock/mineral wool (20-35)
Exterior wall Interior wallExterior layer rock/mineral wool (20-35) Exterior layer rock/mineral wool (20-35)
Construcion solution Stone masonry + timber
Building Solution
I1 - Solutions ClearI1 - Compare
Interior layerInsulation layer
Exterior layer

Indicator Life cycle environmental impact
Aim Reduce the building's environmental life cycle impact
Benefit Diminishe harm to the environmentImprove natural environmental conditionsReduce raw materials exploitation
Methodology
Analyse alternatives? Comparative
Number of Alternatives
0
I1 - Solutions ClearI1 - Compare
Solution GWP AP TPE EP ADP ODP POCP GWP AP TPE EP ADP ODP POCP1 0,5460 0,0031 8,4445 0,0002 0,0039 0,0000 0,0003 0,5460 0,0031 8,4445 0,0002 0,0039 0,0000 0,0003
Exterior wall Interior wall
0,0000
0,1000
0,2000
0,3000
0,4000
0,5000
0,6000
0 1 2 3 4 5 6 7 8 9 10
~º
0,0000
0,0005
0,0010
0,0015
0,0020
0,0025
0,0030
0,0035
0 1 2 3 4 5 6 7 8 9 10
~º
0,0000
50,0000
100,0000
150,0000
200,0000
250,0000
300,0000
350,0000
0 1 2 3 4 5 6 7 8 9 10
0,0000
0,2000
0,4000
0,6000
0,8000
1,0000
1,2000
1,4000
1,6000
1,8000
0 1 2 3 4 5 6 7 8 9 10

Indicator Life cycle environmental impact
Aim Reduce the building's environmental life cycle impact
Benefit Diminishe harm to the environmentImprove natural environmental conditionsReduce raw materials exploitation
Methodology
Analyse alternatives? Comparative
Number of Alternatives
0
I1 - Solutions ClearI1 - Compare
GWP AP TPE EP ADP ODP POCP GWP AP TPE EP ADP ODP POCP0,5460 0,0031 8,4445 0,0002 0,0039 0,0000 0,0003 0,5460 0,0031 8,4445 0,0002 0,0039 0,0000 0,0003
~º Ground floor
0,0000
1,0000
2,0000
3,0000
4,0000
5,0000
6,0000
7,0000
8,0000
9,0000
0 1 2 3 4 5 6 7 8 9 10
~º
0,0000
0,0000
0,0000
0,0001
0,0001
0,0001
0,0001
0,0001
0,0002
0,0002
0 1 2 3 4 5 6 7 8 9 10
~º
0,0
500,0
1000,0
1500,0
2000,0
2500,0
3000,0
3500,0
4000,0
4500,0
0 1 2 3 4 5 6 7 8 9 10
0,0000
0,0100
0,0200
0,0300
0,0400
0,0500
0,0600
0,0700
0,0800
0,0900
0,1000
0 1 2 3 4 5 6 7 8 9 10

Indicator Life cycle environmental impact
Aim Reduce the building's environmental life cycle impact
Benefit Diminishe harm to the environmentImprove natural environmental conditionsReduce raw materials exploitation
Methodology
Analyse alternatives? Comparative
Number of Alternatives
0
I1 - Solutions ClearI1 - Compare
GWP AP TPE EP ADP ODP POCP GWP AP TPE EP ADP ODP POCP0,5460 0,0031 8,4445 0,0002 0,0039 0,0002 0,0003 292,0000 1,6640 4029,8 0,0892 2,1000 0,0000 0,1856
StructureRoof
0,0000
0,0005
0,0010
0,0015
0,0020
0,0025
0,0030
0,0035
0,0040
0,0045
0 1 2 3 4 5 6 7 8 9 10
~º
0,0000
0,0000
0,0000
0,0001
0,0001
0,0001
0,0001
0,0001
0,0002
0,0002
0,0002
0 1 2 3 4 5 6 7 8 9 10
~º
0,0000
0,5000
1,0000
1,5000
2,0000
2,5000
0 1 2 3 4 5 6 7 8 9 10
0,0000
0,0000
0,0000
0,0000
0,0000
0,0000
0,0000
0,0000
0 1 2 3 4 5 6 7 8 9 10

Indicator Life cycle environmental impact
Aim Reduce the building's environmental life cycle impact
Benefit Diminishe harm to the environmentImprove natural environmental conditionsReduce raw materials exploitation
Methodology
Analyse alternatives? Comparative
Number of Alternatives 0
I1 - Solutions ClearI1 - Compare
0,0000
0,0001
0,0001
0,0002
0,0002
0,0003
0,0003
0,0004
0,0004
0 1 2 3 4 5 6 7 8 9 10
~º
0,0000
0,0200
0,0400
0,0600
0,0800
0,1000
0,1200
0,1400
0,1600
0,1800
0,2000
0 1 2 3 4 5 6 7 8 9 10

Indicator: Certified products and responsible sourcing
Aim Improve sustainability of construction products by encouraging the use of responsible sourced and certified products
Benefit Aid recognise the relevance of low environmental impact materialsImproves supply chain sustainabilityReduces the home's environmental impact
Methodology
Analyse alternatives ? ComparativeNumber of Alternatives 2
Information
Level DescriptionLevel 1 Fulfil effort 1
Level 2 Fulfil effort 1 and effort 2 or 4
Level 3 Fulfil level 2 and at least one more effort
No.1
2
3
4
Solution or 1 2 3 41 yes yes yes yes 3 Level 3
2 no Level 1 1 Level 1
3 yes yes yes 2 Level 2
Obtained level
EffortWood or wood-based products certified by FSC, PEFC or similar (reused or reclaimed)
Manufacturers certified by ISO 14001 or EMAS, and OHSAS 1800
Manufacturers are certified with responsible sourcing schemes
Other products are certified with relevant and acknowledge certification systems (p. ex. Eco-label)
Select the efforts? Select level?
EffortTotal score
I2 Clear
0
1
2
3
0 1 2 3 4 5 6 7 8 9 10

Indicator Recycle and reuse of materials and components
Aim Improve sustainability of construction products by encouraging the reuse and use of materials with recycled content
Benefit Aid recognise the relevance of low environmental impact materialsImproves circular economyReduces the home's environmental impact
Methodology
Analyse alternatives ?
ComparativeNumber of Alternatives
0
Information
Level
Level 1Level 2Level 3
Solution 1 Solution 2
Materials/product Reused % of recycled content REF.
% recycled content NEEDED
% of recycled content REF.
% recycled content NEEDED
Glass fibre yes 0,00 75 no 0 100rock/mineral wool (35-100) yes 50,00 75 no 50 100glass wool (15-100) yes 80,00 75 no 80 80Rigid expanded polyurethane -Sandwich board (35-50)yes 0,00 75 0 5Laminated wood (exterior) yes 90,00 75 90 30Extruded polystyrene (XPS) yes 25,00 75 25Limestone Rock - Marble (2600-2800) yes 0,00 75 0rock/mineral wool (35-100) yes 50,00 75 no 50 100glass wool (15-100) yes 80,00 75 80Low density polyethylene yes 4,00 75 4Aluminum, 50% recycled yes 50,00 75 50 55rock/mineral wool (35-100) yes 50,00 75 no 50 55glass wool (15-100) yes 80,00 75 80Double glass-Uw (Wood frame-vertical) yes 30,00 75 30rock/mineral wool (100-180) yes 50,00 75 50Ceramic brick 20 cm yes 65,00 75 65Ceramic brick 11 cm yes 65,00 75 65Thermal brick of 29 cm ( Preceram ) yes 0,00 75 0Oriented Strand Board (OSB) - board yes 90,00 75 90
#N/A #N/A #N/A #N/A#N/A #N/A #N/A #N/A#N/A #N/A #N/A #N/A#N/A #N/A #N/A #N/A#N/A #N/A #N/A #N/A#N/A #N/A #N/A #N/A#N/A #N/A #N/A #N/A#N/A #N/A #N/A #N/A#N/A #N/A #N/A #N/A
45 75 45 28
Select level to attain Level 3 New corresponding level Level 2Achieved percentage 75% Achieved percentage 28%
Obtained level Level 3 Obtained level Level 2
Solution Solution 1 Solution 21 3 2
Oriented Strand Board (OSB) - board000000000
Performance Level
Thermal brick of 29 cm ( Preceram )
Limestone Rock - Marble (2600-2800)rock/mineral wool (35-100)glass wool (15-100)Low density polyethyleneAluminum, 50% recycledrock/mineral wool (35-100)glass wool (15-100)Double glass-Uw (Wood frame-vertical)rock/mineral wool (100-180)Ceramic brick 20 cmCeramic brick 11 cm
Extruded polystyrene (XPS)
Description
≥ 25 % of reference recycled content≥ 50 % of reference recycled content≥ 75 % of reference recycled content
Materials/product
Glass fibrerock/mineral wool (35-100)glass wool (15-100)Rigid expanded polyurethane -Sandwich board (35-50)Laminated wood (exterior)
Reused
0
1
2
3
0 1 2 3 4 5 6 7 8 9 10
1 2
I3 Clear

Indicator: Heat Island effect
Aim Reduce heat island effect through design
Benefit Reduce energy spent to conquer higher cooling needsImprove health in the surounding
Methodology
Analyse alternatives ?
ComparativeNumber of Alternatives
2
Information
Level Description
Level 1 One effort from the list should be implemented
Level 2 Two efforts from list should be implmented
Level 3 Three or more efforts should be implemented
No.
d1 (m) 2
d2 (m) 2,5
H (m) 6
Sb 0,75
WSt (m
2)Sp (m
2)As (m
2)Sa #DIV/0!
Agreen (m2)
Awater (m2)
Ap (m2)Apr #DIV/0!
Agreen (m2)
Aalb (m2)
As (m2)
Aalbr #DIV/0!
Agr (m2)
Acr (m2)
Ar (m2)Grr #DIV/0!
Agw (m2)
Acw (m2)
Aw (m2)Gwr #DIV/0!
Solution 1 2 3 4 Total Score Efforts selected
Obtained level1 Level 1 yes 1 1 Level 1
2 Level 2 yes yes 2 2 Level 2
3 Level 3 yes yes yes 3 ≥ 3 Level 3
Select level to attain
Efforts
3
The thermal impact on the surrounding area is reduced by choosing the appropriate surface cover
[1] Covering materials with gsunlight reflectivity are used for the ground surface.Ratio of area covered by high albedo materials: 40% or more
4
The thermal impact on the surrounding area is reduced by choosing the appropriate exterior materials (either [1] or [2] should implemented).
[1] Rooftop: Rooftop greening area ratio: 20% or moreOr roofing materials with good sunlight reflectivity and longwave radiation efficiency are selected: 20% or more
[2] Exterior wall surfaces: Ratio of green area to the total surface area of the exterior wall surfaces facing east, west, and south: 20% or moreOr exterior wall materials with good sunlight reflectivity and longwave radiation efficiency: 20% or more
1
Some measures have been taken to reduce the thermal impact on the surrounding area so as to ensure smooth ventilation in the neighbourhood.
[1] The building is set back in response to the prevailing wind direction in summer. Ratio of setback from the site boundary to the building height: 30% or more
2
The thermal impact on the surrounding area is reduced by maintaining a green area (including water surfaces) at the site (either [1] or [2] should be implemented).
[1] Efforts have been made to create as much shade from the sun as possible at the site by arranging medium-height/tall trees, piloti, eaves, or pergolas.Lateral projecting area: 20% or more
[2] Rise of temperature on or near the ground surface is mitigated by arranging lawns, grass, shrubs, or ponds and covering materials with good water retainability, water permeability are used for the ground surface.Permeable area ratio: 40% or more
Effort Auxiliar Calculations
0
1
2
3
4
0 1 2 3 4 5 6 7 8 9 10
I4 Clear

Indicator Energy Efficiency
Aim Improve the buildings energy efficiencyReduce environmental impacts arising from its use
Benefit Improve the buildings life cycle environmental impactsReduce costs associated with energy consumptionImproving life quality
Methodology
I15.1 Energy Needs
Analyse alternatives ? Comparative
Number of Alternatives 1
Input
Go to :
Need Delivered Renewable Primary
Solution Need (kWh/m2.year)
Delivered (kWh/m2.year)
Renewable (kWh/m2.year)
Primary (kgoe/m2.year)
Need (kWh/m2.year)
Delivered (kWh/m2.year)
Renewable (kWh/m2.year)
Primary (kgoe/m2.year)
Need (kWh/m2.year)
Delivered (kWh/m2.year)
Renewable (kWh/m2.year)
Primary (kgoe/m2.year)
1 25 27 0 27 15 16 0 15 5 7 8 62 12 13 5 13 9 10 0 10 4,5 5 3,5 5
I15.2 Local Production
Analyse alternatives ? Comparative
Number of Alternatives 1
Input
Level
Level 1
Level 2
Level 3
Solution Er (kWh/m2.year) QTp (kWh/m
2.year) NIA (m2) MDHW (L) QDHW (kWh/year)QDHW’
(kWh/m2.year) QTp’ (kWh/m
2.year)
1 8 94,98 128 108 1605 13,20 114 Level 1 1
2 8,5 52,30 128 89 1322 10,87 63 Level 2 2
Obtained levelPerformance
Level
Description
Er > 50% of QDHW’
75% of QDHW’ ≤ Er < QTp’
Er ≥ QTp’
DHW - Energy
http://www.onesource.pt/sbsteel/site/
Carry out the energy assessment and retrieve the following
Heating - Energy Cooling - Energy
I5 Clear
25
12
15
9
5
4,5
0
5
10
15
20
25
30
35
40
45
50
1 2
-(
/2
)
27
13
15
10
6
5
0
10
20
30
40
50
60
1 2
-(
/2
)
0
1
2
3
0 1 2 3 4 5 6 7 8 9 10

Indicator Water Efficiency
Aim To reduce potable water use through the implementation of efficient fittings and water reuse and recycle systems
Benefit Reduces costs with water billsReduces amount of produced waste water sewageMinimises environmental impact of operational phase by preserving valuable resources
Methodology
Analyse alternatives ?
ComparativeNumber of Alternatives
1
Information
Water flow (Q) according to water efficiency performance levels for water consumption devices (l/min)
LevelLevel 1Level 2 Fulfil effort 1 and effort 2 or 3Level 3 Fulfil the three efforts
No.12 Check for ANQIP recommendations3 Check for ANQIP recommendations
Solution 1 2 31 Level 2 KO yes yes 2 22 Level 3 KO yes yes yes 3 3
Device porpostion in the home Q U t
Washbasin 1 6 10 6Kitchen sink 1 7 1 7Toilet flush 1 7 6 1Shower 1 5 0,7 5Dishwasher 1 20 0,12 1Washing machine 1 85 0,15 1
WU 176,5 m3/person.year
Description
Performance LevelDesired performance level
Effort
Total scoreEffort
Reuse of rainwaterReuse of greywater
Use of water-saving fittings
Fulfil effort 1
I6 Clear
0
1
2
3
4
0 1 2 3 4 5 6 7 8 9 10
Performance level Washbasin Kitchen sink Toilet flush1 Shower A+ Q ≤ 2,0 Q ≤ 4,0 5,0 (for A++ its 4,0) Q ≤ 5,0 A 2,0 < Q ≤ 4,0 4,0 < Q ≤ 6,0 6,0 5,0 < Q ≤7,2 B 4,0 < Q ≤ 6,0 6,0 < Q ≤ 9,0 7,0 7,2 < Q ≤9,0 C 6,0 < Q ≤ 9,0 9,0 < Q ≤ 12,0 9,0 9,0 < Q ≤15,0 D 9,0 < Q ≤ 12,0 12,0 < Q ≤ 15,0 - 15,0 < Q ≤30,0
1 Nominal volume (l). If the toilet has a interrupter for flushing consider one level below the one given and if it is complete please consider two levels below.

Indicator: Waste reduction
Aim To provide sufficient interior and exterior waste disposal and storage to promote waste recycling thus reducing landfilled waste.
Benefit
Addtional recommendations Reduce construction waste
Methodology
Analyse alternatives ?
ComparativeNumber of Alternatives
1
Information
Level Description
Level 1 Two efforts from the list should be implemented
Level 2 Three efforts from list should be implmentedLevel 3 Four or more efforts should be implemented
No.
Directions for implementing a dedicated composting external facilities: - Located in a dedicated position. - Easily accessible to all users. - Integrated within the design of the home achieving reduced visual impact. - Storage locations are durable, low maintenance and cleanable.
Solution 1 2 3 4 5
1 Level 3 5 yes yes yes yes yes 5 32 Level 2 2 yes yes yes 3 2
Score Performance Level
2
Household waste recycling is promoted by planning at least one decicated location for waste bins in the house internal space. If only one space is provided it should be in the kitchen (close to the non-recyclable waste bin) or located adjacent to the kitchen, e.g. in a utility room or connected garage.
[1] Provide waste containers corresponding to the number of recycling streams given by the authorities or, if none is said, at least three individual recycling bins (paper, glass and packaging) Volume: 15 L or more, each (at least 18 L/hab total)
Obs.: The internal recycling bins should be located in a dedicated non-obstructive position.
3Household waste recycling is improved by planning addicitonal measures
[1] Planning a reservoir for storage of vegetable oils (oil storage container).
Se possivel apresentar ideias possiveis/ exemplos
4 [2] Planning a reservoir for storage of used batteries (used batteries container)
[2] Adequate internal container space (large enough to hold at least a 7L container), for storing segregated compostable organic material in the kitchen.
5
Organic household waste recycling is promoted through provision of decidated external facilities for storage or composting of household compostable waste (either [1] or [2] should implemented).
[1] Provide external composting facilities
Desired performance levelEffort
Effort
1Local authority for waste collection was been consulted to identify the waste collection patterns and design accordingly. (implement [2] if [1] is obtained).
[1] The building design will incorporate an external location suitable for waste collection and storage, according to the given number of recyclable streams, type and size od waste collection containers[2] The individual containers should have at least 40 L each (6,5 L/hab) and at least a total of 28 L/hab
I7 Clear
0
1
2
3
4
0 1 2 3 4 5 6 7 8 9 10
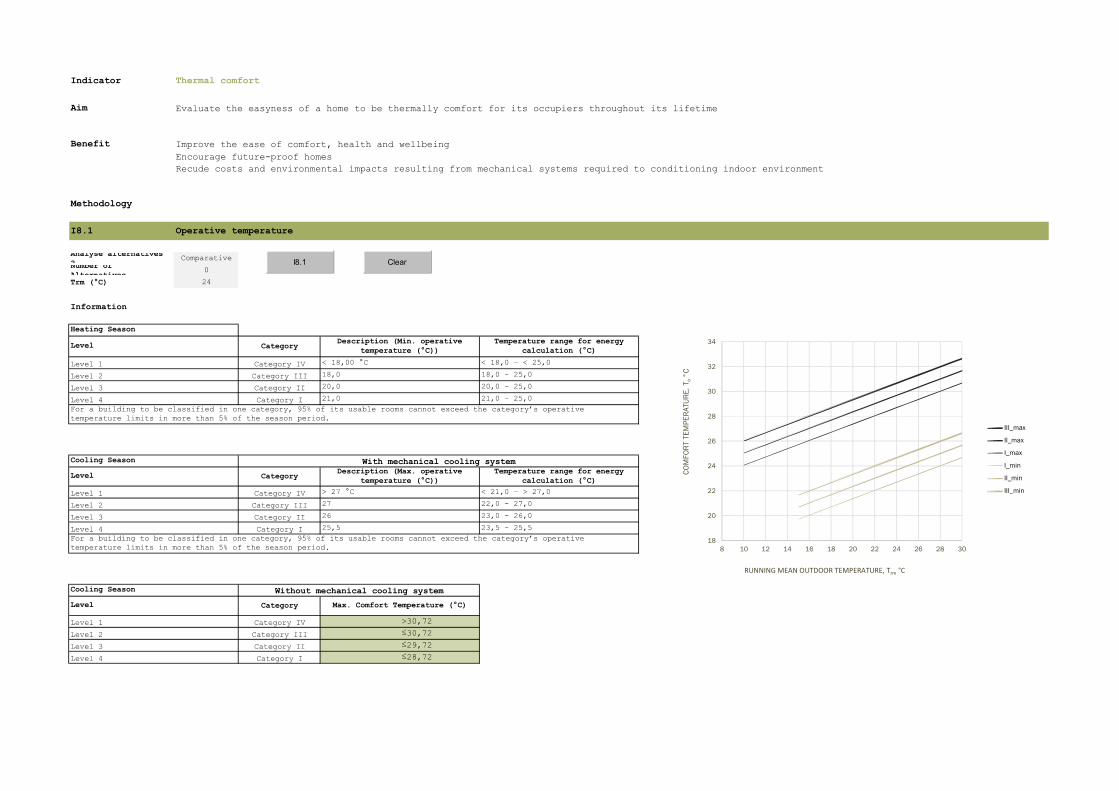
Indicator Thermal comfort
Aim Evaluate the easyness of a home to be thermally comfort for its occupiers throughout its lifetime
Benefit Improve the ease of comfort, health and wellbeing Encourage future-proof homesRecude costs and environmental impacts resulting from mechanical systems required to conditioning indoor environment
Methodology
I8.1 Operative temperature
Analyse alternatives ?
ComparativeNumber of Alternatives
0
Trm (°C) 24
Information
Category
Category IV < 18,00 °C < 18,0 – < 25,0
Category III 18,0 18,0 – 25,0
Category II 20,0 20,0 – 25,0
Category I 21,0 21,0 – 25,0
Category
Category IV > 27 °C < 21,0 – > 27,0
Category III 27 22,0 - 27,0
Category II 26 23,0 - 26,0
Category I 25,5 23,5 - 25,5
Category
Category IV 30,7 >30,72Category III 30,7 ≤30,72Category II 29,7 ≤29,72Category I 28,7 ≤28,72Level 4
Level 2Level 1
Level Max. Comfort Temperature (°C)
Heating Season
Level
Level 1Level 2Level 3Level 4For a building to be classified in one category, 95% of its usable rooms cannot exceed the category’s operative temperature limits in more than 5% of the season period.
With mechanical cooling system
Cooling Season Without mechanical cooling system
Level 3
Temperature range for energy calculation (°C)
Description (Min. operative temperature (°C))
Description (Max. operative temperature (°C))
Temperature range for energy calculation (°C)
For a building to be classified in one category, 95% of its usable rooms cannot exceed the category’s operative temperature limits in more than 5% of the season period.
Level
Level 1Level 2Level 3Level 4
Cooling Season
I8.1 Clear
18
20
22
24
26
28
30
32
34
8 10 12 14 16 18 20 22 24 26 28 30
COM
FORT
TEM
PERA
TURE
, To
°C
RUNNING MEAN OUTDOOR TEMPERATURE, Trm °C
III_max
II_max
I_max
I_min
II_min
III_min

Indicator Thermal comfort
Aim Evaluate the easyness of a home to be thermally comfort for its occupiers throughout its lifetime
Benefit Improve the ease of comfort, health and wellbeing Encourage future-proof homesRecude costs and environmental impacts resulting from mechanical systems required to conditioning indoor environment
Methodology
I8.2 Vertical air temperature difference
Analyse alternatives ?
ComparativeNumber of Alternatives
0
Information
Category
Category IVCategory IIICategory IICategory I
Solution or1 yes Level 4 3 3 Level 2 2
I8.3 Floor surface temperature range
Analyse alternatives ?
ComparativeNumber of Alternatives
0
Information
Category
Category IV < 17 - > 31
Category III 17 - 31
Category II and I 19 - 29
Solution or1 yes Level 2 18,5 18,5 Level 2 2
Obtained level Performance LevelSpecify temperature ?
Select Performace level?
Floor surface temperature (°C)
Floor surface temperature (°C)
Level
Performance LevelSelect
Performace level?
Specify difference ?
Vertical air temperature
difference (°C)Obtained level
Vertical air temperature
difference (°C)
> 4 °C
Air temperature difference (°C)
Level 4Level 3Level 2 < 4 °C
< 3 °C
< 2 °C
Floor surface temperature range (°C)
Level
Level 1Level 2Level 3
Level 1
0
1
2
3
4
0 1 2 3 4 5 6 7 8 9 10
I8.2 Clear
I8.3 Clear
0
1
2
3
0 1 2 3 4 5 6 7 8 9 10
1

Indicator Thermal comfort
Aim Evaluate the easyness of a home to be thermally comfort for its occupiers throughout its lifetime
Benefit Improve the ease of comfort, health and wellbeing Encourage future-proof homesRecude costs and environmental impacts resulting from mechanical systems required to conditioning indoor environment
Methodology
I8.5 Radiant temperature asymmetry
Analyse alternatives ?
ComparativeNumber of Alternatives
0
Information
Level Category Warm ceiling Cool wall Cool ceiling Warm wall
Level 1 Category IV > 7 > 13 > 18 > 35
Level 2 Category III < 7 < 13 < 18 < 35
Level 3 Category II and I < 5 < 10 < 14 < 23
Solution Warm ceiling Cool wall Cool ceiling Warm wall Warm ceiling Cool wall Cool ceiling Warm wall1 yes yes yes yes 2
Solution Warm ceiling Cool wall Cool ceiling Warm wall Warm ceiling Cool wall Cool ceiling Warm wall1 Level 2 Level 2 Level 2 Level 2 2 0 0 0
Solution Warm ceiling Cool wall Cool ceiling Warm wall Warm ceiling Cool wall Cool ceiling Warm wall1 Level 3 Level 3 Level 3 Level 3 3 3 3 3
Obtained level: Performance Level
Select Performace level?
Specify rate ? Temperature asymetry (°C)
Temperature asymmetry (°C)
I8.5 Clear
0
1
2
3
0 1 2 3 4 5 6 7 8 9 10

Indicator: Visual comfort
Aim Promote the access to daylight, improving inhabitants' wellbeing and life quality and reducing costs and energy spent with artificial lighting
Benefit Improve comfort, health and wellbeing Reduce costs and environmental impacts resulting from artificial lighting solutions
Methodology
I9 Visual comfort
Analyse alternatives ? ComparativeNumber of Alternatives 2
Information
Level
Level 2Level 3
Obs.: If additional effor is added, the next level is rewarded.
Solution or Select level? Kitchen Living rooms Bedroom Additional effort Obtained level
1 no Level 1 yes Level 1 12 yes 3% 4,0% 3% yes Level 4 43 yes 3% 3,0% 2% yes Level 3 3
DescriptionADF should be at least:· 2.0% in kitchens;· 1.5% in living rooms;· 1.0% in bedrooms
Level 4
Level 1
Introduce ADF value?
ADF Performance Level
All rooms should have an ADF of at least 2%All rooms should have an ADF of at least 3%All rooms should have an ADF of at least 3%And at least 80% the working plane in kitchen and living rooms receives direct light from the sky.
0
1
2
3
4
0 1 2 3 4 5 6 7 8 9 10
I9 Clear

Indicator: Acoustic comfort
Aim Promote the adoption of low sound level solutions, reducing noise disturbance from inside and outside born sounds.
Benefit Improve comfort, health and wellbeing Aids cohesion between neighbours
Methodology
I10.1 Insulation index for exterior airborn noise
Analyse alternatives ?
SingleNumber of AlternativesZone Mixed
Information
LevelLevel 1Level 2Level 3
Solution or D2m,nT,w (dB) D2m,nT,w (dB) Obtained level Performance Level1 no Level 2 36 dB ≤ D2m,nT,w < 39 dB Level 2 2
I10.2 Sound insulation levels for internal walls and floors
Analyse alternatives ?
SingleNumber of Alternatives
0
Information
LevelLevel 1Level 2Level 3
Solution or DnT,W (dB) DnT,w (dB) Obtained level Performance Level1 no Level 2 45 ≤ DnT,W < 48 Level 2 2
I10.3 Internal noise (Indoor weighted sound pressure level (LAR,eq)
Analyse alternatives ?
SingleNumber of Alternatives
0
Information
Living rooms BedroomsLevel 1 40 dB (A) ≤ LAReq < 36 dB(A) 35 dB (A) ≤ LAReq < 30 dB(A)Level 2 36 dB (A) ≤ LAReq < 32 dB(A) 30 dB (A) ≤ LAReq < 25 dB(A)Level 3 LAReq ≤ 32 dB(A) LAReq ≤ 25 dB(A)
Solution or LAR (dB(A)) LAR eq (dB(A)) Obtained level Performance Level1 no Level 2 Living rooms 36 dB (A) ≤ LAReq < 32 dB(A) Level 2 2
Bedroom(s) 30 dB (A) ≤ LAReq < 25 dB(A)
LevelDescription
Specify LAR values? Select Performace level?
Description43 ≤ DnT,W < 4545 ≤ DnT,W < 48DnT,W ≤ 48
Specify Rw value? Select Performace level?
DescriptionD2m,nT,w (dB) greater than the minimum legal value (33 dB mixed zone; 28 dB D2m,nT,w (dB) at least 36 dB and less than 39 dBD2m,nT,w (dB) at least 39 dB
Specify D2m,nT,w value? Select Performace level?
0
1
2
3
0 1 2 3 4 5 6 7 8 9 10
I10.1 Clear
I10.2 Clear
I10.3 Clear
0
1
2
3
0 1 2 3 4 5 6 7 8 9 10
0
1
2
3
0 1 2 3 4 5 6 7 8 9 10
( ( , )

Indicator: Indoor air quality
Aim Improve indoor health and wellbeing by avoiding the emission of air pollutants from the building
Benefit Reduce exposure to air pollutantsRaise awareness to indoor pollutants in furnishing and cleanin products
Methodology
I11 Airborne Emissions
Analyse alternatives ?
ComparativeNumber of Alternatives
2
Information
Level DescriptionLevel 1 Two efforts from list should be implemented
Level 2 Three efforts should be implemented
Level 3 Four or more efforts should be implemented
No.
1
2
3
4
5
Solution or 1 2 3 4 51 yes yes yes 2 2 Level 1 1
2 Level 2 2 Three efforts should be implemented Level 1 1
3 yes yes yes yes yes 4 4 Level 3 3
Performance Level
Effort
Manufacturers certified by ISO 14001 or EMAS, and OHSAS 1800
A formaldehyde content not greater than 0.06 mg/m3Flooring materials
Ceiling. Walls and insulation materials
Interior adhesives & sealants
Wood-based products have a E1 classification according to EM 13986 (formaldehyde concentration ≤ 8mg/100g or 0.08 mg/m
Obtained levelEffort
Total scoreSelect the efforts? Select level? Effot Selected
0
1
2
3
0 1 2 3 4 5 6 7 8 9 10
I11 Clear

Indicator: Space efficiency
Aim Improve internal space quality and efficacy for the desired functions
Benefit Improves occupaiers wellbeing and comfortHelp in achieving life proofing homes
Methodology
I12.1 Use of available area
Analyse alternatives ?
ComparativeNumber of Alternatives
2Construction technology
Light steel framing
Information
AA 352 (m2)GEAmax 159 (m2)NO 4 (-)ILUmax 0,2 (-)
LevelLevel 1 48,00% < NUA/GEA ≤ 54,00%
Level 2 54,00% < NUA/GEA ≤ 67,00%
Level 3 NUA/GEA > 67,00%
NIA WA nUA
Solution NUA (m2) NUA/GEA Obtained Level Performance Level (m2) (m2) (m2)
1 86,32 54,29% Level 2 2 117,97 41,03 31,65
Change NUA? Performance Level
2 108 68% Level 3 3 max 131,06 27,94 23,06
min 120,48 38,52 12,48
I12.2 Area availability per occupant
Analyse alternatives ?
ComparativeNumber of Alternatives
0
Information
LevelLevel 1 ≥ 18,08 (m2/p)Level 2 ≥ 20,76 (m2/p)Level 3 ≥ 25,60 (m2/p)
NUA NUA/pSolution (m2) (m2/p)
1 108 27 Level 3 3
Additional data
Description
Description
Obtained Level Performance Level
I12.1 Clear
I12.2 Clear

Indicator: Adaptability
Aim Improve indoor health and wellbeing by avoiding the emission of air pollutants from the building
Benefit Extend building life cycle, thus reducing environmental life cycle impactImprove occupiers comfortAvoid expensive retrofit measures through improvement of design for life
Methodology
I13.1 Flexibility provision
Analyse alternatives ? ComparativeNumber of Alternatives 1
Information
LevelLevel 1 TC ≤ 33%Level 2 33% < TC < 67%Level 3 TC ≥ 67%
1
or TCyes Level 2 66% Level 2 2
Score
Separation of funtions 1
Integration of functions with the same life cycle into one elements 0,6
Integration of functions with the different life cycle into one elements 0 0,8
Modular zoning 0
Planned interpenetration of installations and load-bearing elements 0,8Unplanned interpenetration of installations and load-bearing element by provision of a free zone 0,2 0,5
Components 0
Elements/components 0
Elements 0,6
Materials/elements/components 0 0,6
Clustering according to function 1
Clustering according to material life cycle 0
Clustering for fast assembly 0 1
Parallel – open assembly 1
Stuck assembly 0
Base element in stuck assembly 0 1
Component/component 0
Component/element 0,8
Element/component 0
Element/element 0
Material/component 0,3 0,55
Accessory external connection 0
Direct connection with additional fixing devices 0
Direct integral connections with inserts 0,6
Accessory internal connection 0,4 0,5
Accessible 0
Accessible with additional operations causing no damage 0
Accessible with additional operations causing reparable damage 0,6
Accessible with additional operations causing partly damage 0,4 0,5
2
or TCyes Level 2 62% Level 2 2
Score
Separation of funtions 0
Integration of functions with the same life cycle into one elements 0
Integration of functions with the different life cycle into one elements 0,1 0,1
Modular zoning 0
Planned interpenetration of installations and load-bearing elements 0,8Unplanned interpenetration of installations and load-bearing element by provision of a free zone 0 0,8
Components 0
Elements/components 0,8
Elements 0
Materials/elements/components 0 0,8
Clustering according to function 1
Clustering according to material life cycle 0
Clustering for fast assembly 0 1
Parallel – open assembly 1
Assembly
0,667
0,333
0,333
Interfaces
Material Level
Connections 0,667
Structure and materials
Functional dependence
Functional separation
Accessibility to fixing and intermediary
Type of connection
Assembly sequences regarding material levels
Assembly direction based on assembly type
0,5
0,5
0,43
0,56
0,5
Description
Obtained Level Performance Level
0,5
0,44
0,56
Low transformation capacity. Medium disassembly capacity. High disassembly capacity
Solution
Select efforts? Select level?
Effort
Functional decomposition
Systematisation
Clustering
Solution
Select efforts? Select level? Obtained Level Performance Level
Effort
Material Level
Functional decomposition 0,667
Functional separation 0,56
Functional dependence 0,44
Systematisation 0,333
Structure and materials 0,5
Clustering 0,5
Assembly direction based on
I13.1 - Solutions ClearI13.1 - Compare
0
1
2
3
4
0 1 2 3 4 5 6 7 8 9 10

Indicator: Adaptability
Aim Improve indoor health and wellbeing by avoiding the emission of air pollutants from the building
Benefit Extend building life cycle, thus reducing environmental life cycle impactImprove occupiers comfortAvoid expensive retrofit measures through improvement of design for life
Stuck assembly 0
Base element in stuck assembly 0 1
Component/component 1
Component/element 0
Element/component 0
Element/element 0
Material/component 0 1
Accessory external connection 0
Direct connection with additional fixing devices 0
Direct integral connections with inserts 0
Accessory internal connection 0,4 0,4
Accessible 0
Accessible with additional operations causing no damage 0
Accessible with additional operations causing reparable damage 0,6
Accessible with additional operations causing partly damage 0 0,6
Solution1 Level 2 22 Level 2 22 Level 2 2
I13.2 Adaptability capacity
Analyse alternatives ? ComparativeNumber of Alternatives 1
Information
LevelLevel 1Level 2Level 3Level 4
Internal Fixed Area - IFA Net Internal Area - NIA Gross External Area - GEA Solution or (m2) (m2) (m2) (%)
1 no Level 2 40 200 240 - Level 2 2
Performance Level
Insert data in m2 or percentage of the site areaPerformance
LevelObtained Level
Global Adataptable Space - % of NIA/GEA
Add areas? Select level?
Description
Obtained Level
50% ≤ GSA < 75 % of NIA/GEAGSA ≥ 75% of NIA/GEA
GSA < 25 % of NIA/GEA25% ≤ GSA < 50 % of NIA/GEA
Interfaces
Assembly 0,333
Assembly direction based on assembly type 0,56
Assembly sequences regarding material levels 0,43
Connections 0,667
Type of connection 0,5
Accessibility to fixing and intermediary 0,5
I13.2 Clear
0
1
2
3
4
0 1 2 3 4 5 6 7 8 9 10

Indicator: Design for all
Aim Provide space that is accessible to all
Benefit Improve homes accessibility to allPromotes future-proof homes against adaptation measuresPromotes inhabitants wellbeing
Methodology
Analyse alternatives ? Comparative
Number of Alternatives 1
Information
LevelLevel 1Level 2Level 3Level 4
Note:
Solution or Bathrooms Kitchen Rooms Corridors Totali Bathrooms Kitchen Rooms Corridors Totali Total1 yes 50% 100% 100,0% 100% 88% 50% 100% 100% 63% 150% 150% Level 3 32 Level 4 0% 0% 0% - Level 4 4
Description25% ≤ PAa < 50% according to ISO 21542:2011 requirements50% ≤ PAa < 75% according to ISO 21542:2011 requirementsPAa ≥ 75% according to ISO 21542:2011 requirementsFollow design for all requirements
Insert the % of rooms in the home forseen to be accessible (housing porpotion. For instance if a home has 2 bathrooms, one is accessible trhough ISO and the other is not, add 50% in the second column)
Specify accessible areas?
Performance Level
% accessible space(ISO standard)Select level?
% accessible space(design for all) PA's Obtained Level
I14 Clear
0
1
2
3
4
0 1 2 3 4 5 6 7 8 9 10

Indicator: Maintainability
Aim Pormote maintenance planning
Benefit Reduces the impact of householding maintenanceReduce buidligns life cyle environmenal impacts and costs
Methodology
I15.1 Cleanning necessities
Analyse alternatives ?
ComparativeNumber of Alternatives
1
Information
LevelLevel 1Level 2Level 3Level 4
Solution or Pga (%) Does it have catwalks or ladders?
Pga (%) Obtained level Performance Level
1 no Level 2
Less than 90% of external glass surface is easily accessible and
the rest have catwalks or ladders.
- -
2 yes 80 yes 80 Level 2 2
I15.2 Maintenance planning and commissioning
Analyse alternatives ?
ComparativeNumber of Alternatives
1
Information
Level
Level 1 Effort n. 1 will be implemented
Level 2 Effort n. 2 will be implemented
Level 3 Effort n. 3 will be implemented
No.1
2
3
Solution or 1 2 3
1 Level 2 -- - -
2 yes yes yes yes 3 Level 3 3
I15.3 Ease of Maintenance
Analyse alternatives ?
ComparativeNumber of Alternatives
1
Information
Level
Level 1 Two effort will be implemented
Level 2 Three efforts will be implemented
Level 3
No.
1
2
3
4 Openings for inspection
5 Building systems
Solution or 1 2 3 4 51 yes yes yes 2 Level 1 12 Level 3 no no no no no 3 Level 2 2
Performance LevelTotal score
EffortObtained level
[1] Different openings will be crates to ease cleaning and inspection[1] Technical areas will be planned to facilitate the access to building systems will be planned to ease future maintenance
[1] Easy access to roof and/or terraces will be created for maintenance activities
Select the efforts? Select level?
Access to specific areas [2] Load-bearing primary structure will be made easily accessible or after removing attached components for maintenance activities
[3] Supply networks will not be buried and mixed allowing easy access and replacement
Four or more efforts will be implemented
Effort
Performance Level
EffortObtained levelEffot Selected
Description
Select the efforts? Select level?
A plan will to key systems and building elements will be established
A detailed plan that identifies inspection schedules’, defines specific measures, record of maintenance operation is to be prepared and provided with the
Key systems are identified, maintenance measured are defined and a plan is defined and prepared to be given to the usersAll systems and components are detailed and a plan is prepared accounting for the recommendations given in the supplementary
Description
Specify Percentage of glass surface easily
accessible for cleaning?Select Performace level?
EffortA general guideline will be developed
DescriptionMore than 10% of the external glass surface is not easily accessible (basket cranes, climbing belts Less than 90% of external glass surface is easily accessible and the rest have catwalks or ladders. More than 90% of external glass surface is easily accessible and the rest have catwalks or ladders. All the glass area is easily accessible for cleaning
0
1
2
3
4
0 1 2 3 4 5 6 7 8 9 10
I15.1 Clear
I15.2 Clear
I15.3 Clear
0
1
2
3
0 1 2 3 4 5 6 7 8 9 10
0
1
2
3
0 1 2 3 4 5 6 7 8 9 10

Indicator Efficient land use
Aim Promote efficient use of the site, ensure maintenance, improvement and protection of its ecological value
Benefit Minimises the building environmental impactAvoids the use of non-used soil, valorizing the one already developedValorizes rehabilitation works
Methodology
I16.1 Reuse of previously built or contaminated land
Analyse alternatives ?
ComparativeNumber of Alternatives
1
Information
Level Description
Level 1
Level 2
Level 3 PPDA ≥ 75%
Solution IA (%) = IA/AA PDA (%) = PDA/AA
1 100 50 28% 14% 50% Level 2 22 120 50 34% 14% 42% Level 1 1
I16.2 Implementation efficiency
Analyse alternatives ?
ComparativeNumber of Alternatives
1
Information
Level Description
Level 1 25% of IEL ≤ IEi < 50 % of IELLevel 2 50% of IEL ≤ IEi < 75 % of IELLevel 3 IEi ≥ 75% of IEL
Gross External Area - GEA Number of Occupants - No Allotment Area - AA Total Deployment Area - TDA Occupation Density - OD Land Use Index - ILU Soil Occupation Index - I Implementation Efficiency - IEi ILUmax Min. Occupation Density - ODminLegal Implementation Efficiency - IE
Solution (m2) (occupant) (m2) (m2) (occupant/m2) (-) (-) (m2/occupant) (-) (occupant/m2) (m2/occupant)1 150 4 150 200 0,03 1,00 1,33 38 0,2 23 0,0088 Level 3 32 120 4 150 150 0,03 0,80 1,00 24 0,2 23 0,0088 Level 3 3
I16.3 Soil permeability
Analyse alternatives ?
ComparativeNumber of Alternatives
1
Information
Level Description
Level 1 25% ≤ SPi < 50 %
Level 2 50% ≤ SPi < 75 %
Level 3 SPi ≥ 75%
Soil Permeability index - SPi Soil sealing percentage - IimpSolution Add areas? or Select Performace level? m2 % of site m2 % of site m2 % of site (-) (%)
1 yes 100 28,41% 50 14,20% 50 14,20% 0,4 64% Level 1 12 Level 3 0,00% 0,00% 0,00% - - Level 3 3
I16.4 Native flora species
Analyse alternatives ?
ComparativeNumber of Alternatives
1
Information
Level Description
Level 1 Effort n. 1 will be implemented
Level 2 Two efforts will be implmented
Level 3 The 3 efforts will be implmented
No.
1 Efforts are made to ensure continuity of existing greenery
Efforts will be made to promote local fauna and flora development, for e.g.:
Solution Select level? or Choose Effort? 1 2 3 Total Obtained level Performance Level
1 Level 2 0 Level 2 22 yes yes yes yes 3 Level 3 3
Efforts
Permeable area - Ap Semi-permeable area - Asp Impermeable area - Aimp
Effort
porous materials are effectively used to allow small animals to live and grow.
maintain watering areas for wild birds to drink water or bathe
ensure spaces for wild birds to hide or nest
3
2 Efforts are made to ensure that new greenery corresponds to native plant species (at least 30% of green area should be filled with native species)
25% ≤ PPDA < 50 % 50% ≤ PPDA <75 %
% of siteInterventioned Area - IA (m2)
Previously Developed Area - PDA (m2)
Obtained level Performance Level
ensure trees to feed wild birds
Percentage of Previously Developed
Area - PPDA (%)Obtained level Performance Level
Obtained level Performance Level
0
1
2
3
4
0 1 2 3 4 5 6 7 8 9 10
0
1
2
3
0 1 2 3 4 5 6 7 8 9 10
0
1
2
3
4
0 1 2 3 4 5 6 7 8 9 10
0
1
2
3
0 1 2 3 4 5 6 7 8 9 10
I16.1 Clear
I16.2 Clear
I16.3 Clear
I16.4 Clear

Indicator: Cultural value
Aim Promote the preservation of the local identify
Benefit Minimises the building environmental impactPromots social cohesion and well beingPreserves cultural heritage
Methodology
Analyse alternatives ?
ComparativeNumber of Alternatives
1
Information
LevelLevel 1
Level 2
Level 3
No.
2
3
Solution or 1 2 31 yes yes yes yes 3 3 Level 3 3
2 Level 2 2 Two efforts will be implemented
Level 2 2
Performance Level
Select the efforts?
Select level?
Total score Effort Selected Obtained
level
One effort will be implemented
Description
Two efforts will be implemented
The three efforts will be implemented
Effort
1
Effort
Conversation of local character, history and culture
Integration with surrounding landscape through positioning and design of the building
Conservation of historic landscape
[1] Conservation of historic built spacesHistoric interior or exteriors spaces will be preserved, restored or regenerated[2] Use of locally-significant materialsLocal materials will be partially used in the building's (structure, interior finishes or exterior spaces)
Building features will be designed in harmony with surrounding landscape
Historic landscape is maintained will be conserved, restored or recreated of the exterior of historic buildings and the existing natural environment the area
0
1
2
3
0 1 2 3 4 5 6 7 8 9 10
I17 Clear

Indicator Passive Design
Aim To provide passive design mesuures to reduce energy demand and promote comfort, through the integration with clime and local conditions
Benefit Promote comfort without energy consumption
Methodology
I18.1 Orientation
Analyse alternatives ? Comparative
Number of Alternatives 1
Information
Level Description 135,0Level 1 > 75% and ≤ 100% of South angle 146,3Level 2 > 50% and ≤ 75% of South angle 146,3Level 3 157,5Level 4 ≤ 25% of South angle 168,8
191,3202,5
Min 135 213,8Mean 180 225,0Max 225
Solution Orientation Degree1 South 180 Level 4 42 South 135 Level 1 1
I18.2 Design and Shape
Analyse alternatives ? Single
Number of Alternatives 1
Geographic ZoneWinter climatic zone
Information
Level DescriptionLevel 1 ≥ 75% and < of reference U-valueLevel 2 ≥ 50% and < 75% of reference U-valueLevel 3 ≥ 25% and < 50% of reference U-valueLevel 4 < 25% of reference U-value
Solution 1
Thickness (mm) R (m2K/W) U [W/m2K]120 0,92 0,39130 3,1040 0,078 0,01
130 0,52
Thickness (mm) R (m2K/W)120,00 0,92 0,22300 7,14100 2,508 0,01
300 1,20Ceramic tile/mosaicPlasterboard
Glass fibreCeramic tile/mosaicPlasterboard
Ground floor
rock/mineral wool (35-100)
Autonomous regionsI2
Performance LevelObtained Level
Oriented Strand Board (OSB) - Expanded polystyrene (EPS) (13-15)
South Angle by Level
South angle range (º)
> 25% and ≤ 50% of South angle
Level 1
Level 3
Level 3
Level 1
Level 2
Level 4
Level 2
Orientation
Exterior wallOriented Strand Board (OSB) - Expanded polystyrene (EPS) (13-15)
Envelope U-value
0
1
2
3
4
0 1 2 3 4 5 6 7 8 9 10
I18.1 Clear
I18.2.1 - Solutions Clear
0
1
2
3
4
0 1 2 3 4 5 6 7 8 9 10
I18.2.1 - Compare

Indicator: Life Cycle Costs
Aim Promote reduction of building costs
Benefit Improve awareness for costs other than investment costsPromote sustainable building that cost the same as conventialPromete building with lower operational costs than conventional
Methodology
I19.1 Investment costs
Information
LevelLevel 1Level 2Level 3
Obtained level
150000 943,40 Level 2
I19.2 Operational Costs
Input
RSP (years) 50Interest rate (%) 0,11%
NIA (m2) 1
Eheat (kWh/m2.year) 6 WU (m3/p.year) 8,03
Ecool (kWh/m2.year) 4,2 WUreused (m3/p.year) 0
EDHW (kWh/m2.year) 16,9 Tw (€/m3) 0,61
Esolar (kWh/m2.year) 7,7 Tww (€/m3) 5,32
Eren (kWh/m2.year) 0 TMW (€/m3) 3,036
Theat (€/kWh) 0,06Tcool (€/kWh) 0,17TDHW (€/kWh) 0,06Tren (€/kWh) 0
Preview maintenance? yes
N. of items to include? 1
Cost (€/unit) Frequency (every #years) NR MCj (€/year)
M 1 100 5 9 5,6M 2 2000 15 2 25,1
Total 30,7
Results
EC (€/m2.year) 1,56
WC (€/m2.year) 287,99MC (€/m2) 30,75
OC (€/m2) 14113,47
LCC (€/m2) 15056,9
I19.3 End of Life Costs
Information
yes
EoL is an important parcel of a building's LCC. Deconstructing a building and allowing the reuse or recycling of its parts, unveal a added value of the building that is often forgotten or dismissed if EoL is not considered or if the building is demolished without recovery.
Willing to consider EoL during the project design, as to have the full LCC performance?
Water
Investement cost (€/m2)
Client's Budget (€)
Energy
Maintenance/ Replace
Description
IC ≥ 979€/m2
979 > IC > 644 €/m2
IC ≤ 644 €/m2
I20 Clear

ADP GWP ODP AP POCP EP NR R non-renewable renewable
(W/m.°C) (m2.°C/W) Kg/m3 years (kg Sb eq) (kg CO2 eq) (kg CFC11,eq) (kg SO2,eq) (kg C2H4,eq) (kg PO4,eq) (MJ,eq) (MJ,eq) (kg Sb eq) (kg CO2 eq) (kg CFC11,eq) (kg SO2,eq) (kg C2H4,eq) (kg PO4,eq) (MJ,eq) (MJ,eq) %
INSULATION Glass fibre 0,6 7,19E-03 1,03E+00 1,30E-07 2,22E-03 1,56E-04 1,87E-04 1,33E+01 0,00E+00 1,98E-01 2,83E+01 3,58E-06 6,11E-02 4,29E-03 5,14E-03 3,66E+02 0,00E+00 yesISOLAMENTOS rock/mineral wool (20-35) 0,04 27,5 50,00 1,05E-02 1,46E+00 6,10E-08 8,32E-03 9,28E-04 4,46E-04 2,16E+01 9,79E-01 7,09E-01 9,86E+01 4,12E-06 5,62E-01 6,26E-02 3,01E-02 1,46E+03 6,61E+01 yes 50ISOLAMENTOS rock/mineral wool (35-100) 0,04 67,5 50,00 1,05E-02 1,46E+00 6,10E-08 8,32E-03 9,28E-04 4,46E-04 2,16E+01 9,79E-01 1,47E+00 2,04E+02 8,54E-06 1,16E+00 1,30E-01 6,24E-02 3,02E+03 1,37E+02 yes 50ISOLAMENTOS rock/mineral wool (100-180) 0,042 140 50,00 1,05E-02 1,46E+00 6,10E-08 8,32E-03 9,28E-04 4,46E-04 2,16E+01 9,79E-01 1,21E-01 1,68E+01 7,02E-07 9,57E-02 1,07E-02 5,13E-03 2,48E+02 1,13E+01 yes 50ISOLAMENTOS glass wool (8-15) 0,045 11,5 50,00 1,43E-02 1,50E+00 2,15E-07 6,42E-03 5,57E-04 1,18E-03 4,50E+01 4,14E+00 8,22E-01 8,63E+01 1,24E-05 3,69E-01 3,20E-02 6,79E-02 2,59E+03 2,38E+02 yes 80ISOLAMENTOS glass wool (15-100) 0,04 57,5 50,00 1,43E-02 1,50E+00 2,15E-07 6,42E-03 5,57E-04 1,18E-03 4,50E+01 4,14E+00 5,01E-01 5,25E+01 7,53E-06 2,25E-01 1,95E-02 4,13E-02 1,58E+03 1,45E+02 yes 80ISOLAMENTOS Poliéster (UP) 35 50,00 1,14E-01 1,97E+01 3,24E-09 1,96E-01 7,42E-03 1,80E-02 2,25E+02 5,52E-01 1,25E+00 2,17E+02 3,56E-08 2,16E+00 8,16E-02 1,98E-01 2,48E+03 6,07E+00 yesISOLAMENTOS Expanded polystyrene (EPS) < 11 0,055 11 50,00 4,63E-02 4,14E+00 1,10E-07 1,49E-02 6,75E-03 1,24E-03 1,05E+02 1,01E+00 5,56E-01 4,97E+01 1,32E-06 1,79E-01 8,10E-02 1,49E-02 1,26E+03 1,21E+01 yes 25ISOLAMENTOS Expanded polystyrene (EPS) (11-13) 0,045 12 50,00 4,63E-02 4,14E+00 1,10E-07 1,49E-02 6,75E-03 1,24E-03 1,05E+02 1,01E+00 6,48E-01 5,80E+01 1,54E-06 2,09E-01 9,45E-02 1,74E-02 1,47E+03 1,41E+01 yes 25ISOLAMENTOS Expanded polystyrene (EPS) (13-15) 0,042 14 50,00 4,63E-02 4,14E+00 1,10E-07 1,49E-02 6,75E-03 1,24E-03 1,05E+02 1,01E+00 8,10E-01 7,25E+01 1,93E-06 2,61E-01 1,18E-01 2,17E-02 1,84E+03 1,77E+01 yes 25ISOLAMENTOS Expanded polystyrene (EPS) (15-20) 0,04 17,5 50,00 4,63E-02 4,14E+00 1,10E-07 1,49E-02 6,75E-03 1,24E-03 1,05E+02 1,01E+00 9,26E-01 8,28E+01 2,20E-06 2,98E-01 1,35E-01 2,48E-02 2,10E+03 2,02E+01 yes 25ISOLAMENTOS Expanded polystyrene (EPS) > 20 0,037 20 50,00 4,63E-02 4,14E+00 1,10E-07 1,49E-02 6,75E-03 1,24E-03 1,05E+02 1,01E+00 1,50E+00 1,35E+02 3,58E-06 4,84E-01 2,19E-01 4,03E-02 3,41E+03 3,28E+01 yes 25ISOLAMENTOS Extruded polystyrene (XPS) 0,037 32,5 50,00 2,41E-06 3,86E+00 1,38E-07 1,38E-02 1,58E-03 5,00E-03 9,69E+01 1,62E+00 2,22E-03 3,55E+03 1,27E-04 1,27E+01 1,45E+00 4,60E+00 8,91E+04 1,49E+03 yes 25ISOLAMENTOS Low density polyethylene 0,33 920 4,03E-02 1,14E+00 0,00E+00 1,69E-02 4,57E-04 1,63E-03 6,80E+01 0,00E+00 3,95E+01 1,12E+03 0,00E+00 0,00E+00 1,66E+01 4,48E-01 1,60E+00 6,66E+04 yes 4ISOLAMENTOS High density polyethylene 0,5 980 4,03E-02 1,14E+00 0,00E+00 1,69E-02 4,57E-04 1,63E-03 6,80E+01 0,00E+00 1,41E+00 3,99E+01 0,00E+00 5,92E-01 1,60E-02 5,71E-02 2,38E+03 0,00E+00 yes 4ISOLAMENTOS Rigid expanded polyurethane - board (20-50) 0,04 35 4,31E-02 4,26E+00 1,89E-08 1,77E-02 2,05E-03 2,75E-03 1,00E+02 2,57E+00 1,51E+00 1,49E+02 6,62E-07 6,20E-01 7,18E-02 9,63E-02 3,50E+03 9,00E+01 yesISOLAMENTOS Rigid expanded polyurethane - foam (20-50) 0,042 35 4,31E-02 4,26E+00 1,89E-08 1,77E-02 2,05E-03 2,75E-03 1,00E+02 2,57E+00 1,83E+00 1,81E+02 8,03E-07 7,52E-01 8,71E-02 1,17E-01 4,25E+03 1,09E+02 yesISOLAMENTOS Rigid expanded polyurethane -Sandwich board (35-50) 0,037 42,5 4,31E-02 4,26E+00 1,89E-08 1,77E-02 2,05E-03 2,75E-03 1,00E+02 2,57E+00 0,00E+00 0,00E+00 0,00E+00 0,00E+00 0,00E+00 0,00E+00 0,00E+00 0,00E+00 yesISOLAMENTOS Cellulose (fibers for thermal insulation) 7,26E-07 1,36E-01 1,72E-08 8,33E-04 7,57E-05 4,13E-04 5,87E+01 1,37E+00 0,00E+00 0,00E+00 0,00E+00 0,00E+00 0,00E+00 0,00E+00 0,00E+00 0,00E+00 yes 100ISOLAMENTOS Foam glass 1,22E-02 1,58E+00 1,52E-07 3,94E-03 1,76E-04 5,21E-04 3,51E+01 1,29E+00 1,40E+00 1,82E+02 1,75E-05 4,53E-01 2,02E-02 5,99E-02 4,04E+03 1,48E+02 yesISOLAMENTOS Cork 0,05 115 50,00 3,80E-06 1,59E+00 1,91E-07 3,80E-06 7,22E-04 4,82E-03 2,88E+01 1,26E+02 4,37E-04 1,83E+02 2,20E-05 4,37E-04 8,30E-02 5,54E-01 3,31E+03 1,45E+04 yes 100ISOLAMENTOS Expanded Cork Agglomerate (90 - 140) 0,045 115 50,00 3,80E-06 1,59E+00 1,91E-07 3,80E-06 7,22E-04 4,82E-03 2,88E+01 1,26E+02 4,75E-04 1,99E+02 2,39E-05 4,75E-04 9,03E-02 6,03E-01 3,60E+03 1,58E+04 yes 100ISOLAMENTOS Expanded Cork Agglomerate (100 - 150) 0,05 125 50,00 3,80E-06 1,59E+00 1,91E-07 3,80E-06 7,22E-04 4,82E-03 2,88E+01 1,26E+02 7,60E-04 3,18E+02 3,82E-05 7,60E-04 1,44E-01 9,64E-01 5,76E+03 2,52E+04 yes 100
0,055 Expanded Cork Agglomerate (150 - 250) 0,055 200 50,00 3,80E-06 1,59E+00 1,91E-07 3,80E-06 7,22E-04 4,82E-03 2,88E+01 1,26E+02 0,00E+00 0,00E+00 0,00E+00 0,00E+00 0,00E+00 0,00E+00 0,00E+00 0,00E+00 yes 100FINISHING Paint - Water base 2,37E-02 2,46E+00 3,69E-07 1,69E-02 7,72E-04 4,23E-03 4,78E+01 3,33E+00 0,00E+00 0,00E+00 0,00E+00 0,00E+00 0,00E+00 0,00E+00 0,00E+00 0,00E+00 noACABAMENTOS Paint - Synthetic base 0,0341 2,51 5,78E-07 0,0202 0,000947 0,00547 71,5 4,46E+00 0,00E+00 0,00E+00 0,00E+00 0,00E+00 0,00E+00 0,00E+00 0,00E+00 0,00E+00 noACABAMENTOS Urea - Expanded formaldehyde 1,68E-02 8,72E-02 4,31E-09 8,62E-04 1,87E-05 1,53E-04 2,29E+01 2,02E-03 0,00E+00 0,00E+00 0,00E+00 0,00E+00 0,00E+00 0,00E+00 0,00E+00 0,00E+00 noACABAMENTOS Varnish 1,88E-02 1,75E+00 3,00E-07 9,26E-03 6,13E-04 1,82E-03 3,75E+01 4,39E-01 4,32E+01 4,03E+03 6,90E-04 2,13E+01 1,41E+00 4,19E+00 8,63E+04 1,01E+03 noACABAMENTOS Ceramic tile/mosaic 1,04 2300 100,00 6,30E-03 7,63E-01 8,16E-08 2,93E-03 1,36E-04 2,75E-04 1,40E+01 3,64E-01 0,00E+00 0,00E+00 0,00E+00 0,00E+00 0,00E+00 0,00E+00 0,00E+00 0,00E+00 yes 20
WOOD PRODUCTS Laminated wood (exterior) 450 100,00 7,61E-07 2,54E-01 3,55E-08 1,70E-03 1,48E-04 1,40E-03 4,40E+00 2,18E+01 4,95E-04 1,65E+02 2,31E-05 1,11E+00 9,62E-02 9,10E-01 2,86E+03 1,42E+04 yes 90PRODUTOS MADEIRA Solid wood (Semi-rigid) 0,18 650 100,00 4,58E-07 8,46E-02 1,88E-08 6,17E-04 1,23E-04 1,06E-03 1,92E+00 2,95E+01 2,98E-04 5,50E+01 1,22E-05 4,01E-01 8,00E-02 6,89E-01 1,25E+03 1,92E+04 yesPRODUTOS MADEIRA Medium Density Fiberboard (MDF) - board 0,15 650 100,00 3,34E-06 8,58E-01 1,03E-07 5,68E-03 4,57E-04 1,05E+01 1,59E+01 1,17E+01 2,34E-03 6,01E+02 7,21E-05 3,98E+00 3,20E-01 7,35E+03 1,11E+04 8,19E+03 yes 90PRODUTOS MADEIRA Plywood (laminated wood) 0,17 700 100,00 1,09E-06 3,63E-01 5,08E-08 2,43E-03 2,12E-04 2,00E-03 6,29E+00 3,11E+01 6,54E-04 2,18E+02 3,05E-05 1,46E+00 1,27E-01 1,20E+00 3,77E+03 1,87E+04 yes 90PRODUTOS MADEIRA Oriented Strand Board (OSB) - board 0,13 600 100,00 1,02E-06 4,72E-01 4,19E-08 2,64E-03 1,93E-04 2,22E-03 9,22E+00 2,82E+01 0,00E+00 0,00E+00 0,00E+00 0,00E+00 0,00E+00 0,00E+00 0,00E+00 0,00E+00 yes 90
STONE Stone 2600 100,00 1,81E-03 2,63E-01 3,43E-08 1,56E-03 4,66E-05 3,13E-04 7,58E+00 8,35E-01 4,89E+00 7,10E+02 9,26E-05 4,21E+00 1,26E-01 8,45E-01 2,05E+04 2,25E+03 yes 0PEDRA Limestone Rock - Marble (2600-2800) 3,5 2700 1,24E-05 1,92E-03 2,26E-10 3,37E-05 5,38E-07 7,79E-06 2,80E-02 4,05E-04 2,97E-02 4,60E+00 5,41E-07 8,07E-02 1,29E-03 1,87E-02 6,71E+01 9,70E-01 yes 0PEDRA Limestone Rock - very hard (2200-2590) 2,3 2395 1,24E-05 1,92E-03 2,26E-10 3,37E-05 5,38E-07 7,79E-06 2,80E-02 4,05E-04 2,97E-02 4,60E+00 5,41E-07 8,07E-02 1,29E-03 1,87E-02 6,71E+01 9,70E-01 yes 0PEDRA Limestone Rock - hard (2000-2190) 1,7 2095 1,24E-05 1,92E-03 2,26E-10 3,37E-05 5,38E-07 7,79E-06 2,80E-02 4,05E-04 2,97E-02 4,60E+00 5,41E-07 8,07E-02 1,29E-03 1,87E-02 6,71E+01 9,70E-01 yes 0PEDRA Limestone Rock - medium (1800-1990) 1,4 1895 1,24E-05 1,92E-03 2,26E-10 3,37E-05 5,38E-07 7,79E-06 2,80E-02 4,05E-04 2,97E-02 4,60E+00 5,41E-07 8,07E-02 1,29E-03 1,87E-02 6,71E+01 9,70E-01 yes 0PEDRA Limestone Rock - soft (1600-1790) 1,1 1695 1,24E-05 1,92E-03 2,26E-10 3,37E-05 5,38E-07 7,79E-06 2,80E-02 4,05E-04 2,97E-02 4,60E+00 5,41E-07 8,07E-02 1,29E-03 1,87E-02 6,71E+01 9,70E-01 yes 0PEDRA Limestone Rock - very soft < 1590 0,85 1590 1,24E-05 1,92E-03 2,26E-10 3,37E-05 5,38E-07 7,79E-06 2,80E-02 4,05E-04 2,97E-02 4,60E+00 5,41E-07 8,07E-02 1,29E-03 1,87E-02 6,71E+01 9,70E-01 yes 0PEDRA Expanded perlite 7,08E-03 9,92E-01 2,21E-07 3,04E-03 1,49E-04 3,13E-04 1,63E+01 5,60E-01 0,00E+00 0,00E+00 0,00E+00 0,00E+00 0,00E+00 0,00E+00 0,00E+00 0,00E+00 yes 0PEDRA Stone board 2,99E-03 4,35E-01 5,53E-08 2,56E-03 7,85E-05 5,07E-04 1,36E+01 1,61E+00 5,83E+00 8,48E+02 1,08E-04 4,99E+00 1,53E-01 9,89E-01 2,65E+04 3,14E+03 yes 0PEDRA Gravel 2 1950 100,00 2,95E-05 4,28E-03 4,08E-10 2,34E-05 1,01E-06 4,15E-06 5,69E-02 1,04E-03 0,00E+00 0,00E+00 0,00E+00 0,00E+00 0,00E+00 0,00E+00 0,00E+00 0,00E+00 yes 100
OTHER POLYMERS Polycarbonate 0,2 1200 50,00 1,40E-06 7,78E+00 3,27E-09 2,49E-02 1,39E-03 2,40E-03 1,07E+02 4,80E+02 1,68E-03 9,34E+03 3,92E-06 2,99E+01 1,67E+00 2,88E+00 1,28E+05 5,76E+05 noOUTROS POLIMEROS Rubber 0,17 1200 50,00 3,88E-02 3,16E+00 3,09E-09 1,03E-02 6,76E-04 7,64E-04 8,53E+01 5,40E-01 3,53E+01 2,88E+03 2,81E-06 9,37E+00 6,15E-01 6,95E-01 7,76E+04 4,91E+02 no
Polypropylene 0,22 9,10E+02 3,24E-02 1,96E+00 1,65E-10 6,19E-03 4,21E-04 6,51E-04 7,46E+01 4,81E-01 4,50E+01 2,72E+03 2,29E-07 8,60E+00 5,85E-01 9,05E-01 1,04E+05 6,69E+02 noOUTROS POLIMEROS Polyvinyl chloride (PVC) 0,14 1390 50,00 2,26E-02 1,97E+00 2,84E-09 5,35E-03 3,12E-04 7,59E-04 5,94E+01 9,34E-01 0,00E+00 0,00E+00 0,00E+00 0,00E+00 0,00E+00 0,00E+00 0,00E+00 0,00E+00 no
METALS Steel profile 50 7800 100,00 4,54E-03 5,71E-01 5,40E-08 3,04E-03 1,85E-04 4,86E-04 8,66E+00 1,16E-01 3,54E+01 4,45E+03 4,21E-04 2,37E+01 1,44E+00 3,79E+00 6,75E+04 9,05E+02 yes 100METAIS steel rebar 50 7800 100,00 1,29E-02 1,25E+00 6,16E-08 5,57E-03 8,29E-04 1,30E-03 3,27E+01 1,52E-01 3,48E+01 3,38E+03 1,66E-04 1,50E+01 2,24E+00 3,51E+00 8,83E+04 4,10E+02 yes 100METAIS Aluminum, 50% recycled 230 2700 100,00 2,82E-02 4,28E+00 1,84E-06 3,80E-02 2,23E-03 1,21E-03 6,82E+01 0,00E+00 2,03E+02 3,08E+04 1,32E-02 2,74E+02 1,61E+01 8,71E+00 4,91E+05 0,00E+00 yes 50METAIS Zinc sheet 110 7200 100,00 1,75E-02 2,46E+00 1,37E-07 4,02E-02 1,44E-03 2,41E-03 2,84E+01 5,60E-01 1,56E+02 2,19E+04 1,22E-03 3,58E+02 1,28E+01 2,14E+01 2,53E+05 4,98E+03 yes 31METAIS Copper 380 8900 100,00 1,59E-02 1,94E+00 1,53E-07 6,46E-02 2,26E-03 3,97E-03 3,03E+01 5,70E+00 1,25E+02 1,53E+04 1,20E-03 5,08E+02 1,78E+01 3,12E+01 2,38E+05 4,49E+04 yes 60METAIS Iron 72 7870 100,00 1,39E-02 1,50E+00 5,04E-08 5,77E-03 8,73E-04 6,52E-04 2,44E+01 5,70E-01 0,00E+00 0,00E+00 0,00E+00 0,00E+00 0,00E+00 0,00E+00 0,00E+00 0,00E+00 yes
CONCRETE Concrete 1,65 2150 2,38E-04 1,10E-01 3,55E-09 1,79E-04 6,49E-06 2,84E-05 5,56E-01 6,24E-03 5,59E-01 2,59E+02 8,34E-06 4,21E-01 1,53E-02 6,67E-02 1,31E+03 1,47E+01 yesBETÕES Reinforced concrete 2 2350 100,00 6,08E-04 1,48E-01 3,55E-09 5,56E-04 5,28E-05 5,76E-05 1,24E+00 7,39E-03 5,47E-01 1,33E+02 3,20E-06 5,00E-01 4,75E-02 5,18E-02 1,12E+03 6,65E+00 yes 90BETÕES Lightweight concrete block (expanded clay) 0,85 900 2,14E-03 4,29E-01 3,74E-08 2,75E-03 1,14E-04 1,62E-04 4,94E+00 1,60E-01 1,28E+00 2,57E+02 2,24E-05 1,65E+00 6,84E-02 9,72E-02 2,96E+03 9,60E+01 yes 93BETÕES autoclaved cellular concrete (ACC) 0,28 600 1,40E-03 4,15E-01 2,18E-08 6,69E-04 4,29E-05 8,47E-05 3,25E+00 2,03E-01 0,00E+00 0,00E+00 0,00E+00 0,00E+00 0,00E+00 0,00E+00 0,00E+00 0,00E+00 yes 93
MORTARS wood-cement bound 1100 4,26E-07 6,92E-01 2,92E-08 1,91E-03 1,03E-04 5,64E-03 5,39E+00 1,46E+00 6,82E-04 1,11E+03 4,67E-05 3,06E+00 1,65E-01 9,02E+00 8,62E+03 2,34E+03 no
ARGAMASSAS Lime mortar 0,8 1600 1,37E-03 6,10E-01 2,08E-08 8,64E-04 3,91E-05 1,31E-04 3,26E+00 3,27E-01 9,59E-01 4,27E+02 1,46E-05 6,05E-01 2,74E-02 9,17E-02 2,28E+03 2,29E+02 no
ARGAMASSAS Cement mortar 0,3 700 4,90E-04 1,95E-01 8,00E-09 3,15E-04 1,29E-05 4,87E-05 1,31E+00 2,10E-01 9,80E-01 3,90E+02 1,60E-05 6,30E-01 2,58E-02 9,74E-02 2,62E+03 4,20E+02 no 100
ARGAMASSAS Asphalt bitumen 0,7 2000 2,35E-02 5,81E-01 7,27E-07 1,94E-03 1,98E-04 3,02E-04 5,33E+01 9,73E-02 0,00E+00 0,00E+00 0,00E+00 0,00E+00 0,00E+00 0,00E+00 0,00E+00 0,00E+00
OTHER Plasterboard 0,25 1250 10,00 2,48E-03 3,50E-01 3,89E-08 1,09E-03 4,69E-05 1,73E-04 5,74E+00 3,21E-01 3,97E+00 5,60E+02 6,22E-05 1,74E+00 7,50E-02 2,77E-01 9,18E+03 5,14E+02 yes 97
OUTROS Ceramic roof tile 0,69 1600 20,00 6,58E-03 8,16E-01 8,41E-08 2,90E-03 1,55E-04 2,85E-04 1,46E+01 7,41E-01 6,05E+00 7,51E+02 7,74E-05 2,67E+00 1,43E-01 2,62E-01 1,34E+04 6,82E+02 yes 20
OUTROS Concrete roof tile 20,00 7,46E-04 2,12E-01 1,11E-08 4,47E-04 2,34E-05 7,64E-05 1,73E+00 1,09E-01 1,19E+00 3,39E+02 1,78E-05 7,15E-01 3,74E-02 1,22E-01 2,77E+03 1,74E+02 yes 22
OUTROS earth and clay 1,5 1600 0,00E+00 0,00E+00 0,00E+00 0,00E+00 0,00E+00 0,00E+00 0,00E+00 0,00E+00 0,00E+00 0,00E+00 0,00E+00 0,00E+00 0,00E+00 0,00E+00 0,00E+00 0,00E+00 yes
OUTROS Glass 1,2 2000 50,00 5,68E-03 9,73E-01 8,01E-08 8,51E-03 2,86E-04 6,53E+04 1,15E+01 2,03E-01 0,00E+00 0,00E+00 0,00E+00 0,00E+00 0,00E+00 0,00E+00 0,00E+00 0,00E+00 yes 30air cavity 0,025 no
WINDOWS Simple glass-Uw (Wood frame-vertical) 0,20 30 9,65E-01 1,30E+02 1,04E-05 6,82E-01 4,20E-02 3,21E-01 2,32E+03 2,41E+03 yes 30Double glass-Uw (Wood frame-vertical) 0,30 30 9,65E-01 1,30E+02 1,04E-05 6,82E-01 4,20E-02 3,21E-01 2,32E+03 2,41E+03 yes 30Double glass-Uw Low-e (Wood frame-vertical) 0,38 30 9,65E-01 1,30E+02 1,04E-05 6,82E-01 4,20E-02 3,21E-01 2,32E+03 2,41E+03 yes 30Simple glass-Uw (Metallic frame without thermal cut) 0,17 30 3,14E+00 4,77E+02 3,35E-05 2,09E+00 1,57E-01 7,90E-01 7,22E+03 1,06E+03 yes 35
Reuse?Recycled content
Type of material/ product
Impacts/kg Embodied Energy Impacts/m3
ADP GWP ODP AP POCP EPEmbodied Energy
Material / Productλ Rj Density Durability

ADP GWP ODP AP POCP EP NR R non-renewable renewable
(W/m.°C) (m2.°C/W) Kg/m3 years (kg Sb eq) (kg CO2 eq) (kg CFC11,eq) (kg SO2,eq) (kg C2H4,eq) (kg PO4,eq) (MJ,eq) (MJ,eq) (kg Sb eq) (kg CO2 eq) (kg CFC11,eq) (kg SO2,eq) (kg C2H4,eq) (kg PO4,eq) (MJ,eq) (MJ,eq) %
Reuse?Recycled content
Type of material/ product
Impacts/kg Embodied Energy Impacts/m3
ADP GWP ODP AP POCP EPEmbodied Energy
Material / Productλ Rj Density Durability
Simple glass-Uw (Metallic frame with thermal cut) 0,19 30 3,14E+00 4,77E+02 3,35E-05 2,09E+00 1,57E-01 7,90E-01 7,22E+03 1,06E+03 yes 35Simple glass-With low air permeability (Metallic frame without thermal cut) 0,26 30 3,14E+00 4,77E+02 3,35E-05 2,09E+00 1,57E-01 7,90E-01 7,22E+03 1,06E+03 yes 35Double glass-Uw (6mm) (Metallic frame without thermal cut) 0,26 30 3,14E+00 4,77E+02 3,35E-05 2,09E+00 1,57E-01 7,90E-01 7,22E+03 1,06E+03 yes 35Double glass-Uw (6mm) (Metallic frame with thermal cut) 0,27 30 3,14E+00 4,77E+02 3,35E-05 2,09E+00 1,57E-01 7,90E-01 7,22E+03 1,06E+03 yes 35Double glass-Uw (Metallic frame without thermal cut) 0,29 30 3,14E+00 4,77E+02 3,35E-05 2,09E+00 1,57E-01 7,90E-01 7,22E+03 1,06E+03 yes 35Double glass (16mm)-Uw (Metallic frame without thermal cut) 0,26 30 3,14E+00 4,77E+02 3,35E-05 2,09E+00 1,57E-01 7,90E-01 7,22E+03 1,06E+03 yes 35Double glass-Uw low-e (Metallic frame without thermal cut 0,32 30 3,14E+00 4,77E+02 3,35E-05 2,09E+00 1,57E-01 7,90E-01 7,22E+03 1,06E+03 yes 35Double glass-Uw (Low-e 16mm) (Metallic frame with thermal cut) 0,33 30 3,14E+00 4,77E+02 3,35E-05 2,09E+00 1,57E-01 7,90E-01 7,22E+03 1,06E+03 yes 35Double glass-Uw (16mm) (Metallic frame with thermal cut) 0,30 30 3,14E+00 4,77E+02 3,35E-05 2,09E+00 1,57E-01 7,90E-01 7,22E+03 1,06E+03 yes 35Double glass-W/low air permeability - 16mm low e (Metallic frame w/thermal cut) 0,43 30 3,14E+00 4,77E+02 3,35E-05 2,09E+00 1,57E-01 7,90E-01 7,22E+03 1,06E+03 yes 35Simple glass-Uw (Plastic frame-vertical-0mm) 0,20 30 2,35E+00 2,45E+02 1,06E-05 1,29E+00 6,56E-02 4,45E-01 5,63E+03 2,29E+02 yes 45Double glass-Uw (Plastic frame-vertical-6mm) 0,31 30 2,35E+00 2,45E+02 1,06E-05 1,29E+00 6,56E-02 4,45E-01 5,63E+03 2,29E+02 yes 45Double glass-Uw (Plastic frame-vertical-16mm) 0,37 30 2,35E+00 2,45E+02 1,06E-05 1,29E+00 6,56E-02 4,45E-01 5,63E+03 2,29E+02 yes 45Double glass-Uw (Plastic frame-vertical-16mm low e) 0,40 30 2,35E+00 2,45E+02 1,06E-05 1,29E+00 6,56E-02 4,45E-01 5,63E+03 2,29E+02 yes 45
yes
BRICK Thermal brick of 14 cm ( Preceram ) 0,79 130,9 100 5,50E-03 1,12E+00 3,28E-08 2,44E-03 6,13E-04 5,14E-04 1,25E+01 3,12E-01 0,00E+00 0,00E+00 0,00E+00 0,00E+00 0,00E+00 0,00E+00 0,00E+00 0,00E+00 yes 65Thermal brick of 19 cm ( Preceram ) 0,9 172,33 100 5,50E-03 1,12E+00 3,28E-08 2,44E-03 6,13E-04 5,14E-04 1,25E+01 3,12E-01 0,00E+00 0,00E+00 0,00E+00 0,00E+00 0,00E+00 0,00E+00 0,00E+00 0,00E+00 yesThermal brick of 24 cm ( Preceram ) 1,07 206,4 100 5,50E-03 1,12E+00 3,28E-08 2,44E-03 6,13E-04 5,14E-04 1,25E+01 3,12E-01 0,00E+00 0,00E+00 0,00E+00 0,00E+00 0,00E+00 0,00E+00 0,00E+00 0,00E+00 yesThermal brick of 29 cm ( Preceram ) 1,4 249,4 100 5,50E-03 1,12E+00 3,28E-08 2,44E-03 6,13E-04 5,14E-04 1,25E+01 3,12E-01 0,00E+00 0,00E+00 0,00E+00 0,00E+00 0,00E+00 0,00E+00 0,00E+00 0,00E+00 yesCeramic brick 4 cm 0,1 60 100 1,18E-03 2,20E-01 1,58E-08 5,48E-04 4,00E-05 6,71E-05 2,58E+00 2,55E-01 1,30E-01 2,42E+01 1,74E-06 6,03E-02 4,40E-03 7,38E-03 2,84E+02 2,81E+01 yes 65
TIJOLO Ceramic brick 7 cm 0,19 110 100 1,18E-03 2,20E-01 1,58E-08 5,48E-04 4,00E-05 6,71E-05 2,58E+00 2,55E-01 1,53E-01 2,86E+01 2,05E-06 7,12E-02 5,20E-03 8,72E-03 3,35E+02 3,32E+01 yes 65
TIJOLO Ceramic brick 9 cm 0,23 130 100 1,18E-03 2,20E-01 1,58E-08 5,48E-04 4,00E-05 6,71E-05 2,58E+00 2,55E-01 1,89E-01 3,52E+01 2,53E-06 8,77E-02 6,40E-03 1,07E-02 4,13E+02 4,08E+01 yes 65
TIJOLO Ceramic brick 11 cm 0,27 160 100 1,18E-03 2,20E-01 1,58E-08 5,48E-04 4,00E-05 6,71E-05 2,58E+00 2,55E-01 2,24E-01 4,18E+01 3,00E-06 1,04E-01 7,60E-03 1,27E-02 4,90E+02 4,85E+01 yes 65
TIJOLO Ceramic brick 15 cm 0,39 190 100 1,18E-03 2,20E-01 1,58E-08 5,48E-04 4,00E-05 6,71E-05 2,58E+00 2,55E-01 3,30E-01 6,16E+01 4,42E-06 1,53E-01 1,12E-02 1,88E-02 7,22E+02 7,14E+01 yes 65
TIJOLO Ceramic brick 20 cm 0,52 280 100 1,18E-03 2,20E-01 1,58E-08 5,48E-04 4,00E-05 6,71E-05 2,58E+00 2,55E-01 3,54E-01 6,60E+01 4,74E-06 1,64E-01 1,20E-02 2,01E-02 7,74E+02 7,65E+01 yes 65TIJOLO Ceramic brick 22 cm 0,52 300 100,00 1,18E-03 2,20E-01 1,58E-08 5,48E-04 4,00E-05 6,71E-05 2,58E+00 2,55E-01 0,00E+00 0,00E+00 0,00E+00 0,00E+00 0,00E+00 0,00E+00 0,00E+00 0,00E+00 yes 65