04 CHAPTER III Methodology
33
CHAPTER III METHODOLOGY OF THE RESEARCH This chapter focuses on methodology of the research. This part explains the steps to conduct the research, determining the place and time of the research, designing the research method, determining the population and sample, deciding the data collection technique, making the research instrument, determining the technique of data analysis and statistical hypothesis. A. Place and Time of the Research The research was conducted in SMA Negeri Jatinangor which is located in Kabupaten Sumedang. It took two-four weeks during October 2012 in the Academic Year of 2012-2013. The activities of the research were drawn in the table below: 47
-
Upload
independent -
Category
Documents
-
view
0 -
download
0
Transcript of 04 CHAPTER III Methodology

CHAPTER III
METHODOLOGY OF THE RESEARCH
This chapter focuses on methodology of the
research. This part explains the steps to conduct
the research, determining the place and time of the
research, designing the research method,
determining the population and sample, deciding the
data collection technique, making the research
instrument, determining the technique of data
analysis and statistical hypothesis.
A. Place and Time of the Research
The research was conducted in SMA Negeri
Jatinangor which is located in Kabupaten Sumedang.
It took two-four weeks during October 2012 in the
Academic Year of 2012-2013. The activities of the
research were drawn in the table below:
47
48
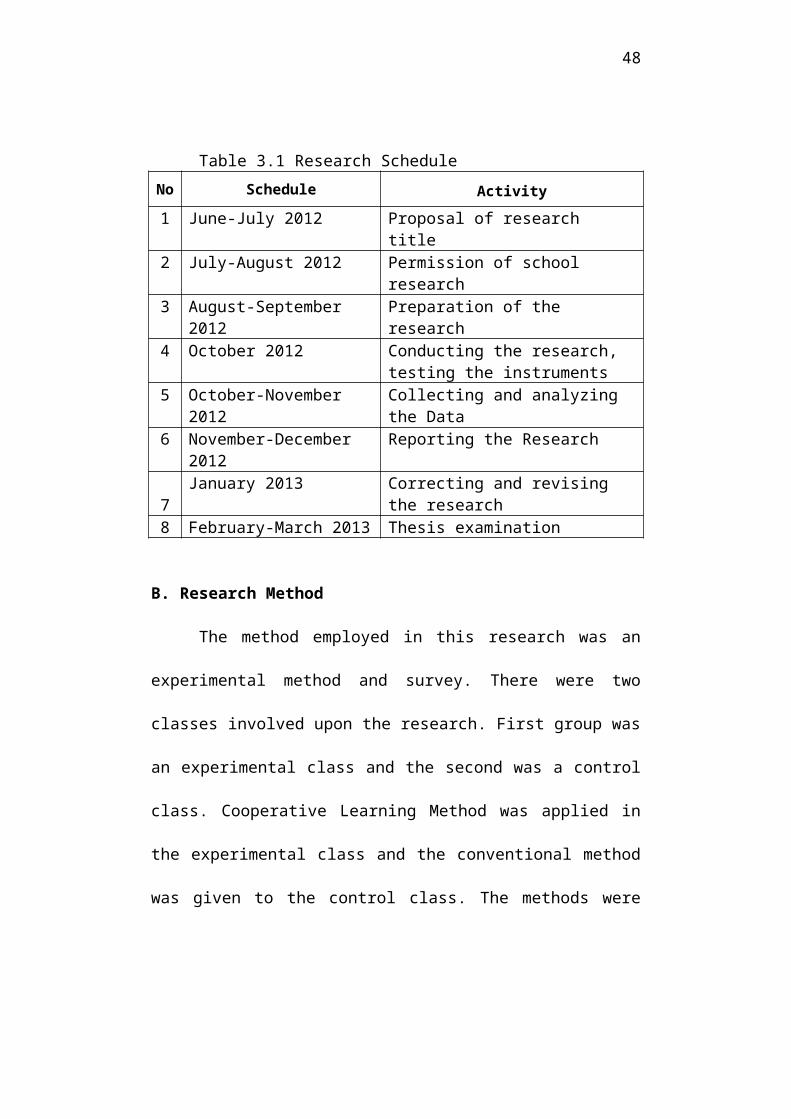
Table 3.1 Research ScheduleNo Schedule Activity1 June-July 2012 Proposal of research
title2 July-August 2012 Permission of school
research3 August-September
2012Preparation of the research
4 October 2012 Conducting the research, testing the instruments
5 October-November 2012
Collecting and analyzing the Data
6 November-December 2012
Reporting the Research
7
January 2013 Correcting and revising the research
8 February-March 2013 Thesis examination
B. Research Method
The method employed in this research was an
experimental method and survey. There were two
classes involved upon the research. First group was
an experimental class and the second was a control
class. Cooperative Learning Method was applied in
the experimental class and the conventional method
was given to the control class. The methods were

49
used to get the ratio of students’ writing skills
at the end of the research.
This research involved two dependent variables
(X1, X2) and one independent variable (Y). The first
dependent variable (X1) or experimental variable
was teaching method. The second dependent variable
(X2) or attributive variable was reading interest.
The independent variable (Y) was students’ writing
skill. To obtain the accurate analysis, all
variables were involved in this design. The
research design used in this study was factorial
design 2x2 as shown in the table below.
Table 3.2 Factorial DesignTeaching Method
Reading Interest
Cooperative Learning
Method
(A1)
Conventional Method
(A2)
High (B1) A1B1 A2B1
Low (B2) A1B2 A2B2

50
Note:
A1 : Cooperative Learning Method
A2 : Conventional Method
B1 : High students’ reading interest
B2 : Low students’ reading interest
A1B1 : Students’ writing skills with
cooperative learning method in
high students’ reading interest.
A2B1 : Students’ writing skills with
conventional method in high
students’ reading interest.
A1B2 : Students’ writing skills with
cooperative learning method in
low students’ reading interest.
A2B2 : Students’ writing skills with
conventional method in low
students’ reading interest.
C. Population and Sample

51
1. Population
The reachable population in this study was the
group of Jatinangor Senior High School. It has
seven class of grade XII. Each class has 30
students. The reachable population was two classes,
namely class XII-1 and XII-2, the Academic Year
2012/2013 in Jatinangor Sumedang.
2. Sample
The sample was determined by (1). deciding
Jatinangor Senior High as the place of research.
(2). deciding students in class XII as a research
class by using random sampling (3). deciding class
XII-1 as experimental class with Cooperative
learning method and class XII-2 as a control class
with conventional teaching method. (4). selecting
and dividing students in an experimental class and
control class into a group of students who had high

52
and low reading interests. The selection and
division the group of students were employed by
doing a reading interest survey. From 30 students
in an experimental group, there were 14 students
who had high reading interest and 16 students who
have low reading interest. Meanwhile, from 30
students in a control class, there were 17 students
who had high reading interest and 13 students who
had low reading interest.
The way to select and group students in high
and low reading interest used the calculation
suggested by Arikunto (2006:246-252), which found
the mean of total score of reading interest in each
group. From this calculation, it found that the
means in an experimental class were 103 and the
means in a control class were 102, then students in
an experimental class who had total score higher
than 103 were included in high reading interest and
who had total score less than 103 were included in

53
low high reading interest. Students in a control
class who had total score higher than 102 were
included in high reading interest and who had total
score less than 102 were included in low reading
interest. The distribution of students with high
and low reading interest in an experimental class
and in a control class can be shown in the table
below.
Table 3.3 The number of students inExperimental and Control Class
Teaching Method
Reading Interest
Cooperative Learning
Method
(Experimental Class)
(A1)
Conventional Method
(A Control Class)
(A2)
High (B1) 14 students 17 students
Low (B2) 16 students 13 students
Note:
1. There are 14 students with high reading interest
having learned with Cooperative Learning Method.
54
2. There are 16 students with low reading interest
having learning with Cooperative Learning Method.
3. There are 17 students with high reading interest
having learned with conventional method.
4. There are 13 students having learned with low reading
interest having learned with conventional method.
The samples can be generalized in population
if they pass in an evaluation. The evaluation used
in validating the samples are internal validity and
external validity (Arikunto, 2006:168-175)
3. Research Design Validity
Since the treatment used in the research
causes the effect, so it is important to control
internal validation and external validation.
Internal validity is about the accuracy of research
design which will be obtained. Internal validity is
dealing with the control of the research from any
distractions in dependent variables, which cause

55
the misinterpretation in drawing research
conclusion. In short, internal validity is about
how the treatment really affects the independent
variable.
a). Internal Validity
Internal validity is about of the research
from any distractions in dependent variables, which
cause the misinterpretation in drawing research
conclusion. In other words, internal validity is
about how the treatment really affects the
independent variable. Steps to control the research
were used as follows:
a. The Control of Maturity
The maturity effect of the respondents is
controlled by considering the period of
research. Regarding with this maturity, the
period of the research conduct is relatively
short.

56
b. The Control of Research Respondents
To avoid the problem in respondents attendants
in treatment, respondents are checked strictly
and examined by a class teacher. The class
teacher takes the respondents’ performance as a
score.
c. The Control of Research Instruments
To avoid the changing of measurement, research
instrument used in the study is validated and is
assessed the level of reliability.
b). External Validity
External validity takes a significant role in
creating a quality of research conclusion. External
validity is dealing with how the research
conclusion can be generalized and applied in
57
population where the samples are used. If the
samples are representatives, the research
instruments are valid and reliable, the data
collection techniques and the analysis are correct,
the research will have high external validity
(Sugiyono, 2008: 267). Reliability is dealing with
the level of consistency and stability of the data
or finding. The reliable or consistent data tend to
be valid. That is why, the control of population
and ecology is needed.
a. The Control of Population
Samples taken have similar characteristics
with the population. In the research, the
target population is class XII students,
Jatinangor Senior High School. During the
treatment, samples are treated based the
procedures. They have a similar right.
b. The Control of Ecology

58
Treatment is done during the school day and in
English schedule. The experiment is done by
the researcher and monitored by the class
teacher. The researcher treats the
experimental and control class based on the
lesson plan. Respondents do not know that they
are being investigated. The teaching-learning
activity is running normally as it used to be.
To control the independent variable, the
writing test is used. Obtaining the validity
of the research, the writing test instrument
was validated before.
D. The Technique of Data Collection
1). Pre-Research Activity
There are two ways of data collection, library
and field research. In the library research, any
reference books, articles, journals and website are
read as many as possible dealing with the topic

59
discussion. Meanwhile, in the field research, the
researcher tries to get the factual data by giving
test and questioner. The test is used to collect
data of independent variable (Y) which is students’
writing skills. While the questioner is used to
collect data of the first dependent variable (X1)
that is Cooperative Learning method and to collect
data of the second dependent variable (X2) that is
Students’ reading interest.
In pre-research activity, the concept of
Cooperative Learning Method, reading interest and
writing skills was explored. The result of this
exploration is to get clear and précised
comprehension towards the variables. Next, the test
instruments were made. The instruments were reading
interest test and writing skills test. For reading
interest test, the purpose of the test is to obtain
the level of students reading interest, whether it
is high reading interest or low reading interest.

60
The test used Likert Scale as suggested by Riduwan
(2003:38-39). The language used for the test is
Bahasa Indonesia since the purpose of the test is
to obtain the level of reading interest, not to
obtain the level of English reading comprehension.
That is why the use of Bahasa Indonesia in the
students’ reading interest is accepted. For the
positive statements, the scale is shown as the
table below.
Table 3.4 Positive Statement in Likert ScaleOption Scale
Strong Agree/Sangat Setuju 5
Agree/Setuju 4
Not Sure/Ragu-Ragu 3
Disagree/Tidak Setuju 2
Strong Disagree/Sangat Tidak
Setuju
1
For the negative statements, the scale is shown in
the following table.
61
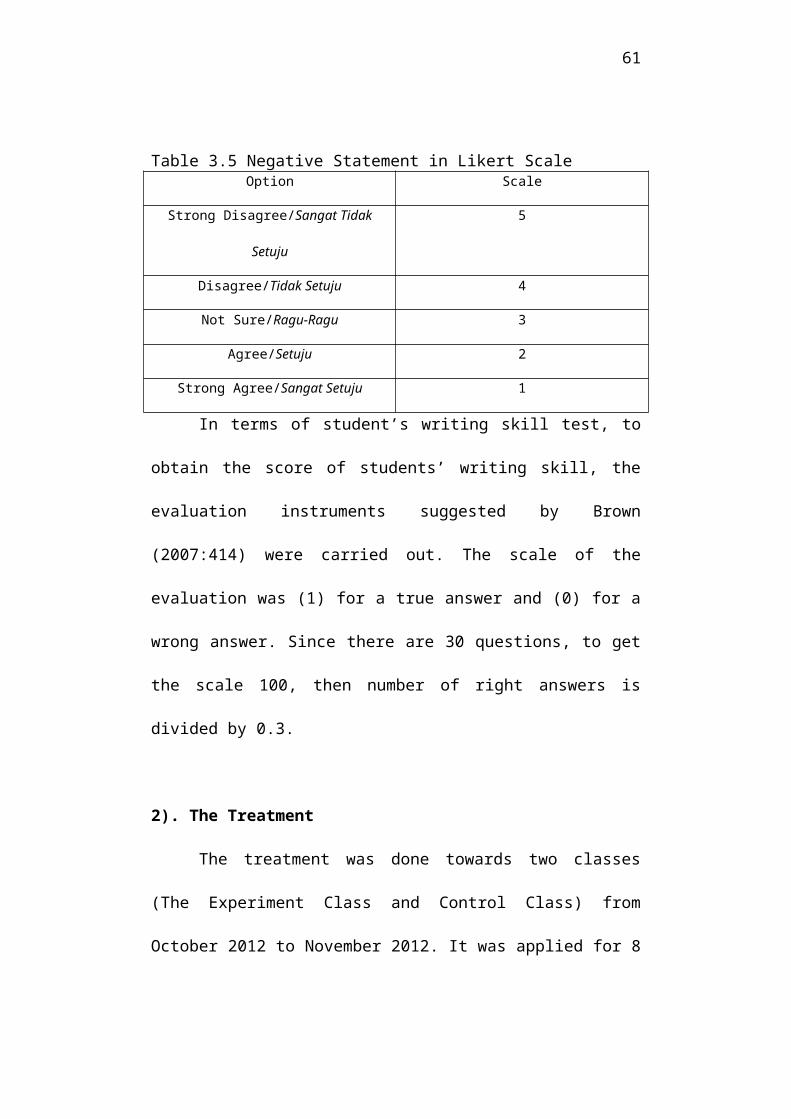
Table 3.5 Negative Statement in Likert ScaleOption Scale
Strong Disagree/Sangat Tidak
Setuju
5
Disagree/Tidak Setuju 4
Not Sure/Ragu-Ragu 3
Agree/Setuju 2
Strong Agree/Sangat Setuju 1
In terms of student’s writing skill test, to
obtain the score of students’ writing skill, the
evaluation instruments suggested by Brown
(2007:414) were carried out. The scale of the
evaluation was (1) for a true answer and (0) for a
wrong answer. Since there are 30 questions, to get
the scale 100, then number of right answers is
divided by 0.3.
2). The Treatment
The treatment was done towards two classes
(The Experiment Class and Control Class) from
October 2012 to November 2012. It was applied for 8
62
(eight meetings) or 3 weeks. From the first meeting
to the last meeting, the treatment in The
Experimental Class used Cooperative Learning Method
and in the Control Class used conventional method.
In the last meeting, the writing test was conducted
in both classes.
3). A Research Procedure
a). Preparation
In preparation stage, a lesson plan, the teaching
materials including worksheet and teaching aids,
and schedule were arranged.
b). During the activities
In this stage, the teaching learning meeting was
conducted based on the schedule. An English subject
for an experimental and control class had 5

63
hours/units (one unit= 45 minutes) a week or 3
meetings a week.
c). Post Activities
In this stage, the writing test was conducted in 8th
meeting. Meanwhile, the students’ reading interest
test was held in the 1st meeting.
E. Research Variables
In this study, there are two dependent
variables. They are (1). teaching method, which is
Cooperative Learning Method and conventional
method, and (2). reading interest which consists of
high reading interest and low reading interest.
After conducting the reading interest test, the
classes then were treated with writing subject.
Writing was used as the subject with the initial
assumption that students who have higher reading
interest, they tend to have good writing skills

64
than students who have low reading interests. The
writing subject was explored and analyzed, then the
elements or writing were exposed. Some elements of
writing were generating the ideas, narrowing down
the topic, understanding the topic sentence, main
idea, supporting ideas, discourse, grammar,
punctuation and mechanics (Brown: 2007: 413).
F. Instrument of the Research
In this research, 2 (two) research instruments
were made in terms of Students’ reading interest,
which consists of 30 questions and of students’
writing skills, which consists of 30 questions.
To obtain the empirical data and to indicate the
effect of dependent variables towards independent
variable, questioners were used to indicate the
students’ reading interest and writing tests were
conducted to uncover the effect of dependent
variables towards an independent variable.

65
1. Students’ reading interest Variable
a. Conceptual Definition
Reading interest is a high willingness
or eagerness towards reading texts. Reading
texts here are not only textual books, or
school books, but any books, such as
novels, comics, information on internet,
television, mobile phone, etc. Individual
interest has been viewed as a relatively
long-lasting predisposition to reengage
with particular objects and events.
Increased knowledge, value, and positive
affect have been connected with individual
interest
b. Operational Definition
Students’ reading interest is the total
score that students achieved in answering
the questions of students’ reading interest

66
instrument. Scale of measurement is the
interval which is transformed to be nominal
scale using Likert scales.
c. The Framework of Reading Interest
Instruments
The reading interest instruments are
arranged and developed by considering the
background theory of reading interest.
Furthermore, the instruments are tested to
60 respondents . The purpose of the test is
to obtain the level of validity and
reliability. of the instruments. Here are
the framework of reading interest
instruments.
Table 3.6 The Framework of Reading InterestNo Measured Aspects Questions No Total
1 Awareness 1, 2, 3, 4, 5, 6, 7, 8, 9, 11 10
2. Ability 10, 12, 13, 14, 15, 16, 17, 10
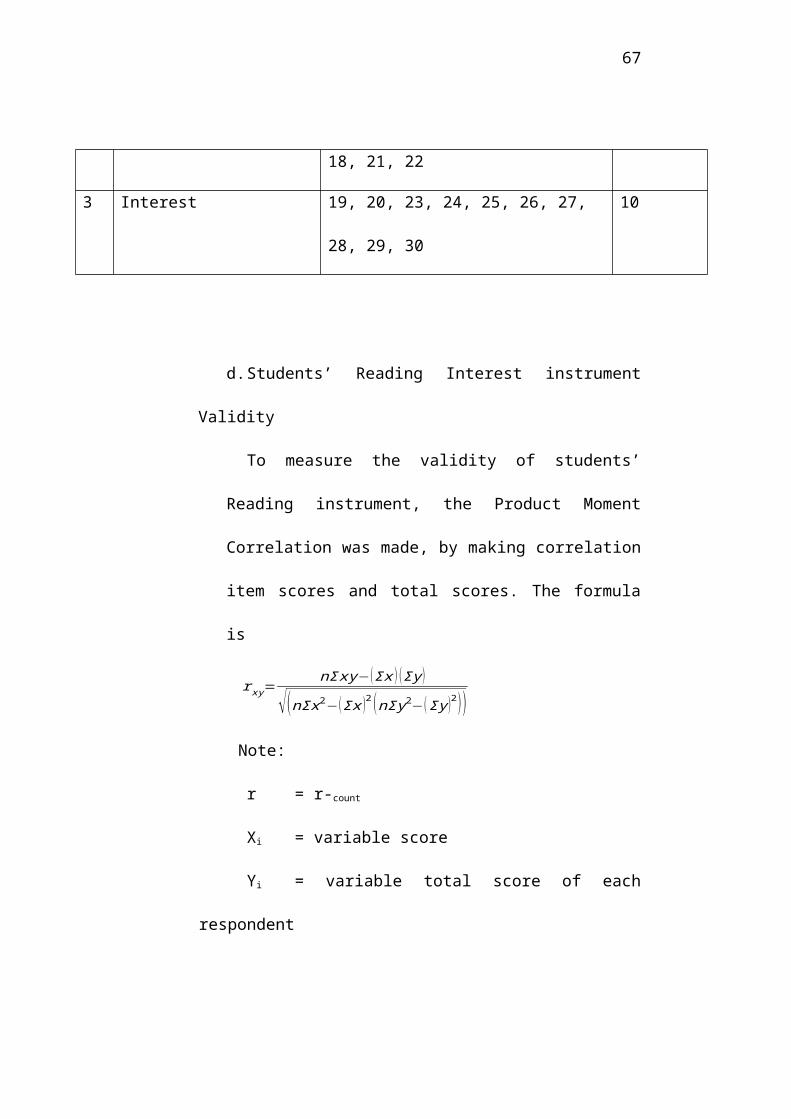
67
18, 21, 22
3 Interest 19, 20, 23, 24, 25, 26, 27,
28, 29, 30
10
d.Students’ Reading Interest instrument
Validity
To measure the validity of students’
Reading instrument, the Product Moment
Correlation was made, by making correlation
item scores and total scores. The formula
is
rxy=nΣxy−(Σx ) (Σy)
√(nΣx2−(Σx )2 (nΣy2−(Σy)2))
Note:
r = r-count
Xi = variable score
Yi = variable total score of each
respondent

68
N = total respondent
(Arikunto, 2006: 170)
e. Reading Interest Variable Reliability
To obtain the reliability of student’s
reading interests, the formula of Alpha
Cronbach was engaged as follow:
r11 = [ k(k−1) ] [1−∑αb2
αt2 ]Note:
r11 = instrument reliability
k = total questions
∑αb2 = total each variant
αt2 = total variants
The developing process of reading
interest instrument was begun by organizing
the instruments using Likert Scales. It
consisted of 30 questions based on the
indicators of Student’s reading instrument

69
variables. The validity process was
conducted by analyzing the data of
student’s reading instruments, which are
coefficient of correlation and reliability
with the total result of 30 questions.
2. Students’ Writing Skill Variable
a. Conceptual Definition
Writing is the representation of
language in a textual medium through the
use of a set of signs or symbols. Writing
is a process which presents certain
sequences from pre-writing activities to
revision.
b. Operational Definition
Students’ writing skill is the score
being achieved by students after following
the learning process that can be measured

70
on the cognitive aspects, which are
knowledge, comprehension, application and
analysis. Writing skills are specific
abilities which help writers put their
thoughts into words in a meaningful form
and to mentally interact with the message.
c. Instrument of Students’ Writing skill
variable
To measure the students’ writing skill,
the instrument is made based on the
understanding of writing elements, which
are: organization, content, discourse,
syntax, vocabulary, mechanics (Brown, 2007:
413-417). The writing material used for the
primary data is writing material of class
XII. The framework of writing instruments
can be shown in the table below:

71
Table 3.7 The Framework of Writing InstrumentNO Measured Aspects No of Questions Total
1 Organization 1, 2, 3, 4, 5 52 Content 11, 12, 13, 14, 15 53 Discourse 6, 7, 8, 9,10 54 Syntax 16, 17, 18, 19, 20 55 Vocabulary 21, 22, 23, 24, 25 56 Mechanic 26, 27, 28, 29, 30 5
TOTAL 30
d. Instrument of Students’ Writing Skills
variable
The developing process of Students’
writing skills instrument was started from
organizing the multiple choices instrument
consist of 30 questions based on the table
above. The instruments were taken from
National Examination tests (Ujian Nasional) and
elaborated with the measured aspects. It
was based on the national curriculum.
3. The Experiment of Test Instrument
a. Test of Validity

72
In this research, the test of validity
is conducted by correlating each question
to the total scores of each variable. The
correlation numbers that are cultivated
statistically need to be compared to the
critical numbers of coefficient (r) in the
correlation table. If F-observed > F-table, it
means the data are significant (valid) and
can be used in the experiment of research
hypothesis. On the other hand, If F-observed <
F-table, it means the data are not significant
(invalid) and cannot be used in the
experiment of research hypothesis.
The product moment correlation was used by
making correlation item scores and total
scores. The formula is
rxy=nΣxy−(Σx ) (Σy)
√(nΣx2−(Σx )2 (nΣy2−(Σy)2))
Note:

73
r = r-count
Xi = variable score
Yi = variable total score of each
respondent
N = total respondent
(Arikunto, 2006: 170)
b. Test of Reliability
Reliability is used to measure the consistency
of measurement tool in a certain research.
After conducting validity test upon the
questions and statements that will be used in
this research, it will be then continued with
the reliability test. The objective of
reliability test is to observe the collecting
data instrument. It needs to show accuracy,
stability or consistency of observed
instruments in some certain occurrences which
are conducted in different period of time. The

74
test of reliability was conducted upon valid
questions and statements only. The formula of
Alpha Cronbach was engaged as follow:
r11 = [ k(k−1) ] [1−∑αb2
αt2 ]Note:
r11 = instrument reliability
k = total questions
∑αb2 = total each variant
αt2 = total variants
G. Technique of Data Analysis
The data analysis is used to examine the
hypothesis. Steps which are used to examine the
hypothesis are by examining the normality and
homogeneity of data test by using P-P plot test,
Kolmogorov-Smirnov (KS) test, and Levene’s test.
The test of validity, reliability, normality and
homogeneity used Statistical Packages For Sosical Sciences

75
(SPSS) software 16.0, getting the accurate
calculation of data analysis (Abdullah, 2012: vi).
The hypothesis testing used two ways ANOVA.
1. Test of Validity
Validity test is conducted to measure the
accuracy of the instrument used. The high
validity instrument possess low error variant
which means the collected data is valid.
The formula of validity test:
r = n.∑ iXiYi−∑iXi.∑ iYi
√n.∑ i−(∑iXi )2√n.∑ i−(∑iYi )2
Note:
r = r-count
Xi = variable score
Yi = variable total score of each
respondent
N = total respondent
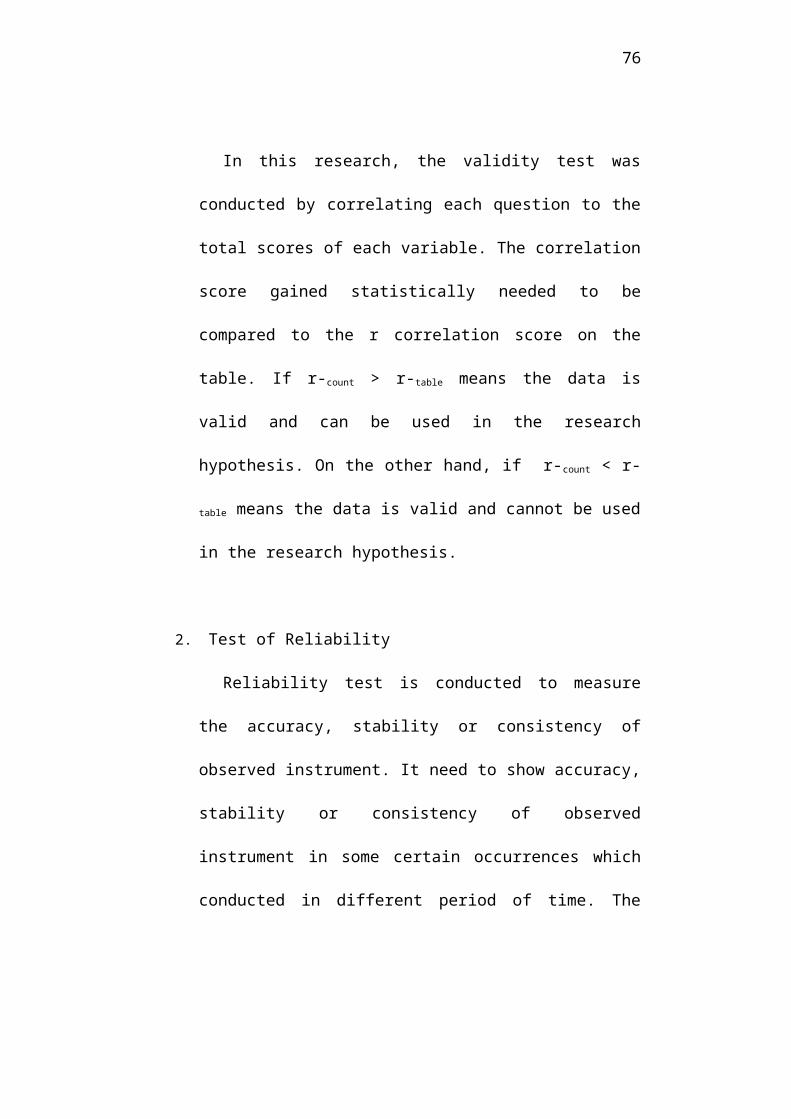
76
In this research, the validity test was
conducted by correlating each question to the
total scores of each variable. The correlation
score gained statistically needed to be
compared to the r correlation score on the
table. If r-count > r-table means the data is
valid and can be used in the research
hypothesis. On the other hand, if r-count < r-
table means the data is valid and cannot be used
in the research hypothesis.
2. Test of Reliability
Reliability test is conducted to measure
the accuracy, stability or consistency of
observed instrument. It need to show accuracy,
stability or consistency of observed
instrument in some certain occurrences which
conducted in different period of time. The

77
test of reliability is conducted upon valid
quest ions and statements only.
The formula of validity test:
r11 = [ k(k−1) ] [1−∑αb2
αt2 ]Note:
r11 = instrument reliability
k = total questions
∑αb2 = total each variant
αt2 = total variants
The correlation coefficient of reliability
is measured by comprising counted coefficient
(r-h) to r table (r-t) on the significant
level of 5%. To acknowledge the effect of
teaching method (X1) and students’ reading
interests (X2) toward students’ reading

78
writing skills (Y) can be measured by multiple
regression of statistic analysis.
The formulation of multiple regression with
2 independent variables and 1 dependent
variable, generally noted as below:
Mathematically Y = f (X1, X2) … (1), then
described as follow:
Y = a + b1X1 + b2X2 + E ………...(2),
Y = Students’ Writing Skills score
a = value of Y on the intersection between
linear to vertical Y X1 = Cooperative
Learning method
X2 = Students’ Reading Interests
b1, b2 = slope connected to X1 and X2
variable
H. Statistical Hypothesis
The statistical hypothesis is formulated
as follows:

79
1. Hypothesis 1 Ho : αy1= 0 and H1: αy1> 0
If T-observed > T-table, means H0 is rejected and
H1 is accepted.
2. Hypothesis 2 Ho : αy2 = 0 and H1: αy2> 0
If T-observed > T-table, means H0 is rejected and
H1 is accepted.
3. Hypothesis 3 Ho : αy1.2 = 0 and H1: αy1.2 > 0
If F-observed > F-table, means H0 is rejected and
H1 is accepted.