Annual Plan 2003-04
97
459 CHAPTER 10 INDUSTRY AND SERVICES 10.1 INDUSTRY Pace and Pattern of Industrial Output (2002-03) Manufacturing Sector has a share of 79.36% in the Index of Industrial Production (IIP). During the year 2002-03, the IIP grew at the rate of 5.8% as compared to 2.1% in 2001-02. The manufacturing sector registered a growth rate of 6.0% as against 2.8% during 2001-02. As per the use based classification, production of basic goods, capital goods, intermediate goods and consumer goods exhibited higher increase during April-November 2002-03 as compared to 2001-02. SECTOR-WISE INDEX OF INDUSTRIAL PRODUCTION (percentage change) Weight 2000-01/ 2001-02/ 2002-03 1999-00 2000-01 (Apr-Mar) General Mining & Quarrying 10.47 3.7 1.8 5.8 Manufacturing 79.36 5.3 2.8 6.0 Electricity 10.17 4.0 3.1 3.2 IIP (General) 100.00 5.0 2.8 5.8 Use Based Classification Basic Goods 35.5 3.9 2.8 4.8 Capital Goods 9.3 1.8 -3.9 10.4 Intermediate Goods 26.5 4.7 1.6 3.8 Consumer Goods of which 28.7 8.0 6.0 7.2 i) Consumer Durables 5.4 14.5 11.5 -6.4 ii) Non Durables 23.3 5.8 4.0 12.3 100.0 2. The above data suggests possibility of an upswing in the trend of growth of IIP as well as manufacturing sector. In order to sustain this growth pattern during the year 2003-04, aggressive supportive measures are needed in respect of different industry segments. 3. A closer look at the constituent product groups under manufacturing sector, shows that while certain industry segments have performed better in the year 2002-03 and 2003-04 (first two months), certain other segments have lagged behind as compared to the previous year’s performance.
-
Upload
khangminh22 -
Category
Documents
-
view
0 -
download
0
Transcript of Annual Plan 2003-04

459
CHAPTER 10
INDUSTRY AND SERVICES
10.1 INDUSTRY
Pace and Pattern of Industrial Output (2002-03)
Manufacturing Sector has a share of 79.36% in the Index of Industrial Production (IIP). Duringthe year 2002-03, the IIP grew at the rate of 5.8% as compared to 2.1% in 2001-02. Themanufacturing sector registered a growth rate of 6.0% as against 2.8% during 2001-02. As perthe use based classification, production of basic goods, capital goods, intermediate goods andconsumer goods exhibited higher increase during April-November 2002-03 as compared to2001-02.
SECTOR-WISE INDEX OF INDUSTRIAL PRODUCTION (percentage change)
Weight 2000-01/ 2001-02/ 2002-031999-00 2000-01 (Apr-Mar)
General
Mining & Quarrying 10.47 3.7 1.8 5.8
Manufacturing 79.36 5.3 2.8 6.0
Electricity 10.17 4.0 3.1 3.2
IIP (General) 100.00 5.0 2.8 5.8
Use Based Classification
Basic Goods 35.5 3.9 2.8 4.8
Capital Goods 9.3 1.8 -3.9 10.4
Intermediate Goods 26.5 4.7 1.6 3.8
Consumer Goods of which 28.7 8.0 6.0 7.2
i) Consumer Durables 5.4 14.5 11.5 -6.4
ii) Non Durables 23.3 5.8 4.0 12.3
100.0
2. The above data suggests possibility of an upswing in the trend of growth of IIP as well asmanufacturing sector. In order to sustain this growth pattern during the year 2003-04, aggressivesupportive measures are needed in respect of different industry segments.
3. A closer look at the constituent product groups under manufacturing sector, shows thatwhile certain industry segments have performed better in the year 2002-03 and 2003-04 (firsttwo months), certain other segments have lagged behind as compared to the previous year’sperformance.

460
4. Cement, steel, wheat flour/ maida, milk powder, diesel engines, auto ancillary and partshave performed better. On the other hand, PVC pipes and tubes, shoe uppers, cigarettes,Caustic Soda, scooters and mopeds have performed poorly.
Industrialisation of Backward Areas
Growth Centre Scheme
5. The Growth Centre Scheme commenced in the year 1991. The objective of the growthcentre Scheme was to create industrial infrastructure in selected backward areas to enable theState and its agencies to attract industrial units to the growth centre. Out of the 71 growth centreidentified for development through out the country, 68 Growth Centres have so far beensanctioned since inception of the scheme. The remaining three growth centre are to besanctioned in the States of Assam, Uttranchal, and Sikkim. The project reports submitted bythese State Governments are under active consideration of the Central Government. Of the 68Growth Centre sanctioned so far, 44 growth centres can be regarded as functional whereallotment of industrial plots has commenced. Remaining Growth Centres are in various stagesof implementation. No new growth centres have been sanctioned in Tenth Plan.
6. The central assistance is released on the basis of physical and financial progress madein the implementation of the project by the State Government. Funds released as on 31.3.2003by the Central Government aggregate to Rs. 427.49 crore and Funds released by StateGovernment and its implementing agencies is Rs. 755.24 crore. Capital investment of Rs.9386.76 crore has been attracted resulting in employment generation to the tune of over 31400persons. State Governments have been asked to conduct an impact assessment studies on theindustrilisation in the backward districts of the respective states as a result of the implementationof the scheme.
7. The Scheme is under review in the Planning Commission under its ZBB for the year 2003-04. Based on the evaluation being conducted by PEO, a decision would be taken oncontinuation of the scheme with or without modification or otherwise.
Transport Subsidy Scheme
8. The Transport Subsidy Scheme was introduced in July, 1971 with a view to promoteindustrialization in hilly, remote and inaccessible areas. The Scheme is applicable to allindustrial units (barring plantations, refineries and power generating units) irrespective of theirsize, both in private and the public sector located in North Eastern region, Darjeeling District ofWest Bengal, Jammu & Kashmir, Himachal Pradesh, Uttaranchal. The scheme has beenextended upto the end of Tenth Five Year Plan period and an amount of Rs. 721.17 crore hasbeen released to various States and UTs till 31.12.2002.
9. An impact assessment study carried out on the scheme presents a mixed scenario ofindustrial growth in various States. The State of Assam could not do well in terms of chosenparameters, State of Himachal Pradesh has performed well in terms of output and employmentas the number of factories had grown at an annual rate of 10.5%. States of Meghalaya and

461
Uttaranchal depict an encouraging trend in industrialization. Among the major industrial groups,food and food products, basic metals and alloys, machinery and equipment, electricity generationfigure in these States.The presence of SSI among the beneficiaries of the transport subsidyscheme is significant.
North East Industrial Policy, 1997
10. Following the Prime Minister’s initiatives for accelerating industrial development in theNorth East Region, the Government announced a New North-East Industrial Policy (NEIP) on24th Dcember, 1997. Under this Policy, various concessions have been allowed to industrialunits in North Eastern Region, e.g., development of industrial infrastructure, subsidies undervarious schemes, excise and income-tax exemption for a period of 10 years etc. North-EastDevelopment Finance Corporation (NEDFi) was also designated as the nodal disbursing agencyunder the Scheme.
11. An impact assessment study carried out by NEDFi in 2002 has indicated that as against106 IEMs filed from August, 1991 to July, 1999 the number of IEMs filed during the periodAugust 1999 to May 2002 was 226 after the implementation of the policy, i.e., an increase of113%. Similarly, against an investment of Rs. 4403 crore during August 1991 to July, 1999,additional committed investment during the period from August, 1999 to May, 2002 was Rs.4257 crore. Further, direct employment generated as a result of the above investment was tothe extent of 33,763 persons. However, the benefits of these investments and employmentgenerated are mostly confined to in and around Guwahati and part of Meghalaya except in Teaand Plywood industries.
New Industrial Policy and other concessions for special category States
12. A special package section was created in the Department of Industrial Policy andPromotion for industrialization in special category States. In 2002-03, the Government announcedthree packages of economic incentives for promoting industrialization on the lines of North EastIndustrial Policy for the States of (i) Jammu & Kashmir, (ii) Sikkim, (iii) Uttaranchal and (iv)Himachal Pradesh.
Project Preparation Facility
13. Past experience suggests that the most critical constraint faced by relatively backwardstates is their inability to prepare and pose quality project proposals to funding agencies. Inorder to address these issues, the Planning Commission has established a Project PreparationFacility which provides 100% grant for financing professional preparation of project reports byState Governments with a view to attracting external and institutional financing for thedevelopment of the state. The facilities are available only to those states which have receivedless than 500 crore of external assistance during the preceding years. Full (100%) financing upto Rs. 25 lakhs is provided to enable the State to engage professional consultants forpreparation of project reports which conform to the lenders requirements and expectations.Backward States should access this facility as also familiarize themselves with CSS/ CSSchemes in order to augment their financial resources.

462
Industrial Infrastructure Up-gradation Scheme
14. A new scheme under this title is in advanced stage of consideration. Considered as amajor initiative with an outlay of Rs.625 crore, the primary objective of the IIUS scheme is toenhance competitiveness of the domestic industry by providing quality infrastructure throughpublic-private partnership in selected functional clusters/locations which have greater potentialto become globally competitive. The improvements in performance will be secured in selectedcompetitiveness indicators to be developed in consultation with the each industrial group.
15. Central assistance per cluster/location will be restricted to 75% of the project cost subjectto a ceiling of Rs. 50 crore. The remaining 25% will be financed by other stake holders of therespective cluster/location with minimum industry contribution of 15% of total project cost andGovernment funding will be confined only to creation of durable assets and activities relating toproductivity enhancement and no recurring expenditure will be funded from Governmentcontribution.
Integrated Development of Leather Sector
16. Keeping in view export potential of leather sector, a UNDP assisted National LeatherDevelopment Programme was implemented in 2 phases during 1992 to 1998 and 1998 to 2002.The programme has led to upgrading of training systems, strengthening of R&D efforts anddevelopment of small-scale entrepreneurship in the leather sector. As an effort to supplementthe said programme, a separate programme titled Indian Leather Development Programme(ILDP) was taken up for implementation during 9th Plan at a total outlay of Rs.17.80 crore. Underthis programme, decentralized common facilities centre, design studios etc. were set up atvarious locations in the country. Besides, a new scheme viz. Tannery Modernization Schemewas also initiated under ILDP.
17. Integrated Development of Leather Sector in the 10th Plan proposes continuation ofongoing schemes/ activities like strengthening of non-footwear sector, village and tiny leatherenterprise, technology/ skill up-gradation, marketing supports etc. In addition, important schemesunder the programme viz, modernization of tannery industry, expansion of footwear industry,modernization of footwear components and consolidation of leather goods and garments havebeen reoriented and expanded in line with specific need for growth of the sector. An outlay ofRs.290 crore within the overall outlay of Rs. 400 crore earmarked for leather sector is in theprocess of being approved for implementation of these schemes during 10th Plan. This will befollowed by consideration of the remaining investments of Rs.110 crore in backward and forwardsectoral linkages.
Intellectual Property Rights
18. It is felt that a consolidated approach is required to deal with WTO negotiations and IPRissues in the ensuing rounds. Accordingly, a Group of Ministers (GOM) has been constituted togo into this vital issue holistically based on interpretation of views of all the concerned Ministries/Departments and agencies so as to propagate a consistent stand in this regard. The scope ofthe GOM covers all facets of IPR issues such as Patents, Design, Traditional Knowledge etc.

463
19. INDUSTRIAL ENTREPRENEUR MEMORANDA (IEMs): Since the announcement of NewIndustrial Policy in 1991, 47312 IEMs have been filed with the Government till December, 2002establishing new units, for manufacture of new articles and expansion of existing units, etc.These IEMs had a proposed investment of about Rs.10,37,000 crore and proposed employmentof more than 82 lakh persons. Since the inception of the IEM scheme, till December, 2002, 5201Units have formally intimated commencement of commercial production. The investmentreported in respect of these IEMs is about Rs.1,89,210 crore.
Foreign Direct Investment
20. Based on purchasing power parity, India is the fifth highest economy in the world (rankingabove France, Italy, the United Kingdom, and Russia) and has the third largest GDP in the entirecontinent of Asia. India is also one of the few markets in the world which offers high prospectsfor growth and earning potential in practically all areas of business. Yet, despite the practicallyunlimited possibilities in India for overseas business, the world’s most populous democracy has,until fairly recently, failed to get the kind of enthusiastic attention generated by other emergingeconomies such as China.
21. Foreign Direct Investment (FDI) is permitted under the following forms of investments
• Through financial collaborations.• Through joint ventures and technical collaborations.• Through capital markets via Euro issues.• Through private placements or preferential allotments.
Foreign direct investments in India are approved through two routes:
(a) Automatic approval by RBI
22. The Reserve Bank of India accords automatic approval within a period of two weeks(provided certain parameters are met) to all proposals involving:
• Foreign equity up to 50% in 3 categories relating to mining activities (List 2).• Foreign equity up to 51% in 48 specified industries.• Foreign equity up to 74% in 9 categories.• Items from 74% category also includes items from 51% category, 74% participation
shall apply.
23. The lists are comprehensive and cover most industries of interest to foreign companies.Investments in high-priority industries or for trading companies primarily engaged in exportingare given almost automatic approval by the RBI.
24. (a) The FIPB Route: Processing of non-automatic approval cases: Foreign InvestmentPromotion Board approves all other cases in which automatic route is not applicable. Normalprocessing time is 4 to 6 weeks. Although some scope for further liberalization no doubt exists,Indian Economy has opened up substantially in terms of FDI inflow as can be seen from therelated data/ information in Annexures- 10.1.1 & 10.1.2.

464
Export Promotion Effort:
25. The country has recorded a remarkable growth of 23.38 per cent in exports. As againstexport volume of Rs. 150111 crore during April-December 2001, increased export volume for thesame period in 2002 has been Rs. 18521 crore. The new Export Import (EXIM) Policy broughtout in March 2002 has specific emphasis on export market diversification so as to bestowspecial attention to regions hitherto untapped. Accordingly, a medium term export strategy hasbeen drawn up with particular objectives of achievement of greater export competitiveness andenhancement of India’s share in world trade. In order to fulfil these objectives, several policyinitiatives/ measures have been taken up during 2002-03. Some important initiatives arediscussed below:
26. Assistance to States for Development of Export Infrastructure (ASIDE): A scheme,viz. ASIDE has been evolved for providing incentive-linked assistance to State Governmentswhich will result in concomitant growth in the infrastructure necessary for promoting exports atthe state level. Approved activities that would be funded through ASIDE Scheme, inter alia,include new EPIP/ EPZ, export enclaves, complementary infrastructure like road connecting theproduction centres with the ports, inland container depots, container freight stations, minor portsjetties, common effluent treatment plants etc. The existing schemes namely Critical InfrastructureBalance (CIB), Export Promotion Zone (EPZ), Export Development Fund (EDF) for NorthEastern Region (NER) and Sikkim and Export Promotion Industrial Park (EPIP) have beensubsumed in the new ASIDE scheme. 80% of the funds of the scheme will be allocated to theStates according to the export performance criteria and remaining 20% as well as unutilizedportion of past allocations would be retained at Central level to take up inter-state projects andcarry out activities for boosting up of exports from North East region. As against release of Rs.49.52 crore in 2001-02, an amount of Rs. 173 crore has been released upto December 2002(2002-03) under the ASIDE scheme for taking up 139 numbers of projects having totalinvestment requirement of Rs. 844 crore.
27. Market Access Initiative (MAI) Scheme: It had been devised to put in place an instrumentwhich is not only WTO compatible but would also mitigate the negative effects of varioushandicaps faced by the exporters vis-à-vis their counterparts in the competing countries toachieving a double digit growth rate in our exports on a sustained basis. The scheme hasimplicit mechanism to pursue product-specific approach in order to tap potential markets inunexplored regions.
28. MAI was taken up in the terminal year of the 9th Five Year Plan at a cost of Rs. 14.50 crorewith the view to assist Export Promotion Councils in undertaking marketing studies, supportexporters to set up showrooms/ warehousing facilities, publicity campaigns and brand promotionetc. As many as 42 numbers and 16 numbers of market studies identified during 2001-02 and2002-03 are in different stages of completion. Besides a marketing centre for cut flowers exportsby APEDA has been set up in Netherlands by way of assistance under the scheme. A broaderversion of the scheme incorporating additional components/ activities like subsidizing registrationcharges for pharmaceutical, bio-technology and agro-chemicals engineering products, assistanceto cottage and handicraft units and earmarking funds to develop websites for virtual exhibitionsand exports facilitation assistance to Exim-Bank for providing project specific assistance for
465
exports to select markets during specific periods etc. has already been approved by the EFCat a cost of Rs. 552 crore for implementation during Tenth Plan.
29. SPECIAL ECONOMIC ZONES: A New Policy was introduced in the EXIM Policy effectivefrom 1.4.2000 for setting up of Special Economic Zones in the country consisting of world classinfrastructure with a view to provide an internationally competitive environment for exports incase of units engaged in activities like manufacturing, trading, reconditioning and repair orservicing. The units in the Zone have to be a net foreign exchange earner but they shall notbe subjected to any pre-determined value addition or minimum export performance requirements.Sales in the Domestic Tariff Area by SEZ units shall be subject to positive foreign exchangeearning and on payment of applicable Customs duty and import policy in force. Labour laws willbe simplified in SEZs. Facilities for SEZ Units inter alia include
• No licence required for import.• Duty free import of capital goods, raw materials, consumables, spares etc. and
procurement from the domestic market.• 100% income –tax exemption for 5 years and 50% exemption for 2 years thereafter.• Domestic Sales on full Customs duty subject to import policy in force.• 100% FDI in manufacturing sector allowed through automatic route.
30. Government has already issued notification for conversion of the existing Export ProcessingZones at Kandla and Surat (Gujarat), Santa Cruz (Maharashtra) and Cochin (Kerala) intoSpecial Economic Zones.Approvals have also been given for setting up of 17 Special economicZones in the country on the basis of, proposals received from the Private Sector/ StateGovernments. Central Government will not like to involve itself for any new SEZ in the countrybut would prefer private and joint sector to take the initiative.
31. Four SEZs having 370 units have become functional so far and exports from these unitshas been exhibiting increasing trend. As exports from these zones have increased from Rs.6088.21 crore in 2000-01 to Rs. 6271.94 crore in 2001-02. Export up to September 2002 hasalready attained a level of Rs. 3428.80 crore.
32. Agricultural and Processed Food Products Export Development Authority (APEDA)-which is mandated with the responsibility for export promotion and development of agriculturalproducts including floriculture, fresh fruits and vegetables, processed food and livestockproducts, proposes to implement schemes for infra-structural development, database andsurvey/study, export promotion, market development and packaging up gradation, etc. Similarly,the Marine Products Export Development Authority (MPEDA)- a statutory body responsiblefor development of the Marine Products Industry with special reference to exports, proposes toimplement schemes for export production-capture fisheries, export production-culture fisheries,induction of new technology, modernisation of processing facilities and market promotion etc.Major activates of Tenth Plan schemes of MPEDA include setting up of liquid chromatographand mass spectra photometer facilities at seven existing laboratories and two new laboratoriesat Nellore and Bhimavaram, A.P. to meet the requirements of quality prescribed by EuropeanUnion. Apart from this, establishment of ornamental fish units/ parks and strengthening ofmarket development activities have been contemplated to arrest the declining trend of exportof marine products.

466
33. Anti-Dumping and Allied duties and import of sensitive items: The DesignatedAuthority in Department of Commerce has been handling Anti-Dumping cases since 1992.However, the Directorate General of Anti-dumping & Allied Duties (DGAD) was constituted inApril, 1988. During the year 2002-03, India has initiated 30 cases. Besides these new cases,mid-term review in four cases, sunset review in six cases and new shippers review in four caseswere also undertaken during the year. During the year, a total of 29 Final Findings were issued,28 of which were arising out of the investigations initiated in the previous year. Of the 27Preliminary Findings issued during the year, 18 pertain to the current year, i.e. 2002-03, whilethe rest relate to cases initiated towards the end of year 2001-02. Twelve cases initiated towardsthe end of 2002-03 are still under investigation for issuing Preliminary Findings. According to theWTO report for January to June 2002, India initiated a maximum 25 anti-dumping investigations,followed by United States (22) and Argentina (10). India is today one of the major playersamong the WTO member countries who are using as well as facing the anti-dumping measures.
34. Export Inspection Council (EIC), which is the official export inspection and certificationbody mandated to carry out pre-shipment inspection and certification of notified commoditieshas proposed to undertake the task of modernization/upgradation of its systems and labs andproviding services to the industry through information on regulatory requirements of the importcontrol systems.
35. Export and Credit Guarantee Corporation (ECGC): Credit Insurance is an importantrequirement for Exports. Tenth Five Year Plan provides an outlay of Rs. 400 crore foraugmentation of equity base of ECGC. It is expected that this will fructify during 2003-04. Therequirements of Project Exports also need to be factored in.
36. Modernization of Patent Offices: As part of project approved recently, modernization ofPatent Offices, computer equipment for initial level computerization have been provided andinternet connectivity has been established in Patent Offices. On line search facilities have beenprovided along with ISDN facility to ensure uninterrupted connectivity and a broad-banddedicated connectivity has been established between Kolkata and Delhi offices. Front officesoftware has been installed to generate computerized information about receipt and status ofpatent applications list of books and journals in the library. Digitization, scanning etc. of 90000patent records and 28000 design records have already been completed.
37. A total of 10592 applications including 8221 from other countries were filed under PatentsAct, 1970 during 2001-02. Applications for patent filed during the period April-October 2002were 6526. The sale for the period November 2002 – March 2003 is expected to be 5380.
38. Director General of Foreign Trade: A scheme for modernization and upgradation of theoffice of Director General of Foreign Trade has been approved during 2002-03 with an outlayof Rs. 14 crore. A beginning was made in 1980 to computerize certain functions and proceduresin some offices of DGFT. Subsequently, a comprehensive computerization programme wasdrawn up during the Ninth Five Year Plan. With the implementation of this plan, networking ofoffices was completed and the facility of video conferencing to enable the importers/ exportersto interact with DGFT has been provided. The proposal approved in 2002-03 would permitprocessing of applications and issue of licenses on line. It will also provide electronic linkages

467
with other agencies such as customs, banks, income tax, ports etc. This project is targeted tobe commissioned by the end of the Tenth Plan.
Public Sector:
39. As on 31.3.2001, there were 250 Central Public Sector Enterprises excluding 6 InsuranceCompanies and 2 Financial Institutions. Of the 234 operating CPSEs, loss making were 111 and66 industrial PSEs whose networth had become negative and had become sick were registeredwith BIFR. Of these 34 were the units taken over by the Government from private sector tosafeguard the interest of workers.
Sick PSUs:
40. The sick PSUs cases referred to BIFR has been transferred to National Company LawTribunal. Decision on sick PSEs is taking long time and revival package apart from the problemof resource availability suffers from certain uncertainties on its viability. Such cases arediscussed alongwith respective sectoral issues. Status of the sick CPSEs with BIFR as on30.6.2001 is given in the Table below:-
41. Winding up has been recommended for the following units:
Name of PSU Present Status
1 Bharat Gold Mines Ltd., Since being closed
2 Bharat Process & Mechanical Engineers Ltd. -do-
3 Mandya National Paper Mills Ltd., -do-
4 National Bicycle Corporation of India Ltd. -do-
5 Tannery & Footwear Corporation of India Ltd. -do-
6 Weighbird (India) Ltd -do-
7 Mining & Allied Machinery Corporation Ltd. Permission for closurereceived.
8 Cycle Corporation of India Ltd. Government has approvedwinding up
9 Maharashtra Antibiotics & Pharmaceuticals Ltd -do-
Disinvestment :
42. A policy decision has been taken to disinvest Government equity in Public SectorUndertakings (PSUs) preferably to a strategic partner. However, PSUs in the strategic sectorwould normally be excluded from the aforesaid process. Ministry of Disinvestment (MODI) istaking steps for phase-wise disinvestments of equity held by Government in the PSUs as perprovisions laid down in the related guidelines already in place.
43. In course of carrying out the disinvestments process, need for further refinement of someareas was felt. Accordingly, the Ministry of Disinvestment has now prepared the second edition

468
of the document “Disinvestment Policy, Procedures and Progress’ incorporating the requisitechanges in the light of the experience gained during the intervening period. Additionally,guidelines have also been suitably modified to ensure participation of employees in thedisinvestment/ sale of Government equity in PSUs. Apart from that, a proposal of incorporatingvarious options of financial restructuring of PSUs having weak financial structure prior to goingfor disinvestments is on the anvil. Such restructuring would facilitate further the disinvestmentsprocess.
44. The Disinvestment Commission made recommendations for disinvestment of Governmentequity in respect of 75 PSUs up to March, 2003. Of these 36 Psus have already been approvedfor disinvestment. In regard to position of actual disinvestment since April, 1991 onwards, it isnoteworthy that disinvestemnt has taken place in 49 companies and actual receipt out of thesedisinvestments has been of the order of Rs.30484 crore as against a target of Rs.91.500 crore.The lower realization was owing to past practice of sale of minority stakes in different PSUswithout transfer of Management control. The Government subsequently modified its Policy toemphasise on strategic sale and simultaneous transfer of management control. Consequently,disinvestment process has gained momentum since 2000-01. Since adoption of policy ofstrategic sale, Government equity has been divested in 33 PSUs/ Government companies(inclusive of sale of 18 hotels of ITDC and 3 hotels of Hotel Corporation of India through de-merger) leading to realization of disinvestment proceeds to the tune of Rs. 11,260 crore. Outof these companies, 100% of Government equity stand divested in case of modern foods, 3hotels of HCI and 18 hotels of ITDC.
45. Disinvestment of Maruti Udyog Limited (MUL) has led to partial resurgence in the sharemarket. It would be prudent to take advantage of the position by speedy disposal of Governmentequity in other potential PSUs.
46. Consumer Awareness: Consumer awareness is presently being managed by theDepartment of Consumer Affairs through its 15-minute weekly AIR programme Jago GrahakJago through DAVP in all the primary and Vividh Bharti stations covering 22 languages. It hasbeen decided that a National Action Plan for consumer awareness/ redressal and enforcementof Consumer Protection Act (1986) would be evolved. Innovative ways of funding significantlylarger outlays required for this vital aspect need to be explored. In order to regulate and enforcestandards of weights and measures in respect of the weighing and measuring instruments usedby trade and commerce, the Central Government has upgraded facilities for nine laboratorieslocated in different states through the Consumer Welfare Fund (CWF). Remaining 93 Statestandard laboratories need to be strengthened expeditiously.
SECTORAL PROFILE
ENGINEERING INDUSTRY:
47. The Engineering Industry with its varied forward and backward linkages has predominantrole in industrial growth. The engineering sector encompasses an array of industries like heavyengineering industry/ capital goods industry, machine tool industry, heavy electrical industry,industrial machinery, transportation equipment manufacturing as well as auto industry. Theengineering sector has exhibited a remarkable improvement by registering an overall growth

469
rate of 5.3% during first nine months of 2002-03 as against 2.5% during the correspondingperiod of 2001-02.
48. There are 49 PSUs under the Department of Heavy Industry (DHI) engaged inmanufacturing, consultancy and contracting activities. Of these, 10 made profit in 2002-03 of Rs825.54 crore (anticipated) and remaining 39 made losses of Rs. 1437.86 crore. 9 PSEs havealready been closed/ wound up and operations of 3 more suspended. The total production in2002-03 has increased to Rs.12535 crore from Rs.1.670 crore recorded for 2001-02.
49. Out of 49 PSEs, 29 had been referred to BIFR. Of these, BIFR has sanctioned revivalschemes in 9 cases involving fresh infusion of Government of India fund of Rs.654 crore andfinancial restructuring of Rs.2103 crore. Within remaining 20 cases, winding up has beenrecommended for 11 cases, while firm view is yet to emerge for balance 9 cases. Apart fromBIFR cases, financial/ organizational restructuring has been approved for 7 PSEs which wouldrequire fresh infusion of Rs.531 crore.
50. An action plan has been drawn up for 49 PSUs under the Department of Heavy Industry.Under this plan, 16 PSUs have been referred to the Ministry of Disinvestment, 12 units are beingdealt with departmentally for joint venture/ disinvestment. In the case of Cement Corporation ofIndia, sale of the company is contemplated as a whole or as individual units. In respect ofAndrew Yule & Company Limited, Heavy Engineering Corporation and Hindustan Photo FilmsLimited, financial/ business restructuring is underway. Recommendations of BIFR/ AAIFR areawaited in respect of three units. Nine units have already been closed/ wound up. Similarprocess for three other units is contemplated. For the present, BHEL and HMT holding companyis to be retained as PSU. In order to prevent the health of the ‘public sector in transition’ fromdeteriorating and arresting erosion in its net worth, crucial balancing investments have beenapproved wherever considered appropriate.
51. Substantial progress has been made in formulating action plan for resolving issues suchas outstanding statutory dues, voluntary separation/ retirement terms and other areas of interestto public sector employees. Cooperatives of employees are now eligible to bid for disinvestingPSUs on somewhat preferential terms.
52. The ‘Auto Industry’ has made tremendous improvement during the last few years and hasassumed a significant position in the industry sector. It has recorded a turnover of aboutRs.82,000 in 2001-02 and has participation of almost all the global players. Against a totalinstalled capacity of 7.9 million vehicles (all type), it produced 5.37 million in 2001-02 andaround 6 million during 2002-03. There is no Central PSUs in the business, except MUL whereGovt. of India holds a share of 50%. However, in recent agreement with Suzuki SML share willbe revised to 54.2% Government has recently approved an Auto Policy for further developmentand growth of the sector with specific emphasis for improvement in quality. The DHI has drawnup a long term plan to set up and strengthen testing and certification facilities for the autoindustry to meet the growing stringent environment regulation and safety norms, which wouldrequire an investment of Rs.1500 crore over the years. Annual Plan 2003-04 has a provisionof Rs.25 crore for this purpose.
53. Out of 49 PSEs under DHI, 21 PSEs have signed MoUs during 2002-03. Total turnoverof 40 operating PSEs is anticipated at Rs.12,525.21 crore in 2002-03 which is about 7.4%

470
higher than the actual turnover of Rs.11,670.24 crore in 2001-02. A target of total turnover ofRs. 14,185.35 crore has been fixed for the year 2003-04.
54. Apart from provision of Rs 25 crore for setting up of testing facilities for auto industry, majorportion of earmarked budgetary support of Rs.100 crore in 2003-04 is meant for lump sumprequirement on projects and annual additions/ maintenance/ replacement to be taken up/ carriedout by PSEs.
55. SHIPBUILDING & SHIP REPAIR INDUSTRY: There are 28 shipyards in the country, 7Central Public Sector Undertakings (4 under Ministry of Shipping & 3 under Ministry of Defence),2 under State Government and the remaining 19 are owned by private parties. Althoughshipping industry is presently de-licensed, private sector participation is still restricted to buildingof medium and small size vessels and other repair work. Two public sector companies viz.Hindustan Shipyard ltd. (HSL), Veshakhapatnam and Cochin Shipyard Ltd (CSL), Kochi aremajor players in the sector with wide array of activities like building/repair of large ocean goingvessels (75259 DWT & 125000 DWT) and carrying out various underwater and afloat repairs.The other major PSUs Hoogly Dock & Port Engineers Ltd (HDPEL) is one of the oldestshipbuilders in the country and has two shipyards i.e. Salkia and Nazirgunge at Kolkata. Thecompanies under Ministry of Defence viz. Mazagaon Dock Ltd, Mumbai, Garden ReachShipbuilders and Engineers Ltd., Kolkata and Goa Shipyard Ltd. Goa are engaged in buildingships and vessels primarily for Indian Navy and Coast Guard.
56. Large PSUs constitute approximately 95% of the gross turnover of the industry. However,capacity utilization of the public sector shipyard in the shipbuilding activity has been very lowowing to lack of adequate orders, reluctance on the part of ship owners to place orders due tohigher price and long construction period being taken by indigenous shipbuilders as well as fordepressed international scenario in shipping. Consequently, large public sector shipbuildingcompanies viz. HSL & HDPEL are incurring losses over the years. Subsequent to financialrestructuring, CSL has started earning profits and has been able to wipe off past-accumulatedloss.
57. Disinvestment of Government equity in HSL, CSL and HDPEL is being contemplated.
IRON & STEEL
58. There has been a gradual increase in the domestic consumption, production and exportof the finished steel (table below) though the growth has been greatly reduced from over 6%to 2% since 1996-97.
Finished C-Steel
Million tonnes
Year Apparent Production Import Exportconsumption
1998-99 23.54 23.82 1.65 2.40
1999-00 25.01 26.71 2.20 3.34
2000-01 26.53 29.27 1.885 2.57
2001-02 27.44 31.63 1.50 3.30
2002-03 (till December 2002) 20.65 23.83 1.47 2.75

471
59. The Iron and Steel industry suffers from surplus capacity both inside and outside thecountry and so the domestic manufacturers depends to certain extent upon export to attain afull utilization of their capacities. Industry has further suffered due to global slow down in theeconomy for the last few years. The domestic industry has the added problem of internationalcompetition as the import duty which was 75% and above before 1994-95 has been reducedto 25-35% since 1996-97. Dumping from China and CIS countries is also another woe of thesector though country was successful in imposing anti-dumping duty on them. The country, inturn, has also faced anti-dumping actions from USA, Canada etc.
60. The excess capacity at the international level has led to protectionists measures frommany countries and for this a High level Intergovernmental Meeting are held, (5 such meetingshave already taken place) where modalities to reduce excess capacity is being devised togetherwith enforcing discipline in the steel market. India’s working capacity stands at 33-34 milliontonnes (though it had 40 MMT in the Nineties but many closure has followed) against domesticdemand of around 29 million tonnes.
61. SAIL: SAIL is the major steel producer in the country having 4 large steel plants (Bhilai,Durgapur, Rourkela and Bokaro) and 3 special plants (Alloys Steel Plant, Salem Steel Plant andVisvesvaria Iron and Steel Plant). Due to continued loss in past few years, the net worth of thecompany has eroded below 50% and the matter was reported to BIFR in November, 2002. Butin the financial year 2002-03 with the upward trend in the market, the company has recordeda gross margin of Rs. 1334 crore (December, 2002) and net loss has reduced from Rs. 1707crore in 2002-02 to Rs. 546 crore in the year 2002-03(up to December, 2002).
62. The company has taken up many measures to increase efficiency and productivity(including reduction in manpower) and reduce energy consumption. It has achieved 5%reduction in coke rate and energy consumption per ton of crude steel has reduced to all timelow value of 7.69 Gcal/t. SAIL has been implementing VRS since 1998 and 19600 employeeshave availed the VRS so far. Additional 6510 employees took VRS after the scheme wasrevised in 2000-01.
63. SAIL has undertaken many capital schemes like putting additional facilities for meetingenhanced rail requirement of railways and Rs 872 crore Sinter Plant at Bhilai, up-gradation ofERW Pipe Plant at Rourkela, Slag rennovation Plant and Rs 98 crore BF up-gradation atDurgapur, modification of heating furnance and installation of tension leveler in slitting line atBokaro. No BS required for these capital investments.
64. IISCO: A revival package for this loss making subsidiary of SAIL has been approved bythe Government and waiting for BIFR approval to which this Company was referred in 1994.
65. Rashtriya Ispat Nigam Ltd (RINL): The Visakhapatnam Steel Plant (VSP) of RINL a stateof art plant commissioned in August, 1992 is able to achieve high level of performance both inproduction and consumption norms. It provides the lowest energy consumption in the domesticproduction of steel. The company which had incurred loss few years back of Rs. 75 crore madeturn around during 2002-03 with a net profit of Rs. 207 crore (till December, 2002).

472
66. Sponge Iron India Ltd (SIIL): Sponge Iron India Ltd has doubled its capacity to produce60,000 tonnes per annum of sponge iron to be used as a substitute for ferrous scrap to theinduction and electric arc furnace using lump iron ore and 100% non-cooking coal. Thecompany has made a net profit of Rs. 3.5 crore during the year.
67. MECON: MECON, the first consultancy and engineering company in the steel sector isfacing difficulty in meeting the expenditure due to reduced work in the sector. It has taken manymeasures to reduce the cost like rolling back the retirement age from 60 to 58 years and VRSscheme to reduce surplus manpower. Attempt to disinvest 50% share of the Government to astrategic partner could not materialize due to lack of suitable proposals. A restructuring plan hasbeen considered to attract good offer.
68. Hindustan Steel Works Construction Ltd: The PSU set up to specialise in setting upprojects in steel sector has been making loss for the shrinkage of jobs and as well as excessman power of over 22,000. 7373 employees have taken VRS under phase I and 3152employees under phase II (till December, 2002). As on 31.12.2002, the manpower position ofthe company is 2785. Company needs to streamline it further.
69. Bharat Refractories Limited (BRL): Bharat Refractories Ltd is also a loss making PSUand incurred a loss of Rs. 63 crore during 2001-02 and Rs. 22.4 crore in 2002-03. TheGovernment has approved a revival plan for the company that includes around Rs. 332 crorepackage.
70. R&D Expenditure: R&D activities in the iron and steel sector have been given a boostthrough the steel development fund. Actual expenditure in these activities was Rs. 76.18 crorein 2001-02 and Rs. 41 crore in 2002-03 (upto September, 2002).
DRUGS AND PHARMACEUTICIALS:
71. Policy inputs have enabled the Indian pharmaceutical industry to meet 70% of thecountry’s requirement of the bulk drugs and almost entire demand for formulations. Drugs,Pharmaceutical and fine chemicals of have recorded export of worth Rs. 9751.2 crores(provisional) in 2001-02 against an import of Rs. 2001.10 crore (provisional).
72. Implementation of Drug Pricing Control Order (DPCO), 1995: DPCO, 1995 has limitedprice controlled bulk drugs to only 74 with one single category and with Maximum AllowablePost Manufacturing Expenses (MAPE) of 100%. The criteria for bringing drugs under DPCOinter alia include minimum annual turnover of Rs 4 crore, monopoly situation for popular brands,annual turnover of Rs. 1 crore with 90% market share for a single formulator etc. As per therecent modification ceiling prices would be fixed for commonly marked standard pack size offormulations under the price control, which will also be applicable to products manufactures, bySSI Units. The criteria for fixation of price were on the basis of ORG-MARG data up to March,1999, which has been subsequently modified to adopt ORG-MARG data of March, 2001 tocapture recent developments.
73. The National Pharmaceutical Pricing Authority (NPPA), an independent body, responsiblefor fixation/ revision and monitoring of prices and for implementation of DPCO has fixed/ revised

473
prices of 63 bulk drugs, 33 derivatives and 1968 formulations so far. Of these, prices of 7 bulkdrugs and 57 formulations were fixed during 2002-03 (April to November)
74. R&D: In order to promote indigenous research in pharmaceutical sector, a PharmaceuticalResearch &Development Fund has been set up under aegis of the Department of Science andTechnology with earmarked outlay of Rs.150 crore for 10th Plan.
75. Pharmaceutical PSUs: All the five public sector units in the Pharmaceutical sector havebecome sick. Bengal Chemicals and Pharmaceuticals Limited has successfully implementedrevised rehabilitation package of BIFR and is exhibiting sign of recovery. However, Governmenthas decided to close down Bengal Immunity Limited and Smith Stanistreet PharmaceuticalsLimited. Revival package in case of IDPL has failed twice and its operation stands closed. Afinal decision on revival is yet to emerge.
76. The first national level institute viz. National Institute of Pharmaceutical Education &Research (NIPER) has been set up at Mohali, Punjab to promote higher education and R&Dactivities in the field of Pharmaceuticals.
CHEMICALS, PESTICIDES AND ALLIED INDUSTRIES
77. Chemical Industry: It is one of the oldest industries having capability of producing arrayof products and contributes in exports to the tune of 11.5% of the total export. Production ofmajor chemicals including pesticides exhibits increasing trend.
‘000 tonnes
Item Capacity 2001-02 2002-03 (Prov) 2003-04 (Est)
Soda Ash 1865 1560 1550 1640
Caustic Soda 2036 1438 1480 1520
Carbon Black 3450 248 248 248
Calcium Carbide 128.9 58.8 58.8 58.5
Phenol 76.6 60.8 76.0 80.0
Methanol 386 309 346 370
Tech. Pesticides 138.3 80.1 89.3 100.1
Dyestuffs 58.6 24.4 30.4 33.9
78. Pesticides: India is one of the largest exporters of pesticides in the world and has facilitiesto manufacture variety of products.
79. HIL: The financial health of the only PSU in the sector has deteriorated over the years dueto low capacity utilization following restricted use of its main product DDT and discontinuationof manufacture of Benzene Hexa-chloride (BHC) since 1993. With the erosion of the 50% of thenet worth of the company, it has been referred to BIFR. In addition, the loss making subsidiaryof the company, SPEC has been closed down as per order of the High Court of A.P. w.e.f. 2nd
April, 2002, Delhi unit of the HIL has been shifted to Bhatinda and Rs. 10.7 crore plant to

474
produce safer insecticides is under advanced stage of completion likely to be commissioned in2003-04. A provision of Rs. 5 crore has been made for Annual Plan 2003-04 mostly to meetthe renewal and replacement of the operating units.
80. CPDS (Chemicals Promotion and Development Schemes): Department is considering thepossible advantage of Mega Chemical Estates with international facilities to attract investments.Preparation of its feasibility report would be taken up in the AP for which, Rs. 2.4 crore has beenprovided.
81. PETROCHEMICAL INDUSTRY: The sector comprising synthetic fibres, polymers,elastomers etc. is showing increasing trend of growth in terms of production and consumption.The estimated production of petrochemicals in 2002-03 was 6169 Th tones as against 5995 Th.Tones in 2001-02. The corresponding consumptions have been reported to be 6373 Th. Tonesand 6177 Th. Tones.
82. Disinvestment has resulted in reduction of Government involvement in petrochemicalssector. Of the 8 existing petrochemical cracker complexes of combined capacity of 2.4 milliontones of Ethylene per annum, Auriya Petrochemicals complex of Gas Authority of India Limited(GAIL) having Ethylene capacity of 300 Th. TPA is the only PSU. No progress in respect of 5expansion/ new petrochemicals projects (capacity 2500 Th.TPA) has been made during theyear.
83. CIPET: The institute, established with UNDP assistance in 1968 provide multidisciplinarysupport such as manpower training and technical assistance to plastic industry in the areas ofto tooling, processing, design, development of new products and quality assurance services.CIPET has corporate office at Chennai and 10 extension centres, of which 3 (Patna, Haldia &Guwahati) have been opened during 2002-03. A proposal of allowing CIPET to take OPEC Fundassistance for augmenting its capability in thrust areas of plastic applications has beenapproved recently.
Fertilisers
84. The total installed capacity of all the fertilizers at the end of the year 2002-03 has reacheda level of 12.18 million tonnes of nitrogen (inclusive of an installed capacity of 9.23 milliontonnes of nitrogen from urea after reassessment of the capacity) and 5.36 million tonnes ofphosphatic nutrients, making India the third largest fertilizer producer in the world. The rapidgrowth of fertilizer production capacity has been achieved as a result of a favourable policyenvironment facilitating large investment in the public, cooperative and private sectors. Presently,there are 57 large sized fertilizer plants in the country manufacturing a wide range ofnitrogenous, phosphatic and complex fertilizers. Out of these, 29 units produce urea, 20 unitsproduce DAP and complex fertilizers, 13 plants manufacture Ammonium Sulphate (AS), CalciumAmmonium Nitrate (CAN) and other low analysis nitrogenous fertilizers. Besides, there areabout 64 medium and small-scale units in operation producing Single Super Phosphate (SSP).
85. The production of fertilizers during 2001-02 was 10.76 million tonnes of nitrogen and thatof phosphatic fertilizers were 3.86 million tonnes. The production targets for the year 2002-03was fixed at 11.16 million tonnes of nitrogen and 4.82 million tonnes of phosphate, representing

475
a growth rate of 7.8 per cent in nitrogen and 24.8 per cent in phosphate as compared to theactual production in the year 2001-02. Production targets for both nutrients was fixed less thanthe installed capacity because of low production from Rashtriya Chemicals & Fertilizers,Trombay and Thal units, Neyveli Lignite Corporation Limited (NLC), Neyevli, Fertilizer Corporationof India (FCI), Sindri and Brahamaputra Valley Fertilizer Corporation Ltd. (BVFCL), Namrup dueto gas limitations and equipment problems. This trend is likely to be continued in the near futureas the Government have decided to close down all the plants of FCI at Ramagundam,Gorakhpur and Talchar and Durgapur & Baruni plants of Hindustan Fertilizer Corporation ofIndia (HFC), barring Namrup units of erstwhile HFC presently under revamp, which are nowunder the separate entity of BVFCL.
86. The actual production of nitrogen for the year 2002-03 was 10.53 million tonnes and 3.38million tonnes of phosphate. The production performance was poor mainly due to constrainedsupply and poor quality of gas to many of the plants, breakdown in urea plant of FACT, boilerproblem in MFL, delay in commissioning of Namrup revamp and unscheduled shutdown at FCI,Sindri, NLC, Neyveli and Duncan Industries Ltd. (DIL), Kanpur. In case of phosphate, productionin DAP plants was low due to depressed demand of DAP on account of drought like situationin many of the States. Similarly, the production of complex fertilizers was also low due to highinventory stocks in silo and poor take off due to dismal sale. The capacity utilization during theyear 2002-03 is estimated at 89.8 per cent for nitrogen and 81.3 per cent for phosphate.
87. The total consumption of the fertilizer, which was 17.54 million tonnes during 2001-02slightly, came down to 16.65 million tonnes during 2002-03 due to unprecedented droughtsituation in many of the states. The consumption of phosphatic fertilizer also came down from4.41 million tonnes in 2001-02 to 4.25 million tonnes in 2002-03. However, the total productionof fertilizer went up from 14.62 million tonnes to 15.23 million tonnes (estimated) during the year2002-03, registering a growth rate of nearly 4.0 per cent during 2002-03 over the year 2001-02.
88. Urea, Di-Ammonium Phosphate (DAP) and Muriate of Potash (MOP) are the three mainfertilizers, which are imported in the country to bridge the gap between the demand andindigenous availability. The imports of urea, which is under price and movement control, is madeon government account and it is the only canalized fertilizer imported through State TradingEnterprises (STEs). All other fertilizers are de-controlled, de-canalized and imported on privatetrade account. There was no import of urea during 2002-03. However, in case of phosphaticfertilizers availability of fertilizer grade rock phosphate in the country is limited, which is thusimported in large quantity for production of phosphatic acid, SSP and DAP and various gradesof complex fertilisers. Besides, other intermediaries used in the production of these fertilizers arealso required to be imported. As there are no commercially viable reserves of potash in thecountry, the entire requirement of potash is met through direct imports of MOP.
89. The two major fertilizer projects; namely BVFCL and Gujarat State Fertilizers & ChemicalsLtd. (GSFC), Sikka are under implementation at an estimated cost of about Rs. 689 crores.Once these projected are commissioned, there will be an additional production of 0.38 milliontonnes of urea and 0.39 million tonnes of DAP per annum. The BVFCL project, which wasoriginally scheduled for commissioning in February, 2002 likely to be further delayed and now

476
anticipated date for commissioning is March, 2004. The GSFC expansion project has beencompleted, commissioned and is under trial production.
90. The Government has approved the financial restructuring of FACT and MFL to avoidattraction of the BIFR clause and facilitate faster disinvestment process of these. The financialrestructuring would attract prospective buyers and will have better realization. The Governmenthas approved the revival of Project & Development India Ltd. (PDIL) retaining its Research &Engineering Division at NOIDA and Baroda and Catalyst and Research & Engineering Divisionat Sindri and the closure of Pyrites Phosphate & Chemicals Ltd. (PPCL) disposing off its assets.The Government of India has also decided to expedite the process of disinvestment by divesting51 per cent of its equity holding out of 97.65 per cent in National Fertilizers Ltd. (NFL); 32.74per cent of its holding out of 58.74 per cent in MFL and 64 per cent of its holding in RCF. In-principle approval for appointment of the Global Advisors and other intermediary advisors inaccordance with prescribed procedure and through the process of open competitive bidding forassisting the Government in the disinvestment in case of MFL, FACT and RCF has alreadygiven by the Govt. of India.
91. The Government had also given ‘in-principle’ approval for two expansion projects, namely,Expansion of Hazira Plant of KRIBHCO in Gujarat & Expansion of Thal Plant of RCF inMaharashtra and two grassroots projects, namely, new Urea Plant to be set up by KRIBHCOat the existing site of FCI’s Gorakhpur Plant in UP and new Urea plant to be set up by IFFCOat Nellore in Andhra Pradesh in the year 2000. The Government has decided to defer theseproposals till the long-term price and feedstock policy is in place.
92. The feedstock policy for nitrogenous fertilizers had hitherto envisaged establishment ofnew plants based mainly on natural gas. Realizing the constraint in the availability of naturalgas, the Government had set up a core group of representatives of fertilizer companies toprepare a Detailed Feasibility Report (DFR) for setting up of integrated chain of LiquefiedNatural Gas (LNG) supply in the country. However, the core group has taken a decision to puton hold on the DFR till the long-term fertilizer policy is announced by the Government. A numberof companies have evinced interest to set up LNG terminals in the country and the initiativehave been taken by M/s. Petronet LNG Limited (PLL), a consortium of public sector oil andnatural gas undertaking, to set up LNG terminals at Dahej and Cochin. The supply from theproject is expected in the beginning of year 2004.
93. A task force, which was constituted in the March, 2000 under the Chairmanship ofSecretary (Fertilizers) with the representatives from Ministry of Science & Technology, Ministryof Power, Ministry of Coal, Council of Scientific & Industrial Research, The Fertilizer Associationof India and PDIL, with a view for exploiting the abundant resources of coal in the country asa feedstock for the production of fertilizers, has submitted its report and concluded that it is notfeasible to use the domestic coal as feedstock for manufacturing fertilizers in the country.
94. The Government have declared a new Group Retention Pricing Policy for urea units whichwill replace the existing Retention Price Scheme and will come into effect from April, 2003.There will be six groups based on vintage and feedstock for determining based concessionunder the new scheme, namely; pre-1992 gas based units, post-1992 gas based units, pre-1992naphtha based units, post-1992 naphtha based units, fuel oil/low sulphur heavy stock (FO/

477
LSHS) based units and mixed energy based units. The mixed energy based group shall includesuch gas-based units that use alternative feedstock/fuel to the extent of more than 25% asadmissible on 1.4.2002. Though, some of the units have disadvantage and incurred losses inthe initial year of the new policy, but it will have a positive impact on Government’s budget onfertilizer subsidy in the long run. The objective of the policy is to phase out the subsidy and de-control of urea distribution and movement.
95. A Memorandum of Understanding (MoU) was signed between the Government of Indiaand the Government of Sultanate of Oman, for the design, construction, financing and operationof a world scale fertilizer complex in Oman. The project wherein the investment of $ 160 millionas equity by IFFCO and KRIBHCO from the Indian side, provides for a buy back arrangementfor 1.65 million tonnes of urea produced by the project by the Government at a long term fixedprice (LTP) for a period of 15 years. The major agreements relating to the project were finalisedand signed by the parties during the year. The project has commenced implementation on15.8.2002 and is scheduled to be commissioned in 35 months, i.e. by July, 2005. SPIC is alsosetting up a gas-based nitrogenous fertilizer plant at Dubai in United Arab Emirates to produce0.40 million tonnes of urea at an estimated cost of $ 170 million. The project is underimplementation and is expected to be commissioned by the fourth quarter of 2004.
Textiles
96. After agriculture, Textile industry is the largest employer, the direct employment in theindustry is estimated at 35 million approximately and with indirect employment of another 58million people. The production of spun yarn is anticipated to touch the figure of 3,088 mn. kg.during current financial year 2002-03, registering an annual growth of about 1% during last fiveyears. It is worth noting that the production of 100% non-cotton yarn has shown an upward trendin recent years and it is anticipated to touch the figure of 307 mn. kg during 2002-03, registeringan annual growth of 11.64% during the last five years. The total production of cloth by all sectori.e. Mill, powerloom, handloom and khadi, wool and silk has shown an upward trend in recentyears. The total production of cloth is anticipated to touch the figure of 42,314 million sq. metrsduring 2002-03 showing an annual growth of 2.48% during last five years. The cloth productionfrom the decentralized powerloom sector has shown significantly higher annual growth rate of4.8% during last five years. The per capita domestic availability of cloth in the country hasincreased to 31.97 sq. metrs in 2001-02 from 30.92 sq. metrs in 1997-98.
97. The major weakness of our industry has been poor technological base. The modernizationof textile industry gains more importance. The spindleage capacity of the organized sector hasincreased from about 36.67 million in 1998-99 to 38.75 million in 2002-2003. A noticeablefeature in this growth process has been the installation of a large number of open-end rotorsin 1990s and the tendency to set up 100% Export Oriented Units in the field of spinning. Anon-going scheme of Technology Upgradation Fund Scheme (TUFS) exists which cover, all thesub-sectors of the textiles like spinning, weaving, knitting, processing, garment making, cottonginning & pressing. To make more and more SSI units take the benefits of TUFS, an optioneither to avail of 12% credits linked capital subsidy or existing 5% interest reimbursement hasbeen provided recently. The time limit of the Scheme has also been extended up to Tenth Plan.The Scheme is being implemented through selected nodal agencies i.e. IDBI (for Textile Industryexcl. SSI Sector), SIDBI (for SSI textile sector) and IFCI (Jute Industry).

478
Progress of Loan Disbursement under TUFS as on 30.11.2002
(Rs. Crore)
No. of Project cost Loan asked Sanctioned Disbursedapplications
Power loom 170 171.99 117.76 101.04 40.24
Total 1970 15246.46 8761.48 5786.63 4206.99
98. Considering the importance of the cotton crop to the national economy, the Govt. of Indiahas launched a Technology Mission on Cotton (TMC) from February 2000 to address the issueof low productivity and contamination. The Mission consists of four Mini-missions which arebeing jointly implemented by the Ministry of Agriculture and the Ministry of Textiles. Mini-MissionI and II are implemented by the Indian Council of Agricultural Research (ICAR) and the Ministryof Agriculture respectively, while Ministry of Textiles is the Nodal agency for implementation ofMini-Missions III & IV. As per the latest information available, upto December 2002 under MiniMission III, 102 project proposals have been sanctioned. The total estimated cost involved isRs.180 crore, out of which Government of India share would be Rs.89 crore. Under Mini MissionIV, modernization of 221 ginning and pressing factories have been sanctioned at an anticipatedcost of Rs.271 crore, out of which Government of India share would be Rs.47 crore.
99. Two Centrally Sponsored Schemes namely Apparel Parks for Exports and Textiles CentreInfrastructure Development Schemes have been launched by the Government with the objectiveof promoting textile exports of international standards and providing textile export units withmodern infrastructural facilities for growth and conducive investment environment. UnderIntegrated Apparel Park Scheme, financial assistance is to be provided for setting up parks ofmodern high-tech weaving/knitting modern processing units and Effluent Treatment Plants andalso provide skill upgradation/testing facilities of high standards at the approved parks or textilegrowth centres. A budget provision of Rs.75 crore each for the above schemes has beenearmarked for the Tenth Plan approved outlay.
100. The Budget allocation for Ministry of Textiles was enhanced substantially from Rs.457crore in 2000-2001 to Rs.763 crore for the Annual Plan 2003-04.
101. In view of the importance of the Textile Sector in the national economy and the need totake urgent, time bound steps to attract investment and encourage growth in the Textile Sector,the Steering Group on Investment and Growth in Textiles under the Chairmanship of Shri N.K.Singh, Member, Planning Commission submitted its Report to enable the Government toconsider fiscal changes and a ‘Textile Package’ in the Budget 2003-04. Majority of therecommendations of the Steering Group with regard to fiscal policy were accepted andincorporated in the Budget 2003-04 which inter alia included a continuous CENTVAT chain topromote compliance and to eliminate evasion thereby reducing distortions in the system i.e. dis-continuation of deemed MODVAT credit. To encourage modernization, Custom Duty on a largenumber of Textile Machinery and their parts reduced from the existing 25% to just 5% andCustom Duty on Apparel Grade Raw Wool reduced from 15% to 5%. The Steering Group hasalso recommended constitution of a Textile Industry Reconstruction Fund with a corpus ofRs.3000 crore for financial restructuring of the Textile Industry. This recommendation is underconsideration.

479
102. Technical Textiles is also one of the new areas which will be supported by the Governmentfor legislation for mandatory use of the fire-retardant textiles in public buildings, improving roadinfrastructure, soil conservation efforts etc. Research and Development activities would coverdecentralized sectors, Technical Textiles, product development, Eco-friendly technologies, costreduction technology and information technology.
PSUs in the Textiles Sector
103. The textile industry is dominated by private sector. Only two PSUs, NTC and BIC existin the sector i.e. NTC with 119 mills (53 identified viable mills + 66 unviable mills) and BIC with2 woollen mills and 2 cotton subsidiary companies. For excess manpower, shortage of workingcapital and obsolete machinery, for the companies making continuous losses, the matter isreferred to BIFR and the revival package is under consideration.
Jute
104. Two successive bumper crops of raw jute including mesta during the year 2001-02 at 105lakh bales and estimated 110 lakh bales during 2002-03 have a dampening impact on raw jutemarket. During the period April-December 2002, total production of jute goods was lower at1158.5 thousand tones as against 1218.8 thousand tones in the corresponding period of 2001-02. The production of sacking which was at 685.4 thousand tones during April-Sept. 2002 waslower as compared to the corresponding period 2001-02. However, hessian production duringApril-December 2002 was higher at 259.4 thousand tones as against 205.4 thousand tones inthe corresponding period of last year. As per the present indication, production of jute goodsduring the financial year 2002-03 may be lower at 1550 thousand tones in comparison to totalproduction of 1600.8 thousand tones in the year 2001-02.
105. National Centre for Jute Diversification (NCJD) is up production and marketing of jutediversified products.
106. Jute Manufactures Development Council (JMDC) has been entrusted with all functionsrelating to export promotion in the jute sector and also to perform other activities in the domesticmarket of jute sector. The Govt. of India finances the activities of JMDC out of the cess collectedon various jute manufacturers wholly. JMDC is working in close association with Indian JuteIndustrial Research Association (IJIRA) for development of low cost jute bags and promotingjute bags as an alternative to plastic bags in coordination with relevant State Govt. authorities.
107. Jute Entrepreneurs Assistance Scheme (JEAS), provides interest free loan to differentcategories of entrepreneurs upto a maximum limit of Rs.50 lakh from the Special JuteDevelopment Fund. During the period April-November 2001, 712 new units have been assisted.
108. Textile Research Associations (TRAs): There are 8 TRAs (autonomous bodies) underthe Ministry of Textiles to provide testing and research facilities; four for cotton (ATIRA, BTRA,SITRA, NITRA) and one each for wool (WRA), Jute (IJIRA), Silk (SASMIRA) and Synthetic(MANTRA. For their Plan schemes like upgradation of facilities, buildings etc. they depend onthe budgetary support. However, with the objective of the Tenth Plan to make them self-sustaining, budgetary support will be gradually trapped off and in no case budgetary supportshould be allowed to be used for recurring expenses which presently is the practice.

480
ATOMIC ENERGY
109. Activities under I&M Sector primarily include manufacture of nuclear and structuralmaterials and control systems to build and operate the nuclear power plants and managementof the back end of the fuel cycle. The programme profile of I&M sector ensure that there is asustained and timely supply of nuclear fuel and other materials for the operating nuclear powerplants and the plants that are being built. The present total nuclear power capacity is 2720 Mwwith 14 units (12 PHWR and 2 BWR) in commercial operation and it has been targeted toachieve 4020 Mw by the end of Tenth Plan and reach 9990 Mw by the end of Eleventh Plan.
110. Majority of the programmes implemented in the Ninth Plan have gainfully achieved thegoals set by the DAE and the activities covered included; exploration for uranium, rare metal& rare earth and beach sand mineral resources, mining and processing of uranium ores andmineral sands, fabrication of nuclear fuel and production of heavy water for nuclear powerreactors, reprocessing of the spent fuel and waste management, and production of control andinstrumentation equipment for nuclear power plants. During the Plan period, the overallperformance and safety record of the running plants were excellent. Reprocessing of spent fueland irradiated thorium as well as waste management of the nuclear fuel cycle and constitutedthe front end of the nuclear power programme.
111. BRIT, plans to set up a new gamma radiation facility for providing efficient gamma radiationsterilization services to the healthcare sector in the country. It is also proposed to establish anintegrated facility for radiation technology for manufacturing and supplying the state of the artequipment. A gamma radiation sterilization plant for Dai Kits, and other healthcare productswould also be set up at or near Kota, Rajasthan for providing support to rural healthcareprogramme.
112. One of the projects of BARC to be executed is for upgradation of metal reductiontechnology and effluent handling. Under this project is proposed to install a facility for metalreduction of pelletised charge in place of powder reduction presently being used improving theuranium recovery in metal reduction stage. A facility would also be created for the research onproduction of intermetallic alloys of uranium and thorium for near future. A project for berylliumtechnology would, therefore, be undertaken for production of beryllium metal, alloys andberyllium oxide.
113. A new project on the second phase of Fast Reactor Fuel Reprocessing Plant (FRFRP) isbeing taken up at Indira Gandhi Centre for Atomic Research (IGCAR). This include remainingworks such as fabrication and installation of process equipment like chopper, titanium dissolver,centrifuges, centrifugal extractors and sampling robots. After completion of these works, theplant would be ready to re-process the irradiated FBTR fuel. The second project titled PFBRReprocessing plant would be pursued to close the fuel cycle so that the system will be self-sustaining without external PU input. A provision of Rs. 5 crore is provided fro augmentation ofwaste management facilities for PFBR fuel cycle.
114. The main thrust of HWB during the Tenth Plan would be to effect energy conservation,revamp and modernize the operating plants and augmentation of capacity of the Plants. Duringpast two years substantial reduction in the specific energy consumption was achieved.

481
Emphasis would be placed on to effect energy conservation further by implementing schemesof minor modifications to the operating plants at Kota, Manuguru and tuticorin. Some of theitems like catalysts having limited life need periodic replacement whereas some instrumentationitems that have become obsolete need replacement.Such revamping and modernization ofManuguru, Hazira and Tuticorin Plant by incorporating modifications. Further, in view of the longterm demand and supply scenario for Heavy Water, it is planned to take up the work for oneadditional stream for Heavy Water production at Manuguru with a capacity of 100 tpa. .Pre-project activities for Manuguru expansion would, therefore, be pursued and some R&D schemeswould also be taken up besides continuing four schemes as spillover schemes.
115. The main emphasis at Electronics Corporation of India (ECIL) is on the up-gradation oftechnology and setting up of the manufacturing and test facilities for Instrumentation & Controlequipment, Fuze products, Radio-communication products, related projects. A project oninfrastructure creation including PCB technology up-gradation, IT across the company, securityequipment and common R&D facilities would also be executed. By implementing theseschemes the company aims to achieve a minimum of 15% growth per annum during the nextfive years.
SMALL SCALE INDUSTRIES AND FOOD PROCESSING INDUSTRIES
116. Small scale industries (SSIs) play an important role as less capital intensive producers ofconsumer goods and providers of employment to labour thereby addressing the problems ofreducing poverty and unemployment. According to rough estimates, there are about 35.14 lakhsmall scale industrial units in the country accounting for more than 40 per cent of the totalindustrial production in the manufacturing sector and about 35 per cent of the total exports ofthe country. It provided employment to about 195.65 lakh persons upto 2002-03, which issecond only to agriculture.
117. The SSI sector has generally recorded higher growth rate than the industry sector as awhole by two to three percentage points. Due to economic liberalisation, WTO regime, thesector has started feeling the effect of opening up of the economy and competition from imports.The Small Industries Development Bank of India (SIDBI) is the apex bank for the small scalesector disbursing large funds and providing refinance to commercial banks for on-lending to theSSI sector. A Credit Guarantee Scheme is under implementation and under this scheme, loansupto Rs.25 lakh are being guaranteed without any collateral guarantee by the Credit GuaranteeFund Trust for Small Industries. The Trust shall pay 75 per cent of the guaranteed amount onpreferring of eligible claim by the lending institution. The balance 25 per cent of the guaranteedamount will be paid on the conclusion of recovery proceedings by the lending institution.Performance of this scheme has improved as 35 Member Lending Institutions including 25Public Sector Banks are participating in the scheme. Intensive awareness efforts are beingmade amongst the SSI units/banks so that more SSI units could take advantage of the scheme.
118. Indicative physical targets and achievements in respect of production, employment andexports are given in Annexure 10.1.9. Details are discussed sector wise in subsequentparagraphs. Plan outlays and expenditure for 2001-02, 2002-03 (B.E.- RE) and 2003-04 (BE)are given in Annexure 10.1.8.

482
Small Scale Industries
119. The Ministry of SSI is implementing promotional and developmental schemes through theSmall Industries Development Organisation (SIDO). SIDO provides services to the SSI unitsthrough a network of organisations viz. Small Industry Service Institutes (SISIs), RegionalTesting Centres (RTCs), Field Testing Stations (FTSs), Process-cum-Product DevelopmentCentres (PPDCs), etc. SIDO provides technical input, quality testing facilities, training, extension,market development assistance, data base support, infrastructural facilities, credit guarantee,credit linked capital subsidy for technology upgradation.
120. A number of Tool Rooms have been set up to assist SSI units and to provide technicalconsultancy and common service facilities for design and production of quality tooling. SIDO isproviding one time financial assistance for machinery to State Governments for setting up MiniTool Rooms to help in creating localised training and production facilities. The State Governmenthas to provide land, building and recurring expenditure for the mini tool room , while GOIprovides grant upto Rs.9 crore for setting up of machinery for the mini tool rooms. Modernisationand technology upgradation of workshops of Small Industry Service Institutes (SISIs)/RegionalTesting Centres (RTCs)/Field Testing Stations (FTSs) is being taken up in a phased manner toequip them with modern machines and skilled manpower.
121. Integrated Infrastructure Development Centres (IIDCs) scheme is under implementationsince Eighth Five Year Plan Plan to augment the infrastructural facilities in rural and backwardareas to promote industrial development. This scheme has been revamped by removing certainrestrictive provisions and by providing liberal finance to North East Region, including Sikkim. Sofar, 74 IIDCs have been approved and are at various stages of implementation. Central grantof Rs.62.88 crore has been released upto September, 2003.
122. Collection of statistics of SSI is a plan scheme whereby relevant data/informationpertaining to SSI sector are collected, compiled and disseminated. The quick results of the ThirdAll India Census of Small Scale Industries have been released on 30th August, 2003. The finalresults are expected to be released soon. According to the quick results of the Small ScaleIndustries Census, employment per unit is 4.4 person and around 35% of the SSI units havebecome sick.
Prime Minister’s Rozgar Yojana (PMRY)
123. Prime Minister’s Rozgar Yojana (PMRY) was approved in 1992 with the objective ofmaking available institutional finance to educated unemployed youths for setting up of self-employed ventures for all economically viable activities and create new job opportunities . Anumber of modifications have been made in the scheme to make it more effective e.g., increasein the upper age limit from 35 years to 45 years for SCs/STs ex-servicemen, women andphysically disabled persons, reduction in minimum educational qualifications, enhancing theannual family income ceiling and project size for projects under industry and service sectors;relaxation of residency criteria for married women applicants and collateral free loan for projectsunder industry sector by the individual beneficiary; enhancing credit/loan portion for beneficiariesof N.E. states etc. During 2002-03, loans have been sanctioned to 2.17 lakh and distributed to

483
1.36 lakh educated unemployed youth against the Plan target of 2.56 lakh. Poor rate of recoveryof loan over dues in some States is the cause of concern. Number of measures have beentaken by the RBI and the Central Govt. to improve recovery of loan over dues under thescheme. During 2001-02 and 2002-03, funds released under PMRY were Rs.14.22 crore andRs.15.44 crore respectively and Rs.18.85 crore is estimated for release during 2003-04 basedon allocated targets. An evaluation study of PMRY carried out by the Institute for AppliedManpower Research (IAMR), New Delhi has indicated the average national rate of refund ofloan instalments by beneficiaries is around 45 per cent. This is quite low and there is need toimprove upon by selecting economically viable projects and making timely available funds tonew units. It is also essential to make available large number of model project profiles to PMRYbeneficiaries to increase refund rate.
National Small Industries Corporation Limited (NSIC)
124. The National Small Industries Corporation (NSIC) Limited was set up with the objectivesof helping SSI sector by providing machinery on hire purchase, equipment on leasing, rawmaterial assistance, marketing inputs for domestic and exports, single point registration, etc, topromote, aid and foster the growth of small industries in the country. NSIC is also helping inpromoting viable small industries all over the country, particularly industries in backward areasNorth-Eastern States and in selected lines of production identified as priority areas for exports.
125. The scheme of ‘Single Window’ assistance helps exporting SSI units and the Corporationprovides all necessary assistance to enable the SSI units to export. The products beingexported by SSI units include builders’ hardware, brass components, machine tools, hand tools,hand gloves, diesel engines, sanitary and bathroom fittings, sports goods, leather goods, gardentools, etc. NSIC is also helping SSI units to participate in international trade fairs. During 2003-04, upto November 2002, the exports (excluding software exports) from SSI units through NSICwere Rs.4.28 crore as against Rs.2.31 crore during the corresponding period of previous year.NSIC has registered 32,496 SSI units upto March, 2003, under Government Store PurchaseProgramme. During first eight months of 2003-04, 473 new units were registered under thisprogramme. NSIC is also making project exports on turn key basis to developing countries.During 2002-03, the Corporation focussed upon (a) accelerate export of quality products of theSSI units, (b) facilitate easier access to SSIs in global markets, (c) inducing small enterprisesto export markets and (d) effectively display product and technologies of SSI units atinternational forums.
126. NSIC is being restructured in view of losses incurred from past liabilities and operations.Provisions were made for bad debts and accounts. Now NSIC would focus on (a) technologyand quality Upgradation, (b) marketing promotion, (c) international cooperation and (d) limitedfinancial support for technology Upgradation to SSI units rather than concentrating upon hirepurchase and leasing of machineries.
Coir Industry
127. It is a labour intensive but export oriented industry. It is using the bye product – coir huskof coconut plantation. The physical performance of Coir Industry could be seen at Annexure

484
10.1.9. Coir Board is looking after promotion, growth and development of the coir industry,export promotion and expansion of the domestic market by providing marketing inputs. TheBoard is implementing a number of developmental programmes for the coir sector; whichinclude assistance for participation in exhibitions, coir industry awards, Mahila Coir Yojana,strengthening, of national level training institutes, model coir villages, group insurance schemefor artisans, financial assistance for modernisation, reduction of drudgery and other welfaremeasures for coir artisans. About 5.5 lakh people are in this industry. For historical reasons, coirindustry has taken deep root in the State of Kerala but it is also functioning in Tamil Nadu,Karnataka and Andhra Pradesh in a small way. Thrust areas identified for developing the coirindustry are: (i) modernisation of production infrastructure through appropriate technologywithout displacing labour, (ii) skill Upgradation through modern training programmes, (iii)expansion of domestic market through proper publicity, (iv) promotion of exports, (v) diversificationto new products like coir geo-textiles, needled telt coir ply, coir pith, coir net, pith plus, etc. (vi)elimination of drudgery and pollution and (vii) application of R&D.
128. Coir Board has evolved a bacterial formulation Coir net which would enhance quality ofgreen husk fibre, cost reduction and easy transportation. The process of faster composting coirpith has been developed. Patent application for these processes has been filed and NationalResearch Development Corporation (NRDC) is productionising the process for commercialapplication through M/s. Cadila Pharmaceuticals Ltd., Ahmedabad. A mobile defibring machineryhas been modified which has been developed by a local entrepreneur. Single ply coir yarn offibre quality has been produced by blending it with various other natural fibres and variousproducts like venetion blinds, curtains, handicraft items have been manufactured. Coir composingboards have been developed as packaging materials in association with Indian Institute ofPackaging, Mumbai. Coir Board has developed Coir Bhoovastra – a mobile lawn for quickinstallation. This product has good wide application in homes, gardens, restaurants, etc.
Handlooms
129. Handlooms not only depict the heritage of India and richness and diversity of our countryand artistry but also play a very important role in the economy by providing employment to about120 lakh persons. Handloom is the largest economic activity after agriculture. This sector alsoearns valuable foreign exchange through export of handloom products. Due to effective stateintervention in providing financial assistance and by implementation of developmental andwelfare schemes, this sector has been able to successfully withstand the growing competitionfrom the powerloom and mill sectors. This sector contributes around 15 per cent of the totalcloth produced in the country. Performance of the sub-sector is indicated in Annexure 10.1.9.
130. Handlooms sector has been facing a number of problems like old technology andtraditional production techniques, high price of hank yarn, inadequate availability of inputs likestandardised dyes and chemicals in small packs, lack of new designs, need for inadequateupgradation of skills and inadequate marketing intelligence and feedback. Besides, it has certaininherent disadvantages like unorganised structure, weak financial base of the weavers andbureaucratization / politicisation of cooperatives.
131. The handloom sector is largely dependent on the organised mill sector for supply of itsprincipal raw material, namely, hank yarn. The Central Govt. has been assisting the handloom
485
weavers in getting regular supply of hank yarn at reasonable prices through (a) Hank YarnObligation Scheme and (b) supply of yarn at mill gate price to handloom weavers throughNational Handloom Development Corporation (NHDC). NHDC had supplied 460.99 lakh kg. ofyarn of value of Rs.361.02 crore during 2001-02 to the handloom agencies. Upto August, 2003,NHDC has supplied 115.40 lakh kg of hank yarn of value of Rs.99.12 crore. During 2002-03Budget, excise duty has been levied on hank yarn. Till the end of February, 2002, hank yarnwas exempted from excise duty. However, to avoid hardships to handloom weavers, due toadditional cost of excise duty, the office of DC(Handlooms) has formulated a scheme toreimburse the excise duty to organisations supplying hank yarn at prices net of CENVAT to thehandloom weavers on hank yarn .
132. To provide marketing support to handloom agencies and individual weavers, the Office ofthe DC(Handlooms) provides assistance for organising National Handloom Expos/SpecialExpos, District Level Events, for conferring National Awards to the Master Weavers and forparticipation in the Craft Melas organised in different parts of the country. In 2001-02, 9 NationalHandloom Expos and 9 Special Expos and 92 District Level Events were held. During 2002-03,about 18 National Handloom Expos/Special Expos and 132 District Level Events are proposedto be organised in different parts of the country alongwith the 6 Craft Melas at Udaipur,Hyderabad, Faridabad, Agra, Patiala and Kollam. During 2003-04, about 20 National/SpecialExpos and 150 District level events are proposed to be organised.
133. Welfare measures are provided to handloom weavers through group insurance scheme,health package scheme, Thrift fund scheme, project package scheme and work-shed- cum-housing scheme etc. The Hon’ble Prime Minister had announced on 15th August, 2002 theimplementation of a special Contributory Insurance Scheme for Weavers and Artisans. Accordingly,a comprehensive scheme called “Bunker Bima Yojana” has been formulated and is underconsideration for approval.
134. Deen Dayal Hathkargha Protsahan Yojana (DDHPY) was launched in April, 2000 andproposed to be continued till March, 2007 for development of the handlooms sector. Some ofthe earlier schemes like Project Package Scheme, Freelance Designer scheme, etc, have beensubsumed in the DDHPY scheme. Under DDHPY financial assistance is being provided tohandloom organisations for components like (i) basic inputs, (ii) infrastructure support, (iii)design input, (iv) publicity, (v) marketing incentive, (vi) transport subsidy, and (vii) strengtheningof handloom organisations. Grant is provided in the ratio of 50:50 between Central and StateGovernments. In the case of N.E. States, Sikkim, J&K, Himachal Pradesh and Uttaranchal, thesharing would be 90:10. In case of implementing agencies having 100 per cent SC/ST/Women/minorities the grant is shared in the ratio of 75:25. The assistance for marketing assistancewould be in the ratio of 50:50 between the Central and State Governments in respect of all theStates.
135. Under the Economic Package for J&K announced by the Prime Minister, the followingprojects have been undertaken by the Office of the Development Commissioner for Handlooms:
a) Integrated Project Proposal for Wool and Woollen Design Development Centresb) A new Weavers’ Service Centre in J&K.

486
Powerlooms
136. The decentralised powerlooms sector plays an important role in meeting clothing needsof the country and produces a wide variety of cloth, both grey as well as processed havingintricate designs. There are over 3.84 lakh powerloom units contributing in the total clothproduction of the country to the extent of 60 per cent, excluding the cloth produced by non SSIweaving and hosiery/knitting units. This sector employs around 43 lakh persons and alsocontributes significantly to the export earnings.
137. The estimated number of powerlooms in the decentralised sector in the country hasincreased from 6.39 lakh in 1986 to 17.20 lakh as on 31st July, 2003. Powerlooms are facingmain problems like use of outdated technology, fragmented and small size units, high powertariffs, increasing power cuts, low skills, inadequate credit availability and poor marketingtechniques. With globalisation, there is increasing competition from imports. It is necessary tomodernize powerlooms, improve quality of production and productivity, provide higher designinputs and to pay attention to the social welfare needs of powerloom workers.
138. There are 14 Powerloom Service Centres (PSCs) functioning under the Textile Commissionerand 30 PSCs under the different Textile Research Associations (TRAs), namely, ATIRA, BTRA,MANTRA, NITRA, SASMIRA, IJIRA, SITRA and State government agencies of MadhyaPradesh and Karnataka. These PSCs are providing a variety of services including training,testing facilities, technical consultation, design development and diversification etc. and implementGroup Insurance Scheme for powerloom units and weavers.
139. The powerlooms in the Powerloom Service Centres (PSCs) are very old and of outdatedtechnology. There is a need to modernise and strengthen the existing PSCs by installing shuttle-less looms, Cop-changing/shuttle changing looms, Drop box looms, Dobby, Jacquard terry fabricweaving looms, prin winding machines, sectional warping machines, yarn and fabric testingequipment, chemical testing equipment, DG sets, etc. 21 PSCs have been modernized duringthe 9th Plan at the cost of Rs.12.67 crore and remaining are being modernized in the Tenth Plan.
140. To facilitate the creation of new designs, improve the designs and production in the fastchanging global tradition in fashion, the Computer Aided Design (CAD) Centres were set up at17 major powerloom clusters under different managing agencies. These CAD Centres havebeen given a recurring expenditure @ Rs.6.75 lakh per centre per annum till completion of 5years.
141. Government of India have introduced a Group Insurance Scheme for powerloom workersin association with the Life Insurance Corporation of India since 1992-93. A modified schemehas been introduced from the current year under which powerloom workers aged between 18-59 years and below the poverty line (the poverty line for urban workers at 1999-2000 prices isestimated at Rs.454.1 per capita) or marginally higher than the BPL are eligible for an insurancecoverage of Rs.50,000/- on accidental death/permanent disability; Rs.25,000/- on permanentpartial disability; or Rs.20,000/- on partial disability under the scheme “Janashri Beema Yojana”.The annual premium of Rs.200/- would be shared by the Central Government, beneficiary andLIC in the order of Rs.60/-, Rs.40/- and Rs.100/- respectively. Under the add on scheme,

487
additional insurance coverage of Rs.30,000/- on natural as well as accidental death is madeavailable at annual premium of Rs.180/- which would be shared equally by Central Governmentand beneficiary. On paying weaver can avail cumulative benefits. While an expenditure ofRs.12.9 lakh was incurred during 2002-03 under the erstwhile scheme and the new scheme isdoing well with an estimated expenditure of Rs.13.56 lakh covering 19,823 powerloom workerstill 30th September, 2003.
142. With a view to improve the working environment and enable the powerloom worker inobtaining higher productivity, Central Government has approved a Group Workshed Scheme,which has Tenth Plan provision of Rs.19.27 crore and provides for subsidy for construction ofworksheds limited to 25% of the unit cost of construction subject to a maximum of Rs.80/- persq. ft. In order to improve the infrastructure facilities the scheme envisages a link with the TextileCentre Infrastructure Development Scheme (TCIDS) which provides central assistance forimproving critical infrastructure in existing or emerging textile centres.
Wool sector
143. The woollen industry in India is concentrated in the states of Himachal Pradesh, Punjab,Haryana, Rajasthan, Uttar Pradesh, Maharashtra and Gujarat. The organised sector, decentralisedsector and the rural sector of woollen industry run complementary to each other in meeting thedemand of different sections of the domestic market as well as exports. The industry comprisesmodern sophisticated fully composite mills in the organised sector as well as handloom andhand knotted carpet manufacturing units at the village level. The industry employs large numberof people to the tune of 12 lakh persons. Most of whom are shepherds rearing sheep flocks andproducing raw wool. Productivity of Indian wool rearers is quite low compared to internationalaverages because of depleting grazing grounds.
144. With a view to harmonise various diversified interests of different sectors of the woolindustry and to achieve integrated development of the industry, Central Wool DevelopmentBoard (CWDB), Jodhpur, has been functioning since 1989. The CWDB has taken up variousactivities for increasing earning of sheep rearers and increase quality of wool, marketingintelligence, marketing of wool and woollens, standardisation of wool and woollen products,quality control, dissemination of information, product diversification, advising government onpolicy matters, coordination etc. to promote growth and development of woollen products.
145. For the development of Angora wool an UNDP aided project costing Rs.8.43 crore isunder implementation. Rural unemployed youths and farmers of hilly areas of Uttar Pradesh,Himachal Pradesh, Darjeeling, Sikkim, etc, are encouraged to take up production and processingof Angora wool. Annual Production of Angora wool in the country is about 40 MT. The amounthas been revised to Rs.3.57 crore which included provision of Rs.2.88 crore for PashminaProject for Ladhakh region. Under the Integrated Sheep and Wool Development Project,aspects of breed improvement, health coverage, product development, marketing assistance,training to sheep breeders in sheep, sheep husbandry and productivity, etc, are taken up by theCWDB. The Board has covered 37.25 lakh sheep under this programme during 9th Plan.
146. CWDB has set up wool testing centres at Bikaner and Beawar in Rajasthan for providingtesting facilities to wool growers, merchants and the industry. The Board has also set up mini

488
wool scouring plants, weaving and designing centres, training centres, industrial service centres,wool testing facilities, etc. A machine shearing-cum-training project is under implementation toencourage use of shearing machines to improve sheep yield of wool of good quality.
147. The Board has set up 10 centres in main wool markets to collect market intelligenceinformation with respect to prevailing market rates of wool and yarn, latest trends andtransactions of wool and woollen products on a weekly basis and disseminated to wool growers,wool merchants and wool users. The CWDB has also established a Weaving and DesigningTraining Centre at Kullu in Himachal Pradesh to impart training in latest weaving technology andnew designs to the wool handloom weavers, so as to increase production, earnings and to getbetter market for their products. A new Technology Mission has been under formulation toincrease productivity, earning of sheep rearers and wool weavers, etc. Efforts are under way tomake available more grazing grounds by enabling States to use more and more graded wasteland and to develop green pastures.
Sericulture
148. India is not only the second largest producer of silk in the world after China but it isproducing all the four varieties of silk viz., Mulberry, Eri, Tasar and Muga. Sericulture is a labourintensive, agro based industry targeted to provide employment to about 56.00 lakh personsduring 2002-03. The Central Silk Board (CSB) is covering three main areas of Research andTechnology Development, Seed Maintenance and Development of Sericulture & Silk Industryand also providing extension and R&D inputs to sericulture industry in the country.
149. During the Ninth Plan period raw silk production of 17351 tonnes was achieved againstthe target of 20666 tonnes. During the Tenth Plan CSB has focused upon achieving internationalquality standards of all varieties of silk, strengthening R&D and transfer of appropriatetechnology, special emphasis on bi-voltine mulberry silk, strengthening of linkages betweensericulture and textile industry, etc. Under the zero-based budgeting exercise, developmentalschemes have been made more focused.
150. Research institutes are functioning at Mysore (Karnataka), Berhampore (West Bengal) andPampore (Jammu & Kashmir), to deal with mulberry sericulture, the institute at Ranchi(Jharkhand) deals with Tasar, whereas the institute at Jorhat (Assam) is looking after muga anderi sericulture. The Central Silk Technological Research Institute (CSTRI) at Bangalore isengaged in providing post cocoon R&D support. CSB has established Silkworm Seed TechnologyLaboratory (SSTL) at Bangalore (Karnataka), Central Sericultural Germplasm Resource Centre(CSGRC) at Hosur (Tamil Nadu) and Seri Biotech Research Laboratory (SBRL) at Bangalorefor R&D in areas related to silkworm races. CSB is providing technology, consultancy andextension facilities to various State Departments of Sericulture and their institutions.
151. Central Silk Board is providing quality silkworm seeds through National Silkworm SeedProject (NSSP). During 2002-03, 22 grainages (SSPCs) of CSB have prepared 183.68 lakhquality highbrid dfls. of different combinations. It is targeted to produce 216.24 lakh mulberrydfls. during 2003-04. Similarly, the production of Eri, Oak Tasar, Tropical Tasar and Muga dfls.during 2002-03 have been 0.06 lakh, 0.53 lakh, 18.06 lakh and 1.85 lakh respectively. During

489
the Tenth Plan period, the requirement of silkworm seeds would be higher than the presentcapacity of CSB Silk worm seed production Centres and State Government Centres. Henceprivate entrepreneurs are being encouraged to take up production of dfls. and seed cocoons.State Govt. seed production centres would also be strengthened suitably.
152. The CSB has formulated a number of schemes under Catalytic Development Programmes(CDP) and implemented in the Ninth Plan to motivate states to increase productivity and qualitybesides providing marketing support. During Tenth Plan, under the zero-based budgetingexercise, the CSB has revamped the CDP to give greater thrust to bi-voltine sericulture andgreater market orientation to non-mulberry sector. The revamped CDP aims at development andexpansion of host plantations, farm infrastructure, modern reeling and processing technologiesfor silk etc. A provision of Rs.173.73 crore has been ear marked for implementation of CDPduring Tenth Plan period. During 2002-03, an expenditure of Rs.43.32 crore has been incurredby CSB towards implementation of various schemes/components under CDP.
153. The UNDP assisted sub-programme on development of non-mulberry silk (Tasar, Mugaand Eri) in the states of Andhra Pradesh, West Bengal, Assam, Bihar, Jharkhand, Chattisgarh,Uttranchal, Orissa, Meghalaya and Nagaland under Fibres and Handicrafts Programme (FHAP)of Country Cooperation Frame Work-1 (CCF-1) in collaboration with GOI was completed in2002-03. The total cost of the programme was Rs.42.48 crore, out of which the GOI share wasRs.5.33 crore. Thrust under this programme was on increase of quality egg production andsupply, training and skill upgradation, technological support in pre-cocoon and post-cocoonprocesses, including reeling, spinning, etc.
154. Chattisragh State is implementing sericulture project in collaboration with Japanese Bankfor International Cooperation (JBIC) at an estimated cost of Rs.748.55 crore. Under the firstphase of the project (estimated cost – Rs.117.10 crore) tasar plantation of 4000 hectares wouldbe raised.
155. The State Govt. of Manipur is implementing the first phase of “Manipur Sericulture Project”at an estimated cost of Rs.93.29 crore with financial assistance from JBIC, Japan. Under thefirst phase of the project, 1020-1700 hectares of mulberry plantation would be raised by 3000to 5000 beneficiaries. 60 MT of raw silk is the production target.
156. Under the Japan International Cooperation Agency (JICA), assisted bio-voltine project(PPPBST Project II Phase), started in 1977, field verification and demonstration of biovoltineraces evolved during phase I of the project have been completed and the performance of thesebi-voltine races has been satisfactory. Average cacoon yield of over 60-80 kg. per hundred dfl.,a renditta pf 6 kg. to 7 kg. and 2A to 4A grade raw silk (a high quality) have been obtainedconsistently. Under the III Phase “Project for Strengthening Extension System for Promotion ofBio-voltine in India” is under implementation from August, 2002 for a period of 5 years with atarget to establish suitable extension system for promotion of bi-voltine in selected TSCs in theState of Karnataka, Tamilnadu and Andhra Pradesh.
157. The Tenth Plan target of providing 6700 MT of mulberry bi-voltine silk envisages specialprogramme for large scale propagation of the new technology and new sturdy bi-voltine races

490
developed by CSB. During Tenth Plan CSB also envisages to encourage integrated soil-to-silkproduction units in the private sector by providing direct linkages between the sub-sector of theindustry, ensure adoption of better quality standards, reorganization of sericulture relatedinstitutions in Central and State Governments and also to provide suitable policy interventionsto create better conducive environment to achieve the Tenth Plan target for production,employment and exports.
Handicrafts
158. The Handicrafts sector is making significant contribution to employment generation andforeign exchange earning through exports as well as retaining heritage and tradition. Performanceof the sector during 2001-02 and 2002-03 has been been encouraging, as may be seen inAnnexure.
159. Various developmental schemes are being implemented by the Office of DevelopmentCommissioner (Handicrafts) to supplement the state activities in the handicrafts sector. The Planschemes cover areas like training, design development, technology upgradation, marketpromotion, exhibitions and publicity, exports etc. Under the Ambedkar Hastashilpa Vikas Yojana(AHVY) focus is given on empowerment of artisans, providing marketing inputs, encouragementto artisans in formulating Self Help Groups (SHGs)/Cooperatives and cluster development.During 2002-03, 42 clusters were provided Rs.7.70 crore as financial assistance against thetarget of 100 clusters.
160. Training is being provided to artisans for upgrading the skills of existing craftsmen as wellas to un-skilled ones with a view to expand employment and production base of crafts foreconomic growth. For reviving languishing crafts, focus is on training, providing financialassistance and marketing inputs. There are 198 departmental Basic Training Centres providingtraining for carpet weaving. Out of 198 Centres, 175 carpet weaving/advance centres are inJ&K. For post-weaving operations like washing and finishing of carpets, training is provided inseven centres. Besides carpets, training is being provided to artisans for crafts like cane andbamboo, wood-wares, etc. During 2002-03, 2905 artisans were provided training.
161. Five Regional Design and Technical Development Centres (RDTDCs) are functioning atNew Delhi, Mumbai, Bangalore, Calcutta and Guwahati. The activities carried out at thesecentres include making crafts a success in the contemporary market, and preserving traditionalbeauty of the crafts on the basis of strong/design inputs. Various institutes like NCDPD,Development Centre for Musical Instruments at Madras, Cane and Bamboo DevelopmentInstitute at Agartala, Institute of Carpet Technology at Bhadohi (U.P.) and Metal HandicraftsCentre at Muradabad are helping handicraft units through research and design, developtechnology, improve tools and equipment, develop new designs, prototypes, etc. During 2002-03, 80 design workshops were organized, 3650 new designs and 200 tool kits have beendeveloped.
162. Under the scheme of marketing Support and Services, efforts are made to have a betterand meaningful interaction with artisans, non-governmental organisations (NGOs), State Govts,exporters and traders. During 2002-03, 79 marketing programmes have been organized against

491
the target of 60. These programmes helped in generating sales worth Rs.17.41 crore whichbenefited 5400 artisans. In addition to above, 147 exhibitions were also organised whichresulted in achieving sales of the order of Rs.8.16 crore benefiting 2396 artisans.
163. Under the scheme of Setting up Urban Haats similar to Delhi Haat, infrastructure wouldbe created at prime locations of market interest. So far, 25 urban haats have been approved.
164. Export promotion efforts of office of DC (Handicrafts) and Export Promotion Council forHandicrafts include participation in international fairs in foreign countries, sponsoring Sales/Technical cum Study teams to various countries. Exports from handicrafts includes craft itemsof zari and zari goods, art metal ware, wood ware, hand printed textiles and scarves andembroidered and crochet goods. Exports of handicrafts during 2002-03 were Rs.10933.67 crore.Food Processing Industries
165. The Ministry of Food Processing Industries is looking after formulation and implementationof policies and plans within the overall national priorities and objectives for promotion anddevelopment of this sector. Food Processing Industries (FPI) has sub-sectors like grainprocessing, fruits and vegetable products, milk products, meat and dairy products, fish and fishprocessing, beverages, aerated drinks, etc. The Food Processing Industries sector had beenidentified as a sunrise industry which could play a significant role in increasing value additionin agricultural and horticultural produce, diversification and commercialization of agriculture,reduction in wastage of agriculture/ horticulture produce by increasing processing level,generating employment and enhancing exports.
166. Rice milling, pulses manufacturing and production of wheat flour and other wheat productsare the main activities covered in the grain processing sector. The number of modern rice millswas 35088 as on 1st January,2002. No licence is required for setting up manufacturing/processing facilities for rice or wheat. Nearly 12.50 million tonnes of wheat is converted intovarious wheat products annually and 820 roller flour mills with an installed capacity of 19.50million tonnes were functioning as on 1st January,2001. Thirteen Regional Extension ServiceCentres have been set up in various states with agricultural universities/research institutions forencouraging modernisation of rice milling industry and by product utilisation. Post HarvestTechnology Centre at Indian Institute of Technology (IIT), Kharagpur is conducting trainingprogrammes on Home Scale Food Processing and Preservation Techniques and Processing ofMinor Millet. Production of bakery products is estimated to be in excess of 30 lakh tonnes.Organised sector is producing about 65 per cent of breads and biscuits, which account for 82per cent of the total bakery products. Besides these, soft drinks, beer and alcoholic drinks arealso a part of the food processing industry.
167. About 30 per cent of horticultural produce estimated to be worth around Rs.50000 croreis being wasted due to non-availability of post-harvest processing facilities, cold storages andcold chains. A strong and effective food processing sector would play a significant role indiversification of agricultural activities, improving value addition and exports of agro-products.This sector has vast potential for increasing production, exports and employment. In the TenthPlan, it has been envisaged to increase the food processing level to 10 per cent from the

492
present level of 2 per cent. The estimated installed capacity of fruit and vegetable processingindustries has increased to 21.10 lakh tonnes in 2001 from 21.00 lakh tonnes in 2000. Thisincrease is negligible and fresh investment is necessary. There is an urgent need to reducetaxes on finished food products so as to make them attractive and available within the reachof masses. Reduction of excise duty on finished/ packed food products would make the FPImore attractive to get private sector investments. India is first in milk production and second inthe production of fruits and vegetables in the world. India’s milk production is expected to touch81 million tonnes in 2000-01 from 78 million tonnes in 1999-2000. While about 80 per cent ofthe fruits and vegetables are processed in countries like Brazil, in India only about two per centof horticultural produce is processed.
168. The schemes and programmes being implemented by the Ministry of Food ProcessingIndustries include schemes like infrastructure development, technology upgradation andmodernization of FPI units, backward and forward integration and other prominent activities,quality assurance, codex standards and R&D, human resource development and strengtheningof institutions under MFPI. These schemes have been approved after the zero-base budgetingexercise under which 24 schemes of 9th Plan were reduced to 6 schemes to be taken up in theTenth Plan period.
169. Special emphasis is being laid on supporting research and development activities for foodprocessing and funds would be provided for development of traditional foods, new products/processes/packaging materials, utilisation of bye-products, etc. R&D projects funded by theMFPI in 2001-02 for which grant was provided to universities/technological research instituteinclude upgradation of traditional food technologies to enable greater productivity, energysaving, import substitution for packaging materials and food additives, development of intermediateproducts and dehydrated products with superior self-life development of cost effective andefficient food processing industries, frozen foods, etc. In the areas of packaging developmentto be provided more attention has to be paid for hot filling of food products in plastic containers,development of appropriate packages for ready to eat foods, traditional Indian khoya basedsweets, meat and meat products, micro-oven suitable packages, retortable pouches for fooditems and bio-degradable packaging materials.
170. The existing infrastructural facilities are inadequate and need upgradation and modernisation.Facilities of quality testing and certification are not upto the standards required for meeting thedemands of the domestic as well as the highly competitive export markets. Encouragement wasgiven to set up food parks by State/Promotional organizations. So far 36 food parks ( uptoNovember, 2002) have been sanctioned and they are at various stages of completion. Some ofthe food parks in Kerala, and Tamilnadu, have been completed and new FPI units are being setup in these food parks.
171 To provide hygienic and quality food products to the consumers, the Food Products Order(FPO) 1955 is in vogue. Amendments in FPO are being carried out at the instance of the CentralFruit Products Advisory Committee having representatives of government, CFTRI, BIS, fruit andvegetable processors and processing industry. Amendments were carried out in 2001 and 2002.Draft specifications in respect of 61 products have been considered by the Central FruitProducts Advisory Committee and recommended for modifications. Campaigns have beenlaunched to ensure that all processors of fruit and vegetable have a licence under the FPO.

493
172. Codex Alimentarius Commission is an international body constituted by Food and AgricultureOrganisation (FAO) and World Health Organisation (WHO) to help in developing standards forfood manufacturing and international trade by bringing together scientists, technical experts,government bodies, consumers and industry representatives. Codex standards are being usedfor safety and quality of food world-wide for international trade negotiations as well as for settlingof disputes related to food processing. A monitoring cell has been set up in the Ministry of FPIfor dissemination of information on Codex standards. The Codex Contact Point in India is theDirectorate General of Health and Services in the Ministry of Health and Family Welfare. TheMFPI is closely associated with the activities of Codex Elimentaries and five Shadow Committeesare under the Ministry. The Hazard Analysis and Critical Control Point (HACCP) qualityassurance system and ISO: 9000 Quality Management is extremely desirable. The Ministry isproviding grants upto 50 per cent, with a maximum of Rs.10 lakh, towards cost of implementationof HACCP, Total Quality Management (TQM) and obtaining ISO:9000 certification, etc. During2001-02, financial assistance of Rs.18 lakh has been provided.
173. The Ministry of FPI has prepared a draft National Food Processing Policy which envisagescreation of enabling environment, infrastructure development and backward linkages at farmlevel. Views of the state governments, industry and experts are included in the draft policy. Anoutline on the Draft Food Processing Bill had been prepared by the Ministry of FPI. A Groupof Ministers (GOM) have been set up to prepare a comprehensive Integrated Law for FPI.
Thrust Areas and Action Plan for 2003-04
174. As a follow up on the directive of the Prime Minister during the NDC meeting, draft PriorityAgenda of Action for 2003-04 has been drawn up. Thrust/ priority would be given during theAnnual Plan to the following:
• Formulation of an appropriate policy and creation of enabling environment toincrease India’s share in world exports from the existing level of 0.6% to 1%.
• Speedy implementation of the assistance package for the weavers and artisans.
• Implementation of the recommendations of the Task Force on PharmaceuticalIndustry.
• Complete introduction of electronic data interchange with regard to foreign trade foron-line filing/ data collection etc. in respect of regulatory work of Department ofCommerce.
• Comprehensive review of the functioning of Bureau of Indian Standards (BIS) witha view to strengthening its core competencies and exploring the possibility ofoutsourcing some of its activities.
• Formulation and implementation of scheme for technology upgradation in order toimprove the competitiveness of the Indian industry vis-à-vis global players.
• Revamping the MOU system for public enterprises.
• Identification of industrial clusters with high growth potential for need-based andspecifically designed intervention.
• Creation of enabling environment and intervention to increase India’s share in worldtextile trade from 3% to 10%.

494
• Formulation of a National Agenda on utilization of nuclear technology for developmentalapplications.
• Re-engineering of all regulatory processes, both upstream (prior to investmentapproval) and downstream (during implementation).
• Further decontrol of drug prices on the basis of a clear set of regulatory principles,institutional mechanism for price regulation.
• Implementation of the report of the Task Force on Project Exports.
• Shaping up of the content of SEZ, and competitive economic zone policy, includingthe Central SEZ Act, to enable world class infrastructure through private participationand hassle free regulatory regime in various areas, including taxation, customs,labour etc. in SEZ.
• Legislation of mandatory GMP HACCP certification for all food exports in two yearsand formulation of a scheme for technical assistance to enable compliance by foodprocessing industries.
• Merger of existing anti-dumping cell into an autonomous quasi judicial internationaltrade commission with a broader mandate related to WTO disciplines and equippedwith the technical capabilities of the erstwhile BICP, augmented by WTO related legalcapacities.
• Firming up of the statutory basis for imposition of anti-dumping duties on the findingsof the ITC.
• Making necessary amendments in the Essential Commodities Act to liberalise …..
• Preparation of a National Action Plan for consumer awareness, redressal andenforcement.
• Evolution of a policy for disinvestment of loss making PSUs.
• Evaluation of a final view on constituting asset management company for managementand dispersal of residual share of disinvestment companies.
• Evaluation of a final view on setting up of a “Disinvestment Proceeds Fund” for thecreation of new assets, investment, employment and retirement of public debt.
• Close monitoring of implementation of Cabinet decision on rationalization of subsidyscheme for urea and concession scheme for decontrolled fertilizers (DAP, MOP andcomplexes).
• Formulation of a long-term policy for fertilizer sector.
• Facilitating credit availability including collateral free credit to SSI and achieve highercoverage of SSI/ tiny units under credit guarantee trust fund scheme.
• Ensure availability of adequate funds for technology upgradation/ modernization,modern testing facilities, quality certification labs and upgradation of skills.
• Revision of policy on FDI, procedures for FDI clearances and strengthening offacilitation.
• Implementation of ERC recommendations and related VRS scheme aimed atreducing wasteful expansion.
• Comprehensive revision of Food Adulteration Act and other food laws for a newintegrated food bill.

495
• Institutionalisation of consultations with industry on multi-lateral negotiations in thefood sector
• Strengthening of quality control system for inputs and produce in agriculture.
• Introduction of policy procedures to promote R&D investments through FDI flows.
• Consideration of treatment of earnings from R&D exports at par with export earningsfor income tax purposes.
• Completion of the transition to a new intellectual property rights regime in order toleverage our comparative advantage in knowledge based industries.
• Processing and implementation of the recommendations of the Rakesh Mohan, AbidHusain, S.P. Gupta and K.C. Pant commodity reports of small scale industries.
• Processing and implementation of ASCI report on procedural/ regulatory reforms onsmall scale sector along with follow up action on Govindrajan Committee Report.
175. A specific NDC Sub-Committee has already been constituted for creation of Investor-friendly Climate in the country.

496
Annexure 10.1.1
Foreign Direct Investment
Sl.No. Sector Equity limit Entry Route
I ManufacturingI.1 Drugs (recombinant DNA) 100% FIPBI.2 Petroleum Refining-PSUs 26% FIPBI.3 Oil marketing 74% FIPBI.4 SSI 25% Automatic
II Minning & QuaryingII.1 Diamond, precious stones 74% AutomaticII.2.1 Petro Explore:small field,bid 100% FIPBII.3.1 Petro Explore:Un incorp JV 60% FIPBII.2.3 Petro Explore:Incorp JV 51% FIPBII.3.1 Coal & Lignite 50% Automatic
Power user 100% FIPBOther user 74% FIPB
II.3.2 Coal Washery 50% Automatic100% FIPB
IV. Infrastructure ServicesIV.1 Airports 74% AutomaticIV.2 Civil Aviation 100% FIPBIV.3 Telecom 40% FIPBIV.3.1 Basic & Mobile 49% FIPBIV.3.2 Total Bandwidth 74% FIPBIV.3.3 Gateway 74% FIPBIV.4 Pipeline:Oil & Gas 51% FIPB
V. Financial ServicesV.1 Banking (private) 49% AutomaticV.2 Investing companies 49% FIPB
VI. Knowledge servicesVI.1 Information TechVI.1.1 ISP 100% FIPBVI.1.2 Email, Voice mail 100% FIPBVI.1.3 Radio Paging 74% FIPBVI.2 Broadcasting-DTH, KU 20% FIPBVI.2.1 Up linking 49% FIPB
VII. Other ServicesVII.1 Advertising 74% AutomaticVII.2 Trading (export, SSI..) 51% AutomaticVII.3 Courier service 100% FIPB
VIII. Currently Banned SectorsVIII.1 Plantations (other) 0% FIPBVIII.2 Real estate:VIII.2.1 Complexes (all categories) 0% AutomaticVIII.2.2 Individual house/blding/shed 0% FIPB
Sectors excluded:: Arms and ammunition, Atomic Energy, Railway Transport. Coal and lignite,Mining of iron, manganese, chrome, gypsum, sulphur, gold, diamonds, copper, zinc.

497
Annexure 10.1.2
Foreign Investment Inflows(US $ million)
Item 1990- 1991- 1992- 1993- 1994- 1995- 1996- 1997- 1998- 1999- 2000- 2001- 2002-91 92 93 94 95 96 97 98 99 00 01(R) 02(R) 03(P)
1 2 3 4 5 6 7 8 9 10 11 12 13 14
A. Direct Investment 97 129 315 586 1,314 2,144 2,821 3,557 2,462 2,155 4,029 6,131 4,660
I. Equity (a+b+c+d+e) .. 129 315 586 1,314 2,144 2,821 3,557 2,462 2,155 2,400 4,095 2,700
a. Government .. 66 222 280 701 1,249 1,922 2,754 1,821 1,410 1,456 2,221 919(SIA/FIPB)
b. RBI .. — 42 89 171 169 135 202 179 171 454 767 739
c. NRI .. 63 51 217 442 715 639 241 62 84 67 35 —
d. Acquisition of .. .. .. .. .. 11 125 360 400 490 362 881 916shares *
e. Equity capital of .. .. .. .. .. .. .. .. .. .. 61 191 126unincorporatedBodies
II. Re-invested Earnings $ .. .. .. .. .. .. .. .. .. .. 1,350 1,646 1,498
III. Other capital $$ .. .. .. .. .. .. .. .. .. .. 279 390 462
B. Portfolio Investment 6 4 244 3,567 3,824 2,748 3,312 1,828 -61 3,026 2,760 2,021 979
a. GDRs/ADRs # — — 240 1,520 2,082 683 1,366 645 270 768 831 477 600
b. FIIs ** — — 1 1,665 1,503 2,009 1,926 979 -390 2,135 1,847 1,505 377
c. Offshore funds 6 4 3 382 239 56 20 204 59 123 82 39 2and others
Total (A+B) 103 133 559 4,153 5,138 4,892 6,133 5,385 2,401 5,181 6,789 8,152 5,639
^ : Data are revised since August 2002. R : Revised.
* : Relates to acquisition of shares of Indian companies by non-residents under Section 5 of FEMA, 1999. Data on suchacquisitions have been included as part of FDI since January 1996.
# : Represents the amount raised by Indian Corporates through Global Depository Receipts (GDRs) and American DepositoryReceipts (ADRs).
** : Represents fresh inflow of funds by Foreign Institutional Investors (FIIs).
$ : Data for 2002-03 are estimated as average of previous two years.
$$ : Data pertain to inter company debt transactions of FDI entities.
Note : Data on FDI have been revised since 2000-01 with expanded coverage to approach international best practices, therefore,are not comparable with FDI data for previous years.

498
Annexure 10.1.3
Statewise Release of Funds to the States/ UTs under Centrally Sponsored Schemes (CSS)
Name of the Ministry/ Department : Department of Industrial Policy & Promotion
Name of the Scheme : Growth Centre Scheme
(Re in lakhs)
S.No. Name of the State/UTs 2000-01 2001-02 2002-03 2003-04 (B.E.)
(1) (2) (3) (4) (5) (6)
1. Andhra Pradesh - - 110 -
2. Arunachal Pradesh - - 320 -
3. Assam 200 900 -
4. Bihar - - 200 -
5. Chhatisgarh - - 100 -
6. Delhi - - - -
7 Goa 150 - - -
8 Gujarat 400 235 300 -
9 Haryana 150 200 450 -
10 Himachal Pradesh - - 153 -
11 Jammu & Kashmir 200 50 275 -
12 Jharkhand - - - -
13 Karnataka 200 - - -
14 Kerala - - - -
15 Madhya Pradesh 100 250 -
16 Maharashtra 255 240 - -
17 Manipur 100 - - -
18 Meghalaya - - - -
19 Mizoram 250 - 180 -
20 Nagaland 195 255 - -
21 Orissa - 675 240 -
22 Punjab - - - -
23 Rajasthan - - 850 -
24 Sikkim - - - -
25 Tamil Nadu 150 600 - -
26 Tripura 250 270 500 -
27 Uttar Pradesh 650 1025 250 -
28 Uttaranchal Pradesh - - - -
29 West Bengal - 350 300 -
30 Andaman & Nicobar Islands - - - -
31 Chandigarh - - - -
32 Dadra & Nagar Haveli - - - -
33 Daman & Diu - - - -
34 Lakshadweep - - - -
35 Pondicherry - 100 250 -
TOTAL 3250 4000 5628 -
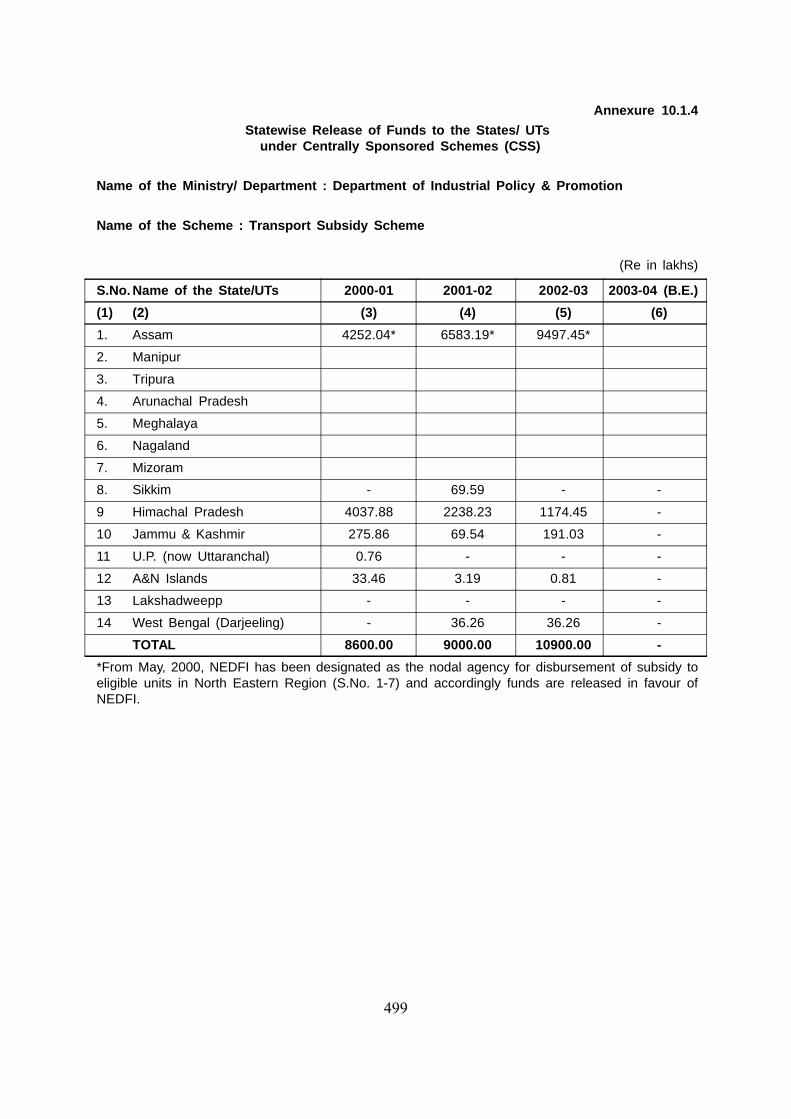
499
Annexure 10.1.4
Statewise Release of Funds to the States/ UTs under Centrally Sponsored Schemes (CSS)
Name of the Ministry/ Department : Department of Industrial Policy & Promotion
Name of the Scheme : Transport Subsidy Scheme
(Re in lakhs)
S.No. Name of the State/UTs 2000-01 2001-02 2002-03 2003-04 (B.E.)
(1) (2) (3) (4) (5) (6)
1. Assam 4252.04* 6583.19* 9497.45*
2. Manipur
3. Tripura
4. Arunachal Pradesh
5. Meghalaya
6. Nagaland
7. Mizoram
8. Sikkim - 69.59 - -
9 Himachal Pradesh 4037.88 2238.23 1174.45 -
10 Jammu & Kashmir 275.86 69.54 191.03 -
11 U.P. (now Uttaranchal) 0.76 - - -
12 A&N Islands 33.46 3.19 0.81 -
13 Lakshadweepp - - - -
14 West Bengal (Darjeeling) - 36.26 36.26 -
TOTAL 8600.00 9000.00 10900.00 -
*From May, 2000, NEDFI has been designated as the nodal agency for disbursement of subsidy toeligible units in North Eastern Region (S.No. 1-7) and accordingly funds are released in favour ofNEDFI.

500
Annexure 10.1.5
Statewise Release of Funds to the States/ UTs under
Centrally Sponsored Schemes (CSS)
Name of the Ministry/ Department : Department of Commerce
Name of the Scheme : Critical Infrastructure Balance Scheme
(Rs in lakhs)
S.No. Name of the State/UTs 2000-01 2001-02 2002-03 2003-04 (B.E.)
(1) (2) (3) (4) (5) (6)
1. Andhra Pradesh 200.00 Scheme merged with “ASIDE”
2. Arunachal Pradesh
3. Assam 95.47 300.00
4. Bihar 99.81
5. Chhatisgarh
6. Delhi
7 Goa
8 Gujarat 100.00
9 Haryana 12.20
10 Himachal Pradesh 165.00 165.00
11 Jammu & Kashmir 222.60 10.13
12 Jharkhand
13 Karnataka 250.00 274.08
14 Kerala
15 Madhya Pradesh 71.18 221.19
16 Maharashtra 115.74 50.00
17 Manipur
18 Meghalaya
19 Mizoram 135.53
20 Nagaland
21 Orissa 180.00
22 Punjab 100.00 100.00
23 Rajasthan
24 Sikkim
25 Tamil Nadu 200.00
26 Tripura 100.00 85.24
27 Uttar Pradesh
28 Uttaranchal Pradesh
29 West Bengal 65.00 100.00
30 Andaman & Nicobar Islands
31 Chandigarh
32 Dadra & Nagar Haveli
33 Daman & Diu
34 Lakshadweep
35 Pondicherry 99.00 150.00
TOTAL 2199.33 1467.84
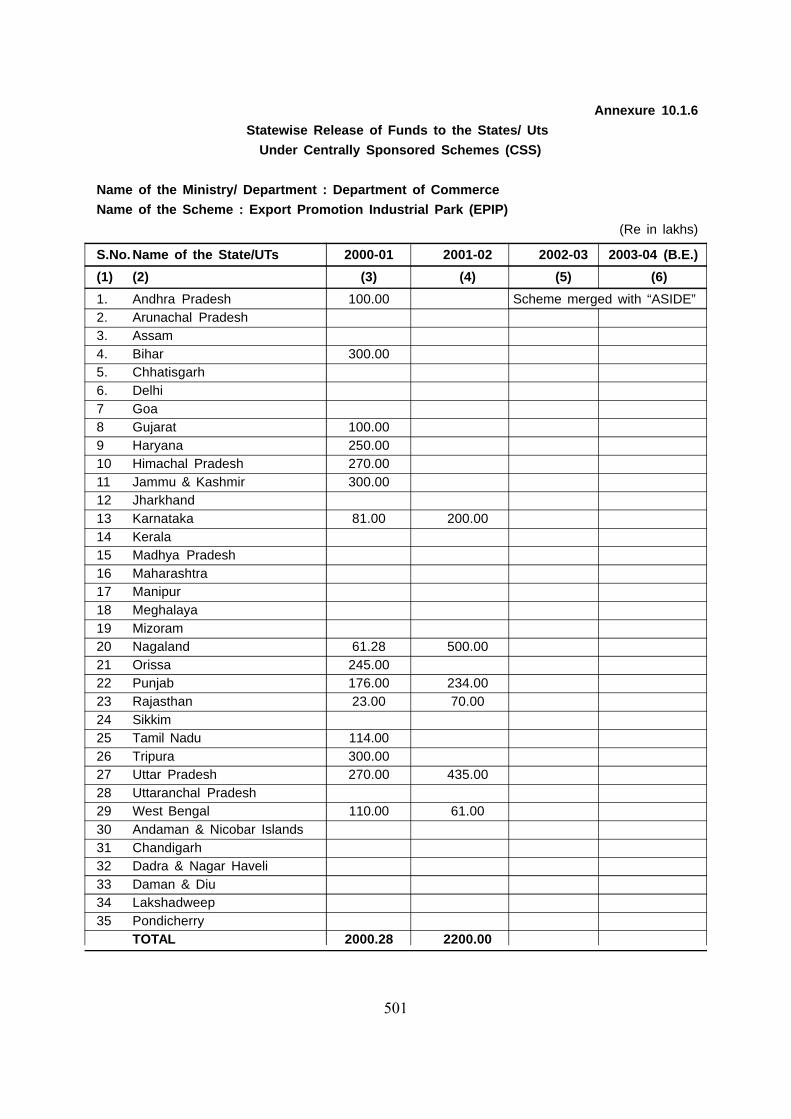
501
Annexure 10.1.6
Statewise Release of Funds to the States/ Uts
Under Centrally Sponsored Schemes (CSS)
Name of the Ministry/ Department : Department of Commerce
Name of the Scheme : Export Promotion Industrial Park (EPIP)
(Re in lakhs)
S.No. Name of the State/UTs 2000-01 2001-02 2002-03 2003-04 (B.E.)
(1) (2) (3) (4) (5) (6)
1. Andhra Pradesh 100.00 Scheme merged with “ASIDE”2. Arunachal Pradesh3. Assam4. Bihar 300.005. Chhatisgarh6. Delhi7 Goa8 Gujarat 100.009 Haryana 250.0010 Himachal Pradesh 270.0011 Jammu & Kashmir 300.0012 Jharkhand13 Karnataka 81.00 200.0014 Kerala15 Madhya Pradesh16 Maharashtra17 Manipur18 Meghalaya19 Mizoram20 Nagaland 61.28 500.0021 Orissa 245.0022 Punjab 176.00 234.0023 Rajasthan 23.00 70.0024 Sikkim25 Tamil Nadu 114.0026 Tripura 300.0027 Uttar Pradesh 270.00 435.0028 Uttaranchal Pradesh29 West Bengal 110.00 61.0030 Andaman & Nicobar Islands31 Chandigarh32 Dadra & Nagar Haveli33 Daman & Diu34 Lakshadweep35 Pondicherry
TOTAL 2000.28 2200.00

502
Annexure 10.1.7
Statewise Release of Funds to the States/ Utsunder Centrally Sponsored Schemes (CSS)
Name of the Ministry/ Department : Department of Commerce
Name of the Scheme : Assistance to States for the Development of Export Infrastructure
and other Allied Activities (ASIDE).
(Re in lakhs)
S.No. Name of the State/UTs 2000-01 2001-02 2002-03 2003-04 (B.E.)
(1) (2) (3) (4) (5) (6)
1. Andhra Pradesh 170.00 1200.00 1200.002. Arunachal Pradesh - 50.00 100.003. Assam 208.00 200.00 400.004. Bihar 330.98 300.00 600.005. Chhatisgarh 200.00 400.00 400.006. Delhi - 10.00 200.007 Goa - 600.00 600.008 Gujarat 118.14 1400.00 1400.009 Haryana 250.00 600.00 600.0010 Himachal Pradesh 700.00 700.0011 Jammu & Kashmir 600.00 600.0012 Jharkhand 200.00 400.00 400.0013 Karnataka 200.00 1800.00 1800.0014 Kerala 450.00 1100.00 1100.0015 Madhya Pradesh 213.95 1000.00 1000.0016 Maharashtra 533.00 1600.00 3200.0017 Manipur 11.00 100.00 200.0018 Meghalaya - 100.00 200.0019 Mizoram - 100.00 200.0020 Nagaland - 50.00 100.0021 Orissa - 450.00 900.0022 Punjab 400.00 900.0 900.0023 Rajasthan 239.15 1200.00 1200.0024 Sikkim - 50.00 100.0025 Tamil Nadu 50.00 2800.00 2800.0026 Tripura - 150.00 300.0027 Uttar Pradesh 306.75 2000.00 2000.0028 Uttaranchal Pradesh 200.00 400.00 400.0029 West Bengal 271.03 1000.00 1000.0030 Andaman & Nicobar Islands - 200.00 200.0031 Chandigarh - 100.00 200.0032 Dadra & Nagar Haveli - 300.00 300.0033 Daman & Diu - 150.00 300.0034 Lakshadweep - 200.00 200.0035 Pondicherry - 300.00 300.00
TOTAL 4352.00 22600.00 26100.00*
*Against the allocation of Re 280.00 crores., Re 261.00 crores has been allocated.

503
Annexure 10.1.8
Sub-Sector-wise Outlays/Expenditure Annual Plan 2003-04
(Rs. crore)
Sl. Industry/ 2001-02 2002-03 (BE) 2002-03 (RE)/Exp. 2003-04Sub Sector Actuals Outlay BS IEBR Exp. BS IEBR Outlay BS IEBR
Ministry of SSI
1 SIDO 173.14 313.00 313.00 0.00 249.23 249.23 0.00 305.00 305.00 0.00
2 NSIC 101.30 117.00 32.00 85.00 103.26 25.65 77.61 90.00 40.00 50.00
3 Other Schemes 0.48 5.00 5.00 0.00 0.83 0.83 0.00 5.00 5.00 0.00
Total of SSI 274.92 435.00 350.00 85.00 353.32 275.71 77.61 400.00 350.00 50.00
Ministry of ARI @
1 Coir 11.60 13.80 13.80 0.00 11.24 11.24 0.00 18.00 18.00 0.00
2 PMRY 193.50 169.00 169.00 0.00 168.10 168.10 0.00 169.00 169.00 0.00
3 NPRI 0.00 1.00 1.00 0.00 0.00 0.00 0.00 1.00 1.00 0.00
Total of ARI 205.10 183.80 183.80 0.00 179.34 179.30 0.00 188.00 188.00 0.00
Ministry of Textiles(VSI)
1 Handlooms 113.00 140.00 140.00 0.00 130.83 130.83 0.00 156.77 156.77 0.00
2 Powerlooms 7.26 12.00 12.00 0.00 4.60 4.95 0.00 14.00 14.00 0.00
3 Handicrafts 76.84 88.00 88.00 0.00 71.65 72.41 0.00 103.55 103.55 0.00
4 Sericulture 88.41 87.50 87.50 0.00 91.07 91.07 0.00 92.68 92.68 0.00
5 Wool 5.62 8.00 5.26 2.74* 5.00 8.25 0.00 13.00 13.00 0.00
Total of 291.13 335.50 332.76 2.74 303.15 307.51 0.00 380.00 380.00 0.00Textiles(VSI)
Ministry of FoodProcessing Industries
Total Ministry 55.00 75.00 75.00 0.00 73.00 75.00 0.00 75.00 75.00 0.00of FPI
* UNDP Aid
@ KVIC outlays/expenditure are indicated in the Chapter on Rural Development

504
Annexure 10.1.9
Physical Performance (Sub-Sector) Annual Plan 2003-04
S. Industry/sub- Unit 2001-02 2002-03 2003-04No. Sector Actuals Anticipated Targets
A Production
1 Small Scale Ind. Rs. crore 690316 760631 935597
2 Coir Fibre Tons 375000 375000 395000
3 Handloom Cloth Mill. Sq. Mtrs. 7585 5989 6200
4 Powerloom Cloth Mill. Sq. Mtrs. 25192 26109 25406
5 Raw Silk Tons 17351 16211 19900
6 Handicrafts Rs. crore 16278 19563 20356
B Employment Lakh Person
1 Small Scale Ind. Lakh Person 192.23 199.65 209.03
2 Coir Fibre Lakh Person 5.67 5.80 6.00
3 Handloom Cloth Lakh Person 124 120 124
4 Powerloom Cloth Lakh Person 42 42 Not fixed
5 Sericulture Lakh Person 55 56 57.50
6 Handicrafts Lakh Person 58 60 62
7 Wool Development Lakh Person 12 12 12(Unorganised Sector)
C Exports Rs. crore
1 Small Scale Ind. Rs. crore 71244 N.A. N.A.
2 Coir Industry Rs. crore 321 353 400
3 Handlooms Rs. crore 2065 2633 575mill US $
4 Powerlooms Rs. crore 11000 13191 14500
5 Silk Rs. crore 2235 2163 3060
6 Handicrafts Rs. crore 9206 10934 11604

505
10.2 MINERALS
Development of minerals is essential for the assured industrial and infrastructure growthof the country. In last five decades sustained efforts in prospecting and development of mineralshave considerably augmented the mineral inventory, however, self sufficiency in respect ofcopper, nickel, gold, diamond, platinum group of metals etc. is area of concern.
2. A review of the mineral exploration and development work indicates that most of theaccessible and near surface deposits are either exhausted or under production. A major portionof the copper, lead and zinc reserves are in the ‘possible ‘ category and have not been exploredto the level of ‘proved’ reserves. Life indices of base metals for copper, lead, and zinc isestimated to be ten years, five years, and fifteen years respectively, however, in case of bauxite,country is in comfortable position with life index 153 years beyond 01-04-2007. Per capitaconsumption of aluminium in India is still very low. With 7 percent of world resources of bauxite,India‘s share in the world alumina production is only 4.3 percent and its share in world tradeis 3.5 percent. There is adequate scope for increasing production of alumina and its exports.India is exporting bauxite and alumina around 10 lakh and three lakh tonnes as against worldtrade of 35 million tones and 17 million tones respectively. Aluminium industry is power intensiveand power is scarce in India, but in the era of globalisation, possibilities of entering into jointventure for production of aluminium with countries having abundant power such as gulf may beexplored. Efforts should be made for producing more alumina for export using state-of-the-arttechnology .
3. The self sufficiency acquired in minerals does not fully cater to the future industrial needsof the nation as only a few significant discoveries have been reported in the Ninth Plan. Thereis need for carrying out mineral exploration quite intensively for establishing more copper, lead,zinc recoverable reserves in the country. The mining sector has been thrown open to privatesector, both foreign and domestic. The MMDR Act ,1957 has been amended for making it moreinvestor friendly with emphasis on development rather than regulation. With this measure,Foreign Direct Investment (FDI) is expected to increase in this sector.
REVIEW OF ANNUAL PLAN 2002-03
4. The Mines and Minerals (Development and Regulation) Act, 1957 (MMDR Act) and rulesframed were amended to make the statutory provisions at par with international best practices.The policy changes have attracted private investment in exploration of base-metals, noblemetals and gem stones. Reconnaissance permits in 119 cases involving an area of over 155000sq. kilometers have been granted till 31.12.2002 of which 46 reconnaissance permits for an areaof over 68300 sq. kilometers were granted during 2002-03.
5. During the year 2002-03, two proposals involving Foreign Direct Investment to the tune ofRs.55 crores were approved through the Foreign Investment Promotion Board (FIPB) route,which takes the total number of FIPB approvals to 72, indicating an expected FDI inflow ofRs.4,018 crores.

506
ACTION TAKEN IN 2002-03
During 2002-03 ,MCR,1960 and MCDR,1988 have been further amended as follows.• A time limit of ninety days has been prescribed for the Indian Bureau of Mines and the
State Governments to convey decision on the mining plan submitted for approvals.• Time limits have been prescribed for conveying a decision on applications for mineral
concessions, viz. six months for reconnaissance permits, nine months for prospectinglicenses and twelve months for mining leases.
• The provisions of penalty under MCDR.1988 was amended on 11TH January 2002inserting new rule providing for intimation of amalgamation of mining leases in 30 days,enhancing the penalties for violation of rules etc.
• The Offshore Areas Mineral (Development and Regulation) Act, 2002 providing fordevelopment and regulation of mineral resources in the territorial waters, continentalshelf, and the exclusive economic zone was notified on 31.1.2003. The legislation wouldenable streamline of mineral exploration and development in the offshore areas andensure systematic and scientific exploitation of mineral reserves (except petroleum,natural gas and hydrocarbon resources) for attracting private investment in the mineralsector.
6. Concept of zero based budgeting was introduced in the Annual Plan 2002-03, the first yearof the Tenth Plan and accordingly PSU’s and organizations like Geological Survey of India (GSI)and Indian Bureau of Mines (IBM) have categorized their activities as per zero based budgeting.Monitoring of physical and financial performance through QPRs, based on zero based budgetingis being done by the Planning Commission.
7. After successful completion of the geological mapping of the country on 1:50,000 scale inprevious plans, GSI has undertaken geochemical and geophysical mapping during the TenthFive Year Plan . The activities of GSI need to be formulated in project mode for ensuring workof international standard in stipulated time frame. Modernization and restructuring of GSI wasaccorded priority during the Tenth Plan.
8. Indian Bureau of Mines (IBM) has carried out work on United Nations Frame workClassification (UNFC) of Indian Mineral resources for converting data according to internationalstandards, besides preparation of overlays superimposing mineral maps with forest maps.
SUB SECTOR PROFILE
9. Sub sector wise details of the mineral sector are as given below:
IRON ORE
10. India’s haematite reserves of iron ore (as on 1.4.2000) are estimated to be over 12317million tonnes and magnetite ores of 5395 million tonnes .
11. The estimated production of iron ore in 2002-03 was 86.4 million tones against a targetof 100.00 million tonnes . The dispatches of iron ore during 2002-03 was estimated to be 84.7

507
million tonnes inclusive of estimated 53.3. million tonnes for internal consumption and 31.4million tonnes for exports.
12. The Government of India had approved development of Bailadila 10/11A iron ore projectof the National Mineral Development Corporation (NMDC) at an estimated cost of Rs.430.50crores including foreign exchange component of Rs.18.61 crores. The project construction hasbeen completed. The load trials of Crushing Plant have been taken on July, 2002. Equipmentsin Screening Plant and Loading Plant are under load run operations. NMDC has taken upexploration of gold and diamond in Tanzania, Madagascar, Namibia and Mozambique.
13. The mining lease for Kudremukh iron ore company ltd. (KIOCL) was given for 30 yearsperiod which expired on 24th July 1999. Since then, the Company was working on temporaryworking permits granted to it. An NGO had filed a Writ Petition in the Hon’ble Supreme Courtin May 2001, the question of long term renewal of mining lease to the Company. The Hon’bleSupreme Court pronounced its judgment on 30.10.2002 and as per this judgment; the Companycan continue mining at Kudremukh only till December, 2005 which include the operations withinthe broken-up area and the mining would be for weathered ore only. The Company is continuingits efforts to obtain prospecting licence/mining lease for exploitation of iron ore deposits in otherplaces in Karnatka, Orissa and Jharkhand.
CHROMITE ORE
14. The Chromite Ore reserves in the country are estimated at over 114 million tonnes as on1.4.2000 (as per National Mineral Year Book 2002). The major quantity of these reserves areconfined to state of Orissa.
15. The production of Chromite ore in the country during 2002-03 is estimated to be 2550thousand tonnes. The dispatches of Chromite ore is estimated to be 1948 thousand tonnesinclusive of 1010 thosuand tonnes for domestic consumption and 938 thousand tonnes forexports.
16. In view of the fact that India endowed with the limited reserves of Chromite ore in thecountry, only certain grades of Chromite ore are allowed for export. Export Policy 2002-03 hasstipulated specific ceiling in respect of export of Chromtie ore. The overall ceiling is 4 lakh forall Chromite ore inclusive of ceiling of 0.40 lakh tonnes of export per annum is applicable forLow Silica Friable / Fine Chromite Ore with Chromium Oxide between 52-54% and Silicaexceeding 4% and 3.6 lakh tonnes for Low Silica friable / fine chromium ore with Chromiumoxide not exceeding 52% and silica exceeding 4% and Chromite Lumps containing Chromiumoxide not exceeding 40%. No ceiling is prescribed for the beneficiated Chromite concentrates,if average feed grade comprises of less than 42% of Cr2O3.
MANGANESE ORE
17. The total manganese ore reserves are estimated at 406 million tones as on 1.4.2000. Thereserves suitable for ferro-manganese grade are 11% of total reserves. Manganese ores arefound in Maharashtra, Madhya Pradesh, Orissa, and Karnataka. These states account for 95%of domestic production of manganese ore.

508
18. During 2002-03, the production of manganese ore was estimated to be 1.56 milliontonnes. Manganese Ore India Ltd (MOIL), is the only PSU in the country producing Metallurgicaland Blast Furnace Grade Manganese ore. Life index of adequacy of known reserves ofmanganese ore is low, therefore efforts are being made to conserve its use as well as restrictthe export. The ceiling limit for export of manganese ores is 7 lakh tonnes per annum whichincludes 1.50 lakh tonnes for (a) not exceeding 0.25 lakh tonnes per annum (i) medium grademanganese ore blend containing 46% - 49% with not less than 0.24% P, (ii) medium grademanganese ore/blended ore containing 38% to 46% manganese and more than 0.1% to0.15%P; (b) manganese not exceeding 4.00 lakh tonnes per annum of low grade manganeseore/blended ore containing less than 38% and (c) not exceeding 1.50 lakh tones per annum ofManganese ore fines below 12 mm in size containing less than 44% manganese.
19. As on 31.12.2002, the Govt. of India held 81.57% shares in Manganese Ore India Ltd. withState Governments of Maharashtra and Madhya Pradesh holding 9.62% and 8.81% sharesrespectively. In order to reduce inventory, MOIL has made efforts to export the ore. In the currentyear, the Company has exported more than 9,300 tonnes till December, 2002.
ALUMINIUM
20. The installed capacity for the production of Alumina in the country is 24,87,000 tonnes perannum and 7,14,000 tonnes per annum of Aluminium. There are five companies which produceAlumina and Aluminium viz. the National Aluminium Company Limited – a public sectorundertaking; Bharat Aluminium Company Ltd. (BALCO) – a joint sector undertaking; HindustanAluminium Corporation Ltd. (HINDALCO), Indian Aluminium Company Ltd. (INDAL), andMadras Aluminium Company Ltd. (MALCO) all three in private sector.
21. During 2002-03 the production of Aluminium is estimated 689 thousand tonnes against atarget of 701 thousand tonnes. The share of NALCO in the domestic production is about 36%(Annexure 10.2.2).
22. The third stream of Alumina Refinery of NALCO was commissioned during December,2001. With this, the capacity of Alumina Refinery has increased from 10,50,000 tonnes perannum (tpa) to 15,75,000 tpa.
23. After expansion, NALCO becomes the largest alumina producer in Asia with an exportablesurplus of one million tpa after meeting the internal demands of its smelter at Angul.
24. In National Aluminium Company Ltd. the Government of India holds 87.15% equity. TheGovernment has taken a decision to further disinvest 30% equity of NALCO through a publicoffer (in the mix of domestic market 10% and through ADR 20%) and sale of 29.15% equity toa strategic partner bringing the Government equity down to 26% after reserving upto 2% of theequity for NALCO employees.
COPPER
25. The installed capacity for the production of copper in the country is estimated to be3,47,500 tonnes per annum inclusive of 47,500 tonnes per annum capacity of Hindustan Copper

509
Limited. The domestic production of copper is not adequate to meet the demand, therefore,import of copper is permitted. Both private companies Sterlite and Birla Copper are dependenton imported copper concentrate for their operation. About 70% of domestic demand is metthrough imports.
26. The production of copper during 2002-03 is estimated to be 377 thousand tonnes(Annexure 10.2.2) against a target of 400 thousand tonnes. This was attributed to the closureof captive mines in Singhbhum (Jharkhand) and Khetri (Rajasthan) of Hindustan Copper Ltd.
27. Due to continuous fall in LME prices of copper and progressive reduction in Customs Dutyon imported copper, HCL continued to incur losses. In order to make the Balance sheet of thecompany attractive for disinvestments and for keeping the Net Worth positive, Governmentaccorded its approval to Second Financial Restructuring for the company in June, 2002.
LEAD AND ZINC
28. Hindustan Zinc Ltd. and Binani Industries Ltd. are the only producers of Zinc in the country.The installed capacity of Zinc is 199 thousand tonnes per annum and 43 thousand tonnes perannum for Lead. Hindustan Zinc Ltd. has the installed capacity of 169 thousand tonnes perannum for Zinc and 43 thousand tonnes per annum for Lead. During the year 2002-03, theproduction of Zinc was 235 thousand tonnes against a target of 237 thousand tonnes. Leadproduction was 39 thousand tonnes against a target of 37 thousand tonnes.
INDIAN BUREAU OF MINES
29. The Indian Bureau of Mines (IBM) is engaged in the promotion & conservation of minerals,protection of mines environment and scientific development of mineral resources of the country,other than coal, petroleum and natural gas, atomic minerals and minor minerals.
30. Ores and minerals as they occur in nature do not generally conform to the desiredspecifications of the down stream industries and as such these are subjected to ‘beneficiationprocesses’ to produce suitable raw material. There is need to develop technology for beneficiationof low grade ores /minerals which are still lying untapped in the country. IBM should endeavorto further develop modern facilities to under take beneficiation work particularly for low gradeores.
31. IBM has completed 50 mineral maps with forest overlays pertaining to 2001-02 andsubmitted with MOEF besides achieving target of 100 maps covering parts of Chhattisgarh andOrissa for the year 2002-03. There is need for completing this work on priority in view ofpromoting private investment in this sector.
32. Having regard to changing scenario in the mineral sector in the wake of liberalization ofpolicy, concern of environment protection and ensuring systematic and scientific mining, themandate for IBM has been revised recently as indicated in the annexure–10.2.3.
GEOLOGICAL SURVEY OF INDIA (GSI)
33. During the Annual Plan 2002-03, GSI remained engaged in ground geological survey,geophysical survey, mineral exploration, airborne survey, marine survey and digitization of maps

510
besides modernization of its laboratories. An area of about 8975 sq.km. has been mapped on1:25,000 scale under Specialized Thematic Mapping against the target of 8778 sq.km. andexceeded the target . However, there has been shortfall in ground geophysical surveys whereinagainst the target of 7076.30 sq.km. 3948.8 sq.km. has been covered by gravity-magneticgeophysical mapping. GSI has also exceeded the targets of large scale mapping and drillingunder mineral exploration programme,besides augmenting reserves of coal,lignite, iron ore andmanganese etc. in different parts of the country. Under airborne survey programme GSI hascovered 16713l km. against a target of 30800l km. This shortfall in airborne surveys is due todelay in getting clearance from MOD and DGCA. Marine surveys is also one of the majoractivities of GSI wherein systematic survey and parametric studies(Bathymetric, magnetic andsampling) within Exclusive Economic Zone (EEZ) and territorial waters were taken up during2002-03. Geoscientists from GSI participated in Antarctic Expedition also.
MINERAL EXPLORATION CORPORATION LIMITED (MECL)
34. MECL carry out detailed exploration and exploratory mining for various metallic ,nonmetallic minerals including coal, lignite and coal bed methane (CBM). The company carried outpromotional and contractual drilling besides, mining development during 2002-03. There hasbeen shortfall of 32 percent in drilling and 10 percent in developmental mining during this period.For past few years company is under going losses and against a target of (-) Rs. 284 lakhs theactual losses have gone up further to the level of (-) Rs. 1429 lakhs in 2002-03. It is a lossmaking company slated for disinvestments.
EXTERNALLY AIDED PROJECTS
35. During Annual Plan 2002-03, GSI had proposed for modernization of the laboratoryfacilities and re-structuring of its ground, marine & aerial surveys with BRGM financial aid ofRs.70.00 crore, however, due to non realization of foreign aid, modernization programme couldnot be taken up during plan.
36. Four IBM-BRGM project proposals i.e. Management of solid Waste from Mining in India,Supply of Laboratory equipment to IBM, Capacity of building at State level for MineralDevelopment and Environmental Management; Implementation of United Nation’s FrameworkClassification for Mineral Resource Management in India under Grant-in-Aid are under activeconsideration of BRGM, France and Government of India, have been included in the Tenth Plan.These projects include Rs.3.33 crores BRGM, France assistance. During the year 2002-03 (upto December, 2002), 54 ore dressing investigations, 39,113 chemical analyses and 1,682mineralogical examinations were completed. Besides, 12 in-plant studies were carried outduring the period.
INTERNATIONAL MARKET BEHAVIOUR IN THE MINERAL SECTOR
37. The total world supply of aluminium up to December,2002 was around 17.5 million tonnesagainst the consumption of 16.8 million tonnes. The reactivation of power related idle capacityhas largely supported the recovery in supply. The LME prices remained under pressure in 2002-03 due to slow growth in the economies of USA, Europe and Japan. The LME aluminium cash

511
prices remained around US$1300 per tonne. The prices have been quite volatile on account ofuncertainties in the global economy.
38. Domestic price of copper is linked to LME price. Which have declined sharply from US$2844 per tonne in 1995-96 to US$ 1581 in 1998-99 and since then has been fluctuating. Theover supply of copper concentrates from Chile and CIS and fall in demand from Europe haveaffected the LME price of copper. This has severely affected the financial position of HindustanCopper Limited. The volatile LME price situation in recent years has affected global expenditureon mineral exploration and as such is an area of concern.
ANNUAL PLAN 2003-04
OBJECTIVE
39. As a part of Tenth Plan, there will be a search for minerals in the off-shore areas. GSI willtake active fault mapping, preparation of predictive seismic micro zonation maps and observationalseismology for delineation of potential risks zone for geo-hazard management.
40. The modernization programme of GSI would include upgradation and expansion oflaboratory instrumentation, drill machines etc. as well as Blue-water Research Vessel, Geo-technical Vessel, Coastal Launch and Air-borne Survey System.
PLAN OUTLAY
41. Plan outlay (RE) of Rs.1018.29 crore was approved for the Annual Plan 2002-03, whichincluded Rs.703.25 crore as of IBER and Rs.315.04 crore of gross budgetary support (GBS).An outlay of Rs.888.05 crore was approved for the Annual Plan 2003-04, to be financed throughIEBR of Rs.653.55 crore and GBS of Rs.234.50 crore including a sum of Rs.25.60 crore asforeign aid, routed through the budget (Annexure 10.2.1). Annual Plan (2003-04 ) allocations ofGeological Survey of India and Indian Bureau of Mines include Rs. 15.19 crore and Rs 1.75crore respectively for the mandatory expenditure in the North –East and Sikkim Region . Thereis no centrally sponsored scheme (CSS) in this sector.

512
THRUST AREAS
• To enhance the indigenous mineral resources, intensive exploration is required in thefield of exploration of high value and low volume minerals like gold, diamond andplatinum group of metals .
• An enabling environment must be created to attract new investment through privatesector participation with modern technical and managerial expertise for finding newdeposits and develop them sustainably in the Tenth Plan.
• India lacks adequate resource base in respect of a number of minerals for which thecountry has to depend largely on imports. There remains urgency for pursuing explorationefforts with modern concepts and tools for possible break through, mainly in locatingconcealed/deep seated mineral deposits/prospects in known mineralized belts and inidentifying new geological environments for ore localization especially in deficient andnon-existent commodities.
• It is also necessary to direct due attention on low grade ores in order to convert yesteryears waste into tomorrow’s ore with the help of technological innovations by IBM.
• Thrust is required to augment uranium reserves for fulfilling the fuel requirement ofproposed atomic energy production in the Tenth Plan period.
• Emphasis has been laid on state- of- the- art technology and integrated multi disciplinaryapproach to mineral exploration for discovering concealed deposits.
• Based on geological database, conceptual efforts are necessary for probing deposits atdeeper level by integrating modern geological, geochemical and geophysical techniques.
• GSI would have to be restructured and modernized, including in the areas ofinstrumentation for both ground and aerial geophysical surveys, state-of-the-art laboratoryinstrumentation with high precision capabilities, etc. Also, a new research vessel wouldhave to be acquired for carrying out bathymetric and magnetic surveys in off-shore areasfor staking claim on extended continental shelf zone up to 350 nautical miles under III– UNCLOS”.
• It would be necessary to adopt U.N. Framework Classification (UNFC) at the earliest andto bring up the National Mineral Inventory (NMI) as per this classification which willpresent reserves/resources of minerals on internationally uniform system inter-alia forattracting more FDI in the mining sector.

513
Annexure 10.2.1
Plan Outlay and Expenditure( BE, RE 2002-03 & BE 2003-04)
(Rs. in crore)
PSU Name 2001-02 2002-03 2003-04
Actual BE RE BE
National Aluminium Coy Ltd. 1054.13 900.00 700.00 650.00
Hindustan Copper Ltd. 95.00 25.00 85.00 20.00
Mineral Exploration Corporation Ltd.
(a) Promotional 7.00 8.00 14.00 9.00
(b) Capital 3.00 3.00 0.00
Geological Survey of India 82.14 168.50 181.50 176.00
Indian Bureau of Mines 17.09 18.00 18.00 19.00
Science & Technology 7.62 8.50 9.79 8.05
Construction
(a) GSI 8.00 6.00 6.00 5.00
(b) IBM 1.00 1.00 1.00
Total 1270.98 1138.00 1018.29 888.05

514
Annexure 10.2.2
Physical Performance for 2002-03 and target for AP 2003-04
Item Unit 2001-02 2002-03 2002-03 2003-04Actual Plan Target Actual Target
1. Iron Ore Mill. Ton. 80.99* 100.00 86.40 100.00
2. Aluminium Tho. ton. 638.00 701.00 689.00 795.00**
3. Copper Cathode Tho. ton. 336.00 400.00 377.00 378.00#
4. Zinc (Primary) Tho. ton. 205.00 237.00 235.00 234.00@
5. Lead Tho. ton. 38.00 37.00 39.00 36.00@@
* Estimated
** Including production from the private sector companies i.e. BALCO, HINDALCO, INDAL andMALCO
# Including production from the private sector companies i.e. Sterlite Industries Ltd. & Birla Copper.
@ Production of primary zinc in HZL and the Private Sector unit, Binani Industries Ltd. (BIL)
@@Both plants of ILL at Thane and Kolkata are closed, as the Company is before BIFR.

515
Annexure 10.2.3
REVISED CHARTER OF FUNCTIONS OF IBM
1. To promote systematic and scientific development of mineral resources of the country(both on shore and off shore).
2. To approve mining plans, schemes and mine closure plans having regard to conservationof minerals and protection of mines environment.
3. To collect, collate and maintain database on exploration, prospecting, mines andminerals and to bring out publications/bulletins highlighting the problems and prospectsof mining industry.
4. To play a pro-active role in minimizing adverse impact of mining on environment byundertaking environmental impact assessment studies on regional basis.
5. To conduct suo moto techno-economic field studies in mining, geology, mineralprocessing and environmental aspects including analysis of ore and minerals and topromote R&D activities in these areas.
6. To provide technical consultancy services on promotional basis within the country andabroad in the field of mining geology, mineral processing and environment.
7. To provide training to the scientific, technical and other cadres of the department andpersons from the mining industry and other agencies for human resource development.
8. To advise the Government on matters in regard to mineral industry, relating toenvironmental protection and pollution control, export & import policies, trade, minerallegislation, fiscal incentives and related matters.
9. To promote awareness about conservation, systematic and scientific development ofmineral deposits and protection of environment including restoration, reclamation andrehabilitation of mined out areas through exhibitions and audio and visual media.
10. To promote and monitor community development activities in the mining areas.
11. To undertake any such other activity as may become necessary in the light of thedevelopments in the field of geology, mining, mineral beneficiation and environment.

516
10.3 ENERGY
Introduction
India ranks sixth in the world in terms of energy consumption. It consumed 3.5% of worldscommercial energy in the year 2002. However, the consumption of commercial energy actuallyreflects a suppressed demand due to supply constraints and affordability considerations. India’scommercial energy consumption is expected to grow more rapidly than in the past as reformstake root and drive growth to achieve the Tenth Plan targets. Despite the significant rate ofgrowth in energy supply over the last two decades, supply growth has lagged growth incommercial energy consumption. This has led to increased reliance on imports for meeting thegap between supply and consumption of commercial energy. Gas is emerging as a preferredfuel for power generation specially for peaking stations relying on gas turbines. To meet theincrease in the demand for gas in India, import of natural gas is envisaged both as LNG andpiped gas.
2. Over half of India’s population doesn’t have access to commercial energy. Increasingaccess to affordable commercial energy will remain the primary objective that shapes India’senergy policies and plans. The Tenth Plan strategy for the sector includes increasing productionof coal and electricity, promoting clean coal technologies, accelerated exploration for hydrocarbons,investing in equity oil abroad, higher efficiency through reforms that restructure and deregulatethe energy sector and increase competition in each element of the energy value chain anddemand management through introduction of energy efficient technologies/processes andappliances. The Electricity Act, 2003 is a reform initiative that would help realize efficiency gainsthrough increased competition in the power sector.
3. Coal will continue to account for over 50% of the commercial energy consumption in thecountry during the next decade. Improvement in productivity, capacity utilization and technologyadaptation would be the focus areas during the Tenth Plan for the coal sector. The share of oiland gas in the primary commercial energy consumption of the country has been increasing overthe years and is currently estimated at 44%. Based on current projections the share of oil andgas in India’s energy mix is expected to remain at this level over the next decade. Hydro, thathad been increasing its share in India’s commercial energy mix to reach just over 4% in 1980-81, will drop to a share of 3.1% by the end of the Tenth Plan before rising to 3.3% at the endof Eleventh Plan. The share of nuclear energy in the commercial energy mix has been risingover the years and is expected to reach 2.5% by the end of the Eleventh Plan.
4. A brief on major developments in respect of Coal & Lignite and Petroleum & Natural gasSectors are given below. The detailed write up on the power sector is covered under chapter11 on Infrastructure.
(i) Coal & Lignite
Introduction
5. In view of the fact that coal will continue to remain the principal source of commercialenergy in the country for the foreseeable future, the Tenth Plan envisages rapid development

517
of coal resources for augmenting domestic coal production to meet the projected coal demandfor the power sector in particular and other end use sectors in general through improvedproductivity, capacity utilisation, technology adaptation, simplified project clearance procedures,improved project implementation, exploration, conservation, etc. An important area of the Planconcerned restructuring the coal sector and facilitating private sector participation in commercialcoal mining by means of necessary legislative amendments and setting up of regulatorymechanism to ensure fair competition and a level playing field in each segment of the coalproduction and supply chain, resolution of disputes, allocation of coal blocks for exploration andmining etc. Emphasis is also laid on augmentation of rail and port infrastructure facilities forimproved coal movement and development of lignite resources, clean coal technologies,development of science & technology in coal sector and development of coal bed methaneresources, etc.
Review of Annual Plan 2002-03
6. Coal demand is envisaged to grow at 5.74% during the Tenth Plan against an actualgrowth of 3.5% in the Ninth Plan. The anticipated coal offtake/consumption in 2002-03 at 361.68mt excluding 4.1 mt of washery middlings is almost in line with the estimated demand and isabout 3 % more than the actual coal offtake in 2001-02.
7. Similarly, the coal production is envisaged to grow at 4.46% in the Tenth Plan against 2.5%achieved in the Ninth Plan. The target of coal production of 335.70 mt in 2002-03 is likely tobe achieved and is 2.5% more than the achievement in 2001-02.
8. Lignite production from Neyveli Lignite Corporation Ltd. (NLC) is envisaged to grow at 8%during the Tenth Plan against 1.1% achieved in the Ninth Plan. The anticipated ligniteproduction of 18.85 mt in 2002-03 is about 94 % of the target for the year at 19.95 mt and isabout 1% more than the actual achievement in 2001-02. Similarly, the anticipated gross powergeneration of 12350 million units (MU) in 2002-03 is about 84% of the target for the year at14638 MU and is about 15% less than the actual achievement in 2001-02 at 14451 MU.
9. Presently, private sector participation in coal mining is limited to captive consumption. Asthis has not yielded the desired results, it has been proposed to allow private sector incommercial coal mining. However, the Bill to amend the Coal Mines (Nationalisation) Act 1973for permitting private sector in commercial coal mining is yet to be passed by the Parliament.The action on the proposed restructuring of CIL to do away with the holding company structureand to give autonomy to the individual coal subsidiaries for promoting competitiveness asenvisaged in the Tenth Plan is yet to be initiated. The revival of the loss making coal companiesis also to take place. As per the new coal mining policy of Government of India, StateGovernment companies or undertakings are allowed to do mining of coking, non-coking coal orlignite reserves, either by opencast or underground method, anywhere in the country without theearlier restriction of isolated small pockets subjected to certain conditions.
Annual Plan 2003-04
Coal Demand
10. As against the anticipated coal offtake/consumption of 361.68 mt of raw coal excluding4.10 mt of washery middlings in 2002-03, the estimated coal demand for Annual Plan 2003-04

518
is 380.90 mt excluding 4.29 mt of middlings. This is 5.3% more than the anticipated level ofofftake in 2002-03. Of this estimated demand for 2003-04, 36.16 mt (9.5%) is of coking coal forsteel sector for a hot metal production programme of 25.54 mt in 2003-04 and 344.74 mt(90.5%) is of non-coking coal. About 67% of the total estimated demand is for power sectorutilities and includes the demand for a projected coal based generation programme of 370 billionKwh in 2003-04. About 4% is for cement sector related to a cement production programme of120.38 mt. About 6% for captive power and the remaining about 13% is for other sectors. Thedetails of coal demand/off-take are given in the Table-1 below.
Table-1
Sectoral Coal Demand/Off-take
(million tonnes)
Sl. Sector Ninth Plan Tenth Plan
No. 2001-02 2002-03 2003-04 2006-07
Actual Target Anticipated Target Projected
Coking Coal
1 Steel 27.60 32.90 29.05 35.35 35.32
2 Coke Ovens 0.83 1.50 0.66 0.81 1.89
Sub-Total Coking: 28.43 34.40 29.71 36.16 37.21
Non-Coking
3 Power Utilities 248.14 249.50 249.50 256.00 317.14(1.86) (3.28) (2.87) (3.04) (3.74)
4 Cement 15.25 17.10 16.42 16.50 24.56
5 Steel (DR) 5.10 4.00 5.09 5.36 7.00
6 Railways - - - - -
7 Fertilisers 3.20 3.50 3.13 3.14 4.18
8 LTC/Soft Coke* 0.20
9 Cokeries/Coke Oven NLW)* 1.50
10 Export 0.02 0.05 0.02 0.02 0.10
11 Captive Power 17.41 21.15 20.97 22.49 28.26(1.36) (1.55) (1.04) (1.15) (1.40)
12 BRK & Others 31.91 31.10 35.21 39.58 37.85(0.28) (0.10) (0.10) (0.10) (0.10)
13 Colliery consumption 1.82 2.50 1.63 1.65 2.50
Sub-Total NonCoking: 322.85 328.90 331.97 344.74 423.29(3.50) (4.93) (4.10) (4.29) (5.24)
Grand Total: 351.28 363.30 361.68 380.90 460.50(3.50) (4.93) (4.10) (4.29) (5.24)
Note : (i) Figures in brackets are washery middlings and are not included in totals. (ii)*Included inBRK&Others

519
Coal Production
11. The target of coal production of 335.70 mt in 2002-03 is likely to be achieved. As againstthis, a coal production target of 350.05 mt is set for Annual Plan 2003-04. This comprises of298.50 mt for CIL, 33.50 mt for SCCL, 7.85 mt for TISCO/IISCO/DVC, 5.20 mt from captiveblocks and 5.00 mt from others (Meghalaya). The target of coal production in 2003-04 is 4.2%more than the anticipated production in 2002-03. The share of opencast production in CIL isabout 83% and underground production is 17%. In SCCL, the share of opencast production isabout 58% and that of underground production is 42%. There is a need to improve productionfrom underground mines by adopting suitable technologies. The company-wise coal productionis given in Table-2 below.
Table–2
Company-wise Coal Production
(in million tonnes)
Company IX Plan Tenth Plan
2001-02 2002-03 2003-04 2006-07
Actual Target Anticipated Target Target
ECL 28.55 29.00 28.00 29.00 31.00
BCCL 25.25 28.00 25.50 27.50 33.00
CCL 33.81 34.25 34.25 35.50 43.30
NCL 42.46 44.00 45.00 46.50 52.00
WCL 37.01 37.00 37.20 37.25 37.50
SECL 64.12 65.25 66.50 69.00 84.55
MCL 47.81 48.00 49.20 53.10 68.00
NEC 0.64 0.50 0.65 0.65 0.65
CIL: 279.65 286.00 286.30 298.50 350.00
SCCL 30.81 32.50 32.50 33.50 36.13
TISCO/IISCO/DVC 7.71 7.60 7.85 7.85 7.64
Captive 4.46 5.50 4.15 5.20 6.73
Others 5.02 4.10 5.00 5.00 4.50
Total 327.65 335.70 335.80 350.05 405.00
12. The envisaged new coal production from the public sector coal companies in the terminalyear 2006-07 of the Tenth Plan is 83.12 mt (79.11 mt by CIL and 4.01 mt by SCCL), whichrepresents 22% of the target of 386.13 mt of these public sector coal companies. To meet theadditional coal production, CIL has planned to take up 98 new projects for a total capacity of197.40 mt with an estimated capital investment of Rs.23,159.24 crore and SCCL has plannedto take up 17 new projects for a capacity of 4.13 mt with a capital investment of Rs.2116.96crore. As against this, 8 projects for a total capacity of 4.32 mt per annum with a total capitalcost of Rs.304.91 crore have been sanctioned by CIL under its delegated powers till 31.12.2002.Similarly, SCCL Board has sanctioned 3 projects for a capacity of 1.5 mtpa with a total capitalinvestment of Rs.64.29 crore till 31.12.2002. In addition, action has been initiated with regard

520
to a number of new projects both in CIL and SCCL. The anticipated production from newcategory at 3.93 mt in 2002-03 from CIL represents about 56% of the target and no productionfrom new category from SCCL is anticipated though a target of 0.1 mt was fixed for the same.
13. The contribution from captive blocks is about 1.5% only. This implies the need toencourage private sector participation in augmenting domestic coal production. The category-wise coal production is given in Table 3 below.
Table 3
Category-wise Coal Production - 2003-04
(Million Tonnes)
Category CIL SCCL TISCO/ Captive Others TotalIISCO/DVC Blocks (Meghalaya)
Existing 26.71 4.12 7.85 4.15 5.00 47.83
Completed 223.42 24.01 - - - 247.43
Ongoing 32.13 5.37 - - - 37.50
New 16.24 0.00 1.05 0.00 17.29
TOTAL 298.50 33.50 7.85 5.20 5.00 350.05
Washed Coking and Non-Coking Coal
14. As against the anticipated washed coking coal production of 4.94 mt from CIL in 2002-03, the target of washed coking coal in 2003-04 is fixed at 5.33 mt. This is an area of concernand efforts need to be made in making available required quantity of washed coking coal ofdesired quality to the metallurgical sector. Similarly, the anticipated availability of washed non-coking coal from CIL sources is 7.98 mt against a target of 8.26 mt in 2002-03 and is targetedto reach 8.56 mt in 2003-04. There is a need to set up more number of washeries for washingnon-coking coal for complying with the directive of MOEF in making available coal of not morethan 34% ash for power generation.
Demand Supply & Coal Movement
15. The anticipated demand of raw coal at 361.68 mt in 2002-03 is planned to be met froma domestic production of 335.8 mt, a stock draw down of 1.9 mt (1.5 mt from CIL & 0.4 mt fromSCCL) and an estimated import of 21 mt (11 mt of coking and 10 mt of non-coking coal). Thisleaves a gap of 2.98 mt.
16. The estimated raw coal demand of 380.90 mt in 2003-04 is planned to be met from adomestic production of 350.05 mt, and a stock draw down of 1.35 mt from CIL sources. Thisleaves a gap of 29.50 mt. With the proposed imports of 16.41 mt of coking coal for steel sectorand 3 mt of non-coking coal for cement sector, a gap of 10.09 mt would still exist. The projectedlevel of coal imports at 5% of the estimated demand is almost of the same level as that of thelikely imports in 2002-03. Should the demand materialise, the gap needs to be bridged fromavailable stocks and some additional production from the public sector coal companies. Thedemand-supply position is given in Table-4 below.

521
Table-4
Coal Demand-Supply – 2003-04
(million tonnes)
Demand Domestic Stock Total Proposed Imports Total GapProduction Draw- Domestic Supply (8~1)
Down- Supply Coking Non-Coking Total (4+7)CIL (2+3)
1 2 3 4 5 6 7 8 9
380.90 350.05 1.35 351.40 16.41 3.00 19.41 370.81 10.09
17. Of the assessed demand of 380.90 mt of raw coal in Annual Plan 2003-04, the plannedofftake from CIL and SCCL is 333.35 mt or about 88 per cent. This is about 4 per cent morethan the anticipated offtake in the current year from these companies. Of the planned offtakeof CIL and SCCL, the proposed movement of coal by rail is 178 mt. or 53 percent and a totalfour wheeler wagons (FWWs) of 22419 per day will be required. This requirement is about 4per cent more than the RE 2002-03.
18. There are certain critical rail links to be established in the potential coalfields like Talcher,Korba, North Karanpura and Bhoopalpalli. The doubling and electrification of Talcher andParadip rail link in MCL, construction of Dipika - Pendra road rail link & development of rail linkfor Mand-Raigarh coalfield from Robertson Station in SECL, construction of Tori-Shivpuri railwayline in North Karanpura of CCL etc. are some of the important rail links for proper developmentof potential coalfields in the Tenth Plan.
19. The share of other modes of transport in the offtake planned from CIL and SCCL is 60.78mt (18%) by road, 79.64 mt (24%) by MGR, 13.87 mt (4%) by coastal shipping and 13.26 mt(4%) by other modes.
Lignite
20. Against the target of lignite production of 19.95 mt in 2002-03 for NLC, the anticipatedproduction is 18.85 mt only. The reasons for shortfall are delay in commissioning of TPS-IExpansion project and delay in commissioning of STCMS unit. Correspondingly, the revisedestimate of gross power generation is 12350 million units against the targeted generation of14638 million units. As against this, the proposed lignite production target for Annual Plan 2003-04 is 20.90 mt matching the requirements of the downstream units and supply to STCMS unit.The target for gross power generation is set at 15006 million units. The proposed targets for2003-04 indicate a growth of about 11 per cent in lignite production and 21.5 per cent growthin power generation. The proposed improvement in productivity is 5% and there is an increasein manpower by 2.1% in 2003-04.
Productivity
21. Against an anticipated overall OMS of 2.58 t (UG-0.67 t, OC-6.53 t) in CIL in 2002-03 thetarget of OMS for 2003-04 is set at 2.71 t (UG- 0.69 t, OC-6.96 t). The proposed increase is5% over the anticipated OMS in 2002-03.

522
22. In case of SCCL against the anticipated overall OMS of 1.75t (UG-0.86 t, OC-7.76 t) thetarget of OMS for 2003-04 is set at 1.80 t (UG-0.94t, OC-6.8 t). The proposed increase is 2.85%over the anticipated OMS in 2002-03.
23. The proposed increase in coal production of CIL in 2003-04 is 12.20 mt or 4.3% over theanticipated production in 2002-03 with a proposed overall improvement in productivity of 5% andreduction in manpower of 2.6%. In case of SCCL, the proposed increase in coal production is1 million tonne with an improvement in productivity of 2.85% and reduction in manpower of 0.5%in 2003-04.
24. In case of NLC, the proposed targets for 2003-04 indicate a growth of about 11% in ligniteproduction and 21.5% growth in power generation with a proposed improvement in productivityof 5 per cent. However, there is an increase in manpower by 2.1% in 2003-04.
25. Bench marking of operations with regard to productivity, capacity utilisation, investmentetc. in coal companies is important. Need for independent auditing of operations, efficiency ofinvestment of resources etc. are some important areas of action for making the coal companiescompetitive.
Project Implementation
26. Land acquisition, forestry clearance, rehabilitation, equipment supplies, availability offunds, inadequate geological studies, improper project formulation, etc. continue to causedelays in implementation of coal projects and also deration of capacity and foreclosures of someof the projects.
27. A number of projects, particularly, belonging to ECL and BCCL have not been able toreach the sanctioned capacities even after approval of the revised cost estimates and were tobe foreclosed for various technical and non-technical reasons including geo-mining, landacquisition and rehabilitation problems. This establishes a need for reviewing project formulationpractices of the coal companies. The problems of mutation & transfer of land by the StateGovernments need to be addressed in the right perspective for meaningful implementation ofcoal projects by coal companies. Similarly, the aspects of grant/renewal of lease by StateGovernments are also equally important to reduce time delays in case of new projects. Withregard to environmental and forestry clearances, number of times it was opined earlier that asingle window system with specific time frame was essential. However, there is no improvementin this regard and it continues to take unduly long time for clearance of new projects. Further,charging of the “expectation value” towards forestland by the State Governments is becominga hurdle in project implementation and coal companies are made to pay huge amounts in thisregard adding to the cost of the projects over and above the cost of afforestation.
28. It has been observed that coal mining projects have long gestation period and areinvariably suffering from time and cost overruns. It was opined that the existing provision foradvance action is very meager and is desirable if the two-stage clearance system in vogue forhydel and nuclear power projects is also made applicable to coal sector projects. This can takecare of land acquisition, resettlement and rehabilitation and environmental aspects in the first

523
stage with the approval of Committee of Public Investment Board (CPIB). The zero date shouldstart with approval of DPR, which should also include the cost of first stage. This will help incompletion of the project in time and reduction in IDC.
Coal & Lignite Reserves
29. The reserves of coal as on 1.1.2003 stand at 240.75 bt [Proved – 90.09 bt (37%);Indicated – 112.61 bt (47%); Inferred - 38.05 bt (16%)]. However, the estimated extractablereserves are about 18 bt (20% of the proved reserves) only. Similarly, the estimated lignitereserves of the country as on 1.1.2002 are 35.36 bt. There is a need to upgrade the availablecoal reserves to proved and extractable category of reserves.
Zero Based Budgeting
30. A review of all the central sector schemes under MOC on a Zero based budgetmethodology was carried out in the Planning Commission in consultation with MOC with a viewto ascertaining the continuity, modification and changes in the Tenth Plan, Annual Plan 2002-03 and 2003-04. Accordingly, the schemes, namely, R&D/S&T, Coal Controller Organisation,Promotional Exploration, Detailed Exploration in Non-CIL blocks, VRS have been agreed to becontinued in the Tenth Plan. However, the schemes of Environmental Measures and SubsidenceControl (EMSC) and Rehabilitation, control of fire & subsidence in Jharia and RaniganjCoalfields have been merged under one scheme, namely, EMSC for continuation in the TenthPlan and the scheme of IT has been taken out of Plan schemes.
Central Sector Schemes
Promotional Exploration
31. In order to accelerate the pace of Regional Exploration in coal & lignite and thesubsequent detailed exploration for projectisation of reserves to match the rapidly increasingdemand for coal, the promotional exploration scheme was initiated in the Seventh Plan.
32. Under this scheme, during the Tenth Plan, a drilling target of 3.3 lakh metres for coal and2.7 lakh metres for lignite totaling to 6.0 lakh metres has been set. About 994 sq. km. area willbe covered for coal and a reserve of 6.68 bt of coal is planned to be established during theTenth Plan. This work will be carried out by GSI, CMPDI and MECL with funding from MOC.In addition to the drilling programme a scheme to create coal & lignite database for consolidatingthe data generated by various exploration agencies for facilitating future decisions has beenproposed to be taken up under Promotional Exploration. Similarly, studies for Coal Bed Methane(CBM) for assessing the gas in place from boreholes drilled under Promotional Explorationprogramme has also been proposed for assessing the potentiality of coal blocks for CBM.
33. Against a target of drilling for promotional exploration of 1,20,300 meter in 2002-03, thelikely achievement is 1,08,300 meter (90% of the target). As against this, the target of drillingin 2003-04 is set at 1,20,300 meter.

524
Detailed Drilling in Non-CIL Blocks
34. This scheme was taken up in Ninth Plan through budgetary support in order to reduce timelag between allotment of mining blocks to the private entrepreneurs and the commencement ofcoal mining operations by them and thus to make up the gap between the demand andavailability of coal.
35. For the Tenth Plan, a target of 2.13 lakh meters has been set for detailed drilling in Non-CIL blocks, which will lead to establish 3.58 bt of coal reserves. Against a target of drilling of42,000 meter in 2002-03, the likely achievement is 37,500 meter. The target of drilling for 2003-04 is set at 41,650 meter.
Science & Technology (R&D)
36. The Research & Development Programme in coal sector gained importance afternationalisation of coal industry. The programme was initiated in the year 1975. The StandingScientific Research Committee (SSRC) was set up in MOC under the chairmanship of Secretary(Coal) and members from other Government Departments & Industry. SSRC is assisted by fourSub-Committees, namely, Production, Productivity & Safety; Coal Beneficiation; Coal Utilisation;and Environment & Ecology.
37. The three pronged approach i.e. (i) Coal S&T programme under SSRC to continue (ii) in-house R&D programme with coal companies and (iii) Inter-Sectoral Research - TechnologyAdvisory Committee (IS-STAC), is adopted for development of R&D in the Tenth Plan. Themajor identified issues under the thrust areas for coal S&T programme are – coal gasification,coal washing, beneficiation of low volatile coking coals (LVMC), coal liquefaction, fluidised bedcombustion, sequestration of CO
2 in control of green house gas and extraction of CBM, etc.
About 41 projects are ongoing under Coal S&T in the beginning of 2002-03. Five new projectshave been taken up during 2002-03. There is a need to identify and formulate new schemesmatching the Tenth Plan thrust areas under S&T.
Environmental Measures and Subsidence Control (EMSC)
38. This scheme was introduced in the Eighth Plan for improvement of environmentalconditions in the mined out areas and mitigation of problems arising out of subsidence and firein Raniganj and Jharia coalfields. The scheme of rehabilitation, control of fire and subsidencein Jharia and Raniganj Coalfields has been merged with EMSC from 2002-03. There are 12ongoing schemes under subsidence control, 8 schemes under environmental measures, 2schemes under social mitigation and 4 under rehabilitation and control of fires at the beginningof 2002-03 and are continuing.
Voluntary Retirement Scheme (VRS)
39. This scheme was introduced in the Ninth Plan for improving the financial health of lossmaking coal companies by means of rationalisation of manpower by making available requiredfunds through NRF initially, which was, later supported by extending budgetary support. To

525
begin with it was started in ECL and BCCL, which was extended to CCL later on. In the NinthPlan, 44400 employees (ECL-19200, BCCL-19200, CCL-6000) were planned to be retiredthrough VRS against which 34675 employees (ECL-16502, BCCL-15507, CCL-2666) or 78% ofthe target have been retired. As against this, 15500 employees (ECL-4000, BCCL-9000, CCL-2500) are planned to be retired through VRS during the Tenth Plan.
40. For Annual Plan 2002-03, a target of retiring 7485 employees (ECL-3125, BCCL-3635 andCCL-725) was fixed. Against this, the likely achievement is retirement of 5600 employees (ECL-2800, BCCL-2000 and CCL-800). For Annual Plan 2003-04, a target of retiring 5200 employees(ECL-2000, BCCL-2000 and CCL-1200) has been set.
Monitoring Mechanism
41. With a view to ensuring timely and effective implementation of projects and Central SectorSchemes of Coal Sector, Quarterly Performance Review (QPR) Meetings have been introducedin the Planning Commission in addition to the QPR Meetings being held in the Ministry.
Policy Measures
42. The Tenth Plan envisages expeditious passing of the pending Coal Bill 2000 for permittingprivate sector in non-captive coal mining, establishing an independent regulatory authority toensure fair competition and a level playing field in each segment of coal production and supplychain, resolution of disputes etc., restructuring of CIL by doing away with the holding companyand making subsidiary coal companies independent for promoting competitiveness and improvingperformance, setting up of an independent body for allocating coal blocks for both explorationand exploitation, undertaking all the required legislative amendments including that of labourlaws, land acquisition, etc.
43. As per the new coal mining policy of Government of India, State Government companiesor undertakings are allowed to do mining of coking, non-coking coal or lignite reserves, eitherby opencast or underground method, anywhere in the country without the earlier restriction ofisolated small pockets subjected to certain conditions.
44. NLC has been permitted to diversify into coal fired power generation and a couple ofprojects are under consideration of government in this regard.
45. The huge outstanding coal and power sale dues are adversely affecting the financialhealth of coal companies. The envisaged securitisation of dues is yet to come through.However, as regards the current billing is concerned, no out standings are reported.
46. The domestic coal is getting outpriced due to high rail freights when compared to theimported coal, particularly, in coastal regions. This is because of cross subsidy by railways andthere is a need for rationalising rail freight rates for coal.
47. Presently, the import duty on coking coal is 5% and that of non-coking coal is 25%.Rationalisation of import duties on coal is contemplated to increase coal imports, particularly thenon-coking coal, which in turn is expected to promote competition in the sector.

526
48. The Government has revised the rates of royalty on coal with effect from 16th August 2002.The rate of royalty ranges from Rs.250/- per tonne for Group-I coals to Rs.90/- per tonne forGroup-VI coals. These royalty rates on coal form about 19% of sale value of coal for Group-I to 11% for Group-VI coals. The royalty rate on lignite was revised to Rs.50/- per tonne witheffect from 15th March 2001.
Safety & Welfare
49. Safety & Welfare of coal miners has been a priority area in various plans. Some of themajor thrust areas identified for safety in coal mines for the Tenth Plan are –
(i) installation of environmental Tele-Monitoring Systems (ETMS) in mines;
(ii) digitizing mining plans at area level for identification of water danger from adjoiningmines, checking correlation survey and estimating thickness of barriers;
(iii) replacement of timber support by steel support;
(iv) improved self-rescuers; etc.
The fatality rate reported in CIL for the year 2002 was 0.24 per million tonne of coaloutput and has been the lowest ever achieved. Similarly the fatality rate in SCCL hasbeen 0.68 per million tonnes of coal output.
50. The housing satisfaction as on 31.12.2002 has reached a level of 80% in CIL and 49%in SCCL. A total population of 23.2 lakh has been covered under water supply scheme in CILand 6.5 lakh in SCCL till December 2002. 87 hospitals with 5979 beds in CIL and 7 hospitalswith 956 beds in SCCL are in operation. In addition to this, 436 dispensaries in CIL and 43dispensaries in SCCL are also functioning.
Plan Outlay
51. An outlay of Rs.3491.47 crore was provided in BE 2002-03 for MOC. This included anoutlay of Rs.292.72 crore for NLC (Power). As against this, the RE provision in 2002-03 hasbeen Rs.2744.21 crore including Rs.318.61 crore for NLC (Power). The anticipated expenditureis about 21% short of the BE provision. The broad reasons for shortfall in expenditure have beendelay in procurement of HEMM in CIL due to some legal issues. Also, delay in taking up of newprojects has affected capital expenditure. In SCCL, the shortfall in expenditure has been dueto delay in finalisation of contracts for some of the underground equipments and delay in takingup of new projects. However, in case of NLC, there has been a slight increase in RE over theprovision made in BE and it is related to final payments towards main mining equipments incase of Mine-1A project and payments for TPS-I Expansion project. Also, there is a shortfall insome of the Central Sector Schemes, namely, VRS (48%) due to some carry forward balance,Regional Exploration (10%), EMSC (41%) etc.
52. For Annual Plan 2003-04, MOC has been provided an outlay of Rs.3321.30 crore in BEincluding Rs.278.45 crore for NLC (Power). This provision is 21% more than RE 2002-03. It has

527
been planned to finance the outlay through an IEBR of Rs.3035.40 crore and a GBS ofRs.285.90 crore. There is no component of EAP (component routed through Budget) and theentire budgetary support is meant for Central Sector Schemes of Ministry of Coal including VRS.The company-wise/scheme-wise details are given in Table-5 below.
Table-5
Company-wise/Scheme-wise Outlay and Expenditure
(Rs. Crore)
Company/Scheme 2001-02 2002-03 2003-04
Provisional BE RE BE
Coal India Ltd. 1146.69 2190.00 1705.52 2240.00
Singareni Coll. Co. Ltd. 181.92 405.00 227.00 340.00
Neyveli Lignite Corporation (Mines) 377.70 292.23 298.99 176.95
Science & Technology 0.17 7.55 9.50 22.48
Coal controller Organisation 0.17 0.21 0.21 0.21
Regional/Promotional .Exploration 31.61 49.19 44.27 56.10
Env. Measures & Subsidence Control 3.31 34.65 20.56 27.56
Detailed drilling in Non-CIL Blocks 45.85 13.92 12.53 12.52
Rehabilitation Project 7.24 - - -
Information Technology 0.51 - - -
Voluntary Retirement Scheme 192.38 206.00 107.02 138.44
Total Coal & Lignite 1987.55 3198.75 2425.60 3014.26
Neyveli Lignite Corporation (Power) 292.85 292.72 318.61 278.45
NEC 11.21 - - 28.59
Total DOC 2291.61 3491.47 2744.21 3321.30
Externally Aided Projects
53. The major projects availing EAP component during the Ninth Plan have almost beencompleted and some residual amount is spilling over to Tenth Plan. Against an amount ofRs.15.48 crore towards the Coal Sector Environment and Social Mitigation Project of CILprovided in Annual Plan 2002-03, the RE provision has been Rs.12.91 crore only. No provisionis made in 2003-04. Similarly against the provision of Rs.26.67 crore in Annual Plan 2002-03for the residual component of World Bank loan for coal sector rehabilitation project of CIL, theRE provision has been Rs.200.91 crore only. The BE provision in 2003-04 is Rs.12.35 crore,which is a direct and residual component of Coal Sector Rehabilitation Plan of CIL. New projectsneed to be identified for EAP assistance in coal sector.
Actionable Points for Annual Plan 2003-04
54. The following actionable points have been identified for Ministry of Coal for Annual Plan2003-04 in line with the directives of National Development Council (NDC) while approving theTenth Five Year Plan.

528
55. On passing of the pending Coal Mines (Nationalisation) Amendment Bill, 2000 forpermitting private sector in commercial coal mining, the following steps need to be taken:
(i) Setting up of an Independent Regulatory Authority to ensure fair competition and alevel playing field in each segment of the coal production and supply chain,resolution of disputes and allocation of coal blocks for exploration and mining.
(ii) To encourage competition and promote private sector participation, it is proposed tode-block the coal blocks held by Coal India Ltd.
(iii) Permit trading of coal by removing it from the list of Essential Commodities Act andamend the provisions of Coal Bearing Areas (Acquisition & Development) Act, 1957and Contract Labour (Regulation & Abolition) Act, 1970.
(ii) Petroleum and Natural Gas Sector
Introduction
56. The Tenth Plan proposes to consolidate and expand the steps initiated earlier in respectof re-structuring the hydrocarbon sector through disinvestment, private participation in marketingand distribution of petroleum products, and award of exploration blocks through internationalcompetitive bidding under the New Exploration Licensing Policy (NELP). A concerted effort hasbeen undertaken for enhancing energy security by acquiring equity oil and gas abroad,diversification of oil imports and accelerated exploration through NELP. A regulatory frameworkis envisaged for the hydrocarbon sector to ensure greater competition that enhances consumersatisfaction.
57. In the first three bidding rounds of NELP, 70 blocks were awarded. Recently, 24 additionalblocks have been announced for bidding under the fourth round of NELP. Agreements forexploration and equity oil/gas have been signed for the Sakhalin-1 offshore field in Russia,Greater Nile oil project in Sudan and in other countries namely Vietnam, Iraq, Iran, Libya andMyanmar. Auto fuel quality has been improved to enable the automobile industry to comply withprescribed emission norms. Supply of blended motor spirit with 5% ethanol has been introducedin nine states.
Review of Annual Plan 2002-03
58. Against the projected consumption of 120.4 MMT of petroleum products in the terminalyear of the Tenth Plan, the actual consumption during 2002-03 is estimated to be 104.14 MMTindicating an annual growth rate of 3.7% over the actual consumption of 100.43 MMT during2001-02.
59. Against the Tenth Plan targets of 1941.12 thousand meters and 1533.96 thousand metersof exploratory and development drilling respectively, the estimated achievements in the year2002-03 for National Oil Companies (ONGC & OIL) are 456.08 thousand meters and 474.67thousand meters respectively. These are higher by 6.4% and 29.3% compared to the actualperformance of 428.65 thousand meters and 367.21 thousand meters for 2001-02 respectively.At this pace, the National Oil Companies are likely to exceed the Tenth Plan targets forexploratory & development drilling.

529
60. The Tenth Plan target for Crude Oil production is 169.38 MMT inclusive of production byprivate/joint sector producers. The crude oil production including production from joint ventureand private sector companies for 2002-03 was 33.04 MMT. This was 3.2% higher than theproduction of 32.03 MMT in 2001-02. The 2002-03 production substantially met the target forthe year and contributed 18.9% of the domestic crude production targeted for the Tenth Plan.
61. The cumulative Tenth Plan target for natural gas production has been kept as 177.48BCM. The actual production of 31.39 BCM in 2002-03 was 5.7% higher than the production in2001-02. The 2002-03 production met the target set for the year and contributed 17.7% of theproduction targetted for the Tenth Plan.
62. The refining capacity, as on 1.4.2003, was 116.97 MMT. No capacity addition is envisagedduring 2003-04. The domestic refining capacity is keeping pace with the growth in domesticconsumption of petroleum products.
63. During 2001-02, 78.7 MMT of crude oil and 7.0 MMT of petroleum products were imported,while 10.1 MMT of petroleum products were exported. Against the import targets of 94.29 MMTcrude oil and 2.13 MMT petroleum products during 2002-03, the actual imports are estimatedas 82.35 MMT and 6.37 MMT respectively. Again, the export of petroleum products for 2002-03 is estimated as 10.28 MMT against a target of 14.83 MMT.
Sectoral Reforms
64. As part of the reform process, the sector is being gradually liberalized. Starting withdelicensing of refineries and making NELP terms far more progressive, IBP has been divestedand the divestment process for BPCL and HPCL firmly initiated. Further, new entrants includingprivate sector companies such as Shell India, Reliance Industries and Essar Oil have beengiven marketing rights for transportation fuels. Again, ONGC and IOC have been permitted tobecome integrated oil majors to better compete as equals with foreign oil majors expected toenter the Indian Market. Finally, the Petroleum Regulatory Board Bill 2002 has been introducedin the Parliament. The main objective of the proposed regulatory regime is the institution of acompetitive market for the oil and gas sector.
65. The Administered Pricing Mechanism (APM) which governed the prices of transportationfuels, LPG and kerosene has been dismantled w.e.f. 1.4.2002. While motor spirit, diesel andaviation turbine fuel are being priced on import parity basis, kerosene and LPG still carrysubsidies that are not fully met through the budget. The consumer prices have not been allowedto increase even though the total subsidy amount included in the central budget is fixed. Higherimport parity prices paid by the oil marketing companies have thus resulted in losses on saleof these two products. Implicitly, it has forced the oil marketing companies to cross subsidisekerosene and LPG with profits from transport fuels.

530
ANNUAL PLAN 2003-04
Programmes and Schemes:
Demand of Petroleum Products
66. The likely consumption of petroleum products in 2003-04 is estimated at about 107.16MMT against the estimated consumption of 104.14 MMT during 2002-03. This yields an annualgrowth rate of only 2.9%.
Imports of Crude Oil & Petroleum Products
67. The targets for imports of crude oil and petroleum products during 2003-04 have beenfixed at 87.62 MMT and 8.27 MMT respectively. The export target for petroleum products hasbeen fixed at 12.73 MMT for 2003-04. The 2003-04 import targets are 6.4% higher for crudeoil and 29.8% higher for petroleum products, while the export target for petroleum products is23.8% higher than the corresponding level in 2002-03.
Exploratory and Development Drilling
68. The targets for 2003-04 for exploratory and development drilling have been kept at 557.86thousand meters and 501.45 thousand meters respectively. These are 22.3% and 5.6% higherthan the estimated respective achievements during Annual Plan 2002-03. The details of drillingactivities are presented in Annexure 10.3.1.
Crude Oil Production
69. The target for crude oil production for Annual Plan 2003-04 has been kept at 33.50 MMTwhich is only marginally higher than the 2002-03 production of 33.04 MMT. Enhanced OilRecovery (EOR) and Improved Oil Recovery (IOR) investments are helping maintain currentproduction levels despite the absence of any significant new discoveries. The details of crudeoil production are provided in Annexure 10.3.2.
Natural Gas Production
70. A target of 31.30 BCM has been fixed for natural gas production in 2003-04 against theproduction of 31.39 BCM in 2002-03. The stagnant level of gas production reflects the shutdown planned by ONGC for the year 2003-04 for some of the offshore gas productioninstallations. The details of natural gas production are provided at Annexure 10.3.3.
Refining Capacity
71. The country has achieved self-sufficiency in refining capacity. The refinery sector has beende-licensed. The setting up of additional refining capacity would depend upon several factorssuch as duty structure, domestic demand, import and export possibilities and likely refiningmargins. Details of refining capacity are given in Annexure 10.3.4.

531
Environmental Initiatives
72. Refineries have implemented programmes for upgradation of petrol and diesel quality inthe past few years. Currently, diesel conforming to Bharat stage II is being supplied to themetropolitan cities. The refineries are implementing projects to extend Bharat Stage-II specificationto other parts of the country while introducing Bharat Stage –III (equivalent to Euro –III)specifications for petrol and diesel in the 4 metros and 7 major cities from April, 2005.
Alternate Fuels
73. A Task Force has been constituted by the Ministry of Petroleum and Natural Gas toconsider raising the percentage of ethanol blending in petrol upto 10%. A pilot project onblending of diesel with upto 5% Bio-diesel is also being taken up. The Planning Commission hasseparately constituted a task force on Hydrogen Energy.
Major Projects
74. The major public sector projects under implementation are given below:
(i) Mumbai High North redevelopment plans – ONGC
(ii) Mumbai High South redevelopment plans – ONGC
(iii) HBJ Expansion project (Phase I) - GAIL
(iv) Panipat Refinery Expansion from 6 MMTPA to 12 MMTPA – IOC
(v) 9 MMTPA grass-root refinery in Eastern India – IOC
(vi) 9 MMTPA Punjab Refinery & Crude Oil Pipeline project - HPCL
(vii) 6 MMTPA Central India Refinery Project - BPCL
75. The details of project costs, outlays and expenditures for 2002-03, approved outlay for2003-04 and the schedule of commissioning of the above projects are given in the Annexure–10.3.5. It is pointed out that the actual realization of the refineries listed under (v), (vi) & (vii)above would be linked closely to domestic growth in consumption for petroleum products since,despite regional imbalances, the current refining capacity is more than adequate for the currentlevels of consumption of petroleum products.
Outlay
76. An outlay of Rs. 22080.43 crore (BE) has been provided in the Annual Plan 2003-04 forthe Petroleum and Natural Gas Sector (Rs. 16950.43 crore for Exploration and ProductionSector, and Rs. 5130.00 crore for Refining and Marketing Sector). No budgetary support wouldbe provided to Petroleum & Natural Gas Sector. The company-wise outlays and expendituresare provided in Annexure –10.3.6.

532
Annexure-10.3.1
Petroleum and Natural Gas
Drilling programmes
(‘000 meters)
Programmes 2001-02 Tenth Plan 2002-03 2003-04Actual (2002-07) Target Anticiptd. Target
Target Achievement
1. Exploratory Drilling
a) ONGC
i) Onshore 343.75 1095.01 307.51 329.30 326.36
ii) Offshore 45.34 480.51 111.30 71.78 165.50
b) OIL
i) Onshore 39.56 338.1 58.00 55.00 66.00
ii) Offshore 0.00 27.5 0.00 0.00 0.00
Total (Expl.) 428.65 1941.12 476.81 456.08 557.86
2. Development Drilling
a) ONGC
i) Onshore 242.63 694.51 266.26 279.09 296.35
ii) Offshore 67.11 469.45 140.00 125.58 135.10
b) OIL
i) Onshore 57.47 370.00 60.20 70.00 70.00
ii) Offshore 0.00 0.00 0.00 0.00 0.00
Total (Dev.) 367.21 1533.96 466.46 474.67 501.45
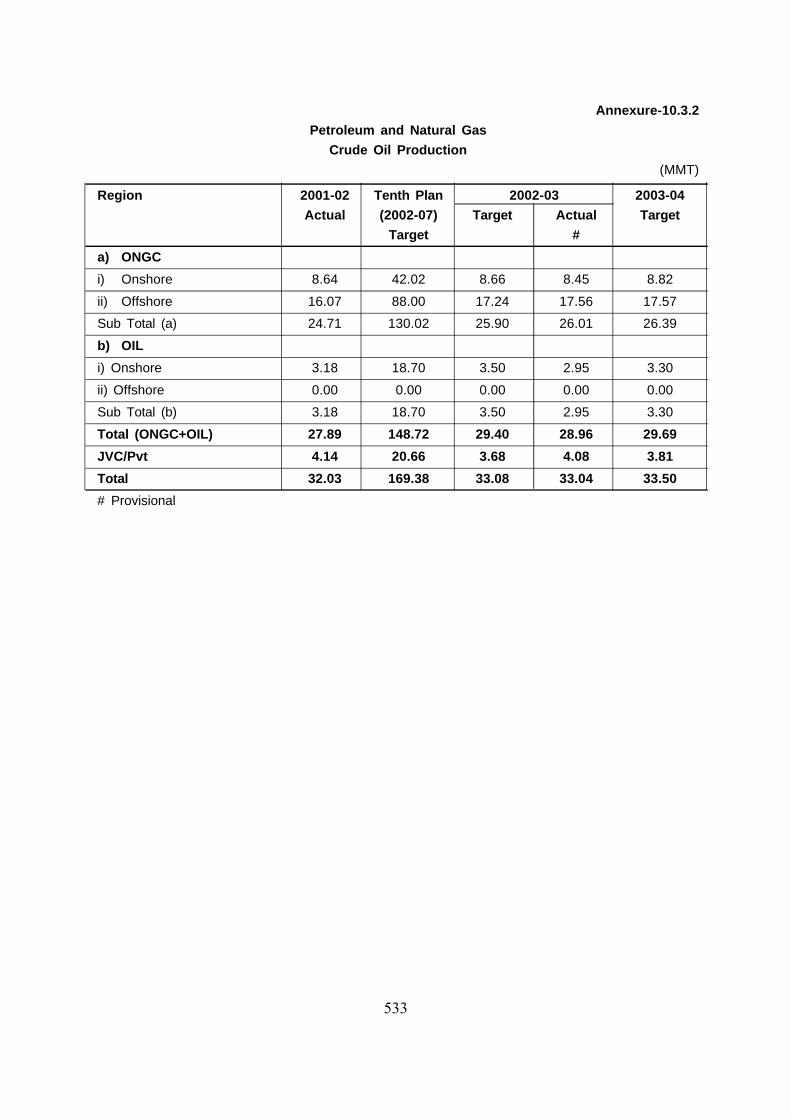
533
Annexure-10.3.2
Petroleum and Natural Gas
Crude Oil Production
(MMT)
Region 2001-02 Tenth Plan 2002-03 2003-04
Actual (2002-07) Target Actual Target
Target #
a) ONGC
i) Onshore 8.64 42.02 8.66 8.45 8.82
ii) Offshore 16.07 88.00 17.24 17.56 17.57
Sub Total (a) 24.71 130.02 25.90 26.01 26.39
b) OIL
i) Onshore 3.18 18.70 3.50 2.95 3.30
ii) Offshore 0.00 0.00 0.00 0.00 0.00
Sub Total (b) 3.18 18.70 3.50 2.95 3.30
Total (ONGC+OIL) 27.89 148.72 29.40 28.96 29.69
JVC/Pvt 4.14 20.66 3.68 4.08 3.81
Total 32.03 169.38 33.08 33.04 33.50
# Provisional

534
Annexure-10.3.3
Petroleum and Natural Gas
Natural Gas Production (BCM)
(BCM)
Region 2001-02 Tenth Plan 2002-03 2003-04
Actual (2002-07) Target Anticpated TargetTarget Achievement
a) ONGC
i) Onshore 5.61 30.71 5.68 5.87 6.11
ii) Offshore 18.43 81.39 18.01 18.37 17.20
Sub Total (a) 24.04 112.10 23.69 24.24 23.31
b) OIL
i) Onshore 1.62 12.61 2.19 1.74 1.96
ii) Offshore 0.00 0.00 0.00 0.00 0.00
Sub Total (b) 1.62 12.61 2.19 1.74 1.96
Total (ONGC+OIL) 25.66 124.71 25.88 25.98 25.27
JVC/Pvt 4.05 52.77 5.49 5.41 6.03
Total 29.71 177.48 31.37 31.39 31.30

535
Annexure-10.3.4
Petroleum and Natural Gas
Refining Capacity
(in MMT as on 1st April)
SL.No. Name of the Refinery 2003
1 IOC , Guwahati 1.00
2 IOC, Barauni 6.00
3 IOC, Gujarat 13.70
4 IOC, Haldia 4.60
5 IOC, Mathura 8.00
6 IOC, Digboi 0.65
7 IOC, Panipat 6.00
8 BPCL, Mumbai 6.90
9 HPCL, Mumbai 5.50
10 HPCL, Visakh 7.50
11 KRL, Kochi 7.50
12 CPCL, Manali 6.50
13 CPCL, Narimanam 1.00
14 BRPL, Bongaigaon 2.35
15 NRL, Numaligarh 3.00
16 MRPL, Mangalore (JV) 9.69
17 ONGC 0.08
18 RPL, Jamnagar 27.00
TOTAL 116.97
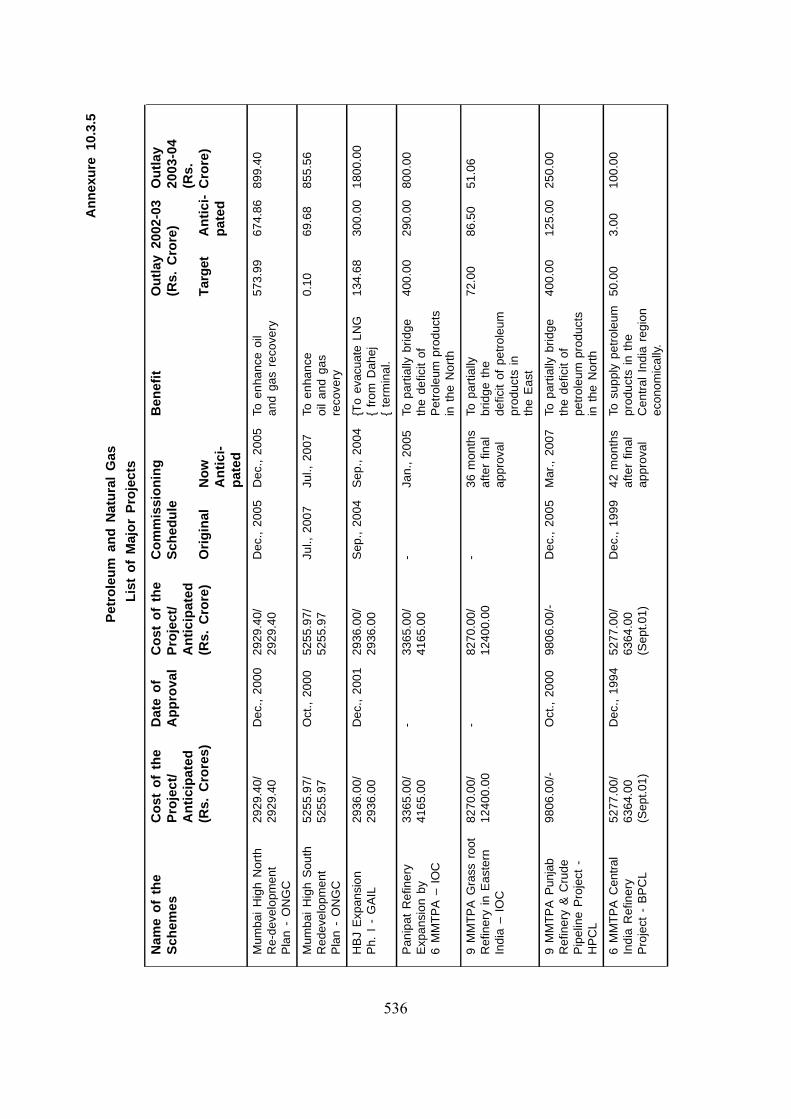
536
An
nex
ure
10.
3.5
Pet
role
um
an
d N
atu
ral
Gas
Lis
t o
f M
ajo
r P
roje
cts
Nam
e o
f th
eC
ost
of
the
Dat
e o
fC
ost
of
the
Co
mm
issi
on
ing
Ben
efit
Ou
tlay
200
2-03
Ou
tlay
Sch
emes
Pro
ject
/A
pp
rova
lP
roje
ct/
Sch
edu
le(R
s. C
rore
)20
03-0
4A
nti
cip
ated
An
tici
pat
ed(R
s.(R
s. C
rore
s)(R
s. C
rore
)O
rig
inal
No
wT
arg
etA
nti
ci-
Cro
re)
An
tici
-p
ated
pat
ed
Mum
bai
Hig
h N
orth
2929
.40/
Dec
., 2
000
2929
.40/
Dec
., 2
005
Dec
., 2
005
To e
nh
an
ce o
il57
3.99
674.
8689
9.40
Re-
deve
lopm
ent
2929
.40
2929
.40
and
gas
reco
very
Pla
n -
ON
GC
Mum
bai
Hig
h S
outh
5255
.97/
Oct
., 2
000
5255
.97/
Jul.,
20
07
Jul.,
20
07
To e
nh
an
ce0.
1069
.68
855.
56R
edev
elop
men
t52
55.9
752
55.9
7o
il a
nd
ga
sP
lan
- O
NG
Cre
cove
ry
HB
J E
xpan
sion
2936
.00/
Dec
., 2
001
2936
.00/
Sep
., 2
004
Sep
., 2
004
{To
evac
uate
LN
G13
4.68
300.
0018
00.0
0P
h. I
- G
AIL
2936
.00
2936
.00
{ fr
om D
ahej
{ te
rmin
al.
Pan
ipat
Ref
iner
y33
65.0
0/-
3365
.00/
-Ja
n.,
20
05
To p
artia
lly b
ridg
e40
0.00
290.
0080
0.00
Exp
ansi
on b
y41
65.0
041
65.0
0th
e d
efic
it o
f6
MM
TP
A –
IO
CP
etr
ole
um
pro
du
cts
in t
he N
orth
9 M
MT
PA
Gra
ss r
oot
8270
.00/
-82
70.0
0/-
36
mo
nth
sTo
pa
rtia
lly72
.00
86.5
051
.06
Ref
iner
y in
Eas
tern
1240
0.00
1240
0.00
afte
r fin
albr
idge
the
Indi
a –
IOC
appr
oval
de
ficit
of
pe
tro
leu
mp
rod
uct
s in
the
Eas
t
9 M
MT
PA
Pun
jab
9806
.00/
-O
ct.,
200
098
06.0
0/-
Dec
., 2
005
Mar
., 20
07To
par
tially
bri
dge
400.
0012
5.00
250.
00R
efin
ery
& C
rude
the
de
ficit
of
Pip
elin
e P
roje
ct -
pe
tro
leu
m p
rod
uct
sH
PC
Lin
the
Nor
th
6 M
MT
PA
Cen
tral
5277
.00/
Dec
., 1
994
5277
.00/
Dec
., 1
999
42
mo
nth
sTo
sup
ply
petr
oleu
m50
.00
3.00
100.
00In
dia
Ref
iner
y63
64.0
063
64.0
0af
ter
final
pro
du
cts
in t
he
Pro
ject
- B
PC
L(S
ept.0
1)(S
ept.0
1)ap
prov
alC
entr
al I
ndia
reg
ion
econ
omic
ally
.

537
Annexure-10.3.6
Petroleum & Natural Gas Sector
Outlays/ Expenditure (Rs. Crore)
Name of 2001-02 2002-03 2003-04
the Companies Actual BE RE BE
A. Exploration & Production
1. ONGC 4040.32 8973.31 14644.94 13223.25
2. OIL 475.39 900.00 775.00 1000.00
3. GAIL 500.20 1492.95 1174.79 2727.18
Sub Total (A) 5015.91 11355.26 16594.73 16950.43
B. Refining & Marketing
1. IOC 2542.50 3000.00 1886.17 2450.00
2. HPCL 319.75 900.00 336.07 750.00
3. BPCL 268.52 650.00 544.90 800.00
4. CPCL 404.79 1000.00 1000.00 850.00
5. KRL 30.75 75.00 12.00 85.00
6. BRPL 26.19 10.00 12.98 10.00
7. LIL 0.00 0.00 0.00 0.00
7. EIL 3.04 0.00 0.00 0.00
8. IBP 53.14 144.00 147.00 125.00
9. NRL 37.54 38.00 7.00 60.00
Sub Total (B) 3686.22 5817.00 3946.12 5130.00
Total Petroleum 8702.13 17172.26 20540.85 22080.43

538
10.4 INFORMATION TECHNOLOGY
Introduction
The Information Technology (IT) is one of the fastest growing sectors of Indian economy.The Indian software and services industry has emerged as one of the fastest growing sectorsin the Indian economy with a growth rate of over 26 per cent during 2002-03 and turnover ofUS$ 12.7 billion (Rs. 59,900 crore) and exports of US$ 10 billion (Rs. 47,500 crore). Theindustry is projected to account for 7% of India’s GDP and 35% of exports during 2008. TheNasscom McKinsey Report 2002 has reiterated that despite recent slowdown, the Indian ITservices (ITS) and IT enabled services (ITES) industry is poised to meet its long-term exportspotential of US$ 57-65 billion. The Indian IT Enabled Services sector has emerged as a keydriver of growth for the Indian IT industry. This segment is poised to grow very rapidly, world-wide, over the next few years.
2. The present size of the global IT industry is estimated to be about 1.3 trillion US dollar.The US and Europe are expected to continue to be the major market for Indian software infuture. In the Asian region, China, Phillipines, CIS countries and Korea are emerging as newcentres for software exports. Japan has shown keen interest in outsourcing their softwarerequirements from India inspite of their inherent cultural and language advantage for countrieslike China, Malaysia and Korea.
Tenth Five Year Plan
Major objectives
3. The major objectives envisaged for the IT sector in the Tenth Five Year Plan are to : -
• Ensure the sustained growth of software sector and increase India’s share in theglobal IT market to a level of 6% against 2% at present.
• Put in place and enact the basic policy framework for development of the hardwaremanufacturing industry.
• Devise appropriate policy interventions for the greater use of IT for promoting moreefficient, transparent and responsive governance.
• Promote development and use of software in Indian languages.• Take necessary steps for taking IT to the masses by making it affordable, easy to
use and useful in day-to-day life.• Put in place the required policy framework to improve the quality of manpower, skills
and R&D.
Major Initiatives and Thrust Areas
4. The major initiatives proposed to be taken up in the Tenth Plan include formulation of anational hardware development policy, improving quality and productivity in software development,aggressive marketing for software export including expanding the focus to newly emergingmarkets in Europe, U.K., Asia Pacific, Japan etc., apart from giving priority to USA, development

539
and promotion of software in Indian languages with a view to take IT to common man andincrease domestic market, upgrading facilities in engineering colleges for improving quality ofmanpower, implement e-governance in the country in a comprehensive manner, providingInternet connectivity and e-learning tools in schools and colleges through Vidya Vahini and GyanVahini programmes and promoting research / innovations for rural needs through Media LabAsia Programme.
5. The IT enabled services like Customer Interaction Services, Business Process Outsourcing(BPO), Insurance Claim Processing, Digital Content Development and Online Education, WebServices have been identified as a sources of wealth creation and employment generation
6. To keep abreast with the Information Technology Agreement (ITA1-WTO), it has becomeimperative for Indian IT industry to develop technologies, products and services of internationalcost and quality and become global leader at least in some selected fields like software & ITservices, bio-informatics, micro-electronics, cyber security, wireless technologies, high-endcomputing etc. The R&D model devised for pursuing R&D in the Tenth Plan is based on theirstrategic value and classification as Long, Medium and Short term R&D. Under this categorizationthe gestation periods of Long, Medium and Short term R&D Projects are 10 years, 3-6 yearsand 1-3 years respectively.
Review of Annual Plan 2002-03
7. During 2002-03, the Indian electronics and IT industry production is estimated at Rs.96,950crore as against a net projected target of Rs. 1,10,500 crore. The Indian IT Enabled Services(ITES) cum Business Process Outsourcing (BPO) industry is expected to have grown by about65% during 2002-03. The total exports revenue of the IT Enabled services industry are presentlyprojected at Rs.11,700 crore; up from Rs.7100 Crore in 2001-02. As regards employment, thissector is estimated to have provided employment to 650,000 IT professionals by March 2003.It was observed that out of this, almost 205,000 are working in the IT software and servicesindustry; nearly 160,000 in ITES; 25000 are in the domestic software market and over 2,60,000in user organizations. The Electronics production profile in the last five years is given in the tablebelow : -
Table 10.4
Production of the IT industry
(Rs. crore)
Item 1998-99 1999-2000 2000-01 2001-02 2002-03
IT Hardware 25,250 28,100 30,700 32,750 37,050
Computer Software 15,890 24,300 37,750 48,134 59,000
Total 41,140 52,450 68,450 80,124 96,950
8. The Department of Information Technology (DIT) is acting as a nodal institution for thepromotion of the sector, facilitating and coordinating the various initiatives of the central andstate governments and the private sector. An outlay of Rs.593.58 crore was approved for AnnualPlan 2002-03, against which the esimated budgetary expenditure has been Rs.470 crore (GBS).

540
A list of Plan schemes is attached at Annexure 10.4. The major achievements during AnnualPlan2002-03 were as under:
§ With a view to facilitate invention, refinements and extend the benefits of Information& Communication Technology (ICT) to masses, the Media Lab Asia Project has beeninitiated in collaboration with MIT USA. The objective of the project is to pursue high-end research in areas germane to the needs of rural India.
§ Commissioning and operationalisation of all the Community Information Centres(CICs)_ in 487 blocks in the northeast region.
§ Setting up of Indian Computer Emergency Response System (CERT) at IISc,Bangalore.
§ Establishing a secure laboratory for carrying out review and penetration test byCentre For Information and Network Security (CINS) at Pune.
§ Completion of seven pilot projects taken up in 7 different districts of the countrycovering about 200 schools under Vidya Vahini program.
§ Under Information Technology Act 2000, the Controller of Certifying authorities(CCA), set up for implementation of the IT Act, has established the national rootinfrastructure which would be used for digitally signing the certificates of all thecertifying authorities.
§ STPI has established new centres including High Speed Data Communicationfacilities at Pondicherry, Nasik, Thiruneveli, Allahabad and Kolhapur.
§ The National Informatics Centre (NIC) have completed establishing video conferencingfacilities in 130 districts.
§ Development and commissioning of next generation High Performance Computingand Communications (HPCC) technologies by way of designing PARAM teraflopcomputing system by Centre for Development of Advanced Computing(C-DAC) atBangalore.
§ Semiconductor Complex Ltd.(SCL), have developed around 82 application specificintegrated circuits for the strategic sector, designed TDI imager and Frame TransferImager for the Department of Space.
§ To promote E-Governance, an NDC subcommittee on Government Reforms includingE-Governance has been set up.
Major Programmes in Annual Plan 2003-04
9. An outlay of Rs.577.45 crore (IR; Rs. 75.65 crore, EBR ; Rs. 31.80 crore) with a grossbudgetary support of Rs. 470 crore has been approved for various schemes of DIT for AnnualPlan 2003-04. A list of Plan schemes of the DIT indicating approved outlays for Annual Plan2003-04 is given in the Annexure 10.4. Some of the major programmes of DIT during 2003-04are given below
9.1 E-Governance: The Tenth Five Year Plan has given high priority to encourage E-Governance in -the Central and State Governments and public utility service organisations forimproving efficiency and transparency in Government sector particularly. In the NDC meetingtoo, emphasis was laid to take initiative in this area. The NDC Sub-Committee on Governanceincluding E-governance formed would conceptualise a strategy to bring about transformation in

541
the organs of the government which would enable them to transact their business in aresponsive, transparent, accountable and citizen-centric manner. Such strategy would encompassreform measures in as many as 15 areas of activity/concern.
9.2 National Informatics Centre (NIC)- The thrust during Annual Plan 2003-04 would be toundertake security auditing of NICNET applications and network; application development forimplementation of ‘minimum agenda for e-governance’ at various levels of Govt. functioning;upgradation of training centres, preparation of e-governance plan for northeastern states andcompletion of the establishment of fibre optic network backbone upto state capitals etc.
9.3 Micro-Electronics and Nano-technology Development Program (NMC) – Steps wouldbe taken for building capabilities in areas of IC process/manufacturing, test and characterisation,SiGe/SiC/Diamond based devices and material growth; to initiate projects under Bio-InformaticsLabs and Industries Support Scheme (BLISS) and to start new projects under TechnologyDevelopment Council.
9.4 IT Act/Certification and Network Security – During 2003-04 a Disaster Recovery Centrehas to be set up for the Root Certifying Authority Infrastructure (RCAI) as well as the NationalRepository of Digital Certificates (NRDC) that are presently operational. This is required forproviding uninterrupted services to the Certifying Authorities, as well as, to the users at large.The facility has to be operational within 2-4 hours in the event of any calamity at the presentsite. Besides, more Open House Seminars are to be conducted for creating awareness on theuse of Digital Signatures for e-commerce and e-Governance under the Information TechnologyAct, 2000.
9.5 Technology Development for Indian Languages- This programmes aims at developmentof IT tools and content in Indian languages to facilitate use of computers and other IT systemsin various Indian languages. The DIT has taken up development work in this area at 13Resource Centers at leading R&D organizations and educational institutes. Major achievementunder the programme are development of multi-lingual digital libraries / dictionaries, translationsupport system, optical character recognition system, Text to Speech Systems and Standardization(UNICODE, XML, Lexware format, Fonts). Some of the new R&D projects to be initiated in thefield of language engineering include localization of Linux Operating System, Indian LanguageContent Creation, Cross Lingual Information Retrieval System; Development of IT Terminologyin Hindi, Translation Support System from English to Hindi.
9.6 Software Technology Parks in India (STPI)- The STPI is serving software exportindustry countrywide with over 30 Software Technology Parks equipped with high speed datacommunication. The efforts in the year 2003-04 would be to upgrade the data communicationinfrastructure for value added services; to make available bandwidth and port speeds typicallybetween 64kb/s to 2 Mb/s and procurement of equipments for fibre optic connectivity. Besides,setting up of corporate training centre and marketing support to SMEs are also envisaged.
9.7 Media Lab Asia- The Media Lab Asia project was taken up by DIT in collaboration withthe Massachusetts Institute of Technology. The objective of the project is to deploy state-of-the-art Information and communication technologies and implementing such technologies for the

542
benefit of the citizens, especially those in the rural areas, and empowering them by creatingbusiness opportunities. The thrust areas to be taken up in the project are health, education/learning, employment and micro-entrepreneurship. With the ending up of RCA collaboration withMIT, USA; from onwards 2003-04, the MLA project would be handled by the Ministry ofInformation Technology. Among private sectors, TCS and Microsoft Corporation have committedto become sponsors. A Steering Committee under the Chairmanship of Minister for Informationand Communication Technology has been proposed to be set up to overview the modalities ofproject implementation and progress of the project.
9.8 ERNET : The objective of ERNET is to connect and provide value added services to theEducation and Research Institutions in the country. While 14 institutions of AICTE have alreadybeen connected on ERNET; UGC has also finalized a detailed program for connecting 115universities in the first phase and remaining 140 universities in the II phase. It is planned toconnect all the regional engineering colleges and IITs on a broad bandwidth. The implementationof UGC net, AICTE Net and Broadband connectivity to the regional engineering colleges requireERNET backbone to be broadband from 8/2 Mbps to minimum 34 Mbps and to be further scaledup to 155 Mbps. 10 presence of points are to be opened at the educational institutions alongwithother infrastructure.
9.9 Special Manpower Development for VLSI Design : Department of Information Technologyaimed to catalyse a modest increase in India’s share of the world market for VLSI design fromabout US$ 10 million to about US $ 200 million in about 5-7 years. A report prepared by TCSand IIT, Mumbai has projected a need of 4000 to 5000 microelectronics professionals per yearat the level of M.Tech (Microelectronics). The Department aims to train special manpower in thisarea at B.E./B.Tech, M.E./M.Tech. and Ph.D. levels.
9.10 Semiconductor Complex Ltd.: In the Semiconductor Complex Limited, Mohali, exceptfor sales in strategic sector, the performance of the company in non-strategic areas was low andthe company had incurred a net capital loss of 8.35% in 2002-03 Department of InformationTechnology, in consultation with other major players in the chip manufacturing area, is workingon a revival plan for SCL during 2003-04.
Monitorable Targets / Anticipated Achievements in Annual Plan 2003-04
10. Notable programmes likely to be taken up in a major way during the year are;
o Implementing Vidya Vahini and Gyan Vahini programmes on pilot basis,o Issuing of digital signatures,o Completion of exploratory phase of the Media Lab Asia project,o Preparing action plan for implementing e-governance in the country,o Finalization of hardware policy and getting approval of Govt. for the policy.o To augment the existing infrastructure of National Informatics Centre (NIC), Software
Technology Parks, Education & Research Network (ERNET), Standardization Testing& Quality Control (STQC), etc.

543
Zero Based Budgeting(ZBB)-
11. As a result of ZBB exercise 55 Ninth Plan schemes of the DIT, have already been reducedto 37 schemes.
Issues
12. A number of plans and policy measures have been implemented by the Government andprivate sector to boost the IT sector in the Ninth Plan. However, some issues given below areyet to be addressed for further development of the sector in the Tenth Plan :
• Formulate and get approval of Govt. on National Hardware Development Policyduring 2003-04 and encourage global hardware majors to set up manufacturing unitsin India.
• A comprehensive rationalisation of tariff structure to cope with the zero duty regimeon finished products that will come into place after 2005 as per ITA1-WTO agreement.
• Encourage setting up Software Technology Parks in the private sector.• Make large investments in building brand equity and positioning the India brand
abroad. Industry associations like NASSCOM, MAIT, ESC etc. must help SMEs intheir export efforts through effective networking and meetings with potential customers.
• Promotion of software in Indian languages to increase IT penetration in the domesticmarket.
• Updating the syllabus of computer engineering, electronics and IT in varioustechnical institutions in keeping with the industry’s requirements. The curriculum inother branches of engineering should also be expanded to include IT subjects.Emphasis must be laid on postgraduate engineering education.
• E-governance has been identified as priority area in the Tenth Plan and a clearroadmap to make it a national programme must be formulated without any delay sothat the programmes can be taken up on a faster mode.
• An action plan needs to be formulated to take up R&D in the emerging areas likeMEMS, bio-informatics and nano-technologies in consultation with CSIR and IITs.
• Enforcement of the IT Act to deal with cyber crimes and training law enforcingagencies to handle such crimes.
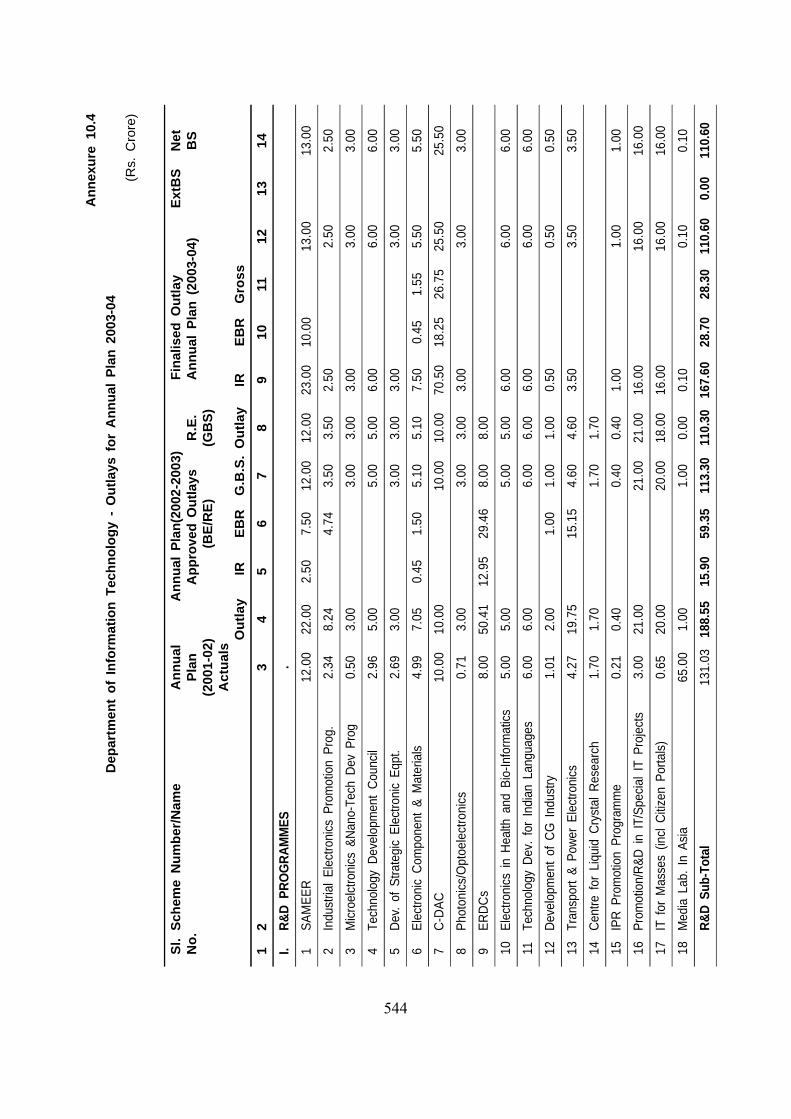
544
An
nex
ure
10.
4
Dep
artm
ent
of
Info
rmat
ion
Tec
hn
olo
gy
- O
utl
ays
for
An
nu
al P
lan
200
3-04
(Rs.
Cro
re)
Sl.
Sch
eme
Nu
mb
er/N
ame
An
nu
al
An
nu
al P
lan
(200
2-20
03)
Fin
alis
ed O
utl
ayE
xtB
SN
etN
o.
Pla
n
Ap
pro
ved
Ou
tlay
sR
.E.
An
nu
al P
lan
(20
03-0
4)B
S(2
001-
02)
(BE
/RE
)(G
BS
)A
ctu
als
Ou
tlay
IR
EB
RG
.B.S
.O
utl
ayIR
EB
RG
ross
12
34
56
78
910
1112
1314
I.R
&D
PR
OG
RA
MM
ES
.
1S
AM
EE
R12
.00
22.0
02.
507.
5012
.00
12.0
023
.00
10.0
013
.00
13.0
0
2In
dust
rial
Ele
ctro
nics
Pro
mot
ion
Pro
g.2.
348.
244.
743.
503.
502.
502.
502.
50
3M
icro
elct
roni
cs &
Nan
o-Te
ch D
ev P
rog
0.50
3.00
3.00
3.00
3.00
3.00
3.00
4Te
chno
logy
Dev
elop
men
t C
ounc
il2.
965.
005.
005.
006.
006.
006.
00
5D
ev.
of S
trate
gic
Ele
ctro
nic
Eqp
t.2.
693.
003.
003.
003.
003.
003.
00
6E
lect
roni
c C
ompo
nent
& M
ater
ials
4.99
7.05
0.45
1.50
5.10
5.10
7.50
0.45
1.55
5.50
5.50
7C
-DA
C10
.00
10.0
010
.00
10.0
070
.50
18.2
526
.75
25.5
025
.50
8P
hoto
nics
/Opt
oele
ctro
nics
0.71
3.00
3.00
3.00
3.00
3.00
3.00
9E
RD
Cs
8.00
50.4
112
.95
29.4
68.
008.
00
10E
lect
roni
cs i
n H
ealth
and
Bio
-Info
rmat
ics
5.00
5.00
5.00
5.00
6.00
6.00
6.00
11Te
chno
logy
Dev
. fo
r In
dian
Lan
guag
es6.
006.
006.
006.
006.
006.
006.
00
12D
evel
opm
ent
of C
G I
ndus
try1.
012.
001.
001.
001.
000.
500.
500.
50
13Tr
ansp
ort
& P
ower
Ele
ctro
nics
4.27
19.7
515
.15
4.60
4.60
3.50
3.50
3.50
14C
entre
for
Liq
uid
Cry
stal
Res
earc
h1.
701.
701.
701.
70
15IP
R P
rom
otio
n P
rogr
amm
e0.
210.
400.
400.
401.
001.
001.
00
16P
rom
otio
n/R
&D
in
IT/S
peci
al I
T P
roje
cts
3.00
21.0
021
.00
21.0
016
.00
16.0
016
.00
17IT
for
Mas
ses
(incl
Citi
zen
Por
tals
)0.
6520
.00
20.0
018
.00
16.0
016
.00
16.0
0
18M
edia
Lab
. In
Asi
a65
.00
1.00
1.00
0.00
0.10
0.10
0.10
R&
D S
ub-T
otal
131.
0318
8.55
15.9
059
.35
113.
3011
0.30
167.
6028
.70
28.3
011
0.60
0.00
110.
60

545
An
nex
ure
10.
4 C
on
cld
.
II.IN
FRA
STR
UC
TUR
E
DE
VE
LOP
ME
NT
19E
RN
ET
5.00
0.10
0.10
0.10
6.00
6.00
6.00
20V
idya
Vah
ini’
& ‘
Gya
n V
ahin
i’ P
rog.
0.00
30.0
030
.00
30.0
05.
005.
005.
00
21S
TQC
28.3
327
.31
27.3
127
.31
33.5
02.
0031
.50
0.50
31.0
0
22S
TPI
& E
HTP
8.00
8.00
8.00
8.00
31.0
025
.00
6.00
6.00
23D
igita
l D
NA
Par
k0.
000.
000.
000.
003.
503.
503.
50
24IT
Ven
ture
Cap
ital
1.00
10.0
010
.00
10.0
05.
005.
005.
00
25E
lect
roni
c G
over
nanc
e4.
9266
.17
25.0
041
.17
41.1
740
.50
40.5
040
.50
26IT
Bill
/ C
ertif
icat
ion
& N
etw
ork
Sec
urity
5.28
5.00
5.00
5.00
6.00
6.00
6.00
27S
emic
ondu
ctor
Layo
utD
esig
n A
ct-2
000
1.00
0.50
0.50
0.50
0.50
0.50
0.50
28C
omm
unity
Inf
orm
atio
n C
entre
s (C
IC)
21.9
720
.00
20.0
023
.00
25.0
025
.00
25.0
0
Infra
stru
ctur
e S
ub-T
otal
75.5
016
7.08
25.0
014
2.08
145.
0815
6.00
25.0
02.
0012
9.00
0.50
128.
50
III.
HU
MA
N R
ES
OU
RC
E D
EV
ELO
PM
EN
T
29C
ED
T4.
0011
.58
7.58
4.00
4.00
20.0
013
.50
1.50
5.00
5.00
30N
CS
T2.
603.
003.
003.
00
31S
oftw
are
Man
pow
er D
ev./E
mp.
Gen
.10
.36
6.00
6.00
5.00
5.00
5.00
5.00
32S
peci
al M
anpo
wer
for
AS
IC D
esig
n1.
902.
002.
002.
003.
503.
503.
50
HR
D S
ub-T
otal
18.8
622
.58
7.58
15.0
014
.00
28.5
013
.50
1.50
13.5
013
.50
IV.
MIS
CE
LLA
NE
OU
S
33H
eadq
uarte
r (S
ecre
taria
t &
Bld
g.)
9.11
10.2
410
.24
10.2
410
.50
10.5
010
.50
34E
l. fo
r R
ural
/Soc
ial
/Agr
i/Wat
er S
ecto
r2.
1214
.00
10.0
04.
004.
001.
001.
001.
00
35Te
ch.
Info
rmat
ion
and
Fore
cast
ing
0.00
0.50
0.50
0.50
36E
lect
roni
cs I
ndus
try I
nfor
mat
ion
Pro
g.0.
240.
250.
250.
250.
200.
200.
20
37E
-Com
mer
ce,In
fo-S
ecur
ity,S
mar
t C
ards
4.50
5.00
5.00
5.00
10.0
010
.00
10.0
0
38P
olic
y Fo
rmul
atio
n in
IT
sect
or0.
600.
600.
600.
600.
500.
500.
50
Mis
cella
neou
s To
tal
16.5
730
.59
10.0
020
.59
20.5
922
.20
0.00
0.00
22.2
00.
0022
.20
SU
B-T
otal
(I
to V
)24
1.96
408.
8023
.48
94.3
529
0.97
289.
9737
4.30
67.2
031
.80
275.
300.
5027
4.80

546
An
nex
ure
10.
4 C
on
cld
.
V.P
SU
s
39S
emic
ondu
ctor
Com
plex
Ltd
.0.
003.
513.
500.
010.
0110
.50
4.50
6.00
6.00
40V
I. N
IC16
2.63
175.
0217
5.02
175.
0218
1.70
181.
702.
0017
9.70
41V
II. E
SC
& E
xpor
t P
rom
otio
n3.
996.
252.
254.
004.
0010
.95
3.95
7.00
7.00
Gra
nd T
otal
408.
5859
3.58
29.2
394
.35
470.
0046
9.00
577.
4575
.65
31.8
0047
0.00
2.50
467.
50(4
92.1
6)*
(470
.00)
**
**O
ther
s -
Rs.
1.0
0 cr
ore
Not
e :-
Nor
th-E
ast
Com
pone
nt:2
003-
04
1. C
-DA
C a
lso
incl
udes
Rs.
8 cr
,for
CIC
2520
01-0
2 (A
ctua
ls)
erst
whi
le E
R&
DC
I, 0.
5 cr
. Fo
r C
ED
TI,
NIC
1657
$$$$
NE
Moh
ali,
3 cr
s. F
or N
CS
T.S
TQC
2
2. D
OE
AC
C i
nclu
des
Rs.
4 cr
s. f
or o
ther
E-g
ovn.
426
.58$
$oth
ers
cent
res
of C
ED
TI &
1 c
r. F
or R
CC
s.47
(492
.16)
*

547
10.5 BIOTECHNOLOGY
Biotechnology is an emerging economic opportunity for India. Taking into account theavailability of large resource of English speaking scientists working in the forefront of R&Dactivities in biosciences and their cost effectiveness, Biotechnology in the Indian context isrightly referred to as “the technology of hope”. Pursued in a focused manner, our efforts in thearea of biotechnology can yield rich harvest of products, processes and technologies withsignificant societal and commercial benefits. Biotechnology industry is characterized by longgestation, significant cost and high-risk with high reward pay-off matrix. The key factor hinderinggrowth of the Biotechnology sector in India appears to be the absence of adequate investmentsor risk capital. Majority of investment funds in India focus on late-stage funding with investmentsize of about 2.5 to 5 crore. This leaves a gap in private equity investments as many start-upsneed early-date funding or angel investment to start their enterprises. Although there are overtwo dozen significant players including US, European, and major Pan Asia-Pacific funds in India,financing for the biotechnology sector remains difficult to come by inter alia, due, to complexityof the industry, long gestation period and risk profile. In other countries, such as China, Korea,Singapore and Taiwan, governments have taken significant initiatives on biotechnology whichare detailed in the Annexure 10.5.1. It is imperative that strategic financing in the form of aVenture Fund for biotechnology is arranged. Government could be the lead sponsor investorfor this fund which would not only support innovative work but also seek capital appreciation onmedium to long-term basis through investment in the focused sector. The fund could moderatethe risk in its portfolio through a judicious mix in investments in higher risk biotechnologycompanies with lower risk allied activities.
Biotech Parks: Biotechnology Vision – a ten year perspective”, insofar as concerns the industrysector, has identified specific milestones such as setting up of biotechnology parks, incubators,training and pilot projects with an outlay of Rs. 30 crore in the Tenth Five Year Plan for industrialactivities. A new central sector scheme is being launched to assist in establishing fermentationunits, plant tissue culture hardening unit and rendering technical advice to biotech industry.Initially, two biotech parks are expected to come up at Andhra Pradesh and Uttar Pradesh tobegin with. Based on experience gained, more such parks could be considered during thecourse of the Tenth Five Year Plan.
These Biotech Parks are mainly aimed at providing technological support and services forthe client to develop proprietary technologies. The central sector funding for Biotech parks wouldbe for establishing incubators, fermentation units, GLP/GMP facilities specialized equipments,greenhouse, networking and data connectivity depending upon the individual business plans.The projects to be received from various states are for providing assistance to industry for
i. Medicinal and Aromatic Plant extraction and bio-processing for health care andagronomic products.
ii. Fermentation and downstream processing for rDNA productsiii. Plant Tissue culture and development of transgenic productsiv. Gene recovery/construction of Incubatorsv. Analytical facilities for rDNA biopharmaceuticals

548
Bharat Immunologicals and Biological Corporation Limited (BIBCOL): This PSU was setup to manufacture Oral Polio Vacine (OPV). The company has formulated OPV from importedbulk and supplied 100 million doses to National Immunisation programme. Based on the positivenet worth of the company, BIFR has discharged the company from the purview of Sick Industrialcompanies Act, 1985 on 01.08.2002.
Indian Vaccines Corporation Limited (IVCOL): This PSU was set up to undertake R&D andmanufacture viral vaccines. The company failed to start production since beginning. One of thepromoter PMSV, France exited from the company transferring its share to GOI (DBT). CurrentlyGOI is holding 67% share in the equity of the company. With a view to restart IVCOL, a proposalto divest its holding to a suitable strategic partner is under consideration

549
Annexure 10.5.1
CHINA/HONG KONG
• China began developing its biotech industry in the mid 1980s, with focus in areas of plantgenomics, transgenics, medicines and vaccines
• Only developing country that participated in the human genome project• Government established key national laboratories supported by the Ministry of Agriculture,
Ministry of Education, Chinese Academy of Sciences• Biotech Parks – Beida, Hangzhou, Zhongguancun, HK Science Park• Over 80 State funded research institutes focused on agri genetic engineering• Government policies list development of modern biotechnology and Traditional Chinese
Medicine• Measures such as tax benefits, government backed VC, attracting overseas nationals to
research instituteso National High Technology R&D Board – Fund of USD 12 billion for 8 priority areas,
including biotechnologyo National Basic Research Development Programme – focus on agri-biotecho China National Centre for Biotechnology Development – Under the State Science &
Technology Commission, focus on biotech projectso The National Natural Science Foundation of China – Fund of USD 30 million, a third
of which is towards life scienceso MOST Torch programme – aims to commercialise novel technologies by
recommendations to financing agencieso Innovation & Technology Fund – Government assigned USD 640 million to fund hi-
tech projectso Applied Research Fund - $ 750 million fund for applied R&D projects, run by 3
professional VC firms
KOREA
• Korea has deemed biotechnology as a strategic industry and plans to spend considerableresources alongwith tax and fiscal incentives
• Biotech Parks – Daeduk Science Park, Bio-venture Support Centre, Korea BiotechnologyIndustrialisation Centre
• Biotechnology has been identified as one of the five designated technologies for largescale R&D investment (Biotech, IT, nanotech, enviro, cultural) – W10 tn (USD 8.3 bn) by2005
• Ministry of Health and Welfare plans to spend W 1 tn (USD d30 mm) by 2010 to develophealth related industries
• Government related biotech spending totalled W 246 bn in 2000 and estimated at W 324bn in 2001 (USD 206 mn, USD 270 mn)
• Other benefits such as low interest loans, tax incentives, research grants

550
TAIWAN
• Taiwan’s biotechnology industry began in 1984 with the government funding of laboratories• Government plans to increase sector focus through investments and development of five
science parks• Biotech Parks – Hsinchu Science Park, Taiwan Science Park• Planned funding of NT $ 20 bn (USD 580 mm) in the biotech sector• Concentrating on providing funds to venture capital firms for investment in the sector –
earmarked NT $ 30 bn (USD 890 mn) to invest in venture funds over the next 5 years• Other government initiatives such as tax exemptions, import concessions, depreciation
benefits, low interest financing etc.
SINGAPORE
• Government singled out biotechnology as a long term good to move towards a knowledgeeconomy
• Biotechnology identified as 4th pillar – electronics, engineering, chemicals• Institutions such as Economic Development Board (EDP), National Science & Technology
Board (NSTB) and Temasek active in financing biotechnology• Biotech Parks – Tuas Biomedical Park, Biopolis• Government has injected S$2bn (USD 1, 1bn) to strengthen infrastructure, develop human
capital, promote private sector R&D, invest in biomedical cos• A S $1bn (USD 570 mn) Biomedical Sciences Investment Fund has been formed to invest
in start-ups• USD 120 mn has been invested in other initiatives including the Bio Innovation Fund, the
Pharm Bio Growth Fund and Life Science Investments• Singapore’s Agency for Science, Technology & Research has allocated S1.5 bn (USD 850
mm) for R&D in the biotech sector• A further S$2 billion (USD 1.1 bn) has been set aside to attract leading research
organizations in Singapore to invest in local and foreign biotech start-ups.• Government related funding forms the bulk of early stage capital for biotechnology
companies through the EDB and Temasek funds• By 2005, Singapore aims to be home to 15 leading pharmaceutical companies and to
become the regional hub for clinical trials and drug development

551
10.6 TOURISM
Introduction
The Tenth Plan approach towards Tourism signifies a distinct shift from the approachadopted in earlier plans. Apart from acknowledging the traditionally recognized advantages ofdeveloping tourism for the promotion of national integration, international understanding and theearning of foreign exchange, the Tenth Plan recognizes the vast employment generatingpotential of tourism and the role it can play in furthering the socio economic objectives of theplan. The need for according higher priority to tourism development is recognized in the TenthPlan. In order to create a supportive environment for the promotion of tourism, the new TourismPolicy, 2002 is under implementation during the Tenth Plan. It seeks to provide legislative andregulatory support for sustainable tourism and protect the interests of the industry and theconsumer. It also seeks to involve the rural sector in the promotion of rural, heritage, adventureand eco tourism. It emphasises the development of high quality products and destinations. Mostimportantly, it seeks to remove the barriers to growth and resolve contradictions in policy toachieve intersectoral convergence of activities that help the growth of tourism.
2. The travel and tourism sector creates more jobs per million rupees of investment than anyother sector of the economy and is capable of providing employment to a wide spectrum of jobseekers from the unskilled to the specialized even in the remotest parts of the country. Tourismis the fastest growing industry in the world with enormous potential for growth in India.
3. The Annual Plan aims to tap the employment potential of tourism through a well-definedgrowth strategy, which seeks to position tourism as a major engine of economic growth, and
• Attempts to harness the direct and multiplier effects of tourism for employmentgeneration and economic development. Provides an impetus to rural tourism togenerate non-farm employment.
• Provides a major thrust to domestic tourism.
• Positions India as a global brand to take advantage of the burgeoning global traveland trade and the vast untapped potential of India as a destination
• Acknowledges the critical role of the private sector with government working as anactive facilitator and catalyst.
• Creates and develops integrated tourism circuits based on India’s unique civilization,heritage and culture in partnership with the States, the private sector and otheragencies
Review of Annual Plan 2002-03
4. For the year 2002-03, the outlay for Tourism was Rs.225 crore. The scheme of TouristInformation and Publicity received a major share of the Plan outlay at Rs. 58 crore. This includesboth overseas campaigns and domestic campaigns. The outlay for the scheme of IntegratedDevelopment of Tourist Circuits was Rs.58 crore. The other important schemes were Product/Infrastructure and Destination Development, schemes of North Eastern Region etc. Details of

552
these schemes are given below. Scheme wise details of outlays and expenditure will beavailable at Annexure-I.
Details of the Schemes
(i) Integrated Development of Tourist Circuits
5. The 9th Plan envisaged a selective approach based on travel circuit concept in theprovision of tourist infrastructure. Travel circuits were identified, but it became difficult tochannelise the resources to these circuits. The reason for this was that the State/UT Governmentsprioritised projects, which were not concentrated on the travel circuits alone. The infrastructureschemes being Centrally Sponsored Schemes, had to depend on the contributions of the State/UT Governments. This resulted in delays in release of this contribution. Therefore, in order toovercome these problems, tourism infrastructure projects were sanctioned under the IntegratedDevelopment of Tourist Circuits. The objective is to identify six tourism circuits in the country onan annual basis (one in each zone) and to develop them to international standards. During2002-03, circuits chosen were Buddhist Circuit, Himalayan Circuit, Nature and Wild Life Circuit,Konkan Riveria Circuit, Backwaters and Beach Circuit and Eco Tourism Circuit.
(ii) Product/Infrastructure and Destination Development
6. For infrastructure and product development, the Department of Tourism has been providingassistance to the State Governments. It has resulted in strengthening of the infrastructure andproduct development in the country. This scheme has been revamped in the Tenth Plan. Thefocus in the Tenth Plan is to fund large projects of infrastructure or product development in termsof construction of budget accommodation and tourist complexes, wayside amenities, touristreception centers, refurbishment of monuments etc.
7. The master plan for destination development ties up all backward and forward linkagesincluding environmental considerations. New emerging areas of tourism like rural tourism,heritage tourism, eco tourism, adventure tourism, health tourism, wildlife tourism etc. getspriority under this scheme. During 2002-03, destinations identified are Hampi (Karnataka), RedFort (Delhi), Kurukshetra (Haryana), Mewar (Rajasthan), Mahabalipuram (Tamil Nadu), Haridwar– Rishikesh (Uttraanchal), Khonoma (Nagaland) etc.
8. Under Rural Tourism, projects included during 2002-03 are Bellur (Karanataka), HatwaVillage (Madhra Pradesh), Raghurajpur (Orissa), Kamlasagar (Tripura) and Jageshwar(Uttaranchal).
(iii) Marketing and Promotion
9. The Indian tourism product is promoted within and outside India by the Department ofTourism, through their schemes of domestic promotion and overseas campaign.
10. Domestic promotion - The promotional efforts have a multi dimensional thrust coveringimage building, dissemination of information, and public relation efforts. The communication

553
message is geared towards the tourists, service providers and consumer media. The domesticcampaign highlighted the new tourism circuits being created such as the Ajanta-Ellora, theGanga heartland project, the Buddhist circuit and the Leh-Ladakh-Manali circuit. The variety offairs and festivals has been supported in the Plan.
11. Overseas promotion - Without aggressive promotion in the highly competitive touristmarket overseas, India will not be able to achieve the targeted growth and increased share inglobal tourists arrivals. During the year 2002-03, the strategies for promotion included creatingawareness about Indian Tourism Product, maintaining close relation and co-ordination withIndian Missions, Travel and Trade Media, Airlines, organizing Indian food festivals andparticipating in festivals/exhibitions abroad.
12. In order to effectively market India abroad, a multi media campaign (‘Incredible India’) waslaunched across the world. This campaign was undertaken in print, television and the internet.
(iv) Human Resource Development
13. Tourism being an employment oriented sector, it is estimated that the hotel and thecatering sector would provide more than 50% of the total employment generated by the tourismindustry. Being a labour oriented industry directly in contact with tourists, skills required in thissector are different from those required in other sectors. In the Tenth Plan, all the earlierschemes on Hotel Management were restructured and merged in a single scheme namely,‘Assistance to IHMs/FCIs/IITTM/NIAS/NCHMCT’. During 2002-03, the training infrastructure inthe existing Institutes of Hotel Management has been upgraded and better facilities wereprovided to all these institutes. Work has been started for creation of new Institutes of HotelManagement in Kurukshetra, (Haryana) and Dehra Dun (Uttranchal) in 2002-03.
(v) Capacity Building in the Organised and the Unorganised sector
14. The existing FCIs, IHMs and the Institutes in the private sector cater mainly to theorganised sector. The unorganised sector consisting of small hotels, dhabas, restaurants andother eatable joints spread all over the country hardly get an opportunity of training from skilledand professional trainers in the hospitality sector. As it is not possible and viable to set up FCIsin every district, the existing IHMs started conducting mobile training courses for them. Short-term training modules for the service providers were conducted during 2002-03.
Annual Plan 2003-2004
15. The Central Sector outlay for Tourism in the Annual Plan 2003-04 is Rs.325 crore. Therestructured Tenth Plan schemes of the Ministry of Tourism like Integrated Development ofTourist Circuits, Product/Infrastructure and Destination Development, Marketing and Promotion,Human Resource Development, Capacity Building in the Organised and the Unorganisedsectors etc. would continue in the second year of the Tenth Plan, i.e. the Annual Plan 2003-04.The details of the scheme-wise outlay for the Annual Plan 2003-04 will be available atAnnexure-II.
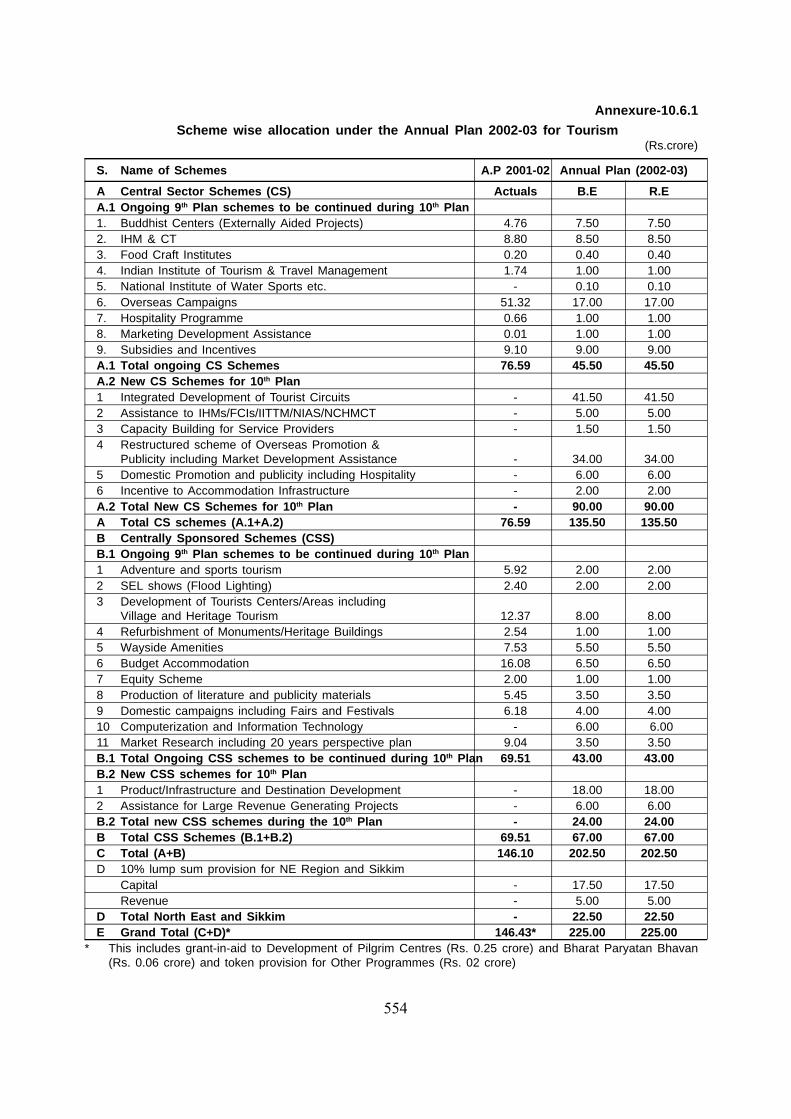
554
Annexure-10.6.1
Scheme wise allocation under the Annual Plan 2002-03 for Tourism(Rs.crore)
S. Name of Schemes A.P 2001-02 Annual Plan (2002-03)
A Central Sector Schemes (CS) Actuals B.E R.EA.1 Ongoing 9th Plan schemes to be continued during 10th Plan1. Buddhist Centers (Externally Aided Projects) 4.76 7.50 7.502. IHM & CT 8.80 8.50 8.503. Food Craft Institutes 0.20 0.40 0.404. Indian Institute of Tourism & Travel Management 1.74 1.00 1.005. National Institute of Water Sports etc. - 0.10 0.106. Overseas Campaigns 51.32 17.00 17.007. Hospitality Programme 0.66 1.00 1.008. Marketing Development Assistance 0.01 1.00 1.009. Subsidies and Incentives 9.10 9.00 9.00A.1 Total ongoing CS Schemes 76.59 45.50 45.50A.2 New CS Schemes for 10th Plan1 Integrated Development of Tourist Circuits - 41.50 41.502 Assistance to IHMs/FCIs/IITTM/NIAS/NCHMCT - 5.00 5.003 Capacity Building for Service Providers - 1.50 1.504 Restructured scheme of Overseas Promotion &
Publicity including Market Development Assistance - 34.00 34.005 Domestic Promotion and publicity including Hospitality - 6.00 6.006 Incentive to Accommodation Infrastructure - 2.00 2.00A.2 Total New CS Schemes for 10th Plan - 90.00 90.00A Total CS schemes (A.1+A.2) 76.59 135.50 135.50B Centrally Sponsored Schemes (CSS)B.1 Ongoing 9th Plan schemes to be continued during 10th Plan1 Adventure and sports tourism 5.92 2.00 2.002 SEL shows (Flood Lighting) 2.40 2.00 2.003 Development of Tourists Centers/Areas including
Village and Heritage Tourism 12.37 8.00 8.004 Refurbishment of Monuments/Heritage Buildings 2.54 1.00 1.005 Wayside Amenities 7.53 5.50 5.506 Budget Accommodation 16.08 6.50 6.507 Equity Scheme 2.00 1.00 1.008 Production of literature and publicity materials 5.45 3.50 3.509 Domestic campaigns including Fairs and Festivals 6.18 4.00 4.0010 Computerization and Information Technology - 6.00 6.0011 Market Research including 20 years perspective plan 9.04 3.50 3.50B.1 Total Ongoing CSS schemes to be continued during 10th Plan 69.51 43.00 43.00B.2 New CSS schemes for 10th Plan1 Product/Infrastructure and Destination Development - 18.00 18.002 Assistance for Large Revenue Generating Projects - 6.00 6.00B.2 Total new CSS schemes during the 10th Plan - 24.00 24.00B Total CSS Schemes (B.1+B.2) 69.51 67.00 67.00C Total (A+B) 146.10 202.50 202.50D 10% lump sum provision for NE Region and Sikkim
Capital - 17.50 17.50Revenue - 5.00 5.00
D Total North East and Sikkim - 22.50 22.50E Grand Total (C+D)* 146.43* 225.00 225.00
* This includes grant-in-aid to Development of Pilgrim Centres (Rs. 0.25 crore) and Bharat Paryatan Bhavan(Rs. 0.06 crore) and token provision for Other Programmes (Rs. 02 crore)

555
Annexure- 10.6.2
Scheme wise allocation under the Annual Plan 2003-04 for Tourism
S. Name of Schemes Annual Plan OutlayNo. (2003-04)
A Central Sector Schemes (CS)
1 Externally Aided Projects 5.00
2 Integrated Development of Tourist Circuits 60.00
3 Assistance to IHMs/FCIs/IITTM/NIWS/NIAS/NCHMCT 17.50
4 Capacity Building for Service Providers 2.00
5 Overseas Promotion & Publicity including Market Development Assistance 56.00
6 Domestic Promotion and publicity including Hospitality 12.00
7 Incentive to Accommodation Infrastructure 10.00
A Total CS Schemes 162.50
B Centrally Sponsored Schemes (CSS)
1 Computerization and Information Technology 9.00
2 Market Research including 20 years perspective plan 3.00
3 Product/Infrastructure and Destination Development 100.00
4 Assistance for Large Revenue Generating Projects 18.00
B Total CSS schemes 130.00
C Total - CS & CSS schemes (A+B) 292.50
D 10% lump sum provision for NE Region and Sikkim
- Capital 22.50
- Revenue 10.00
D Total North East Region and Sikkim 32.50
E Grand Total 325.00