
RESEARCH METHODOLOGY - Alagappa University
284
Directorate of Distance Education RESEARCH METHODOLOGY ALAGAPPA UNIVERSITY [Accredited with ‘A+’ Grade by NAAC (CGPA:3.64) in the Third Cycle and Graded as Category–I University by MHRD-UGC] (A State University Established by the Government of Tamil Nadu) KARAIKUDI – 630 003 M.Com. [Finance and Control] IV - Semester 335 43
-
Upload
khangminh22 -
Category
Documents
-
view
1 -
download
0
Transcript of RESEARCH METHODOLOGY - Alagappa University

Directorate of Distance Education
RESEARCH METHODOLOGY
ALAGAPPA UNIVERSITY[Accredited with ‘A+’ Grade by NAAC (CGPA:3.64) in the Third Cycle
and Graded as Category–I University by MHRD-UGC]
(A State University Established by the Government of Tamil Nadu)
KARAIKUDI – 630 003
M.Com. [Finance and Control] IV - Semester
335 43

All rights reserved. No part of this publication which is material protected by this copyright noticemay be reproduced or transmitted or utilized or stored in any form or by any means now known orhereinafter invented, electronic, digital or mechanical, including photocopying, scanning, recordingor by any information storage or retrieval system, without prior written permission from the AlagappaUniversity, Karaikudi, Tamil Nadu.
Information contained in this book has been published by VIKAS® Publishing House Pvt. Ltd. and hasbeen obtained by its Authors from sources believed to be reliable and are correct to the best of theirknowledge. However, the Alagappa University, Publisher and its Authors shall in no event be liable forany errors, omissions or damages arising out of use of this information and specifically disclaim anyimplied warranties or merchantability or fitness for any particular use.
Authors
Dr Deepak Chawla, Distinguished Professor, Dean (Research & Fellow Programme), International Management Institute (IMI),New Delhi
Dr Neena Sondhi, Professor, International Management Institute (IMI), New DelhiUnits (1-14)
"The copyright shall be vested with Alagappa University"
Vikas® is the registered trademark of Vikas® Publishing House Pvt. Ltd.
VIKAS® PUBLISHING HOUSE PVT. LTD.E-28, Sector-8, Noida - 201301 (UP)Phone: 0120-4078900 Fax: 0120-4078999Regd. Office: A-27, 2nd Floor, Mohan Co-operative Industrial Estate, New Delhi 1100 44 Website: www.vikaspublishing.com Email: [email protected]
Work Order No.AU/DDE/DE12-02/Preparation and Printing of Course Materials /2020 dated 30.01.2020 Copies – 200
Reviewer
............... ............................................................
SYLLABI-BOOK MAPPING TABLEResearch Methodology
BLOCK - I: RESEARCH PROPOSAL
UNIT 1: Research: Meaning of Research; Types of Research - Exploratory
Research, Conclusive Research; The Process of Research; Research
Applications in Social and Business Sciences; Features of a Good Research
Study.
UNIT 2: Research Problem and Formulation of Research Hypotheses:
Defining the Research Problem; Management Decision Problem Vs
Management Research Problem; Problem Identification Process; Components
of the Research Problem; Formulating the Research Hypothesis - Types of
Research Hypothesis; Writing a Research Proposal - Contents of a Research
Proposal and Types of Research Proposals.
UNIT 3: Research Design: Meaning of Research Designs; Nature and
Classification of Research Designs; Exploratory Research Designs:
Secondary Resource Analysis, Case Study Method, Expert Opinion Survey,
Focus Group Discussions; Descriptive Research Designs: Cross-Sectional
Studies and Longitudinal Studies; Experimental Designs, Errors Affecting
Research Design.
BLOCK - II: CLASSIFICATION OF DATA
UNIT 4: Primary and Secondary Data: Classification of Data; Secondary
Data: Uses, Advantages, Disadvantages, Types and Sources; Primary Data
Collection: Observation Method, Focus Group Discussion, Personal
Interview Method.
BLOCK - III: METHODOLOGY
UNIT 5: Attitude Measurement and Scaling: Types of Measurement Scales;
Attitude; Classification of Scales: Single Item Vs Multiple Item Scale,
Comparative Vs Non-Comparative Scales, Measurement Error, Criteria for
Good Measurement.
UNIT 6: Questionnaire Design: Questionnaire Method; Types of
Questionnaires; Process of Questionnaire Designing; Advantages and
Disadvantages of Questionnaire Method.
UNIT 7: Sampling: Sampling Concepts - Sample Vs Census, Sampling Vs
Non Sampling Error; Sampling Design - Probability and Non Probability
Sampling Design; Determination of Sample Size - Sample Size for Estimating
Population Mean, Determination of Sample Size for Estimating the Population
Proportion.
Syllabi Mapping in Book
Unit 1: Introduction to Research(Pages 1-15)
Unit 2: Research Problem andFormulation of the Research
Hypotheses(Pages 16-34)
Unit 3: Research Designs(Pages 35-50)
Unit 4: Primary andSecondary Data
(Pages 51-76)
Unit 5: Attitude Measurementand Scaling
(Pages 77-95)
Unit 6: Questionnaire Design(Pages 96-112)
Unit 7: Sampling(Pages 113-132)

UNIT 8: Data Processing: Data Editing - Field Editing, Centralized in House
Editing; Coding - Coding Closed Ended Structured Questions, Coding Open
Ended Structured Questions; Classification and Tabulation of Data.
UNIT 9: Univariate and Bivariate Analysis of Data: Descriptive Vs Inferential
Analysis, Descriptive Analysis of Univariate Data - Analysis of Nominal
Scale Data with Only One Possible Response, Analysis of Nominal Scale
Data with Multiple Category Responses, Analysis of Ordinal Scaled
Questions, Measures of Central Tendency, Measures of Dispersion;
Descriptive Analysis of Bivariate Data.
UNIT 10: Testing of Hypotheses: Concepts in Testing of Hypothesis - Steps
in Testing of Hypothesis, Test Statistic for Testing Hypothesis about
Population Mean; Tests Concerning Means - the Case of Single Population;
Tests for Difference between Two Population Means; Tests Concerning
Population Proportion - the Case of Single Population; Tests for Difference
between Two Population Proportions.
BLOCK - IV: RESEARCH REPORT
UNIT 11: Chi-Square Analysis: Chi Square Test for the Goodness of Fit; Chi-
Square Test for the Independence of Variables; Chi-Square Test for the
Equality of More Than Two Population Proportions.
UNIT 12: Analysis of Variance: Completely Randomized Design in a One-
Way ANOVA; Randomized Block Design in Two-Way ANOVA; Factorial
Design.
UNIT 13: Research Report Writing: Types of Research Reports - Brief Reports
and Detailed Reports; Report Writing: Structure of the Research Report-
Preliminary Section, Main Report, Interpretations of Results and Suggested
Recommendations; Report Writing: Formulation Rules for Writing the Report:
Guidelines for Presenting Tabular Data, Guidelines for Visual Representations.
UNIT 14: Ethics in Research: Meaning of Research Ethics; Clients Ethical
Code; Researchers Ethical Code; Ethical Codes Related to Respondents;
Responsibility of Ethics in Research - Uses of Library and Internet in Research.
Unit 8: Data Processing(Pages 133-143)
Unit 9: Univariate and BivariateAnalysis of Data(Pages 144-171)
Unit 10: Testing of Hypotheses(Pages 172-200)
Unit 11: Chi-Square Analysis(Pages 201-218)
Unit 12: Analysis of Variance(Pages 219-237)
Unit 13: Research Report Writing(Pages 238-256)
Unit 14: Ethics in Research(Pages 257-274)
INTRODUCTION
BLOCK I: RESEARCH PROPOSAL
UNIT 1 INTRODUCTION TO RESEARCH 1-151.0 Introduction1.1 Objectives1.2 Meaning of Research1.3 Types of Research
1.3.1 Exploratory Research1.3.2 Conclusive Research
1.4 The Process of Research1.5 Research Applications in Social and Business Sciences1.6 Features of a Good Research Study1.7 Answers to Check Your Progress Questions1.8 Summary1.9 Key Words
1.10 Self Assessment Questions and Exercises1.11 Further Readings
UNIT 2 RESEARCH PROBLEM AND FORMULATION OF
THE RESEARCH HYPOTHESES 16-342.0 Introduction2.1 Objectives2.2 Defining the Research Problem2.3 Management Decision Problem vs Management Research Problem2.4 Problem Identification Process2.5 Components of the Research Problem2.6 Formulating the Research Hypotheses
2.6.1 Types of Research Hypotheses2.7 Writing a Research Proposal
2.7.1 Contents of a research proposal2.7.2 Types of Research Proposals
2.8 Answers to Check Your Progress Questions2.9 Summary
2.10 Key Words2.11 Self Assessment Questions and Exercises2.12 Further Readings
UNIT 3 RESEARCH DESIGNS 35-503.0 Introduction3.1 Objectives3.2 Meaning, Nature and Classification of Research Designs3.3 Exploratory Research Designs
3.3.1 Secondary Resource Analysis3.2.2 Case Study Method
CONTENTS

3.3.3 Expert Opinion Survey3.3.4 Focus Group Discussions
3.4 Descriptive Research Designs3.4.1 Cross-sectional Studies3.4.2 Longitudinal Studies
3.5 Experimental Designs3.6 Errors Affecting Research Design3.7 Answers to Check Your Progress Questions3.8 Summary3.9 Key Words
3.10 Self Assessment Questions and Exercises3.11 Further Readings
BLOCK II: CLASSIFICATION OF DATA
UNIT 4 PRIMARY AND SECONDARY DATA 51-76)4.0 Introduction4.1 Objectives4.2 Classification of Data4.3 Secondary Data
4.3.1 Uses of Secondary Data4.3.2 Advantages and Disadvantages of Secondary Data4.3.3 Types and Sources of Secondary Data
4.4 Primary Data Collection: Observation Method4.5 Primary Data Collection: Focus Group Discussion4.6 Primary Data Collection: Personal Interview Method4.7 Answers to Check Your Progress Questions4.8 Summary4.9 Key Words
4.10 Self Assessment Questions and Exercises4.11 Further Readings
BLOCK III: METHODOLOGY
UNIT 5 ATTITUDE MEASUREMENT AND SCALING 77-955.0 Introduction5.1 Objectives5.2 Types of Measurement Scales
5.2.1 Attitude5.3 Classification of Scales
5.3.1 Single Item vs Multiple Item Scale5.3.2 Comparative vs Non-comparative Scales
5.4 Measurement Error5.4.1 Criteria for Good Measurement
5.5 Answers to Check Your Progress Questions5.6 Summary5.7 Key Words5.8 Self Assessment Questions and Exercises5.9 Further Readings
UNIT 6 QUESTIONNAIRE DESIGN 96-1126.0 Introduction6.1 Objectives6.2 The Questionnaire Method
6.2.1 Types of Questionnaire6.3 Process of Questionnaire Designing6.4 Advantages and Disadvantages of the Questionnaire Method6.5 Answers to Check Your Progress Questions6.6 Summary6.7 Key Words6.8 Self Assessment Questions and Exercises6.9 Further Readings
UNIT 7 SAMPLING 113-1327.0 Introduction7.1 Objectives7.2 Sampling Concepts
7.2.1 Sample vs Census7.2.2 Sampling vs Non-Sampling Error
7.3 Sampling Design7.3.1 Probability Sampling Design7.3.2 Non-probability Sampling Designs
7.4 Determination of Sample Size7.4.1 Sample Size for Estimating Population Mean7.4.2 Determination of Sample Size for Estimating the Population Proportion
7.5 Answers to Check Your Progress Questions7.6 Summary7.7 Key Words7.8 Self Assessment Questions and Exercises7.9 Further Readings
UNIT 8 DATA PROCESSING 133-1438.0 Introduction8.1 Objectives8.2 Data Editing
8.2.1 Field Editing8.2.2 Centralized In-house Editing
8.3 Coding8.3.1 Coding Closed-ended Structured Questions8.3.2 Coding Open-ended Structured Questions
8.4 Classification and Tabulation of Data8.5 Answers to Check Your Progress Questions8.6 Summary8.7 Key Words8.8 Self Assessment Questions and Exercises8.9 Further Readings

UNIT 9 UNIVARIATE AND BIVARIATE ANALYSIS OF DATA 144-1719.0 Introduction9.1 Objectives9.2 Descriptive vs Inferential Analysis
9.2.1 Descriptive Analysis9.2.2 Inferential Analysis
9.3 Descriptive Analysis of Univariate Data9.3.1 Analysis of Nominal Scale Data with only One Possible Response9.3.2 Analysis of Nominal Scale Data with Multiple Category Responses9.3.3 Analysis of Ordinal Scaled Questions9.3.4 Measures of Central Tendency9.3.5 Measures of Dispersion
9.4 Descriptive Analysis of Bivariate Data9.5 Answers to Check Your Progress Questions9.6 Summary9.7 Key Words9.8 Self Assessment Questions and Exercises9.9 Further Readings
UNIT 10 TESTING OF HYPOTHESES 172-20010.0 Introduction10.1 Objectives10.2 Concepts in Testing of Hypothesis
10.2.1 Steps in Testing of Hypothesis Exercise10.2.2 Test Statistic for Testing Hypothesis about Population Mean
10.3 Tests Concerning Means-the Case of Single Population10.4 Tests for Difference between two Population Means10.5 Tests Concerning Population Proportion- the Case of Single Population10.6 Tests for Difference between two Population Proportions10.7 Answers to Check Your Progress Questions10.8 Summary10.9 Key Words
10.10 Self Assessment Questions and Exercises10.11 Further Readings
BLOCK IV: RESEARCH REPORT
UNIT 11 CHI-SQUARE ANALYSIS 201-21811.0 Introduction11.1 Objectives11.2 A Chi-square Test for the Goodness of Fit11.3 A Chi-square Test for the Independence of Variables11.4 A Chi-square Test for the Equality of More than
11.4.1 Two Population Proportions11.5 Answers to Check Your Progress Questions11.6 Summary11.7 Key Words11.8 Self Assessment Questions and Exercises11.9 Further Readings

UNIT 12 ANALYSIS OF VARIANCE 219-23712.0 Introduction12.1 Objectives12.2 Completely Randomized Design in a One-way ANOVA12.3 Randomized Block Design in Two-way ANOVA12.4 Factorial Design12.5 Answers to Check Your Progress Questions12.6 Summary12.7 Key Words12.8 Self Assessment Questions and Exercises12.9 Further Readings
UNIT 13 RESEARCH REPORT WRITING 238-25613.0 Introduction13.1 Objectives13.2 Types of Research Reports
13.2.1 Brief Reports13.2.2 Detailed reports
13.3 Report Writing: Structure of the Research Report13.3.1 Preliminary Section13.3.2 Main Report13.3.3 Interpretations of Results and Suggested Rcommendations
13.4 Report Writing: Formulation Rules for Writing the Report13.4.1 Guidelines for Presenting Tabular Data13.4.2 Guidelines for Visual Representations: Graphs
13.5 Answers to Check Your Progress Questions13.6 Summary13.7 Key Words13.8 Self Assessment Questions and Exercises13.9 Further Readings
UNIT 14 ETHICS IN RESEARCH 257-27414.0 Introduction14.1 Objectives14.2 Meaning of Research Ethics
14.2.1 Client’s Ethical Code14.2.2 Researcher’s Ethical Code
14.3 Ethical Codes Related to Respondents14.4 Responsibility of Ethics in Research14.5 Uses of Library and Internet in Research
14.5.1 Uses of Library in Research14.5.2 Uses of Internet in Research
14.6 Answers to Check Your Progress Questions14.7 Summary14.8 Key Words14.9 Self Assessment Questions and Exercises
14.10 Further Readings

Introduction
NOTES
Self-Instructional10 Material
INTRODUCTION
Research simply means a search for facts – answer to questions and solutions toproblems. It is a purposive investigation. It is an organized inquiry. It seeks to findexplanations to unexplained phenomena to clarify doubtful facts and to correct themisconceived notions.
Research is a scientific endeavour and involves the scientific method. Thescientific method is a systematic step-by-step procedure following the logicalprocesses of reasoning. Scientific method is a means for gaining knowledge of theuniverse. It does not belong to any particular body of knowledge; it is universal. Itdoes not refer to a field of specific subject of matter, but rather to a procedure ormode of investigation.
Research methodology refers to the procedures used in making systematicobservations or otherwise obtaining data, evidence, or information as part of aresearch project or study. It defines what the activity of research is, how to proceed,how to measure progress, and what constitutes success.
This book, Research Methodology, is written with the distance learningstudent in mind. It is presented in a user-friendly format using a clear, lucid language.Each unit contains an Introduction and a list of Objectives to prepare the studentfor what to expect in the text. At the end of each unit are a Summary and a list ofKey Words, to aid in recollection of concepts learnt. All units contain Self-Assessment Questions and Exercises, and strategically placed Check Your Progressquestions so the student can keep track of what has been discussed.
NOTES
Self-InstructionalMaterial 1
Introduction to ResearchBLOCK - I
RESEARCH PROPOSAL
UNIT 1 INTRODUCTION TORESEARCH
Structure
1.0 Introduction1.1 Objectives1.2 Meaning of Research1.3 Types of Research
1.3.1 Exploratory Research1.3.2 Conclusive Research
1.4 The Process of Research1.5 Research Applications in Social and Business Sciences1.6 Features of a Good Research Study1.7 Answers to Check Your Progress Questions1.8 Summary1.9 Key Words
1.10 Self Assessment Questions and Exercises1.11 Further Readings
1.0 INTRODUCTION
You might have watched on TV the panel discussion that takes place before thestart of the cricket match. The facilitator asks the panel members questions like:
Which side will win the match today?
Will Sachin Tendulkar score a century?
What will be the score that the batting side will pile?
You have noted that to answer these questions, the panel members quote factorssuch as the following:
The outcome of previous instances when the two sides met and the winningstreak of the teams at the venue
The number of centuries Tendulkar has scored on a particular ground andagainst the opposite side
Weather conditions, etc.
What the panel members are doing is that they are using the existing evidenceor data systematically to make match predictions. In other words, we could saythat they are using research methodology to answer the questions.
Introduction to Research
NOTES
Self-Instructional2 Material
Research methodology refers to the procedures used in making systematicobservations or otherwise obtaining data, evidence, or information as part of aresearch project or study. It defines what the activity of research is, how to proceed,how to measure progress, and what constitutes success. We will study more aboutthe various aspects of research methodology in the unit. First, let us understandwhat research is.
Research helps in decision making, especially in business. Effective decisionslead to managerial success, and this requires reducing the element of risk anduncertainty. For example, let us say, an ice-cream company has come up with anew flavour of ice-cream, which is a mixture of mango and vanilla. They are thinkingof two names –‘Aam Masti’ or ‘Mango Mania’. They would like to sell the ice-cream to children and are not sure which name has more appeal. One of the waysin which this can be done is by using the scientific method of enquiry and followinga structured approach to collect and analyse information and then eventually subjectit to the manager’s judgement. This is no magic mantra but a scientific and structuredtool available to every manager, namely, research. Thus, research refers to a widerange activities involving a search for information, which is used in various disciplines.
Research activities may range from a simple collection of facts (example, thenumber of MBA students who opt for higher studies abroad in a particular institute)to validation of information (for example, is the new diet cola more popular amongwomen?) to an exhaustive theory and model construction (for example, constructinga model of India’s weather patterns in 2050 based on climate change projections).
In this unit, we will discuss the meaning of research, the types of researchesavailable to the researcher and the process of a research study. We will alsodiscuss the application of research in different areas of management and describethe features of a good research study.
1.1 OBJECTIVES
After going through this unit, you will be able to:
Define the concept of research in management
Identify the types of researches available to a business researcher
Describe the complete process of a research study
Explain the application of research in different domains of Management
Identify the criteria needed to classify research as meaningful and ‘good’research
1.2 MEANING OF RESEARCH
Different scholars have interpreted the term ‘research’ in many ways. For instance,Fred Kerlinger (1986) stated that ‘Scientific research is a systematic, controlled

NOTES
Self-InstructionalMaterial 3
Introduction to Researchand critical investigation of propositions about various phenomena.’ Grinnell (1993)has simplified the debate and stated ‘The word research is composed of twosyllables, ‘re’ and ‘search’.
The dictionary defines the former as a prefix meaning ‘again’, ‘anew’ or‘over again’. Search is defined as a verb meaning ‘to examine closely and carefully’,‘to test and try’, or ‘to probe’. Together, they form a noun describing a careful,systematic, patient study and investigation in some field of knowledge, undertakento establish facts or principles.’
Thus, drawing from the common threads of the above definitions, we derivethat management research is an unbiased, structured, and sequential methodof enquiry, directed towards a clear implicit or explicit business objective.This enquiry might lead to proving existing theorems and models or arriving at newtheories and models. Let us now understand each part of the definition.
The most important and difficult task of a researcher is to be as objectiveand neutral as possible. Even though the researcher might have a lot of knowledgeabout the topic, he/she must not try to deliberately get results in the direction of thehypotheses.
The second thing to be remembered is that you follow a structured andsequential method of enquiry. For example, you may want to look at what are theoptions that you can choose if you study abroad. And you search the internet andask your relatives and friends about what are the options for studying abroad. Thisis search and not research. For research, there must be a structured approach thatyou need to follow, and then only will it be called scientific. Thus, you may do abackground analysis of how many students go abroad to study and based on this,form a hypotheses that 80 per cent of young Indians go to universities in the USAfor further study. Then, you conduct a small survey amongst the students who areintending to go abroad for study. And based on the data collected, you are able toprove or disprove the hypotheses. So, we can state that you had conducted aresearch study. You will study the process of research later in the Unit.
The last and most important aspect of our definition that needs to be carefullyconsidered is the decision-assisting nature of business research. As Easterby-Smith, et al. (2002) state, business research must have some practical consequences,either immediately, when it is conducted for solving an immediate business problemor when the theory or model developed can be implemented and tested in abusiness setting. The world of business demands that managers and researcherswork towards a goal—whether immediate or futuristic, else the research loses itssignificance in the field of management. The advantage with doing research is thatone is able to take a decision with more confidence as one has tested it throughresearch. For example, if you conduct a study of young women professionals andsee that they have a need for a night crèche facility when they need to go out oftown on official duty. You can conduct a small research to test what facilities theywould like in this crèche and how much would they be willing to pay for thisfacility.
Introduction to Research
NOTES
Self-Instructional4 Material
In fact, it would not be wrong to say that without the tool of research therewould be no new business practices or methods, as no one would want to startsomething new (for example, launch a new product, enter a new market segment,etc) without testing it through research.
Check Your Progress
1. State the most important and difficult task of a researcher.
2. What method of enquiry is required in research?
1.3 TYPES OF RESEARCH
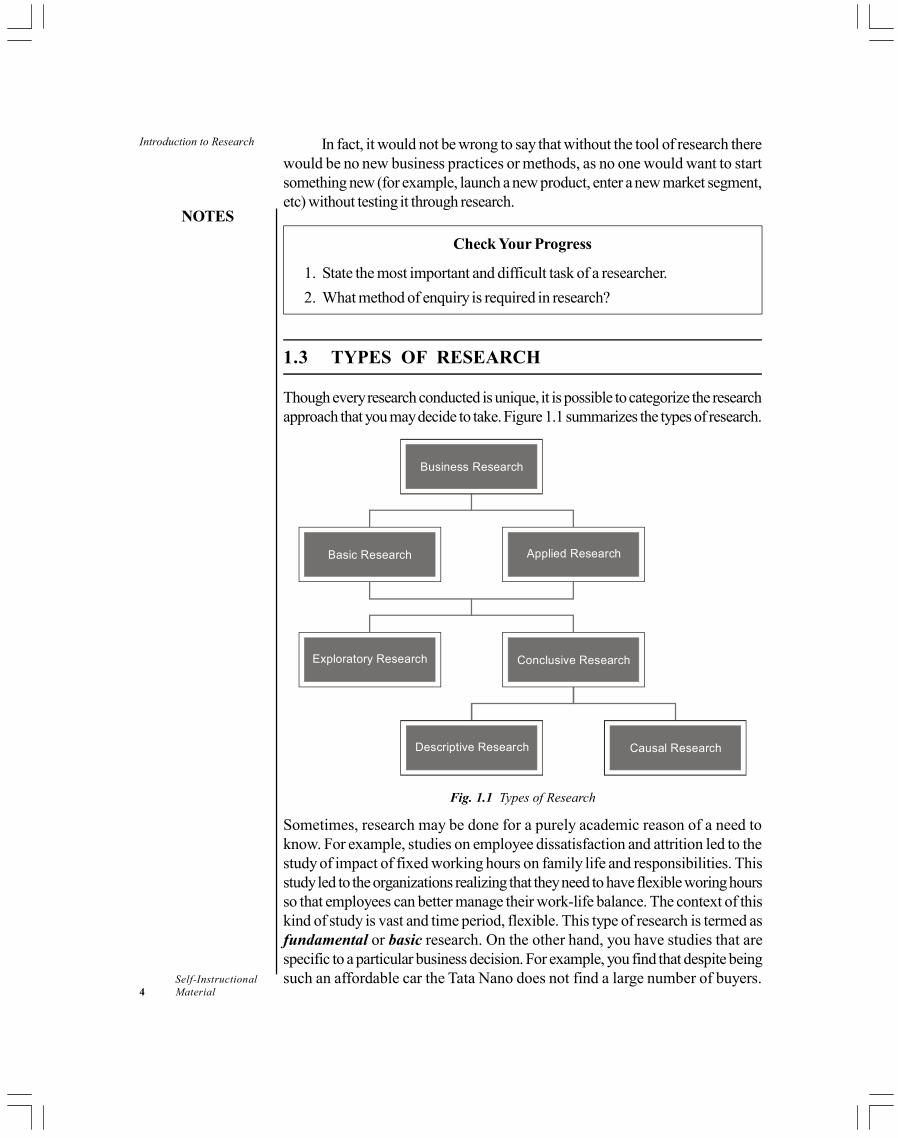
Though every research conducted is unique, it is possible to categorize the researchapproach that you may decide to take. Figure 1.1 summarizes the types of research.
Causal ResearchDescriptive Research
Business Research
Applied ResearchBasic Research
Conclusive ResearchExploratory Research
Fig. 1.1 Types of Research
Sometimes, research may be done for a purely academic reason of a need toknow. For example, studies on employee dissatisfaction and attrition led to thestudy of impact of fixed working hours on family life and responsibilities. Thisstudy led to the organizations realizing that they need to have flexible woring hoursso that employees can better manage their work-life balance. The context of thiskind of study is vast and time period, flexible. This type of research is termed asfundamental or basic research. On the other hand, you have studies that arespecific to a particular business decision. For example, you find that despite beingsuch an affordable car the Tata Nano does not find a large number of buyers.
NOTES
Self-InstructionalMaterial 5
Introduction to ResearchThus, the study you undertake would be of practical value to the specificorganization. Secondly, it has implications for immediate action. This action-orientedresearch is termed as applied research.
However, now we would like to advise you not to look at the two asopposites of each other. It may happen that the research which started as appliedmight lead to some fundamental and basic research, which expands the body ofknowledge or vice versa. The process followed in both basic and applied researchis systematic and scientific; the difference between them could simply be a matterof context and purpose.
Research studies can also be classified based on the nature of enquiry orobjectives. Based on the nature of enquiry or objectives, research can be of thefollowing types.
Exploratory research
Conclusive research
1.3.1 Exploratory Research
As the name suggests, exploratory research is used to gain a deeper understandingof the issue or problem that is troubling the decision maker. The idea is to providedirection to subsequent and more structured and rigorous research. The followingare some examples of exploratory research:
Let us say a diet food company wants to find out what kind of snackscustomers like to eat and where they generally buy health food from.
A reality show producer wants to make a show for children. He would liketo know what kind of shows children like to watch.
There is an investment bank that would like to know from its customersabout what kind of help they want from the bank while making theirinvestments.
As can be seen, for the examples above an informal exploratory study wouldbe needed.Exploratory research studies are less structured, more flexible inapproach and sometimes could lead to some testable hypotheses. Exploratorystudies are also conducted to develop the research questionnaire. (These will bediscussed in detail in Unit 3.) The nature of the study being loosely structuredmeans the researcher’s skill in observing and recording all possible informationwill increase the accuracy of the findings.
1.3.2 Conclusive Research
Conclusive research is carried out to test and validate the study hypotheses. Incontrast to exploratory research, these studies are more structured and definite.The variables and constructs in the research are clearly defined. For example,finding customer satisfaction levels of heavy consumers of different pizzas in thePizza Hut menu. Now, this needs clear definition of customer satisfaction; secondly,how we will identify heavy consumers. The timeframe of the study and respondent
Introduction to Research
NOTES
Self-Instructional6 Material
selection are more formal and representative. The emphasis on reliability and validityof the research findings are all the more significant, as the results might need to beimplemented.
Based on the nature of investigation required, conclusive research can furtherbe divided into the following types:
Descriptive research
Causal research
Descriptive research
The main goal of descriptive research is to describe the data and characteristicsabout what is being studied. The annual census carried out by the Government ofIndia is an example of descriptive research. The census describes the number ofpeople living in a particular area. It also gives other related data about them. It iscontemporary and time-bound. Some more examples of descriptive research areas follows:
A study to distinguish between the characteristics of the customers whobuy normal petrol and those who buy premium petrol.
A study to find out the level of involvement of middle level versus seniorlevel managers in a company’s stock-related decisions
As study on the organizational climate in different organizations.
All the above research studies are conducted to test specific hypothesesand trends. For example we might hypotheses that the level of involvement ofsenior level managers is higher than middle level managers in stock-related decisions.They are more structured and require a formal, specific and systematic approachto sampling, collecting information and testing the data to verify the researchhypotheses.
Causal research
Causal research studies explore the effect of one thing on another and morespecifically, the effect of one variable on another. For example, if a fast-food outletcurrently sells vegetarian fare, what will be the impact on sales if the price of thevegetarian food is increased by 10 per cent. Causal research studies are highlystructured and require a rigid sequential approach to sampling, data collection anddata analysis. This kind of research, like research in pure sciences, requiresexperimentation to establish causality. In majority of the situations, it is quantitativein nature and requires statistical testing of the information collected.
Other types of research
Diagnostic research: It is just like descriptive research but with a differentfocus. It is aimed towards in depth approaches to reach the basic casualrelations of a problem and possible solutions for it. Prior knowledge of the

NOTES
Self-InstructionalMaterial 7
Introduction to Researchproblem is required for this type of research. Problem formulation, definingthe population correctly for study purposes, proper methods for collectingaccurate information, correct measurement of variables, statistical analysisand tests of significance are essential in diagnostic research.
Historical: Historical research studies the social effects of the past thatmay have given rise to current situations, i.e., past incidents are used toanalyse the present as well as the future conditions. The study of the currentstate of Indian labour based on past labour union movements in the Indianeconomy to formulate the Indian Labour Policy is an example of this typeof research.
Formulative: It helps examine a problem with suitable hypothesis. Thisresearch, on social science, is mainly significant for clarifying concepts andinnovations for further researches. The researchers are mainly concernedwith the principles of developing hypothesis and testing with statistical tools.
Experimental: The experimental type of research enables a person tocalculate the findings, employ the statistical and mathematical devices andmeasure the results thus quantified.
Ex post facto: This type of research is the same as experimental research,which is conducted to deal with the situations that occur in or around anorganization. Examples of such a research are market failure of anorganization's product being researched later and research into the causesfor a landslide in the country.
Case study: This method undertakes intensive research that requires athorough study of a particular chapter.
Cross-sectional Research: This type of research is undertaken after datais gathered once, during a period of days, weeks or months. Many cross-sectional studies are exploratory or descriptive in purpose. They are designedto look at how things are now, without any sense of whether there is ahistory or trend at work.
Action research: It refers to research that improves the quality of action inthe social world.
Policy-Oriented Research: Reports employing this type of research focuson the question 'How can problem 'X' be solved or prevented?'
Check Your Progress
3. Which type of researched is especially carried out to test and validate thestudy hypotheses?
4. Census is an example of which type of research?
Introduction to Research
NOTES
Self-Instructional8 Material
1.4 THE PROCESS OF RESEARCH
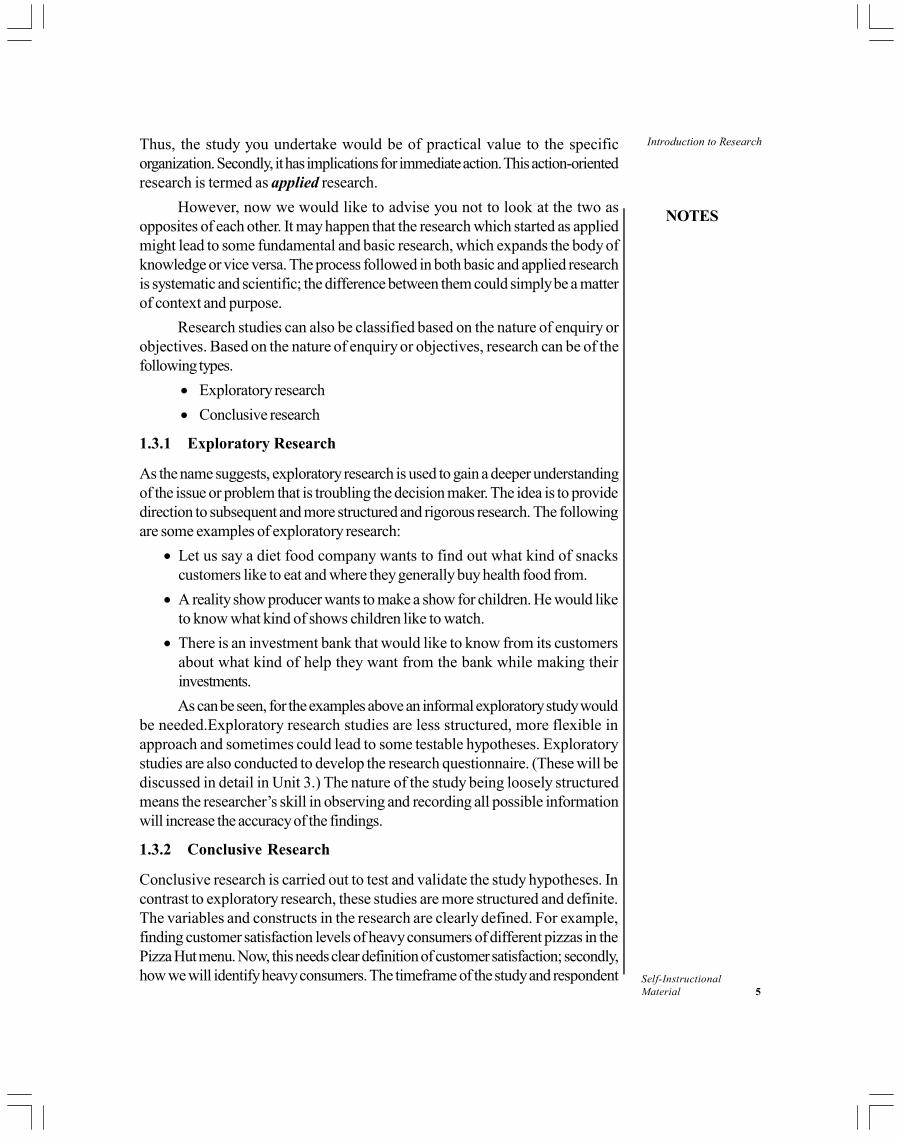
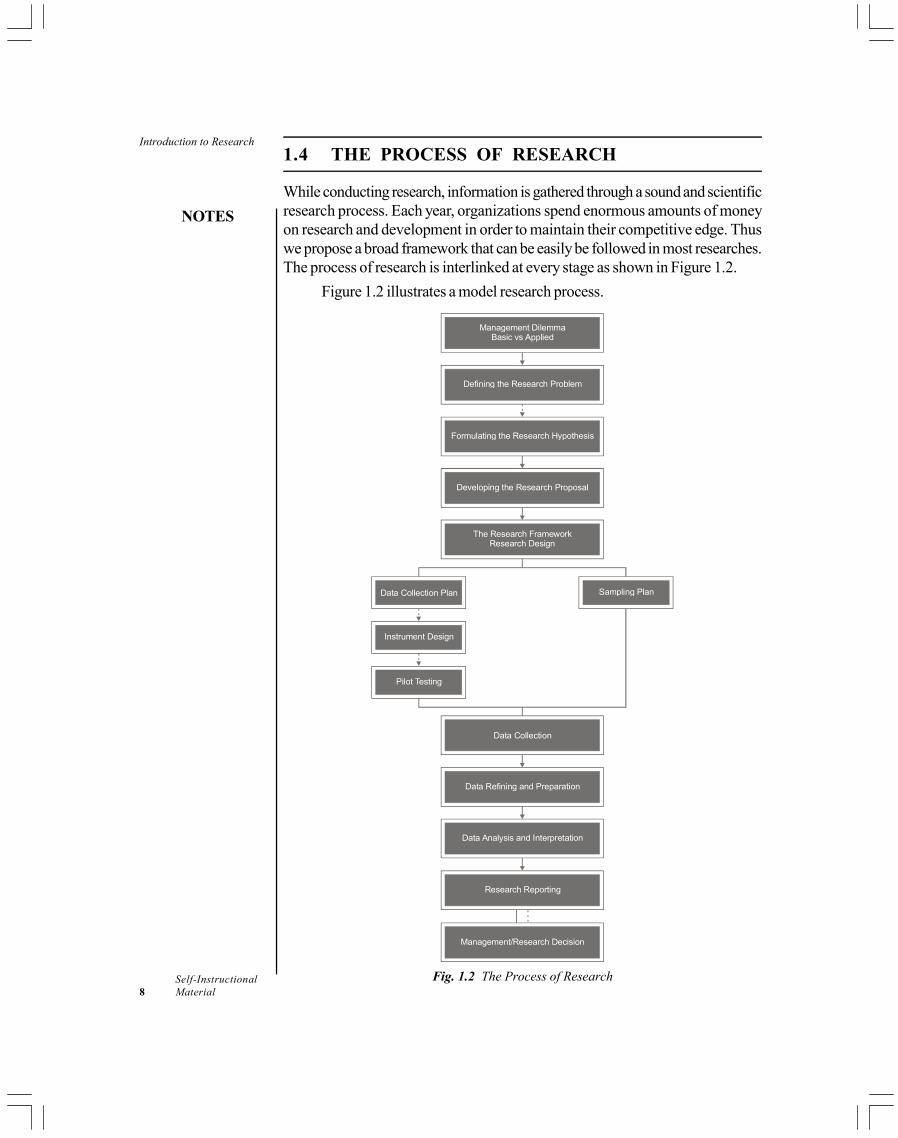
While conducting research, information is gathered through a sound and scientificresearch process. Each year, organizations spend enormous amounts of moneyon research and development in order to maintain their competitive edge. Thuswe propose a broad framework that can be easily be followed in most researches.The process of research is interlinked at every stage as shown in Figure 1.2.
Figure 1.2 illustrates a model research process.
Management DilemmaBasic vs Applied
Defining the Research Problem
Formulating the Research Hypothesis
Developing the Research Proposal
The Research FrameworkResearch Design
Instrument Design
Pilot Testing
Data Collection Plan Sampling Plan
Data Collection
Data Refining and Preparation
Data Analysis and Interpretation
Research Reporting
Management/Research Decision
Fig. 1.2 The Process of Research
NOTES
Self-InstructionalMaterial 9
Introduction to ResearchIn the following paragraphs we will briefly discuss the steps that, in general,any research study might follow:
The management dilemma
Any research starts with the need and desire to know more. This is essentially themanagement dilemma. It could be the researcher himself or herself or it could be abusiness manager who gets the study by done by a researcher. The need might bepurely academic (basic or fundamental research) or there might be an immediatebusiness decision that requires an effective and workable solution (appliedresearch).
Defining the research problem
This is the first and the most critical step of the research journey. For example, asoft drink manufacturer who is making and selling aerated drinks now wants toexpand his business. He wants to know whether moving into bottled water wouldbe a better idea or he should look at fruit juice based drinks. Thus, a comprehensiveand detailed survey of the bottled water as well as the fruit juice market will haveto be done. He will also have to decide whether he wants to know consumeracceptance of a new drink. Thus, there has to be complete clarity in the mind ofthe researcher regarding the information he must collect.
Formulating the research hypotheses
In the model, we have drawn broken lines to link defining the research problemstage to the hypotheses formulation stage. The reason is that every research studymight not always begin with a hypothesis; in fact, the task of the study might be tocollect detailed data that might lead to, at the end of the study, some indicativehypotheses to be tested in subsequent research. For example, while studying thelifestyle and eating-out behavior of consumers at Pizza Hut, one may find that theyoung student group consume more pizzas. This may lead to a hypotheses thatyoung consumers consume more pizzas than older consumers.
Hypothesis is, in fact, the assumptions about the expected results of theresearch. For example, in the above example of work-life balance among womenprofessionals, we might start with a hypothesis that higher the work-family conflict,higher is the intention to leave the job. We will discuss the conversion of the definedproblem into working hypotheses in Unit 2.
Developing the research proposal
Once the management dilemma has been converted into a defined problem and aworking hypothesis, the next step is to develop a plan of investigation. This iscalled the research proposal. The reason for its placement before the other stagesis that before you begin the actual research study in order to answer the researchquestion you need to spell out the research problem, the scope and the objectivesof the study and the operational plan for achieving this. The proposal is a flexible
Introduction to Research
NOTES
Self-Instructional10 Material
contract about the proposed methodology and once it is made and accepted, theresearch is ready to begin. The formulation of a research proposal, its types andpurpose will be explained in the next unit.
Research design formulation
Based on the orientation of the research, i.e., exploratory, descriptive or causal, theresearcher has a number of techniques for addressing the stated objectives. Theseare termed in research as research designs. The main task of the design is to explainhow the research problem will be investigated. There are different kinds of designsavailable to you while doing a research. These will be discussed in detail in Unit 3.
Sampling design
It is not always possible to study the entire population. Thus, one goes aboutstudying a small and representative sub-group of the population. This sub-group isreferred to as the sample of the study. There are different techniques available forselecting the group based on certain assumptions. The most important criteria forthis selection would be the representativeness of the sample selected from thepopulation under study.
Two categories of sampling designs available to the researcher are probabilityand non-probability. In the probability sampling designs, the population under studyis finite and one can calculate the probability of a person being selected. On theother hand, in non-probability designs one cannot calculate the probability ofselection. The selection of one or the other depends on the nature of the research,degree of accuracy required (the probability sampling techniques reveal moreaccurate results) and the time and financial resources available for the research.Another important decision the researcher needs to take is to determine the bestsample size to be selected in order to obtain results that can be considered asrepresentative of the population under study. We will learn more about this in unit7.
Planning and collecting the data for research
In the model (Figure 1.2), we have placed planning and collecting data forresearch as proceeding simultaneously with the sampling plan. The reason forthis is that the sampling plan helps in identifying the group to be studied and thedata collection plan helps in obtaining information from the specified population.The data collection methods may be classified into secondary and primary datamethods. Primary data is original and collected first hand for the problem understudy. There are a number of primary data methods available to the researcherlike interviews, focus group discussions, personal/telephonic interviews/mailsurveys and questionnaires.
Secondary data is information that has been collected and compiled earlierfor some other problem or purpose. For example, company records, magazinearticles, expert opinion surveys, sales records, customer feedback, government
NOTES
Self-InstructionalMaterial 11
Introduction to Researchdata and previous researches done on the topic of interest. This step in the researchprocess requires careful and rigorous quality checks to ensure the reliability andvalidity of the data collected.
Data refining and preparation for analysis
Once the data is collected, it must be refined and processed in order to answer theresearch question(s) and test the formulated hypotheses (if any). This stage requiresediting of the data for any omissions and irregularities. Then it is coded and tabulatedin a manner in which it can be subjected to statistical testing. In case of data that issubjective and qualitative, the information collected has to be post coded i.e. afterthe data has been collected.
Data analysis and interpretation of findings
This stage requires selecting the analytical tools for testing the obtained information.There are a number of statistical techniques available to the researcher—frequencyanalysis, percentages, arithmetic mean, t-test and chi-square analysis. These willbe explained in the later units.
Once the data has been analysed and summarized, linking the results withthe research objectives and stating clearly the implications of the study is the mostimportant task of the researcher.
The research report and implications for the manager’s dilemma
The report preparation, from the problem formulation to the interpretation, is thefinal part of the research process. As we stated earlier, business researchis directed towards answering the question ‘what are the implications for thecorporate world?’ Thus, in this step, the researcher’s expertise in analysing,interpreting and recommending, is very important. This report has to give completedetails about everything that was done right from problem formulation, to themethodology followed to the conclusions inding of the study. The nature of thereport may be different depending on whether it is meant for a business person oris an academic report. This will be discussed in detail in Unit 13.
Check Your Progress
5. What is another name for the process of ‘developing a plan of investigation’?
6. List some of the primary data methods available to the researcher.
1.5 RESEARCH APPLICATIONS IN SOCIAL ANDBUSINESS SCIENCES
Research is a crucial element in the area of business. It helps the decision maker toidentify new opportunities for business growth. Research provides information

Introduction to Research
NOTES
Self-Instructional12 Material
about various aspects of business, like product life cycle, consumer behaviour,market opportunities and threats, technological changes, social changes, economicchanges, environmental changes, and so on, which are important for any decisionmaker to run the business smoothly.
Research is crucial in the following areas of business:
Marketing function - Research is the lifeline in the field of marketing,where it is carried out on a vast array of topics and is conducted both in-house by the organization itself and outsourced to external agencies. Thiscould be related to the 4 Ps- product, price, place and promotions.
Personnel and human resource management - Human resources (HR)and organizational behaviour is an area which involves basic or fundamentalresearch as a lot of academic, macro-level research may be adapted andimplemented by organizations into their policies and programmes.
Financial and accounting research - The area of financial and accountingresearch is quite vast and includes asset pricing, corporate finance and capitalmarkets, market-based accounting research, modelling and forecasting involatility, risk, etc.
Production and operations management - This area of management isone in which research results are implemented, taking on huge cost andprocess implications. Research in this area relates to operation planning,demand forecasting, process planning, project management, supply chainmanagement, quality assurance and management.
Research in social science includes an in-depth study and evaluation ofhuman behavior by using scientific methods in either quantitative or qualitativemanner. As social science is concerned with the study of society and human behavior,it is important for a business organization in terms of understanding their customers,their taste, needs, preferences, lifestyle and their behaviour. New products orservices are unlikely to succeed without proper consumer studies and survey.
1.6 FEATURES OF A GOOD RESEARCH STUDY
In the above sections we learnt that research studies can vary from the looselystructured method based on observations and impressions to the strictly scientificand quantifiable methods. However, for a research to be of value, it must possessthe following characteristics:
(a) It must have a clearly stated purpose. This not only refers to the objectiveof the study, but also precise definition of the scope and domain of thestudy.
(b) It must follow a systematic and detailed plan for investigating the researchproblem. The systematic conduction also requires that all the steps in theresearch process are interlinked and follow a sequence.
NOTES
Self-InstructionalMaterial 13
Introduction to Research(c) The selection of techniques of collecting information, sampling plans anddata analysis techniques must be supported by a logical justification aboutwhy the methods were selected.
(d) The results of the study must be presented in an unbiased, objective andneutral manner.
(e) The research at every stage and at any cost must maintain the highest ethicalstandards.
(f) And lastly, the reason for a structured, ethical, justifiable and objectiveapproach is the fact that the research carried out by you must be replicable.This means that the process followed by you must be ‘reliable’, i.e., in casethe study is carried out under similar conditions it should be able to revealsimilar results.
Check Your Progress
7. What are demand forecasting, and quality assurance and management apart of?
8. What does the replicability of a research mean?
1.7 ANSWERS TO CHECK YOUR PROGRESSQUESTIONS
1. The most important and difficult task of a researcher is to be as objectiveand neutral as possible.
2. Research always requires a structured and sequential method of enquiry.
3. Conclusive research is especially carried out to test and validate the studyhypotheses.
4. Census is an example of descriptive research.
5. Research proposal is another name for the process of ‘developing a plan ofinvestigation.’
6. Some of the primary data methods available to the researcher includeinterviews, focus group discussions, personal/telephonic interviews/mailsurveys and questionnaires.
7. The demand forecasting, and quality assurance and management are a partof production and operations management.
8. The replicability of a research means that the process followed by you mustbe ‘reliable’, i.e., in case the study is carried out under similar conditions itshould be able to reveal similar results.

Introduction to Research
NOTES
Self-Instructional14 Material
1.8 SUMMARY
Research is a tool, of special significance in all areas of management. It canbe defined as an unbiased, structured, and sequential method of enquiry,directed towards a clear implicit or explicit business objective. This enquirymight lead to proving existing postulates or arriving at new theories andmodels.
Research may be done for a purely academic reason of a need to know(fundamental or basic research) or it could be undertaken as it would be ofpractical value to an organization with implications for immediate action(applied research).
Based on the nature of enquiry or the objective, research can be exploratoryor conclusive research.
Conclusive research can be of two types—descriptive or causal studies.
A research study usually follows a structured sequence of steps:
o Developing and defining the research problem
o Formulating the study hypothesis
o Developing the study plan or proposal
o Identifying the research design
o Designing the sampling approach
o Conceptualizing and developing the data collection plan
o Executing data analysis
o Working out data inference and conclusions
o Compiling and preparing the research report
Different kinds of studies are carried out in the area of business manage-ment such as marketing, finance, human resources and operations. Eachhaving their own orientation and approach.
For a research to be recognized as significant, it must follow some basiccriteria – clearly stated purpose; a systematic and detailed plan; logicaljustification for the selection of techniques of collecting information, samplingplans and data analysis techniques; unbiased, objective and neutral results;ethical standards; sequential and replicable.
1.9 KEY WORDS
Applied research: Studies that are related to specific problems and areconducted to find solutions.
Basic research: Studies that are conducted for academic reasons and donot have immediate applicability.

NOTES
Self-InstructionalMaterial 15
Introduction to Research Causal research: These studies need experimentation and study the causeand effect relationship.
Conclusive research: More structured studies conducted to test or validatethe study hypotheses.
Descriptive research: Conclusive studies that describe the phenomena,group or situation under study.
Exploratory research: Loosely structured studies carried to gain a deeperunderstanding about something.
Hypothesis: A tentative assumption made in order to draw out and test itslogical or empirical consequences; the assumptions about the expected resultsof a research.
Postulate: Something taken as true or factual and used as the startingpoint for a course of action.
1.10 SELF ASSESSMENT QUESTIONS ANDEXERCISES
Short-Answer Questions
1. How would you define business research? Illustrate with examples.
2. Distinguish between descriptive and causal research studies.
3. What are the features of a good research study?
Long-Answer Questions
1. What are the different types of researches that can be conducted by aresearcher?
2. Describe in detail the steps to be carried out in a typical research study.
3. Can research be carried out in all areas of business? Explain with examplesabout the kind of studies that can be done.
1.11 FURTHER READINGS
Chawla D and Sondhi N. 2016. Research Methodology: Concepts and Cases,2nd edition. New Delhi: Vikas Publishing House.
Easterby-Smith, M, Thorpe, R and Lowe, A. 2002. Management Research: AnIntroduction, 2nd edn. London: Sage.
Grinnell, Richard Jr (ed.). 1993. Social Work, Research and Evaluation 4th
edn. Itasca, Illinois: F E Peacock Publishers.
Kerlinger, Fred N. 1986. Foundations of Behavioural Research, 3rd edn. NewYork: Holt, Rinehart and Winston.
Research Problem andFormulation of theResearch Hypotheses
NOTES
Self-Instructional16 Material
UNIT 2 RESEARCH PROBLEM ANDFORMULATION OF THERESEARCH HYPOTHESES
Structure
2.0 Introduction2.1 Objectives2.2 Defining the Research Problem2.3 Management Decision Problem vs Management Research Problem2.4 Problem Identification Process2.5 Components of the Research Problem2.6 Formulating the Research Hypotheses
2.6.1 Types of Research Hypotheses2.7 Writing a Research Proposal
2.7.1 Contents of a research proposal2.7.2 Types of Research Proposals
2.8 Answers to Check Your Progress Questions2.9 Summary
2.10 Key Words2.11 Self Assessment Questions and Exercises2.12 Further Readings
2.0 INTRODUCTION
In the last unit, you were introduced to the meaning of research as well its types,process and features. In this unit, we will focus on the research problem and theformulation of the research hypothesis. The most important aspect of the businessresearch method is to identify the ‘what’, i.e., what is the exact research questionto which you are seeking an answer. The second important thing is that the processof arriving at the question should be logical and follow a line of reasoning that canlend itself to scientific enquiry. This reasoning approach needs to be convertedinto a possible research question. And based on the initial study of the researchtopic, you should be able to make certain assumptions which can lend direction tothe study as research hypotheses.
Thus in this unit, we will understand how to identify a problem that can besubjected to research and help us reduce decision risks. This will follow a structuredand logical path to help us arrive at the research problem. Next. we will learn howto convert this research question into research hypotheses. The conduct of aresearch study usually requires that you write the steps you will take to do thestudy in the form of a proposal. We will end the unit by understanding how onewrites a research proposal.

NOTES
Self-InstructionalMaterial 17
Research Problem andFormulation of the
Research Hypotheses2.1 OBJECTIVES
After going through this unit, you will be able to:
Explain the business decision problem
Translate the decision needs into clearly spelt research questions
Describe the method to be followed to arrive at the research questions
List the components of a research problem
Translate the research questions into research hypotheses depending on thenature of research
Prepare a research proposal
2.2 DEFINING THE RESEARCH PROBLEM
The challenge for a business manager is not only to identify and define the decisionproblem; the bigger challenge is to convert the decision into a research problemthat can lead to a scientific enquiry. As Powers et al. (1985) have put it, ‘Potentialresearch questions may occur to us on a regular basis, but the process of formulatingthem in a meaningful way is not at all an easy task’. One needs to narrow down thedecision problem and rephrase it into workable research questions.
Thus, the first and the most important step of the research process is likethe start of a journey, in this instance the research journey, and the identification ofthe problem gives an indication of the expected result . A research problem can bedefined as a gap or uncertainty in the decision makers’ existing body of knowledgewhich inhibits efficient decision making. Sometimes it may so happen that theremight be multiple alternative paths one can take and we will have to select whichof these we would like to consider as the problem to be studied. As Kerlinger(1986) states, ‘If one wants to solve a problem, one must generally know whatthe problem is. It can be said that a large part of the problem lies in knowing whatone is trying to do.’ The defined research problem might be classified as simple orcomplex. Simple problems are those that are easy to understand and the componentsand identified relationships are linear, e.g., the relationship between cigarette smokingand lung cancer. Complex problems on the other hand, deal with the interrelationshipbetween multiple variables, e.g., the impact of social networking sites like Facebookand online shopping sites like Flipkart on consumer purchase behaviour in shopsand markets. The impact might also further differ in terms of males and females.Other influencing factors on the buying behaviour could be a person’s lifestyle,age and education. Complex problems such as these deal with multiple variables.Thus, they require a model or framework to be developed to define the researchapproach.

Research Problem andFormulation of theResearch Hypotheses
NOTES
Self-Instructional18 Material
2.3 MANAGEMENT DECISION PROBLEM VSMANAGEMENT RESEARCH PROBLEM
The problem recognition process starts when the decision maker faces somedifficulty or decision dilemma. Sometimes, this might be related to actual andimmediate difficulties faced by the manager (applied research) or gaps experiencedin the existing body of knowledge (basic research). The broad decision problemhas to be narrowed down to information-oriented problem, which focuses on thedata or information required to arrive at any meaningful conclusion. Given in Table2.1 is a set of decision problems and the subsequent research problems that mightaddress them. Please remember these are only indicative questions and there couldbe many more ways of arriving at an answer to the decision problem. Secondly, itis not essential that the decision maker will always go in for research as he mayarrive at a decision without research also. Sometimes, the company might have somuch experience in the business that they feel no additional information can beobtained through research. As stated earlier in Unit 1, research is conducted whenthe decision maker wants to reduce some risk and uncertainity while taking adecision.
Table 2.1 Converting Management Decision Probleminto Research Problem
DECISION PROBLEM RESEARCH PROBLEM*
1. What should be done to increase the consumers of organic food products in the domestic market?
2. How to reduce turnover rates in the
BPO sector? 3. Can the housing and real estate growth
be accelerated?
1. What is the awareness and purchase intention of health conscious consumers for organic food products?
2. What is the impact of shift duties on work exhaustion and turnover intentions of the BPO employees?
3. What is the current investment in real estate and housing? Can the demand in the sector be forecasted for the next six months?
* This requires you to follow a sequence of steps as specified in Figure 2.3
Thus, what we clearly see is that the management problem is a difficultyfaced by the decision maker and by itself cannot be tested. To do this it must bestated in a form that can lend itself to a scientific enquiry. In case the decisionmaker is a business manager, the management research problem requires that welook for an answer to to the problem faced by the manager, as in the aboveexample of how to reduce the turnover rate in a BPO company. This problem hasto be translated to a simpler form of research question. And as said earlier, therecan be more than one research problem that can help the manager in taking adecision. It depends on the researcher how he looks at it. For example, he maysay that the research problem is:
What are the management policies in other BPO companies?
Why do the employees leave the company? What is the problemarea?
NOTES
Self-InstructionalMaterial 19
Research Problem andFormulation of the
Research Hypotheses
Are the shift duties creating a problem of work family conflict whichis why they leave?
How can the company work on employee engagement so that hestays with the company?
Thus, as you can see we can have many questions. Finally, the researchproblem you think is likely to give the possible solution is the one you decide totake as your research problem.
Check Your Progress
1. The management decision problem must be reduced to which type ofproblem?
2. Which type of relationships are tested under simple research problems?
3. Which type of problem is faced by the decision maker at the start of theproblem recognition process?
2.4 PROBLEM IDENTIFICATION PROCESS
The process of identifying the research problem involves the following steps:
1. Management decision problem
The entire process begins with the identification of the difficulty encountered bythe business manager/researcher. The manager might decide to conduct the studyhimself or gives it to a researcher or a research agency. Thus this step requires thatthere must be absolute clarity about what is the purpose of getting a study done.When the work is to be done by an outsider it is very important that discussion isheld with the business manager.
2. Discussion with subject experts
The next step involves getting the problem in the right perspective throughdiscussions with industry and subject experts. These individuals are knowledgeableabout the industry as well as the organization. They could be found both withinand outside the company. The information on the current and future is obtainedwith the assistance of an interview. Thus, the researcher must have a predeterminedset of questions related to the doubts experienced in problem formulation. It shouldbe remembered that the purpose of the interview is simply to gain clarity on theproblem area and not to arrive at any kind of conclusions or solutions to theproblem. For example, for the organic food study,that is mentioned in Table 2.1 asa decision problem, the researcher might decide to go to food experts like doctorsand dieticians to seek their opinion. This data should, in practice, be supportedwith secondary data in the form of theory as well as organizational facts.

Research Problem andFormulation of theResearch Hypotheses
NOTES
Self-Instructional20 Material
3. Review of existing literature
A literature review is a comprehensive collection of the information obtained frompublished and unpublished sources of data in the specific area of interest to theresearcher. This may include journals, newspapers, magazines, reports, governmentpublications, and also computerized databases. The advantage of the survey isthat it provides different perspectives and methodologies to be used to investigatethe problem, as well as identify possible variables that may be studied. Second,the survey might also show that our research problem has already been investigatedand this might be useful in solving the decision dilemma. It also helps in narrowingthe scope of the study into a research problem.
Once the data has been collected, the researcher must write it down in his/her own words and clearly show how this is linked to the research topic understudy. The logical and theoretical framework developed on the basis of past studiesshould be able to provide the foundation for the problem statement.
The reporting should cite the author and the year of the study clearly. Thereare several internationally accepted forms of citing references and quoting frompublished sources. The Publication Manual of the American PsychologicalAssociation (sixth edition, 2009) and the Chicago Manual of Style (seventeenthedition, 2017) are academically accepted as referencing styles in management.
4. Organizational analysis
Another significant source for deriving the research problem is the industry andorganizational data. In case the researcher/investigator is the manager himself/herself, the data might be easily available. This data needs to include theorganizational demographics—origin and history of the firm; size, assets, nature ofbusiness, location and resources; management philosophy and policies as well asthe detailed organizational structure, with the job descriptions. It is to beremembered here that the organizational data might not be always essential, forexample in case of basic research, where the nature of study is not companyspecific but general.
5. Qualitative survey
Sometimes the expert interview, secondary data and organizational informationmight not be enough to define the problem. In such a case, a small exploratoryqualitative survey can be done to understand the reason for some . For example,a soap like Dove may be very good in terms of price and quality but very fewpeople in the smaller towns buy it. When we do a secondary data analysis, or talkto experts there seems to be no problem. Then we do a quick round of interviewwith women who come to a kirana store to find out why Dove is not bought. Andthe women tell us that the same soap is used by the whole family, and husband and
NOTES
Self-InstructionalMaterial 21
Research Problem andFormulation of the
Research Hypotheses
sons do not use Dove as they say this is a soap for women, which is the reasonwhy dove is not bought by them. These surveys thus are done on small samplesand might make use of focus group discussions or interviews with the respondentpopulation to help uncover relevant and current issues which might have a significantbearing on the problem definition.
In the organic food research, focused group discussions with young and oldconsumers revealed the level of awareness about organic food and consumersentiments related to purchase of more expensive but a healthy food product.
6. Management research problem
Once the audit process of secondary review and interviews and survey is over, theresearcher is ready to focus and define the issues of concern, that need to beinvestigated further, in the form of an unambiguous and clearly defined researchproblem. Here, it is important to remember that simply using the word ‘problem’does not mean that there is something wrong that has to be corrected, it simplyindicates the gaps in information or knowledge base available to the researcher.These might be the reason for his inability to take the correct decision. Second,identifying all possible dimensions of the problem might be a monumental andimpossible task for the researcher. For example, the lack of sales of a newlylaunched product could be due to consumer perceptions about the product,ineffective supply chain, gaps in the distribution network, competitor offerings oradvertising ineffectiveness. It is the researcher who has to identify and then refinethe most probable cause of the problem and formalize it as the research problem.This would be achieved through the five preliminary investigative steps indicatedabove. Once done the research problem has to be clearly defined in terms ofcertain components This will be discussed in the next section.
7. Theoretical foundation and model building
Having identified and defined the variables under study, the next step is to try andform a theoretical framework. It can be best understood as a schema or networkof the probable relationship between the identified variables. An advantage of themodel is that it clearly shows the expected direction of the relationships betweenthe concepts. There is also an indication of whether the relationship would bepositive or negative.
This step, however, is not mandatory as sometimes the objective of theresearch is to explore the probable variables that might explain the observedphenomena and the outcome of the study helps to finally develop a conceptualmodel.
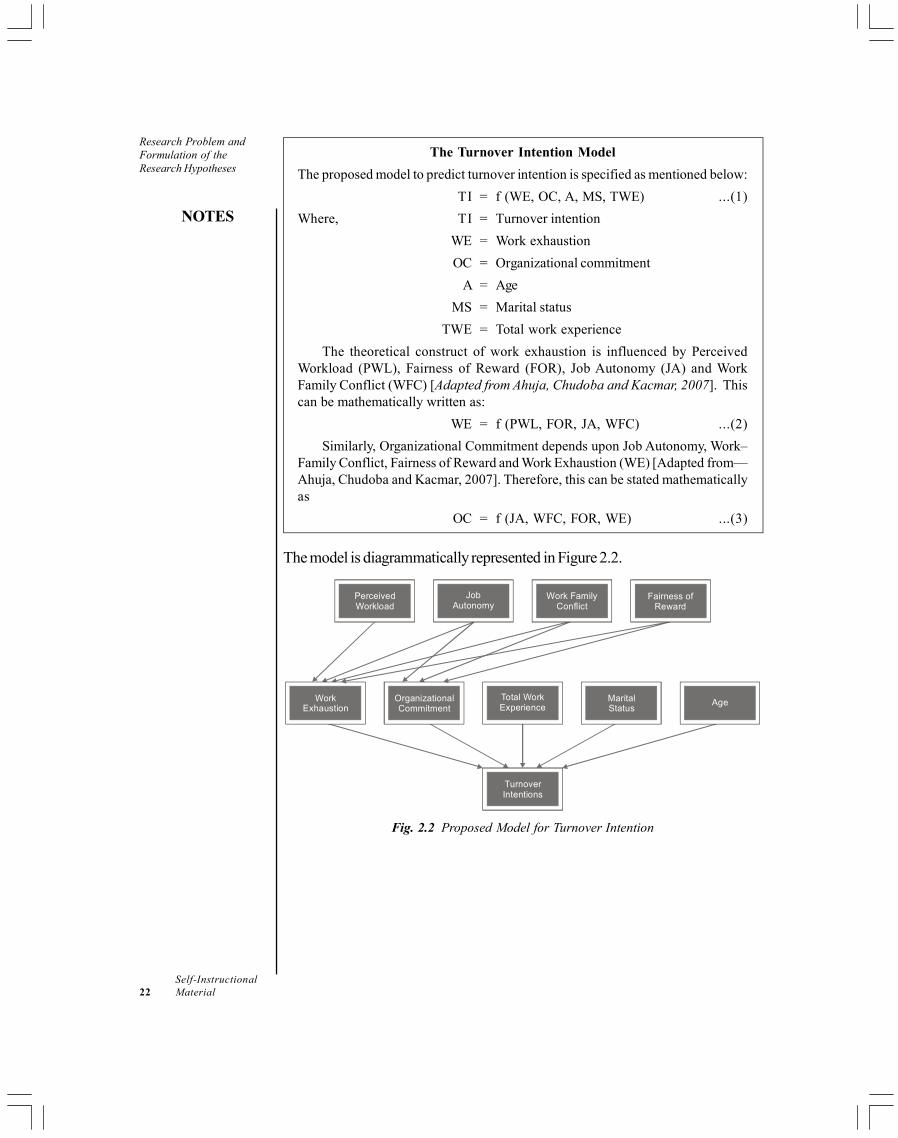
Given below is a predictive model for turnover intentions developed toexplain the high rate of attrition amongst BPO professionals. Once validated, it isof course possible to test it in different contexts and differing respondent population.
Research Problem andFormulation of theResearch Hypotheses
NOTES
Self-Instructional22 Material
The Turnover Intention Model
The proposed model to predict turnover intention is specified as mentioned below:
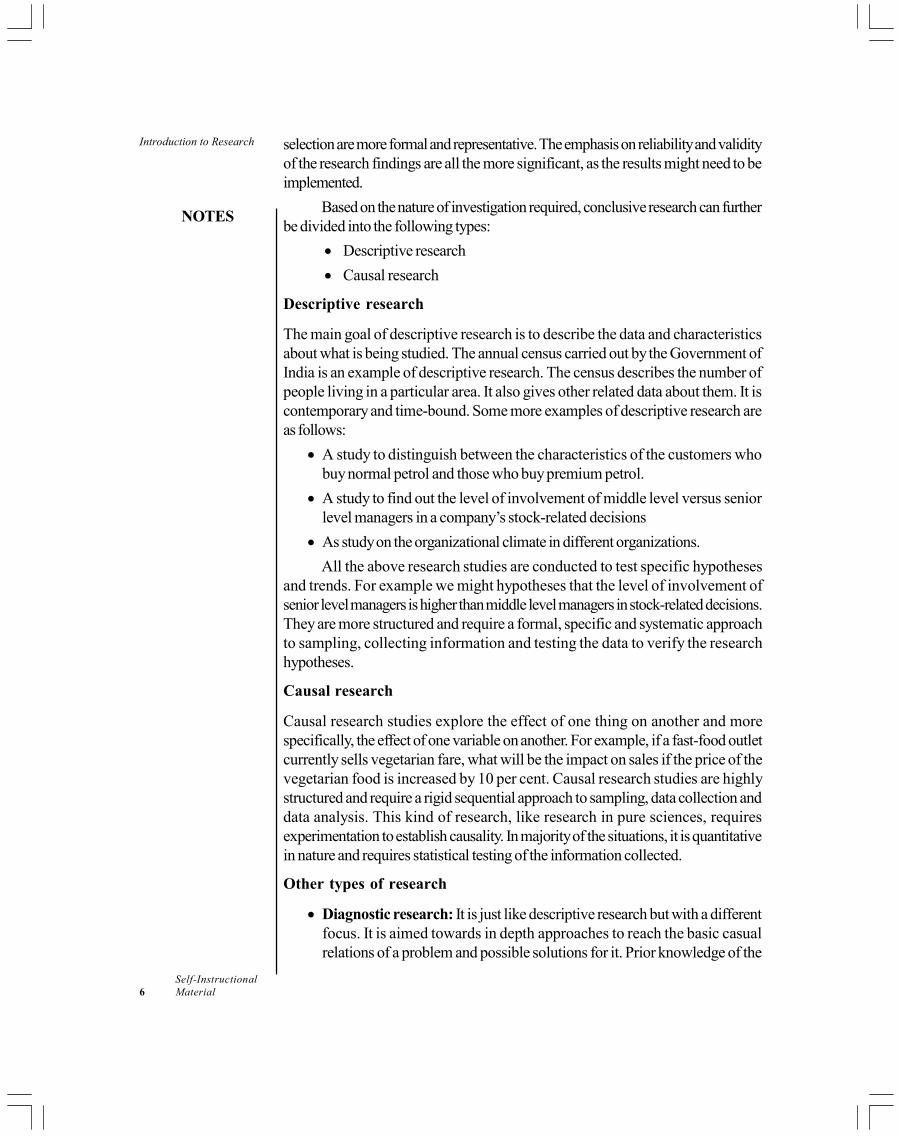
TI = f (WE, OC, A, MS, TWE) ...(1)
Where, TI = Turnover intention
WE = Work exhaustion
OC = Organizational commitment
A = Age
MS = Marital status
TWE = Total work experience
The theoretical construct of work exhaustion is influenced by PerceivedWorkload (PWL), Fairness of Reward (FOR), Job Autonomy (JA) and WorkFamily Conflict (WFC) [Adapted from Ahuja, Chudoba and Kacmar, 2007]. Thiscan be mathematically written as:
WE = f (PWL, FOR, JA, WFC) ...(2)
Similarly, Organizational Commitment depends upon Job Autonomy, Work–Family Conflict, Fairness of Reward and Work Exhaustion (WE) [Adapted from—Ahuja, Chudoba and Kacmar, 2007]. Therefore, this can be stated mathematicallyas
OC = f (JA, WFC, FOR, WE) ...(3)
The model is diagrammatically represented in Figure 2.2.
TurnoverIntentions
WorkExhaustion
OrganizationalCommitment
Total WorkExperience
MaritalStatus
Age
PerceivedWorkload
JobAutonomy
Work FamilyConflict
Fairness ofReward
Fig. 2.2 Proposed Model for Turnover Intention

NOTES
Self-InstructionalMaterial 23
Research Problem andFormulation of the
Research Hypotheses
The formulated framework has been explained verbally as a verbal model.The flowchart of the relationship between variables has been demonstrated ingraphical form as a graphical model and the same have been also reduced tothree mathematical equations specifying the relationship between the same in theform of a mathematical model. What needs to be understood is that all threeare representatives of the same framework.
8. Statement of research objectives
Next, the research question(s) that were formulated need to be broken down astasks or objectives that need to be met in order to answer the research question.
This section makes active use of verbs such as ‘to find out’, ‘to determine’,‘to establish’, and ‘to measure’ so as to spell out the objectives of the study. Incertain cases, the main objectives of the study might need to be broken down intosub-objectives which clearly state the tasks to be accomplished.
In the organic food research, the objectives and sub-objectives of the studywere as follows:
1. To study the existing organic market:
To categorize the organic products available in Delhi into grain,snacks, herbs, pickles, squashes and fruits and vegetables;
To estimate the demand pattern of various products for each ofthe above categories;
To understand the marketing strategies adopted by differentplayers for promoting and propagating organic products.
2. Consumer diagnostic research:
To study the existing consumer profile, i.e., perception andattitudes towards organic products and purchase andconsumption patterns;
To study the potential customers in terms of consumer segments,level of awareness, perception and attitude towards health andorganic products;
3. Opinion survey: To assess the awareness and opinions of experts suchas doctors, dieticians and chefs in order to understand organicconsumption.

Research Problem andFormulation of theResearch Hypotheses
NOTES
Self-Instructional24 Material
Figure 2.3 summarizes the problem identification process.
Management Research Problem/Question
Management Decision Problem
Research Framework/Analytical Model
Formulation of Research Hypothesis
Statement of Research Objectives
Fig. 2.3 Problem Identification Process
2.5 COMPONENTS OF THE RESEARCHPROBLEM
To address the problems of clarity and focus, we need to understand thecomponents of a well defined problem. These are:
The unit of analysis
The researcher must specify in the problem statement the individual(s) from whomthe research information is to be collected and on whom the research results areapplicable. This could be the entire organization, departments, groups or individuals.
Research variables
The research problem also requires identification of the key variables under study.A variable is any concept that varies and we can assign numerals or values. Avariable may be dichotomous in nature, that is, it can possess only two values suchas male-female or customer–non-customer. Values that can only fit into prescribednumber of categories are continuous variables, for example, very important (1) tovery unimportant (5). There are still others that possess an indefinite set, e.g., age,income and production data.
NOTES
Self-InstructionalMaterial 25
Research Problem andFormulation of the
Research Hypotheses
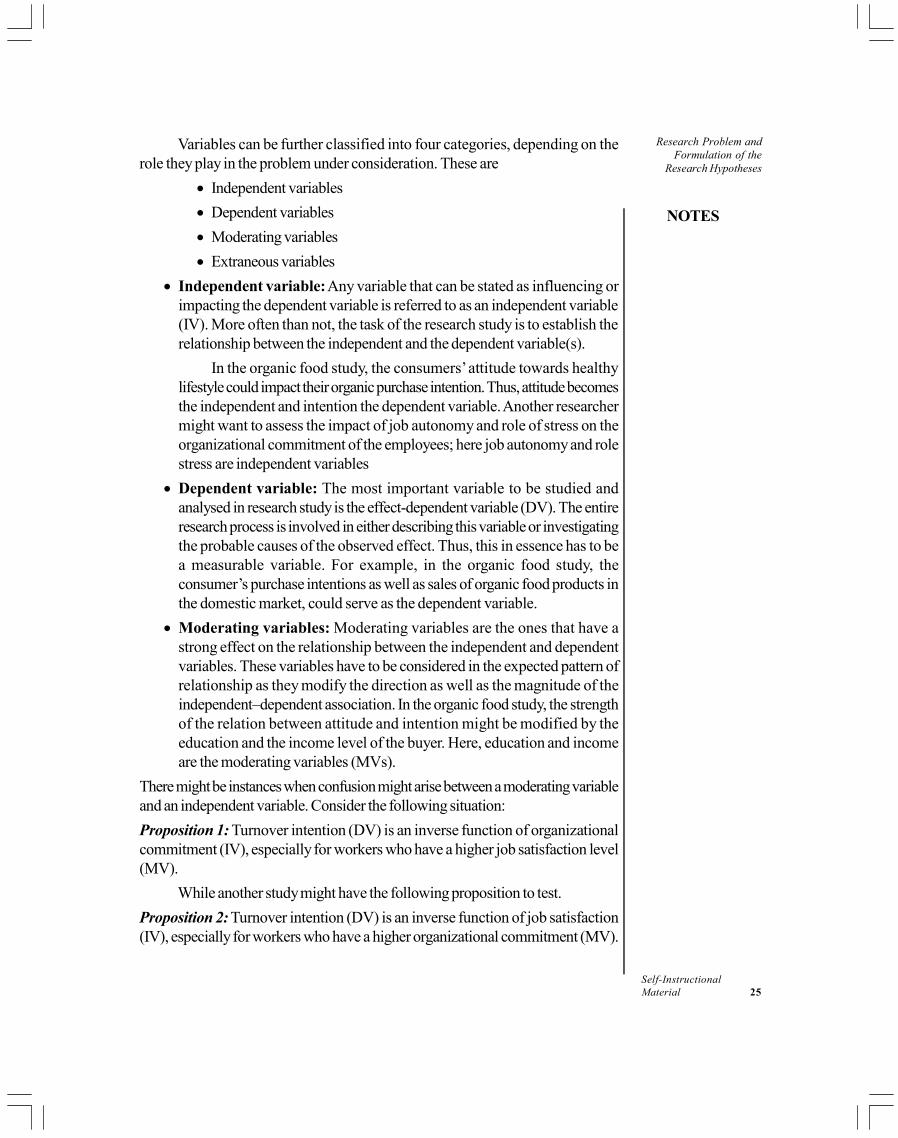
Variables can be further classified into four categories, depending on therole they play in the problem under consideration. These are
Independent variables
Dependent variables
Moderating variables
Extraneous variables
Independent variable: Any variable that can be stated as influencing orimpacting the dependent variable is referred to as an independent variable(IV). More often than not, the task of the research study is to establish therelationship between the independent and the dependent variable(s).
In the organic food study, the consumers’ attitude towards healthylifestyle could impact their organic purchase intention. Thus, attitude becomesthe independent and intention the dependent variable. Another researchermight want to assess the impact of job autonomy and role of stress on theorganizational commitment of the employees; here job autonomy and rolestress are independent variables
Dependent variable: The most important variable to be studied andanalysed in research study is the effect-dependent variable (DV). The entireresearch process is involved in either describing this variable or investigatingthe probable causes of the observed effect. Thus, this in essence has to bea measurable variable. For example, in the organic food study, theconsumer’s purchase intentions as well as sales of organic food products inthe domestic market, could serve as the dependent variable.
Moderating variables: Moderating variables are the ones that have astrong effect on the relationship between the independent and dependentvariables. These variables have to be considered in the expected pattern ofrelationship as they modify the direction as well as the magnitude of theindependent–dependent association. In the organic food study, the strengthof the relation between attitude and intention might be modified by theeducation and the income level of the buyer. Here, education and incomeare the moderating variables (MVs).
There might be instances when confusion might arise between a moderating variableand an independent variable. Consider the following situation:
Proposition 1: Turnover intention (DV) is an inverse function of organizationalcommitment (IV), especially for workers who have a higher job satisfaction level(MV).
While another study might have the following proposition to test.
Proposition 2: Turnover intention (DV) is an inverse function of job satisfaction(IV), especially for workers who have a higher organizational commitment (MV).
Research Problem andFormulation of theResearch Hypotheses
NOTES
Self-Instructional26 Material
Thus, the two propositions are studying the relation between the same threevariables. However the decision to classify one as independent and the other asmoderating depends on the research interest of the decision maker.
Extraneous variables: Besides the moderating variables, there might still exist anumber of extraneous variables (EVs) which could affect the defined relationshipbut might have been excluded from the study. These would most often account forthe chance variations observed in the research investigation. They might not heavilyimpact the direction of the findings. However, in case the effect is substantial, theresearcher might try to block their effect by using an experimental and a controlgroup (This concept will be discussed later in Unit 3).
At this stage, we can clearly distinguish between the different kinds ofvariables discussed above. An independent variable is the most important causewhich can explain the variance in the dependent variable. The moderating variableis a contributing variable which might affect the relationship between the independentand the dependent variable. The extraneous variables are outside the domain ofthe study and yet may also affect the dependent variable.
Check Your Progress
4. Name some of the academically accepted referencing styles in management.
5. State the advantage of the developing a theoretical framework.
6. What is another name for causal variable?
7. Which variable can affect the relationship between the independent andthe dependent variable?
2.6 FORMULATING THE RESEARCHHYPOTHESES
The problem identification process ends in the hypotheses formulation stage. Anyassumption that the researcher makes on the probable direction of the results thatmight be obtained on completion of the research process is termed as a hypothesis.Unlike the research problem that generally takes on a question form, the hypothesesare always in a sentence form. The statements thus made can then be empiricallytested. Kerlinger (1986) defines a hypothesis as ‘…a conjectural statement of therelationship between two or more variables.’ According to Grinnell (1993), ‘Ahypotheses is written in such a way that it can be proven or disproven by valid andreliable data—it is in order to obtain these data that we perform our study’.
While designing any hypotheses, there are a few criteria that the researchermust fulfill. These are:
A hypothesis must be formulated in simple, clear, and declarative form.A broad hypothesis might not be empirically testable. Thus, it might be
NOTES
Self-InstructionalMaterial 27
Research Problem andFormulation of the
Research Hypotheses
advisable to make the hypothesis unidimensional, and to be testing onlyone relationship between only two variables at a time.
o Consumer liking for the electronic advertisement for the new diet drinkwill have positive impact on brand awareness of the drink.
o High organizational commitment will lead to lower turnover intention.
A hypothesis must be measurable and quantifiable.
A hypothesis is a conjectural statement based on the existing literatureand theories about the topic and not based on the gut feel of theresearcher.
The validation of the hypothesis would necessarily involve testing thestatistical significance of the hypothesized relation.
2.6.1 Types of Research Hypotheses
The formulated hypothesis could be of two types:
Descriptive hypothesis: This is simply a statement about the magnitude, trendor behaviour of a population under study. Based on past records, the researchermakes some presumptions about the variable under study. For example:
Students from the pure science background score 90–95 per cent on acourse on quantitative methods.
The current advertisement for the diet drink will have a 20–25 per centrecall rate.
The literacy rate in the city of Indore is 100 per cent.
Relational hypothesis: These are the typical kind of hypotheses which state theexpected relationship between two variables. While stating the relation if theresearcher makes use of words such as increase, decrease, less than or morethan, the hypothesis is stated to be directional or one-tailed hypothesis.
For example,
Higher the likeability of the advertisement, higher is the recall rate.
Higher the work exhaustion experienced by the BPO professional, higher isthe turnover intention of the person.
However, sometimes the researcher might not have reasonable supportivedata to hypothesize the expected direction of the relationship. In this case he orshe would leave the hypothesis as non-directional or two-tailed.
For example,
There is a relation between quality of working life and job satisfactionexperienced by employees.
Ban on smoking has an impact on cigarette sales.
Anxiety is related to performance.
Research Problem andFormulation of theResearch Hypotheses
NOTES
Self-Instructional28 Material
The hypotheses discussed in this section are in a verbal sentence form. Inlater sections, we will learn that it needs to be reduced to a statistical form for anydata analysis to be done. The nature and formulation of the statistical hypotheseswill be discussed in Unit 10.
2.7 WRITING A RESEARCH PROPOSAL
We have learnt that research always begins with a purpose. Either this is theresearcher’s own pursuit, or it is carried out to address and answer a specificmanagerial question and arrive at a solution. This clear statement of purpose guidesthe research process and must be converted into a plan for the study. Thisframework or plan is termed as the research proposal. A research proposal is aformal document that presents the research objectives, design of achieving theseobjectives and the expected outcomes/deliverables of the study.
This step is essential both for academic and corporate research, as it clearlyestablishes the research process to be followed to address the research questions.In a business or corporate setting, this step is often preceded by a PR (ProposalRequest). Here the manager or the corporate spells out his decision problem andrequests the potential suppliers of research to work out a research plan/proposalto address the stated issues.
Another advantage of a formal proposal is that sometimes the manager maynot be able to clearly tell his problem or the researcher might not be able tounderstand and convert the decision into a workable research problem. Theresearcher lists the objectives of the study and then together with the manager, isable to review whether or not the listed objectives and direction of the study willbe able to deliver output for arriving at a workable solution.
For the researcher, the document provides an opportunity to identify anyshortfalls in the logic or the assumption of the study. It also helps to monitor themethodical work being carried out to accomplish the project.
2.7.1 Contents of a research proposal
There is a broad framework that most proposals follow. In this section we willbriefly discuss these steps.
Executive summary
This is a broad overview that gives the purpose and objective of the study. In ashort paragraph, the author gives a summary about the management problem/academic concern.
Background of the problem
This is the detailed background of the management problem. It requires a sequentialand systematic build-up to the research questions and also why the study should
NOTES
Self-InstructionalMaterial 29
Research Problem andFormulation of the
Research Hypotheses
be done. The researcher has to be able to demonstrate that there could be anumber of ways in which the management dilemma could be answered. Forexample, a pharmaceutical company develops a new hair growing solution andpackages it in two different types of bottles. They want to know which one peoplewill buy. The product testing could be done internally in the company, or the twosample bottles could be formulated and tested for their acceptability amongst likelyconsumers or retailers keeping the product; or the two types would be developedand test launched and tested for their sales potential. The researcher thus has tospell out all probabilities and then systematically and logically argue for the researchstudy. This section has to be objective and written in simple language, avoidingany metaphors or idioms to dramatize the plan. The logical arguments should speakfor themselves and be able to convince the reader of the need for the study inorder to find probable solutions to the management dilemma.
Problem statement and research objectives
The clear definition of the problem broken down into specific objectives is thenext step. This section is crisp and to the point. It begins by stating the main thrustarea of the study. For example, in the above case, the problem statement couldbe:
To test the acceptability of a spray or capped bottle dispenser for a newhair growing formulation.
The basic objectives of this research would be to:
Determine the comparative preference of the two prototypes amongstcustomers of hair growing solutions.
To conduct a sample usage test of both the bottles with the identifiedpopulation.
To assess the ease of use for the bottles amongst the respondents.
To prepare a comparative analysis of the advantages and problemsassociated with each bottle, on the basis of the sample usage test.
To prepare a detailed report on the basis of the findings.
If the study is addressed towards testing some assumptions in the form ofhypotheses, they have to be clearly stated in this section.
Research design
This is the working section of the proposal as it needs to indicate the logical andsystematic approach intended to be followed in order to achieve the listedobjectives. This would include specifying the population to be studied, the samplingprocess and plan, sample size and selection. It also details the information areas ofthe study and the probable sources of data, i.e., the data collection methods. Incase the process has to include an instrument design, then the intended approachneeds to be detailed here. A note of caution has to be given here: this is not a
Research Problem andFormulation of theResearch Hypotheses
NOTES
Self-Instructional30 Material
simple statement of the sampling and data collection plan; it requires a clear andlogical justification of using the techniques over the methods available for research.
Scheduling the research
The time-bound dissemination of the study with the major phases of the researchhas to be presented. This can be done using the CPM/GANTT/PERT charts.This gives a clear way for monitoring and managing the research task. It also hasthe additional benefit of providing the researcher with a means of spelling out thepayment points linked to the delivered phase outputs.
Results and outcomes of the research
Here the clear terms of contract or expected outcomes of the study have to bespelt out. This is essential even if it is an academic research. The expecteddeliverables need to clearly demonstrate how the researcher intends to link thefindings of the proposed study design to the stated research objectives. Forexample, in the pharmaceutical study, the expected deliverables are:
To identify the usage problems with each bottle type.
To recommend on the basis of the sample study on which bottle to use forpackaging the liquid.
Costing and budgeting the research
In all instances of business research, both internal and external, an estimated costof the study is required.
In addition to these sections, academic research proposals require a sectionon review of related literature; this generally follows the ‘problem background’section. If the proposal is meant to establish the credentials of the research supplier,then detailed qualifications of the research team, including the research experiencein the required or related area, help to aid in the selection of the research proposal.
Sometimes, the research study requires an understanding of some technicalterms or explanations of the constructs under study; in such cases the researcherneeds to attach a glossary of terms in the appendix of the research proposal.
The last section of the proposal is to state the complete details of thereferences used in the formulation of the research proposal. Thus the data sourceand address have to be attached with the formulated document.
2.7.2 Types of Research Proposals
Basically, the proposals formulated could be of three types:
Academic research proposals
Internal organizational proposal
External organizational proposals

NOTES
Self-InstructionalMaterial 31
Research Problem andFormulation of the
Research Hypotheses
Academic research proposal
The academic research proposal might be generated by students or academicianspursuing the study for fundamental academic research. These kind of studies needextensive search of past studies and data on the topic of study. An example is anacademician wanting to explore the viability of different eco-friendly packagingoptions available to a manufacturer.
Internal organizational proposal
The internal organizational proposals are conducted within an organization andare submitted to the management for approval and funding. They are of a highlyfocused nature and are oriented towards solving immediate problems. For example,a pharmaceutical company, which has developed a new hair growing formulationwants to test whether to package the liquid in a spray type or capped dispenser.The solutions are time-driven and applicability is only for this product. These studiesdo not require extensive literature review but do require clearly stated researchobjectives, for the management to assess the nature of work required.
External organizational proposals
External organizational proposals have the base or origin within the company, butthe scope and nature of the study requires a more structured and objective research.For example, if the above stated pharmaceutical company wishes to explore theherbal cosmetic market and wants market analysis and feasibility study conducted;the PR might be spelt out to solicit proposals to address the research question,and execute an outsourced research.
Check Your Progress
8. Name the hypotheses that talks about relation between two or morevariables.
9. What should the researcher do when he/she does not have a reasonablesupportive data to hypothesize the expected direction of the relationship?
10. What is the research proposal preceded by in a corporate or businesssetting?
11. Mention the tools through which the time-bound dissemination of the studywith the major phases of the research is presented.
2.8 ANSWERS TO CHECK YOUR PROGRESSQUESTIONS
1. The management decision problem must be reduced to a research problemwhich can lead to a scientific enquiry.
Research Problem andFormulation of theResearch Hypotheses
NOTES
Self-Instructional32 Material
2. Linear relationships are tested under simple research problems.
3. The types of problem faced by the decision maker at the start of the problemrecognition process are that it might be related to actual and immediatedifficulties faced by the manager or gaps experienced in the existing bodyof knowledge.
4. Some of the academically accepted referencing styles in management arethe Publication Manual of the American Psychological Association (2001)and the Chicago Manual of Style (1993) are academically accepted asreferencing styles in management.
5. The advantage of developing a theoretical framework is that it clearly showsthe expected direction of the relationships between the concepts. There isalso an indication of whether the relationship would be positive or negative.
6. Independent variable is another name for causal variable.
7. Moderating variable is the contributing variable which may affect therelationship between the independent and the dependent variable.
8. The hypotheses that talks about the relation between two or more variablesis known as the relational hypotheses.
9. When the researcher does not have reasonable supportive data to hypothesizethe expected direction of the relationship between variable that he/she shouldleave the hypotheses as non-directional or two-tailed.
10. In a business or corporate setting, the research proposal is preceded by aPR (Proposal Request). Here the manager or the corporate spells out hisdecision problem and requests the potential suppliers of research to workout a research plan/proposal to address the stated issues.
11. The time-bound dissemination of the study with the major phases of theresearch is presented using the CPM/GANTT/PERT charts.
2.9 SUMMARY
The most important step in research is to identify the decision to be madeand how it can be converted into a research problem
The problem definition process is a well-integrated, linked and stepwiseprocess.
There are some essential elements of a typical research problem. Theseinclude the unit of analysis—which is the individual or group that is to bestudied. The second element is a clear definition of the variables understudy.
At this stage, the researcher should be able to specify what is the causal orindependent variable and which is the effect or dependent variable understudy. Also, it is best to acknowledge the effect or presence of any external

NOTES
Self-InstructionalMaterial 33
Research Problem andFormulation of the
Research Hypotheses
variables which might have a contingent effect on the cause and effectrelationship that is to be studied. These can be further classified as moderator,intervening, and extraneous variables.
It is advisable to the researcher to construct a model or theoretical frameworkbased on the process of problem formulation. This is a recommended butnot necessarily an essential step as some studies might be of a nature thatthe intent is to conduct the study and then arrive at a theory or a model.
The problem formulation process ultimately ends as a research hypothesis.
The entire step wise in the shape of a formal plan to be followed is made.This is called the research proposal
There are three different kinds of research proposals available to theresearcher – academic, internal and external.
2.10 KEY WORDS
Dependent variable: The outcome or effect that is being studied in theresearch
Extraneous variable: Any variable that may have an effect on the dependentvariable and is not part of the study.
Hypothesis: Any pre-supposition made about the likely outcome of thestudy.
Independent variable: The variables that might have an effect on thedependent variable
Unit of analysis: The respondent population to be studied
2.11 SELF ASSESSMENT QUESTIONS ANDEXERCISES
Short-Answer Questions
1. How would you distinguish between a management decision problem and amanagement research problem?
2. What is a research hypothesis? Do all researches require hypothesesformulation?
3. What are the steps involved in writing a research proposal. Give examples.
Long-Answer Questions
1. Do all decision problems require research? Explain and illustrate withexamples.

Research Problem andFormulation of theResearch Hypotheses
NOTES
Self-Instructional34 Material
2. Explain the step wise process of problem identification with an example
3. What are the components of a sound research problem? Illustrate withexamples.
4. Explain the different types of hypotheses available for research withexamples.
5. What are the different kinds of research proposals that can be formulated?
2.12 FURTHER READINGS
Chawla D and Sondhi N. 2016. Research Methodology: Concepts and Cases,2nd edition. New Delhi: Vikas Publishing House.
Easterby-Smith, M, Thorpe, R and Lowe, A. 2002. Management Research: AnIntroduction, 2nd edn. London: Sage.
Grinnell, Richard Jr (ed.). 1993. Social Work, Research and Evaluation 4th
edn. Itasca, Illinois: F E Peacock Publishers.
Kerlinger, Fred N. 1986. Foundations of Behavioural Research, 3rd edn. NewYork: Holt, Rinehart and Winston.

NOTES
Self-InstructionalMaterial 35
Research Designs
UNIT 3 RESEARCH DESIGNS
Structure
3.0 Introduction3.1 Objectives3.2 Meaning, Nature and Classification of Research Designs3.3 Exploratory Research Designs
3.3.1 Secondary Resource Analysis3.2.2 Case Study Method3.3.3 Expert Opinion Survey3.3.4 Focus Group Discussions
3.4 Descriptive Research Designs3.4.1 Cross-sectional Studies3.4.2 Longitudinal Studies
3.5 Experimental Designs3.6 Errors Affecting Research Design3.7 Answers to Check Your Progress Questions3.8 Summary3.9 Key Words
3.10 Self Assessment Questions and Exercises3.11 Further Readings
3.0 INTRODUCTION
In the last unit, we studied the defining of the research problem and the formulationof the research hypothesis. However, in research, it is not enough to define theproblem formulate the hypotheses. It has been found by research scholars andmanagers alike that most research studies do not result in any significant findingsbecause of a faulty research design. Most researchers feel that once the problemis defined and hypotheses are made, one can go ahead and collect the data on aspecified group, or sample, and then analyse it using statistical tests. However,unless the the formulated research problem and the study hypotheses is testedthrough a well defined plan, answers are going to be based on hit and trial ratherthan any sound logic.
The design approach available to the researcher are many and will dependon whether the study is of descriptive or conclusive nature. The designs rangefrom very simple, loosely structured to highly scientific experimentation. In thisunit, we will study the complete choice of designs, along with detailed reasoningon which design should be used under what conditions. Just as experiments inscience, in business research also there are chances of error and this needs to beunderstood and controlled for more accurate results for the decision maker.

Research Designs
NOTES
Self-Instructional36 Material
3.1 OBJECTIVES
After going through this unit, you will be able to:
Describe the nature of research designs
Explain exploratory research designs
Discuss the designs used for descriptive studies
Describe the range of experimental designs available
Identify and control the errors in research designs
3.2 MEANING, NATURE AND CLASSIFICATIONOF RESEARCH DESIGNS
Once you have established the ‘what’ of the study, i.e., the research problem, thenext step is the ‘how’ of the study, which specifies the method of achieving theresearch objectives. In other words, this is the research design.
Green et al. (2008) defines research design as ‘the specification of methodsand procedures for acquiring the information needed. It is the overall operationalpattern or framework of the project that stipulates what information is to becollected from which sources by what procedures. If it is a good design, it willensure that the information obtained is relevant to the research questions and thatit was collected by objective and economical procedures.’
Thyer (1993) states that, ‘A traditional research design is a blueprint ordetailed plan for how a research study is to be completed—operationalizingvariables so they can be measured, selecting a sample of interest to study, collectingdata to be used as a basis for testing hypotheses, and analysing the results.’ Sellitzet al. (1962) state that, ‘A research design is the arrangement of conditions forcollection and analysis of data in a manner that aims to combine relevance to theresearch purpose with economy in procedure.’
One of the most comprehensive and holistic definition has been given byKerlinger (1995). He refers to a research design as, ‘….. a plan, structure andstrategy of investigation so conceived as to obtain answers to research questionsor problems. The plan is the complete scheme or programme of the research. Itincludes an outline of what the investigator will do from writing the hypotheses andtheir operational implications to the final analysis of data.’
Thus, the formulated design must ensure three basic principles:
(a) Convert the research question and the stated assumptions/hypotheses intovariables that can be measured.
(b) Specify the process to complete the above task.
(c) Specify the ‘control mechanism(s)’ to follow so that the effect of othervariables that could have an effect on the outcome of the study have beencontrolled.
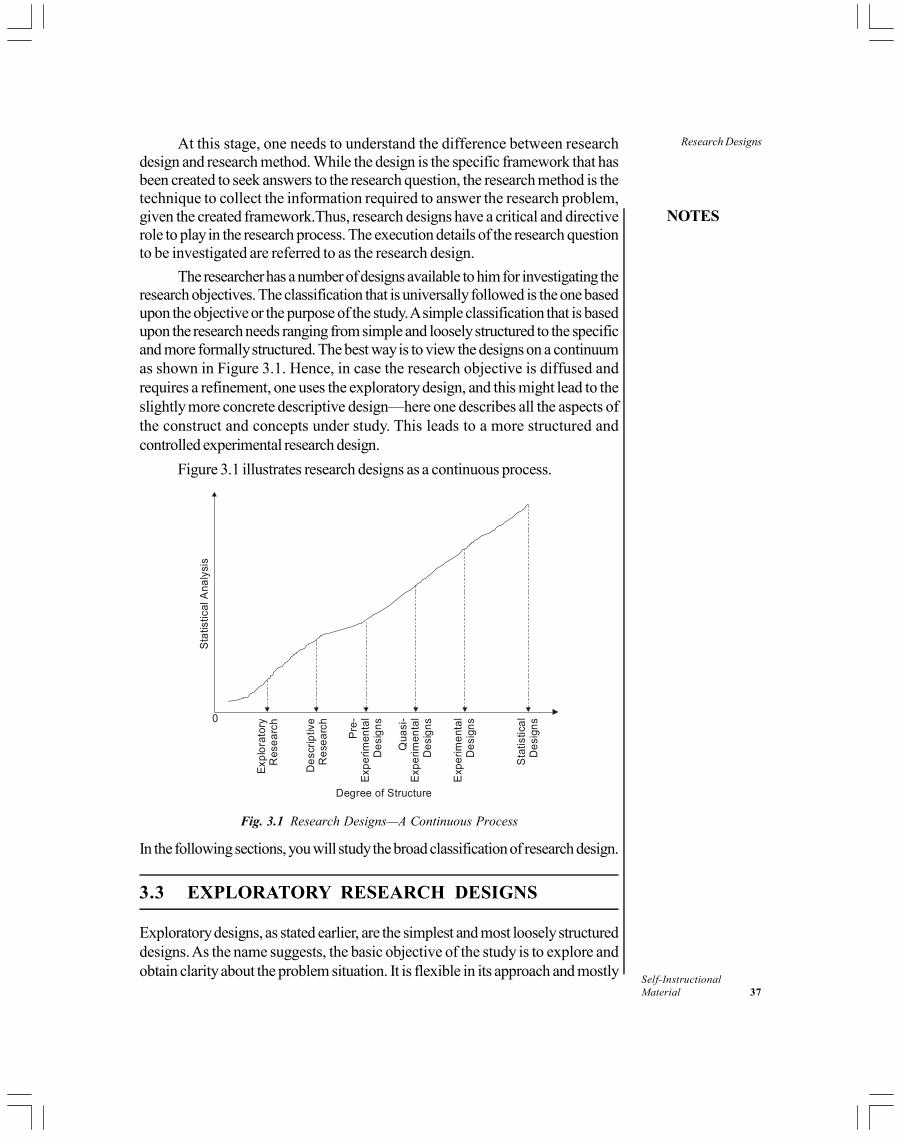
NOTES
Self-InstructionalMaterial 37
Research DesignsAt this stage, one needs to understand the difference between researchdesign and research method. While the design is the specific framework that hasbeen created to seek answers to the research question, the research method is thetechnique to collect the information required to answer the research problem,given the created framework.Thus, research designs have a critical and directiverole to play in the research process. The execution details of the research questionto be investigated are referred to as the research design.
The researcher has a number of designs available to him for investigating theresearch objectives. The classification that is universally followed is the one basedupon the objective or the purpose of the study. A simple classification that is basedupon the research needs ranging from simple and loosely structured to the specificand more formally structured. The best way is to view the designs on a continuumas shown in Figure 3.1. Hence, in case the research objective is diffused andrequires a refinement, one uses the exploratory design, and this might lead to theslightly more concrete descriptive design—here one describes all the aspects ofthe construct and concepts under study. This leads to a more structured andcontrolled experimental research design.
Figure 3.1 illustrates research designs as a continuous process.
0
Exp
lora
tory
Res
ea
rch
De
scri
ptiv
eR
ese
arc
h
Pre
-
De
sig
ns
Exp
erim
enta
l
Qua
si-
De
sig
ns
Exp
erim
enta
l
Exp
erim
ent
al
De
sign
s
Degree of Structure
Sta
tistic
al
De
sign
s
Sta
tistic
al A
naly
sis
Fig. 3.1 Research Designs—A Continuous Process
In the following sections, you will study the broad classification of research design.
3.3 EXPLORATORY RESEARCH DESIGNS
Exploratory designs, as stated earlier, are the simplest and most loosely structureddesigns. As the name suggests, the basic objective of the study is to explore andobtain clarity about the problem situation. It is flexible in its approach and mostly
Research Designs
NOTES
Self-Instructional38 Material
involves a qualitative investigation. The sample size is not strictly representativeand at times it might only involve unstructured interviews with a couple of subjectexperts. The essential purpose of the study is to:
Define and understand the research problem to be investigated.
Explore and evaluate the diverse and multiple research opportunities.
Assist in the development and formulation of the research hypotheses.
Define the variables and constructs under study.
Identify the possible nature of relationships that might exist between thevariables under study.
Explore the external factors and variables that might impact the research.
For example, a university professor might decide to do an exploratoryanalysis of the new channels of distribution that are being used by the marketers topromote and sell products and services. To do this, a structured and definedmethodology might not be essential as the basic objective is to understand how toteach this to students of marketing. The researcher can make use of differentmethods and techniques in an exploratory research- like secondary data sources,unstructured or structured observations, expert interviews and focus groupdiscussions with the concerned respondent group. Here, we will discuss them inbrief in the light of their use in exploratory research.
3.3.1 Secondary Resource Analysis
Secondary sources of data, as the name suggests, are data in terms of the detailsof previously collected findings in facts and figures—which have been authenticatedand published. It is a fast and inexpensive way of collecting information. The pastdetails can sometimes point out to the researcher that his proposed research isredundant and has already been established earlier. Secondly, the researcher mightfind that a small but significant aspect of the concept has not been addressed andshould be studied. For example, a marketer might have extensively studied thepotential of the different channels of communication for promoting a ‘homemaintenance service’ in Greater Mumbai. However, there is no impact of any mixthat he has tested. An anthropologist research associate, on going through thefindings, postulated the need for studying the potential of WOM (word of mouth)in a close-knit and predominantly Parsi colony where this might be the most effectiveculture-dependent technique that would work. Thus, such insights might provideleads for carrying out an experimental and conclusive research subsequently.
Another valuable secondary resource is the compiled and readily availabledatabases of the entire industry, business or construct. These might be availableon free and public domains or through a structured acquisition process and cost.These are both government and non-government publications. Based on theresources and the level of accuracy required, the researcher might decide to makeuse of them.

NOTES
Self-InstructionalMaterial 39
Research Designs3.2.2 Case Study Method
Another way of conducting an exploratory research is the case study method.This requires an in-depth study and is focused on a single unit of analysis. This unitcould be an employee or a customer; an organization or a complete country analysis.They are by their nature, generally, post-hoc studies and report those incidenceswhich might have occurred earlier. The scenario is reproduced based upon thesecondary information and a primary interview/discussion with those involved inthe occurrence. Thus, there might be an element of bias as the data, in most cases,becomes a judgemental analysis rather than a simple recounting of events.
For example, BCA Corporation wants to implement a performance appraisalsystem in the organization and is debating between the merits of a traditional appraisalsystem and a 360° appraisal system. For a historical understanding of the twotechniques, the HR director makes use of books on the subject. However, forbetter understanding, he should do an in-depth case accounting of AlliedAssociation which had implemented traditional appraisal formats, and SurakhshaInternational which uses 360° appraisal systems. Thus, the two exploratoryresearches carried out were sufficient to arrive at a decision in terms of whatwould be best for the organization.
3.3.3 Expert Opinion Survey
At times, there might be a situation when the topic of a research is such that thereis no previous information available on it. In these cases, it is advisable to seekhelp from experts who might be able to provide some valuable insights basedupon their experience in the field or with the concept. This approach of collectingparticulars from significant and knowledgeable people is referred to as the expertopinion survey. This methodology might be formal and structured and is usefulwhen authenticated or supported by a secondary/primary research or it might befluid and unstructured and might require an in-depth interviewing of the expert.For example, the evaluation of the merit of marketing organic food products in thedomestic Indian market cannot be done with the help of secondary data as nosuch structured data sources exist. In this case the following can be contacted:
Doctors and dieticians as experts would be able to provide informationwhether consumers would eat organic food products as a healthieralternative.
Chefs who are experimental and would like to look at providing bettervalue to their clients.
Retailers who like to sell contemporary new products.
These could be useful in measuring the viability of the proposed plan.Discussions with knowledgeable people may reveal some information regardingwho might be considered as potential consumers. Secondly, the question whethera healthy proposition or a lifestyle proposition would work better to capture the

Research Designs
NOTES
Self-Instructional40 Material
targeted consumers needs to be examined.Thus, this method can play a directionalrole in shaping the research study.
3.3.4 Focus Group Discussions
Another way to conduct a exploratory analysis is carry out discussions withindividuals associated with the problem under study. This technique, thoughoriginally from sociology, is actively used in business research. In a typical focusgroup, there is a carefully selected small set of individuals representative of thelarger respondent population under study. It is called a focus group as the selectedmembers discuss the concerned topic for the duration of 90 minutes to, sometimes,two hours. Usually the group is made up of six to ten individuals. The number thusstated is because less than six would not be able to throw enough perspectives forthe discussion and there might emerge a one-sided discussion on the topic. On theother hand, more than ten might lead to more confusion rather than any fruitfuldiscussion and that would be unwieldy to manage. Generally, these discussionsare carried out in neutral settings by a trained observer, also referred to as themoderator. The moderator, in most cases, does not participate in the discussion.His prime objective is to manage a relatively non-structured and informal discussion.He initiates the process and then maneuvers it to steer it only to the desiredinformation needs. Sometimes, there is more than one observer to record theverbal and non-verbal content of the discussion. The conduction and recording ofthe dialogue requires considerable skill and behavioural understanding and themanagement of group dynamics. In the organic food product study, the focusgroup discussions were carried out with the typical consumers/buyers of groceryproducts. The objective was to establish the level of awareness about health hazards,environmental concerns and awareness of organic food products. A series of suchfocus group discussions carried out across four metros—Delhi, Mumbai, Bengaluruand Hyderabad—revealed that even though the new age consumer was concernedabout health, the awareness about organic products varied from extremely low tonon-existent. (This study was carried out in the year 2004–05 by one of theauthors for an NGO located in Delhi).
Check Your Progress
1. State the difference between the research design and research method.
2. Which unit of analysis is the focus of the case study method?
3. Define expert opinion survey.
3.4 DESCRIPTIVE RESEARCH DESIGNS
As the name implies, the objective of descriptive research studies is to provide acomprehensive and detailed explanation of the phenomena under study. The

NOTES
Self-InstructionalMaterial 41
Research Designsintended objective might be to give a detailed sketch or profile of the respondentpopulation being studied. For example, to design an advertising and sales promotioncampaign for high-end watches, a marketer would require a holistic profile of thepopulation that buys such luxury products. Thus a descriptive study, (whichgenerates data on who, what, when, where, why and how of luxury accessorybrand purchase) would be the design necessary to fulfill the research objectives.
Descriptive research thus are conclusive studies. However, they lack theprecision and accuracy of experimental designs, yet it lends itself to a wide rangeof situations and is more frequently used in business research. Based on the timeperiod of the collection of the research information, descriptive research is furthersubdivided into two categories: cross-sectional studies and longitudinal studies.
3.4.1 Cross-sectional Studies
As the name suggests, cross-sectional studies involve a slice of the population.Just as in scientific experiments one takes a cross-section of the leaf or the cheekcells to study the cell structure under the microscope, similarly one takes a currentsubdivision of the population and studies the nature of the relevant variables beinginvestigated.
There are two essential characteristics of cross-sectional studies:
The cross-sectional study is carried out at a single moment in time and thusthe applicability is most relevant for a specific period. For example, onecross-sectional study was conducted in 2002 to study the attitude ofAmericans towards Asian-Americans, after the 9/11 terrorist attack. Thisrevealed the mistrust towards Asians. Another cross-sectional studyconducted in 2012 to study the attitude of Americans towards Asian-Americans revealed more acceptance and less mistrust. Thus the cross-sectional studies cannot be used interchangeably. .
Secondly, these studies are carried out on a section of respondents fromthe population units under study (e.g., organizational employees, voters,consumers, industry sectors). This sample is under consideration and underinvestigation only for the time coordinate of the study.
There are also situations in which the population being studied is not of ahomogeneous nature but composed of different groups. Thus it becomes essentialto study the sub-segments independently. This variation of the design is termed asmultiple cross-sectional studies. Usually this multi-sample analysis is carried outat the same moment in time. However, there might be instances when the data isobtained from different samples at different time intervals and then they arecompared. Cohort analysis is the name given to such cross-sectional surveysconducted on different sample groups at different time intervals. Cohorts areessentially groups of people who share a time zone or have experienced an eventthat took place at a particular time period. For example, in the post-9/11 cross-sectional study done in 2002, we study and compare the attitudes of middle-aged
Research Designs
NOTES
Self-Instructional42 Material
Americans versus teenaged Americans towards Asian-Americans. These twoAmerican groups are separate cohorts and this would be a cohort analysis. Thusthe teenage American is one cohort and the middle-aged cohort is separate andthinks differently.
The technique is especially useful in predicting election results, cohorts ofmales–females, different religious sects, urban–rural or region-wise cohorts arestudied by leading opinion poll experts like Nielsen, Gallup and others. Thus,Cross-sectionals studies are extremely useful to study current patterns of behaviouror opinion.
3.4.2 Longitudinal Studies
A single sample of the identified population that is studied over a longer period oftime is termed as a longitudinal study design. A panel of consumers specificallychosen to study their grocery purchase pattern is an example of a longitudinaldesign. There are certain distinguishing features of the same:
The study involves the selection of a representative panel, or a group ofindividuals that typically represent the population under study.
The second feature involves the repeated measurement of the group overfixed intervals of time. This measurement is specifically made for the variablesunder study.
A distinguishing and mandatory feature of the design is that once the sampleis selected, it needs to stay constant over the period of the study. Thatmeans the number of panel members has to be the same. Thus, in case apanel member due to some reason leaves the panel, it is critical to replacehim/her with a representative member from the population under study.
Longitudinal study using the same section of respondents thus provides moreaccurate data than one using a series of different samples. These kinds of panelsare defined as true panels and the ones using a different group every time arecalled omnibus panels. The advantages of a true panel are that it has a morecommitted sample group that is likely to tolerate extended or long data collectingsessions. Secondly, the profile information is a one-time task and need not becollected every time. Thus, a useful respondent time can be spent on collectingsome research-specific information.
However, the problem is getting a committed group of people for the entirestudy period. Secondly, there is an element of mortality and attrition where themembers of the panel might leave midway and the replaced new recruits might bevastly different and could skew the results in an absolutely different direction. Athird disadvantage is the highly structured study situation which might be responsiblefor a consistent and structured behaviour, which might not be the case in the realor field conditions.

NOTES
Self-InstructionalMaterial 43
Research Designs
Check Your Progress
4. Define cohort analysis.
5. What are omnibus panels?
3.5 EXPERIMENTAL DESIGNS
Experimental designs are conducted to infer causality. In an experiment, aresearcher actively manipulates one or more causal variables and measures theireffects on the dependent variables of interest. Since any changes in the dependentvariable may be caused by a number of other variables, the relationship betweencause and effect often tends to be probabilistic in nature. It is virtually impossibleto prove a causality. One can only infer a cause-and-effect relationship.
The necessary conditions for making causal inferences are: (i) concomitantvariation, (ii) time order of occurrence of variables and (iii) absence of other possiblecausal factors. The first condition implies that cause and effect variables shouldhave a high correlation. The second condition means that causal variable mustoccur prior to or simultaneously with the effect variable. The third condition meansthat all other variable except the one whose influence we are trying to study shouldbe absent or kept constant.
There are two conditions that should be satisfied while conducting an experiment.These are:
(i) Internal validity: Internal validity tries to examine whether the observedeffect on a dependent variable is actually caused by the treatments(independent variables) in question. For an experiment to be possessinginternal validity, all the other causal factors except the one whose influenceis being examined should be absent. Control of extraneous variables is anecessary condition for inferring causality. Without internal validity, theexperiment gets confounded.
(ii) External validity: External validity refers to the generalization of the resultsof an experiment. The concern is whether the result of an experiment can begeneralized beyond the experimental situations. If it is possible to generalizethe results, then to what population, settings, times, independent variablesand the dependent variables can the results be projected. It is desired tohave an experiment that is valid both internally and externally. However, inreality, a researcher might have to make a trade-off between one type ofvalidity for another. To remove the influence of an extraneous variable, aresearcher may set up an experiment with artificial setting, thereby increasingits internal validity. However, in the process the external validity will bereduced.

Research Designs
NOTES
Self-Instructional44 Material
There are four types of experimental designs. These are explained below:
1. Pre-experimental designs: There are three designs under this – one shortcase study where observation is taken after the application of treatment,one group pre test-post test design where one observation is taken prior tothe application of treatment and the other one after the application oftreatment, and static group comparison, where there are two groups –experimental group and control group. The experiment group is subjectedto treatment and a post test measurement is taken. In the control groupmeasurement is taken at the time when it was done for experimental group.These do not make use of any randomization procedures to control theextraneous variables. Therefore, the internal validity of such designs isquestionable.
2. Quasi-experimental designs: In these designs the researcher can controlwhen measurements are taken and on whom they are taken. However, thisdesign lacks complete control of scheduling of treatment and also lacks theability to randomize test units’ exposure to treatments. As the experimentalcontrol is lacking, the possibility of getting confounded results is very high.Therefore, the researchers should be aware of what variables are notcontrolled and the effects of such variables should be incorporated into thefindings.
3. True experimental designs: In these designs, researchers can randomlyassign test units and treatments to an experimental group. Here, the researcheris able to eliminate the effect of extraneous variables from both theexperimental and control group. Randomization procedure allows theresearcher the use of statistical techniques for analysing the experimentalresults.
4. Statistical designs: These designs allow for statistical control and analysisof external variables. The main advantages of statistical design are thefollowing:
The effect of more than one level of independent variable on thedependent variable can be manipulated.
The effect of more than one independent variable can be examined.
The effect of specific extraneous variable can be controlled.
Statistial design includes the following designs:
(i) Completely randomized design: This design is used when aresearcher is investigating the effect of one independent variable onthe dependent variable. The independent variable is required to bemeasured in nominal scale i.e. it should have a number of categories.Each of the categories of the independent variable is considered asthe treatment. The basic assumption of this design is that there are nodifferences in the test units. All the test units are treated alike andrandomly assigned to the test groups. This means that there are noextraneous variables that could influence the outcome.

NOTES
Self-InstructionalMaterial 45
Research DesignsSuppose we know that the sales of a product is influenced by theprice level. In this case, sales are a dependent variable and the price isthe independent variable. Let there be three levels of price, namely,low, medium and high. We wish to determine the most effective pricelevel i.e. at which price level the sale is highest. Here, the test units arethe stores which are randomly assigned to the three treatment level.The average sales for each price level is computed and examined tosee whether there is any significant difference in the sale at variousprice levels. The statistical technique to test for such a difference iscalled analysis of variance (ANOVA).
The main limitation of completely randomized designs is that it doesnot take into account the effect of extraneous variables on the dependentvariable. The possible extraneous variables in the present examplecould be the size of the store, the competitor’s price and price of thesubstitute product in question. This design assumes that all theextraneous factors have the same influence on all the test units whichmay not be true in reality. This design is very simple and inexpensiveto conduct.
(ii) Randomized block design: As discussed, the main limitation of thecompletely randomized design is that all extraneous variables wereassumed to be constant over all the treatment groups. This may notbe true. There may be extraneous variables influencing the dependentvariable. In the randomized block design it is possible to separate theinfluence of one extraneous variable on a particular dependent variable,thereby providing a clear picture of the impact of treatment on testunits.
In the example considered in the completely randomized design, theprice level (low, medium and high) was considered as an independentvariable and all the test units (stores) were assumed to be more or lessequal. However, all stores may not be of the same size and, therefore,can be classified as small, medium and large size stores. In this design,the extraneous variable, like the size of the store could be treated asdifferent blocks. Now the treatments are randomly assigned to theblocks in such a way so that each treatment appears in each block atleast once. The purpose of forming these blocks is that it is hoped thatthe scores of the test units within each block would be more or lesshomogeneous when the treatment is absent. What is assumed here isthat block (size of the store) is correlated with the dependent variable(sales). It may be noted that blocking is done prior to the applicationof the treatment.
In this experiment one might randomly assign 12 small-sized stores tothree price levels in such a way that there are four stores for each ofthe three price levels. Similarly, 12 medium-sized stores and
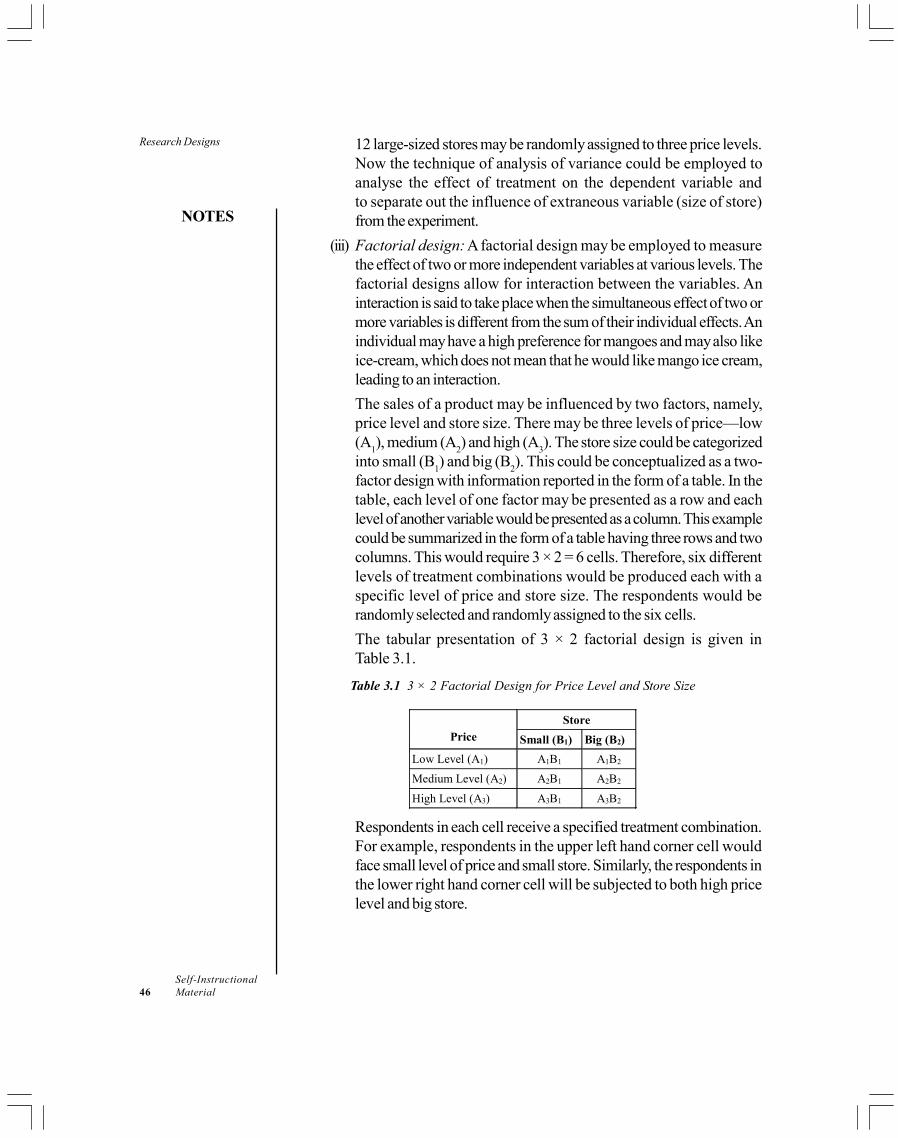
Research Designs
NOTES
Self-Instructional46 Material
12 large-sized stores may be randomly assigned to three price levels.Now the technique of analysis of variance could be employed toanalyse the effect of treatment on the dependent variable andto separate out the influence of extraneous variable (size of store)from the experiment.
(iii) Factorial design: A factorial design may be employed to measurethe effect of two or more independent variables at various levels. Thefactorial designs allow for interaction between the variables. Aninteraction is said to take place when the simultaneous effect of two ormore variables is different from the sum of their individual effects. Anindividual may have a high preference for mangoes and may also likeice-cream, which does not mean that he would like mango ice cream,leading to an interaction.
The sales of a product may be influenced by two factors, namely,price level and store size. There may be three levels of price—low(A
1), medium (A
2) and high (A
3). The store size could be categorized
into small (B1) and big (B
2). This could be conceptualized as a two-
factor design with information reported in the form of a table. In thetable, each level of one factor may be presented as a row and eachlevel of another variable would be presented as a column. This examplecould be summarized in the form of a table having three rows and twocolumns. This would require 3 × 2 = 6 cells. Therefore, six differentlevels of treatment combinations would be produced each with aspecific level of price and store size. The respondents would berandomly selected and randomly assigned to the six cells.
The tabular presentation of 3 × 2 factorial design is given inTable 3.1.
Table 3.1 3 × 2 Factorial Design for Price Level and Store Size
Price
Store
Small (B1) Big (B2)
Low Level (A1) A1B1 A1B2
Medium Level (A2) A2B1 A2B2
High Level (A3) A3B1 A3B2
Respondents in each cell receive a specified treatment combination.For example, respondents in the upper left hand corner cell wouldface small level of price and small store. Similarly, the respondents inthe lower right hand corner cell will be subjected to both high pricelevel and big store.

NOTES
Self-InstructionalMaterial 47
Research DesignsThe main advantages of factorial design are:
It is possible to measure the main effects and interaction effectof two or more independent variables at various levels.
It allows a saving of time and effort because all observations areemployed to study the effects of each factor.
The conclusion reached using factorial design has broaderapplications as each factor is studied with different combinationsof other factors.
The limitation of this design is that the number of combinations (number ofcells) increases with increased number of factors and levels. However, a fractionalfactorial design could be used if interest is in studying only a few of the interactionsor main effects.
3.6 ERRORS AFFECTING RESEARCH DESIGN
We have discussed three types of research designs, namely, exploratory, descriptiveand experimental. All of these have some scope of error. There could be varioussources of errors in research design.
Exploratory research is conducted using focus group discussion, secondarydata, analysis of case study and expert opinion survey. It is quite likely that membersof the focus group have not been selected properly. Secondary data may not befree from errors (in fact, one needs to evaluate the methodology used in collectingsuch a data). Also, the experts chosen for the survey may not be experts in thefield. As a matter of fact, getting an expert is very difficult task. All these factorscould lead to errors in the exploratory design.
In the descriptive design, the purpose is to describe a phenomenon. For thisone could use a structured questionnaire. It could always a happen that therespondents do not give correct responses to some of the questions, therebyresulting in wrong information.
In the true experimental design and statistical design, the respondents areselected at random which may not be the case in real life. Many a times, in actualbusiness situation, the value judgements play very important role in selecting therespondents. Further, there can always be errors in observations.
Check Your Progress
6. Is it possible to prove a causality?
7. Name the type of experimental design in which researchers can randomlyassign test units and treatments to an experimental group.
8. State the limitation of the factorial design.
Research Designs
NOTES
Self-Instructional48 Material
3.7 ANSWERS TO CHECK YOUR PROGRESSQUESTIONS
1. The difference between research design and research methods is that whilethe design is the specific framework that has been created to seek answersto the research question, the research method is the technique to collect theinformation required to answer the research problem, give the createdframework.
2. The case study method is focused on the single unit of analysis.
3. An expert opinion survey is the approach of collecting particulars fromsignificant and knowledgeable people.
4. Cohort analysis is the name given to such cross-sectional surveys conductedon different sample groups at different time intervals.
5. Omnibus panels are the type of longitudinal study using a different groupevery time.
6. It is virtually impossible to prove a causality. One can only infer a cause-and-effect relationship.
7. The type of experimental design in which researchers can randomly assigntest units and treatments to an experimental group are true experimentaldesigns.
8. The limitation of the factorial design is that the number of combinationsincreases with increased number of factors and levels.
3.8 SUMMARY
Research design is the blueprint or the framework for carrying out theresearch study.
The researcher has a number of designs available to him for investigatingthe research objectives. Based upon the objective or the purpose of thestudy, research design may be exporatory, descriptive or experimental.
Exploratory designs are loosely structured and investigative in nature.
In case the hypothesis formulated is descriptive in nature, the study designwould also be descriptive. The study involves collecting the who, what,why, where, why, when and how about the population under study.
Descriptive studies can further be divided into cross-sectional, i.e., studyinga section of the population at a single time period. In case the study is
NOTES
Self-InstructionalMaterial 49
Research Designsconducted on a single population, it is called as single cross-sectional and incase, it is done on more than one segment it is called multiple cross-sectionaldesigns.
Another type of descriptive desgn is the longitudinal design. Here, a selectedsample is studied at different intervals (fixed) of time to measure thevariable(s) under study.
Experimental designs are conducted to infer causality. There are four typesof experimental designs – pre-experimental designs, quasi-experimentaldesigns, true experimental designs and statistical designs
3.9 KEY WORDS
Case study method: An in-depth study of a single unit of analysis. Thiscould be an employee, the owner, a customer, a company or even a country.
Cross-sectional designs: A descriptive study done on a representativegroup of people at a single moment in time.
Descriptive designs: Research designs that describe in detail thephenomena under study.
Exploratory research design: Loosely structured research design toexplore and gain clarity about the research questions.
Focus group discussion: A sociological method in which 6-10 peoplediscuss the topic being researched.
Judgemental analysis: Formation of a judgement based upon personalimpressions rather than facts.
Longitudinal designs: A single sample studied over a longer period oftime. There are periodic measurements done of the study variable.
Test unit: A unit on which treatment is applied.
3.10 SELF ASSESSMENT QUESTIONS ANDEXERCISES
Short-Answer Questions
1. How would you define research designs? What are the three principles tobe taken care of when selecting a research design?
2. Distinguish between internal and external validity of the experiments.
3. What are the various sources of errors?
Research Designs
NOTES
Self-Instructional50 Material
Long-Answer Questions
1. What are exploratory designs? What are the methods that can be used inan exploratory design?
2. What are descriptive designs? What are the different kinds of descriptivedesigns available?
3. Explain the four types of experimental designs.
3.11 FURTHER READINGS
Chawla D and Sondhi N. 2016. Research Methodology: Concepts and Cases,2nd edition. New Delhi: Vikas Publishing House.
Easterby-Smith, M, Thorpe, R and Lowe, A. 2002. Management Research: AnIntroduction, 2nd edn. London: Sage.
Grinnell, Richard Jr (ed.). 1993. Social Work, Research and Evaluation 4th
edn. Itasca, Illinois: F E Peacock Publishers.
Kerlinger, Fred N. 1986. Foundations of Behavioural Research, 3rd edn. NewYork: Holt, Rinehart and Winston.

NOTES
Self-InstructionalMaterial 51
Primary andSecondary DataBLOCK - II
CLASSIFICATION OF DATA
UNIT 4 PRIMARY ANDSECONDARY DATA
Structure
4.0 Introduction4.1 Objectives4.2 Classification of Data4.3 Secondary Data
4.3.1 Uses of Secondary Data4.3.2 Advantages and Disadvantages of Secondary Data4.3.3 Types and Sources of Secondary Data
4.4 Primary Data Collection: Observation Method4.5 Primary Data Collection: Focus Group Discussion4.6 Primary Data Collection: Personal Interview Method4.7 Answers to Check Your Progress Questions4.8 Summary4.9 Key Words
4.10 Self Assessment Questions and Exercises4.11 Further Readings
4.0 INTRODUCTION
In the last unit, we discussed research design and its various aspects. Once theresearch design is in place, it is time to answer the research problem and hypotheses.But this cannot be done unless one collects the relevant information necessary forarriving at any suitable conclusions. The information thus collected is usually termedas data. The researcher has a choice of a wide variety of methods to collect thesame. It has to be remembered that there might be a lot of information available onthe topic under study; however you need to pick up only that information which is ofdirect relevance to the current problem under study.
The researcher can make use of data that has been collected and compiledearlier or alternately make use of methods that are problem specific. The decisionto choose one over the other or to use a combination of methods depends on anumber of deciding criteria. This unit will begin by making the reader aware of themethods of data collection available for research. Next, we will discuss thesecondary data methods and then go on to discuss three most widely used primarydata methods: observation, focus group discussion and interviews. The most popularand widely used method of primary data is the questionnaire method. This will bedealt with at length in Unit 6.

Primary andSecondary Data
NOTES
Self-Instructional52 Material
4.1 OBJECTIVES
After going through this unit, you will be able to:
Distinguish between different types of primary and secondary sources ofdata.
Explain the relevance of secondary data in research.
Identify the different types and sources of secondary data.
Describe the method and uses of observation method.
Discuss the method of focus group discussion.
Identify and use the interview method for data collection.
4.2 CLASSIFICATION OF DATA
To understand the number of choices available to a researcher for collecting thestudy-specific information, one needs to be fully aware of the resources availablefor the study and the level of accuracy required. To appreciate the truth of thisstatement, one needs to examine the variety of methods available to the researcher.The data sources could be either problem specific and primary or historical andsecondary in nature (Figure 4.1).
DataSources
SecondaryMethods
PrimaryMethods
Internal External
FullyProcessed
Need FurtherAnalysis
SyndicatedSources
ElectronicDatabasePublished
Fig. 4.1 Sources of Research Information
Primary data, as the name suggests, is original, problem- or project-specific andcollected for the specific objectives and needs spelt out by the researcher. Theaccuracy and relevance is reasonably high. The time and money required for thisare quite high and sometimes a researcher might not have the resources or thetime or both to go ahead with this method. In this case, the researcher can look atalternative sources of data which are economical and reliable enough to take the
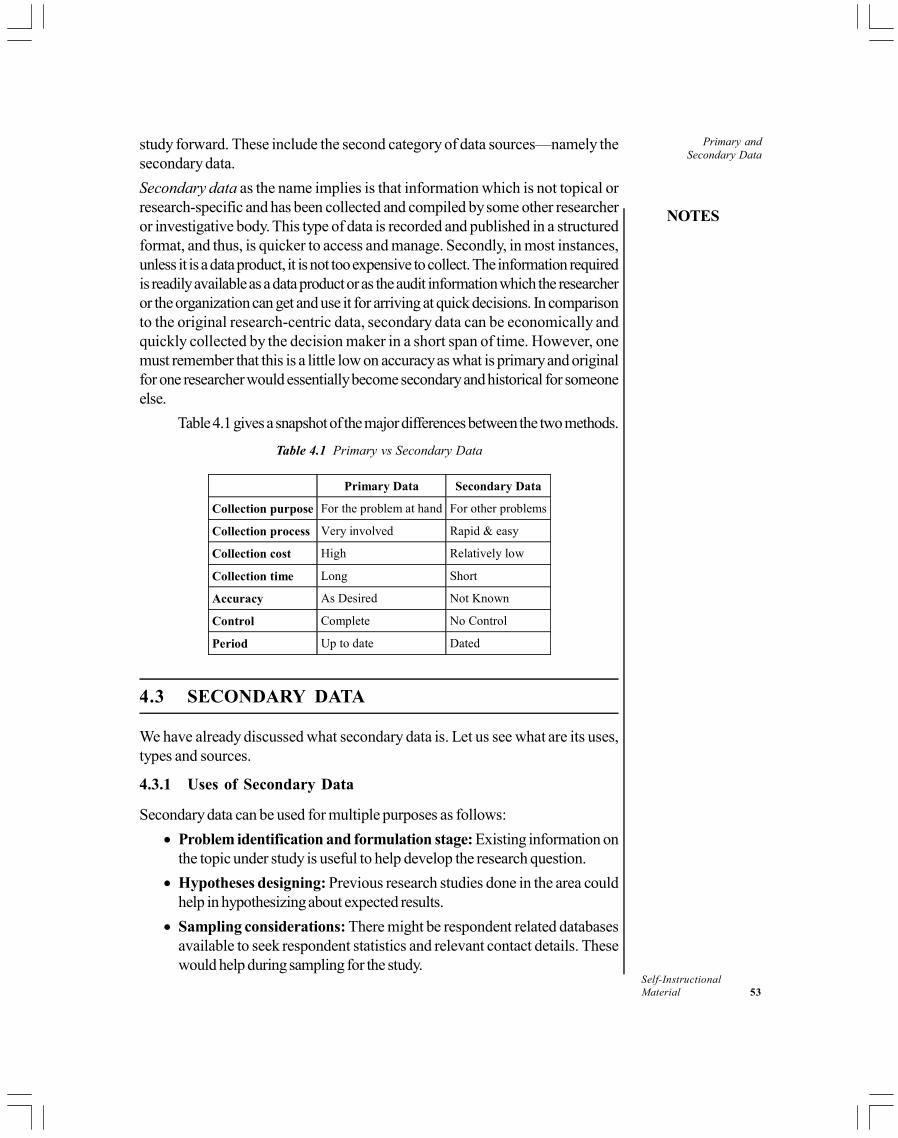
NOTES
Self-InstructionalMaterial 53
Primary andSecondary Data
study forward. These include the second category of data sources—namely thesecondary data.
Secondary data as the name implies is that information which is not topical orresearch-specific and has been collected and compiled by some other researcheror investigative body. This type of data is recorded and published in a structuredformat, and thus, is quicker to access and manage. Secondly, in most instances,unless it is a data product, it is not too expensive to collect. The information requiredis readily available as a data product or as the audit information which the researcheror the organization can get and use it for arriving at quick decisions. In comparisonto the original research-centric data, secondary data can be economically andquickly collected by the decision maker in a short span of time. However, onemust remember that this is a little low on accuracy as what is primary and originalfor one researcher would essentially become secondary and historical for someoneelse.
Table 4.1 gives a snapshot of the major differences between the two methods.
Table 4.1 Primary vs Secondary Data
Primary Data Secondary Data
Collection purpose For the problem at hand For other problems
Collection process Very involved Rapid & easy
Collection cost High Relatively low
Collection time Long Short
Accuracy As Desired Not Known
Control Complete No Control
Period Up to date Dated
4.3 SECONDARY DATA
We have already discussed what secondary data is. Let us see what are its uses,types and sources.
4.3.1 Uses of Secondary Data
Secondary data can be used for multiple purposes as follows:
Problem identification and formulation stage: Existing information onthe topic under study is useful to help develop the research question.
Hypotheses designing: Previous research studies done in the area couldhelp in hypothesizing about expected results.
Sampling considerations: There might be respondent related databasesavailable to seek respondent statistics and relevant contact details. Thesewould help during sampling for the study.
Primary andSecondary Data
NOTES
Self-Instructional54 Material
Primary base: The secondary information collected can be used to designthe primary data collection instruments, in order to phrase and design theright questions.
Validation board: Earlier records and studies can also be used to supportor validate the information collected through primary sources.
Before we examine the wide range of the secondary sources available tothe business researcher, it is essential that one is aware of the advantages anddisadvantages of using secondary sources.
4.3.2 Advantages and Disadvantages of Secondary Data
There are multiple advantages of using secondary data.
Resource advantage: Any research that is making use of secondaryinformation will be able to save immensely in terms of both cost and time
Accessibility of data: The other major advantage of secondary sources isthat it is very easy to access this data.
Accuracy and stability of data: Data from recognized sources has theadditional advantage of accuracy and reliability
Assessment of data: It can be used to compare and support the primaryresearch findings of the present study.
However, there is need for caution as well because in using secondary data, theremight be some disadvantages like:
Applicability of data: The information might not be directly suitable forour study. Also since it is past data it might not be applicable today.
Accuracy of data: All data that is available might not be reliable andaccurate.
4.3.3 Types and Sources of Secondary Data
As we saw earlier in Figure 4.1, secondary data can be divided into internal andexternal sources. Internal, as the name implies, is organization-or environment-specific source and includes the historical output and records available with theorganization which might be the backdrop of the study. The data that is independentof the organization and covers the larger industry-scape would be available in theform of published material, computerized databases or data compiled by syndicatedservices. Discussed below are three major sources of data – internal, external,computer-stored data and syndicated databases.
1. Internal sources of data
Compilation of various kinds of information and data is mandatory for anyorganization that exists. Some sources of internal information are presented inFigure 4.2.

NOTES
Self-InstructionalMaterial 55
Primary andSecondary DataInternal
Data
CompanyRecord
EmployeeRecord
OtherPublications
SalesData
FinancialRecord
Fig. 4.2 Internal Sources of Data
Company records: This includes all the data about the inception, theowners, and the mission and vision statements, infrastructure and otherdetails, including both the process and manufacturing (if any) and sales, aswell as a historical timeline of the events.
Employee records: All details regarding the employees (regular and part-time) would be part of employee records.
Sales data: This data can take on different forms:
(i) Cash register receipt
(ii) Salespersons’ call records: This is a document to be prepared andupdated every day by each individual salesperson.
(iii) Sales invoices: Customer who has placed an order with the company,his complete details including the size of the order, location, price byunit, terms of sale and shipment details (if any).
Financial records and sales reports
Besides this, there are other published sources like warranty records, CRMdata and customer grievance data which are extremely critical in evaluatingthe health of a product or an organization.
2. External data sources
As stated earlier, information that is collected and compiled by an outside sourcethat is external to the organization is referred to as external source of data. Externalsources of data include the following:
Published data: There could be two kinds of published data—one that is fromthe official and government sources and the other kind of data is that which hasbeen prepared by individuals or private agencies or organizations.
Government sources: The Indian government publishes a lot of documents thatare readily available and are extremely useful for the purpose of providingbackground data. A brief snapshot of some government data is given in Table 4.2.
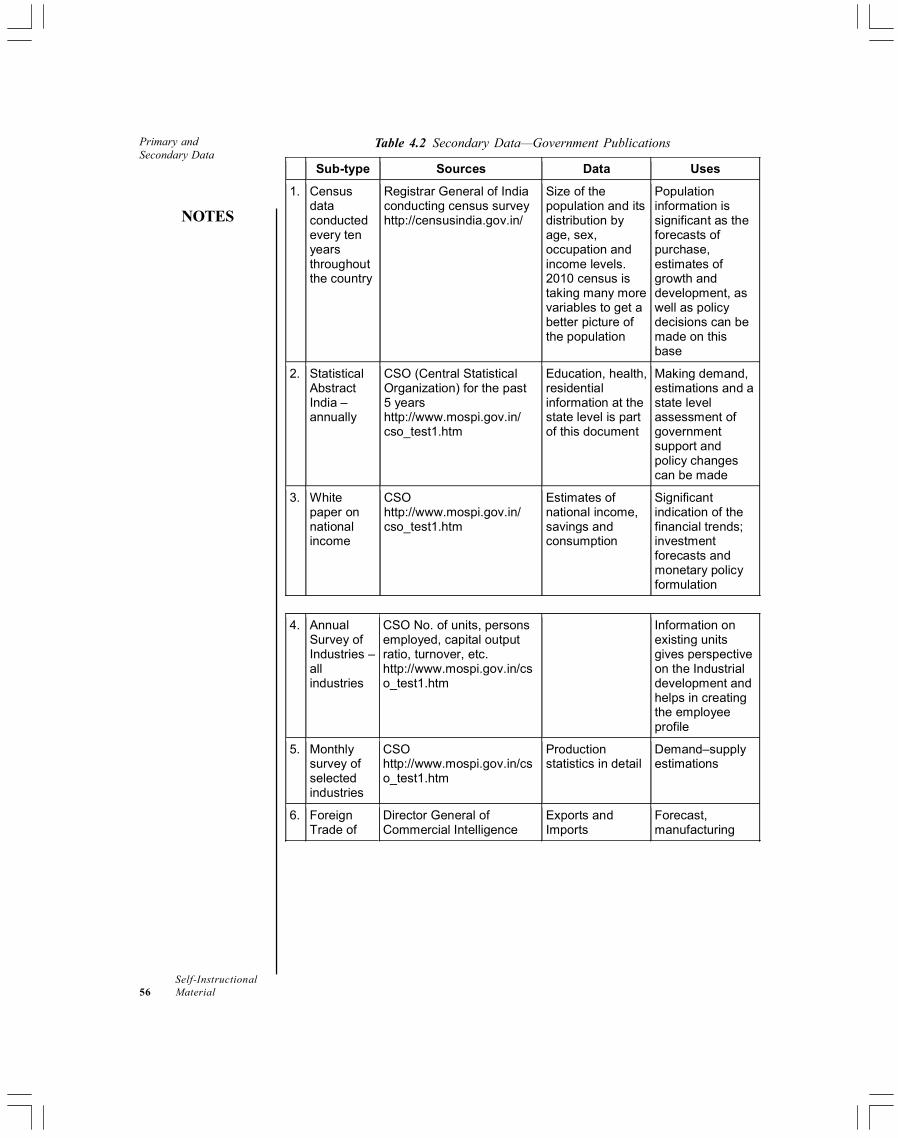
Primary andSecondary Data
NOTES
Self-Instructional56 Material
Table 4.2 Secondary Data—Government Publications
Sub-type Sources Data Uses
1. Census data conducted every ten years throughout the country
Registrar General of India conducting census survey http://censusindia.gov.in/
Size of the population and its distribution by age, sex, occupation and income levels. 2010 census is taking many more variables to get a better picture of the population
Population information is significant as the forecasts of purchase, estimates of growth and development, as well as policy decisions can be made on this base
2. Statistical Abstract India – annually
CSO (Central Statistical Organization) for the past 5 years http://www.mospi.gov.in/ cso_test1.htm
Education, health, residential information at the state level is part of this document
Making demand, estimations and a state level assessment of government support and policy changes can be made
3. White paper on national income
CSO http://www.mospi.gov.in/ cso_test1.htm
Estimates of national income, savings and consumption
Significant indication of the financial trends; investment forecasts and monetary policy formulation
4. Annual
Survey of Industries – all industries
CSO No. of units, persons employed, capital output ratio, turnover, etc. http://www.mospi.gov.in/cso_test1.htm
Information on existing units gives perspective on the Industrial development and helps in creating the employee profile
5. Monthly survey of selected industries
CSO http://www.mospi.gov.in/cso_test1.htm
Production statistics in detail
Demand–supply estimations
6. Foreign Trade of
Director General of Commercial Intelligence
Exports and Imports
Forecast, manufacturing
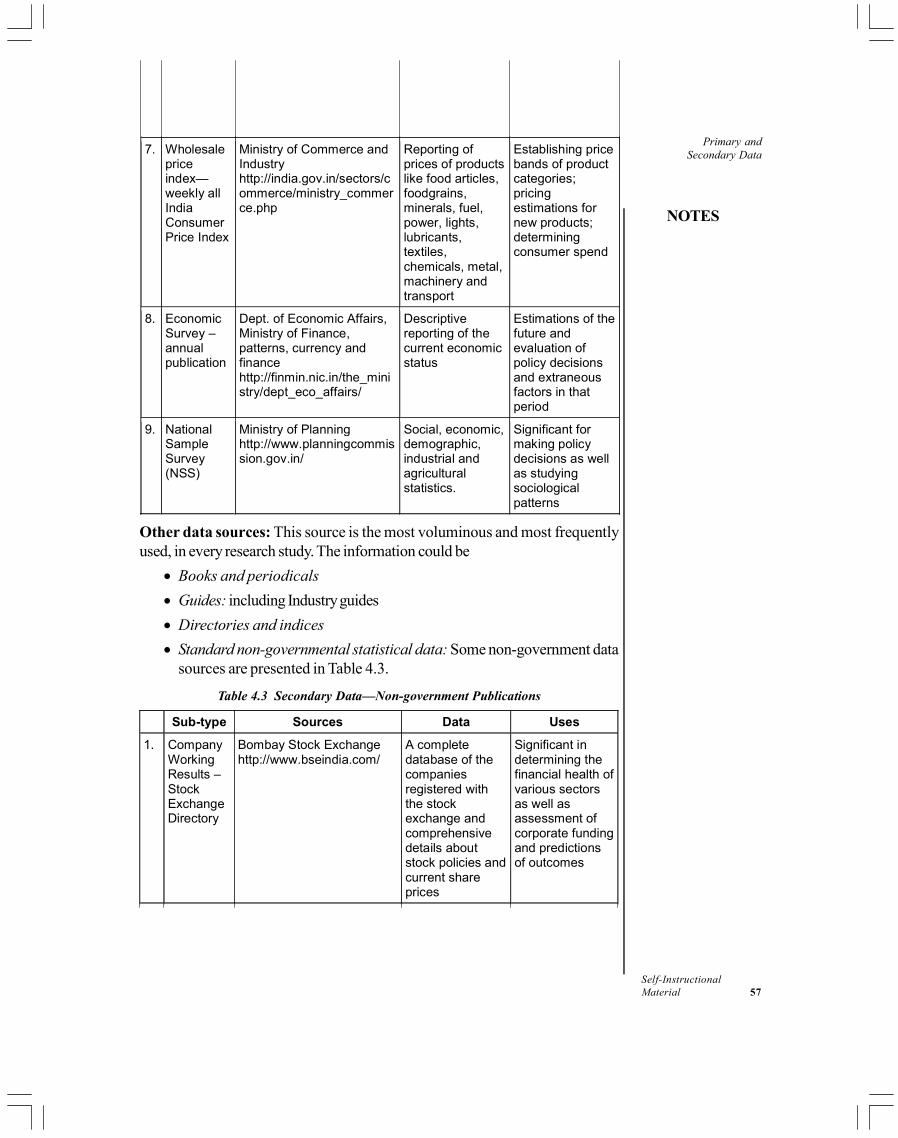
NOTES
Self-InstructionalMaterial 57
Primary andSecondary Data7. Wholesale
price index—weekly all India Consumer Price Index
Ministry of Commerce and Industry http://india.gov.in/sectors/commerce/ministry_commerce.php
Reporting of prices of products like food articles, foodgrains, minerals, fuel, power, lights, lubricants, textiles, chemicals, metal, machinery and transport
Establishing price bands of product categories; pricing estimations for new products; determining consumer spend
8. Economic Survey – annual publication
Dept. of Economic Affairs, Ministry of Finance, patterns, currency and finance http://finmin.nic.in/the_ministry/dept_eco_affairs/
Descriptive reporting of the current economic status
Estimations of the future and evaluation of policy decisions and extraneous factors in that period
9. National Sample Survey (NSS)
Ministry of Planning http://www.planningcommission.gov.in/
Social, economic, demographic, industrial and agricultural statistics.
Significant for making policy decisions as well as studying sociological patterns
Other data sources: This source is the most voluminous and most frequentlyused, in every research study. The information could be
Books and periodicals
Guides: including Industry guides
Directories and indices
Standard non-governmental statistical data: Some non-government datasources are presented in Table 4.3.
Table 4.3 Secondary Data—Non-government Publications
Sub-type Sources Data Uses
1. Company Working Results – Stock Exchange Directory
Bombay Stock Exchange http://www.bseindia.com/
A complete database of the companies registered with the stock exchange and comprehensive details about stock policies and current share prices
Significant in determining the financial health of various sectors as well as assessment of corporate funding and predictions of outcomes
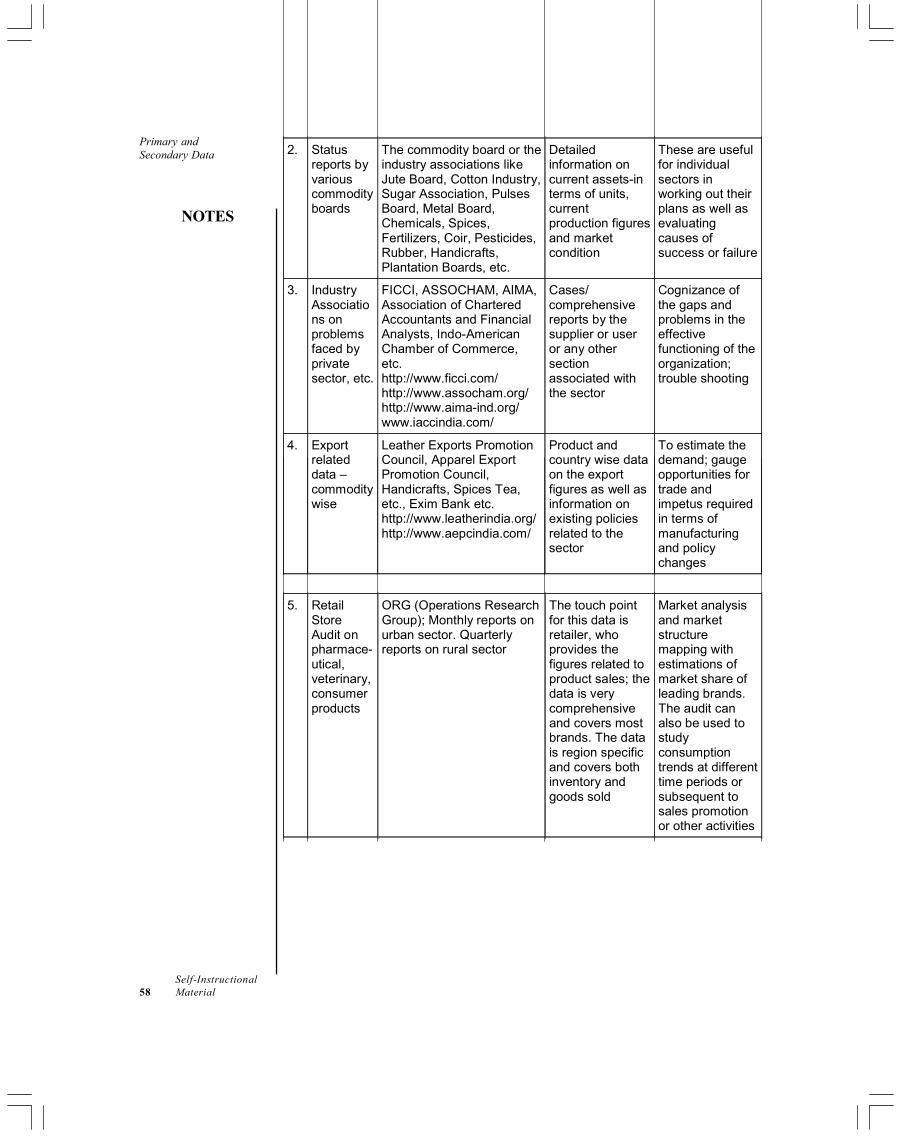
Primary andSecondary Data
NOTES
Self-Instructional58 Material
2. Status reports by various commodity boards
The commodity board or the industry associations like Jute Board, Cotton Industry, Sugar Association, Pulses Board, Metal Board, Chemicals, Spices, Fertilizers, Coir, Pesticides, Rubber, Handicrafts, Plantation Boards, etc.
Detailed information on current assets-in terms of units, current production figures and market condition
These are useful for individual sectors in working out their plans as well as evaluating causes of success or failure
3. Industry Associations on problems faced by private sector, etc.
FICCI, ASSOCHAM, AIMA, Association of Chartered Accountants and Financial Analysts, Indo-American Chamber of Commerce, etc. http://www.ficci.com/ http://www.assocham.org/ http://www.aima-ind.org/ www.iaccindia.com/
Cases/ comprehensive reports by the supplier or user or any other section associated with the sector
Cognizance of the gaps and problems in the effective functioning of the organization; trouble shooting
4. Export related data – commodity wise
Leather Exports Promotion Council, Apparel Export Promotion Council, Handicrafts, Spices Tea, etc., Exim Bank etc. http://www.leatherindia.org/ http://www.aepcindia.com/
Product and country wise data on the export figures as well as information on existing policies related to the sector
To estimate the demand; gauge opportunities for trade and impetus required in terms of manufacturing and policy changes
5. Retail Store Audit on pharmace-utical, veterinary, consumer products
ORG (Operations Research Group); Monthly reports on urban sector. Quarterly reports on rural sector
The touch point for this data is retailer, who provides the figures related to product sales; the data is very comprehensive and covers most brands. The data is region specific and covers both inventory and goods sold
Market analysis and market structure mapping with estimations of market share of leading brands. The audit can also be used to study consumption trends at different time periods or subsequent to sales promotion or other activities

NOTES
Self-InstructionalMaterial 59
Primary andSecondary Data6. National
Reader-ship Surveys (NRS)
IMRB-survey of reading behaviour for different segments as well as different products http://www.imrbint.com/
Today these surveys are done by various bodies with different sample bases. Today the survey base has become younger, with the age of the reader lowered to 12+
Media planning and measuring exposure as well as reach for product categories
7. THOMPSON INDICES: Urban market index, Rural market index
Hindustan Thompson Associates
All towns with population of more than one lakh are covered and information of demographic and socio-economic variables are given for each city with Mumbai as base. The rural index similarly covers about 400 districts with socio-economic indicators like value of agriculture output, etc.
The inclinations to purchase consumer products are directly related to socio-economic development of communities in general. The indices provide barometers to measure such potentials for each city and has implications for the researcher in terms of data collection sources
3. Computer-stored data
Information today is also available in an electronic form. The databases availableto the researcher can be classified on the basis of the type of information or by themethod of storage and recovery as described below. Figure 4.3 gives a classificationof the sources of computerized data.
Reference databases: These refer users to the articles, research papers,abstracts and other printed news contained in other sources. They provideonline indices and abstracts and are thus also called bibliographic databases.
Source databases: These provide numerical data, complete text, or acombination of both.
Based on storage and recovery mechanisms: Another useful way of classifyingdatabases is based on their method of storage and retrieval.
Online databases: These can be accessed in real time directly from theproducers of the database or through a vendor. Examples include ABI/Inform, EBSCO and Emerald.
CD-ROM databases: Here information is available on a CD-ROM.
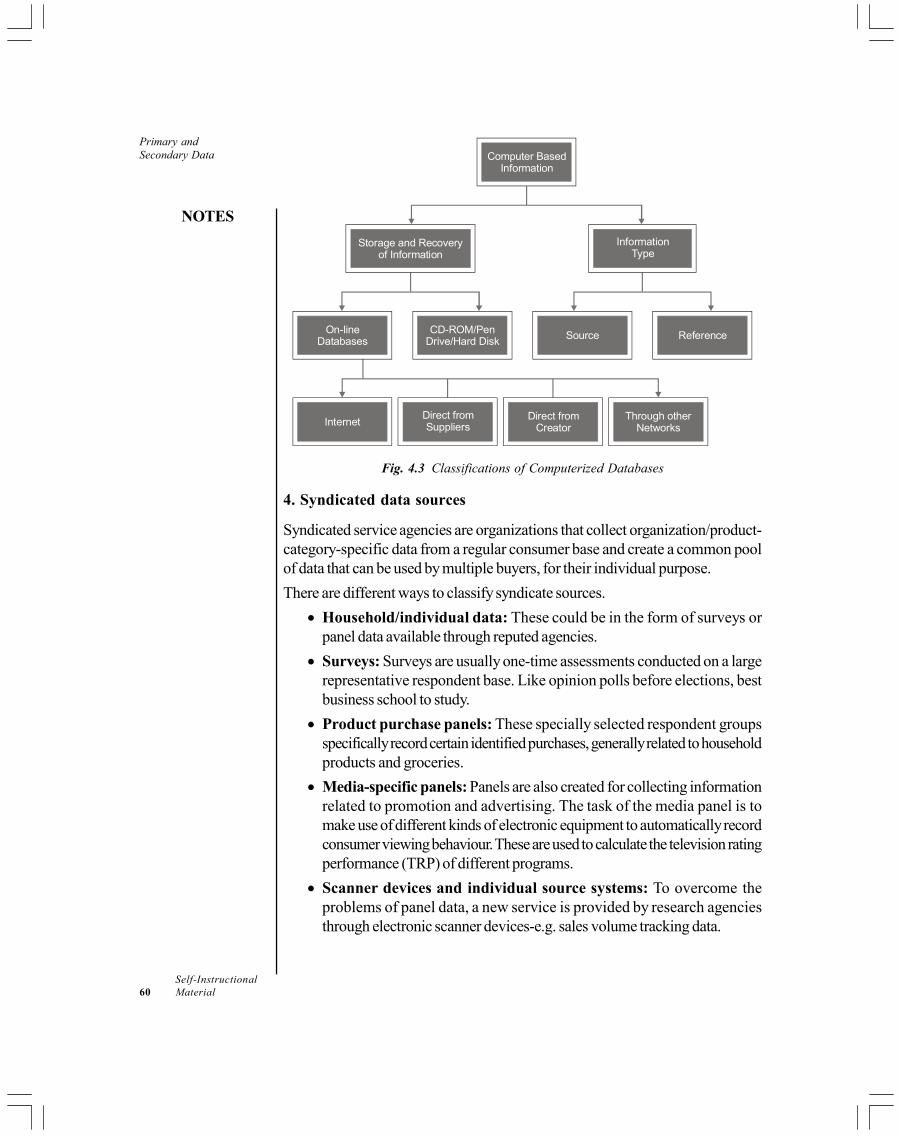
Primary andSecondary Data
NOTES
Self-Instructional60 Material
Computer BasedInformation
InternetDirect fromSuppliers
Direct fromCreator
Through otherNetworks
On-lineDatabases
CD-Drive/Hard Disk
ROM/Pen ReferenceSource
Storage and Recoveryof Information
InformationType
Fig. 4.3 Classifications of Computerized Databases
4. Syndicated data sources
Syndicated service agencies are organizations that collect organization/product-category-specific data from a regular consumer base and create a common poolof data that can be used by multiple buyers, for their individual purpose.
There are different ways to classify syndicate sources.
Household/individual data: These could be in the form of surveys orpanel data available through reputed agencies.
Surveys: Surveys are usually one-time assessments conducted on a largerepresentative respondent base. Like opinion polls before elections, bestbusiness school to study.
Product purchase panels: These specially selected respondent groupsspecifically record certain identified purchases, generally related to householdproducts and groceries.
Media-specific panels: Panels are also created for collecting informationrelated to promotion and advertising. The task of the media panel is tomake use of different kinds of electronic equipment to automatically recordconsumer viewing behaviour. These are used to calculate the television ratingperformance (TRP) of different programs.
Scanner devices and individual source systems: To overcome theproblems of panel data, a new service is provided by research agenciesthrough electronic scanner devices-e.g. sales volume tracking data.

NOTES
Self-InstructionalMaterial 61
Primary andSecondary Data
Institutional syndicated data: The syndicated data can also be availableat the institutional level. Retailer and wholesaler audits are examples of thiskind. Usually the records are noted as:
Beginning stocks + deliveries – ending inventory = sales for the period
Check Your Progress
1. Which type of data has a significant time and cost advantage?
2. How is secondary information collected helpful in for primary data collectioninstruments?
3. Cash registers are examples of which type of secondary data sources?
4. What are syndicated service agencies?
4.4 PRIMARY DATA COLLECTION:OBSERVATION METHOD
The researcher has available to him/her a wide variety of data collection methodswhich are primary or problem specific in nature. However in this unit we would bediscussing the major and most often used methods like the observation method,focus group discussion and interview method. The questionnaire method is themost commonly used method of primary data collection. We will focus on thequestionnaire method in detail in Unit 6. Let us discuss some of the other widelyused methods now.
Observation is a direct method of collecting primary data. It is one of themost appropriate methods to use in case of descriptive research. The method ofobservation involves viewing and recording individuals, groups, organizations orevents in a scientific manner in order to collect valuable data related to the topicunder study.
The mode of observation could be in a standardized or structuredobservation. Here, the nature of content to be recorded, the format and the broadareas of recording are predetermined. Thus, the observer’s bias is reduced andthe authenticity and reliability of the information collected is higher. For example,Fisher Price toys carry out an observational study whenever they come out with anew toy. The observer is supposed to record the appeal of the toy for a child.
The opposite of this is called the unstructured observation. Here, theobserver is supposed to make a note of whatever he understands as relevant forthe research study. This kind of approach is more useful in exploratory studiesSince it lacks structure, the chances of observer’s bias are high. An example ofthis is the observation of consumers at a bank, a restaurant or a doctor’s clinic.

Primary andSecondary Data
NOTES
Self-Instructional62 Material
However, it is critical here to understand that the researcher must have apreconceived plan to capture the observations made. It is not to be treated as ablank sheet where the observer reports what he sees. The aspects to be observedmust be clearly listed as in an audit form, or they could be indicative areas onwhich the observation is to be made.
Another way of distinguishing observations is the level of respondent being awareof being observed or not. This might be disguised; here the observation is done withoutthe respondent’s knowledge who has no idea that he/she is being observed. This canalso be done with devices like a one-way mirror or a hidden camera or a recorder.The only disadvantage is this is ethically an intrusion of an individual’s right to privacy.On the other hand, the knowledge that the person is under observation can be conveyedto the respondent, and this is undisguised observation. The decision to choose oneover the other depends upon the nature of the study.
The observation method can also be distinguished on the basis of the settingin which the information is being collected. This could be natural observation,which as the name suggests, is carried out in actual real life locations, for examplethe observations of how employees interact with each other during lunch breaks.On the other hand, it could be an artificial or simulated environment in which therespondent is to be observed. This is actively done in the armed forces wherestress tests are carried out to measure an individual’s tolerance level.
There is another differentiation where the observation could be done by ahuman observer or a mechanical device.
Human observation: As the name suggests, this technique involves observationand recording done by human observers. The task of the observer is simple andpredefined in case of a structured observation study as the format and the areas tobe observed and recorded are clearly defined. In an unstructured observation, theobserver records in a narrative form the entire event that he has observed.
Mechanical observation: In these methods, man is replaced by machine. Someexamples are
Store cameras and cameras in banks and other service areas.
Universal product code (UPC) scanned by electric scanners in stores.
Psychogalvanometer, which measures galvanic skin response (GSR) orchanges in the electrical resistance of the skin. Thus, the respondent couldbe exposed to different kinds of packaging, advertisements and productcomposition, to note his/her reaction to them.
Eye-tracking equipment such as oculometers, eye cameras or eye viewminuters, record the movements of the eye. The oculometer determineswhat the individual is looking at, while the pupilometer measures the interestof the person in the stimulus. The pupilometer measures changes in thediameter of the respondent’s pupils.
Trace analysis; in this the remains or the leftovers of the consumers’ basket—like his credit card spend, his recycle bin on his computer, his garbage

NOTES
Self-InstructionalMaterial 63
Primary andSecondary Data
(garbology) are evaluated to measure current trends and patterns of usageand disposal.
Observational techniques are an extremely useful method of primary datacollection and are always a part of the inputs, whether accompanying othertechniques, like interviews, discussions or questionnaire administration, or as theprime method of data collection. However, the disadvantage which they sufferfrom is that they are always behaviourally driven and cannot be used to investigatethe reasons or causes of the observed behaviour. Another problem is that if one isobserving the occurrence of a certain phenomena, one has to wait for the event tooccur. One alternative to this is to study the recordings, whether verbal, written oraudio-visual, in order to formulate the study-related inferences.
4.5 PRIMARY DATA COLLECTION: FOCUSGROUP DISCUSSION
Focus group discussion (FGD) is a highly versatile and dynamic method of collectingprimary data from a representative group of respondents. The process generallyinvolves a moderator who steers the discussion on the topic under study. Thereare a group of carefully selected respondents who are specifically invited andgathered at a neutral setting. The moderator initiates the discussion and then thegroup carries it forward by holding a focused and an interactive discussion.
Key elements of a focus group
Size: Ideal recommended size for a group discussion is 8 to 12 members. Lessthan eight would not generate all the possible perspectives on the topic and thegroup dynamics required for a meaningful session. And more than 12 would makeit difficult to get any meaningful insight.
Nature: Individuals who are from a similar background—in terms ofdemographic and psychographic traits—must be included, otherwisedisagreement might emerge as a result of other factors rather than the oneunder study. The other requirement is that the respondents must be similarin terms of the subject/policy/product knowledge and experience with theproduct under study. Moreover, the conduction of the focus group discussionmust ensure that the following criteria are taken care of:
Acquaintance: It has been found that knowing each other in a groupdiscussion is disruptive and hampers the free flow of the discussion. It isrecommended that the group should consist of strangers rather than subjectswho know each other.
Setting: The space or setting in which the discussion takes place should beas neutral, informal and comfortable as possible. In case one-way mirrorsor cameras are installed, there is a need to ensure that these gadgets are notdirectly visible.
Primary andSecondary Data
NOTES
Self-Instructional64 Material
Time period: The discussion should be held in a single setting unless thereis a ‘before’ and ‘after’ design, which requires group perceptions, initiallybefore the study variable is introduced; and later in order to gauge thegroup’s reactions. The ideal duration of conduction should not exceed anhour and a half. This is usually preceded by a short rapport formation sessionbetween the moderator and the group members.
The recording: This is most often machine recording even though sometimesthis may be accompanied by human recording as well.
The moderator: The moderator is the one who manages the discussion. Hemight be a participant in the group discussion or he might be a non-participant.He must be a good listener and unbiased in his conduct of the discussions.
Steps in planning and conducting focus groups
The focus group conduction has to be done in a stepwise manner:
Clearly define and enlist the research objectives of the study that requiresgroup discussion.
A comprehensive moderator’s structured outline for conducting the wholeprocess needs to be charted out.
After this, the actual focus group discussion is carried out.
The focus summary of the findings are clubbed under different heads asindicated in the focus group objectives and reported in a narrative form.This may include expressions like ‘majority of the participants were of theview’ or ‘there was a considerable disagreement on this issue’.
Types of focus groups
The researcher has different kinds of group discussion methods available to himor her. These are:
Two-way focus group: Here one respondent group sits and listens to theother and after learning from them or understanding the needs of the group,they carry out a discussion amongst themselves. For example, in amanagement school, the faculty group could listen to the opinions and needsof the student group.
Dual-moderator group: Here, there are two different moderators; oneresponsible for the overt task of managing the group discussion and theother for the second objective of managing the ‘group mind’ in order tomaximize the group performance.
Fencing-moderator group: The two moderators take opposite sides onthe topic being discussed and thus, in the short time available, ensure that allpossible perspectives are thoroughly explored.
Friendship groups: There are situations where the comfort level of themembers needs to be high so that they elicit meaningful responses. This isespecially the case when a supportive peer group encourages admissionabout the related organizations or people/issues.

NOTES
Self-InstructionalMaterial 65
Primary andSecondary Data
Mini-groups: These groups might be of a smaller size (usually four to six)and are usually expert groups/committees that on account of theircomposition are able to decisively contribute to the topic under study.
Creativity group: These are usually longer than one and a half hour durationand might take the workshop mode. Here, the entire group is instructed, afterwhich they brainstorm in smaller sub-groups. They then reassemble to presenttheir sub-group’s opinion. This might also stretch across a day or two.
Brand-obsessive group: These are special respondent sub-strata whoare passionately involved with a brand or product category (say, cars).They are selected, as they can provide valuable insights that can besuccessfully incorporated into the brand’s marketing strategy.
Online focus group: This is a recent addition to the methodology and isextensively used today. Here, the respondents at the designated time in aweb-based chat room and enters their ID and password to log on. Thediscussion between the moderator and the participants is real time.
4.6 PRIMARY DATA COLLECTION: PERSONALINTERVIEW METHOD
Personal interview is a one-to-one interaction between the investigator/interviewerand the interviewee. The purpose of the dialogue is research specific and rangesfrom completely unstructured to highly structured.
Uses of the interview method
The interview has varied applications in business research and can be usedeffectively in various stages.
Problem definition: The interview method can be used right in the beginningof the study. Here, the researcher uses the method to get a better clarityabout the topic under study.
Exploratory research: Here because the structure is loose this methodcan be actively used.
Primary data collection: There are situations when the method is used asa primary method of data collection, this is generally the case when the areato be investigated is high on emotional responses
The interview process
The steps undertaken for the conduction of a personal interview are somewhatsimilar in nature to those of a focus group discussion.Interview objective: The information needs that are to be addressed by theinstrument should be clearly spelt out as study objectives. This step includes aclear definition of the construct/variable(s) to be studied.Interview guidelines: A typical interview may take from 20 minutes to close toan hour. A brief outline to be used by the investigator is formulated dependingupon the contours of the interview.

Primary andSecondary Data
NOTES
Self-Instructional66 Material
Structure: Based on the needs of the study, the actual interview may beunstructured, semi-structured or structured.
Unstructured: This type of interview has no defined guidelines. It usuallybegins with a casually worded opening remark like ‘so tell us/me somethingabout yourself’. The direction the interview will take is not known to theresearcher also. The probability of subjectivity is very high.
Semi-structured: This has a more defined format and usually only the broadareas to be investigated are formulated. The questions, sequence andlanguage are left to the investigator’s choice. Probing is of critical importancein obtaining meaningful responses and uncovering hidden issues. After askingthe initial question, the direction of the interview is determined by therespondent’s initial reply, the interviewer’s probes for elaboration and therespondent’s answers.
Structured: This format has highest reliability and validity. There isconsiderable structure to the questions and the questioning is also done onthe basis of a prescribed sequence. They are sometimes used as the primarydata collection instrument also.
Interviewing skills: The quality of the output and the depth of informationcollected depend upon the probing and listening skills of the interviewer. His attitudeneeds to be as objective as possible.
Analysis and interpretation: The information collected is not subjected to anystatistical analysis. Mostly the data is in narrative form, in the case of structuredinterviews it might be summarized in prose form.
Types of interviews
There are various kinds of interview methods available to the researcher. In thelast section we have spoken about a distinction based on the level of structure.The other classification is based on the mode of administering the interview.
Figure 4.3 presents a classification of the types of personal interview.
Computer-Assisted
MallInterceptAt HomeTraditional Computer-
Assisted
PersonalInterviewing
TelephoneInterviewing
InterviewMethods
Fig. 4.3 Types of Personal Interview
NOTES
Self-InstructionalMaterial 67
Primary andSecondary Data
Personal methods: These are the traditional one-to-one methods that have beenused actively in all branches of social sciences. However, they are distinguished interms of the place of conduction.
At-home interviews: This face-to-face interaction takes place at therespondent’s residence. Thus, the interviewer needs to initially contact therespondent to ascertain the interview time.
Mall-intercept interviews: As the name suggests, this method involvesconducting interviews with the respondents as they are shopping in malls.Sometimes, product testing or product reactions can be carried out throughstructured methods and followed by 20–30 minute interviews to test thereactions.
Computer-assisted personal interviewing (CAPI): This technique is carriedout with the help of the computer. In this form of interviewing, the respondentfaces an assigned computer terminal and answers a questionnaire on thecomputer screen by using the keyboard or a mouse. A number of pre-designedpackages are available to help the researcher design simple questions thatare self-explanatory and instead of probing, the respondent is guided to aset of questions depending on the answer given. There is usually an interviewerpresent at the time of respondent’s computer-assisted interview and isavailable for help and guidance, if required.
Telephone method: The telephone method replaces the face-to-face interactionbetween the interviewer and interviewee, by calling up the subjects and askingthem a set of questions. The advantage of the method is that geographicboundaries are not a constraint and the interview can be conducted at the individualrespondent’s location. The format and sequencing of the questions remains thesame.
Traditional telephone interviews: The process can be accomplished usingthe traditional telephone for conducting the questioning.
Computer-assisted telephone interviewing: In this process, the intervieweris replaced by the computer and it involves conducting the telephonicinterview using a computerized interview format. The interviewer sits in frontof a computer terminal and wears a mini-headset, in order to hear therespondent answer. However, unlike the traditional method where he hadto manually record the responses, the responses are simultaneously recordedon the computer.
Since the interview requires a one-to-one dialogue to be carried out, it ismore cumbersome and costly as compared to a focus group discussion. Also,conduction of interview requires considerable skills on part of the interviewer andthus adequate training in interviewing skills is needed for capturing a comprehensivestudy-related data.
Primary andSecondary Data
NOTES
Self-Instructional68 Material
Questionnaire Method
It is one of the most cost-effective methods which can be used with considerableease by most individual and business researchers. It has the advantage of flexibilityof approach and can be successfully adapted for most research studies. Theinstrument has been defined differently by various researchers. Some take thetraditional view of a written document requiring the subject to record his/her ownresponses (Kervin,1999), others have taken a broader perspective to includestructured interview also as a questionnaire (Bell, 1999). It is essentially a data-collection instrument that has a pre-designed set of questions, following a particularstructure (De Vaus, 2002). Since it includes a standard set of questions, it can besuccessfully used to collect information from a large sample in a reasonably shorttime period.
However, a note of caution is to be sounded here, as the usage ofquestionnaire as the best method in all research studies is not a foregoneconclusion. For example, at the exploratory stage, when one is still trying toidentify the information areas, variables and execution decision, it is advisableto use a more unstructured interview. Secondly, when the number ofrespondents is small and one needs to collect more subjective data and mostof the questions to be asked are open-ended, then a standardized questionnaireis not advisable.
When one is designing the questionnaire, there are certain criteria that mustbe kept in mind.
Criteria for Questionnaire Designing
The first and foremost requirement is that the spelt-out research objectives mustbe converted into clear questions which will extract answers from the respondent.This is not as easy as it sounds, for example, if one wants to know something likewhat is the margin that a company gives to the retailer? This cannot be convertedinto a direct question as no one will give the correct figure. Thus, one will have toask a disguised question like may be a range of percentage estimates—2–5 percent, 6–10 per cent, 11–15 per cent, 16–20 per cent, etc., or the retailer mightnot go beyond a yes, no or ‘ industry standard’.
The second requirement is, like the Toyota questionnaire, it should bedesigned to engage the respondent and encourage a meaningful response. Forexample, a questionnaire measuring stress cannot have a voluminous set ofquestions which fatigue the subject. The questions, thus, should be non-threatening, must encourage response and be clear to understand. One needs toremember that the essential usage of the instrument is to administer the same toa large base, thus there must be clarity and interest that should be part of themeasure itself.
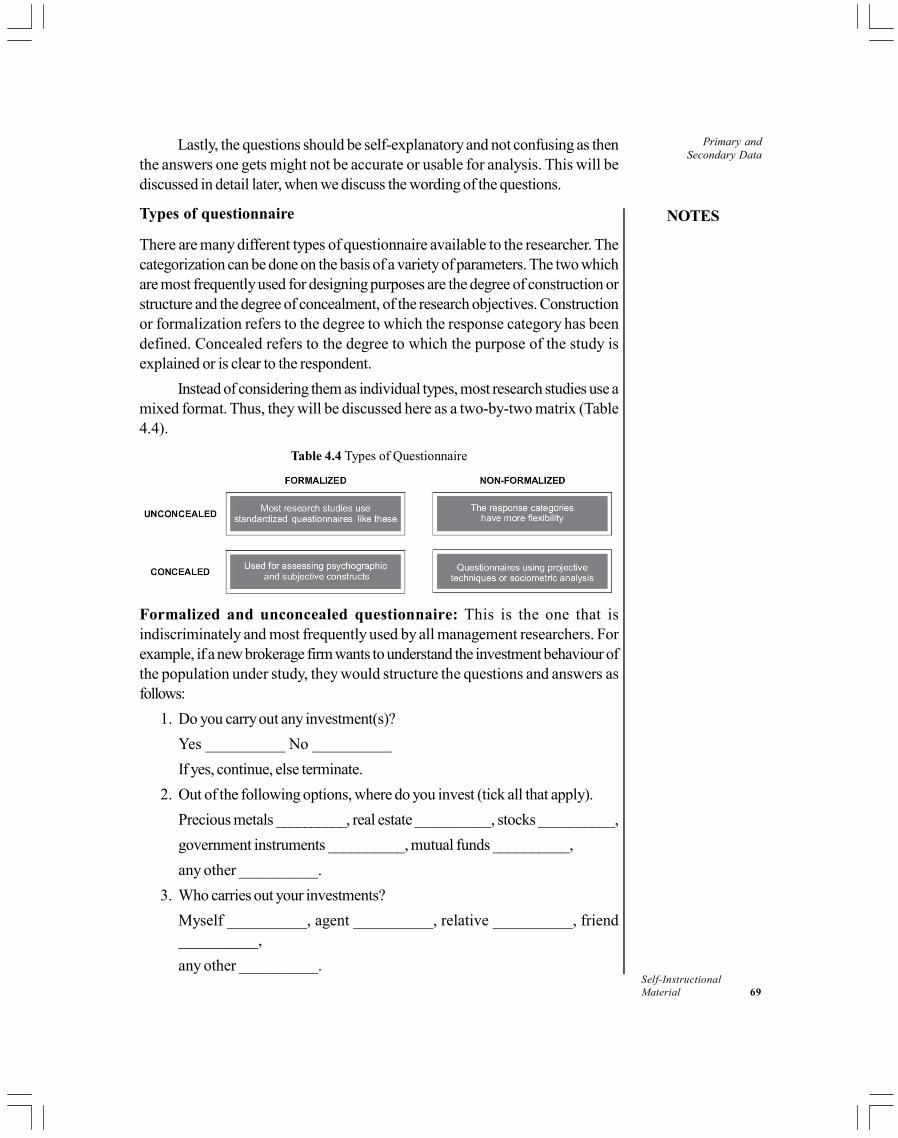
NOTES
Self-InstructionalMaterial 69
Primary andSecondary Data
Lastly, the questions should be self-explanatory and not confusing as thenthe answers one gets might not be accurate or usable for analysis. This will bediscussed in detail later, when we discuss the wording of the questions.
Types of questionnaire
There are many different types of questionnaire available to the researcher. Thecategorization can be done on the basis of a variety of parameters. The two whichare most frequently used for designing purposes are the degree of construction orstructure and the degree of concealment, of the research objectives. Constructionor formalization refers to the degree to which the response category has beendefined. Concealed refers to the degree to which the purpose of the study isexplained or is clear to the respondent.
Instead of considering them as individual types, most research studies use amixed format. Thus, they will be discussed here as a two-by-two matrix (Table4.4).
Table 4.4 Types of Questionnaire
Formalized and unconcealed questionnaire: This is the one that isindiscriminately and most frequently used by all management researchers. Forexample, if a new brokerage firm wants to understand the investment behaviour ofthe population under study, they would structure the questions and answers asfollows:
1. Do you carry out any investment(s)?
Yes __________ No __________
If yes, continue, else terminate.
2. Out of the following options, where do you invest (tick all that apply).
Precious metals __________, real estate __________, stocks __________,
government instruments __________, mutual funds __________,
any other __________.
3. Who carries out your investments?
Myself __________, agent __________, relative __________, friend__________,
any other __________.
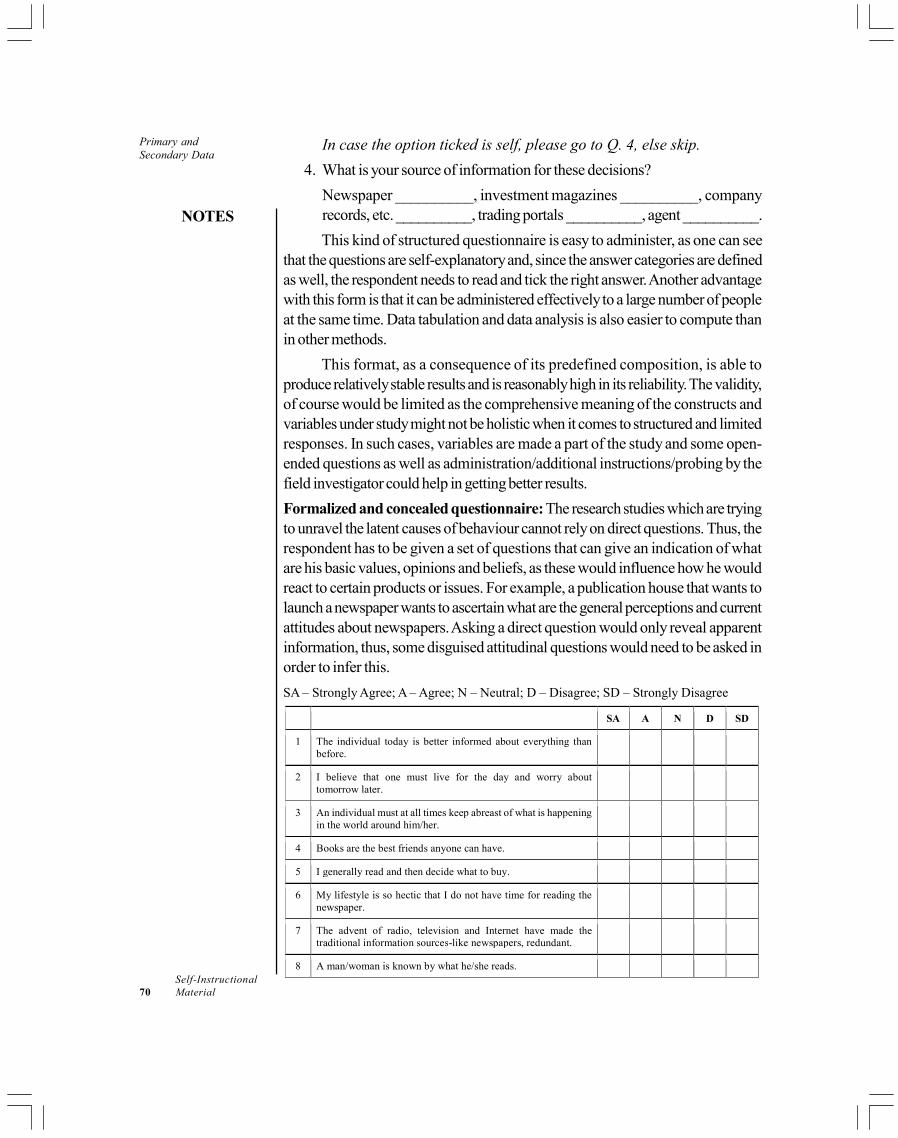
Primary andSecondary Data
NOTES
Self-Instructional70 Material
In case the option ticked is self, please go to Q. 4, else skip.
4. What is your source of information for these decisions?
Newspaper __________, investment magazines __________, companyrecords, etc. __________, trading portals __________, agent __________.
This kind of structured questionnaire is easy to administer, as one can seethat the questions are self-explanatory and, since the answer categories are definedas well, the respondent needs to read and tick the right answer. Another advantagewith this form is that it can be administered effectively to a large number of peopleat the same time. Data tabulation and data analysis is also easier to compute thanin other methods.
This format, as a consequence of its predefined composition, is able toproduce relatively stable results and is reasonably high in its reliability. The validity,of course would be limited as the comprehensive meaning of the constructs andvariables under study might not be holistic when it comes to structured and limitedresponses. In such cases, variables are made a part of the study and some open-ended questions as well as administration/additional instructions/probing by thefield investigator could help in getting better results.
Formalized and concealed questionnaire: The research studies which are tryingto unravel the latent causes of behaviour cannot rely on direct questions. Thus, therespondent has to be given a set of questions that can give an indication of whatare his basic values, opinions and beliefs, as these would influence how he wouldreact to certain products or issues. For example, a publication house that wants tolaunch a newspaper wants to ascertain what are the general perceptions and currentattitudes about newspapers. Asking a direct question would only reveal apparentinformation, thus, some disguised attitudinal questions would need to be asked inorder to infer this.
SA – Strongly Agree; A – Agree; N – Neutral; D – Disagree; SD – Strongly Disagree
SA A N D SD
1 The individual today is better informed about everything than before.
2 I believe that one must live for the day and worry about tomorrow later.
3 An individual must at all times keep abreast of what is happening in the world around him/her.
4 Books are the best friends anyone can have.
5 I generally read and then decide what to buy.
6 My lifestyle is so hectic that I do not have time for reading the newspaper.
7 The advent of radio, television and Internet have made the traditional information sources-like newspapers, redundant.
8 A man/woman is known by what he/she reads.
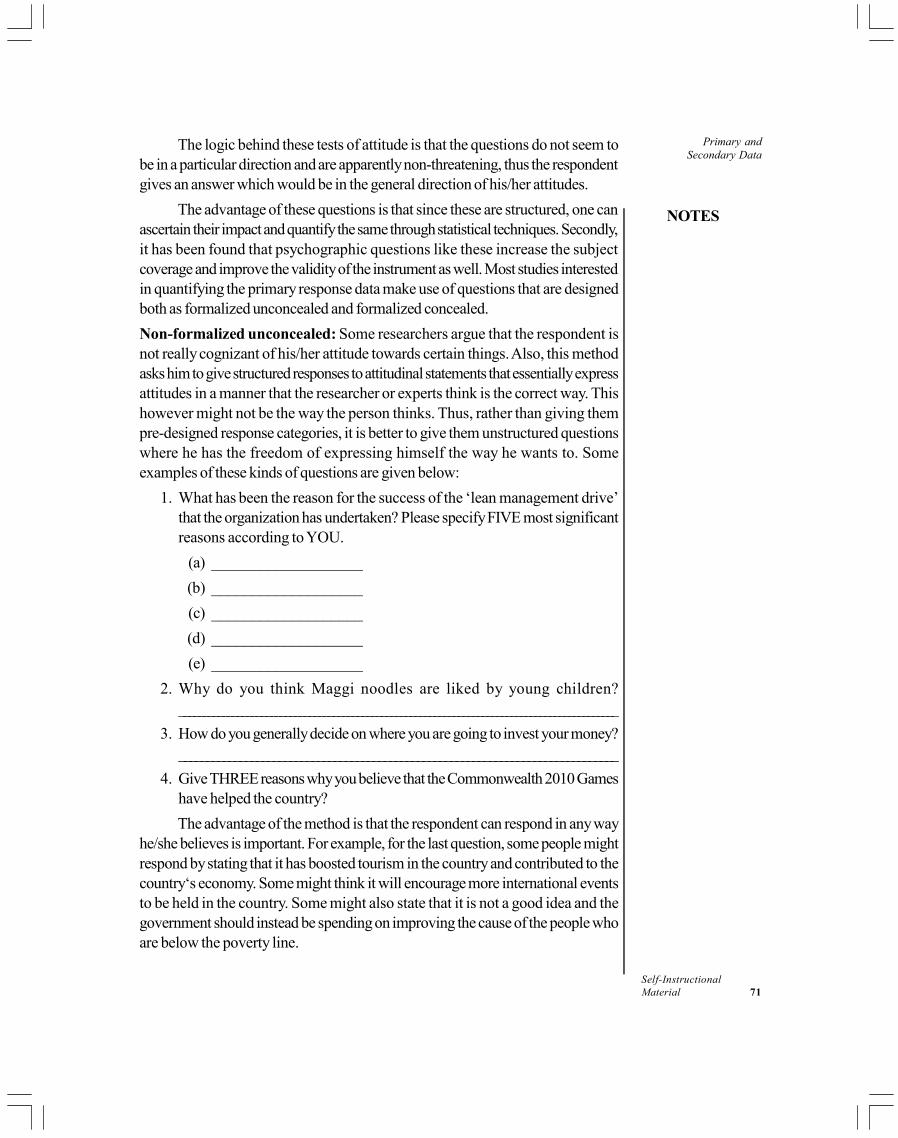
NOTES
Self-InstructionalMaterial 71
Primary andSecondary Data
The logic behind these tests of attitude is that the questions do not seem tobe in a particular direction and are apparently non-threatening, thus the respondentgives an answer which would be in the general direction of his/her attitudes.
The advantage of these questions is that since these are structured, one canascertain their impact and quantify the same through statistical techniques. Secondly,it has been found that psychographic questions like these increase the subjectcoverage and improve the validity of the instrument as well. Most studies interestedin quantifying the primary response data make use of questions that are designedboth as formalized unconcealed and formalized concealed.
Non-formalized unconcealed: Some researchers argue that the respondent isnot really cognizant of his/her attitude towards certain things. Also, this methodasks him to give structured responses to attitudinal statements that essentially expressattitudes in a manner that the researcher or experts think is the correct way. Thishowever might not be the way the person thinks. Thus, rather than giving thempre-designed response categories, it is better to give them unstructured questionswhere he has the freedom of expressing himself the way he wants to. Someexamples of these kinds of questions are given below:
1. What has been the reason for the success of the ‘lean management drive’that the organization has undertaken? Please specify FIVE most significantreasons according to YOU.
(a) ___________________
(b) ___________________
(c) ___________________
(d) ___________________
(e) ___________________
2. Why do you think Maggi noodles are liked by young children?___________________________________________________________________________________________
3. How do you generally decide on where you are going to invest your money?_______________________________________________________________________________
4. Give THREE reasons why you believe that the Commonwealth 2010 Gameshave helped the country?
The advantage of the method is that the respondent can respond in any wayhe/she believes is important. For example, for the last question, some people mightrespond by stating that it has boosted tourism in the country and contributed to thecountry‘s economy. Some might think it will encourage more international eventsto be held in the country. Some might also state that it is not a good idea and thegovernment should instead be spending on improving the cause of the people whoare below the poverty line.
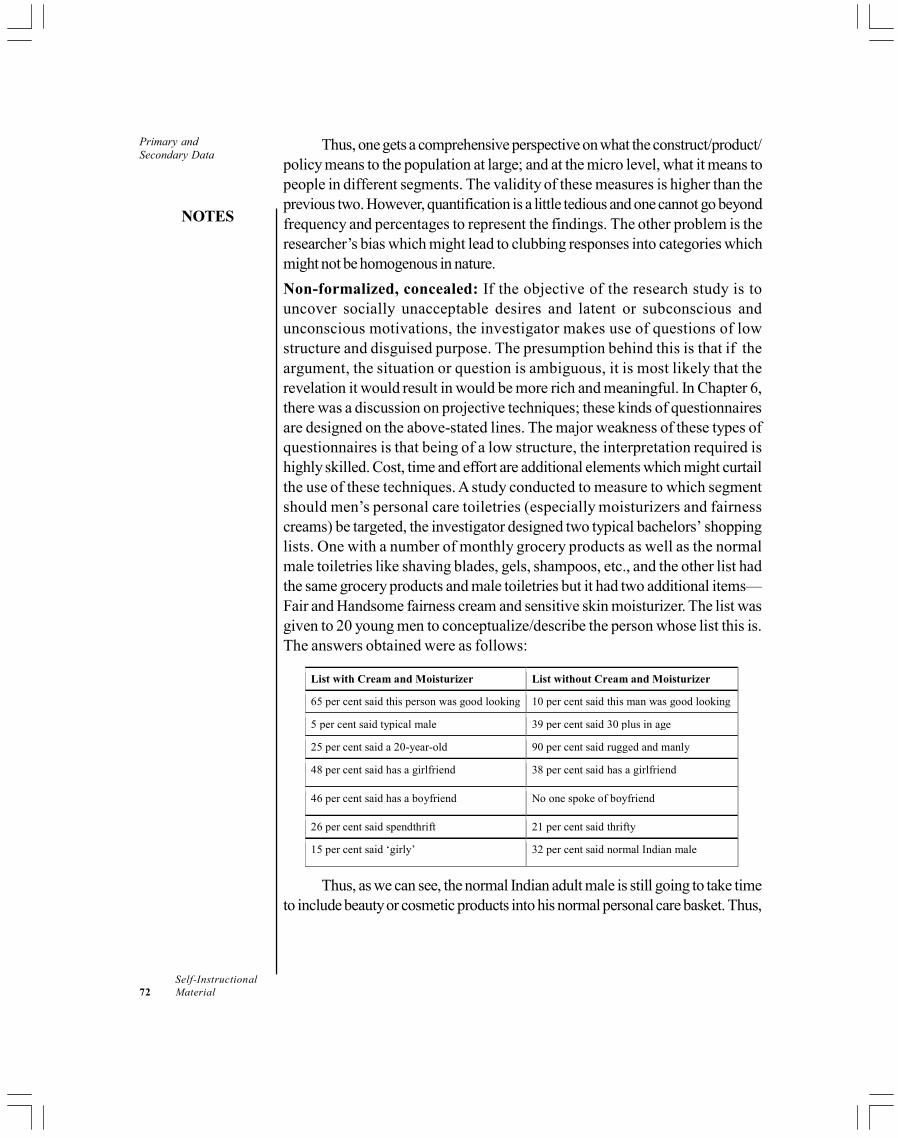
Primary andSecondary Data
NOTES
Self-Instructional72 Material
Thus, one gets a comprehensive perspective on what the construct/product/policy means to the population at large; and at the micro level, what it means topeople in different segments. The validity of these measures is higher than theprevious two. However, quantification is a little tedious and one cannot go beyondfrequency and percentages to represent the findings. The other problem is theresearcher’s bias which might lead to clubbing responses into categories whichmight not be homogenous in nature.
Non-formalized, concealed: If the objective of the research study is touncover socially unacceptable desires and latent or subconscious andunconscious motivations, the investigator makes use of questions of lowstructure and disguised purpose. The presumption behind this is that if theargument, the situation or question is ambiguous, it is most likely that therevelation it would result in would be more rich and meaningful. In Chapter 6,there was a discussion on projective techniques; these kinds of questionnairesare designed on the above-stated lines. The major weakness of these types ofquestionnaires is that being of a low structure, the interpretation required ishighly skilled. Cost, time and effort are additional elements which might curtailthe use of these techniques. A study conducted to measure to which segmentshould men’s personal care toiletries (especially moisturizers and fairnesscreams) be targeted, the investigator designed two typical bachelors’ shoppinglists. One with a number of monthly grocery products as well as the normalmale toiletries like shaving blades, gels, shampoos, etc., and the other list hadthe same grocery products and male toiletries but it had two additional items—Fair and Handsome fairness cream and sensitive skin moisturizer. The list wasgiven to 20 young men to conceptualize/describe the person whose list this is.The answers obtained were as follows:
List with Cream and Moisturizer List without Cream and Moisturizer
65 per cent said this person was good looking 10 per cent said this man was good looking
5 per cent said typical male 39 per cent said 30 plus in age
25 per cent said a 20-year-old 90 per cent said rugged and manly
48 per cent said has a girlfriend 38 per cent said has a girlfriend
46 per cent said has a boyfriend No one spoke of boyfriend
26 per cent said spendthrift 21 per cent said thrifty
15 per cent said ‘girly’ 32 per cent said normal Indian male
Thus, as we can see, the normal Indian adult male is still going to take time
to include beauty or cosmetic products into his normal personal care basket. Thus,
NOTES
Self-InstructionalMaterial 73
Primary andSecondary Data
it is wiser for the marketeers to target the younger metrosexual male who is aheavy spender.
Another useful way of categorizing questionnaires is on the method ofadministration. Thus, the questionnaire that has been prepared would necessitatea face-to-face interaction. In this case, the interviewer reads out each questionand makes a note of the respondent’s answers. This administration is called aschedule. It might have a mix of the questionnaire type as described in the sectionabove and might have some structured and some unstructured questions. Theinvestigator might also have a set of additional material like product prototypes orcopy of advertisements. The investigator might also have a predetermined set ofstandardized questions or clarifications , which he can use to ask questions like‘why do you say that?’ or ‘can you explain this in detail’ ‘what I mean to askis…….’ The other kind is the self-administered questionnaire, where therespondent reads all the instructions and questions on his own and records hisown statements or responses. Thus, all the questions and instructions need to beexplicit and self-explanatory.
The selection of one over the other depends on certain study prerequisites.
Population characteristics: In case the population is illiterate or unable to writethe responses, then one must as a rule use the schedule, as the questionnairecannot be effectively answered by the subject himself.
Population spread: In case the sample to be studied is large and dispersed, thenone needs to use the questionnaire. Also when the resources available for thestudy, time, cost and manpower are limited, then schedules become expensive touse and it is advisable to use self-administered questionnaire.
Study area: In case one is studying a sensitive topic , like organizational climateor quality of working life, where the presence of an investigator might skew theanswers in a more positive direction, then it is better that one uses the questionnaire.However, in case the motives and feelings are not well-developed and structured,one might need to do additional probing and in that case a schedule is better. If theobjective is to explore concepts or trace the reaction of the sample population tonew ideas and concepts, a schedule is advisable.
Check Your Progress
5. What is the consequence of standardized or structured observation?
6. Define a facing-moderator group.
7. In which structure of interview is the probability of subjectivity very high?
Primary andSecondary Data
NOTES
Self-Instructional74 Material
4.7 ANSWERS TO CHECK YOUR PROGRESSQUESTIONS
1. The secondary type of data has a significant time and cost advantage.
2. The secondary information collected can be used to design the primarydata collection instruments, in order to phrase and design the right questions.
3. Cash registers are examples of sales data type of secondary data sources.
4. Syndicated service agencies are organizations that collect organization/product-category-specific data from a regular consumer base and create acommon pool of data that can be used by multiplier buyers, for their individualpurpose.
5. The consequence of standardized or structured observation is that theobserver’s bias is reduced, and the authenticity and reliability of theinformation collected is higher.
6. A facing-moderator group is a type of focus group in which the twomoderators take opposite sides on the topic being discussed and thus, inthe short time available, ensure that all possible perspectives are thoroughlyexplored.
7. In the unstructured interview the probability of subjectivity very high.
4.8 SUMMARY
The researcher has access to two major sources of this data: original as inprimary sources or secondary data.
The secondary information is useful, fast and cost-effective way of testingand achieving the study objectives.
Secondary data could be collected and compiled within the organization/industry.
Data collected from an outside source is termed as external data source.
The observational method is the simplest method of primary data collection.This can be differentiated into structure-unstructured; human – mechanicallyobserved data.
The focus group discussion is a cost effective method and can ideally bedone on a small group of respondents to obtain meaningful data.
Interview method involves a dialogue between the interviewee and theinterviewer. This can range from unstructured to completely structured.

NOTES
Self-InstructionalMaterial 75
Primary andSecondary Data
Today the interviewer can make use of the telephone as well as computerto assist him in conducting the interview.
4.9 KEY WORDS
External source of data: Information that is collected and compiled by anoutside source that is external to the organization.
Focus group discussion: A form of structured group discussion involvingpeople with knowledge and interest in a particular topic and a facilitator.
Online database: a database that can be accessed by computers.
Primary data: Original, problem or project-specific and collected for thespecific objectives and needs spelt out by the researcher.
Secondary data: Information which is not topical or research-specific andhas been collected and compiled by some other researcher or investigativebody.
Syndicated data: Information gathered by a service or company for publicrelease and sold by subscription.
4.10 SELF ASSESSMENT QUESTIONS ANDEXERCISES
Short-Answer Questions
1. Distinguish between secondary and primary methods of data collection.
2. Explain the interview method of data collection.
3. What are the advantages and disadvantages of secondary data?
Long-Answer Questions
1. How can secondary data be classified? Elaborate on each type with suitableexamples.
2. What is the observation method? What are the different types of observationmethods available to the researcher?
3. What are focus group discussions? What are the types of focus groupsavailable to the researcher?
4. What are the uses of the technique? What are the different types ofinterviews?

Primary andSecondary Data
NOTES
Self-Instructional76 Material
4.11 FURTHER READINGS
Bhattacharyya, D K. 2006. Research Methodology. New Delhi: Excel Books.
Chawla D and Sondhi N. 2016. Research Methodology: Concepts and Cases,2nd edition. New Delhi: Vikas Publishing House.
Malhotra, N K. 2002. Marketing Research–An Applied Orientation. 3rd edn.New Delhi: Pearson Education.
Pannerselvam, R. 2004. Research Methodology. New Delhi: Prentice Hall ofIndia Pvt. Ltd.,
Easwaran, Singh, SJ. 2006. Marketing Research–Concepts, Practices andCases. New Delhi: Oxford University Press.

NOTES
Self-InstructionalMaterial 77
Attitude Measurementand ScalingBLOCK - III
METHODOLOGY
UNIT 5 ATTITUDE MEASUREMENTAND SCALING
Structure
5.0 Introduction5.1 Objectives5.2 Types of Measurement Scales
5.2.1 Attitude5.3 Classification of Scales
5.3.1 Single Item vs Multiple Item Scale5.3.2 Comparative vs Non-comparative Scales
5.4 Measurement Error5.4.1 Criteria for Good Measurement
5.5 Answers to Check Your Progress Questions5.6 Summary5.7 Key Words5.8 Self Assessment Questions and Exercises5.9 Further Readings
5.0 INTRODUCTION
In the previous unit, we studied the various types, sources and methods of collectingdata. In this unit, we will focus on different types of measurements and the statisticaltechniques that are applicable for the same. The various formats of a rating scaleand the construction of the attitude measurement scale, along with the descriptionof the distinct criteria involved in analysing a good measurement scale, are elaboratedin this unit.
The term ‘measurement’ means assigning numbers or some other symbolsto the characteristics of certain objects. When numbers are used, the researchermust have a rule for assigning a number to an observation in a way that providesan accurate description. We do not measure the object but some characteristicsof it. Therefore, in research, people/consumers are not measured; what is measuredonly are their perceptions, attitude or any other relevant characteristics. There aretwo reasons for which numbers are usually assigned. First of all, numbers permitstatistical analysis of the resulting data and secondly, they facilitate thecommunication of measurement results.
Attitude Measurementand Scaling
NOTES
Self-Instructional78 Material
Scaling is an extension of measurement. Scaling involves creating a continuumon which measurements on objects are located. Suppose you want to measurethe satisfaction level towards Kingfisher Airlines and a scale of 1 to 11 is used forthe said purpose. This scale indicates the degree of dissatisfaction, with 1 =extremely dissatisfied and 11 = extremely satisfied.
5.1 OBJECTIVES
After going through this unit, you will be able to:
Define measurement
Distinguish between the four types of measurement scales
Define attitude and its three components
Discuss the various classifications of scales
Define measurement error and explain the criteria for good measurement
5.2 TYPES OF MEASUREMENT SCALES
There are four types of measurement scales—nominal, ordinal, interval and ratio.We will discuss each one of them in detail. The choice of the measurement scalehas implications for the statistical technique to be used for data analysis.
Nominal scale: This is the lowest level of measurement. Here, numbers areassigned for the purpose of identification of the objects. Any object which isassigned a higher number is in no way superior to the one which is assigned alower number. Each number is assigned to only one object and each object hasonly one number assigned to it. It may be noted that the objects are divided intomutually exclusive and collectively exhaustive categories.
Example:
What is your religion?
(a) Hinduism
(b) Sikhism
(c) Christianity
(d) Islam
(e) Any other, (please specify)
A Hindu may be assigned a number 1, a Sikh may be assigned a number 2,a Christian may be assigned a number 3 and so on. Any religion which is assigneda higher number is in no way superior to the one which is assigned a lower number.The assignment of numbers is only for the purpose of identification.
NOTES
Self-InstructionalMaterial 79
Attitude Measurementand Scaling
Nominal scale measurements are used for identifying food habits (vegetarianor non-vegetarian), gender (male/female), caste, respondents, marital status, brands,attributes, stores, the players of a hockey team and so on.
The assigned numbers cannot be added, subtracted, multiplied or divided.The only arithmetic operations that can be carried out are the count of each category.Therefore, a frequency distribution table can be prepared for the nominal scalevariables and mode of the distribution can be worked out. One can also use chi-square test and compute contingency coefficient using nominal scale variables.
Ordinal scale: This is the next higher level of measurement than the nominal scalemeasurement. One of the limitations of the nominal scale measurements is that wecannot say whether the assigned number to an object is higher or lower than theone assigned to another option. The ordinal scale measurement takes care of thislimitation. An ordinal scale measurement tells whether an object has more or lessof characteristics than some other objects. However, it cannot answer how muchmore or how much less.
Example:
Rank the following attributes while choosing a restaurant for dinner. Themost important attribute may be ranked one, the next important may beassigned a rank of 2 and so on.
Attribute Rank
Food quality
Prices
Menu variety
Ambience
Service
In the ordinal scale, the assigned ranks cannot be added, multiplied,subtracted or divided. One can compute median, percentiles and quartilesof the distribution. The other major statistical analysis which can be carriedout is the rank order correlation coefficient, sign test. All the statisticaltechniques which are applicable in the case of nominal scale measurementcan also be used for the ordinal scale measurement. However, the reverseis not true. This is because ordinal scale data can be converted into nominalscale data but not the other way round.
Interval scale: The interval scale measurement is the next higher level ofmeasurement. It takes care of the limitation of the ordinal scale measurement wherethe difference between the score on the ordinal scale does not have any meaningfulinterpretation. In the interval scale the difference of the score on the scale hasmeaningful interpretation. It is assumed that the respondent is able to answer the
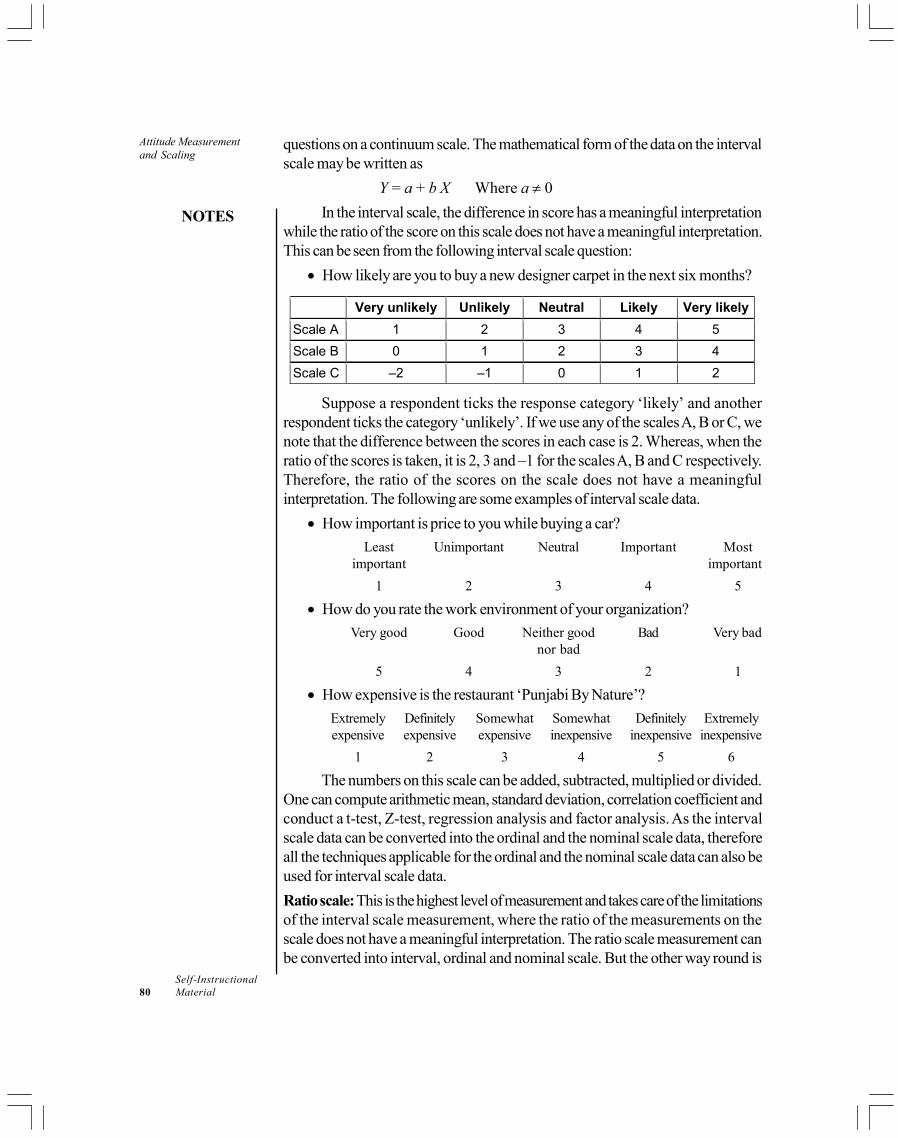
Attitude Measurementand Scaling
NOTES
Self-Instructional80 Material
questions on a continuum scale. The mathematical form of the data on the intervalscale may be written as
Y = a + b X Where a 0
In the interval scale, the difference in score has a meaningful interpretationwhile the ratio of the score on this scale does not have a meaningful interpretation.This can be seen from the following interval scale question:
How likely are you to buy a new designer carpet in the next six months?
Very unlikely Unlikely Neutral Likely Very likely
Scale A 1 2 3 4 5
Scale B 0 1 2 3 4
Scale C –2 –1 0 1 2
Suppose a respondent ticks the response category ‘likely’ and another
respondent ticks the category ‘unlikely’. If we use any of the scales A, B or C, wenote that the difference between the scores in each case is 2. Whereas, when theratio of the scores is taken, it is 2, 3 and –1 for the scales A, B and C respectively.Therefore, the ratio of the scores on the scale does not have a meaningfulinterpretation. The following are some examples of interval scale data.
How important is price to you while buying a car?
Least Unimportant Neutral Important Mostimportant important
1 2 3 4 5
How do you rate the work environment of your organization?
Very good Good Neither good Bad Very badnor bad
5 4 3 2 1
How expensive is the restaurant ‘Punjabi By Nature’?
Extremely Definitely Somewhat Somewhat Definitely Extremelyexpensive expensive expensive inexpensive inexpensive inexpensive
1 2 3 4 5 6
The numbers on this scale can be added, subtracted, multiplied or divided.One can compute arithmetic mean, standard deviation, correlation coefficient andconduct a t-test, Z-test, regression analysis and factor analysis. As the intervalscale data can be converted into the ordinal and the nominal scale data, thereforeall the techniques applicable for the ordinal and the nominal scale data can also beused for interval scale data.
Ratio scale: This is the highest level of measurement and takes care of the limitationsof the interval scale measurement, where the ratio of the measurements on thescale does not have a meaningful interpretation. The ratio scale measurement canbe converted into interval, ordinal and nominal scale. But the other way round is

NOTES
Self-InstructionalMaterial 81
Attitude Measurementand Scaling
not possible. The mathematical form of the ratio scale data is given by Y = b X. Inthis case, there is a natural zero (origin), whereas in the interval scale we had anarbitrary zero. Examples of the ratio scale data are weight, distance travelled,income and sales of a company, to mention a few.
All the mathematical operations can be carried out using the ratio scaledata. In addition to the statistical analysis mentioned in the interval, the ordinal andthe nominal scale data, one can compute coefficient of variation, geometric meanand harmonic mean using the ratio scale measurement.
5.2.1 Attitude
An attitude is viewed as an enduring disposition to respond consistently in a givenmanner to various aspects of the world, including persons, events and objects. Acompany is able to sell its products or services when its customers have a favourableattitude towards its products/services. In the reverse scenario, the company willnot be able to sustain itself for long. It, therefore, becomes very important tomeasure the attitude of the customers towards the company’s products/services.Unfortunately, attitude cannot be measured directly. In order to measure an attitude,we make an inference based on the perceptions the customers have about theproduct/services. The attitude is derived from the perceptions. If the consumershave a favourable perception towards the products/services, the attitude will befavourable. Therefore, the attitudes are indirectly observed.
Basically, attitude has three components: cognitive, affective and intention(or action) components.
Cognitive component: This component represents an individual’s informationand knowledge about an object. It includes awareness of the existence of theobject, beliefs about the characteristics or attributes of the object and judgementabout the relative importance of each of the attributes. In a survey, if the respondentsare asked to name the companies manufacturing plastic products, some respondentsmay remember names like Tupperware, Modicare and Pearl Pet. This is calledunaided recall awareness. More names are likely to be remembered when theinvestigator makes a mention of them. This is aided recall. The examples of beliefsor judgements could be that the products of Tupperware are of high quality, non-toxic and can be used in parties; a mutton dish can be cooked in a pressurecooker in less than 30 minutes and so on.
Affective component: The affective component summarizes a person’s overallfeeling or emotions towards the objects. The examples for this component couldbe: the food cooked in a pressure cooker is tasty, taste of orange juice is good orthe taste of bitter gourd is very bad.
Intention or action component: This component of an aptitude, also called thebehavioural component, reflects a predisposition to an action by reflecting theconsumer’s buying or purchase intention. It also reflects a person’s expectationsof future behaviour towards an object.

Attitude Measurementand Scaling
NOTES
Self-Instructional82 Material
There is a relationship between attitude and behaviour. If a consumer doesnot have a favourable attitude towards the product, he/she will certainly not buythe product. However, having a favourable attitude does not mean that it wouldbe reflected in the purchase behaviour. This is because intention to buy a producthas to be backed by the purchasing power of the consumer. Therefore, therelationship between the attitude and the purchase behaviour is a necessarycondition for the purchase of the product but it is not a sufficient condition. Thisrelationship could hold true at the aggregate level but not at the individual level.
Check Your Progress
1. State the limitation of nominal scale which is taken care of by the ordinalscale.
2. What is the highest level of measurement?
3. Define the intention component of attitude.
5.3 CLASSIFICATION OF SCALES
One of the ways of classifications of scales is in terms of the number of items in thescale. Based upon this, the following classification may be proposed:
5.3.1 Single Item vs Multiple Item Scale
Single item scale: In the single item scale, there is only one item to measure agiven construct. For example:
Consider the following question:
How satisfied are you with your current job?
Very Dissatisfied
Dissatisfied
Neutral
Satisfied
Very satisfied
The problem with the above question is that there are many aspects to ajob, like pay, work environment, rules and regulations, security of job andcommunication with the seniors. The respondent may be satisfied on some of thefactors but may not on others. By asking a question as stated above, it will bedifficult to analyse the problem areas. To overcome this problem, a multiple itemscale is proposed.
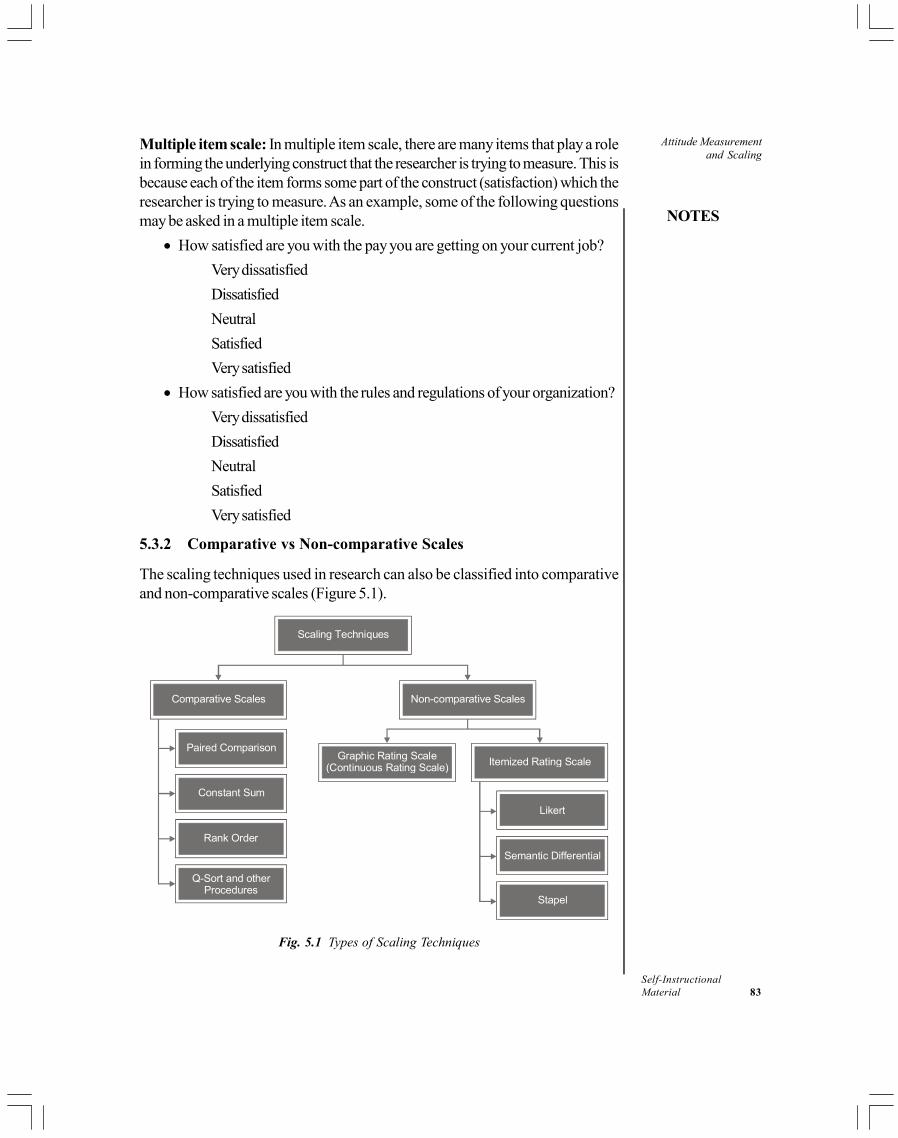
NOTES
Self-InstructionalMaterial 83
Attitude Measurementand Scaling
Multiple item scale: In multiple item scale, there are many items that play a rolein forming the underlying construct that the researcher is trying to measure. This isbecause each of the item forms some part of the construct (satisfaction) which theresearcher is trying to measure. As an example, some of the following questionsmay be asked in a multiple item scale.
How satisfied are you with the pay you are getting on your current job?
Very dissatisfied
Dissatisfied
Neutral
Satisfied
Very satisfied
How satisfied are you with the rules and regulations of your organization?
Very dissatisfied
Dissatisfied
Neutral
Satisfied
Very satisfied
5.3.2 Comparative vs Non-comparative Scales
The scaling techniques used in research can also be classified into comparativeand non-comparative scales (Figure 5.1).
Scaling Techniques
Comparative Scales Non-comparative Scales
Itemized Rating ScaleGraphic Rating Scale(Continuous Rating Scale)
Paired Comparison
Constant Sum
Rank Order
Q-Sort and otherProcedures
Likert
Semantic Differential
Stapel
Fig. 5.1 Types of Scaling Techniques
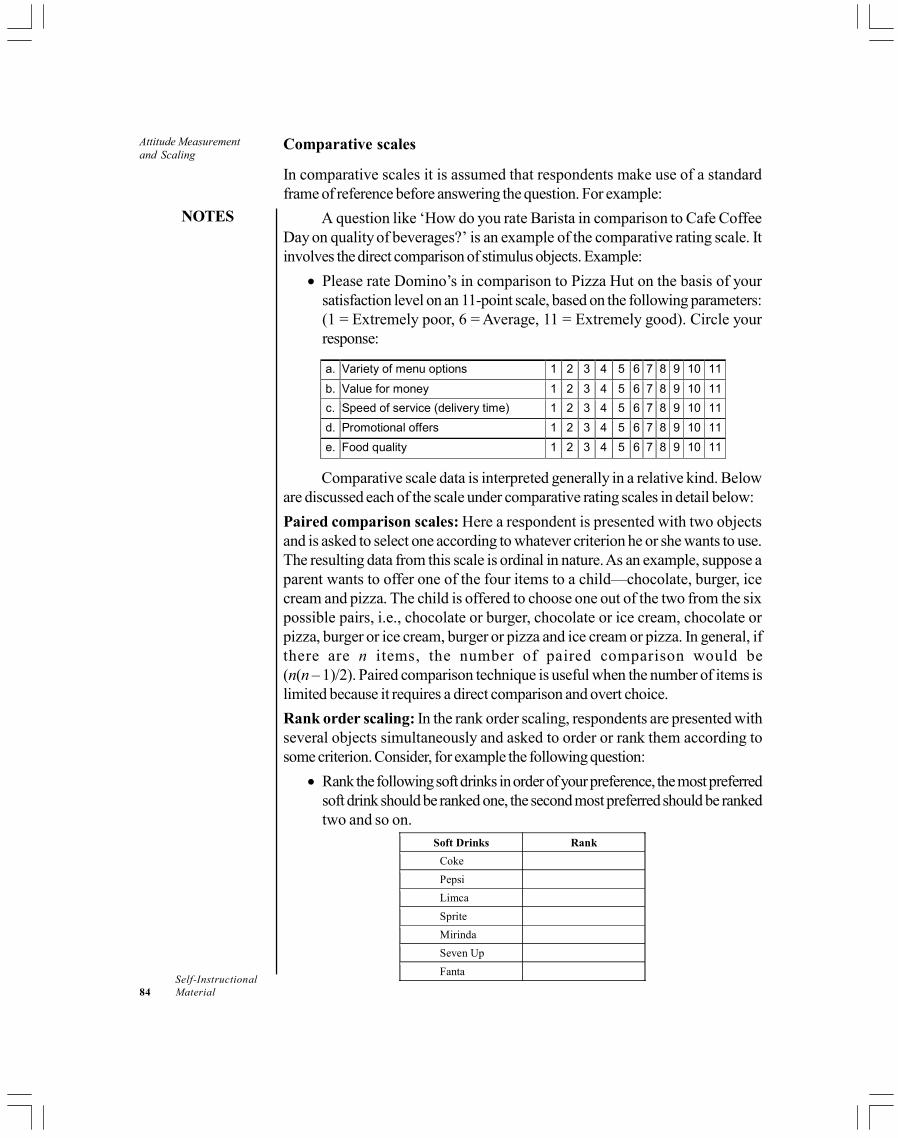
Attitude Measurementand Scaling
NOTES
Self-Instructional84 Material
Comparative scales
In comparative scales it is assumed that respondents make use of a standardframe of reference before answering the question. For example:
A question like ‘How do you rate Barista in comparison to Cafe CoffeeDay on quality of beverages?’ is an example of the comparative rating scale. Itinvolves the direct comparison of stimulus objects. Example:
Please rate Domino’s in comparison to Pizza Hut on the basis of yoursatisfaction level on an 11-point scale, based on the following parameters:(1 = Extremely poor, 6 = Average, 11 = Extremely good). Circle yourresponse:
a. Variety of menu options 1 2 3 4 5 6 7 8 9 10 11
b. Value for money 1 2 3 4 5 6 7 8 9 10 11
c. Speed of service (delivery time) 1 2 3 4 5 6 7 8 9 10 11
d. Promotional offers 1 2 3 4 5 6 7 8 9 10 11
e. Food quality 1 2 3 4 5 6 7 8 9 10 11
Comparative scale data is interpreted generally in a relative kind. Beloware discussed each of the scale under comparative rating scales in detail below:
Paired comparison scales: Here a respondent is presented with two objectsand is asked to select one according to whatever criterion he or she wants to use.The resulting data from this scale is ordinal in nature. As an example, suppose aparent wants to offer one of the four items to a child—chocolate, burger, icecream and pizza. The child is offered to choose one out of the two from the sixpossible pairs, i.e., chocolate or burger, chocolate or ice cream, chocolate orpizza, burger or ice cream, burger or pizza and ice cream or pizza. In general, ifthere are n items, the number of paired comparison would be(n(n – 1)/2). Paired comparison technique is useful when the number of items islimited because it requires a direct comparison and overt choice.
Rank order scaling: In the rank order scaling, respondents are presented withseveral objects simultaneously and asked to order or rank them according tosome criterion. Consider, for example the following question:
Rank the following soft drinks in order of your preference, the most preferredsoft drink should be ranked one, the second most preferred should be rankedtwo and so on.
Soft Drinks Rank
Coke
Pepsi
Limca
Sprite
Mirinda
Seven Up
Fanta

NOTES
Self-InstructionalMaterial 85
Attitude Measurementand Scaling
Like paired comparison, this approach is also comparative in nature. Theproblem with this scale is that if a respondent does not like any of the above-mentioned soft drink and is forced to rank them in the order of his choice, then, thesoft drink which is ranked one should be treated as the least disliked soft drinkand similarly, the other rankings can be interpreted. The rank order scaling resultsin the ordinal data.
Constant sum rating scaling: In constant sum rating scale, the respondents areasked to allocate a total of 100 points between various objects and brands. Therespondent distributes the points to the various objects in the order of his preference.Consider the following example:
Allocate a total of 100 points among the various schools into which youwould like to admit your child. The points should be allocated in such a waythat the sum total of the points allocated to various schools adds up to 100.
Schools Points
DPS
Mother’s International
APEEJAY
DAV Public School
Laxman Public School
TOTAL POINTS 100
Suppose Mother’s International is awarded 30 points, whereas LaxmanPublic School is awarded 15 points, one can make a statement that the respondentrates Mother’s International twice as high as Laxman Public School. This type ofdata is not only comparative in nature but could also result in ratio scale measurement.
Q-sort technique: This technique makes use of the rank order procedure inwhich objects are sorted into different piles based on their similarity with respectto certain criterion. Suppose there are 100 statements and an individual is askedto pile them into five groups, in such a way, that the strongly agreed statementscould be put in one pile, agreed statements could be put in another pile, neutralstatement form the third pile, disagreed statements come in the fourth pile andstrongly disagreed statements form the fifth pile, and so on. The data generated inthis way would be ordinal in nature. The distribution of the number of statement ineach pile should be such that the resulting data may follow a normal distribution.
Non-comparative scales
In the non-comparative scales, the respondents do not make use of any frame ofreference before answering the questions. The resulting data is generally assumedto be interval or ratio scale.
The non-comparative scales are divided into two categories, namely, thegraphic rating scales and the itemized rating scales. A useful and widely used itemizedrating scale is the Likert scale.

Attitude Measurementand Scaling
NOTES
Self-Instructional86 Material
Graphic rating scale
This is a continuous scale, also called graphic rating Scale. In the graphic ratingscale the respondent is asked to tick his preference on a graph. Consider forexample the following question:
Please put a tick mark () on the following line to indicate your preferencefor fast food.
LeastPreferred
MostPreferred
1 7
To measure the preference of an individual towards the fast food one has tomeasure the distance from the extreme left to the position where a tick mark hasbeen put. Higher the distance, higher would be the individual preference for fastfood. This scale suffers from two limitations—one, if a respondent has put a tickmark at a particular position and after ten minutes, he or she is given another formto put a tick mark, it will virtually be impossible to put a tick at the same positionas was done earlier. Does it mean that the respondent’s preference for fast foodhas undergone a change in 10 minutes? The basic assumption in this scale is thatthe respondents can distinguish the fine shade in differences between the preference/attitude which need not be the case. Further, the coding, editing and tabulation ofdata generated through such a procedure is a very tedious task and researcherstry to avoid using it.
Itemized rating scale
In the itemized rating scale, the respondents are provided with a scale that has anumber of brief descriptions associated with each of the response categories. Theresponse categories are ordered in terms of the scale position and the respondentsare supposed to select the specified category that describes in the best possibleway an object is rated. There are certain issues that should be kept in mind whiledesigning the itemized rating scale. These issues are:
Number of categories to be used: There is no hard and fast rule as to howmany categories should be used in an itemized rating scale. However, it is a practiceto use five or six categories. Some researches are of the opinion that more thanfive categories should be used in situations where small changes in attitudes are tobe measured. There are others that argue that the respondents would find it difficultto distinguish between more than five categories.
Odd or even number of categories: It has been a matter of debate among theresearchers as to whether odd or even number of categories are to be used. Byusing even number of categories the scale would not have a neutral category andthe respondent will be forced to choose either the positive or the negative side ofthe attitude. If odd numbers of categories are used, the respondent has the freedomto be neutral if he wants to be so.

NOTES
Self-InstructionalMaterial 87
Attitude Measurementand Scaling
Balanced versus unbalanced scales: A balanced scale is the one which hasequal number of favourable and unfavourable categories. The following is theexample of a balanced scale:
How important is price to you in buying a new car?
Very important
Relatively important
Neither important nor unimportant
Relatively unimportant
Very unimportant
In this question, there are five response categories, two of which emphasizethe importance of price and two others that do not show its importance. Themiddle category is neutral.
The following is the example of the unbalanced scale.
How important is price to you in buying a new car?
More important than any other factor
Extremely important
Important
Somewhat important
Unimportant
In this question there are four response categories that are skewed towardsthe importance given to the price, whereas one category is for the unimportantside. Therefore, this question is an unbalanced question.
Nature and degree of verbal description: Many researchers believe that eachcategory must have a verbal, numerical or pictorial description. Verbal descriptionshould be clearly and precisely worded so that the respondents are able todifferentiate between them. Further, the researcher must decide whether to labelevery scale category, some scale categories, or only extreme scale categories.
Forced versus non-forced scales: In the forced scale, the respondent is forcedto take a stand, whereas in the non-forced scale, the respondent can be neutral ifhe/she so desires. The argument for a forced scale is that those who are reluctantto reveal their attitude are encouraged to do so with the forced scale. Pairedcomparison scale, rank order scale and constant sum rating scales are examplesof forced scales.
Physical form: There are many options that are available for the presentation ofthe scales. It could be presented vertically or horizontally. The categories could beexpressed in boxes, discrete lines or as units on a continuum. They may or maynot have numbers assigned to them. The numerical values, if used, may be positive,negative or both.
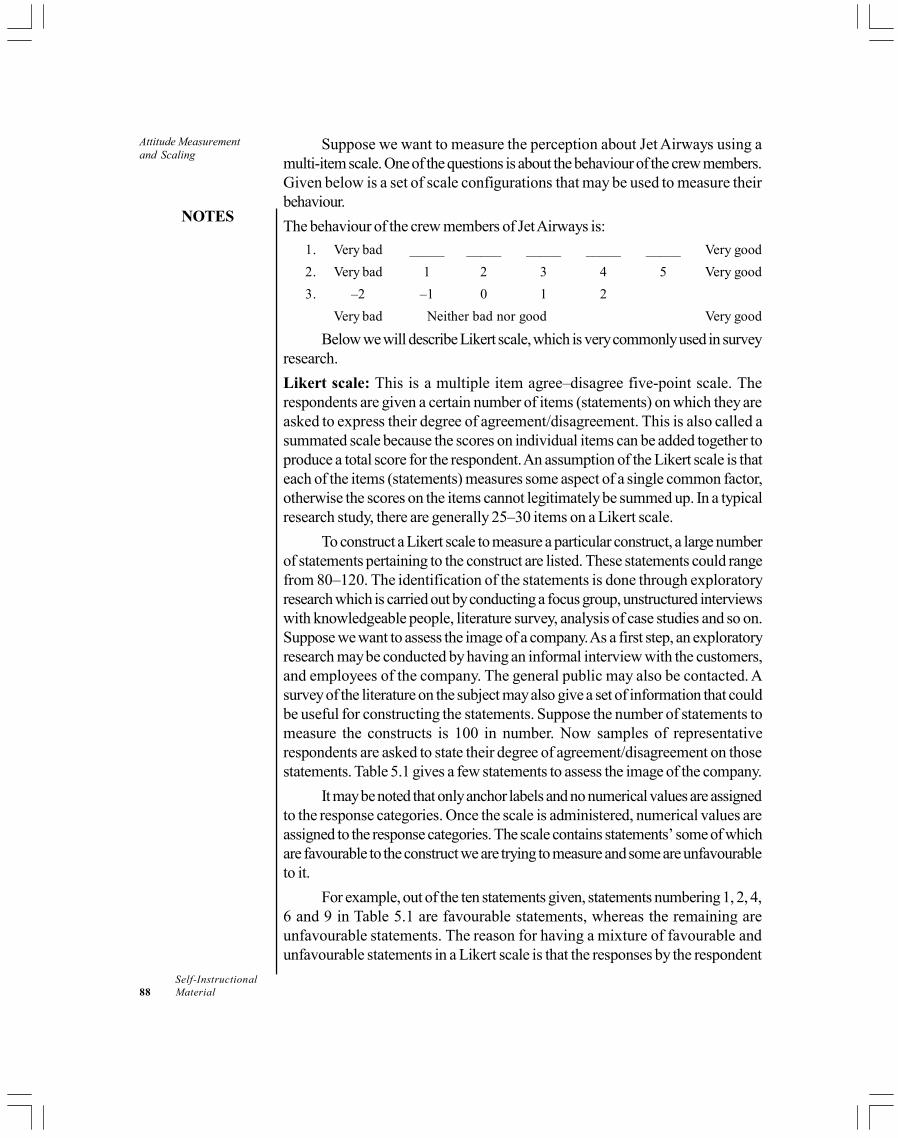
Attitude Measurementand Scaling
NOTES
Self-Instructional88 Material
Suppose we want to measure the perception about Jet Airways using amulti-item scale. One of the questions is about the behaviour of the crew members.Given below is a set of scale configurations that may be used to measure theirbehaviour.
The behaviour of the crew members of Jet Airways is:
1. Very bad _____ _____ _____ _____ _____ Very good
2. Very bad 1 2 3 4 5 Very good
3. –2 –1 0 1 2
Very bad Neither bad nor good Very good
Below we will describe Likert scale, which is very commonly used in surveyresearch.
Likert scale: This is a multiple item agree–disagree five-point scale. Therespondents are given a certain number of items (statements) on which they areasked to express their degree of agreement/disagreement. This is also called asummated scale because the scores on individual items can be added together toproduce a total score for the respondent. An assumption of the Likert scale is thateach of the items (statements) measures some aspect of a single common factor,otherwise the scores on the items cannot legitimately be summed up. In a typicalresearch study, there are generally 25–30 items on a Likert scale.
To construct a Likert scale to measure a particular construct, a large numberof statements pertaining to the construct are listed. These statements could rangefrom 80–120. The identification of the statements is done through exploratoryresearch which is carried out by conducting a focus group, unstructured interviewswith knowledgeable people, literature survey, analysis of case studies and so on.Suppose we want to assess the image of a company. As a first step, an exploratoryresearch may be conducted by having an informal interview with the customers,and employees of the company. The general public may also be contacted. Asurvey of the literature on the subject may also give a set of information that couldbe useful for constructing the statements. Suppose the number of statements tomeasure the constructs is 100 in number. Now samples of representativerespondents are asked to state their degree of agreement/disagreement on thosestatements. Table 5.1 gives a few statements to assess the image of the company.
It may be noted that only anchor labels and no numerical values are assignedto the response categories. Once the scale is administered, numerical values areassigned to the response categories. The scale contains statements’ some of whichare favourable to the construct we are trying to measure and some are unfavourableto it.
For example, out of the ten statements given, statements numbering 1, 2, 4,6 and 9 in Table 5.1 are favourable statements, whereas the remaining areunfavourable statements. The reason for having a mixture of favourable andunfavourable statements in a Likert scale is that the responses by the respondent
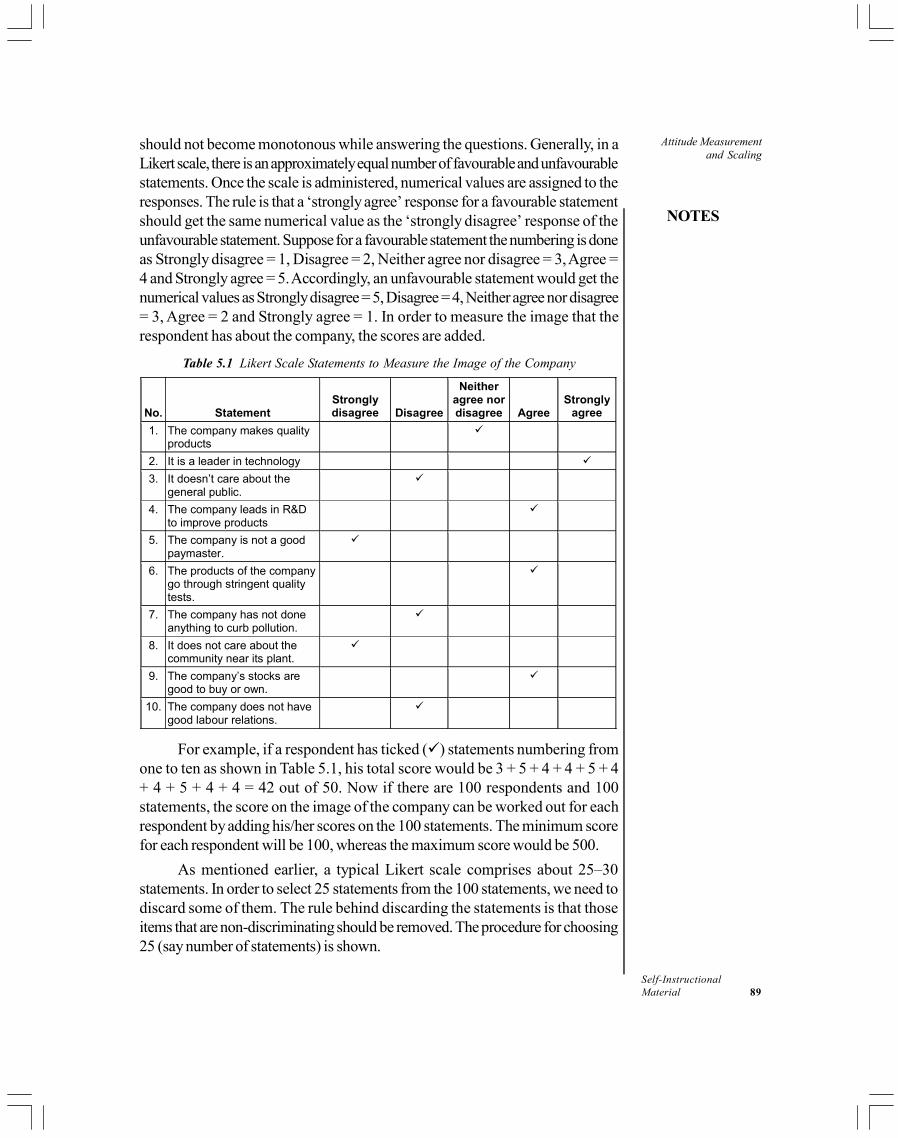
NOTES
Self-InstructionalMaterial 89
Attitude Measurementand Scaling
should not become monotonous while answering the questions. Generally, in aLikert scale, there is an approximately equal number of favourable and unfavourablestatements. Once the scale is administered, numerical values are assigned to theresponses. The rule is that a ‘strongly agree’ response for a favourable statementshould get the same numerical value as the ‘strongly disagree’ response of theunfavourable statement. Suppose for a favourable statement the numbering is doneas Strongly disagree = 1, Disagree = 2, Neither agree nor disagree = 3, Agree =4 and Strongly agree = 5. Accordingly, an unfavourable statement would get thenumerical values as Strongly disagree = 5, Disagree = 4, Neither agree nor disagree= 3, Agree = 2 and Strongly agree = 1. In order to measure the image that therespondent has about the company, the scores are added.
Table 5.1 Likert Scale Statements to Measure the Image of the Company
No. Statement Strongly disagree Disagree
Neither agree nor disagree Agree
Strongly agree
1. The company makes quality products
2. It is a leader in technology
3. It doesn’t care about the general public.
4. The company leads in R&D to improve products
5. The company is not a good paymaster.
6. The products of the company go through stringent quality tests.
7. The company has not done anything to curb pollution.
8. It does not care about the community near its plant.
9. The company’s stocks are good to buy or own.
10. The company does not have good labour relations.
For example, if a respondent has ticked () statements numbering from
one to ten as shown in Table 5.1, his total score would be 3 + 5 + 4 + 4 + 5 + 4+ 4 + 5 + 4 + 4 = 42 out of 50. Now if there are 100 respondents and 100statements, the score on the image of the company can be worked out for eachrespondent by adding his/her scores on the 100 statements. The minimum scorefor each respondent will be 100, whereas the maximum score would be 500.
As mentioned earlier, a typical Likert scale comprises about 25–30statements. In order to select 25 statements from the 100 statements, we need todiscard some of them. The rule behind discarding the statements is that thoseitems that are non-discriminating should be removed. The procedure for choosing25 (say number of statements) is shown.

Attitude Measurementand Scaling
NOTES
Self-Instructional90 Material
As mentioned earlier, the score for each of the respondents on each of thestatements can be used to measure his/her total score about the image of thecompany. The data may look as given in Table 5.2.
Table 5.2 Total Score and Individual Score of Each Respondent on Various Statements
Scores of Statements Resp. No. 1 2 3 .......... i ..........
. j ........... 100 Total Score
1 - - - .......... 5 .......... .
4 ........... - 410
2 - - - .......... 4 .......... .
2 ........... - 209
3 - - - .......... - .......... .
- ........... - -
- - - - .......... - .......... .
- ........... - -
100 - - - .......... - ...........
- ........... - -
Table 5.2 shows that the total score for respondent no. 1 is 410, whereas
for respondent no. 2 it is 209. This means that respondent no. 1 has a morefavourable image for the company as compared to respondent no. 2. Now, inorder to select 25 statements, let us consider statements numbering i and j. Wenote that the statement no. j is more discriminating as compared to statement no.i. This is because the score on statement j is very highly correlated with the totalscore as compared to the scores on statement i. Therefore, if we have to choosebetween i and j, we will choose statement no. j. From this we can conclude thatonly those statements will be selected which have a very high correlation with thetotal score. Therefore, the 100 correlations are to be arranged in the descendingorder of magnitudes corresponding to each statement and only top 25 statementshaving a high correlation with the total score need to be selected.
Check Your Progress
4. What is the Q-sort technique?
5. Give some examples of forced scales.
6. Why is the Likert scale also called a summated scale?
5.4 MEASUREMENT ERROR
Measurement error occurs when the observed measurement on a construct orconcept deviates from its true values. The following is a list of the sources ofmeasurement errors.
There are factors like mood, fatigue and health of the respondent whichmay influence the observed response while the instrument is beingadministered. The other factors could be education, job, awareness of topicand reluctance to express an opinion.
NOTES
Self-InstructionalMaterial 91
Attitude Measurementand Scaling
The variations in the environment in which measurements are taken mayalso result in a departure from the true value.
At times, the errors may be committed at the time of coding, entering ofdata from questionnaire to the spreadsheet on the computer and at thetabulation stage. The other reasons could be defective instrument for datacollection like lengthy and ambiguous questionnaire with leading questions(suggestive responses) in the instrument.
The observed measurement in any research need not be equal to the truemeasurement. The observed measurement can be written as
O = T + S + R
Where, O = Observed measurement
T = True score
S = Systematic error
R = Random error
It may be noted that the total error consists of two components—systematicerror and random error. Systematic error causes a constant bias in the measurement.Suppose there is a weighing scale that weighs 50 gm less for every one kg ofproduct being weighed. The error would consistently remain the same irrespectiveof the kind of product and the time at which product is weighed. Random error onthe other hand involves influences that bias the measurements but are not systematic.Suppose we use different weighing scales to weigh one kg of a product and ifsystematic error is assumed to be absent, we may find that recorded weights mayfall within a range around the true value of the weight, thereby causing randomerror.
5.4.1 Criteria for Good Measurement
There are three criteria for evaluating measurements: reliability, validity and sensitivity.It may be noted that there is a relationship between reliability and sensitivity. If wewant to make an item more sensitive, it may be achieved at the cost of reliability.This means to get more sensitivity, the researcher might have to compromise withreliability.
1. Reliability
Reliability is concerned with consistency, accuracy and predictability of the scale.It refers to the extent to which a measurement process is free from random errors.The reliability of a scale can be measured using the following methods:
Test–retest reliability: In this method, repeated measurements of the same personor group using the same scale under similar conditions are taken. A very highcorrelation between the two scores indicates that the scale is reliable. The researcherhas to be careful in deciding the time difference between two observations. If thetime difference between two observations is very small it is very likely that therespondent would give same answer which could result in higher correlation. Further
Attitude Measurementand Scaling
NOTES
Self-Instructional92 Material
if the difference is too large, the attitude might have undergone a change duringthat period, resulting in a weak correlation and hence poor reliability. Thereforeresearcher have to be very careful in deciding the time difference betweenobservation. Generally, a time difference of about 5-6 months is considered as anideal period.
Split-half reliability method: This method is used in the case of multiple itemscales. Here the number of items is randomly divided into two parts and acorrelation coefficient between the two is obtained. A high correlation indicatesthat the internal consistency of the construct leads to greater reliability.
2. Validity
The validity of a scale refers to the question whether we are measuring what wewant to measure. Validity of the scale refers to the extent to which the measurementprocess is free from both systematic and random errors. The validity of a scale isa more serious issue than reliability. There are different ways to measure validity.
Content validity: This is also called face validity. It involves subjective judgementby an expert for assessing the appropriateness of the construct. For example, tomeasure the perception of a customer towards Kingfisher Airlines, a multiple itemscale is developed. A set of 15 items is proposed. These items when combined inan index measure the perception of Kingfisher Airlines. In order to judge the contentvalidity of these 15 items, a set of experts may be requested to examine therepresentativeness of the 15 items. The items covered may be lacking in the contentvalidity if we have omitted behaviour of the crew, food quality, and food quantity,etc., from the list. In fact, conducting the exploratory research to exhaust the list ofitems measuring perception of the airline would be of immense help in such a case.
Predictive validity: This involves the ability of a measured phenomena at onepoint of time to predict another phenomenon at a future point of time. If thecorrelation coefficient between the two is high, the initial measure is said to have ahigh predictive ability. As an example, consider the use of the common admissiontest (CAT) to shortlist candidates for admission to the MBA programme in abusiness school. The CAT scores are supposed to predict the candidate’s aptitudefor studies towards business education.
3. Sensitivity
Sensitivity refers to an instrument’s ability to accurately measure the variability in aconcept. A dichotomous response category such as agree or disagree does notallow the recording of any attitude changes. A more sensitive measure with numerouscategories on the scale may be required. For example, adding ‘strongly agree’,‘agree’, ‘neither agree nor disagree’, ‘disagree and ‘strongly disagree’ categorieswill increase the sensitivity of the scale.
The sensitivity of scale based on a single question or a single item can beincreased by adding questions or items. In other words, because compositemeasures allow for a greater range of possible scores, they are more sensitivethan a single-item scale.
NOTES
Self-InstructionalMaterial 93
Attitude Measurementand Scaling
Check Your Progress
7. What are systematic errors?
8. Name the method in which the number of items is randomly divided intotwo parts and a correlation coefficient between the two is obtained.
5.5 ANSWERS TO CHECK YOUR PROGRESSQUESTIONS
1. One of the limitation of the nominal scale measurements is that we cannotsay whether the assigned number to an object is higher or lower than theone assigned to another option. The ordinal scale measurement takes careof this limitation.
2. The highest level of measurement is the ratio scale.
3. The intention component of attitude also called the behavioural component,reflects a predisposition to an action by reflecting the consumer’s buying orpurchase intention.
4. The Q-sort technique makes use of the rank order procedure in whichobjects are sorted into different piles based on their similarity with respectto certain criterion.
5. Some examples of forced scales include paired comparison scale, rankorder scale and constant sum rating scales.
6. The Likert scale is also called as summated scale because the scores onindividual items can be added together to produce a total score for therespondent.
7. Systematic errors are one of the components of total error which causes aconstant bias in the measurement.
8. Split-half reliability method is the method in which the number of items israndomly divided into two parts and a correlation between the two isobtained.
5.6 SUMMARY
Measurement means the assignment of numbers or other symbols to thecharacteristics of certain objects. Scaling is an extension of measurement.Scaling involves creating a continuum on which measurements on the objectsare located. There are four types of measurement scales: nominal, ordinal,interval and ratio scale.

Attitude Measurementand Scaling
NOTES
Self-Instructional94 Material
Attitude is a predisposition of the individual to evaluate some objects orsymbol. Attitude has three components: cognitive, affective andintention or action component.
Scales can be classified as single-item and multiple-item scales. Anotherclassification could be whether the scales are comparative or non-comparative in nature.
The observed measurement need not be equal to the true value ofthe measurement. Some systematic and random errors may be found in theobserved measurement. There are three criteria for determining the accuracyof a measurement—reliability, validity and sensitivity.
5.7 KEY WORDS
Balanced scale: A scale that has equal number of favourable andunfavourable categories.
Comparative scale: A scale in which respondents make use of somestandard frame of reference before answering the question.
Forced scale: A scale in which the respondent is forced to take a stand
Interval scale: A scale that makes use of an arbitrary origin.
Validity: It deals with whether a scale measures what it is supposed tomeasure.
5.8 SELF ASSESSMENT QUESTIONS ANDEXERCISES
Short-Answer Questions
1. What is the meaning of measurement in research? Give examples.
2. Outline the steps involved in constructing a Likert scale.
3. Briefly explain the concepts of reliability, validity and sensitivity.
Long-Answer Questions
1. Discuss four types of measurements using examples.
2. Define attitude. What are its various components?
3. Explain an itemized rating scale. What are the various issues involved inconstructing an itemized rating scale?

NOTES
Self-InstructionalMaterial 95
Attitude Measurementand Scaling5.9 FURTHER READINGS
Chawla D and Sondhi N. 2016. Research Methodology: Concepts and Cases,2nd edition. New Delhi: Vikas Publishing House.
Easterby-Smith, M, Thorpe, R and Lowe, A. 2002. Management Research: AnIntroduction, 2nd edn. London: Sage.
Grinnell, Richard Jr (ed.). 1993. Social Work, Research and Evaluation 4th
edn. Itasca, Illinois: F E Peacock Publishers.
Kerlinger, Fred N. 1986. Foundations of Behavioural Research, 3rd edn. NewYork: Holt, Rinehart and Winston.

Questionnaire Design
NOTES
Self-Instructional96 Material
UNIT 6 QUESTIONNAIRE DESIGN
Structure
6.0 Introduction6.1 Objectives6.2 The Questionnaire Method
6.2.1 Types of Questionnaire6.3 Process of Questionnaire Designing6.4 Advantages and Disadvantages of the Questionnaire Method6.5 Answers to Check Your Progress Questions6.6 Summary6.7 Key Words6.8 Self Assessment Questions and Exercises6.9 Further Readings
6.0 INTRODUCTION
In Unit 4, we discussed some of the methods of primary data like observation,focus group discussion and interviews. However, a discussion on data collectionwould be incomplete if one did not talk about the questionnaire method. This isthe most cost effective and widely used method, apart from being extremely userfriendly. The questionnaire method is flexible enough to reveal data that is in therespondents own words and language. It can be made extremely scientific byframing questions which enable a very advanced level of quantitative measurementand analysis. The pattern of questioning is always designed, keeping in mind therespondent’s comfort and ease of answering. Today, with the wide use of technologyit is very easy to use the questionnaire method even without being present physicallyin front of the respondent.
Even though all of us have filled a questionnaire at some time or the otherand know what it must have, designing a well structured and study specificquestionnaire requires a structured and logical path so that the effort of collectinginformation using the questionnaire is meaningful. In this unit you will learn aboutthe various aspects of the questionnaire method in detail. The entire process ofquestionnaire designing will be discussed at length, with special reference to thedifferent kinds of questionnaires available to the researcher.
6.1 OBJECTIVES
After going through this unit, you will be able to:
Recognize the relevance on the questionnaire method in research
Describe the step-wise process involved in the design of a questionnaire
NOTES
Self-InstructionalMaterial 97
Questionnaire Design Define the content of the questions
Define the flow and sequence in the questioning method
Recognize the advantages and disadvantages of using the questionnaire
6.2 THE QUESTIONNAIRE METHOD
The questionnaire is a research technique that consists of a series of questionsasked to respondents, in order to obtain statistically useful information about agiven topic. It is one of the most cost-effective methods of collecting primary data,which can be used with considerable ease by most individual and businessresearchers. It has the advantage of flexibility of approach and can be successfullyadapted for most research studies. The instrument has been defined differently byvarious researchers. Some take the traditional view of a written document requiringthe subject to record his/her own responses (Kervin,1999). Others have taken abroader perspective to include structured interview also as a questionnaire (Bell,1999). It is essentially a data-collection instrument that has a predesigned set ofquestions, following a particular structure (De Vaus, 2002). Since it includes astandard set of questions, it can be successfully used to collect information from alarge sample in a reasonably short time period.
However, the use of questionnaire is not always the best method in all researchstudies. For example, at the exploratory stage, rather than questionnaire, it isadvisable to use a more unstructured interview. Secondly, when the number ofrespondents is small and one has to collect more subjective data, then a questionnaireis not advisable.
Criteria for designning a questionnaire
There are certain criteria that must be kept in mind while designing the questionnaire.The first and foremost requirement is that the spelt-out research objectives mustbe converted into clear questions which will extract answers from the respondent.This is not as easy as it sounds, for example, if one wants to know how many timesyour teacher praised you in the week? It is very difficult to give an exact number.The second requirement is, it should be designed to engage the respondent andencourage a meaningful response. For example, a questionnaire measuring stresscannot have a voluminous set of questions which fatigue the subject. The questions,thus, should encourage response and be easy to understand. Lastly, the questionsshould be self-explanatory and not confusing as then the person will answer theway he understood the question and not in terms of what was asked. This will bediscussed in detail later, when we discuss the wording of the questions.
6.2.1 Types of Questionnaire
There are many different types of questionnaire available to the researcher. Thecategorization can be done on the basis of a variety of parameters. The two criteria

Questionnaire Design
NOTES
Self-Instructional98 Material
that are most frequently used for designing purposes are the degree of structureand the degree of concealment. Structure refers to the degree to which the responsecategory has been defined. Concealment refers to the degree to which the purposeof the study is explained to the respondent.
Instead of considering them as individual types, most research studies use amixed format. Thus, they will be discussed here as a two-by-two matrix(Table 6.1).
Table 6.1 Types of Questionnaire
FORMALIZED NON FORMALIZED
UNCONCEALED
CONCEALED
The response categorieshave more flexibility
Questionnaires using projectivetechniques or sociometric analysis
Most research studies useStandardised Questionnaires like these
Used for assessing psychographicand subjective constructs
Let us discuss the types of questionnaires. Qustionnaires can be categorizedon the basis of their structure or method of administration.
Based on the structure, questionnaires can be divided into the followingcategories:
Formalized and unconcealed questionnaire: This is the one that is the mostfrequently used by all management researchers. For example, if a new brokeragefirm wants to understand the investment behaviour of people, they would structurethe questions and answers as follows:
1. Do you carry out any investment(s)?
Yes ________ No _________
If yes, continue, else terminate.
2. Out of the following options, where do you invest? (tick all that apply).
Precious metals _________, real estate _________, stocks _________,
government instruments _________, mutual funds _________,
any other _________.
This kind of structured questionnaire is easy to administer, and has both thequestions as self-explanatory and the answer categories clearly defined.
Formalized and concealed questionnaire: These questionnaires have a formalmethod of questioning; however the purpose is not clear to the respondent. Theresearch studies which are trying to find out the latent causes of behaviour andcannot rely on direct questions use these. For example young people cannot beasked direct questions on whether they are likely to indulge in corruption at work.Thus, the respondent has to be given a set of questions that can give an indicationof what are his basic values, opinions and beliefs, as these would influence how hewould react to issues.
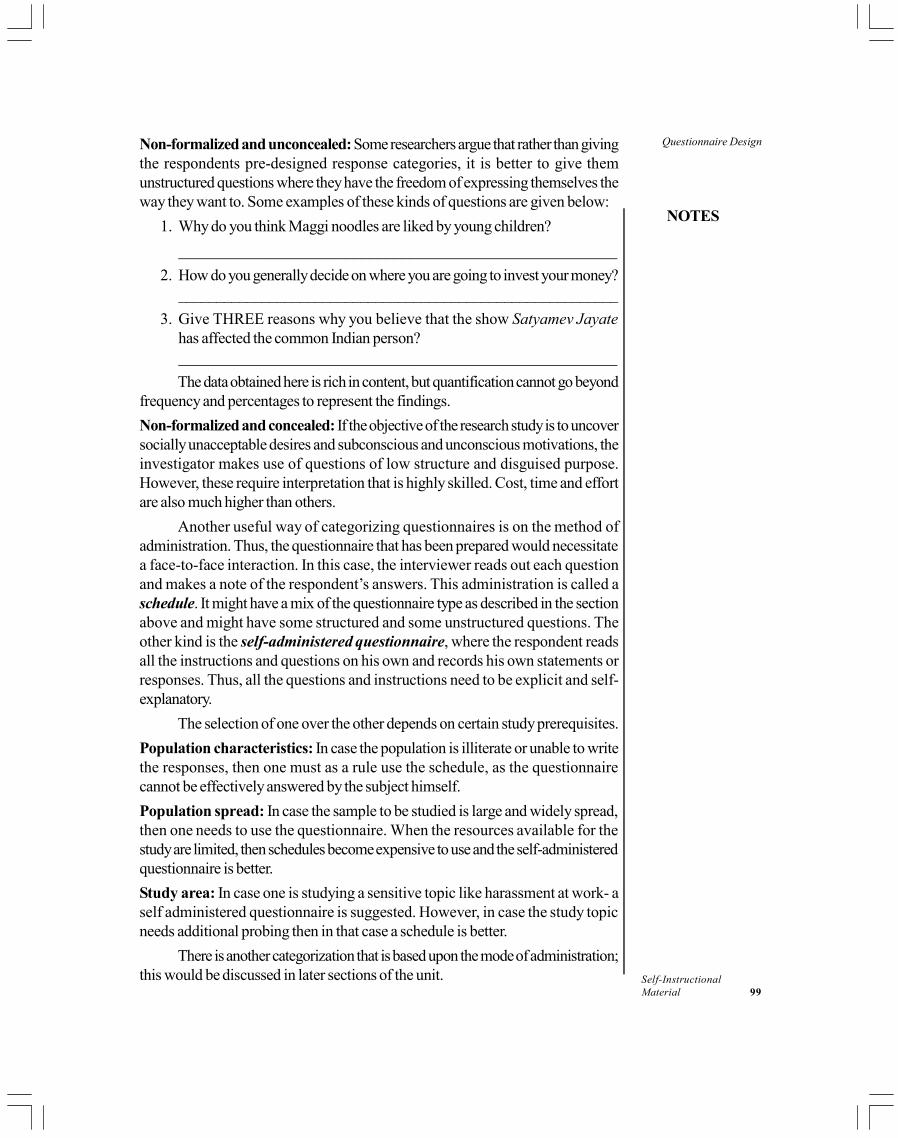
NOTES
Self-InstructionalMaterial 99
Questionnaire DesignNon-formalized and unconcealed: Some researchers argue that rather than givingthe respondents pre-designed response categories, it is better to give themunstructured questions where they have the freedom of expressing themselves theway they want to. Some examples of these kinds of questions are given below:
1. Why do you think Maggi noodles are liked by young children?
_______________________________________________________
2. How do you generally decide on where you are going to invest your money?__________________________________________________________
3. Give THREE reasons why you believe that the show Satyamev Jayatehas affected the common Indian person?_______________________________________________________
The data obtained here is rich in content, but quantification cannot go beyondfrequency and percentages to represent the findings.
Non-formalized and concealed: If the objective of the research study is to uncoversocially unacceptable desires and subconscious and unconscious motivations, theinvestigator makes use of questions of low structure and disguised purpose.However, these require interpretation that is highly skilled. Cost, time and effortare also much higher than others.
Another useful way of categorizing questionnaires is on the method ofadministration. Thus, the questionnaire that has been prepared would necessitatea face-to-face interaction. In this case, the interviewer reads out each questionand makes a note of the respondent’s answers. This administration is called aschedule. It might have a mix of the questionnaire type as described in the sectionabove and might have some structured and some unstructured questions. Theother kind is the self-administered questionnaire, where the respondent readsall the instructions and questions on his own and records his own statements orresponses. Thus, all the questions and instructions need to be explicit and self-explanatory.
The selection of one over the other depends on certain study prerequisites.
Population characteristics: In case the population is illiterate or unable to writethe responses, then one must as a rule use the schedule, as the questionnairecannot be effectively answered by the subject himself.
Population spread: In case the sample to be studied is large and widely spread,then one needs to use the questionnaire. When the resources available for thestudy are limited, then schedules become expensive to use and the self-administeredquestionnaire is better.
Study area: In case one is studying a sensitive topic like harassment at work- aself administered questionnaire is suggested. However, in case the study topicneeds additional probing then in that case a schedule is better.
There is another categorization that is based upon the mode of administration;this would be discussed in later sections of the unit.
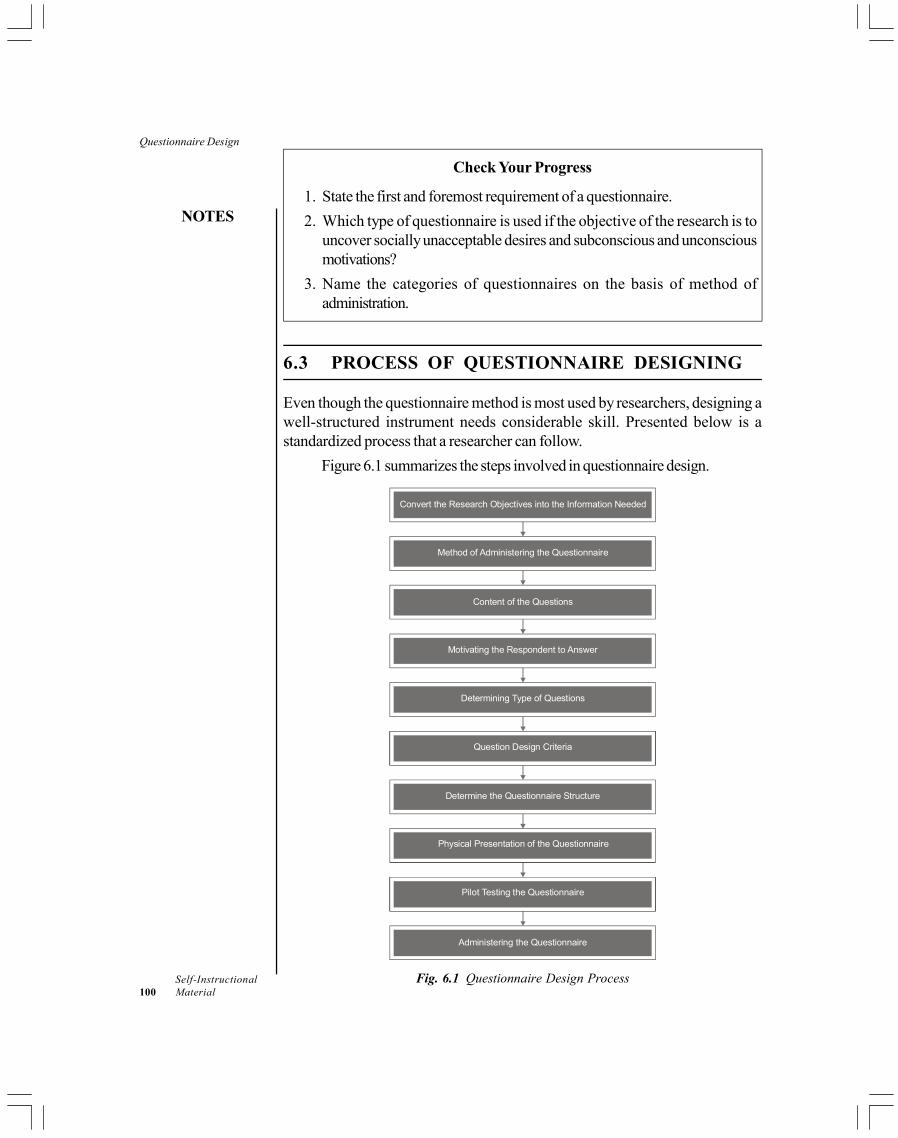
Questionnaire Design
NOTES
Self-Instructional100 Material
Check Your Progress
1. State the first and foremost requirement of a questionnaire.
2. Which type of questionnaire is used if the objective of the research is touncover socially unacceptable desires and subconscious and unconsciousmotivations?
3. Name the categories of questionnaires on the basis of method ofadministration.
6.3 PROCESS OF QUESTIONNAIRE DESIGNING
Even though the questionnaire method is most used by researchers, designing awell-structured instrument needs considerable skill. Presented below is astandardized process that a researcher can follow.
Figure 6.1 summarizes the steps involved in questionnaire design.
Convert the Research Objectives into the Information Needed
Content of the Questions
Method of Administering the Questionnaire
Motivating the Respondent to Answer
Determining Type of Questions
Pilot Testing the Questionnaire
Question Design Criteria
Determine the Questionnaire Structure
Physical Presentation of the Questionnaire
Administering the Questionnaire
Fig. 6.1 Questionnaire Design Process
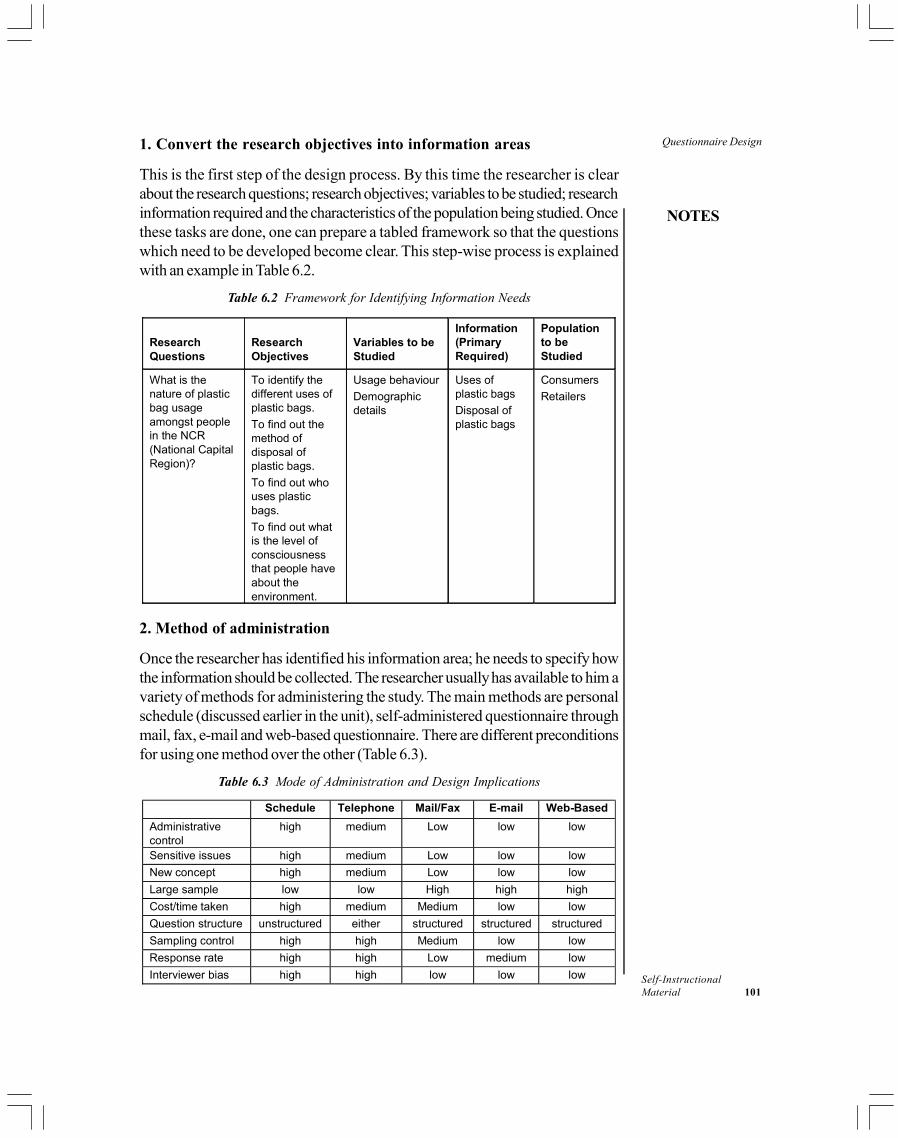
NOTES
Self-InstructionalMaterial 101
Questionnaire Design1. Convert the research objectives into information areas
This is the first step of the design process. By this time the researcher is clearabout the research questions; research objectives; variables to be studied; researchinformation required and the characteristics of the population being studied. Oncethese tasks are done, one can prepare a tabled framework so that the questionswhich need to be developed become clear. This step-wise process is explainedwith an example in Table 6.2.
Table 6.2 Framework for Identifying Information Needs
Research Questions
Research Objectives
Variables to be Studied
Information (Primary Required)
Population to be Studied
What is the nature of plastic bag usage amongst people in the NCR (National Capital Region)?
To identify the different uses of plastic bags.
To find out the method of disposal of plastic bags.
To find out who uses plastic bags.
To find out what is the level of consciousness that people have about the environment.
Usage behaviour
Demographic details
Uses of plastic bags
Disposal of plastic bags
Consumers
Retailers
2. Method of administration
Once the researcher has identified his information area; he needs to specify howthe information should be collected. The researcher usually has available to him avariety of methods for administering the study. The main methods are personalschedule (discussed earlier in the unit), self-administered questionnaire throughmail, fax, e-mail and web-based questionnaire. There are different preconditionsfor using one method over the other (Table 6.3).
Table 6.3 Mode of Administration and Design Implications
Schedule Telephone Mail/Fax E-mail Web-Based
Administrative control
high medium Low low low
Sensitive issues high medium Low low low
New concept high medium Low low low
Large sample low low High high high
Cost/time taken high medium Medium low low
Question structure unstructured either structured structured structured
Sampling control high high Medium low low
Response rate high high Low medium low
Interviewer bias high high low low low

Questionnaire Design
NOTES
Self-Instructional102 Material
3. Content of the questionnaire
The next step is to determine the matter to be included as questions in the measure.The researcher needs to do an objective quality check in order to see what researchobjective/information need the question would be covering before using any of theframed questions.
How essential is it to ask the question? You must remember that the time of therespondent is precious and it should not be wasted. Unless a question is adding tothe data needed for getting an answer to the research problem, it should not beincluded. For example, if one is studying the usage of plastic bags, then demographicquestions on age group, occupation, education and gender might make sense butquestions related to marital status, family size and the state to which the respondentbelongs are not required as they have no direct relation with the usage or attitudetowards plastic bags.
Sometimes, especially in self-administered questionnaires, one may ask someneutral questions at the beginning of the questionnaire to establish an involvementand rapport. For example, for a biofertilizer usage study, the following questionwas asked:
Farming for you is a:
noble professionancestral professionprofession like any otherprofession that is not money makingany other
Do we need to ask several questions instead of a single one? Afterdeciding on the significance of the question, one needs to ascertain whether asingle question will serve the purpose or should more than one question be asked.For example, in a TV serial study, one may give ten popular serials to be rankedas 1 to 10 in order of preference. Then the second question after the rankingquestion is:
‘Why do you like the serial __________ (the one you ranked No. 1/preferwatching most)?’ (Incorrect)
Here, one lady might say, ‘Everyone in my family watches it’. While anothermight say, ‘It deals with the problems of living in a typical Indian joint family system’and yet another might say, ‘My friend recommended it to me’.
Thus, we need to ask her:
‘What do you like about__________?’
‘Who all in your household watch the serial?’
and
‘How did you first hear about the serial?’ (Correct)

NOTES
Self-InstructionalMaterial 103
Questionnaire Design4. Motivating the respondent to answer
The questionnaire should be designed in a manner that it involves the respondentand motivates him/her to give information. There are different situations whichmight lead to this. Each of these is examined separately here:
Does the person have the required information? It has been found that theperson has had no experience with the issue being studied. Look at the followingquestion:
How do you evaluate the negotiation skills module, viz., the communicationand presentation skill module? (Incorrect)
In this case it might be that the person has not undergone one or even boththe modules, so how can he compare? Thus, certain qualifying or filter questionsmust be asked. Filter questions enable the researcher to filter out the respondentswho are not adequately informed. Thus, the correct question would have been:
Have you been through the following training modules?
Negotiation skills module Yes/no
Communication and presentation skills Yes/no
In case the answer to both is yes, please answer the following question, orelse move to the next question.
How do you evaluate the negotiation skills module, viz., the communicationand presentation skill module? (Correct)
Does the person remember? Many a times, the question addressed might beputting too much stress on an individual’s memory. For example, consider thefollowing questions:
How much did you spend on eating out last month? (Incorrect)
Such questions are beyond any normal individual’s memory bank. Thus, thequestions listed above could have been rephrased as follows:
When you go out to eat, on an average your bill amount is:
Less than 100101–250251–500
More than 500
How often do you eat out in a week?
1–2 times3–4 times5–6 timesEvery day (correct)
Can the respondent articulate? Sometimes the respondent might not know howto put the answer in clear words. For example, if you ask a respondent to:
Describe a river rafting experience.
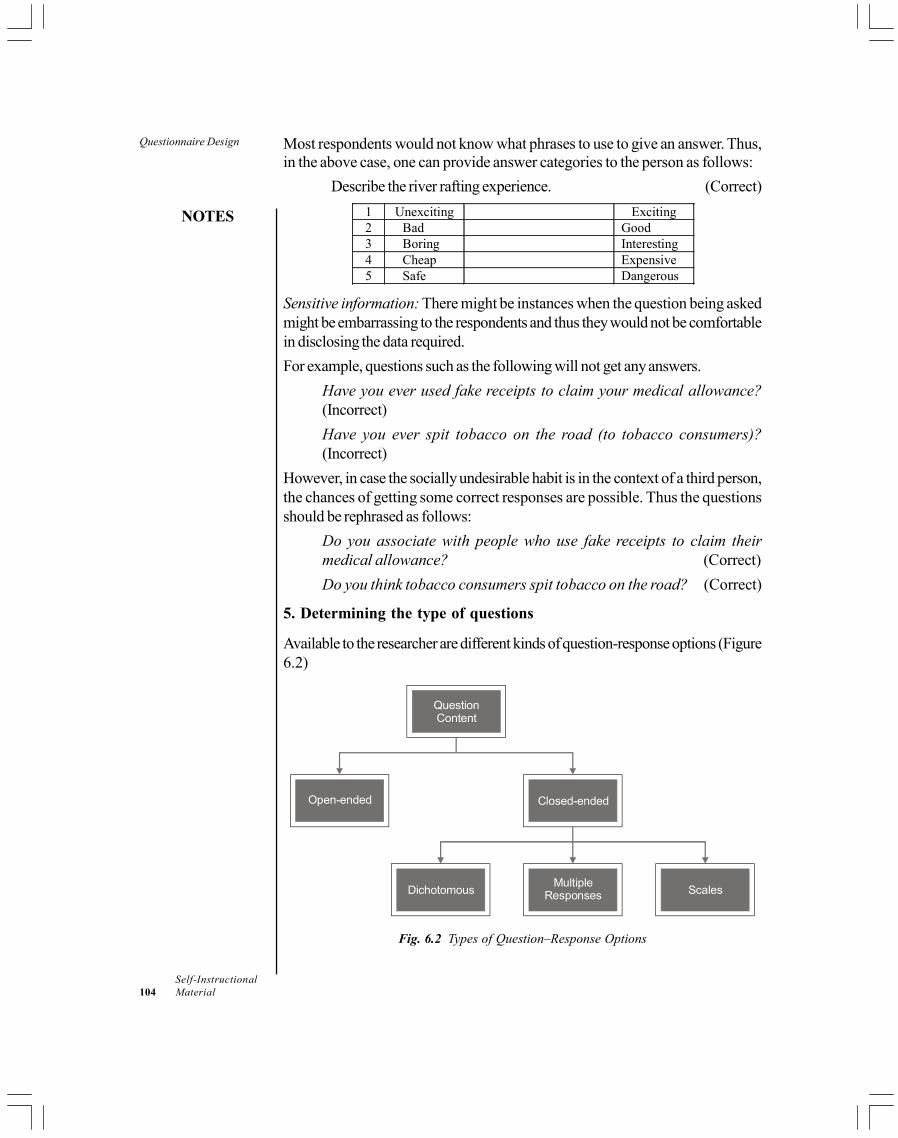
Questionnaire Design
NOTES
Self-Instructional104 Material
Most respondents would not know what phrases to use to give an answer. Thus,in the above case, one can provide answer categories to the person as follows:
Describe the river rafting experience. (Correct)
1 Unexciting Exciting 2 Bad Good 3 Boring Interesting 4 Cheap Expensive 5 Safe Dangerous
Sensitive information: There might be instances when the question being askedmight be embarrassing to the respondents and thus they would not be comfortablein disclosing the data required.
For example, questions such as the following will not get any answers.
Have you ever used fake receipts to claim your medical allowance?(Incorrect)
Have you ever spit tobacco on the road (to tobacco consumers)?(Incorrect)
However, in case the socially undesirable habit is in the context of a third person,the chances of getting some correct responses are possible. Thus the questionsshould be rephrased as follows:
Do you associate with people who use fake receipts to claim theirmedical allowance? (Correct)
Do you think tobacco consumers spit tobacco on the road? (Correct)
5. Determining the type of questions
Available to the researcher are different kinds of question-response options (Figure6.2)
Closed-endedOpen-ended
QuestionContent
DichotomousMultiple
Responses Scales
Fig. 6.2 Types of Question–Response Options

NOTES
Self-InstructionalMaterial 105
Questionnaire DesignOpen-ended questions
In open-ended questions, the openness refers to the option of answering in one’sown words. They are also referred to as unstructured questions or free-responseor free-answer questions. Some illustrations of this type are listed below:
What is your age?
Which is your favourite TV serial?
I like Nescafe because ________________________
My career goal is to ________________________
Closed-ended questions
In closed-ended questions, both the question and response formats are structuredand defined.There are three kinds of formats as we observed earlier—dichotomousquestions, multiple–choice questions and those that have a scaled response.
i. Dichotomous questions: These are restrictive alternatives and provide therespondents only with two answers. These could be ‘yes’ or ‘no’, like or dislike,similar or different, married or unmarried, etc.
Are you diabetic? Yes/No
Have you read the new book by Dan Brown? Yes/no
What kind of petrol do you use in your car? Normal/Premium
Dichotomous questions are the easiest type of questions to code and analyse.They are based on the nominal level of measurement and are categorical or binaryin nature.
ii. Multiple-choice questions: Unlike dichotomous questions, the person is givena number of response alternatives here. He might be asked to choose the one thatis most applicable. For example, this question was given to a retailer who is currentlynot selling organic food products:
Will you consider selling organic food products in your store?
Definitely not in the next one year Probably not in the next one year
Undecided Probably in the next one year
Definitely in the next one year
Sometimes, multiple-choice questions do not have verbal but rather numericaloptions for the respondent to choose from, for example:
How much do you spend on grocery products (average in one month)?
Less than 2500/-
Between 2500–5000/-
More than 5000/-
Most multiple-choice questions are based upon ordinal or interval level ofmeasurement. There could also be instances when multiple options are given to
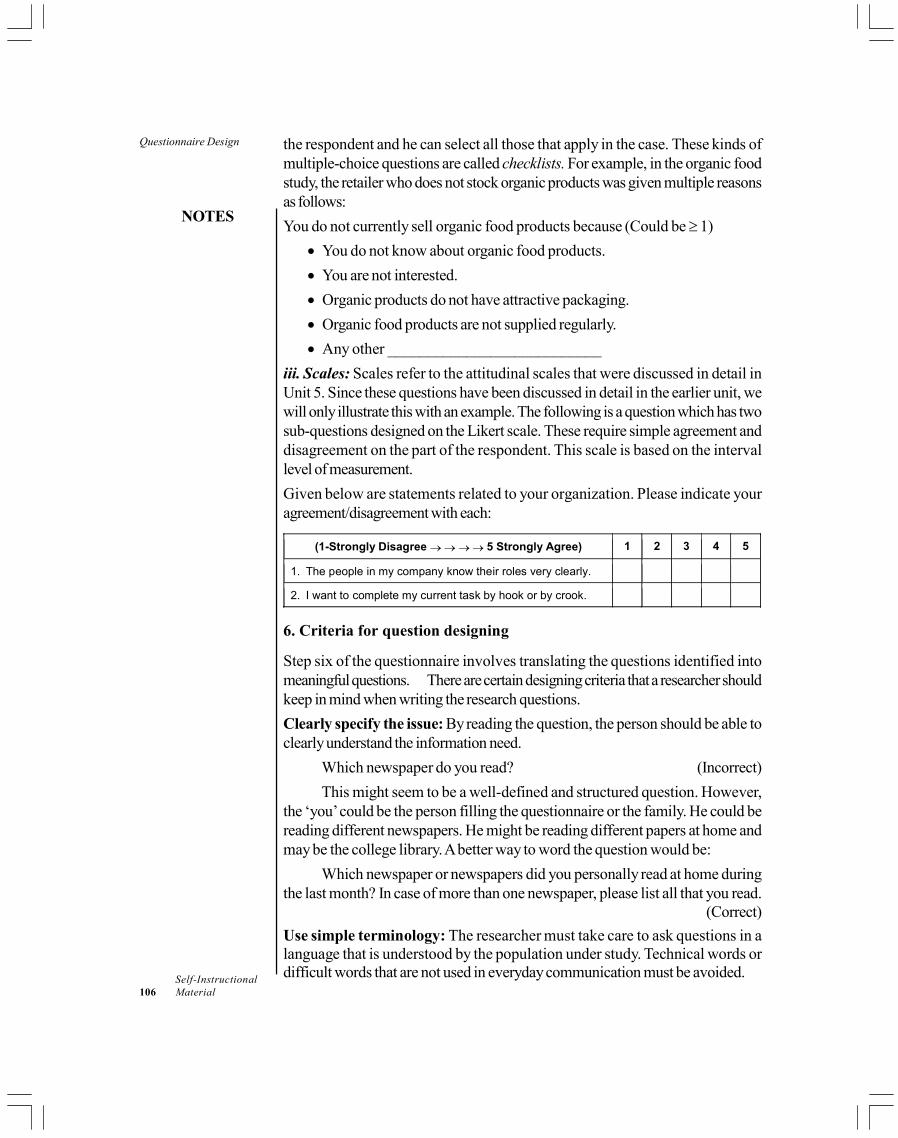
Questionnaire Design
NOTES
Self-Instructional106 Material
the respondent and he can select all those that apply in the case. These kinds ofmultiple-choice questions are called checklists. For example, in the organic foodstudy, the retailer who does not stock organic products was given multiple reasonsas follows:
You do not currently sell organic food products because (Could be 1)
You do not know about organic food products.
You are not interested.
Organic products do not have attractive packaging.
Organic food products are not supplied regularly.
Any other ___________________________
iii. Scales: Scales refer to the attitudinal scales that were discussed in detail inUnit 5. Since these questions have been discussed in detail in the earlier unit, wewill only illustrate this with an example. The following is a question which has twosub-questions designed on the Likert scale. These require simple agreement anddisagreement on the part of the respondent. This scale is based on the intervallevel of measurement.
Given below are statements related to your organization. Please indicate youragreement/disagreement with each:
(1-Strongly Disagree 5 Strongly Agree) 1 2 3 4 5
1. The people in my company know their roles very clearly.
2. I want to complete my current task by hook or by crook.
6. Criteria for question designing
Step six of the questionnaire involves translating the questions identified intomeaningful questions. There are certain designing criteria that a researcher shouldkeep in mind when writing the research questions.
Clearly specify the issue: By reading the question, the person should be able toclearly understand the information need.
Which newspaper do you read? (Incorrect)
This might seem to be a well-defined and structured question. However,the ‘you’ could be the person filling the questionnaire or the family. He could bereading different newspapers. He might be reading different papers at home andmay be the college library. A better way to word the question would be:
Which newspaper or newspapers did you personally read at home duringthe last month? In case of more than one newspaper, please list all that you read.
(Correct)
Use simple terminology: The researcher must take care to ask questions in alanguage that is understood by the population under study. Technical words ordifficult words that are not used in everyday communication must be avoided.

NOTES
Self-InstructionalMaterial 107
Questionnaire DesignDo you think thermal wear provides immunity? (Incorrect)
Do you think that thermal wear provides you protection from the cold?(Correct)
Avoid ambiguity in questioning: The words used in the questionnaire shouldmean the same thing to all those answering the questionnaire. A lot of words aresubjective and relative in meaning. Consider the following question:
How often do you visit Pizza Hut?
Never
Occasionally
Sometimes
Often
Regularly (Incorrect)
These are ambiguous measures, as occasionally in the above question,might be three to four times in a week for one person it, while for another it couldbe three times in a month. A much better wording for this question would be thefollowing:
In a typical month, how often do you visit Pizza Hut?
Less than once
1 or 2 times
3 or 4 times
More than 4 times (Correct)
Avoid leading questions: Any question that provides a clue to the respondentsin terms of the direction in which one wants them to answer is called a leading orbiasing question. For example, ‘Do you think that working mothers should buyready-to-eat food when that might contain some chemical preservatives?
Yes
No
Don’t know (Incorrect)
The question would mostly generate a negative answer, as no working motherwould like to buy something that is convenient but might be harmful. Thus, it isadvisable to construct a neutral question as follows:
Do you think that working mothers should buy ready-to-eat food?
Yes
No
Don’t know (Correct)
Avoid loaded questions: Questions that address sensitive issues are termed asloaded questions and the response to these questions might not always be honest,as the person might not wish to admit the answer. For example, questions such asfollows will rarely get an affirmative answer:
Questionnaire Design
NOTES
Self-Instructional108 Material
Will you take dowry when you get married? (Incorrect)
Sensitive questions like this can be rephrased in a variety of ways. For example,the question could be constructed in the context of a third person as follows:
Do you think most Indian men would take dowry when they get married?(Correct)
Avoid double-barrelled questions: Questions that have two separate optionsseparated by an ‘or’ or ‘and’ like the following:
Do you think Nokia and Samsung have a wide variety of touchphones? Yes/No (Incorrect)
The problem is that the respondent might believe that Nokia has betterphones or Samsung has better phones or both. These questions are referred to asdouble-barrelled and the researcher should always split them into two separatequestions. For example,
A wide variety of touch phones is available for:
Nokia
Samsung
Both (Correct)
7. Determine the questionnaire structure
The questions now have to be put together in a proper sequence.
Instructions: The questionnaires always, even the schedules, begin withstandardized instructions. These begin by greeting the respondent and thenintroducing the researcher and then the purpose of questionnaire administration.For example, in the study on organic food products, the following instructionswere given at the beginning of the questionnaire:
‘Hi. We __________ are carrying out a market research on the purchasebehaviour of grocery products/organic food. We are conducting a survey ofconsumers, retailers and experts in the NCR for the same.
As you are involved in the purchase and/or consumption of food products,we seek your cooperation for providing the following relevant information for ourresearch. Thank you very much.’
Opening questions: After instructions come the opening questions, which leadthe reader into the study topic. For example, a questionnaire on understanding theconsumer’s buying behavior in malls can ask an opening question that is generic innature, such as:
What is your opinion about shopping at a mall?
Study questions: After the opening questions, the bulk of the instrument needs tobe devoted to the main questions that are related to the specific information needs
NOTES
Self-InstructionalMaterial 109
Questionnaire Designof the study. Here also, the general rule is that the simpler questions, which do notrequire a lot of thinking or response time should be asked first as they build thetempo for answering the more difficult/sensitive questions later on. This method ofgoing in a sequential manner from the general to the specific is called the funnelapproach.
Classification information: This is the information that is related to the basicsocio-economic and demographic traits of the person. These might include name(kept optional in some cases), address, e-mail address and telephone number.
Acknowledgement: The questionnaire ends by acknowledging the inputs of therespondent and thanking him for his cooperation and valuable contribution.
8. Physical characteristics of the questionnaire
The researcher must pay special attention to the look of the questionnaire. Thefirst thing is the quality of the paper on which the questionnaire is printed whichshould be of good quality. The font style and spacing used in the entire documentshould be uniform. One must ensure that every question and its response optionsare printed on the same page. Surveys for different groups could be on differentcoloured paper. For example, if Delhi is being studied as five zones, then thequestionnaire used in each zone could be printed on a differently coloured paper.Each question and section must be numbered properly. In case there is any responseinstruction for an individual question, it must be before the question. In case thequestionnaire is going to be administered by the investigator and if there are anyprobing question then they should be clearly written as instructions for theinvestigator.
9. Pilot testing of the questionnaire
Pilot testing refers to testing and administering the designed instrument on a smallgroup of people from the population under study. This is to essentially cover anyerrors that might have still remained even after the earlier eight steps. For examplethe question wording may not be clear, the sequence of questions may not becorrect or the question is not needed as it does not solve any purpose. Thus theseaspects need to be corrected.Every aspect of the questionnaire has to be testedand one must record all the experiences of the conduction, including the timetaken to administer it. Sometimes, the researcher might also get the questionnairewhetted by academic or industry experts for their inputs. As far as possible, thepilot should be a small scale replica of the actual survey that would be subsequentlyconducted.
10. Administering the questionnaire
Once all the nine steps have been completed, the final instrument is ready forconduction and the questionnaire needs to be administered according to thesampling plan.

Questionnaire Design
NOTES
Self-Instructional110 Material
6.4 ADVANTAGES AND DISADVANTAGES OF THEQUESTIONNAIRE METHOD
The questionnaire has many advantages over the other data collection methodsdiscussed earlier.
Probably the greatest benefit of the method is its adaptability. There is,actually speaking, no domain or branch for which a questionnaire cannotbe designed. It can be shaped in a manner that can be easily understood bythe population under study. The language, the content and the manner ofquestioning can be modified suitably. The instrument is particularly suitablefor studies that are trying to establish the reasons for certain occurrences orbehaviour.
The second advantage is that it assures anonymity if it is self-administeredby the respondent, as there is no pressure or embarrassment in revealingsensitive data. A lot of questionnaires do not even require the person to fillin his/her name. Administering the questionnaire is much faster and lessexpensive as compared to other primary and a few secondary sources aswell. There is considerable ease of quantitative coding and analysis of theobtained information as most response categories are closed-ended andbased on the measurement levels as discussed in Unit 5. The chance ofresearcher bias is very little here.
Lastly, there is no pressure of immediate response, thus the subject can fillin the questionnaire whenever he or she wants.
The questionnaire is the most economical method as it can be administeredsimultaneously to a number of respondents. Thus a large amount of datacan be collected within a short time through a questionnaire.
However, the method does not come without any disadvantages.
The major disadvantage is that the inexpensive standardized instrument haslimited applicability, that is, it can be used only with those who can read andwrite.
The questionnaire is an impersonal method and sometimes for a sensitiveissue it may not reveal the actual reasons or answers to the questionsthatyou asked.The return ratio, i.e., the number of people who return the dulyfilled in questionnaires are sometimes not even 50 per cent of the number offorms distributed.
Skewed sample response could be another problem. This can occur in twocases; one, if the investigator distributes the same to his friends andacquaintances and second, because of the self-selection of the subjects.This means that the ones who fill in the questionnaire and return it might notbe the representatives of the population at large. In case the person is notclear about a question, clarification with the researcher might not be possible.

NOTES
Self-InstructionalMaterial 111
Questionnaire Design
Check Your Progress
4. What are some of the other names for open-ended questions?
5. Name the method in which sampling control is the highest.
6. ‘Do you sing and dance?’ is an example of which type of question?
7. State the greatest benefit of the questionnaire method.
6.5 ANSWERS TO CHECK YOUR PROGRESSQUESTIONS
1. The first and foremost requirement of a questionnaire is that the spelt-outresearch objectives must be converted into clear questions which will extractanswers from the respondent.
2. The non-formalized and concealed questionnaire is used if the objective ofthe research is to uncover socially unacceptable desires and subconsciousand unconscious motivations.
3. The categories of questionnaires on the basis of method of administrationare schedule and self-administered questionnaire.
4. The other names for open-ended questions are unstructured questions orfree-response or free-answer questions.
5. Schedule is the method in which sampling control is the highest.
6. ‘Do you sing and dance?’ is an example of a double-barreled question.
7. The greatest benefit of the questionnaire method is its adaptability.
6.6 SUMMARY
The questionnaire is a research technique that consists of a series of questionsasked to respondents, in order to obtain statistically useful information abouta given topic.
It is one of the most cost-effective methods of collecting primary data, whichhas the advantage of flexibility of approach and can be successfully adaptedfor most research studies.
There are many different types of questionnaire available to the researcher.
Based on the structure, questioannaires can be categorized into unconcealedand formalized, concealed and formalized, unconcealed and non-formalizedand concealed and non-formalized.
Based on the method of administration, the questionnaire could be in theform of a schedule or self-administered questionnaire.
Questionnaire Design
NOTES
Self-Instructional112 Material
6.7 KEY WORDS
Questionnaire: A research tool that consists of a series of questions askedto respondents, in order to obtain statistically useful information about agiven topic.
Schedule: Questionnaire with a face-to-face interaction in which theinterviewer reads out each question and makes a note of the respondent’sanswers.
Dichotomous questions: Questions with restrictive alternatives that providethe respondents only with two answers.
Double-barrelled questions: Questions that have two separate optionsseparated by an ‘or’ or ‘and’.
6.8 SELF ASSESSMENT QUESTIONS ANDEXERCISES
Short-Answer Questions
1. What is a questionnaire? What are the criteria of a sound questionnaire?
2. Write short notes on the following:
(a) Formalized and concealed questionnaire
(b) Non-formalized and unconcealed questionnaire
(c) Non-formalized and concealed questionnaire
3. What are the different criteria for designing questions in a questionnaire?
Long-Answer Questions
1. What are the steps involved in the questionnaire design? Explain in detailthe questionnaire design process.
2. What are the advantages and disadvantages of the questionnaire method?Illustrate with suitable examples.
6.9 FURTHER READINGS
Bell, J. 1999. Doing Your Research Project. 3rd edn. Buckingham: Open UniversityPress.
De Vaus, D A. 2002. Surveys in Social Research. 5th edn. London: Routledge.
Kervin, J B. 1999. Methods for Business Research, 2nd edn. Reading, MA:Addison-Wesley.
NOTES
Self-InstructionalMaterial 113
Sampling
UNIT 7 SAMPLING
Structure
7.0 Introduction7.1 Objectives7.2 Sampling Concepts
7.2.1 Sample vs Census7.2.2 Sampling vs Non-Sampling Error
7.3 Sampling Design7.3.1 Probability Sampling Design7.3.2 Non-probability Sampling Designs
7.4 Determination of Sample Size7.4.1 Sample Size for Estimating Population Mean7.4.2 Determination of Sample Size for Estimating the Population Proportion
7.5 Answers to Check Your Progress Questions7.6 Summary7.7 Key Words7.8 Self Assessment Questions and Exercises7.9 Further Readings
7.0 INTRODUCTION
In Unit 5, we discussed the concept of attitude measurement and scaling. In thisunit, we will discuss an important aspect of research – sampling. Let us understandwhat is sampling and what role it plays in research.
As we have discussed earlier, research objectives are generally translatedinto research questions that enable the researchers to identify the information needs.Once the information needs are specified, the sources of collecting the informationare sought. Some of the information may be collected through secondary sources(published material), whereas the rest may be obtained through primary sources.The primary methods of collecting information could be the observation method,personal interview with questionnaire (which we learnt in previous unit), telephonesurveys and mail surveys. Surveys are, therefore, useful in information collection,and their analysis plays a vital role in finding answers to research questions. Surveyrespondents should be selected using the appropriate procedures; otherwise theresearchers may not be able to get the right information to solve the problemunder investigation. This is done through sampling.
In this unit, we will discuss in detail the concept of sampling, including samplingand non-sampling error, probability and non-probability sampling designs, as wellas determination of sample size.
Sampling
NOTES
Self-Instructional114 Material
7.1 OBJECTIVES
After going through this unit, you will be able to:
Explain the basic concepts of sampling.
Distinguish between sample and census.
Differentiate between a sampling and non-sampling error.
Describe the meaning of sampling design.
Explain different types of probability sampling designs.
Describe various types of non-probability sampling designs.
Estimate the sample size required while estimating the population mean andproportion.
7.2 SAMPLING CONCEPTS
The process of selecting the right individuals, objects or events for a study isknown as sampling. Sampling involves the study of a small number of individuals,objects chosen from a larger group. Before we get into the details of variousissues pertaining to sampling, it would be appropriate to discuss some of thesampling concepts.
Population: Population refers to any group of people or objects that form thesubject of study in a particular survey and are similar in one or more ways. Forexample, the number of full-time MBA students in a business school could formone population. If there are 200 such students, the population size would be 200.We may be interested in understanding their perceptions about business education.If, in an organization there are 1,000 engineers, out of which 350 are mechanicalengineers and we are interested in examining the proportion of mechanical engineerswho intend to leave the organization within six months, all the 350 mechanicalengineers would form the population of interest. If the interest is in studying howthe patients in a hospital are looked after, then all the patients of the hospital wouldfall under the category of population.
Element: An element comprises a single member of the population. Out of the350 mechanical engineers mentioned above, each mechanical engineer would forman element of the population.
Sampling frame: Sampling frame comprises all the elements of a population withproper identification that is available to us for selection at any stage of sampling.For example, the list of registered voters in a constituency could form a samplingframe; the telephone directory; the number of students registered with a university;the attendance sheet of a particular class and the payroll of an organization areexamples of sampling frames. When the population size is very large, it becomesvirtually impossible to form a sampling frame. We know that the number of
NOTES
Self-InstructionalMaterial 115
Samplingconsumers of soft drinks is very large and, therefore, it becomes very difficult toform the sampling frame for the same.
Sample: It is a subset of the population. It comprises only some elements of thepopulation. If out of the 350 mechanical engineers employed in an organization,30 are surveyed regarding their intention to leave the organization in the next sixmonths, these 30 members would constitute the sample.
Sampling unit: A sampling unit is a single member of the sample. If a sample of50 students is taken from a population of 200 MBA students in a business school,then each of the 50 students is a sampling unit.
Sampling: It is a process of selecting an adequate number of elements from thepopulation so that the study of the sample will not only help in understanding thecharacteristics of the population but also enables us to generalize the results. Wewill see later that there are two types of sampling designs—probability samplingdesign and non-probability sampling design.
Census (or complete enumeration): An examination of each and every elementof the population is called census or complete enumeration. Census is an alternativeto sampling. We will discuss the inherent advantages of sampling over a completeenumeration later.
7.2.1 Sample vs Census
In a research study, we are generally interested in studying the characteristics of apopulation. Suppose there are 2 lakh households in a town, and we are interestedin estimating the proportion of households that spend their summer vacations in ahill station. This information can be obtained by asking every household in thattown. If all the households in a population are asked to provide information, sucha survey is called a census. There is an alternative way of obtaining the sameinformation, by choosing a subset of all the two lakh households and asking themfor the same information. This subset is called a sample. Based upon the informationobtained from the sample, a generalization about the population characteristic couldbe made. However, that sample has to be representative of the population. For asample to be representative of the population, the distribution of sampling units inthe sample has to be in the same proportion as the elements in the population. Forexample, if in a town there are 50, 35 and 15 per cent households in lower, middleand upper income groups, then a sample taken from this population should havethe same proportions in for it to be representative. There are several advantagesof sample over census.
Sample saves time and cost. Many times a decision-maker may not havetoo much of time to wait till all the information is available. Therefore, asample could come to his rescue.
There are situations where a sample is the only option. When we want toestimate the average life of fluorescent bulbs, what is done is that they areburnt out completely. If we go for a complete enumeration there would not

Sampling
NOTES
Self-Instructional116 Material
be anything left for use. Another example could be testing the quality of aphotographic film.
The study of a sample instead of complete enumeration may, at times,produce more reliable results. This is because by studying a sample, fatigueis reduced and fewer errors occur while collecting the data, especially whena large number of elements are involved.
A census is appropriate when the population size is small, e.g., the numberof public sector banks in the country. Suppose the researcher is interested incollecting information from the top management of a bank regarding their viewson the monetary policy announced by the Reserve Bank of India (RBI), in thiscase, a complete enumeration may be possible as the population size is not verylarge.
7.2.2 Sampling vs Non-Sampling Error
There are two types of error that may occur while we are trying to estimate thepopulation parameters from the sample. These are called sampling and non-samplingerrors.
Sampling error: This error arises when a sample is not representative of thepopulation. It is the difference between sample mean and population mean. Thesampling error reduces with the increase in sample size as an increased samplemay result in increasing the representativeness of the sample.
Non-sampling error: This error arises not because a sample is not a representativeof the population but because of other reasons. Some of these reasons are listedbelow:
The respondents when asked for information on a particular variable maynot give the correct answers. If a person aged 48 is asked a question abouthis age, he may indicate the age to be 36, which may result in an error andin estimating the true value of the variable of interest.
The error can arise while transferring the data from the questionnaire to thespreadsheet on the computer.
There can be errors at the time of coding, tabulation and computation.
If the population of the study is not properly defined, it could lead to errors.
The chosen respondent may not be available to answer the questions ormay refuse to be part of the study.
Check Your Progress
1. What is the subset of a population called?
2. Define a sampling frame.
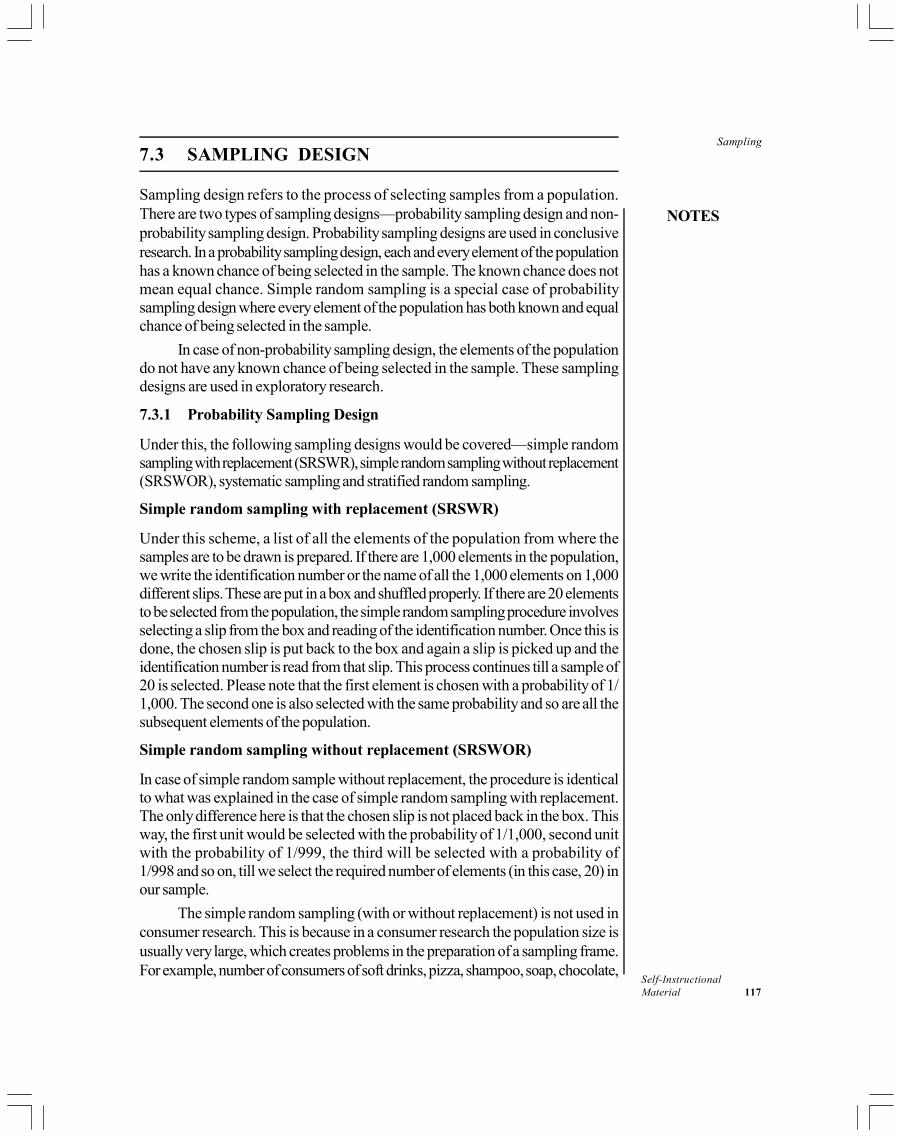
NOTES
Self-InstructionalMaterial 117
Sampling7.3 SAMPLING DESIGN
Sampling design refers to the process of selecting samples from a population.There are two types of sampling designs—probability sampling design and non-probability sampling design. Probability sampling designs are used in conclusiveresearch. In a probability sampling design, each and every element of the populationhas a known chance of being selected in the sample. The known chance does notmean equal chance. Simple random sampling is a special case of probabilitysampling design where every element of the population has both known and equalchance of being selected in the sample.
In case of non-probability sampling design, the elements of the populationdo not have any known chance of being selected in the sample. These samplingdesigns are used in exploratory research.
7.3.1 Probability Sampling Design
Under this, the following sampling designs would be covered—simple randomsampling with replacement (SRSWR), simple random sampling without replacement(SRSWOR), systematic sampling and stratified random sampling.
Simple random sampling with replacement (SRSWR)
Under this scheme, a list of all the elements of the population from where thesamples are to be drawn is prepared. If there are 1,000 elements in the population,we write the identification number or the name of all the 1,000 elements on 1,000different slips. These are put in a box and shuffled properly. If there are 20 elementsto be selected from the population, the simple random sampling procedure involvesselecting a slip from the box and reading of the identification number. Once this isdone, the chosen slip is put back to the box and again a slip is picked up and theidentification number is read from that slip. This process continues till a sample of20 is selected. Please note that the first element is chosen with a probability of 1/1,000. The second one is also selected with the same probability and so are all thesubsequent elements of the population.
Simple random sampling without replacement (SRSWOR)
In case of simple random sample without replacement, the procedure is identicalto what was explained in the case of simple random sampling with replacement.The only difference here is that the chosen slip is not placed back in the box. Thisway, the first unit would be selected with the probability of 1/1,000, second unitwith the probability of 1/999, the third will be selected with a probability of1/998 and so on, till we select the required number of elements (in this case, 20) inour sample.
The simple random sampling (with or without replacement) is not used inconsumer research. This is because in a consumer research the population size isusually very large, which creates problems in the preparation of a sampling frame.For example, number of consumers of soft drinks, pizza, shampoo, soap, chocolate,

Sampling
NOTES
Self-Instructional118 Material
etc, is very large. However, these (SRSWR and SRSWOR) designs could beuseful when the population size is very small, for example, the number of steel/aluminum-producing companies in India and the number of banks in India. Sincethe population size is quite small, the preparation of a sampling frame does notcreate any problem.
Another problem with these (SRSWR and SRSWOR) designs is that wemay not get a representative sample using such a scheme. Consider an example of alocality having 10,000 households, out of which 5,000 belong to low-income group,3,500 belong to middle income group and the remaining 1,500 belong to high-income group. Suppose it is decided to take a sample of 100 households using thesimple random sampling. The selected sample may not contain even a single householdbelonging to the high- and middle-income group and only the low-income householdsmay get selected, thus, resulting in a non-representative sample.
Systematic sampling
Systematic sampling takes care of the limitation of the simple random samplingthat the sample may not be a representative one. In this design, the entire populationis arranged in a particular order. The order could be the calendar dates or theelements of a population arranged in an ascending or a descending order of themagnitude which may be assumed as random. List of subjects arranged in thealphabetical order could also be used and they are usually assumed to be randomin order. Once this is done, the steps followed in the systematic sampling designare as follows:
First of all, a sampling interval given by K = N/n is calculated,
where N = the size of the population and n = the size of the sample.
It is seen that the sampling interval K should be an integer. If it is not, it isrounded off to make it an integer.
A random number is selected from 1 to K. Let us call it C.
The first element to be selected from the ordered population would be C,the next element would be C + K and the subsequent one would be C + 2Kand so on till a sample of size n is selected.
This way we can get representation from all the classes in the populationand overcome the limitations of the simple random sampling. To take an example,assume that there are 1,000 grocery shops in a small town. These shops could bearranged in an ascending order of their sales, with the first shop having the smallestsales and the last shop having the highest sales. If it is decided to take a sample of50 shops, then our sampling interval K will be equal to 1000 ÷ 50 = 20. Now weselect a random number from 1 to 20. Suppose the chosen number is 10. Thismeans that the shop number 10 will be selected first and then shop number 10 +20 = 30 and the next one would be 10 + (2 × 20) = 50 and so on till all the 50shops are selected. This way we can get a representative sample in the sense thatit will contain small, medium and large shops.
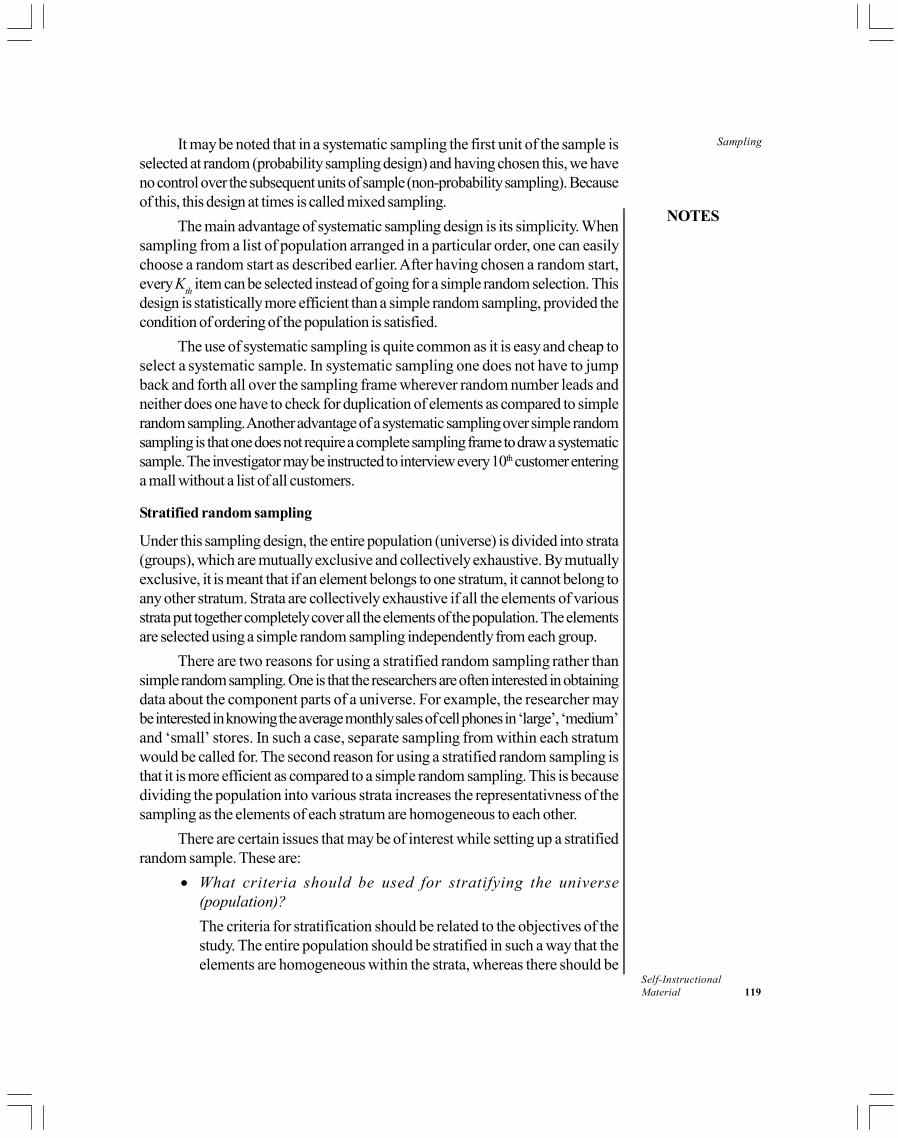
NOTES
Self-InstructionalMaterial 119
SamplingIt may be noted that in a systematic sampling the first unit of the sample isselected at random (probability sampling design) and having chosen this, we haveno control over the subsequent units of sample (non-probability sampling). Becauseof this, this design at times is called mixed sampling.
The main advantage of systematic sampling design is its simplicity. Whensampling from a list of population arranged in a particular order, one can easilychoose a random start as described earlier. After having chosen a random start,every K
th item can be selected instead of going for a simple random selection. This
design is statistically more efficient than a simple random sampling, provided thecondition of ordering of the population is satisfied.
The use of systematic sampling is quite common as it is easy and cheap toselect a systematic sample. In systematic sampling one does not have to jumpback and forth all over the sampling frame wherever random number leads andneither does one have to check for duplication of elements as compared to simplerandom sampling. Another advantage of a systematic sampling over simple randomsampling is that one does not require a complete sampling frame to draw a systematicsample. The investigator may be instructed to interview every 10th customer enteringa mall without a list of all customers.
Stratified random sampling
Under this sampling design, the entire population (universe) is divided into strata(groups), which are mutually exclusive and collectively exhaustive. By mutuallyexclusive, it is meant that if an element belongs to one stratum, it cannot belong toany other stratum. Strata are collectively exhaustive if all the elements of variousstrata put together completely cover all the elements of the population. The elementsare selected using a simple random sampling independently from each group.
There are two reasons for using a stratified random sampling rather thansimple random sampling. One is that the researchers are often interested in obtainingdata about the component parts of a universe. For example, the researcher maybe interested in knowing the average monthly sales of cell phones in ‘large’, ‘medium’and ‘small’ stores. In such a case, separate sampling from within each stratumwould be called for. The second reason for using a stratified random sampling isthat it is more efficient as compared to a simple random sampling. This is becausedividing the population into various strata increases the representativness of thesampling as the elements of each stratum are homogeneous to each other.
There are certain issues that may be of interest while setting up a stratifiedrandom sample. These are:
What criteria should be used for stratifying the universe(population)?
The criteria for stratification should be related to the objectives of thestudy. The entire population should be stratified in such a way that theelements are homogeneous within the strata, whereas there should be
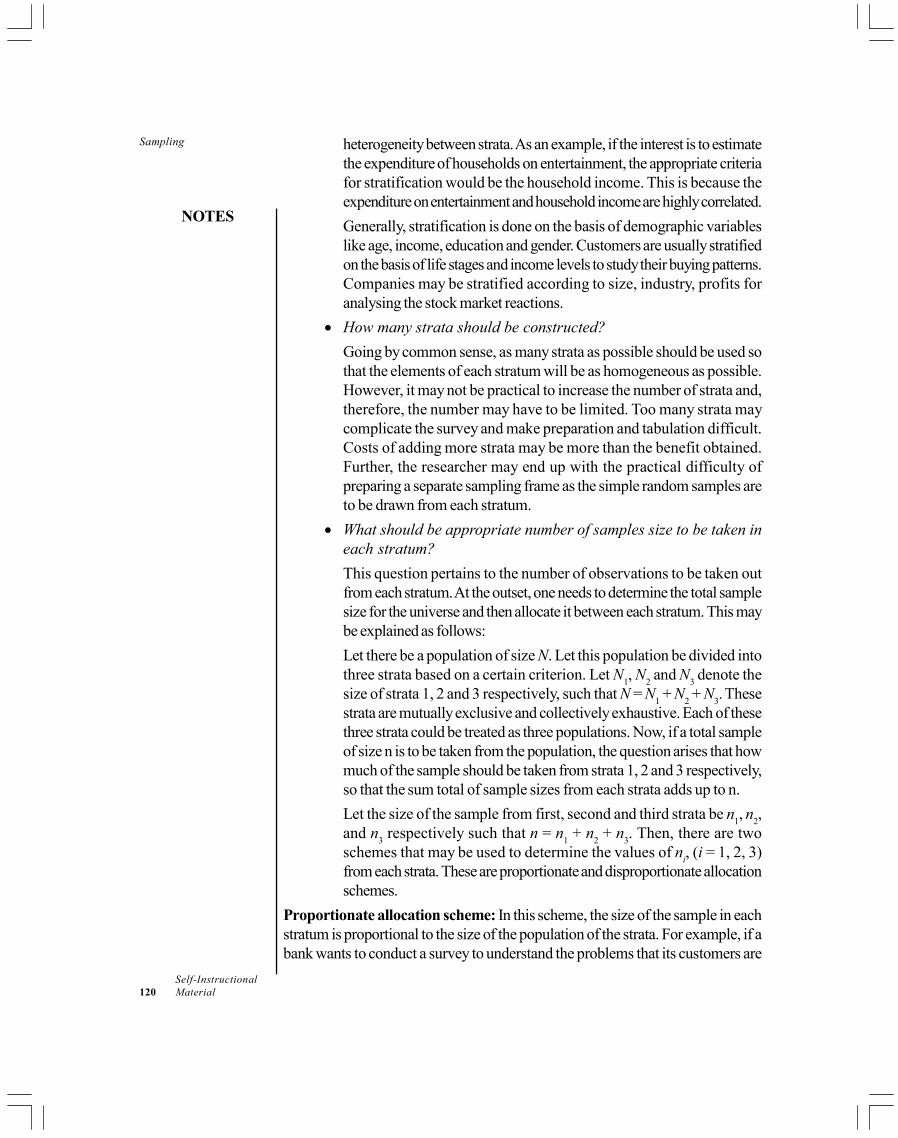
Sampling
NOTES
Self-Instructional120 Material
heterogeneity between strata. As an example, if the interest is to estimatethe expenditure of households on entertainment, the appropriate criteriafor stratification would be the household income. This is because theexpenditure on entertainment and household income are highly correlated.
Generally, stratification is done on the basis of demographic variableslike age, income, education and gender. Customers are usually stratifiedon the basis of life stages and income levels to study their buying patterns.Companies may be stratified according to size, industry, profits foranalysing the stock market reactions.
How many strata should be constructed?
Going by common sense, as many strata as possible should be used sothat the elements of each stratum will be as homogeneous as possible.However, it may not be practical to increase the number of strata and,therefore, the number may have to be limited. Too many strata maycomplicate the survey and make preparation and tabulation difficult.Costs of adding more strata may be more than the benefit obtained.Further, the researcher may end up with the practical difficulty ofpreparing a separate sampling frame as the simple random samples areto be drawn from each stratum.
What should be appropriate number of samples size to be taken ineach stratum?
This question pertains to the number of observations to be taken outfrom each stratum. At the outset, one needs to determine the total samplesize for the universe and then allocate it between each stratum. This maybe explained as follows:
Let there be a population of size N. Let this population be divided intothree strata based on a certain criterion. Let N
1, N
2 and N
3 denote the
size of strata 1, 2 and 3 respectively, such that N = N1 + N
2 + N
3. These
strata are mutually exclusive and collectively exhaustive. Each of thesethree strata could be treated as three populations. Now, if a total sampleof size n is to be taken from the population, the question arises that howmuch of the sample should be taken from strata 1, 2 and 3 respectively,so that the sum total of sample sizes from each strata adds up to n.
Let the size of the sample from first, second and third strata be n1, n
2,
and n3 respectively such that n = n
1 + n
2 + n
3. Then, there are two
schemes that may be used to determine the values of ni, (i = 1, 2, 3)
from each strata. These are proportionate and disproportionate allocationschemes.
Proportionate allocation scheme: In this scheme, the size of the sample in eachstratum is proportional to the size of the population of the strata. For example, if abank wants to conduct a survey to understand the problems that its customers are

NOTES
Self-InstructionalMaterial 121
Samplingfacing, it may be appropriate to divide them into three strata based upon the sizeof their deposits with the bank. If we have 10,000 customers of a bank in such away that 1,500 of them are big account holders (having deposits of more than 10lakh), 3,500 of them are medium-sized account holders (having deposits of morethan 2 lakh but less than 10 lakh), the remaining 5,000 are small account holders(having deposits of less than 2 lakh). Suppose the total budget for sampling isfixed at 20,000 and the cost of sampling a unit (customer) is 20. If a sample of100 is to be chosen from all the three strata, the size of the sample from strata 1would be:
11
1500100 15
10000
Nn n
N
The size of sample from strata 2 would be:
22
3500100 35
10000
Nn n
N
The size of sample from strata 3 would be:
33
5000100 50
10000
Nn n
N
This way the size of the sample chosen from each stratum is proportional tothe size of the stratum. Once we have determined the sample size from each stratum,one may use the simple random sampling or the systematic sampling or any othersampling design to take out samples from each of the strata.
Disproportionate allocation: As per the proportionate allocation explainedabove, the sizes of the samples from strata 1, 2 and 3 are 15, 35 and 50 respectively.As it is known that the cost of sampling of a unit is 20 irrespective of the stratafrom where the sample is drawn, the bank would naturally be more interested indrawing a large sample from stratum 1, which has the big customers, as it getsmost of its business from strata 1. In other words, the bank may follow adisproportionate allocation of sample as the importance of each stratum is not thesame from the point of view of the bank. The bank may like to take a sample of 45from strata 1 and 40 and 15 from strata 2 and 3 respectively. Also, a large samplemay be desired from the strata having more variability.
7.3.2 Non-probability Sampling Designs
Under the non-probability sampling, the following designs would be considered—convenience sampling, purposive (judgemental) sampling and snowball sampling.
Convenience sampling
Convenience sampling is used to obtain information quickly and inexpensively.The only criterion for selecting sampling units in this scheme is the convenience ofthe researcher or the investigator. Mostly, the convenience samples used areneighbours, friends, family members, colleagues and ‘passers-by’. This sampling

Sampling
NOTES
Self-Instructional122 Material
design is often used in the pre-test phase of a research study such as the pre-testing of a questionnaire. Some of the examples of convenience sampling are:
People interviewed in a shopping centre for their political opinion for a TVprogramme.
Monitoring the price level in a grocery shop with the objective of inferringthe trends in inflation in the economy.
Requesting people to volunteer to test products.
Using students or employees of an organization for conducting an experiment.
In all the above situations, the sampling unit may either be self-selected orselected because of ease of availability. No effort is made to choose a representativesample. Therefore, in this design the difference between the population value(parameters) of interest and the sample value (statistic) is unknown both in termsof the magnitude and direction. Therefore, it is not possible to make an estimate ofthe sampling error and researchers would not be able to make a conclusivestatement about the results from such a sample. It is because of this, conveniencesampling should not be used in conclusive research (descriptive and causalresearch).
Convenience sampling is commonly used in exploratory research. This isbecause the purpose of an exploratory research is to gain an insight into the problemand generate a set of hypotheses which could be tested with the help of a conclusiveresearch. When very little is known about a subject, a small-scale conveniencesampling can be of use in the exploratory work to help understand the range ofvariability of responses in a subject area.
Judgemental sampling
Under judgemental sampling, experts in a particular field choose what they believeto be the best sample for the study in question. The judgement sampling calls forspecial efforts to locate and gain access to the individuals who have the requiredinformation. Here, the judgement of an expert is used to identify a representativesample. For example, the shoppers at a shopping centre may serve to representthe residents of a city or some of the cities may be selected to represent a country.Judgemental sampling design is used when the required information is possessedby a limited number/category of people. This approach may not empirically producesatisfactory results and, may, therefore, curtail generalizability of the findings dueto the fact that we are using a sample of experts (respondents) that are usuallyconveniently available to us. Further, there is no objective way to evaluate theprecision of the results. A company wanting to launch a new product may usejudgemental sampling for selecting ‘experts’ who have prior knowledge orexperience of similar products. A focus group of such experts may be conductedto get valuable insights. Opinion leaders who are knowledgeable are included in
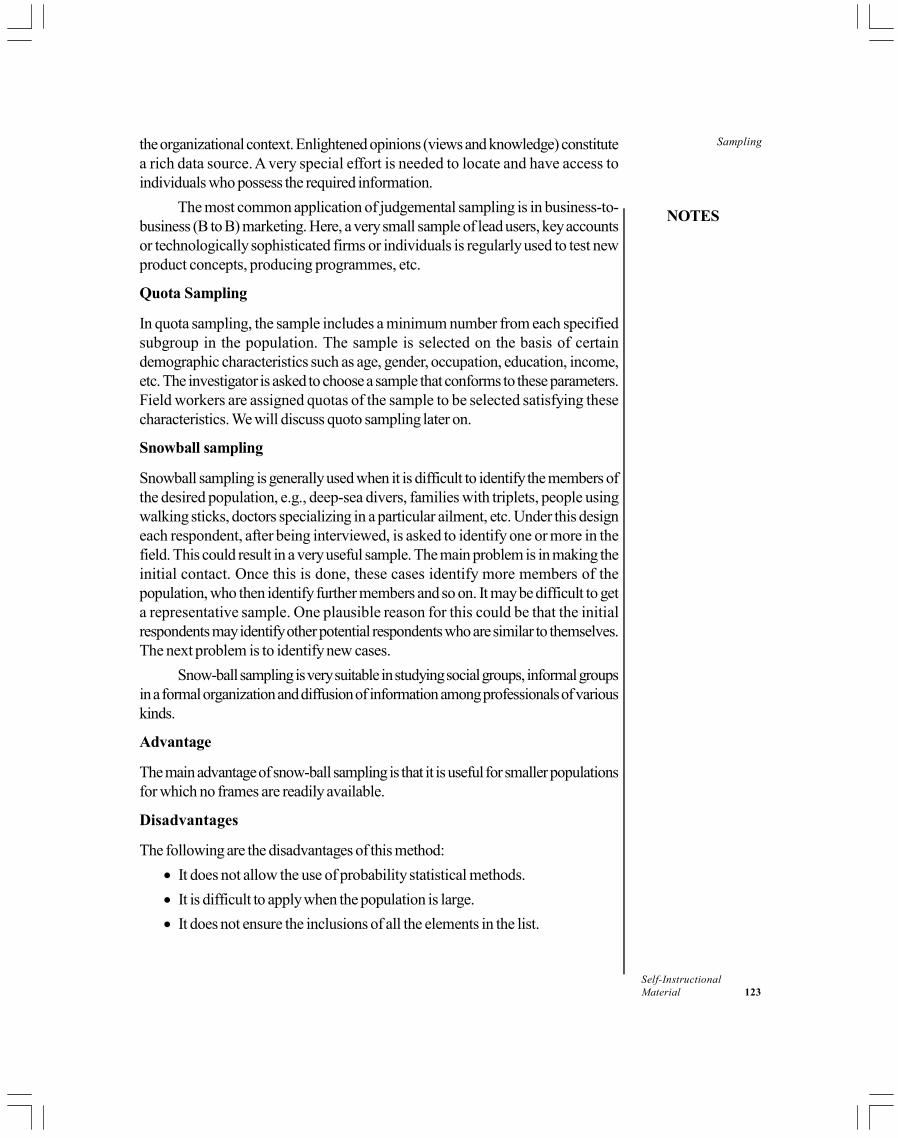
NOTES
Self-InstructionalMaterial 123
Samplingthe organizational context. Enlightened opinions (views and knowledge) constitutea rich data source. A very special effort is needed to locate and have access toindividuals who possess the required information.
The most common application of judgemental sampling is in business-to-business (B to B) marketing. Here, a very small sample of lead users, key accountsor technologically sophisticated firms or individuals is regularly used to test newproduct concepts, producing programmes, etc.
Quota Sampling
In quota sampling, the sample includes a minimum number from each specifiedsubgroup in the population. The sample is selected on the basis of certaindemographic characteristics such as age, gender, occupation, education, income,etc. The investigator is asked to choose a sample that conforms to these parameters.Field workers are assigned quotas of the sample to be selected satisfying thesecharacteristics. We will discuss quoto sampling later on.
Snowball sampling
Snowball sampling is generally used when it is difficult to identify the members ofthe desired population, e.g., deep-sea divers, families with triplets, people usingwalking sticks, doctors specializing in a particular ailment, etc. Under this designeach respondent, after being interviewed, is asked to identify one or more in thefield. This could result in a very useful sample. The main problem is in making theinitial contact. Once this is done, these cases identify more members of thepopulation, who then identify further members and so on. It may be difficult to geta representative sample. One plausible reason for this could be that the initialrespondents may identify other potential respondents who are similar to themselves.The next problem is to identify new cases.
Snow-ball sampling is very suitable in studying social groups, informal groupsin a formal organization and diffusion of information among professionals of variouskinds.
Advantage
The main advantage of snow-ball sampling is that it is useful for smaller populationsfor which no frames are readily available.
Disadvantages
The following are the disadvantages of this method:
It does not allow the use of probability statistical methods.
It is difficult to apply when the population is large.
It does not ensure the inclusions of all the elements in the list.
Sampling
NOTES
Self-Instructional124 Material
Other types of sampling
Voluntary sample: A voluntary sample is made up of people who self-select into the survey. Often, these folks have a strong interest in the maintopic of the survey. Suppose, for example, that a news show asks viewersto participate in an on-line poll. This would be a volunteer sample. Thesample is chosen by the viewers, not by the survey administrator.
Multistage sampling: With multistage sampling, we select a sample byusing combinations of different sampling methods. For example, in Stage 1,we might use cluster sampling to choose clusters from a population. Then,in Stage 2, we might use simple random sampling to select a subset ofelements from each chosen cluster for the final sample.
Replicated or interpenetrating sampling: Replicated sampling involvesselection of a certain number of sub-samples rather than one full samplefrom a population. All the sub-samples should be drawn using the samesampling technique and each is a self-contained and adequate sample ofthe population. Replicated sampling technique can be used with any basicsampling technique: simple or stratified, single or multistage or single ormulti-phase sampling. It provides a simple means of calculating the samplingerror. It is practical. The replicated samples can throw light on variablesand non-sampling errors. The only disadvantage is that it limits the amountof stratification that can be employed.
Area sampling: Area sampling is also a form of cluster sampling. In a largefield survey cluster consisting of specific geographical areas like districts,tallukas, blocks, villages, in a city are randomly drawn. When geographicalareas are selected as sampling units, their sampling is known as area sampling.
Double sampling and multi-phase sampling: Double sampling refers tothe subsection of the final sample form a preselected larger sample thatprovided information for improving the final selection. When the procedureis extended to more than two phases of selection, it is then called multi-phase sampling. This is also known as sequential sampling, as sub-samplingis done form a main sample in phases. Double sampling or multi-phasesampling is a compromise solution for a dilemma posed by undesirableextremes. The statistics based on the sample of ‘n’ can be improved byusing ancillary information from a wide base, but this is too costly to obtainfrom the entire population of N elements. Instead, information is obtainedfrom a larger preliminary sample which includes the final sample n.
Quota Sampling
As discussed, quota sampling is a form of convenient sampling which involvesselection of quota groups of accessible sampling units by traits such as sex, age,
NOTES
Self-InstructionalMaterial 125
Samplingsocial class, etc. It is a method of stratified sampling in which the selection withinstrata is known as random. It is this known random element that constitutes itsgreatest weakness.
This sampling method is used in studies like marketing service, opinion pollsand readership service which do not aim at making decisions, but try to get somecrude results quickly.
Advantages
The following are the advantages of quota sampling:
It is less costly.
It takes less time.
There is no need for a list of the population.
The field work can easily be organized.
Disadvantages
The following are the disadvantages of quota sampling:
It is impossible to estimate sampling error.
Strict control if field work is difficult.
It is subject to a higher degree of classification.
Check Your Progress
3. Name the sampling in where every element of the population has bothknown and equal change of being selected in the sample.
4. Which sampling design is often used in the pre-test phase of a researchstudy as the pre-testing of a questionnaire?
5. What is snowball sampling?
7.4 DETERMINATION OF SAMPLE SIZE
The size of a sample depends upon the basic characteristics of the population, thetype of information required from the survey and the cost involved. Therefore, asample may vary in size for several reasons. The size of the population does notinfluence the size of the sample as will be shown later on.
There are various methods of determining the sample size in practice:
Researchers may arbitrarily decide the size of sample without giving anyexplicit consideration to the accuracy of the sample results or the cost ofsampling. This arbitrary approach should be avoided.

Sampling
NOTES
Self-Instructional126 Material
For some of the projects, the total budget for the field survey (usuallymentioned) in a project proposal is allocated. If the cost of sampling persample unit is known, one can easily obtain the sample size by dividing thetotal budget allocation by the cost of sampling per unit. This methodconcentrates only on the cost aspect of sampling, rather than the value ofinformation obtained from such a sample.
There are other researchers who decide on the sample size based on whatwas done by the other researchers in similar studies. Again, this approachcannot be a substitute for the formal scientific approach.
The most commonly used approach for determining the size of sample isthe confidence interval approach covered under inferential statistics. Belowwill be discussed this approach while determining the size of a sample forestimating population mean and population proportion. In a confidenceinterval approach, the following points are taken into account for determiningthe sample size in estimation of problems involving means:
(a) The variability of the population: It would be seen that the higher thevariability as measured by the population standard deviation, larger willbe the size of the sample. If the standard deviation of the population isunknown, a researcher may use the estimates of the standard deviationfrom previous studies. Alternatively, the estimates of the populationstandard deviation can be computed from the sample data.
(b) The confidence attached to the estimate: It is a matter of judgement,how much confidence you want to attach to your estimate. Assuminga normal distribution, the higher the confidence the researcher wantsfor the estimate, larger will be sample size. This is because the valueof the standard normal ordinate ‘Z’ will vary accordingly. For a 90per cent confidence, the value of ‘Z’ would be 1.645 and for a 95 percent confidence, the corresponding ‘Z’ value would be 1.96 and soon (see Table 7.1). It would be seen later that a higher confidencewould lead to a larger ‘Z’ value.
(c) The allowable error or margin of error: How accurate do wewant our estimate to be is again a matter of judgement of theresearcher. It will of course depend upon the objectives of the studyand the consequence resulting from the higher inaccuracy. If theresearcher seeks greater precision, the resulting sample size wouldbe large.

NOTES
Self-InstructionalMaterial 127
SamplingTable 7.1 Area under Standard Normal Distribution betweenthe Mean and Successive Value of Z
Z 0.00 0.01 0.02 0.03 0.04 0.05 0.06 0.07 0.08 0.09
0.0 0.0000 0.0040 0.0080 0.0120 0.0160 0.0199 0.0239 0.0279 0.0319 0.0359
0.1 0.0398 0.0438 0.0478 0.0517 0.0557 0.0596 0.0636 0.0675 0.0714 0.0753
0.2 0.0793 0.0832 0.0871 0.0910 0.0948 0.0987 0.1026 0.1064 0.1103 0.1141
0.3 0.1179 0.1217 0.1255 0.1293 0.1331 0.1368 0.1406 0.1443 0.1480 0.1517
0.4 0.1554 0.1591 0.1628 0.1664 0.1700 0.1736 0.1772 0.1808 0.1844 0.1879
0.5 0.1915 0.1950 0.1985 0.2019 0.2054 0.2088 0.2123 0.2157 0.2190 0.2224
0.6 0.2257 0.2291 0.2324 0.2357 0.2389 0.2422 0.2454 0.2486 0.2517 0.2549
0.7 0.2580 0.2611 0.2642 0.2673 0.2704 0.2734 0.2764 0.2794 0.2823 0.2852
0.8 0.2881 0.2910 0.2939 0.2967 0.2995 0.3023 0.3051 0.3078 0.3106 0.3133
0.9 0.3159 0.3186 0.3212 0.3238 0.3264 0.3289 0.3315 0.3340 0.3365 0.3389
1.0 0.3413 0.3438 0.3461 0.3485 0.3508 0.3531 0.3554 0.3577 0.3599 0.3621
1.1 0.3643 0.3665 0.3686 0.3708 0.3729 0.3749 0.3770 0.3790 0.3810 0.3830
1.2 0.3849 0.3869 0.3888 0.3907 0.3925 0.3944 0.3962 0.3980 0.3997 0.4015
1.3 0.4032 0.4049 0.4066 0.4082 0.4099 0.4115 0.4131 0.4147 0.4162 0.4177
1.4 0.4192 0.4207 0.4222 0.4236 0.4251 0.4265 0.4279 0.4292 0.4306 0.4319
1.5 0.4332 0.4345 0.4357 0.4370 0.4382 0.4394 0.4406 0.4418 0.4429 0.4441
1.6 0.4452 0.4463 0.4474 0.4484 0.4495 0.4505 0.4515 0.4525 0.4535 0.4545
1.7 0.4554 0.4564 0.4573 0.4582 0.4591 0.4599 0.4608 0.4616 0.4625 0.4633
1.8 0.4641 0.4649 0.4656 0.4664 0.4671 0.4678 0.4686 0.4693 0.4699 0.4706
1.9 0.4713 0.4719 0.4726 0.4732 0.4738 0.4744 0.4750 0.4756 0.4761 0.4767
2.0 0.4772 0.4778 0.4783 0.4788 0.4793 0.4798 0.4803 0.4808 0.4812 0.4817
2.1 0.4821 0.4826 0.4830 0.4834 0.4838 0.4842 0.4846 0.4850 0.4854 0.4857
2.2 0.4861 0.4864 0.4868 0.4871 0.4875 0.4878 0.4881 0.4884 0.4887 0.4890
2.3 0.4893 0.4896 0.4898 0.4901 0.4804 0.4906 0.4909 0.4911 0.4913 0.4916
2.4 0.4918 0.4920 0.4922 0.4925 0.4927 0.4929 0.4931 0.4932 0.4934 0.4936
2.5 0.4938 0.4940 0.4941 0.4943 0.4945 0.4946 0.4948 0.4949 0.4951 0.4952
2.6 0.4953 0.4955 0.4956 0.4957 0.4959 0.4960 0.4961 0.4962 0.4963 0.4964
2.7 0.4965 0.4966 0.4967 0.4968 0.4969 0.4970 0.4971 0.4972 0.4973 0.4974
2.8 0.4974 0.4975 0.4976 0.4977 0.4977 0.4978 0.4979 0.4979 0.4980 0.4981
2.9 0.4981 0.4982 0.4982 0.4983 0.4984 0.4984 0.4985 0.4985 0.4986 0.4986
3.0 0.4987 0.4987 0.4987 0.4988 0.4988 0.4989 0.4989 0.4989 0.4990 0.4990
7.4.1 Sample Size for Estimating Population Mean
The formula for determining the sample size in such a case is given by
n = 2 2
2
Z
e

Sampling
NOTES
Self-Instructional128 Material
Where X – = e = Margin of error
n = Sample size
= Population standard deviation
Z = the value of standard normal ordinate
It may be noted from above that the size of the sample is directly proportionalto the variability in the population and the value of Z for a confidence interval. Itvaries inversely with the size of the error. It may also be noted that the size of asample does not depend upon the size of population.
Below is given a worked out example for the determination of a samplesize.
Example 7.1: An economist is interested in estimating the average monthlyhousehold expenditure on food items by the households of a town. Based on pastdata, it is estimated that the standard deviation of the population on the monthlyexpenditure on food item is 30. With allowable error set at 7, estimate thesample size required at a 90 per cent confidence.
Solution:
90 per cent confidence Z = 1.645
e = 7
= 30
n =2 2
2
Z
e
=2 2
2
(1.645) (30)
(7)
= 49.7025
= 50 (approx.)
7.4.2 Determination of Sample Size for Estimating the PopulationProportion
The formula for determining the sample size in such a case is given by
n = 2
2
Z pq
eThe above formula will be used if the value of population proportion
(proportion of occurrence of the event) p is known. If, however, p is unknown,we substitute the maximum value of pq in the above formula. It can be shown thatthe maximum value of pq is 1/4 when p = 1/2 and q = 1/2.
Therefore, n = 2
2
1
4
Z
e

NOTES
Self-InstructionalMaterial 129
SamplingLet us consider two examples for determining a sample size while estimatingthe population proportion.
Example 7.2: A manager of a department store would like to study women’sspending per year on cosmetics. He is interested in knowing the populationproportion of women who purchase their cosmetics primarily from his store. If hewants to have a 90 per cent confidence of estimating the true proportion to bewithin ± 0.045, what sample size is needed?
Solution:
90 per cent confidence Z = 1.645
e = ± .045
n =2
2
1
4
Z
e
=2
2
1 (1.645)
4 (0.45)
= 334.0772
= 335 (approx.)
Example 7.3: A consumer electronics company wants to determine the jobsatisfaction levels of its employees. For this, they ask a simple question, ‘Are yousatisfied with your job?’ It was estimated that no more than 30 per cent of theemployees would answer yes. What should be the sample size for this company toestimate the population proportion to ensure a 95 per cent confidence in result,and to be within 0.04 of the true population proportion?
Solution:
95 per cent confidence Z = 1.96
e = 0.04
p = 0.3
q = 0.7
n =2
2
z pq
e
=2
2
(1.96) 0.3 0.7
(0.04)
= 504.21
= 505 (approx.)
Points to be noted for sample size determination
There are certain issues to be kept in mind before applying the formulas for thedetermination of sample size in this unit. First of all, these formulas are applicable
Sampling
NOTES
Self-Instructional130 Material
for simple random sampling only. Further, they relate to the sample size neededfor the estimation of a particular characteristic of interest. In a survey, a researcherneeds to estimate several characteristics of interests and each one of them mayrequire a different sample size. In case the universe is divided into different strata,the accuracy required for determining the sample size for each strata may bedifferent. However, the present method will not able to serve the requirement.Lastly, the formulas for sample size must be based upon adequate informationabout the universe.
Check Your Progress
6. What are the factors on which is the size of a sample depends?
7. Mention the most commonly used approach for determining the size ofsample.
7.5 ANSWERS TO CHECK YOUR PROGRESSQUESTIONS
1. Sample is the subset of a population.
2. Sampling frame comprises of all the elements of a population with properidentification that is available to us for selection at any stage of sampling.
3. Simple random sampling the special case of probability sampling designwhere every element of the population has both known and equal changeof being selected in the sample.
4. Convenience sampling is the sampling design which is often used in the pre-test phase of a research study as the pre-testing of a questionnaire.
5. Snowball sampling is generally used when it is difficult to identify the membersof the desired population. Under this design each respondent, after beinginterviewed, is asked to identify one or more in the field.
6. The size of a sample depends upon the basic characteristics of the population,the type of information required from the survey and the cost involved.
7. The most commonly used approach for determining the size of the sampleis the confidence interval approach.
7.6 SUMMARY
Surveys are useful in information collection. The survey respondents shouldbe selected using appropriate and right procedures. The process of selectingthe right individuals, objects or events for the study is known as sampling.

NOTES
Self-InstructionalMaterial 131
Sampling An alternative to sample is census where each and every element of thepopulation (universe) is examined. There are many advantages of samplingover complete enumeration. While estimating the population parameter usingsample results, the researcher may incur two types of error—sampling andnon-sampling error.
The process of selecting samples from the population is referred to assampling design. There are two types of sampling designs—probabilitysampling design and non-probability sampling design. Probability samplingdesigns are used in a conclusive research whereas non-probability samplingdesigns are appropriate for an exploratory research.
There are four probability sampling designs—the simple random samplingwith replacement, simple random sampling without replacement, systematicsampling and stratified random sampling.
Under the non-probability sampling designs, there are convenience sampling,judgmental sampling and snowball sampling.
7.7 KEY WORDS
Convenience sampling: The type of sampling in which the sample isselected as per the convenience of the investigator.
Census: The enumeration of each and every element of population.
Element: A single member of population.
Sampling design: The process of selecting samples from a population.
Sampling error: The error that occurs because of non-representativenessof the sample.
7.8 SELF ASSESSMENT QUESTIONS ANDEXERCISES
Short-Answer Questions
1. Differentiate between sample and census.
2. Differentiate between the stratified random sampling and systematic sampling.
3. Why is judgemental sampling used in research? Can it result in morerepresentative sample than a random sample?
Long-Answer Questions
1. Explain the various sources of non-sampling errors.
2. Explain the difference between simple random sampling with replacementand without replacement.
Sampling
NOTES
Self-Instructional132 Material
3. Explain giving example why a random sample may not result into arepresentative sample.
4. Explain the factors that should be considered while selecting a sample forresearch.
7.9 FURTHER READINGS
Aaker, David A, Kumar, V and Day, G S. 2001. Marketing Research, 7th edn.Singapore: John Wiley & Sons, Inc.
Chawla D and Sondhi N. 2016. Research Methodology: Concepts and Cases,2nd edition. New Delhi: Vikas Publishing House.
Churchill, G A Jr and Lacobucci, D. 2002. Marketing Research MethodologicalFoundations, 8th edn. New Delhi: Thomson-South Western.
Kinnear, T C and Taylor, J C. 1987. Marketing Research—An AppliedApproach, 3rd edn. New York: McGraw-Hill Book Company.
NOTES
Self-InstructionalMaterial 133
Data Processing
UNIT 8 DATA PROCESSING
Structure
8.0 Introduction8.1 Objectives8.2 Data Editing
8.2.1 Field Editing8.2.2 Centralized In-house Editing
8.3 Coding8.3.1 Coding Closed-ended Structured Questions8.3.2 Coding Open-ended Structured Questions
8.4 Classification and Tabulation of Data8.5 Answers to Check Your Progress Questions8.6 Summary8.7 Key Words8.8 Self Assessment Questions and Exercises8.9 Further Readings
8.0 INTRODUCTION
In the last few units, you have learnt about the various aspects of data collection.The critical job of the researcher begins after the data has been collected. He hasto use this information to assess whether he had been correct or incorrect whilemaking certain assumptions in the form of the hypotheses at the beginning of thestudy. The raw data that has been collected must be refined and structured in sucha format that it can lend itself to statistical enquiry. This process of preparing thedata for an analysis is a structured and sequential process. The process starts byvalidating the measuring instrument, which could be a questionnaire or any otherprimary technique. This is followed by editing, coding, classifying and tabulatingthe obtained data.
In this unit we will learn these steps of preparing the data through editing,coding and tabulating, so that it is ready for any kind of statistical analysis, in orderto achieve the research objectives we had made earlier.
8.1 OBJECTIVES
After going through this unit, you will be able to:
Explain the significance and technique of data processing
Construct codes both for structured and unstructured questionnairesfollowing certain guidelines.
Classifiy and tabulate data in the required format.
Data Processing
NOTES
Self-Instructional134 Material
8.2 DATA EDITING
Data editing is the process that involves detecting and correcting errors (logicalinconsistencies) in data. After collection, the data is subjected to processing.Processing requires that the researcher must go over all the raw data forms andcheck them for errors. The significance of validation becomes more important inthe following cases:
In case the form had been translated into another language, expert analysisis done to see whether the meaning of the questions in the two measures isthe same or not.
The second case could be that the questionnaire survey has to be done atmultiple locations and it has been outsourced to an outside research agency.
The respondent seems to have used the same response category for all thequestions; for example, there is a tendency on a five point scale to give 3 asthe answer for all questions.
The form that is received back is incomplete, in the sense that either theperson has not filled the answer to all questions, or in case of a multiple-page questionnaire, one or more pages are missing.
The forms received are not in the proportion of the sampling plan. Forexample, instead of an equal representation from government and privatesector employees, 65 per cent of the forms are from the government sector.In such a case the researcher either would need to discard the extra formsor get an equal number filled-in from private sector employees.
Once the validation process has been completed, the next step is the editingof the raw data obtained. While carrying out the editing the researcher needs toensure that:
The data obtained is complete in all respects.
It is accurate in terms of information recorded and responses sought.
Questionnaires are legible and are correctly deciphered, especially theopen-ended questions.
The response format is in the form that was instructed.
The data is structured in a manner that entering the information will notbe a problem.
The editing process is carried out at two levels, the first of these is fieldediting and the second is central editing.
8.2.1 Field Editing
Usually, the preliminary editing of the information obtained is done by the fieldinvestigators or supervisors who review the filled forms for any inconsistencies,
NOTES
Self-InstructionalMaterial 135
Data Processingnon-response, illegible responses or incomplete questionnaires. Thus the errorscan be corrected immediately and if need be the respondent who filled in the form,can be contacted again. The other advantage is that regular field editing ensuresthat one can also check that the surveyor is able to handle the process of instructionsand probing correctly or not. Thus, the researcher can advise and train theinvestigator on how to administer the questionnaire correctly.
8.2.2 Centralized in-house Editing
The second level of editing takes place at the researcher’s end. At this stage thereare two kinds of typical problems that the researcher might encounter.
First, one might detect an incorrect entry. For example, in case of a five-point scale one might find that someone has used a value more than 5. In anothercase, one might be asking a question like, ‘how many days do you travel out of thecity in a week?’ and the person says ‘15 days’. Here one can carry out a quickfrequency check of the responses; this will immediately detect an unexpected value.
The second and the major problem that most researchers face is that of‘armchair interviewing’ or a fudged interview. One way to handle this is to firstscroll the answers to the open-ended questions, as generally if the investigator isfilling in multiple forms faking these would be difficult.
The researcher has some standard processes available to him to carry out theediting process. These are briefly discussed below.
Backtracking: The best and the most efficient way of handling unsatisfactoryresponses is to return to the field, and go back to the respondents. This techniqueis best used for industrial surveys but a little difficult in individual surveys.
Allocating missing values: This is a contingency plan that the researcher mightneed to adopt in case going back to the field is not possible. Then the option mightbe to assign a missing value to the blanks or the unsatisfactory responses. However,this works in case:
The number of blank or wrong answers is small.
The number of such responses per person is small.
The important parameters being studied do not have too many blanks,otherwise the sample size for those variables becomes too small forgeneralizations.
Plug value: In cases such as the third condition above, when the variable beingstudied is the key variable, then sometimes the researcher might insert a plugvalue. Sometimes one can plug an average or a neutral value in such cases, forexample a 3 for a five-point scale or the researcher might have to establish a ruleas to what value will be put if the person has not answered. Sometimes, therespondents’ pattern of responses to other questions is used to extrapolate andcalculate an appropriate response for the missing answer.
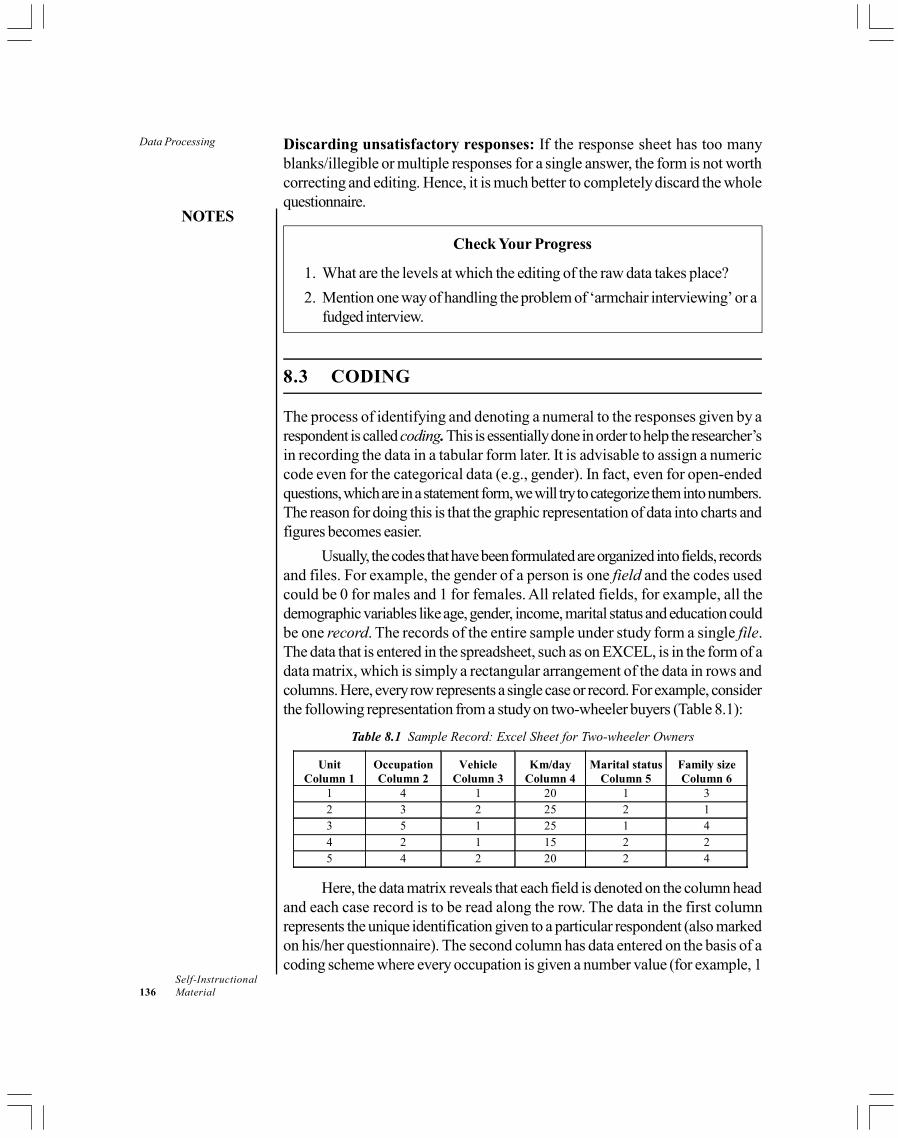
Data Processing
NOTES
Self-Instructional136 Material
Discarding unsatisfactory responses: If the response sheet has too manyblanks/illegible or multiple responses for a single answer, the form is not worthcorrecting and editing. Hence, it is much better to completely discard the wholequestionnaire.
Check Your Progress
1. What are the levels at which the editing of the raw data takes place?
2. Mention one way of handling the problem of ‘armchair interviewing’ or afudged interview.
8.3 CODING
The process of identifying and denoting a numeral to the responses given by arespondent is called coding. This is essentially done in order to help the researcher’sin recording the data in a tabular form later. It is advisable to assign a numericcode even for the categorical data (e.g., gender). In fact, even for open-endedquestions, which are in a statement form, we will try to categorize them into numbers.The reason for doing this is that the graphic representation of data into charts andfigures becomes easier.
Usually, the codes that have been formulated are organized into fields, recordsand files. For example, the gender of a person is one field and the codes usedcould be 0 for males and 1 for females. All related fields, for example, all thedemographic variables like age, gender, income, marital status and education couldbe one record. The records of the entire sample under study form a single file.The data that is entered in the spreadsheet, such as on EXCEL, is in the form of adata matrix, which is simply a rectangular arrangement of the data in rows andcolumns. Here, every row represents a single case or record. For example, considerthe following representation from a study on two-wheeler buyers (Table 8.1):
Table 8.1 Sample Record: Excel Sheet for Two-wheeler Owners
Unit Column 1
Occupation Column 2
Vehicle Column 3
Km/day Column 4
Marital status Column 5
Family size Column 6
1 4 1 20 1 3 2 3 2 25 2 1 3 5 1 25 1 4 4 2 1 15 2 2 5 4 2 20 2 4
Here, the data matrix reveals that each field is denoted on the column head
and each case record is to be read along the row. The data in the first columnrepresents the unique identification given to a particular respondent (also markedon his/her questionnaire). The second column has data entered on the basis of acoding scheme where every occupation is given a number value (for example, 1
NOTES
Self-InstructionalMaterial 137
Data Processingstands for government service and 5 stands for student and so on). Column 3 has1 representing a motorcycle and 2 representing a scooter. The next value is of theaverage number of kilometres a person travels per day.
This is followed by the marital status, with 1 signifying unmarried and2 married. The last column is again a ratio scale data with the number of familymembers. The researcher can enter the data on the spreadsheet of the softwarepackage he/she is using for the analysis.
Codebook formulation: In order to manage the data entry process, it is best toprepare a method for entering the records. This coding scheme for all the variablesunder study is called a code book. Generally, while designing the rules, care mustbe taken to decide on some categories that are:
Comprehensive: Should cover all the possible answer to the question thatwas asked.
Mutually exclusive: The categories and codes devised must be exclusiveor clearly different from each other.
Single variable entry: The response that is being entered and the codefor it should indicate only a single variable. For example, a ‘working singlemother’ might seem an apparently simple category which one could codeas ‘occupation’. However, it needs three columns—occupation, marital statusand family life cycle. So, one needs to have three different codes to enterthis information.
Based on the above rules, one creates a code book. This would generallycontain information on the question number, variable name, response descriptorsand coding instructions and the column descriptor.
As we have read in Unit 6, a questionnaire can have both closed-ended andopen-ended questions. When the questions are structured and the responsecategories are prescribed then one does what is called pre-coding, i.e., givingnumeral codes to the designed responses before administration. However, if thequestions are structured and the answers are open ended, one needs to decide onthe codes after the administration of the survey. This is called post-coding.
8.3.1 Coding Closed-ended Structured Questions
The method of coding for structured questions is easier as the response categoriesare decided in advance. The coding method to be followed for different kinds ofquestions is discussed below.
Dichotomous questions: For dichotomous questions, which are on a nominalscale, the responses can be binary, for example:
Do you eat ready-to-eat food? Yes = 1; no = 0.
This means if someone eats ready- to- eat food he/she will be given a scoreof 1 and if not, then 0.
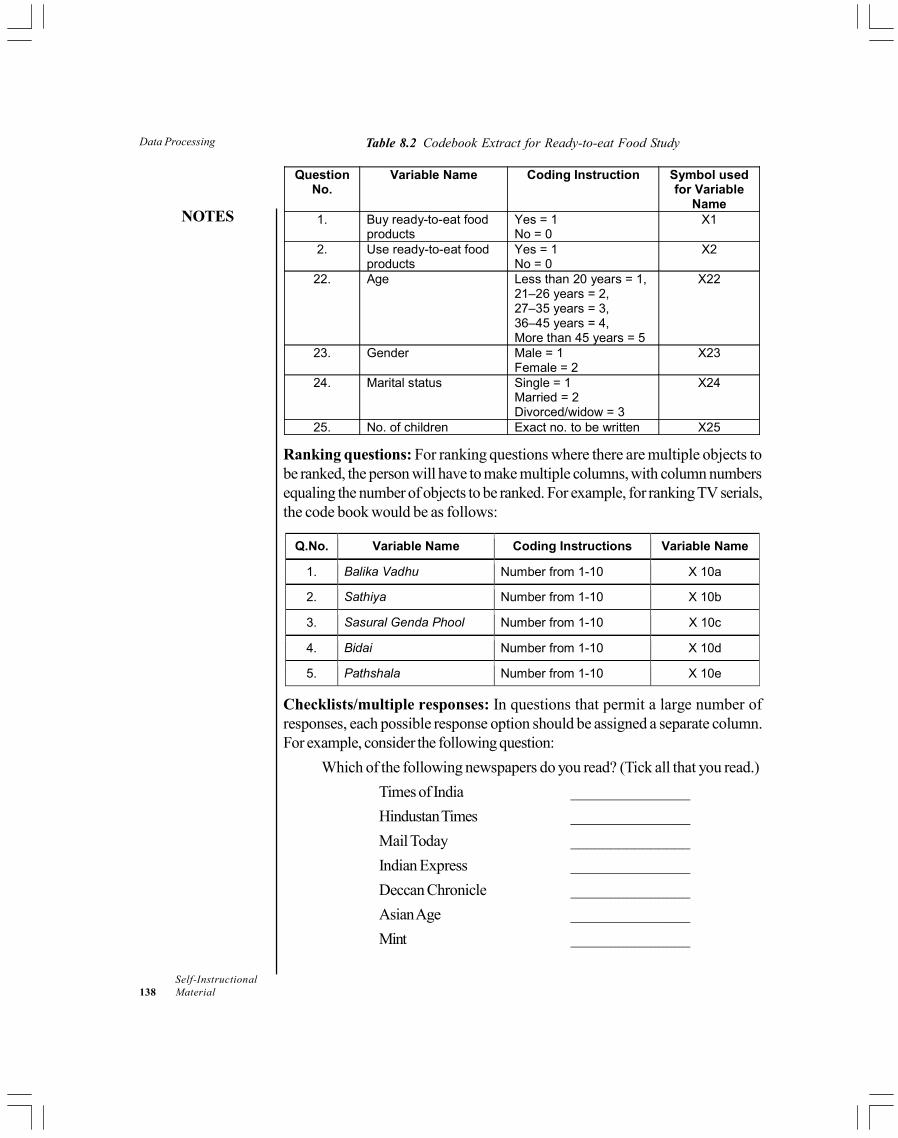
Data Processing
NOTES
Self-Instructional138 Material
Table 8.2 Codebook Extract for Ready-to-eat Food Study
Question No.
Variable Name Coding Instruction Symbol used for Variable
Name 1. Buy ready-to-eat food
products Yes = 1 No = 0
X1
2. Use ready-to-eat food products
Yes = 1 No = 0
X2
22. Age Less than 20 years = 1, 21–26 years = 2, 27–35 years = 3, 36–45 years = 4, More than 45 years = 5
X22
23. Gender Male = 1 Female = 2
X23
24. Marital status Single = 1 Married = 2 Divorced/widow = 3
X24
25. No. of children Exact no. to be written X25
Ranking questions: For ranking questions where there are multiple objects tobe ranked, the person will have to make multiple columns, with column numbersequaling the number of objects to be ranked. For example, for ranking TV serials,the code book would be as follows:
Q.No. Variable Name Coding Instructions Variable Name
1. Balika Vadhu Number from 1-10 X 10a
2. Sathiya Number from 1-10 X 10b
3. Sasural Genda Phool Number from 1-10 X 10c
4. Bidai Number from 1-10 X 10d
5. Pathshala Number from 1-10 X 10e
Checklists/multiple responses: In questions that permit a large number ofresponses, each possible response option should be assigned a separate column.For example, consider the following question:
Which of the following newspapers do you read? (Tick all that you read.)
Times of India _______________
Hindustan Times _______________
Mail Today _______________
Indian Express _______________
Deccan Chronicle _______________
Asian Age _______________
Mint _______________
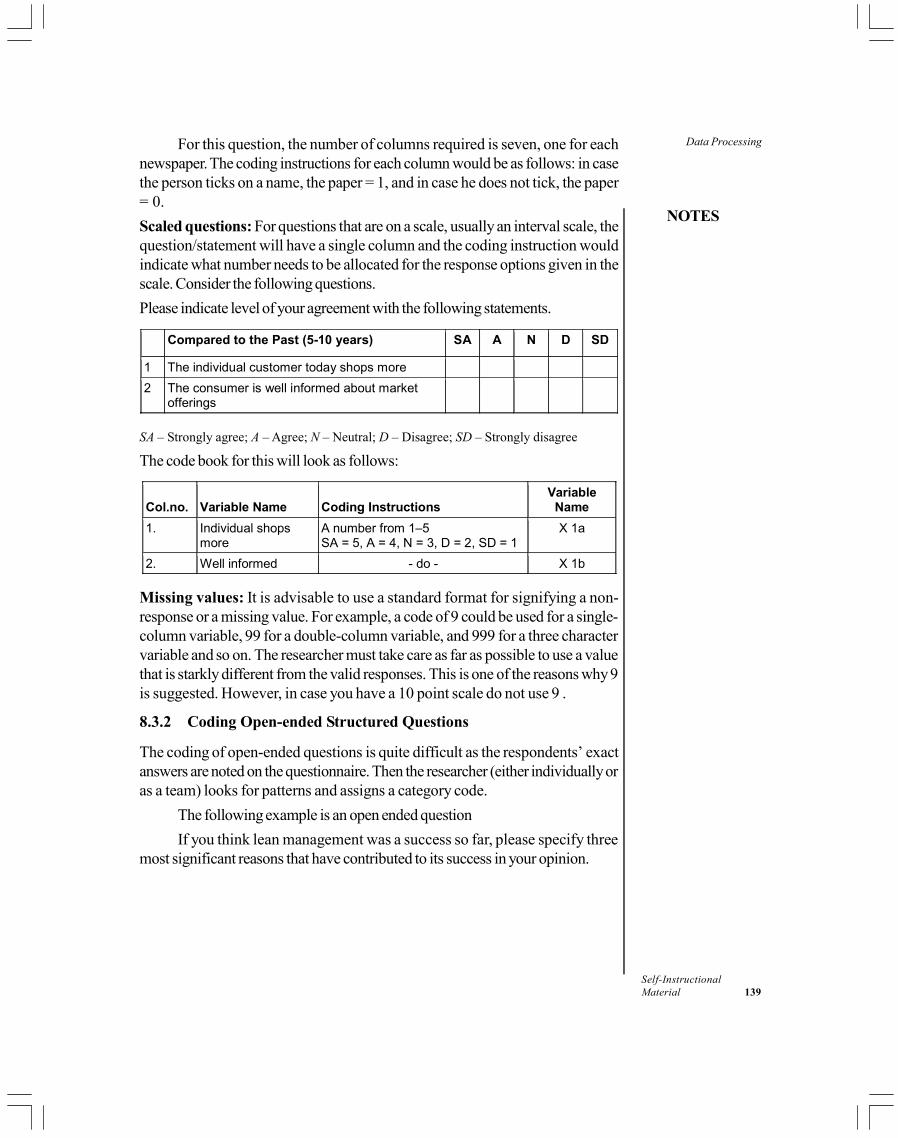
NOTES
Self-InstructionalMaterial 139
Data ProcessingFor this question, the number of columns required is seven, one for eachnewspaper. The coding instructions for each column would be as follows: in casethe person ticks on a name, the paper = 1, and in case he does not tick, the paper= 0.
Scaled questions: For questions that are on a scale, usually an interval scale, thequestion/statement will have a single column and the coding instruction wouldindicate what number needs to be allocated for the response options given in thescale. Consider the following questions.
Please indicate level of your agreement with the following statements.
Compared to the Past (5-10 years) SA A N D SD
1 The individual customer today shops more
2 The consumer is well informed about market offerings
SA – Strongly agree; A – Agree; N – Neutral; D – Disagree; SD – Strongly disagree
The code book for this will look as follows:
Col.no. Variable Name Coding Instructions Variable
Name
1. Individual shops more
A number from 1–5 SA = 5, A = 4, N = 3, D = 2, SD = 1
X 1a
2. Well informed - do - X 1b
Missing values: It is advisable to use a standard format for signifying a non-response or a missing value. For example, a code of 9 could be used for a single-column variable, 99 for a double-column variable, and 999 for a three charactervariable and so on. The researcher must take care as far as possible to use a valuethat is starkly different from the valid responses. This is one of the reasons why 9is suggested. However, in case you have a 10 point scale do not use 9 .
8.3.2 Coding Open-ended Structured Questions
The coding of open-ended questions is quite difficult as the respondents’ exactanswers are noted on the questionnaire. Then the researcher (either individually oras a team) looks for patterns and assigns a category code.
The following example is an open ended question
If you think lean management was a success so far, please specify threemost significant reasons that have contributed to its success in your opinion.

Data Processing
NOTES
Self-Instructional140 Material
People gave different answers. Thus, based upon the responses obtained,for the above question, the following post–code book was created:
Col.No. Variable Name Coding Instructions Variable Name
63 Improvement at workplace by eliminating waste.
Yes = 1 No = 0
X 63a
64 To meet increasing demands of customers
Yes = 1 No = 0
X 63b
65 To improve quality Yes = 1 No = 0
X 63c
66 To achieve corporate goal Yes = 1 No = 0
X 63d
8.4 CLASSIFICATION AND TABULATION OF DATA
Sometimes, the data obtained from the primary instrument is so huge that it becomesdifficult to interpret. In such cases, the researcher might decide to reduce theinformation into homogenous categories. This method of arrangement is calledclassification of data. This can be done on the basis of class intervals.
Classification by class intervals: Numerical data, like the ratio scale data, can beclassified into class intervals. This is to assist the quantitative analysis of data. Forexample, the age data obtained from the sample could be reduced to homogenousgrouped data, for example all those below 25 form one group, those 25–35 areanother group and so on. Thus, each group will have class limits—an upper and alower limit. The difference between the limits is termed as the class magnitude. Onecan have class intervals of both equal and unequal magnitude.
The decision on how many classes and whether equal or unequal dependsupon the judgement of the researcher. Generally, multiples of 2 or 5 are preferred.Some researchers adopt the following formula for determining the number of classintervals:
I = R/(1 + 3.3 log N)
where,
I = size of class interval,R = Range (i.e., difference between the values of the largest item and
smallest item among the given items),
N = Number of items to be grouped.
The class intervals that are decided upon could be exclusive, for example:
10–15
15–20
20–25
25–30

NOTES
Self-InstructionalMaterial 141
Data ProcessingIn this case, the upper limit of each is excluded from the category. Thus weread the first interval above as 10 and under 15, the next one as 15 and under 20and so on.
The other kind is inclusive, that is:
10–15
16–20
21–25
26–30
Here, both the lower and the upper limits are included in the interval. It says10–15 but actually means 10–15.99. It is recommended that when one hascontinuous data it should be signified as 10–15.99, as then all possibilities of theresponses are exhausted here. However, for discrete data one can use 10–15.
Once the categories and codes have been decided upon, the researcherneeds to arrange the same according to some logical pattern. This is referred to astabulation of data. This involves an orderly arrangement of data into an arraythat is suitable for a statistical analysis. Usually, this is an orderly arrangement ofthe rows and columns. In case there is data to be entered for one variable, theprocess is a simple tabulation and, when it is two or more variables, then onecarries out a cross-tabulation of data. The method of cross-tabulating the data isdiscussed at length in Unit 12.
Check Your Progress
3. What does a code book contain?
4. How is coding done for scaled questions?
5. What is class magnitude?
8.5 ANSWERS TO CHECK YOUR PROGRESSQUESTIONS
1. The editing of the raw data takes place at two levels, the first of these is fieldediting and the second is central editing.
2. One way to handle the problem of ‘armchair interviewing’ or a fudgedinterview is to first scroll the answers to the open-ended questions, asgenerally if the investigator is filling in multiple forms faking these would bedifficult.
3. A code book contains information on the question number, variable name,response descriptors, and coding instructions and the column descriptor.
Data Processing
NOTES
Self-Instructional142 Material
4. For questions that are on a scale, usually an interval scale, the question/statement will have a single column and the coding instruction would indicatewhat number needs to be allocated for the response options given in thescale.
5. In the class interval, each group has a lower and a upper limit. The differencebetween the limits is termed as the class magnitude.
8.6 SUMMARY
Data processing refers to the primary data that has been collected specificallyfor the study.
The researcher has to check for omissions or errors .This is the editingstage of the data processing step. This is done first at the field and then atthe central office level.
At this stage, the research team conducts some data treatment such asallocating the missing values, if possible, backtracking and sometimes,plugging the incomplete data.
Once this is completed, the researcher prepares code book. Classificationinto attributes or class intervals is carried out and the entered data is nowready for analysis in a tabular form.
8.7 KEY WORDS
Backtracking: The best and the most efficient way of handling unsatisfactoryresponses is to return to the field, and go back to the respondents.
Code book: Coding scheme for all the variables under study
Coding The process of identifying and denoting a numeral to the responsesgiven by a respondent is called
Data tabulation: Arrangement of data according to some logical pattern
8.8 SELF ASSESSMENT QUESTIONS ANDEXERCISES
Short-Answer Questions
1. What is data editing? Mention its significance.
2. Distinguish between field editing and centralized in-house editing. Mentionthe standard processes available to the researcher to carry out the editingprocess.

NOTES
Self-InstructionalMaterial 143
Data ProcessingLong-Answer Questions
1. How do you code data? What guidelines should be followed to carry outthe task? Discuss by giving suitable examples.
2. Distingush between coding closed-ended structured questions and codingopen-ended structured questions.
3. Explain the classification and tabulation of data.
8.9 FURTHER READINGS
Burns, Robert B. 2000. Introduction to Research Methods. London: SagePublications.
Chawla D and Sondhi N. 2016. Research Methodology: Concepts and Cases,2nd edition. New Delhi: Vikas Publishing House.
Kothari, C R. 1990. Research Methodology: Methods and Techniques, 2ndedn. New Delhi: Wiley Eastern Ltd.

Univariate and BivariateAnalysis of Data
NOTES
Self-Instructional144 Material
UNIT 9 UNIVARIATE ANDBIVARIATE ANALYSISOF DATA
Structure
9.0 Introduction9.1 Objectives9.2 Descriptive vs Inferential Analysis
9.2.1 Descriptive Analysis9.2.2 Inferential Analysis
9.3 Descriptive Analysis of Univariate Data9.3.1 Analysis of Nominal Scale Data with only One Possible Response9.3.2 Analysis of Nominal Scale Data with Multiple Category Responses9.3.3 Analysis of Ordinal Scaled Questions9.3.4 Measures of Central Tendency9.3.5 Measures of Dispersion
9.4 Descriptive Analysis of Bivariate Data9.5 Answers to Check Your Progress Questions9.6 Summary9.7 Key Words9.8 Self Assessment Questions and Exercises9.9 Further Readings
9.0 INTRODUCTION
In the previous unit, we studied the processing of data collected from both primaryand secondary sources. The next step is to analyse the same so as to draw logicalinferences from them. The data collected in a survey could be voluminous in nature,depending upon the size of the sample. In a typical research study there may be alarge number of variables that the researcher needs to analyse. The analysis couldbe univariate, bivariate and multivariate in nature. In the univariate analysis, onevariable is analysed at a time. In bivariate analysis, two variables are analysedtogether and examined for any possible association between them. In multivariateanalysis, the concern is to analyse more than two variables at a time.
In this unit, we will concentrate on the descriptive analysis of univariate andbivariate data
9.1 OBJECTIVES
After going through this unit, you will be able to:
Distinguish between univariate, bivariate and multivariate analysis.

NOTES
Self-InstructionalMaterial 145
Univariate and BivariateAnalysis of Data
Differentiate between descriptive and inferential analysis.
Discuss the type of descriptive univariate analysis to be carried on nominal,ordinal, interval and ratio scale data.
Explain the descriptive analysis of bivariate data.
9.2 DESCRIPTIVE VS INFERENTIAL ANALYSIS
At the data analysis stage, the first step is to describe the sample which is followedby inferential analysis. In the descriptive analysis, we describe the sample whereasthe inferential analysis deals with generalizing the results as obtained from the sample.
9.2.1 Descriptive Analysis
Descriptive analysis refers to transformation of raw data into a form that will facilitateeasy understanding and interpretation. Descriptive analysis deals with summarymeasures relating to the sample data. The common ways of summarizing data areby calculating average, range, standard deviation, frequency and percentagedistribution. Below is a set of typical questions that are required to be answeredunder descriptive statistics:
What is the average income of the sample?
What is the standard deviation of ages in the sample?
What percentage of sample respondents are married?
What is the median age of the sample respondents?
Which income group has the highest number of user of product in questionin the sample?
Is there any association between the frequency of purchase of product andincome level of the consumers?
Types of descriptive analysis
The type of descriptive analysis to be carried out depends on the measurement ofvariables into four forms—nominal, ordinal, interval and ratio.
Table 9.1 presents the type of descriptive analysis which is applicable undereach form of measurement.
Table 9.1 Descriptive Analysis for Various Levels of Measurement
Type of Measurement Type of Descriptive Analysis
Nominal Frequency table, Proportion percentages, Mode
Ordinal Median, Quartiles, Percentiles, Rank order correlation
Interval Arithmetic mean, Correlation coefficient
Ratio Index numbers, Geometric mean, Harmonic mean

Univariate and BivariateAnalysis of Data
NOTES
Self-Instructional146 Material
9.2.2 Inferential Analysis
After descriptive analysis has been carried out, the tools of inferential statistics areapplied. Under inferential statistics, inferences are drawn on population parametersbased on sample results. The researcher tries to generalize the results to thepopulation based on sample results. The analysis is based on probability theoryand a necessary condition for carrying out inferential analysis is that the sampleshould be drawn at random. The following is an illustrative list of questions that arecovered under inferential statistics.
Is the average age of the population significantly different from 35?
Is the job satisfaction of unskilled workers significantly related with theirpay packet?
Do the users and non-users of a brand vary significantly with respect toage?
Does the advertisement expenditure influences sale significantly?
Are consumption expenditure and disposable income of householdssignificantly correlated?
Is the proportion of satisfied workers significantly more for skilled workersthan for unskilled works?
Check Your Progress
1. What are some of the common ways of summarizing data?
2. What is inferential analysis based on? State its necessary condition.
9.3 DESCRIPTIVE ANALYSIS OF UNIVARIATE DATA
The first step under univariate analysis is the preparation of frequency distributionsof each variable. The frequency distribution is the counting of responses orobservations for each of the categories or codes assigned to a variable.
9.3.1 Analysis of Nominal Scale Data with only One Possible Response
Consider a nominal scale variable—gender of respondents in a survey research.
Table 9.2 shows both the raw frequency and the percentages of responsesfor each category in case of the variable gender in a sample of 414 respondents.

NOTES
Self-InstructionalMaterial 147
Univariate and BivariateAnalysis of Data
Table 9.2 Gender of the respondent
Frequency Per cent Valid
Per cent Cumulative
Per cent
Valid
Male 301 72.7 72.7 72.7
Female 113 27.3 27.3 100.0
Total 414 100.0 100.0
This tabulation process can be done by hand, using tally marks. The resultsindicate that out of a sample of 414 respondents, 301 are male and 113 are female.The raw frequencies are often converted into percentages as they are moremeaningful. In the present case, for example, there are 72.7 per cent male and27.3 per cent female respondents.
9.3.2 Analysis of Nominal Scale Data with Multiple Category Responses
In section 9.3.1 the variable considered could take only two values, namely, maleand female and one of the two responses was possible. However, at times, theresearcher comes across multiple-category questions, where respondents couldchoose more than one answer. In such a case, the preparation of frequency tableand its interpretation is slightly different. If the question in the research study ismultiple category question and the responds are allowed to tick more than onechoice, the percentage in such a case may not add up to 100. For example, onemay consider the following question:
When accessing the internet at a cyber cafe, tick up to four frequently usedapplications for which you use the cyber cafe.
1. E-mail
2. Chat
3. Browsing
4. Downloading
5. Shopping
6. Net telephony
7. Business and Commerce (e-commerce)
8. Entertainment
9. Adult sites
10. Astrology and Horoscope
11. Education
12. Any other, please specify.

Univariate and BivariateAnalysis of Data
NOTES
Self-Instructional148 Material
The coding for the variable applications has been in binary form wherevalues one and zero are assigned. If the respondent uses a particular application,the value assigned is 1, otherwise 0. The resulting frequency table for the above-mentioned question is as presented in Table 9.3.
Table 9.3 Frequently used Applications at Cyber Cafe
Sl. No. Application Frequencies Percentage (%)
1 Email 399 94.9
2 Chat 316 76.3
3 Browsing 232 56
4 Downloading 197 47.6
5 Shopping 30 7.2
6 Net telephony 30 7.2
7 E-commerce 51 12.3
8 Entertainment 135 32.6
9 Adult sites 59 14.3
10 Astrology and horoscopes 52 12.6
11 Education 159 38.4
12 Any Other 14 3.4
TOTAL RESPONDENTS 414
*Total exceeds 100% because of multiplicity of answers.
In Table 9.3 the percentages are computed on the total sample size of 414.If these percentages are added up, they would exceed more than 100 per cent.This is because of multiplicity of answers as respondents were given the chance tochoose more than one answer. The interpretation of the table would be based ona sample of 414 and is given as:
The most used application at a cyber cafe is e-mail. It is seen that 94.9 percent of the users make use of this.
The second popular application is chatting, and 76.3 per cent of the samplerespondents make use of it.
Similarly, other applications in order of preference are browsing (56 percent), downloading (47.6 per cent), education 35.4 per cent), entertainment(32.6 per cent) and so on.
9.3.3 Analysis of Ordinal Scaled Questions
There could always be some ordinal-scaled questions in the questionnaire. Thequestion before the researcher is how to tabulate and interpret the responses tosuch questions. It could be done in two ways as would be shown in the followingexample. The questions asked of the respondents in such a case could be:
Rank the following five attributes while choosing a restaurant for dinner.Assign a rank of 1 to the most important, 2 to the next important … and 5to the least important.
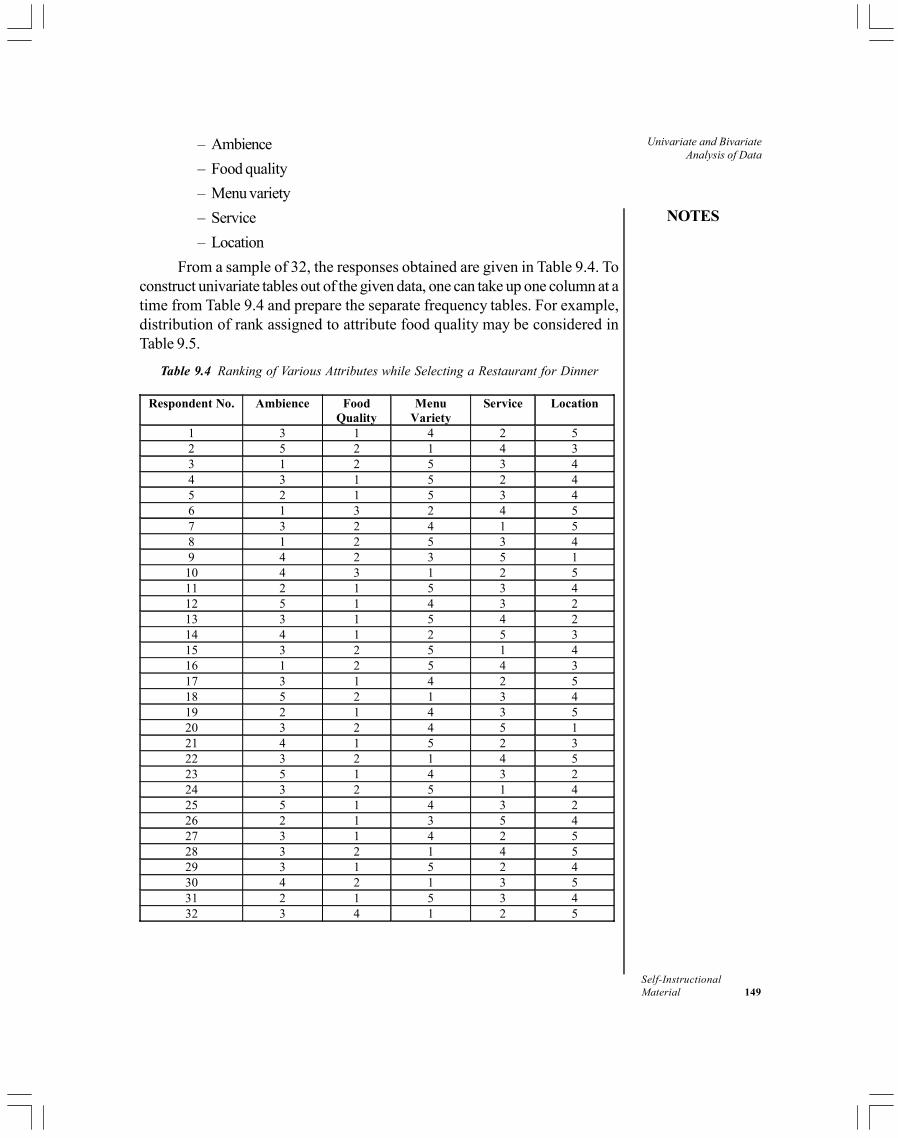
NOTES
Self-InstructionalMaterial 149
Univariate and BivariateAnalysis of Data
– Ambience
– Food quality
– Menu variety
– Service
– Location
From a sample of 32, the responses obtained are given in Table 9.4. Toconstruct univariate tables out of the given data, one can take up one column at atime from Table 9.4 and prepare the separate frequency tables. For example,distribution of rank assigned to attribute food quality may be considered inTable 9.5.
Table 9.4 Ranking of Various Attributes while Selecting a Restaurant for Dinner
Respondent No. Ambience Food Quality
Menu Variety
Service Location
1 3 1 4 2 5 2 5 2 1 4 3 3 1 2 5 3 4 4 3 1 5 2 4 5 2 1 5 3 4 6 1 3 2 4 5 7 3 2 4 1 5 8 1 2 5 3 4 9 4 2 3 5 1 10 4 3 1 2 5 11 2 1 5 3 4 12 5 1 4 3 2 13 3 1 5 4 2 14 4 1 2 5 3 15 3 2 5 1 4 16 1 2 5 4 3 17 3 1 4 2 5 18 5 2 1 3 4 19 2 1 4 3 5 20 3 2 4 5 1 21 4 1 5 2 3 22 3 2 1 4 5 23 5 1 4 3 2 24 3 2 5 1 4 25 5 1 4 3 2 26 2 1 3 5 4 27 3 1 4 2 5 28 3 2 1 4 5 29 3 1 5 2 4 30 4 2 1 3 5 31 2 1 5 3 4 32 3 4 1 2 5
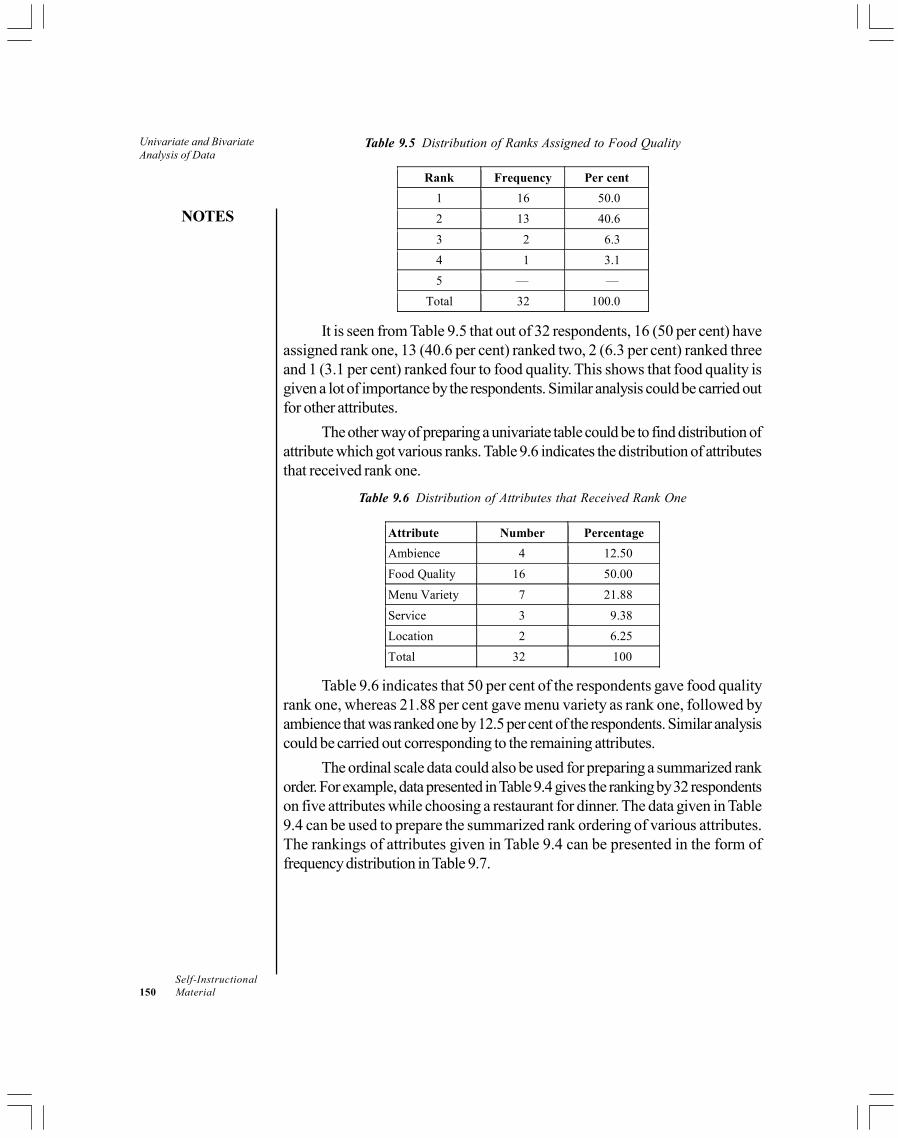
Univariate and BivariateAnalysis of Data
NOTES
Self-Instructional150 Material
Table 9.5 Distribution of Ranks Assigned to Food Quality
Rank Frequency Per cent
1 16 50.0
2 13 40.6
3 2 6.3
4 1 3.1
5 — —
Total 32 100.0
It is seen from Table 9.5 that out of 32 respondents, 16 (50 per cent) haveassigned rank one, 13 (40.6 per cent) ranked two, 2 (6.3 per cent) ranked threeand 1 (3.1 per cent) ranked four to food quality. This shows that food quality isgiven a lot of importance by the respondents. Similar analysis could be carried outfor other attributes.
The other way of preparing a univariate table could be to find distribution ofattribute which got various ranks. Table 9.6 indicates the distribution of attributesthat received rank one.
Table 9.6 Distribution of Attributes that Received Rank One
Attribute Number Percentage
Ambience 4 12.50
Food Quality 16 50.00
Menu Variety 7 21.88
Service 3 9.38
Location 2 6.25
Total 32 100
Table 9.6 indicates that 50 per cent of the respondents gave food qualityrank one, whereas 21.88 per cent gave menu variety as rank one, followed byambience that was ranked one by 12.5 per cent of the respondents. Similar analysiscould be carried out corresponding to the remaining attributes.
The ordinal scale data could also be used for preparing a summarized rankorder. For example, data presented in Table 9.4 gives the ranking by 32 respondentson five attributes while choosing a restaurant for dinner. The data given in Table9.4 can be used to prepare the summarized rank ordering of various attributes.The rankings of attributes given in Table 9.4 can be presented in the form offrequency distribution in Table 9.7.

NOTES
Self-InstructionalMaterial 151
Univariate and BivariateAnalysis of Data
Table 9.7 Frequency Table of the Rankings of the Attributes while Selectinga Restaurant for Dinner
Attribute Rank
1 2 3 4 5
Ambience 4 5 13 5 5
Food Quality 16 13 2 1 0
Menu Variety 7 2 2 9 12
Service 3 8 11 6 4
Location 2 4 4 11 11
Total 32 32 32 32 32
To calculate a summary rank ordering, the attribute with the first rank wasgiven the lowest number (1) and the least preferred attribute was given the highestnumber (5).
The summarized rank order is obtained with the following computations as:
Ambience : (4 × 1) + (5 × 2) + (13 × 3) + (5 × 4) + (5 × 5) = 98 Food Quality : (16 × 1) + (13 × 2) + (2 × 3) + (1 × 4) + (0 × 5) = 52 Menu Variety : (7 × 1) + (2 × 2) + (2 × 3) + (9 × 4) + (12 × 5) = 113 Service : (3 × 1) + (8 × 2) + (11 × 3) + (6 × 4) + (4 × 5) = 96 Location : (2 × 1) + (4 × 2) + (4 × 3) + (11 × 4) + (11 × 5) = 121
The total lowest score indicates the first preference ranking. The results
show the following rank ordering:
(1) Food quality
(2) Service
(3) Ambience
(4) Menu variety
(5) Location
9.3.4 Measures of Central Tendency
There are three measures of central tendency that are used in research—mean,median and mode.
1. Mean
The mean represents the arithmetic average of a variable is appropriate for intervaland ratio scale data. The mean is computed as:
1
n
ii
X
Xn

Univariate and BivariateAnalysis of Data
NOTES
Self-Instructional152 Material
Where,
X = Mean of some variable X
Xi
= Value of i th observation on that sample
n = Number of observations in the sample
It is also possible to compute the value of mean when interval or ratio scaledata are grouped into categories or classes. The formula for mean in such a caseis given by:
1
k
i ii
f X
Xn
Where,
fi
= Frequency of ith class
Xi
= Midpoint of ith class
k = Number of classes
Given below are two examples to illustrate the computation of arithmeticmean:
Example 9.1: The percentage of dividend declared by a company over the last12 years is 5, 8, 6, 10, 12, 20, 18, 15, 30, 25, 20, 16. Compute the averagedividend.
Solution:
Let Xi denote the dividend declared in ith year;
185 15.417ii
XX X
n
Therefore, the average dividend declared by the company in the last 12years is 15.417 per cent.
Example 9.2: The sales data of 250 retail outlets in the garment industry gave thefollowing distribution. Compute the arithmetic mean of the sales.
Sales (in lakh) No. of firms
0–20 6
20–40 16
40–60 34
60–80 46
80–100 75
100–120 42
120–140 20
140–160 11
Total 250

NOTES
Self-InstructionalMaterial 153
Univariate and BivariateAnalysis of Data
Solution:
Sales (in lakh) No. of firms (f ) Mid-point (X) X × f 0–20 6 10 60
20–40 16 30 480 40–60 34 50 1700 60–80 46 70 3220
80–100 75 90 6750 100–120 42 110 4620 120–140 20 130 2600 140–160 11 150 1650
Total 250 21080
2108021080 84.32
250i i
i ii
X fX f X
f
Hence, the average sales of 250 retail outlets in the garments industry is84.32 lakh. The main limitation of arithmetic mean as a measure of central tendency
is that it is unduly affected by extreme values. Further, it cannot be computed withopen-ended frequency distribution without making assumptions regarding the sizeof the class interval of the open-ended classes. In an extremely asymmetricaldistribution, it is not a good measure of central tendency.
2. Median
The median can be computed for ratio, interval or ordinal scale data. The medianis that value in the distribution such that 50 per cent of the observations are belowit and 50 per cent are above it. The median for the ungrouped data is defined asthe middle value when the data is arranged in ascending or descending order ofmagnitude. In case the number of items in the sample is odd, the value of (n + 1)/2th item gives the median. However if there are even number of items in the sample,say of size 2n, the arithmetic mean of nth and (n + 1)th items gives the median. It isagain emphasized that data needs to be arranged in ascending or descending orderof the magnitude before computing the median.
Given below are a few examples to illustrate the computation of median:
Example 9.3: The marks of 21 students in economics are given 62, 38, 42, 43,57, 72, 68, 60, 72, 70, 65, 47, 49, 39, 66, 73, 81, 55, 57, 57, 59. Compute themedian of the distribution.
Solution:
By arranging the data in ascending order of magnitude, we obtain: 38, 39, 42, 43,47, 49, 55, 57, 57, 57, 59, 60, 62, 65, 66, 68, 70, 72, 72, 73, 81.
The median will be the value of the 11th observation arranged as above.Therefore, the value of median equals 59. This means 50 per cent of studentsscore marks below 59 and 50 per cent score above 59.
Example 9.4: What would be the median score in the above example if therewere 22 students in the class and the score of the 22nd student was 79.
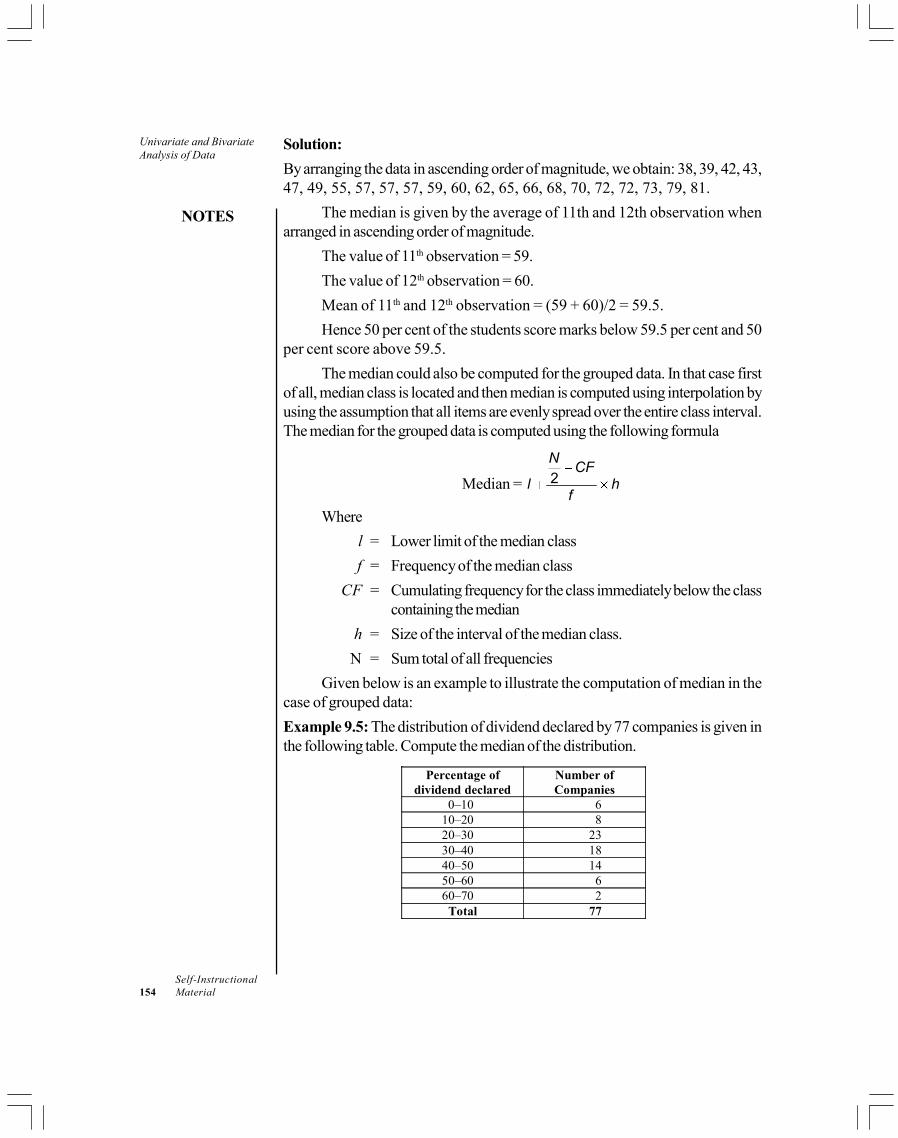
Univariate and BivariateAnalysis of Data
NOTES
Self-Instructional154 Material
Solution:
By arranging the data in ascending order of magnitude, we obtain: 38, 39, 42, 43,47, 49, 55, 57, 57, 57, 59, 60, 62, 65, 66, 68, 70, 72, 72, 73, 79, 81.
The median is given by the average of 11th and 12th observation whenarranged in ascending order of magnitude.
The value of 11th observation = 59.
The value of 12th observation = 60.
Mean of 11th and 12th observation = (59 + 60)/2 = 59.5.
Hence 50 per cent of the students score marks below 59.5 per cent and 50per cent score above 59.5.
The median could also be computed for the grouped data. In that case firstof all, median class is located and then median is computed using interpolation byusing the assumption that all items are evenly spread over the entire class interval.The median for the grouped data is computed using the following formula
Median = 2N
CFl h
f
Where
l = Lower limit of the median class
f = Frequency of the median class
CF = Cumulating frequency for the class immediately below the classcontaining the median
h = Size of the interval of the median class.
N = Sum total of all frequencies
Given below is an example to illustrate the computation of median in thecase of grouped data:
Example 9.5: The distribution of dividend declared by 77 companies is given inthe following table. Compute the median of the distribution.
Percentage of dividend declared
Number of Companies
0–10 6 10–20 8 20–30 23 30–40 18 40–50 14 50–60 6 60–70 2
Total 77

NOTES
Self-InstructionalMaterial 155
Univariate and BivariateAnalysis of Data
Solution:
Percentage of dividend declared
Number of Companies (f)
CF
0–10 6 6 10–20 8 14 20–30 23 37 30–40 18 55 40–50 14 69 50–60 6 75 60–70 2 77 Total 77
Median = 2N
CFl h
f
Where
l = Lower limit of the median class = 30
f = Frequency of the median class = 18
CF = Cumulating frequency for the class immediately belowthe class containing the median = 37
h = Size of the interval of the median class = 10
N = Sum total of all frequencies
Substituting these values in the formula for median, we getMedian = 30.83
The results show that half of the companies have declared less than 30.83per cent dividend and the other half have declared more than 30.83 per centdividend.
The limitations of median as a measure of central tendency is that it does notuse each and every observation in its computation since it is a positional average.
3. Mode
The mode is that measure of central tendency which is appropriate for nominal orhigher order scales. It is the point of maximum frequency in a distribution aroundwhich other items of the set cluster densely. Mode should not be computed forordinal or interval data unless these data have been grouped first. The concept iswidely used in business, e.g. a shoe store owner would be naturally interested inknowing the size of the shoe that the majority of the customers ask for. Similarly, agarment manufacturer is interested in determining the size of the shirt that fits mostpeople so as to plan its production accordingly.
Example 9.6: The marks of 20 students of a class in statistics are given as under:
44, 52, 40, 61, 58, 52, 63, 75, 87, 52, 63, 38, 44, 61, 68, 75, 72, 52, 51, 50,
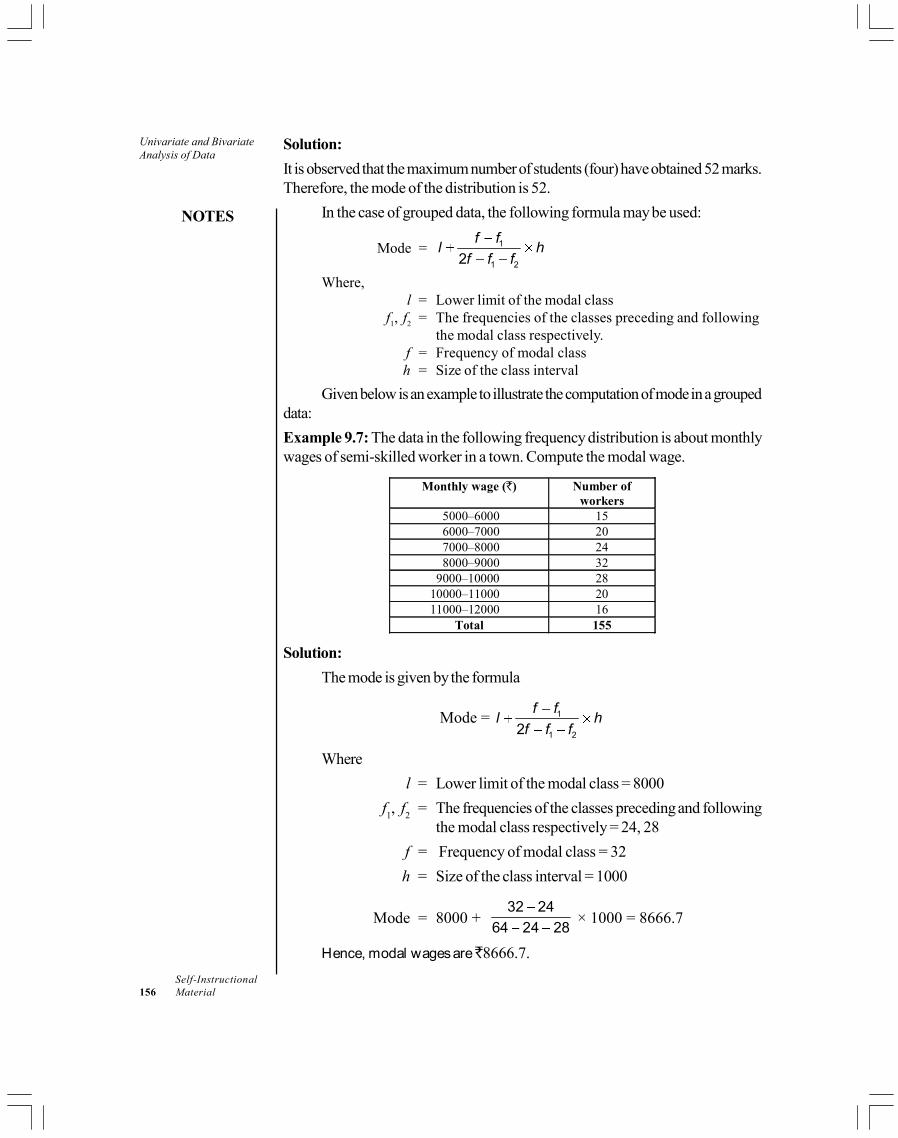
Univariate and BivariateAnalysis of Data
NOTES
Self-Instructional156 Material
Solution:
It is observed that the maximum number of students (four) have obtained 52 marks.Therefore, the mode of the distribution is 52.
In the case of grouped data, the following formula may be used:
Mode = 1
1 22
f fl h
f f f
Where,l = Lower limit of the modal class
f1, f2 = The frequencies of the classes preceding and followingthe modal class respectively.
f = Frequency of modal classh = Size of the class interval
Given below is an example to illustrate the computation of mode in a groupeddata:
Example 9.7: The data in the following frequency distribution is about monthlywages of semi-skilled worker in a town. Compute the modal wage.
Monthly wage ( ) Number of workers
5000–6000 15 6000–7000 20 7000–8000 24 8000–9000 32
9000–10000 28 10000–11000 20 11000–12000 16
Total 155
Solution:
The mode is given by the formula
Mode = 1
1 22
f fl h
f f f
Where
l = Lower limit of the modal class = 8000
f1, f
2= The frequencies of the classes preceding and following
the modal class respectively = 24, 28
f = Frequency of modal class = 32
h = Size of the class interval = 1000
Mode = 8000 + 32 24
64 24 28 × 1000 = 8666.7
Hence, modal wages are 8666.7.

NOTES
Self-InstructionalMaterial 157
Univariate and BivariateAnalysis of Data
Another important concept is skewness, which measures lack of symmetryin the distribution. In case of symmetrical distribution, mean = median = mode.For a positively skewed distribution, mean > median > mode. In such a case, thelonger tail of the distribution is towards the right, the mode falls under the peak andthe mean changes its position as it is affected by extreme values. The same is thecase with negatively skewed distribution where arithmetic mean< median < mode.
The skewness is measured by the difference between arithmetic mean andmode. If the value of arithmetic mean is greater than mode, skewness is positiveand if the value of the expression is negative, skewness is negative.
9.3.5 Measures of Dispersion
The measures of central tendency locate the centre of the distribution. However,they do not provide enough information to the researcher to fully understand thedistribution being examined. There is a need to study the spread of a distributionof a variable and the methods which provide that are called measures of dispersion.
The study of dispersion could help in taking better decisions. This is becausesmall dispersion indicates high uniformity of the items, whereas large variability denotesless uniformity. If returns on a particular investment show lot of variability (dispersion),it means a risky investment as compared to the one where variability is very small.The various measures of dispersion are discussed below:
(i) Range: This is the simplest measure of dispersion and is defined asthe distance between the highest (maximum) value and the lowest(minimum) value in an ordered set of values. The range could becomputed for interval scale and ratio scale data.
Range = Xmax
– Xmin
Where,
Xmax
= Maximum value of the variable
Xmin
= Minimum value of the variable
The limitation of range as a measure of dispersion is that it considersonly the extreme value and ignores all other data points. The value ofrange could vary considerably from sample to sample. Even with thislimitation, range as a measure of dispersion is widely used in industrialquality control for the preparation of control charts.
Example 9.8: The following are the prices of shares of a company from Mondayto Friday: Calculate the range of the distribution.
Day Price ( ) Monday 125 Tuesday 180 Wednesday 100 Thursday 210 Friday 150
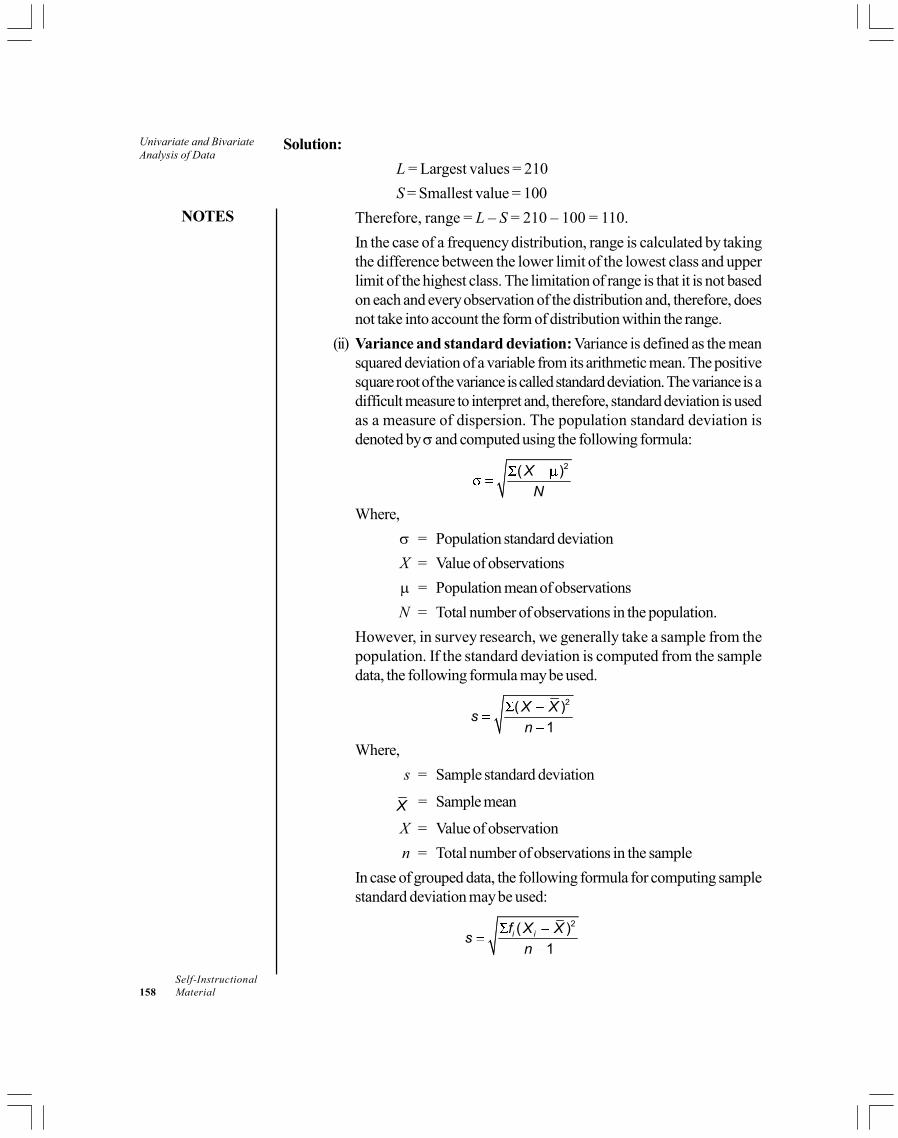
Univariate and BivariateAnalysis of Data
NOTES
Self-Instructional158 Material
Solution:
L = Largest values = 210
S = Smallest value = 100
Therefore, range = L – S = 210 – 100 = 110.
In the case of a frequency distribution, range is calculated by takingthe difference between the lower limit of the lowest class and upperlimit of the highest class. The limitation of range is that it is not basedon each and every observation of the distribution and, therefore, doesnot take into account the form of distribution within the range.
(ii) Variance and standard deviation: Variance is defined as the meansquared deviation of a variable from its arithmetic mean. The positivesquare root of the variance is called standard deviation. The variance is adifficult measure to interpret and, therefore, standard deviation is usedas a measure of dispersion. The population standard deviation isdenoted by and computed using the following formula:
2( )X
N
Where,
= Population standard deviation
X = Value of observations
= Population mean of observations
N = Total number of observations in the population.
However, in survey research, we generally take a sample from thepopulation. If the standard deviation is computed from the sampledata, the following formula may be used.
2( )
1
X Xs
n
Where,
s = Sample standard deviation
X = Sample mean
X = Value of observation
n = Total number of observations in the sample
In case of grouped data, the following formula for computing samplestandard deviation may be used:
2( )
1i if X X
sn
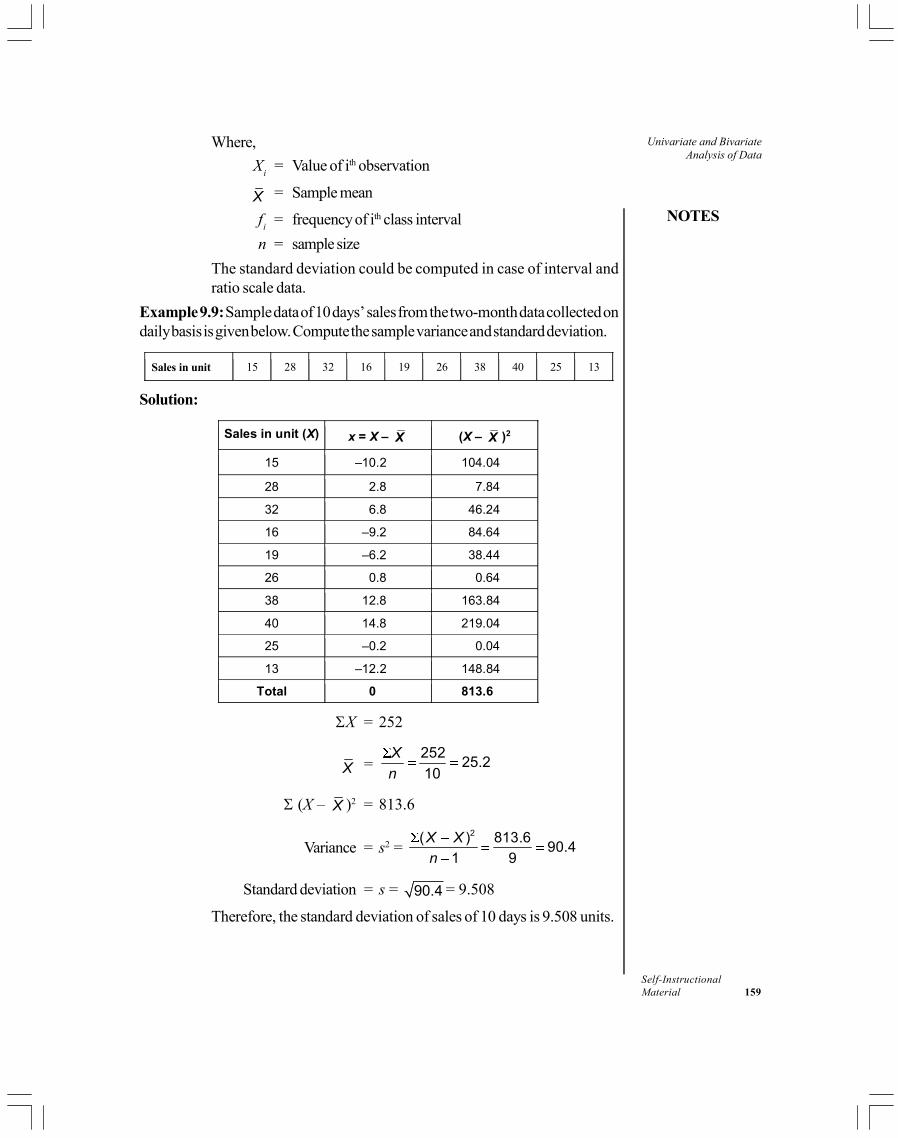
NOTES
Self-InstructionalMaterial 159
Univariate and BivariateAnalysis of Data
Where,
Xi
= Value of ith observation
X = Sample mean
fi
= frequency of ith class interval
n = sample size
The standard deviation could be computed in case of interval andratio scale data.
Example 9.9: Sample data of 10 days’ sales from the two-month data collected ondaily basis is given below. Compute the sample variance and standard deviation.
Sales in unit 15 28 32 16 19 26 38 40 25 13
Solution:
Sales in unit (X) x = X – X (X – X )2
15 –10.2 104.04
28 2.8 7.84
32 6.8 46.24
16 –9.2 84.64
19 –6.2 38.44
26 0.8 0.64
38 12.8 163.84
40 14.8 219.04
25 –0.2 0.04
13 –12.2 148.84
Total 0 813.6
X = 252
X =252
25.210
X
n
(X – X )2 = 813.6
Variance = s2 = 2( ) 813.6
90.41 9
X X
n
Standard deviation = s = 90.4 = 9.508
Therefore, the standard deviation of sales of 10 days is 9.508 units.

Univariate and BivariateAnalysis of Data
NOTES
Self-Instructional160 Material
Example 9.10: The data on dividend declared in percentage is presented in thefollowing frequency distribution table for a sample of 107 companies. Computethe variance and standard deviation of the dividend declared.
Dividend declared (per cent)
Number of Companies
0–10 5
10–20 10
20–30 13
30–40 25
40–50 30
50–60 16
60–70 8
Total 107
Solution:
Dividend declared (per cent)
Number of Companies (f) X f X X – X (X – X )2 f (X – X )2
0–10 5 5 25 – 33.5514 1125.697 5628.483 10–20 10 15 150 – 23.5514 554.6685 5546.685 20–30 13 25 325 – 13.5514 183.6405 2387.326 30–40 25 35 875 – 3.5514 12.61246 315.3114 40–50 30 45 1350 6.448598 41.58442 1247.533 50–60 16 55 880 16.4486 270.5564 4328.902 60–70 8 65 520 26.4486 699.5283 5596.227 Total 4125 25050.47
fX = 4125
X =4125
38.5514107
fX
f
f(X – X )2 = 25050.47
Variance = s2 = 2( ) 25050.47
236.32521 106
f X X
n
s = Standard deviation = 236.3252 = 15.373
Therefore, the standard deviation of the dividend declared of 107companies is 15.373 per cent.
(iii) Coefficient of variation: This measure is computed for ratio scalemeasurement. The standard deviation measures the variability of avariable around the mean. The unit of measurement of standard
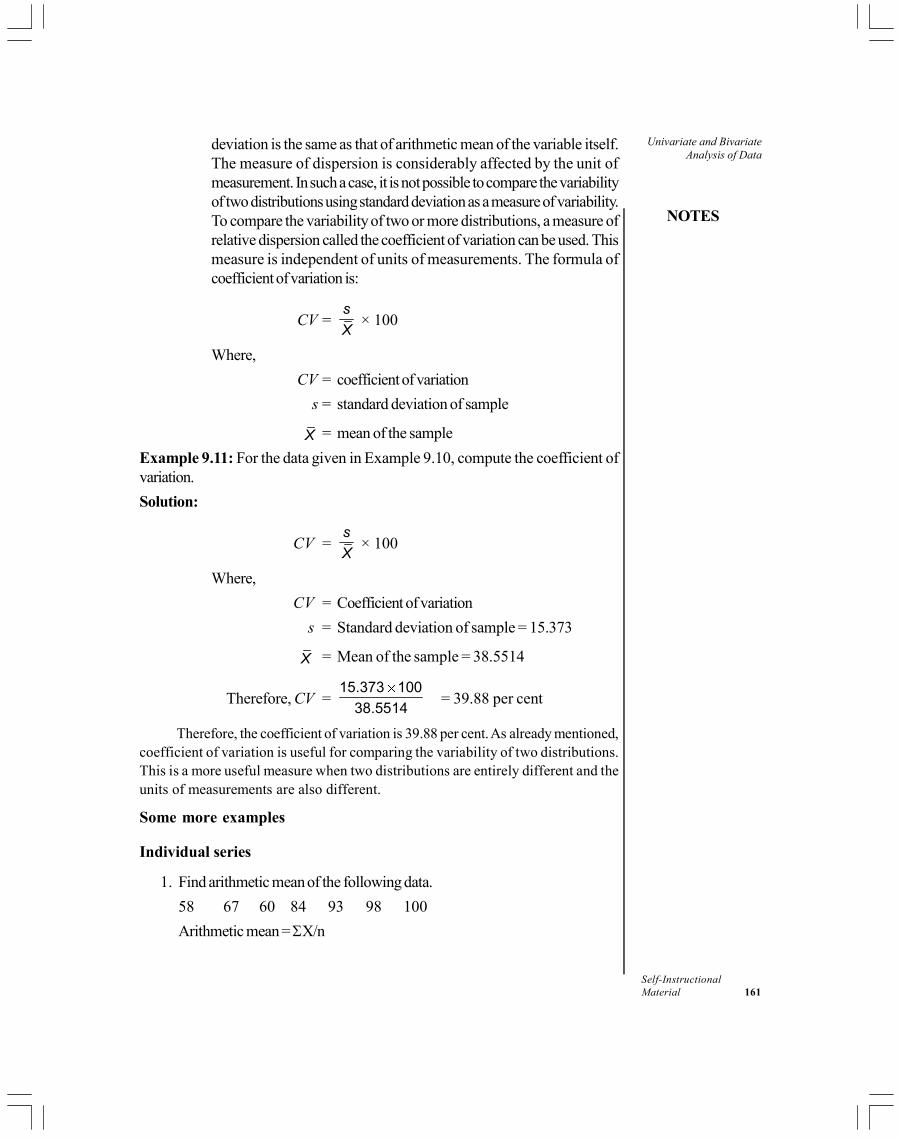
NOTES
Self-InstructionalMaterial 161
Univariate and BivariateAnalysis of Data
deviation is the same as that of arithmetic mean of the variable itself.The measure of dispersion is considerably affected by the unit ofmeasurement. In such a case, it is not possible to compare the variabilityof two distributions using standard deviation as a measure of variability.To compare the variability of two or more distributions, a measure ofrelative dispersion called the coefficient of variation can be used. Thismeasure is independent of units of measurements. The formula ofcoefficient of variation is:
CV =s
X × 100
Where,
CV = coefficient of variation
s = standard deviation of sample
X = mean of the sample
Example 9.11: For the data given in Example 9.10, compute the coefficient ofvariation.
Solution:
CV =s
X × 100
Where,
CV = Coefficient of variation
s = Standard deviation of sample = 15.373
X = Mean of the sample = 38.5514
Therefore, CV =15.373 100
38.5514= 39.88 per cent
Therefore, the coefficient of variation is 39.88 per cent. As already mentioned,coefficient of variation is useful for comparing the variability of two distributions.This is a more useful measure when two distributions are entirely different and theunits of measurements are also different.
Some more examples
Individual series
1. Find arithmetic mean of the following data.
58 67 60 84 93 98 100
Arithmetic mean = X/n
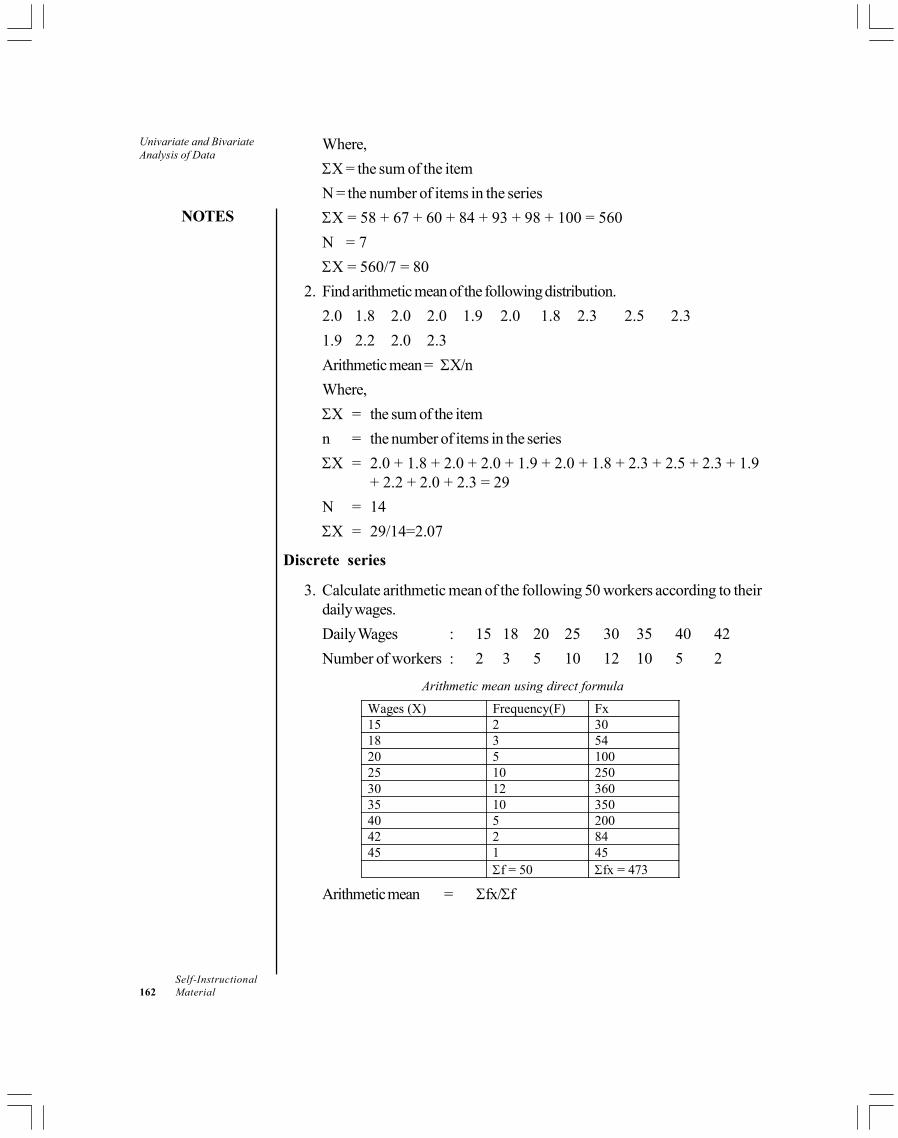
Univariate and BivariateAnalysis of Data
NOTES
Self-Instructional162 Material
Where,
X = the sum of the item
N = the number of items in the series
X = 58 + 67 + 60 + 84 + 93 + 98 + 100 = 560
N = 7
X = 560/7 = 80
2. Find arithmetic mean of the following distribution.
2.0 1.8 2.0 2.0 1.9 2.0 1.8 2.3 2.5 2.3
1.9 2.2 2.0 2.3
Arithmetic mean = X/n
Where,
X = the sum of the item
n = the number of items in the series
X = 2.0 + 1.8 + 2.0 + 2.0 + 1.9 + 2.0 + 1.8 + 2.3 + 2.5 + 2.3 + 1.9+ 2.2 + 2.0 + 2.3 = 29
N = 14
X = 29/14=2.07
Discrete series
3. Calculate arithmetic mean of the following 50 workers according to theirdaily wages.
Daily Wages : 15 18 20 25 30 35 40 42
Number of workers : 2 3 5 10 12 10 5 2
Arithmetic mean using direct formula
Wages (X) Frequency(F) Fx 15 2 30 18 3 54 20 5 100 25 10 250 30 12 360 35 10 350 40 5 200 42 2 84 45 1 45 f = 50 fx = 473
Arithmetic mean = fx/f
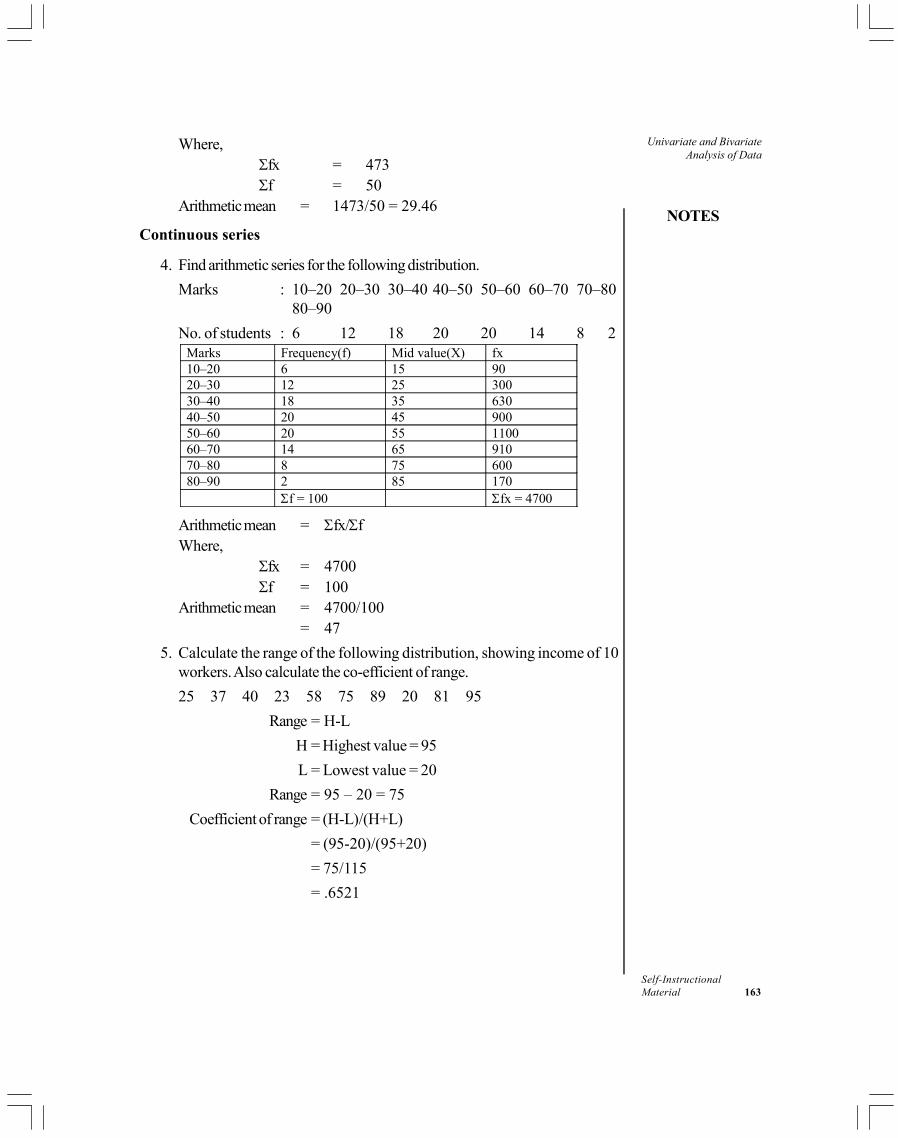
NOTES
Self-InstructionalMaterial 163
Univariate and BivariateAnalysis of Data
Where,fx = 473f = 50
Arithmetic mean = 1473/50 = 29.46
Continuous series
4. Find arithmetic series for the following distribution.
Marks : 10–20 20–30 30–40 40–50 50–60 60–70 70–8080–90
No. of students : 6 12 18 20 20 14 8 2Marks Frequency(f) Mid value(X) fx 10–20 6 15 90 20–30 12 25 300 30–40 18 35 630 40–50 20 45 900 50–60 20 55 1100 60–70 14 65 910 70–80 8 75 600 80–90 2 85 170 f = 100 fx = 4700
Arithmetic mean = fx/fWhere,
fx = 4700f = 100
Arithmetic mean = 4700/100= 47
5. Calculate the range of the following distribution, showing income of 10workers. Also calculate the co-efficient of range.
25 37 40 23 58 75 89 20 81 95
Range = H-L
H = Highest value = 95
L = Lowest value = 20
Range = 95 – 20 = 75
Coefficient of range = (H-L)/(H+L)
= (95-20)/(95+20)
= 75/115
= .6521

Univariate and BivariateAnalysis of Data
NOTES
Self-Instructional164 Material
6. Find the quartile deviation and its co-efficient.
20 58 40 12 30 15 50
First of all arrange the data in ascending order.
12 15 20 28 30 40 50
Q1 = Size of (N+1)/4th item
= Size of (7+1)/4th item
= Size of (8/4)th item
= 2nd item
= 15
Q3 = Size of 3 × (N+1)4th item
= Size of 3 × (7+1)/4th item
= Size of 3 × 8/4th item
= (3×2)nd item
= 6th item
= 40
Co-efficient Deviation = (Q3 – Q1)/(Q3 + 1)
= (40 – 15)/(40 + 15)
= 25/55
= .4545
9.4 DESCRIPTIVE ANALYSIS OF BIVARIATE DATA
As already mentioned, bivariate analysis examines the relationship between twovariables. There are various methods used for carrying out bivariate analysis. Wewill discuss two methods, namely, cross-tabulation and correlation coefficient.
(i) Cross-tabulation
In simple tabulation, the frequency and the percentage for each question wascalculated. In cross-tabulation, responses to two questions are combined anddata is tabulated together. A cross-tabulation counts the number of observationsin each cross-category of two variables. The descriptive result of a cross-tabulation is a frequency count for each cell in the analysis. For example, incross-tabulating a two-category measure of income (low- and high-incomehouseholds) with a two-category measure of purchase intention of a product(low and high purchase intentions) the basic result is a cross-classification asshown in Table 9.8.

NOTES
Self-InstructionalMaterial 165
Univariate and BivariateAnalysis of Data
Table 9.8 Cross-table of Purchase Intention and Income
Income
Low Income High Income
Purchase Intention
Low purchase intention 120 60
High purchase intention 80 190
200 250
The results of cross-tabulation show the number of sample respondents
with low income having low purchase intention, low income with high purchaseintention, high income with low purchase intention and high income with highpurchase intention.
As is the case with simple tabulations, the results of a cross-tabulation aremore meaningful if cell frequencies are computed as percentages. The percentagescan be computed in three-ways. As is the case of Table 9.8, the percentages canbe computed (i) row-wise so that the percentages in each row add up to 100 percent; (2) column-wise so that the percentages in each column add up to 100 percent or (3) cell percentages, such that percentages added across all cells equal100 per cent. The interpretation of percentages is different in each of the threecases. Therefore, the question arises which of these percentages is most useful tothe researcher. What is the general rule for computing percentages?
The basis for calculating category percentage depends upon the nature ofrelationship between the variables. One of the variables could be viewed asdependent variable and the other one as independent variable. In the cross-tabulation presented in Table 9.8, the purchase intention could be treated asdependent variable, which depends upon income (independent variable). The ruleis to cast percentages in the direction of independent (causal) variable across thedependent variable. For Table 9.8, there are 200 respondents with low income,out of which 120 have low purchase intention for the product. In terms ofpercentages, 60 per cent of the respondents with low income have low purchaseintention for the product. Now there are 250 people with high income, out ofwhich 60 have low purchase intention and 190 have high purchase intention forthe product. By calculating percentages column wise, it is seen that 24 per centhave low purchase intention whereas 76 per cent have high purchase intention forthe product. The results indicate that with increase in income, the purchase intentionfor the product increases.
Table 9.9 presents the percentages column-wise as given below:
Table 9.9 Cross-table of Purchase Intention and Income(Column-wise Percentages)
Income
Low Income High Income
Purchase Intention
Low purchase intention 60% 24%
High purchase intention 40% 76%
100% 100%
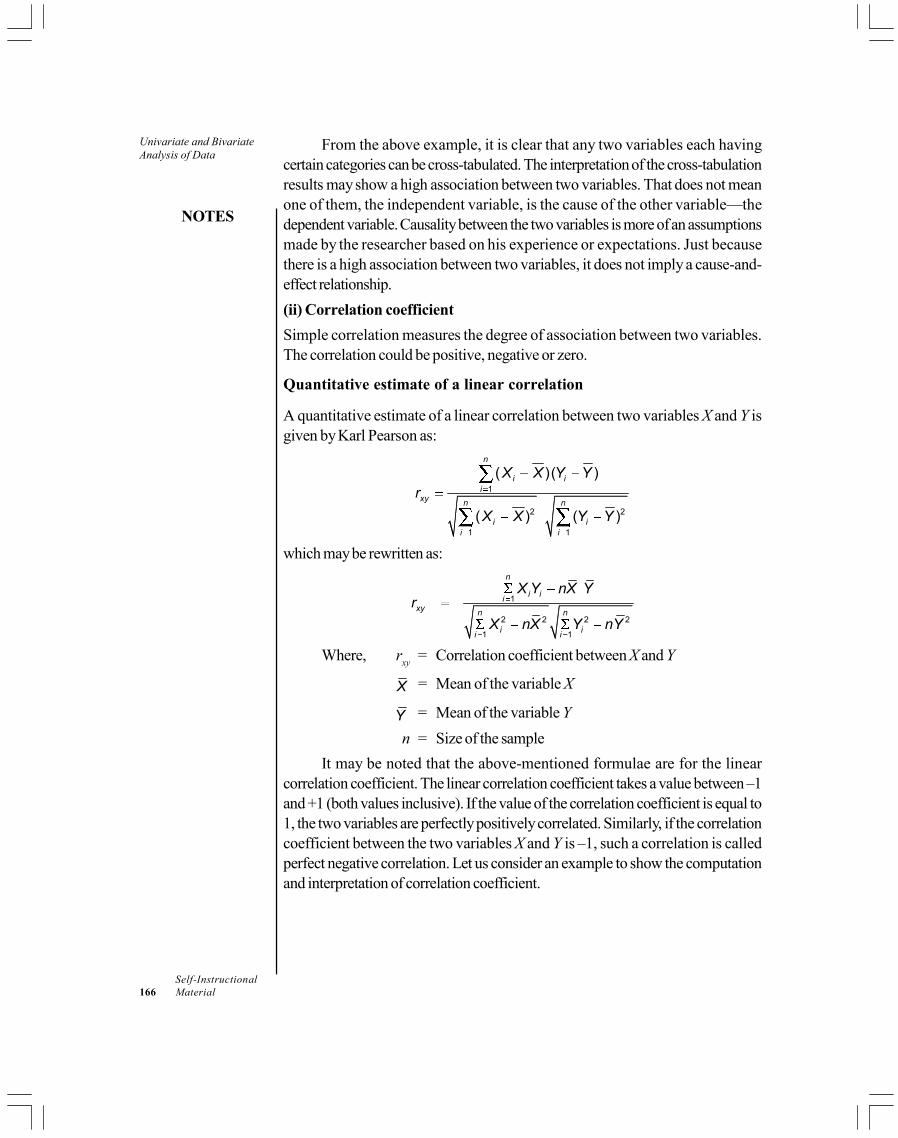
Univariate and BivariateAnalysis of Data
NOTES
Self-Instructional166 Material
From the above example, it is clear that any two variables each havingcertain categories can be cross-tabulated. The interpretation of the cross-tabulationresults may show a high association between two variables. That does not meanone of them, the independent variable, is the cause of the other variable—thedependent variable. Causality between the two variables is more of an assumptionsmade by the researcher based on his experience or expectations. Just becausethere is a high association between two variables, it does not imply a cause-and-effect relationship.
(ii) Correlation coefficient
Simple correlation measures the degree of association between two variables.The correlation could be positive, negative or zero.
Quantitative estimate of a linear correlation
A quantitative estimate of a linear correlation between two variables X and Y isgiven by Karl Pearson as:
1
2 2
1 1
( )( )
( ) ( )
n
i ii
xy n n
i ii i
X X Y Yr
X X Y Y
which may be rewritten as:
1
2 2 2 2
1 1
n
i ii
xy n n
i ii i
X Y nX Yr
X nX Y nY
Where, rxy
= Correlation coefficient between X and Y
X = Mean of the variable X
Y = Mean of the variable Y
n = Size of the sample
It may be noted that the above-mentioned formulae are for the linearcorrelation coefficient. The linear correlation coefficient takes a value between –1and +1 (both values inclusive). If the value of the correlation coefficient is equal to1, the two variables are perfectly positively correlated. Similarly, if the correlationcoefficient between the two variables X and Y is –1, such a correlation is calledperfect negative correlation. Let us consider an example to show the computationand interpretation of correlation coefficient.

NOTES
Self-InstructionalMaterial 167
Univariate and BivariateAnalysis of Data
Example 9.12: Consider the data on the quantity demanded and the price of acommodity over a ten-year period as given in the following table:
Year Demand Price
1996 100 5
1997 75 7
1998 80 6
1999 70 6
2000 50 8
2001 65 7
2002 90 5
2003 100 4
2004 110 3
2005 60 9
Estimate the correlation coefficient between the quantity demanded andprice and interpret the same.
Solution:
This problem will be attempted first by showing all the detailed computations usingthe following formula.
1
2 2 2 2
1 1
n
i ii
xy n n
i ii i
X Y nX Yr
X nX Y nY
The required computations are shown in the following table:
Year Demand (Y) Price (X) XY X2 Y2
1996 100 5 500 25 10000
1997 75 7 525 49 5625
1998 80 6 480 36 6400
1999 70 6 420 36 4900
2000 50 8 400 64 2500
2001 65 7 455 49 4225
2002 90 5 450 25 8100
2003 100 4 400 16 10000
2004 110 3 330 9 12100
2005 60 9 540 81 3600
TOTAL 800 60 4500 390 67450
XY = 4500 X2 = 390
Y2 = 67,450 Y = 800
X = 60 n = 10
80080
10
YY
n
606
10
XX
n
Univariate and BivariateAnalysis of Data
NOTES
Self-Instructional168 Material
Substituting these values in the formula for the correlation coefficient, weget:
4500 10 6 80
390 10 6 6 67450 64000
4500 4800
390 360 67450 64000
300 300
5.477 58.73730 3450
xyr
3000.9325
321.701
The value of the correlation coefficient between the quantity demanded andprice is –0.9325, which is negative and very high. This shows that the quantitydemanded and price move in the opposite directions.
Exercises
1. You are presented with the following table of frequency counts to show thenature of relationship between age and watching of movies in a cinema hall.What conclusion can be drawn?
2. The following bivariate table was prepared to understand the relationshipbetween preference for continental food and monthly income of therespondents. What conclusion can be drawn?
3. The table below presents the ranks which were assigned by three judges tothe works of ten artists:

NOTES
Self-InstructionalMaterial 169
Univariate and BivariateAnalysis of Data
Compute the correlation coefficient for each pair of ranking and decide:
(a) Which two judges are most alike in their opinions about these artists?
(b) Which two judges are different in their opinions about their artists?
Check Your Progress
3. Which type of data can be computed through median?
4. State the positively skewed distribution.
5. Mention the limitation of range as a measure of dispersion.
6. What is the descriptive result of a cross-tabulation?
9.5 ANSWERS TO CHECK YOUR PROGRESSQUESTIONS
1. Some of the common ways of summarizing data are by calculating average,range, standard deviation, frequency, and percentage distribution.
2. Inferential analysis is based on probability theory and a necessary conditionfor carrying out inferential analysis is that the sample should be drawn atrandom.
3. The median can be computed for ratio, interval or ordinal scale data.
4. The positively skewed distribution is mean > median > mode.
5. The limitation of range as a measure of dispersion is that it considers onlythe extreme value and ignores all other data points.
6. The descriptive result of a cross-tabulation is a frequency count for eachcell in the analysis.
9.6 SUMMARY
Data analysis could be univariate, bivariate and multivariate. Further, it couldbe descriptive or inferential.
The type of analysis depends upon the level of measurement i.e. nominal,ordinal, interval and ratio.
The bivariate analysis of data is illustrated through cross-table and correlationcoefficient.

Univariate and BivariateAnalysis of Data
NOTES
Self-Instructional170 Material
9.7 KEY WORDS
Bivariate analysis: The data analysis that deals with analysis of twovariables at a time.
Inferential analysis: The data analysis that attempts to generalize the resultsof sample.
Median: The value in the distribution such that 50 per cent of observationsin the distribution are below it and 50 per cent are above it.
Mode: The point of maximum frequency in a distribution.
Univariate analysis: The data analysis that deals with the analysis of onevariable at a time.
9.8 SELF ASSESSMENT QUESTIONS ANDEXERCISES
Short-Answer Questions
1. Differentiate between descriptive and inferential analysis of data.
2. Briefly explain analysis of nominal scale data with multiple categoryresponses.
Long-Answer Questions
1. Explain with the help of examples various measures of central tendency.
2. Discuss various measures of dispersions. List out their merits and demerits.
3. How does one go about preparing cross-table between two variables eachhaving two categories? In what ways should percentages be calculated tointerpret the results of a cross-tabulation?
4. You are presented with the following table of frequency counts to show thenature of relationship between age and watching of movies in a cinema hall.What conclusion can be drawn?
Frequency of watching movies
Age
Under 35 35 & above
4 or more times in a month 200 80
Less than 4 times in a month 130 190
Total 330 270
5. Compute the correlation coefficient between sales and advertising
expenditure of a company from given data. Also interpret the results.
S. No. 1 2 3 4 5
Sales (` crore) 236 300 453 500 720
Advt. Exp. (` crore) 10 11 13 14 17
NOTES
Self-InstructionalMaterial 171
Univariate and BivariateAnalysis of Data9.9 FURTHER READINGS
Chawla D and Sondhi N. 2016. Research Methodology: Concepts and Cases,2nd edition. New Delhi: Vikas Publishing House.
Cooper, D R. 2006. Business Research Methods. New Delhi: Tata McGraw HillPublishing Company Ltd.
Kinnear, T C and Taylor, J R. 1996. Marketing Research: An Applied Approach,5th edn. New York: McGraw Hill, Inc.
Nargundkar, R. 2002. Marketing Research (Text and Cases). New Delhi: TataMcGraw Hill Publishing Company Ltd.

Testing of Hypotheses
NOTES
Self-Instructional172 Material
UNIT 10 TESTING OF HYPOTHESES
Structure
10.0 Introduction10.1 Objectives10.2 Concepts in Testing of Hypothesis
10.2.1 Steps in Testing of Hypothesis Exercise10.2.2 Test Statistic for Testing Hypothesis about Population Mean
10.3 Tests Concerning Means-the Case of Single Population10.4 Tests for Difference between two Population Means10.5 Tests Concerning Population Proportion- the Case of Single Population10.6 Tests for Difference between two Population Proportions10.7 Answers to Check Your Progress Questions10.8 Summary10.9 Key Words
10.10 Self Assessment Questions and Exercises10.11 Further Readings
10.0 INTRODUCTION
A hypothesis is an assumption or a statement that may or may not be true. Thehypothesis is tested on the basis of information obtained from a sample. Instead ofasking, for example, what the mean assessed value of an apartment in a multistoriedbuilding is, one may be interested in knowing whether or not the assessed valueequals some particular value, say 80 lakh. Some other examples could be whethera new drug is more effective than the existing drug based on the sample data, andwhether the proportion of smokers in a class is different from 0.30. The formulationof hypothesis has already been discussed in Unit 2. We will now study the conceptsand steps in the testing of hypothesis exercise.
10.1 OBJECTIVES
After going through this unit, you will be able to:
Discuss the concepts used in the testing of hypothesis exercise
Explain the steps used in testing of hypothesis exercise
Explain the test of the significance of the mean of a single population usingboth t and Z test
Explain the test of the significance of difference between two populationmeans using t and Z tests

NOTES
Self-InstructionalMaterial 173
Testing of Hypotheses Discuss the test of the significance of a single population proportion
Explain the test of the significance of the difference between two populationproportions using a Z test
10.2 CONCEPTS IN TESTING OF HYPOTHESIS
Below are discussed some concepts on testing of hypotheses to be used in thisunit.
Null hypothesis: The hypotheses that are proposed with the intent ofreceiving a rejection for them are called null hypotheses. This requires thatwe hypothesize the opposite of what is desired to be proved. For example,if we want to show that sales and advertisement expenditure are related,we formulate the null hypothesis that they are not related. If we want toprove that the average wages of skilled workers in town 1 is greater thanthat of town 2, we formulate the null hypotheses that there is no differencein the average wages of the skilled workers in both the towns. A nullhypothesis is denoted by H
0.
Alternative hypotheses: Rejection of null hypotheses leads to theacceptance of alternative hypotheses. The rejection of null hypothesisindicates that the relationship between variables (e.g., sales and advertisementexpenditure) or the difference between means (e.g., wages of skilled workersin town 1 and town 2) or the difference between proportions have statisticalsignificance and the acceptance of the null hypotheses indicates that thesedifferences are due to chance. The alternative hypotheses are denoted byH
1.
One-tailed and two-tailed tests: A test is called one-sided (or one-tailed)only if the null hypothesis gets rejected when a value of the test statistic fallsin one specified tail of the distribution. Further, the test is called two-sided(or two-tailed) if null hypothesis gets rejected when a value of the test statisticfalls in either one or the other of the two tails of its sampling distribution. Forexample, consider a soft drink bottling plant which dispenses soft drinks inbottles of 300 ml capacity. The bottling is done through an automatic plant.An overfilling of bottle (liquid content more than 300 ml) means a huge lossto the company given the large volume of sales. An underfilling means thecustomers are getting less than 300 ml of the drink when they are paying for300 ml. This could bring bad reputation to the company. The companywants to avoid both overfilling and underfilling. Therefore, it would preferto test the hypothesis whether the mean content of the bottles is differentfrom 300 ml. This hypothesis could be written as:
H0
: µ = 300 ml.
H1
: µ 300 ml.

Testing of Hypotheses
NOTES
Self-Instructional174 Material
The hypotheses stated above are called two-tailed or two-sided hypotheses.
However, if the concern is the overfilling of bottles, it could be stated as:
H0
: µ = 300 ml.
H1
: µ > 300 ml.
Such hypotheses are called one-tailed or one-sided hypotheses and the researcherwould be interested in the upper tail (right hand tail) of the distribution. If however,the concern is loss of reputation of the company (underfilling of the bottles), thehypothesis may be stated as:
H0
: µ = 300 ml.
H1
: µ < 300 ml.
The hypothesis stated above is also called one-tailed test and the researcherwould be interested in the lower tail (left hand tail) of the distribution.
Type I and type II error: The acceptance or rejection of a hypothesis isbased upon sample results and there is always a possibility of sample not beingrepresentative of the population. This could result in errors, as a consequence ofwhich inferences drawn could be wrong. The situation could be depicted as givenin Figure 10.1.
Accept H0 Reject H0
H0
True
H0
False
Correctdecision
Type II Error
Type I Error
Correct decision
Fig. 10.1 Type I and Type II Errors
If null hypothesis H0 is true and is accepted or H
0 when false is rejected, the
decision is correct in either case. However, if the hypothesis H0 is rejected when it
is actually true, the researcher is committing what is called a Type I error. Theprobability of committing a Type I error is denoted by alpha (). This is termed asthe level of significance. Similarly, if the null hypothesis H
0 when false is accepted,
the researcher is committing an error called Type II error. The probability ofcommitting a Type II error is denoted by beta (). The expression 1 – is calledpower of test. To decrease the risk of committing both types of errors, you mayincrease the sample size.
10.2.1 Steps in Testing of Hypothesis Exercise
The following steps are followed in the testing of a hypothesis:
Setting up of a hypothesis: The first step is to establish the hypothesis tobe tested. As it is known, these statistical hypotheses are generally assumptionsabout the value of the population parameter; the hypothesis specifies a single valueor a range of values for two different hypotheses rather than constructing a single

NOTES
Self-InstructionalMaterial 175
Testing of Hypotheseshypothesis. These two hypotheses are generally referred to as (1) the nullhypotheses denoted by H
0 and (2) alternative hypothesis denoted by H
1.
The null hypothesis is the hypothesis of the population parameter taking aspecified value. In case of two populations, the null hypothesis is of no differenceor the difference taking a specified value. The hypothesis that is different from thenull hypothesis is the alternative hypothesis. If the null hypothesis H
0 is rejected
based upon the sample information, the alternative hypothesis H1 is accepted.
Therefore, the two hypotheses are constructed in such a way that if one is true, theother one is false and vice versa.
Setting up of a suitable significance level: The next step is to choose asuitable level of significance. The level of significance denoted by is chosenbefore drawing any sample. The level of significance denotes the probability ofrejecting the null hypothesis when it is true. The value of varies from problem toproblem, but usually it is taken as either 5 per cent or 1 per cent. A 5 per cent levelof significance means that there are 5 chances out of hundred that a null hypothesiswill get rejected when it should be accepted. When the null hypothesis is rejectedat any level of significance, the test result is said to be significant. Further, if ahypothesis is rejected at 1 per cent level, it must also be rejected at 5 per centsignificance level.
Determination of a test statistic: The next step is to determine a suitabletest statistic and its distribution. As would be seen later, the test statistic could be t,Z, 2 or F, depending upon various assumptions to be discussed later in the book.
Determination of critical region: Before a sample is drawn from thepopulation, it is very important to specify the values of test statistic that will lead torejection or acceptance of the null hypothesis. The one that leads to the rejectionof null hypothesis is called the critical region. Given a level of significance, , theoptimal critical region for a two-tailed test consists of that/2 per cent area in the right hand tail of the distribution plus that /2 per cent inthe left hand tail of the distribution where that null hypothesis is rejected.
Computing the value of test-statistic: The next step is to compute thevalue of the test statistic based upon a random sample of size n. Once the value oftest statistic is computed, one needs to examine whether the sample results fall inthe critical region or in the acceptance region.
Making decision: The hypothesis may be rejected or accepted dependingupon whether the value of the test statistic falls in the rejection or the acceptanceregion. Management decisions are based upon the statistical decision of eitherrejecting or accepting the null hypothesis.
In case a hypothesis is rejected, the difference between the sample statisticand the hypothesized population parameter is considered to be significant. On theother hand, if the hypothesis is accepted, the difference between the sample statisticand the hypothesized population parameter is not regarded as significant and canbe attributed to chance.
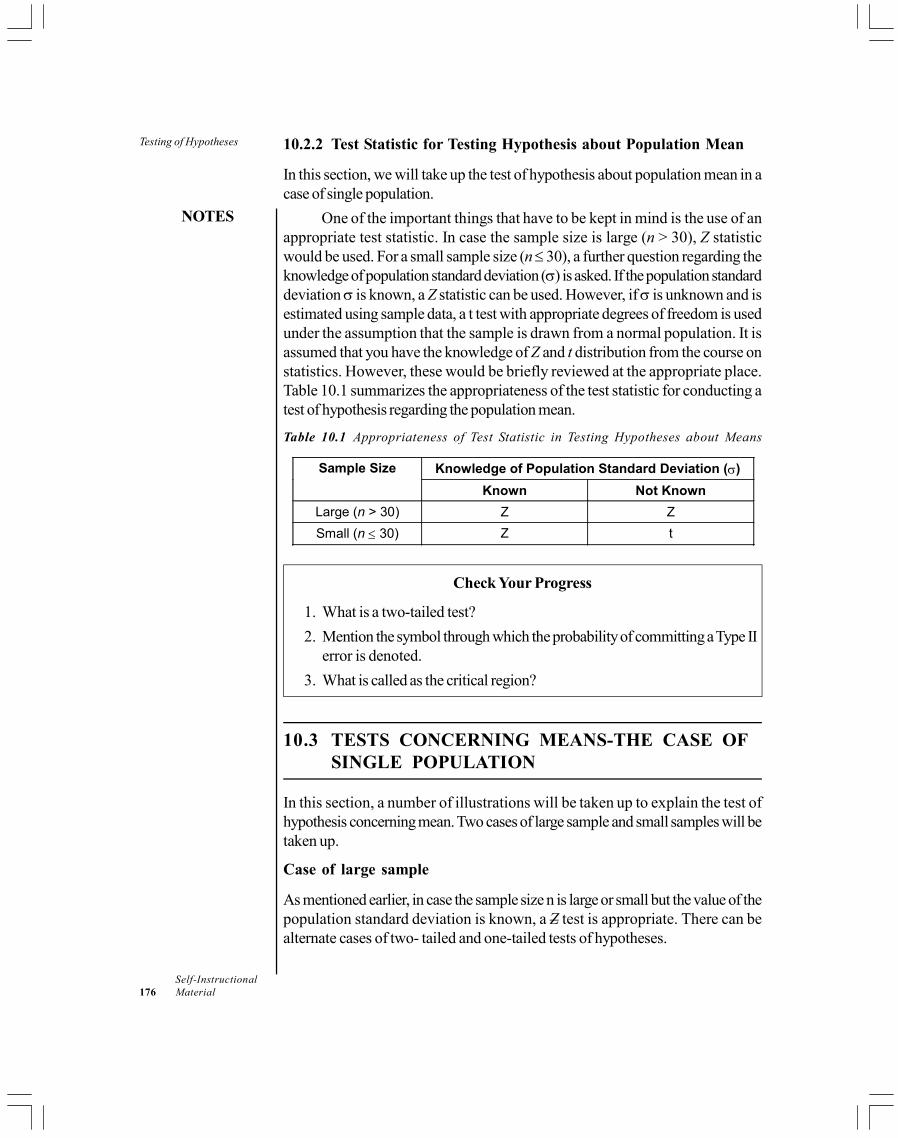
Testing of Hypotheses
NOTES
Self-Instructional176 Material
10.2.2 Test Statistic for Testing Hypothesis about Population Mean
In this section, we will take up the test of hypothesis about population mean in acase of single population.
One of the important things that have to be kept in mind is the use of anappropriate test statistic. In case the sample size is large (n > 30), Z statisticwould be used. For a small sample size (n 30), a further question regarding theknowledge of population standard deviation () is asked. If the population standarddeviation is known, a Z statistic can be used. However, if is unknown and isestimated using sample data, a t test with appropriate degrees of freedom is usedunder the assumption that the sample is drawn from a normal population. It isassumed that you have the knowledge of Z and t distribution from the course onstatistics. However, these would be briefly reviewed at the appropriate place.Table 10.1 summarizes the appropriateness of the test statistic for conducting atest of hypothesis regarding the population mean.
Table 10.1 Appropriateness of Test Statistic in Testing Hypotheses about Means
Knowledge of Population Standard Deviation () Sample Size
Known Not Known
Large (n > 30) Z Z
Small (n 30) Z t
Check Your Progress
1. What is a two-tailed test?
2. Mention the symbol through which the probability of committing a Type IIerror is denoted.
3. What is called as the critical region?
10.3 TESTS CONCERNING MEANS-THE CASE OFSINGLE POPULATION
In this section, a number of illustrations will be taken up to explain the test ofhypothesis concerning mean. Two cases of large sample and small samples will betaken up.
Case of large sample
As mentioned earlier, in case the sample size n is large or small but the value of thepopulation standard deviation is known, a Z test is appropriate. There can bealternate cases of two- tailed and one-tailed tests of hypotheses.

NOTES
Self-InstructionalMaterial 177
Testing of HypothesesCorresponding to the null hypothesis H0 : µ = µ
0, the following criteria could
be used as shown in Table 10.2.
The test statistic is given by,
0HXZ
n
Where,
X = Sample mean
= Population standard deviation
µH0
= The value of µ under the assumption that the null hypothesis is true.
n = Size of sample.
Table 10.2 Criteria for Accepting or Rejecting Null Hypothesis underDifferent Cases of Alternative Hypotheses
S. No.
Alternative Hypothesis
Reject the Null Hypothesis if
Accept the Null Hypothesis if
1. µ < µ 0 Z < – Zα Z – Zα
2. µ > µ 0 Z > Zα Z Zα
3. µ µ 0 Z < – Zα/2 or
Z > Zα/2
– Zα/2 Z Zα/2
If the population standard deviation is unknown, the sample standard
deviation21
1s X X
n
is used as an estimate of . It may be noted that Z and Z/2 are Z values such that
the area to the right under the standard normal distribution is and /2 respectively.Below are solved examples using the above concepts.
Example 10.1: A sample of 200 bulbs made by a company give a lifetime meanof 1540 hours with a standard deviation of 42 hours. Is it likely that the sample hasbeen drawn from a population with a mean lifetime of 1500 hours? You may use 5per cent level of significance.
Solution:
In the above example, the sample size is large (n = 200), sample mean ( X ) equals1540 hours and the sample standard deviation (s) is equal to 42 hours. The nulland alternative hypotheses can be written as:
H0
: µ = 1500 hrs
H1
: µ 1500 hrs

Testing of Hypotheses
NOTES
Self-Instructional178 Material
It is a two-tailed test with level of significance () to be equal to 0.05. Sincen is large (n > 30), though population standard deviation is unknown, one canuse Z test. The test statistics are given by:
0HXZ
X
Where, µH0
= Value of µ under the assumption that the null hypothesis is trueX
= Estimated standard error of mean
Here 0
ˆ 421,500, 2.97
200H
s
X n n
(Note that ̂ is estimated value of .)
0 1,540 1,500 4013.47
2.97 2.97HX
Zs
n
The value of = 0.05 and since it is a two-tailed test, the critical value Z isgiven by – Z/2
and Z/2 which could be obtained from the standard normal Table
7.1 given in Unit 7.
Rejection regions for Example 10.1
Since the computed value of Z = 13.47 lies in the rejection region, the null hypothesisis rejected. Therefore, it can be concluded that the average life of the bulb issignificantly different from 1,500 hours.
Example 10.2: On a typing test, a random sample of 36 graduates of a secretarialschool averaged 73.6 words with a standard deviation of 8.10 words per minute.Test an employer’s claim that the school’s graduates average less than 75.0 wordsper minute using the 5 per cent level of significance.
Solution:
H0
: µ = 75
H1
: µ < 75
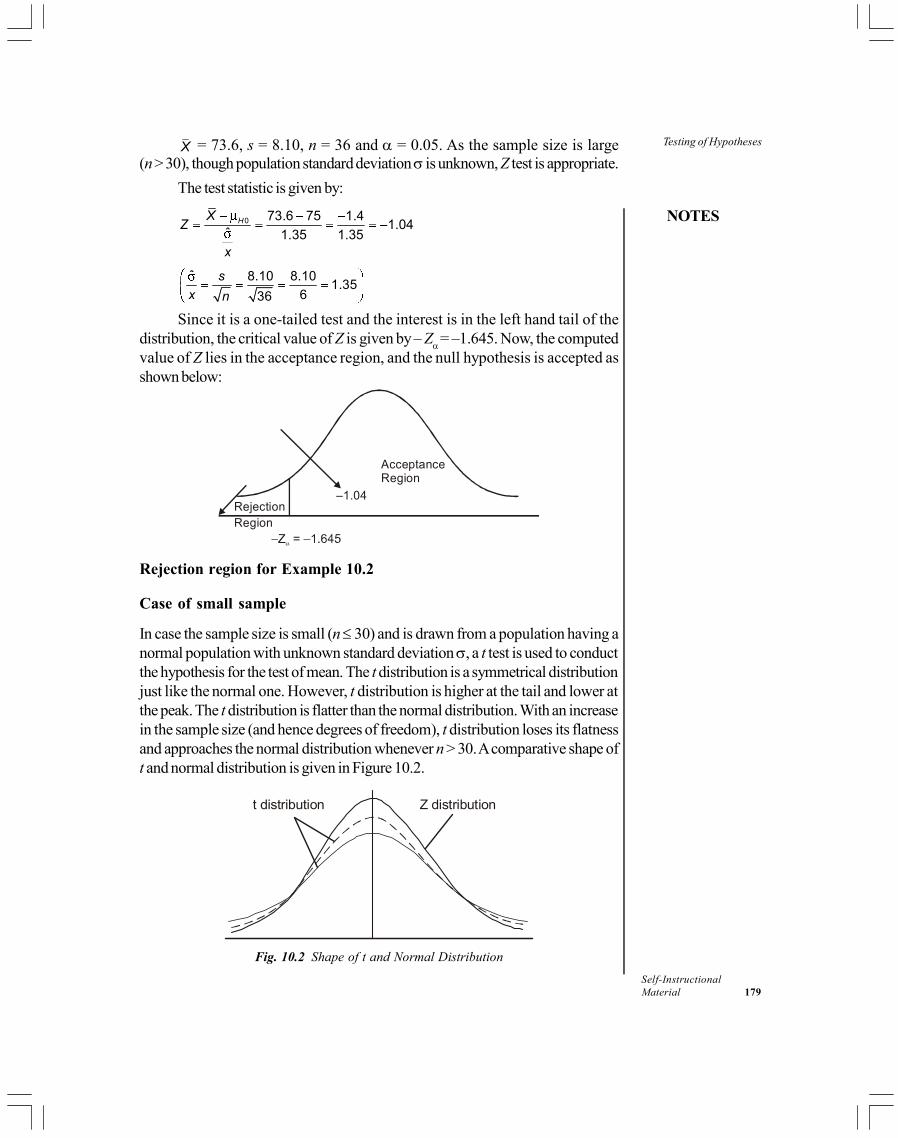
NOTES
Self-InstructionalMaterial 179
Testing of HypothesesX = 73.6, s = 8.10, n = 36 and = 0.05. As the sample size is large(n > 30), though population standard deviation is unknown, Z test is appropriate.
The test statistic is given by:
0 73.6 75 1.41.04
ˆ 1.35 1.35HX
Z
x
ˆ 8.10 8.101.35
636
s
x n
Since it is a one-tailed test and the interest is in the left hand tail of thedistribution, the critical value of Z is given by – Z
= –1.645. Now, the computedvalue of Z lies in the acceptance region, and the null hypothesis is accepted asshown below:
RejectionRegion
–1.04
Acceptance Region
Rejection region for Example 10.2
Case of small sample
In case the sample size is small (n 30) and is drawn from a population having anormal population with unknown standard deviation , a t test is used to conductthe hypothesis for the test of mean. The t distribution is a symmetrical distributionjust like the normal one. However, t distribution is higher at the tail and lower atthe peak. The t distribution is flatter than the normal distribution. With an increasein the sample size (and hence degrees of freedom), t distribution loses its flatnessand approaches the normal distribution whenever n > 30. A comparative shape oft and normal distribution is given in Figure 10.2.
t distribution Z distribution
Fig. 10.2 Shape of t and Normal Distribution
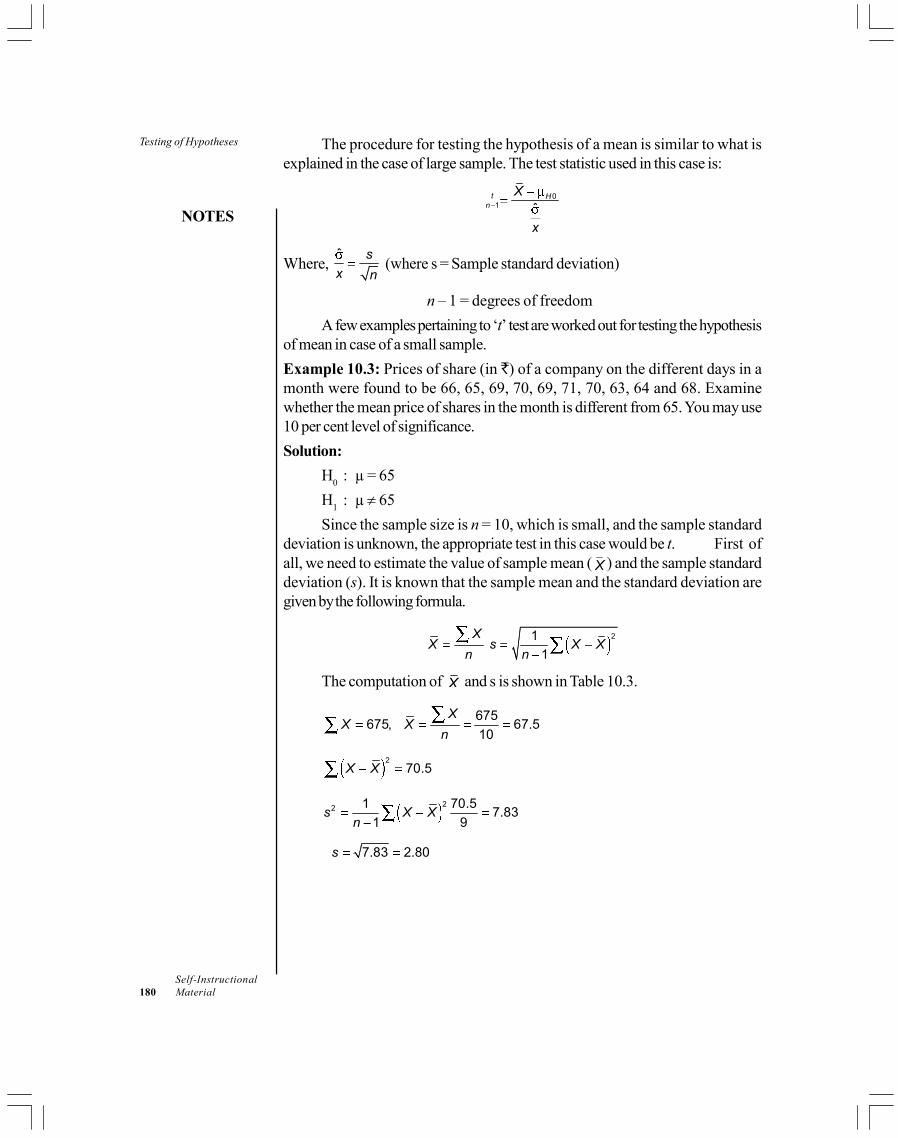
Testing of Hypotheses
NOTES
Self-Instructional180 Material
The procedure for testing the hypothesis of a mean is similar to what isexplained in the case of large sample. The test statistic used in this case is:
01 ˆ
t Hn
X
x
Where, ˆ s
x n (where s = Sample standard deviation)
n – 1 = degrees of freedom
A few examples pertaining to ‘t’ test are worked out for testing the hypothesisof mean in case of a small sample.
Example 10.3: Prices of share (in ) of a company on the different days in amonth were found to be 66, 65, 69, 70, 69, 71, 70, 63, 64 and 68. Examinewhether the mean price of shares in the month is different from 65. You may use10 per cent level of significance.
Solution:
H0
: µ = 65
H1
: µ 65
Since the sample size is n = 10, which is small, and the sample standarddeviation is unknown, the appropriate test in this case would be t. First ofall, we need to estimate the value of sample mean ( X ) and the sample standarddeviation (s). It is known that the sample mean and the standard deviation aregiven by the following formula.
21
1
XX s X X
n n
The computation of X and s is shown in Table 10.3.
675675, 67.5
10
XX X
n
270.5X X
22 1 70.57.83
1 9s X X
n
7.83 2.80s

NOTES
Self-InstructionalMaterial 181
Testing of HypothesesTable 10.3 Computation of Sample Mean and Standard Deviation
S. No. X X – X (X – X )2
1 66 – 1.5 2.25
2 65 – 2.5 6.25
3 69 1.5 2.25
4 70 2.5 6.25
5 69 1.5 2.25
6 71 3.5 12.25
7 70 2.5 6.25
8 63 – 4.5 20.25
9 64 – 3.5 12.25
10 68 0.5 0.25
Total 675 0 70.5
The test statistic is given by:
0 01
67.5 65 2.5 10ˆ 2.8 2.8
10
H Hn
X Xt
s
x n
= 2.5 × 3.16/2.8 = 7.91/2.8 = 2.82
The critical values of t with 9 degrees of freedom for a two-tailed testare given by –1.833 and 1.833. Since the computed value of t lies in the rejectionregion (see figure below), the null hypotheses is rejected.
–
Rejection regions for Example 10.3
Therefore, the average price of the share of the company is differentfrom 65.

Testing of Hypotheses
NOTES
Self-Instructional182 Material
Example 10.4: Past records indicate that a golfer has averaged 82 on a certaincourse. With a new set of clubs, he averages 7 over five rounds with a standarddeviation of 2.65. Can we conclude that at 0.025 level of significance, the newclub has an adverse effect on the performance?
Solution:
H0
: µ = 82
H1
: µ < 82
X = 7.9, n = 5, s = 2.65, = 0.025. As the population standard deviationis unknown and the sample size is small (n < 30), a t test would be appropriate.The test statistic is given by:
0 0
1 ˆ
ˆ
7.9 8.2 0.30.25
1.185 1.185/
2.651.185
5
H Htn
x
x
X X
s n
s
n
The critical value of t at 0.025 level of significance with four degrees offreedom is given by –t = –2.776 (see Table 10.4). As the sample t value of–0.25 lies in the acceptance region, the null hypothesis is accepted (see figurebelow).
Rejection region for Example 10.4
Therefore, there is no adverse effect on the performance due to a change in theclub and the performance can be attributed to chance.
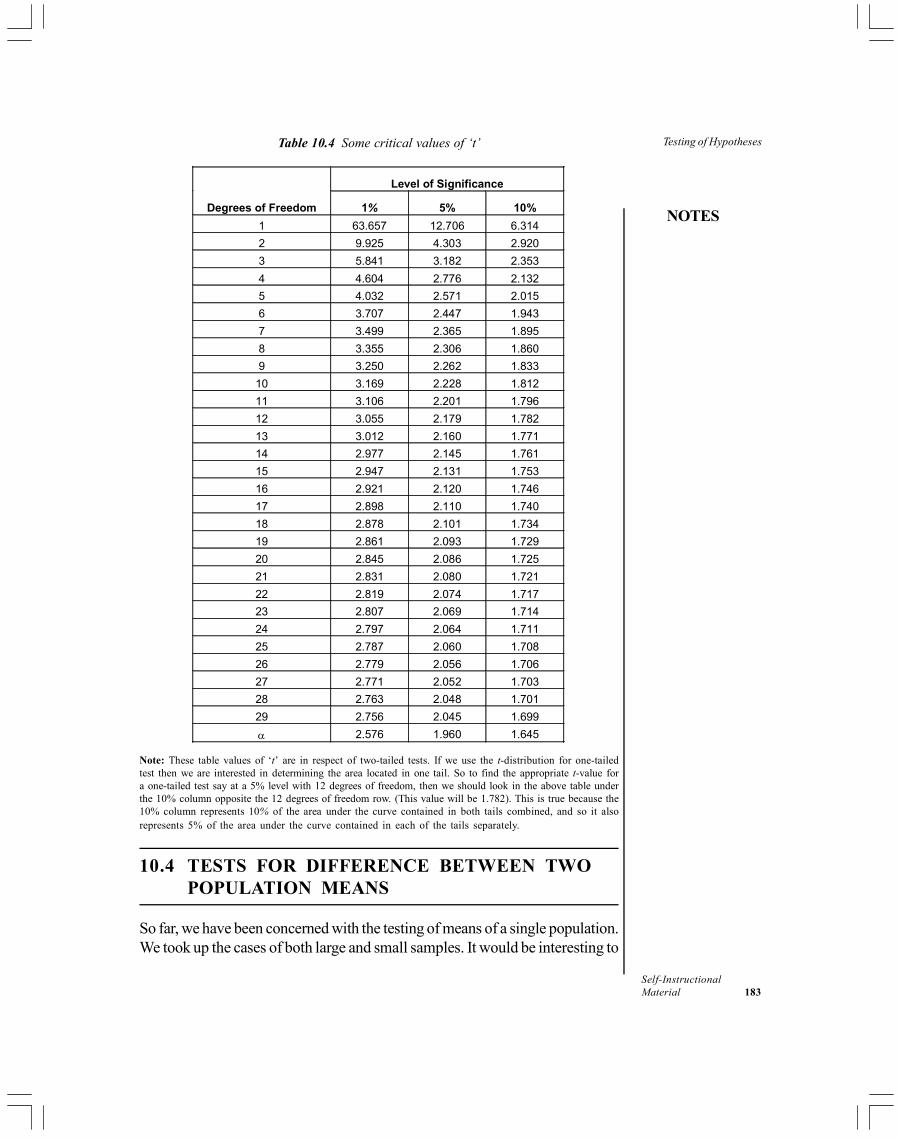
NOTES
Self-InstructionalMaterial 183
Testing of HypothesesTable 10.4 Some critical values of ‘t’
Level of Significance
Degrees of Freedom 1% 5% 10%
1 63.657 12.706 6.314
2 9.925 4.303 2.920
3 5.841 3.182 2.353
4 4.604 2.776 2.132
5 4.032 2.571 2.015
6 3.707 2.447 1.943
7 3.499 2.365 1.895
8 3.355 2.306 1.860
9 3.250 2.262 1.833
10 3.169 2.228 1.812
11 3.106 2.201 1.796
12 3.055 2.179 1.782
13 3.012 2.160 1.771
14 2.977 2.145 1.761
15 2.947 2.131 1.753
16 2.921 2.120 1.746
17 2.898 2.110 1.740
18 2.878 2.101 1.734
19 2.861 2.093 1.729
20 2.845 2.086 1.725
21 2.831 2.080 1.721
22 2.819 2.074 1.717
23 2.807 2.069 1.714
24 2.797 2.064 1.711
25 2.787 2.060 1.708
26 2.779 2.056 1.706
27 2.771 2.052 1.703
28 2.763 2.048 1.701
29 2.756 2.045 1.699
2.576 1.960 1.645
Note: These table values of ‘t’ are in respect of two-tailed tests. If we use the t-distribution for one-tailedtest then we are interested in determining the area located in one tail. So to find the appropriate t-value fora one-tailed test say at a 5% level with 12 degrees of freedom, then we should look in the above table underthe 10% column opposite the 12 degrees of freedom row. (This value will be 1.782). This is true because the10% column represents 10% of the area under the curve contained in both tails combined, and so it alsorepresents 5% of the area under the curve contained in each of the tails separately.
10.4 TESTS FOR DIFFERENCE BETWEEN TWOPOPULATION MEANS
So far, we have been concerned with the testing of means of a single population.We took up the cases of both large and small samples. It would be interesting to
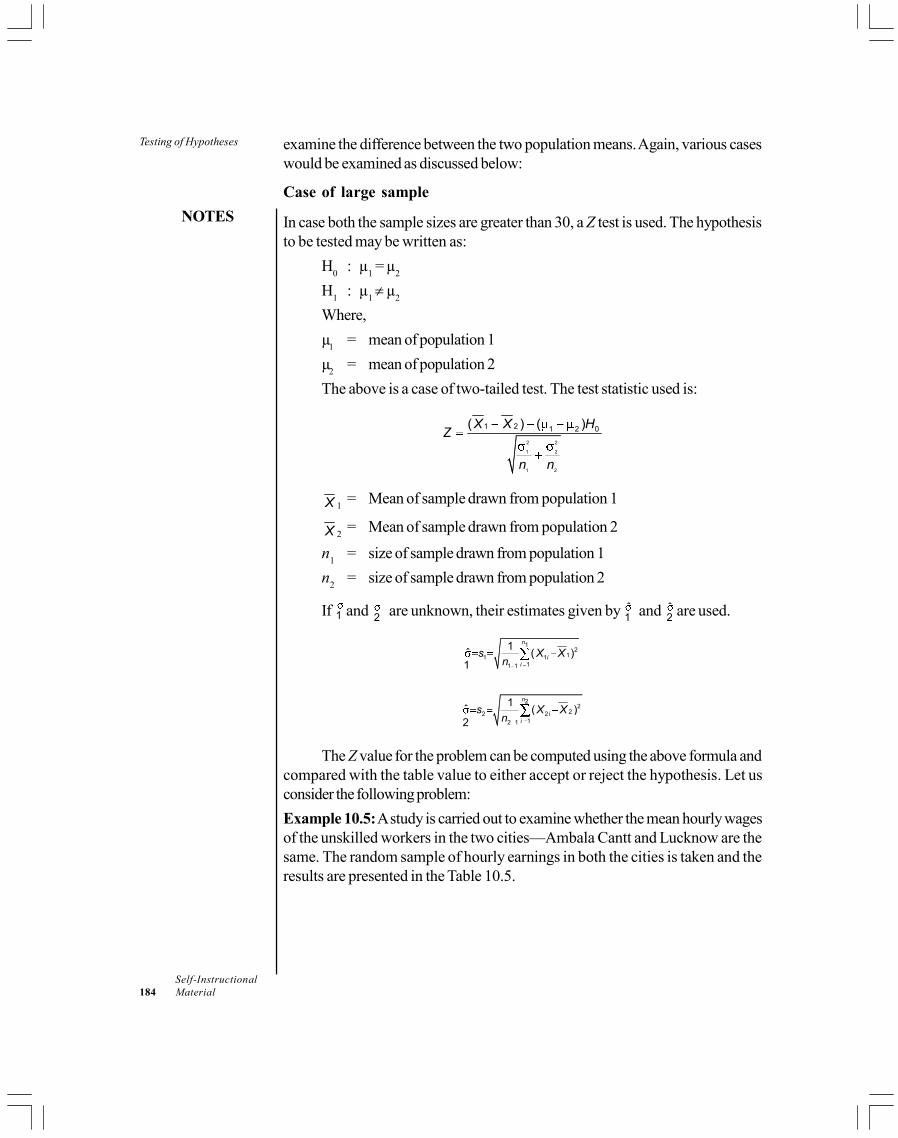
Testing of Hypotheses
NOTES
Self-Instructional184 Material
examine the difference between the two population means. Again, various caseswould be examined as discussed below:
Case of large sample
In case both the sample sizes are greater than 30, a Z test is used. The hypothesisto be tested may be written as:
H0
: µ1 = µ
2
H1
: µ1 µ
2
Where,
µ1
= mean of population 1
µ2
= mean of population 2
The above is a case of two-tailed test. The test statistic used is:
2 2
1 2
1 2
1 2 1 2 0( ) ( )X X HZ
n n
X 1= Mean of sample drawn from population 1
X 2= Mean of sample drawn from population 2
n1
= size of sample drawn from population 1
n2
= size of sample drawn from population 2
If 1 and 2 are unknown, their estimates given by ˆ1 and ˆ
2 are used.
12
11 111 1
1ˆ ( )1
n
ii
s X Xn
22
22 212 1
1ˆ ( )2
n
ii
s X Xn
The Z value for the problem can be computed using the above formula andcompared with the table value to either accept or reject the hypothesis. Let usconsider the following problem:
Example 10.5: A study is carried out to examine whether the mean hourly wagesof the unskilled workers in the two cities—Ambala Cantt and Lucknow are thesame. The random sample of hourly earnings in both the cities is taken and theresults are presented in the Table 10.5.
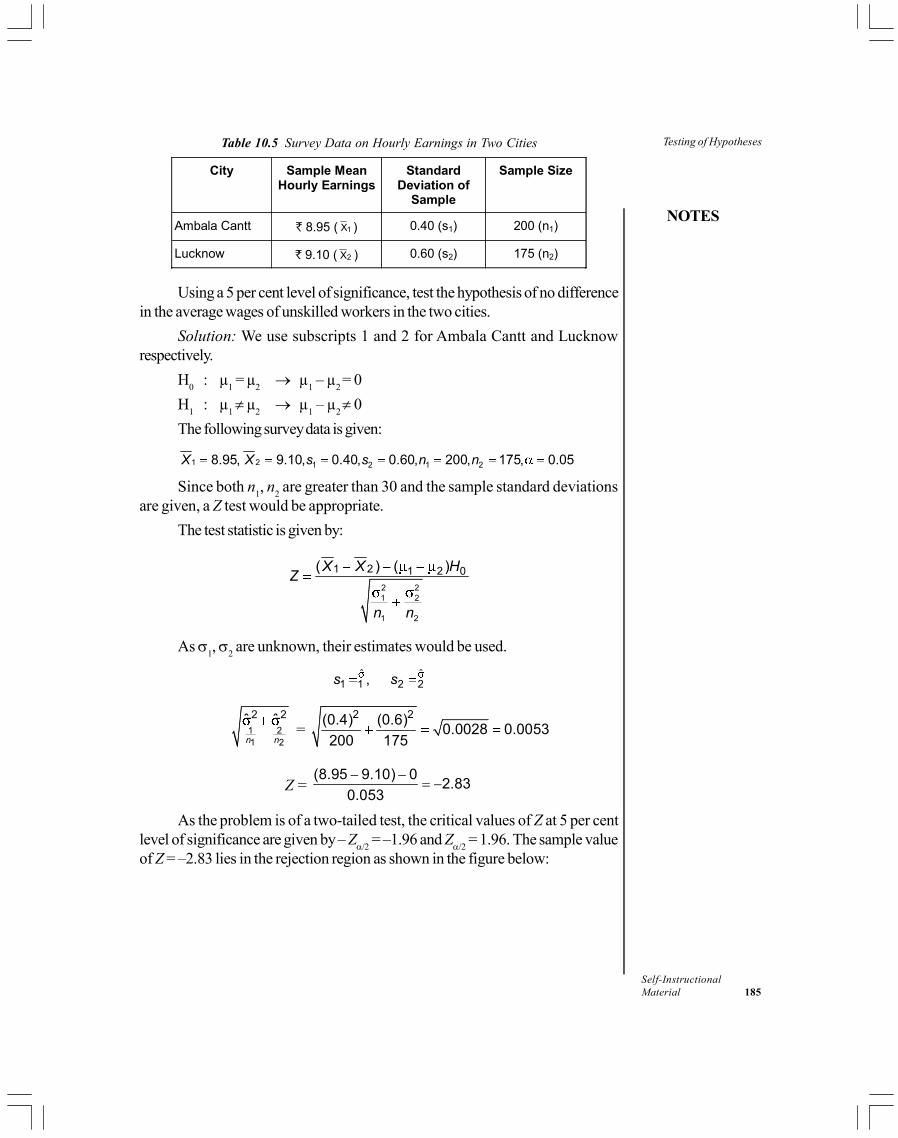
NOTES
Self-InstructionalMaterial 185
Testing of HypothesesTable 10.5 Survey Data on Hourly Earnings in Two Cities
City Sample Mean Hourly Earnings
Standard Deviation of
Sample
Sample Size
Ambala Cantt 8.95 ( 1X ) 0.40 (s1) 200 (n1)
Lucknow 9.10 ( 2X ) 0.60 (s2) 175 (n2)
Using a 5 per cent level of significance, test the hypothesis of no differencein the average wages of unskilled workers in the two cities.
Solution: We use subscripts 1 and 2 for Ambala Cantt and Lucknowrespectively.
H0
: µ1 = µ
2 µ
1 – µ
2 = 0
H1
: µ1 µ
2 µ
1 – µ
2 0
The following survey data is given:
1 2 1 2 1 28.95, 9.10, 0.40, 0.60, 200, 175, 0.05X X s s n n
Since both n1, n
2 are greater than 30 and the sample standard deviations
are given, a Z test would be appropriate.
The test statistic is given by:
2 21 2
1 2
1 2 1 2 0( ) ( )X X HZ
n n
As 1,
2 are unknown, their estimates would be used.
ˆ ˆ1 1 2 2,s s
1 21 2
2 2ˆ ˆn n
= 2 2(0.4) (0.6)
0.0028 0.0053200 175
Z = (8.95 9.10) 0
2.830.053
As the problem is of a two-tailed test, the critical values of Z at 5 per centlevel of significance are given by – Z/2
= –1.96 and Z/2 = 1.96. The sample value
of Z = –2.83 lies in the rejection region as shown in the figure below:

Testing of Hypotheses
NOTES
Self-Instructional186 Material
Rejection regions for Example 10.5
Case of small sample
If the size of both the samples is less than 30 and the population standard deviationis unknown, the procedure described above to discuss the equality of twopopulation means is not applicable in the sense that a t test would be applicableunder the assumptions:
(a) Two population variances are equal.
(b) Two population variances are not equal.
Population variances are equal
If the two population variances are equal, it implies that their respective unbiasedestimates are also equal. In such a case, the expression becomes:
2 21 2
1 2
ˆ ˆ
n n = 2 2
1 2 1 2
ˆ ˆ 1 1ˆ
n n n n
2 2 21 2ˆ ˆ ˆ(Assuming )
To get an estimate of 2ˆ , a weighted average of 21s and 2
2s is used, where
the weights are the number of degrees of freedom of each sample. The weighted
average is called a ‘pooled estimate’ of 2̂ . This pooled estimate is given by the
expression:
2 22 1 1 2 2
1 2
( 1) ( 1)ˆ
2
n s n s
n n
The testing procedure could be explained as under:
H0
: µ1 = µ
2 µ
1 – µ
2 = 0
H1
: µ1 µ
2 µ
1 – µ
2 0
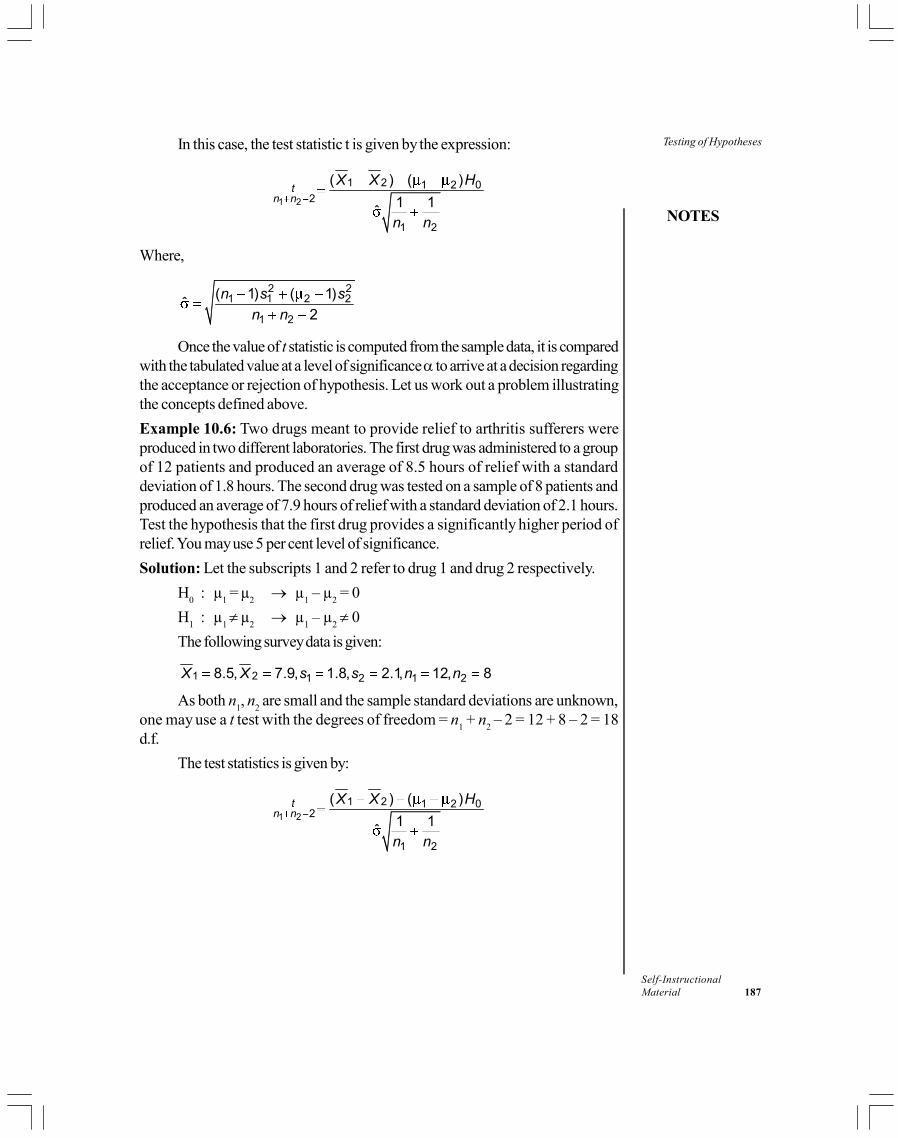
NOTES
Self-InstructionalMaterial 187
Testing of HypothesesIn this case, the test statistic t is given by the expression:
1 2
1 2 1 2 02
1 2
( ) ( )
1 1ˆ
tn n
X X H
n n
Where,
2 21 1 2 2
1 2
( 1) ( 1)ˆ
2
n s s
n n
Once the value of t statistic is computed from the sample data, it is comparedwith the tabulated value at a level of significance to arrive at a decision regardingthe acceptance or rejection of hypothesis. Let us work out a problem illustratingthe concepts defined above.
Example 10.6: Two drugs meant to provide relief to arthritis sufferers wereproduced in two different laboratories. The first drug was administered to a groupof 12 patients and produced an average of 8.5 hours of relief with a standarddeviation of 1.8 hours. The second drug was tested on a sample of 8 patients andproduced an average of 7.9 hours of relief with a standard deviation of 2.1 hours.Test the hypothesis that the first drug provides a significantly higher period ofrelief. You may use 5 per cent level of significance.
Solution: Let the subscripts 1 and 2 refer to drug 1 and drug 2 respectively.
H0
: µ1 = µ
2 µ
1 – µ
2 = 0
H1
: µ1 µ
2 µ
1 – µ
2 0
The following survey data is given:
1 2 1 2 1 28.5, 7.9, 1.8, 2.1, 12, 8X X s s n n
As both n1, n
2 are small and the sample standard deviations are unknown,
one may use a t test with the degrees of freedom = n1 + n
2 – 2 = 12 + 8 – 2 = 18
d.f.
The test statistics is given by:
1 2
1 2 1 2 02
1 2
( ) ( )
1 1ˆ
tn n
X X H
n n

Testing of Hypotheses
NOTES
Self-Instructional188 Material
Where,
18
2 21 1 2 2
1 2
2 2
( 1) ( 1)ˆ
2
(12 1)(1.8) (8 1)(2.1) 11 3.24 7 (4.41)
12 8 2 18
35.64 30.87 66.613.698 1.92
18 18(8.5 7.9) (0) 0.6
1 1 1.92 0.20831.92
12 80.6 0.6
0.6851.92 0.456 0.8755
t
n s n s
n n
The critical value of t with 18 degrees of freedom at 5 per cent level ofsignificance is given by 1.734. The sample value of t = 0.685 lies in the acceptanceregion as shown in figure below:
Rejection region for Example 10.6
Therefore, the null hypothesis is accepted as there is not enough evidence to rejectit. Therefore, one may conclude that the first drug is not significantly more effectivethan the second drug.
When population variances are not equal
In case population variances are not equal, the test statistic for testing the equalityof two population means when the size of samples are small is given by:
1 2 1 2 0
2 21 2
1 2
( ) ( )
ˆ ˆ
X X Ht
n n
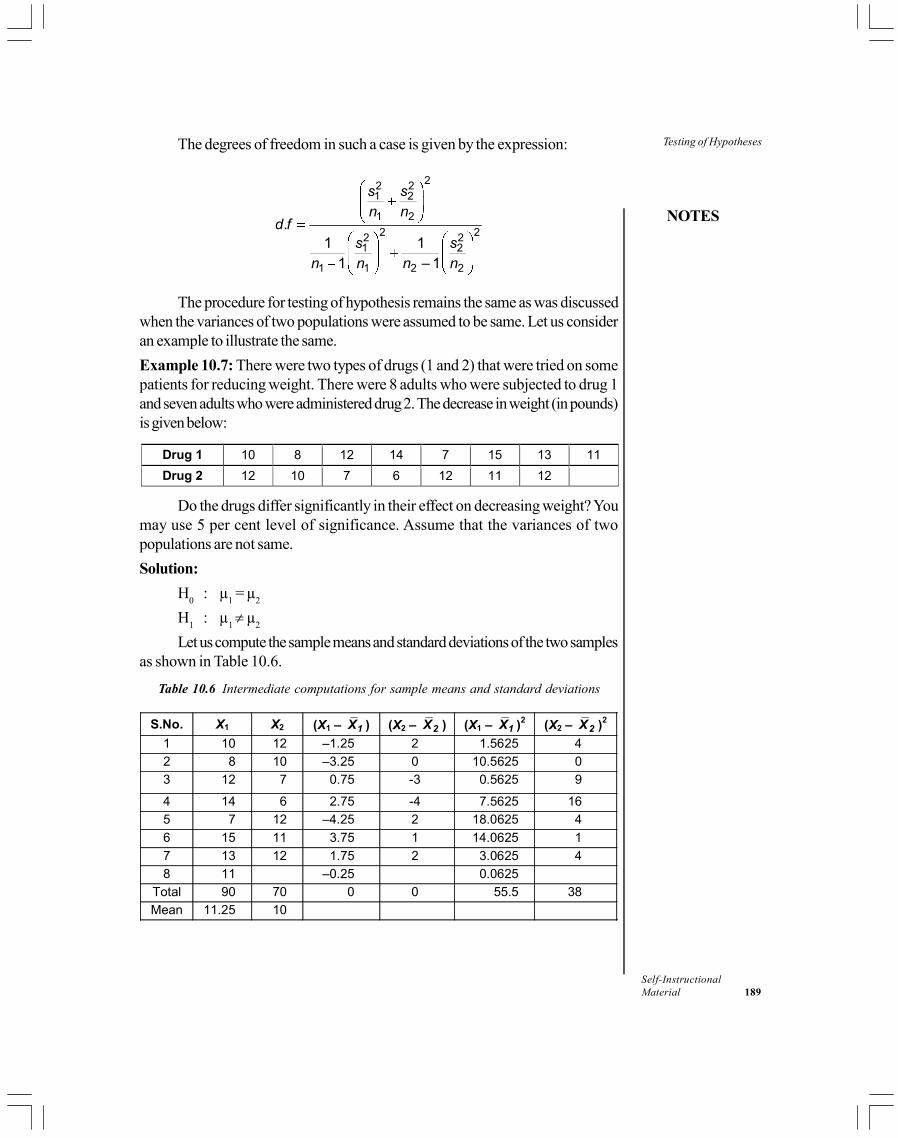
NOTES
Self-InstructionalMaterial 189
Testing of HypothesesThe degrees of freedom in such a case is given by the expression:
22 21 2
1 2
2 22 21 2
1 1 2 2
.1 1
1 – 1
s sn n
d fs s
n n n n
The procedure for testing of hypothesis remains the same as was discussedwhen the variances of two populations were assumed to be same. Let us consideran example to illustrate the same.
Example 10.7: There were two types of drugs (1 and 2) that were tried on somepatients for reducing weight. There were 8 adults who were subjected to drug 1and seven adults who were administered drug 2. The decrease in weight (in pounds)is given below:
Drug 1 10 8 12 14 7 15 13 11
Drug 2 12 10 7 6 12 11 12
Do the drugs differ significantly in their effect on decreasing weight? You
may use 5 per cent level of significance. Assume that the variances of twopopulations are not same.
Solution:
H0
: µ1 = µ
2
H1
: µ1 µ
2
Let us compute the sample means and standard deviations of the two samplesas shown in Table 10.6.
Table 10.6 Intermediate computations for sample means and standard deviations
S.No. X1 X2 (X1 – 1X ) (X2 – 2X ) (X1 – 1X )2 (X2 – 2X )2
1 10 12 –1.25 2 1.5625 4
2 8 10 –3.25 0 10.5625 0
3 12 7 0.75 -3 0.5625 9
4 14 6 2.75 -4 7.5625 16
5 7 12 –4.25 2 18.0625 4
6 15 11 3.75 1 14.0625 1
7 13 12 1.75 2 3.0625 4
8 11 –0.25 0.0625
Total 90 70 0 0 55.5 38
Mean 11.25 10
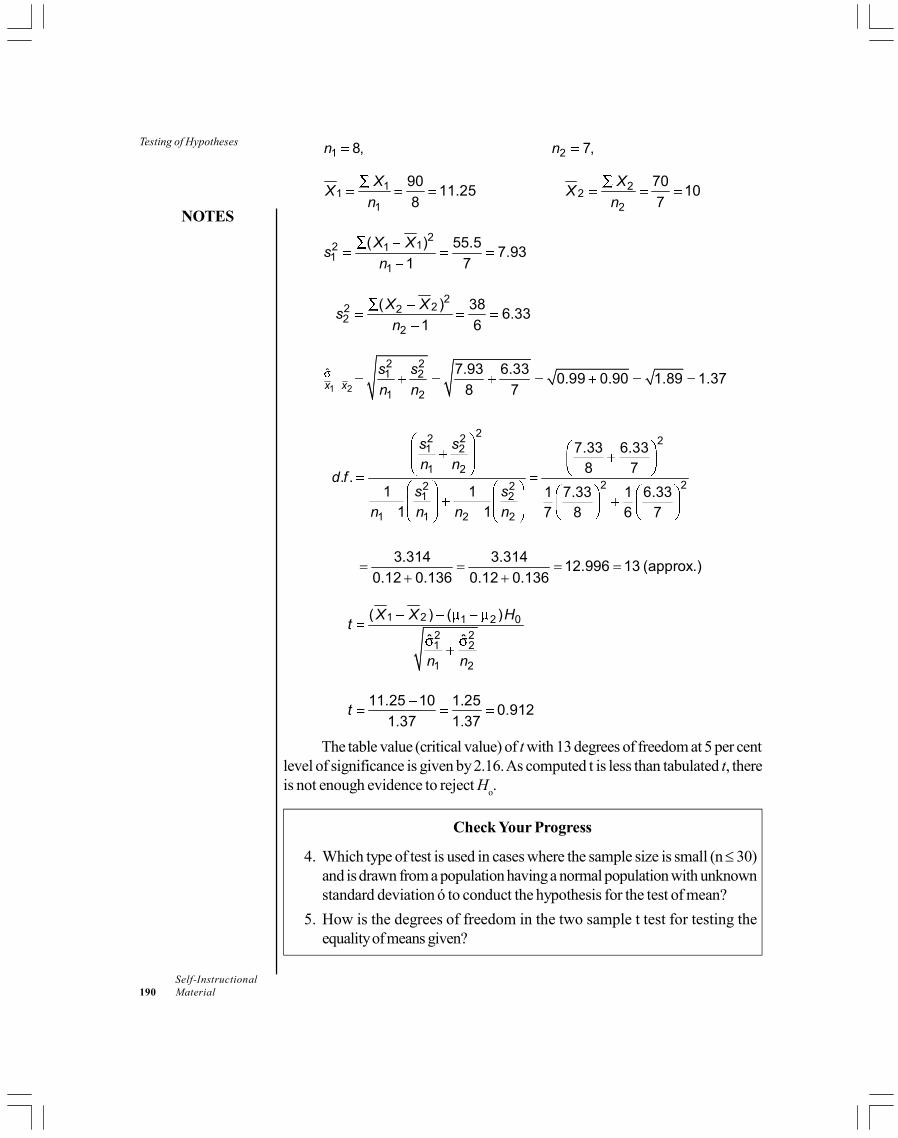
Testing of Hypotheses
NOTES
Self-Instructional190 Material
1 8,n 2 7,n
1 21 2
1 2
90 7011.25 10
8 7
X XX X
n n
212 1
11
( ) 55.57.93
1 7
X Xs
n
2
22 22
2
( ) 386.33
1 6
X Xs
n
1 2
2 2ˆ 1 2
1 2
7.93 6.330.99 0.90 1.89 1.37
8 7x xs s
n n
22 2 21 2
1 2
2 22 21 2
1 1 2 2
7.33 6.338 7
. .1 1 1 7.33 1 6.33
1 1 7 8 6 7
s sn n
d fs s
n n n n
3.314 3.31412.996 13 (approx.)
0.12 0.136 0.12 0.136
1 2 1 2 0
2 21 2
1 2
( ) ( )
ˆ ˆ
X X Ht
n n
11.25 10 1.250.912
1.37 1.37t
The table value (critical value) of t with 13 degrees of freedom at 5 per centlevel of significance is given by 2.16. As computed t is less than tabulated t, thereis not enough evidence to reject H
o.
Check Your Progress
4. Which type of test is used in cases where the sample size is small (n 30)and is drawn from a population having a normal population with unknownstandard deviation ó to conduct the hypothesis for the test of mean?
5. How is the degrees of freedom in the two sample t test for testing theequality of means given?
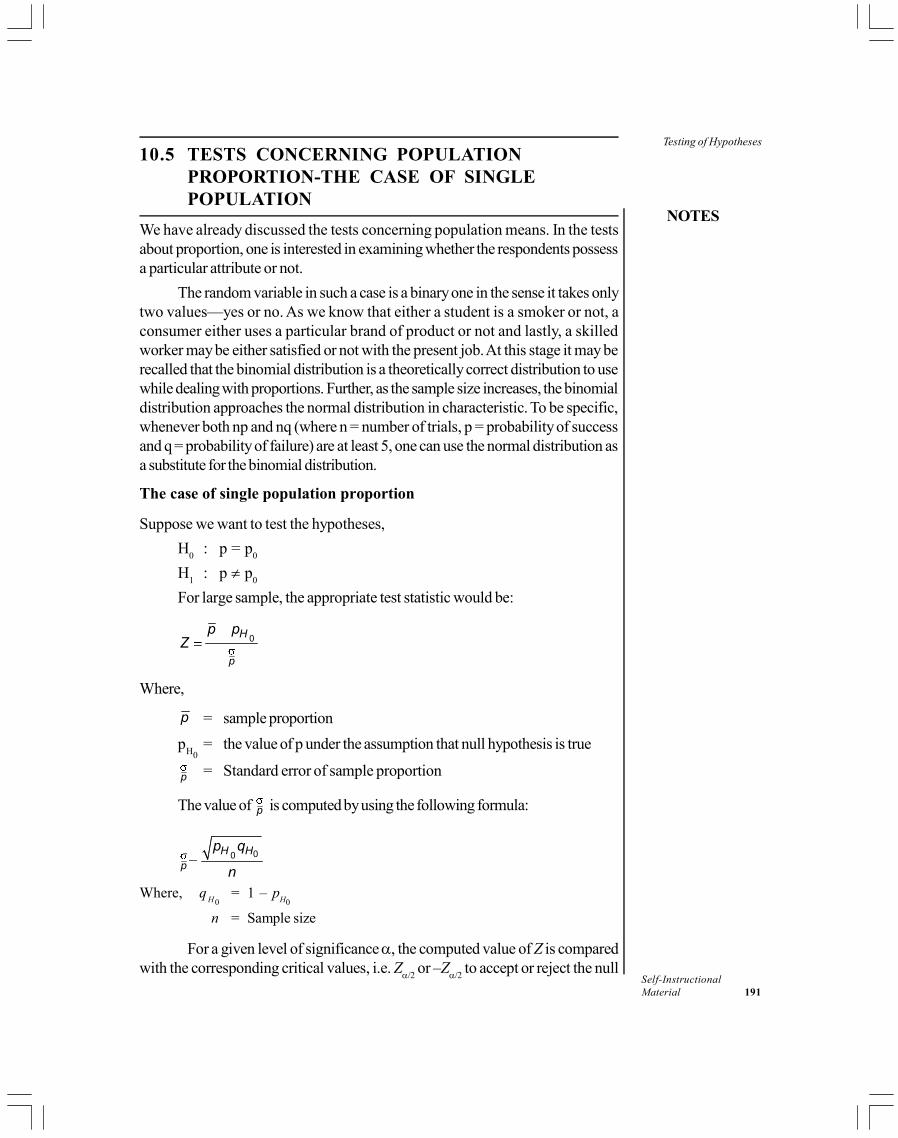
NOTES
Self-InstructionalMaterial 191
Testing of Hypotheses10.5 TESTS CONCERNING POPULATION
PROPORTION-THE CASE OF SINGLEPOPULATION
We have already discussed the tests concerning population means. In the testsabout proportion, one is interested in examining whether the respondents possessa particular attribute or not.
The random variable in such a case is a binary one in the sense it takes onlytwo values—yes or no. As we know that either a student is a smoker or not, aconsumer either uses a particular brand of product or not and lastly, a skilledworker may be either satisfied or not with the present job. At this stage it may berecalled that the binomial distribution is a theoretically correct distribution to usewhile dealing with proportions. Further, as the sample size increases, the binomialdistribution approaches the normal distribution in characteristic. To be specific,whenever both np and nq (where n = number of trials, p = probability of successand q = probability of failure) are at least 5, one can use the normal distribution asa substitute for the binomial distribution.
The case of single population proportion
Suppose we want to test the hypotheses,
H0
: p = p0
H1
: p p0
For large sample, the appropriate test statistic would be:
0H
p
p pZ
Where,
p = sample proportion
pH0
= the value of p under the assumption that null hypothesis is true
p = Standard error of sample proportion
The value of p is computed by using the following formula:
00H Hp
p q
n
Where, qH0
= 1 – pH0
n = Sample size
For a given level of significance , the computed value of Z is comparedwith the corresponding critical values, i.e. Z/2
or –Z/2 to accept or reject the null
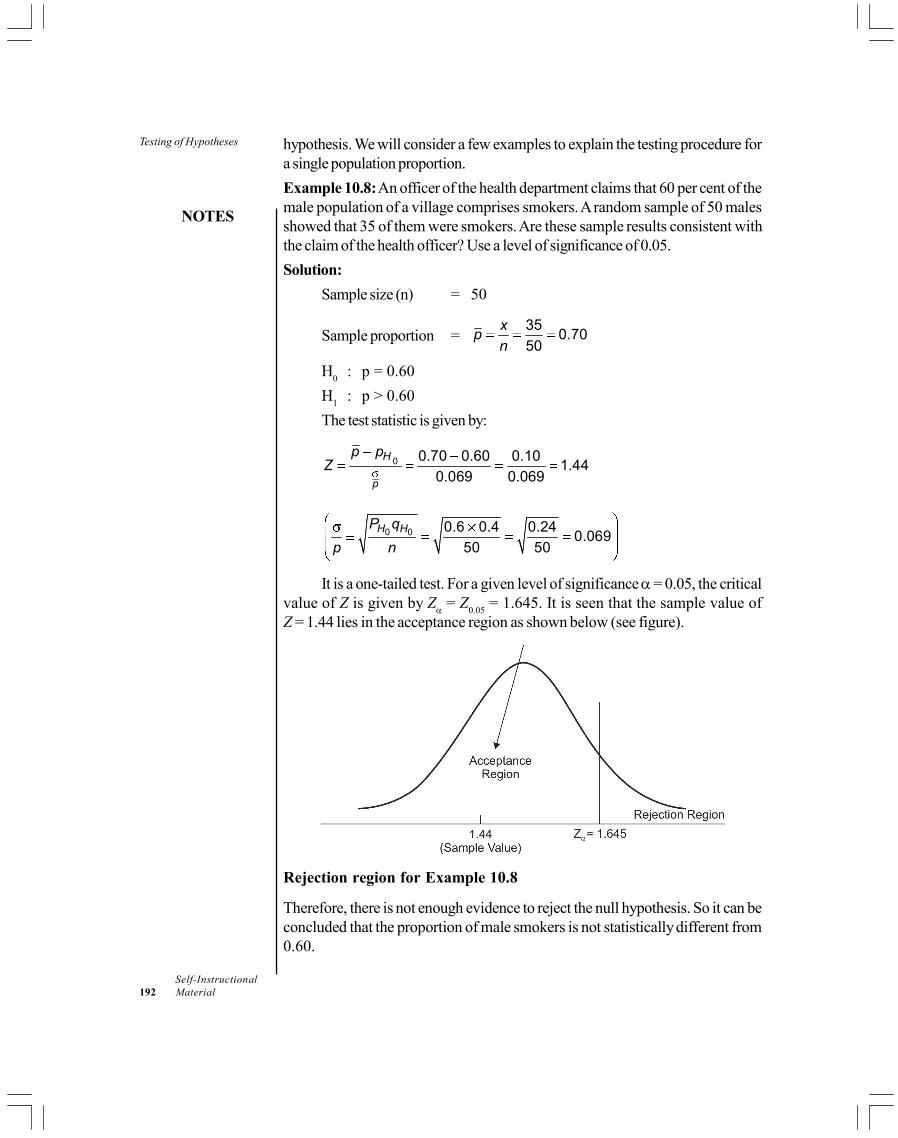
Testing of Hypotheses
NOTES
Self-Instructional192 Material
hypothesis. We will consider a few examples to explain the testing procedure fora single population proportion.
Example 10.8: An officer of the health department claims that 60 per cent of themale population of a village comprises smokers. A random sample of 50 malesshowed that 35 of them were smokers. Are these sample results consistent withthe claim of the health officer? Use a level of significance of 0.05.
Solution:
Sample size (n) = 50
Sample proportion =35
0.7050
xp
n
H0
: p = 0.60
H1
: p > 0.60
The test statistic is given by:
0 0.70 0.60 0.101.44
0.069 0.069
H
p
p pZ
0 0 0.6 0.4 0.240.069
50 50H HP q
p n
It is a one-tailed test. For a given level of significance = 0.05, the criticalvalue of Z is given by Z = Z
0.05 = 1.645. It is seen that the sample value of
Z = 1.44 lies in the acceptance region as shown below (see figure).
Rejection region for Example 10.8
Therefore, there is not enough evidence to reject the null hypothesis. So it can beconcluded that the proportion of male smokers is not statistically different from0.60.

NOTES
Self-InstructionalMaterial 193
Testing of Hypotheses10.6 TESTS FOR DIFFERENCE BETWEEN TWO
POPULATION PROPORTIONS
Here, the interest is to test whether the two population proportions are equal ornot. The hypothesis under investigation is:
H0
: p1 = p
2 p
1 – p
2 = 0
H1
: p1 p
2 p
1 – p
2 0
The alternative hypothesis assumed is two sided. It could as well have beenone sided. The test statistic is given by:
1 2
1 2 1 2 0( )
P P
p p p p HZ
Where,
1p = Sample proportion possessing a particular attribute frompopulation 1
2p = Sample proportion possessing a particular attribute frompopulation 2
1 2P P = Standard error of difference between proportions.
(p1 – p
2)
H0= Value of difference between population proportion under
the assumption that the null hypothesis is true.
The formula for 1 2P P is given by:
1 2
1 1 2 2
1 2P P
p q p q
n n
We do not know the value of p1, p
2, etc., but under the null hypothesis
p1 = p
2 = p.
1 2 1 2 1 2
1 1P P
pq pqpq
n n n n
The best estimate of p is given by:
1 2
1 2
ˆx x
pn n
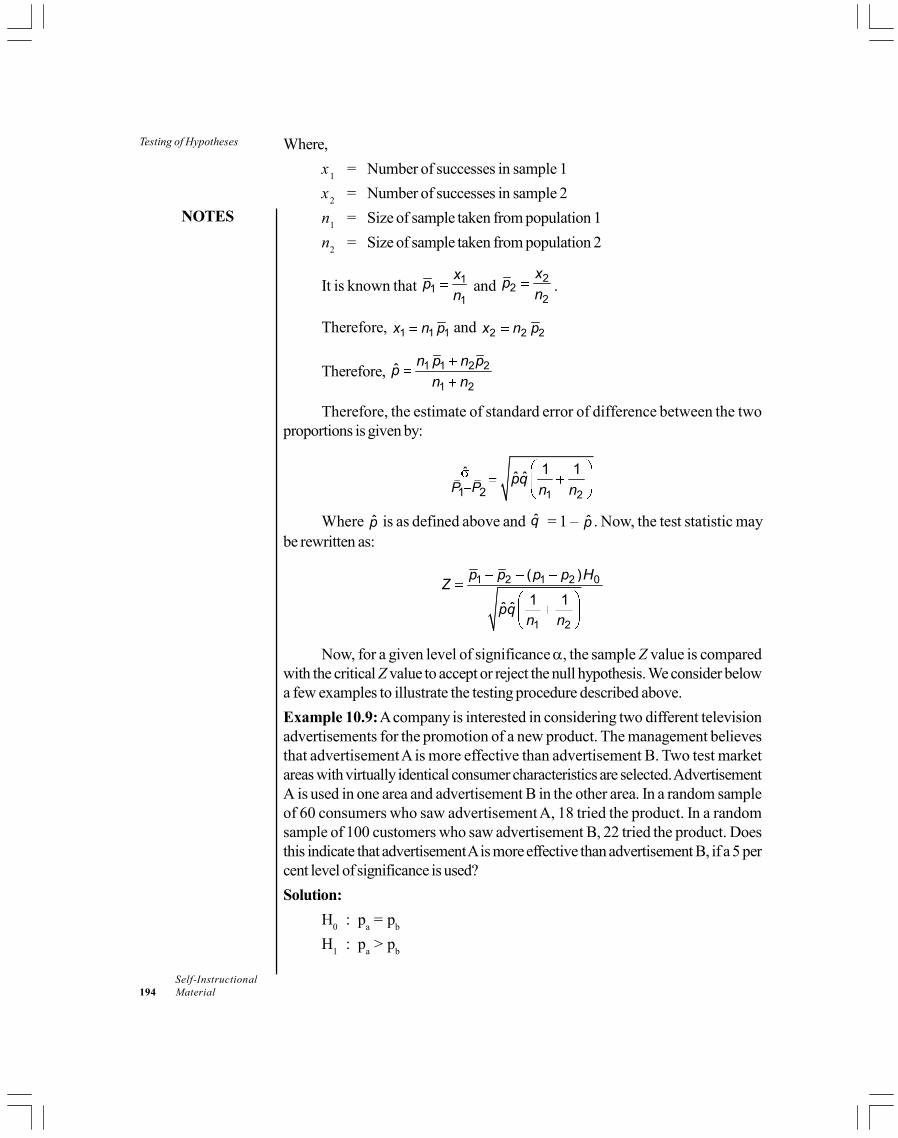
Testing of Hypotheses
NOTES
Self-Instructional194 Material
Where,
x1
= Number of successes in sample 1
x2
= Number of successes in sample 2
n1
= Size of sample taken from population 1
n2
= Size of sample taken from population 2
It is known that 11
1
xp
n and
22
2
xp
n.
Therefore, 1 1 1x n p and 2 2 2x n p
Therefore, 1 1 2 2
1 2
ˆn p n p
pn n
Therefore, the estimate of standard error of difference between the twoproportions is given by:
1 21 2
ˆ 1 1ˆ ˆP P
pqn n
Where p̂ is as defined above and q̂ = 1 – p̂ . Now, the test statistic maybe rewritten as:
1 2 1 2 0
1 2
( )
1 1ˆ ˆ
p p p p HZ
pqn n
Now, for a given level of significance , the sample Z value is comparedwith the critical Z value to accept or reject the null hypothesis. We consider belowa few examples to illustrate the testing procedure described above.
Example 10.9: A company is interested in considering two different televisionadvertisements for the promotion of a new product. The management believesthat advertisement A is more effective than advertisement B. Two test marketareas with virtually identical consumer characteristics are selected. AdvertisementA is used in one area and advertisement B in the other area. In a random sampleof 60 consumers who saw advertisement A, 18 tried the product. In a randomsample of 100 customers who saw advertisement B, 22 tried the product. Doesthis indicate that advertisement A is more effective than advertisement B, if a 5 percent level of significance is used?
Solution:
H0
: pa = p
b
H1
: pa > p
b

NOTES
Self-InstructionalMaterial 195
Testing of Hypotheses
0
60, 18, 100, 22
18 220.3 0.22
60 100
( ) 0.3 0.22 0
1 1ˆ ˆ
0.08 0.08 0.081.3
0.0710.25 0.75(0.0267)1 10.25 0.75
60 100
1ˆ
A B
A A B B
A BA B
A B
A B A B
P P
A B
A B
A B
n x n x
x xp p
n n
P P p p HZ
pqn n
x xp
n n
8 22 400.25
60 100 160
The critical value of Z at 5 per cent level of significance is 1.645. The samplevalue of Z = 1.13 lies in the acceptance region as shown in the figure below:
Rejection region for Example 10.9
Exercises
1. The company XYZ manufacturing bulbs hypothesizes that the life of itsbulbs is 145 hours with a known standard deviation of 210 hours. A randomsample of 25 bulbs gave a mean life of 130 hours. Using a 0.05 level ofsignificance, can the company conclude that the mean life of bulbs is lessthan the 145 hours?
2. The manager of a hotel is trying to decide which of the two supposedlyequally good cigarette–vending machines to install, tests each machine 500times, and finds that machine I fails to work (neither delivers the cigarettesnor returns the money) 26 times and machine II fails to work 12 times.Using a 0.05 level of significance, can he conclude that two machines arenot equally good?
3. If 54 out of a random sample of 150 boys smoke, while 31 out of randomsample of 100 girls smoke, can we conclude at the 0.05 level of significancethat the proportion of male smokers is higher than that of female smokers?
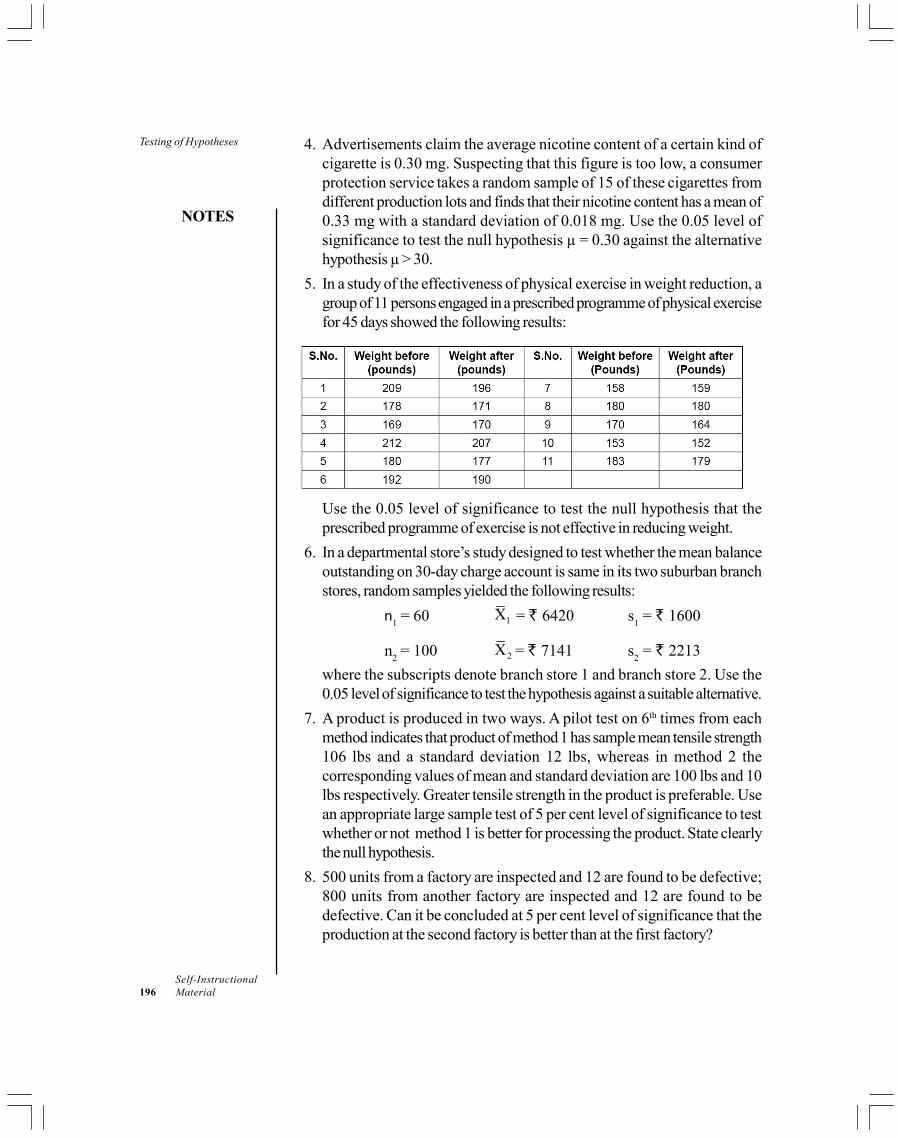
Testing of Hypotheses
NOTES
Self-Instructional196 Material
4. Advertisements claim the average nicotine content of a certain kind ofcigarette is 0.30 mg. Suspecting that this figure is too low, a consumerprotection service takes a random sample of 15 of these cigarettes fromdifferent production lots and finds that their nicotine content has a mean of0.33 mg with a standard deviation of 0.018 mg. Use the 0.05 level ofsignificance to test the null hypothesis µ = 0.30 against the alternativehypothesis µ > 30.
5. In a study of the effectiveness of physical exercise in weight reduction, agroup of 11 persons engaged in a prescribed programme of physical exercisefor 45 days showed the following results:
Use the 0.05 level of significance to test the null hypothesis that theprescribed programme of exercise is not effective in reducing weight.
6. In a departmental store’s study designed to test whether the mean balanceoutstanding on 30-day charge account is same in its two suburban branchstores, random samples yielded the following results:
n1 = 60 1X = 6420 s
1 = 1600
n2 = 100 2X = 7141 s
2 = 2213
where the subscripts denote branch store 1 and branch store 2. Use the0.05 level of significance to test the hypothesis against a suitable alternative.
7. A product is produced in two ways. A pilot test on 6th times from eachmethod indicates that product of method 1 has sample mean tensile strength106 lbs and a standard deviation 12 lbs, whereas in method 2 thecorresponding values of mean and standard deviation are 100 lbs and 10lbs respectively. Greater tensile strength in the product is preferable. Usean appropriate large sample test of 5 per cent level of significance to testwhether or not method 1 is better for processing the product. State clearlythe null hypothesis.
8. 500 units from a factory are inspected and 12 are found to be defective;800 units from another factory are inspected and 12 are found to bedefective. Can it be concluded at 5 per cent level of significance that theproduction at the second factory is better than at the first factory?
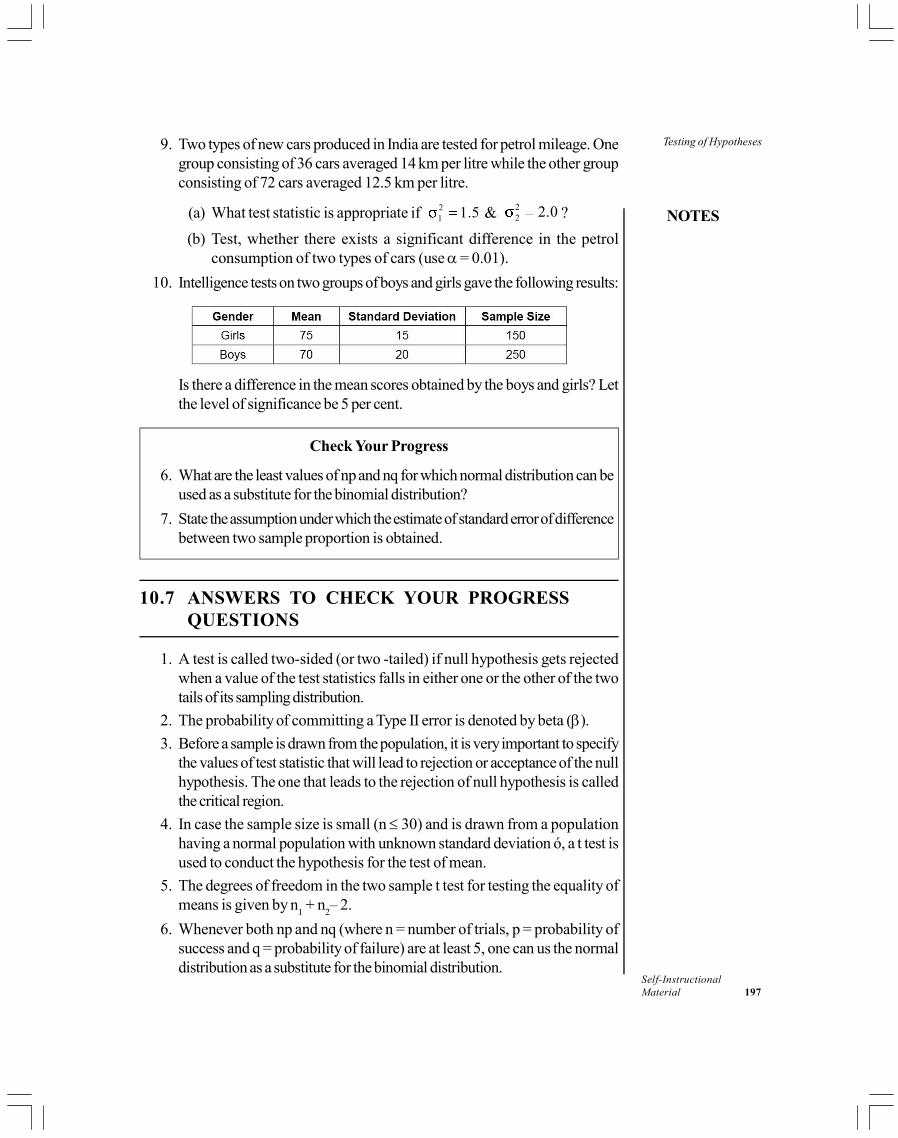
NOTES
Self-InstructionalMaterial 197
Testing of Hypotheses9. Two types of new cars produced in India are tested for petrol mileage. Onegroup consisting of 36 cars averaged 14 km per litre while the other groupconsisting of 72 cars averaged 12.5 km per litre.
(a) What test statistic is appropriate if 21 1.5 & 2
2 2.0 ?
(b) Test, whether there exists a significant difference in the petrolconsumption of two types of cars (use = 0.01).
10. Intelligence tests on two groups of boys and girls gave the following results:
Is there a difference in the mean scores obtained by the boys and girls? Letthe level of significance be 5 per cent.
Check Your Progress
6. What are the least values of np and nq for which normal distribution can beused as a substitute for the binomial distribution?
7. State the assumption under which the estimate of standard error of differencebetween two sample proportion is obtained.
10.7 ANSWERS TO CHECK YOUR PROGRESSQUESTIONS
1. A test is called two-sided (or two -tailed) if null hypothesis gets rejectedwhen a value of the test statistics falls in either one or the other of the twotails of its sampling distribution.
2. The probability of committing a Type II error is denoted by beta ().
3. Before a sample is drawn from the population, it is very important to specifythe values of test statistic that will lead to rejection or acceptance of the nullhypothesis. The one that leads to the rejection of null hypothesis is calledthe critical region.
4. In case the sample size is small (n 30) and is drawn from a populationhaving a normal population with unknown standard deviation ó, a t test isused to conduct the hypothesis for the test of mean.
5. The degrees of freedom in the two sample t test for testing the equality ofmeans is given by n
1 + n
2– 2.
6. Whenever both np and nq (where n = number of trials, p = probability ofsuccess and q = probability of failure) are at least 5, one can us the normaldistribution as a substitute for the binomial distribution.

Testing of Hypotheses
NOTES
Self-Instructional198 Material
7. The estimate of standard error of difference between two sample proportionis obtained under the assumption that null hypothesis is true.
10.8 SUMMARY
A hypothesis is a statement or an assumption regarding a population, whichmay or may not be true.
The sequences of steps that need to be followed for the testing of hypothesisare: setting up of a hypothesis, setting up of a suitable significance level,determination of a test statistic, determination of critical region, computingthe value of test-statistic and making decision
In the test procedure for a single population mean or for examining theequality of two population means, for large samples, a Z test is appropriatewhereas for the small samples, a t test is used under the two cases where: (i)population variances are equal and (ii) population variances are not equal.
In the testing procedures concerning the proportion of a single populationand the difference between two population proportions the hypothesesconcerning them are carried out using a Z test under the assumption that thenormal distribution could be used as an approximation to the binomialdistribution for a large sample.
10.9 KEY WORDS
Critical region: The region that leads to rejection of null hypothesis.
Level of significance: The probability of committing a Type 1 error.
Null hypothesis: The hypotheses that is proposed with the intent ofreceiving a rejection for them.
Type I error: This occurs when null hypothesis is rejected when it is actuallytrue.
10.10 SELF ASSESSMENT QUESTIONS ANDEXERCISES
Short-Answer Questions
1. What is alternative hypothesis?
2. Write a short note on one-tailed and two-tailed tests.
3. Briefly explain Type I and Type II error.

NOTES
Self-InstructionalMaterial 199
Testing of HypothesesLong-Answer Questions
1. Explain the various steps involved in the tests of hypothesis exercise.
2. Indicate whether a Z or t distribution is applicable in each of the followingcases while conducting test for population mean.
(i) n = 31 s = 12
(ii) n = 15 s = 9
(iii) n = 64 s = 8
(iv) n = 28 = 10
(v) n = 56 = 6
3. The company XYZ manufacturing bulbs hypothesizes that the life of itsbulbs is 145 hours with a known standard deviation of 210 hours. A randomsample of 25 bulbs gave a mean life of 130 hours. Using a 0.05 level ofsignificance, can the company conclude that the mean life of bulbs is lessthan the 145 hours?
4. Average annual income of the employees of a company has been reportedto be 18,750. A random sample of 100 employees was taken. Then averageannual income was found to be 19,240 with a standard deviation of 2,610.Test at 5 per cent level of significance whether the sample results arerepresentative of population results.
5. If 54 out of a random sample of 150 boys smoke, while 31 out ofrandom sample of 100 girls smoke, can we conclude at the 0.05 levelof significance that the proportion of male smokers is higher than that offemale smokers? Use the 0.05 level of significance to test the nullhypothesis that the prescribed programme of exercise is not effective inreducing weight.
6. In a departmental store’s study designed to test whether the mean balanceoutstanding on 30-day charge account is same in its two suburban branchstores, random samples yielded the following results:
n1 = 60 1X = 6420 s
1 = 1600
n2 = 100 2X = 7141 s
2 = 2213
where the subscripts denote branch store 1 and branch store 2. Use the0.05 level of significance to test the hypothesis against a suitablealternative.

Testing of Hypotheses
NOTES
Self-Instructional200 Material
10.11 FURTHER READINGS
Chawla D and Sondhi N. 2016. Research Methodology: Concepts and Cases,2nd edition. New Delhi: Vikas Publishing House.
Cooper, Donald R. 2006. Business Research Methods. New Delhi: TataMcGraw-Hill Publishing Company Ltd.
Kinnear, T C and Taylor, J R. 1996. Marketing Research: An Applied Approach.5th edn. New York: McGraw Hill, Inc.
Malhotra, N K. 2002. Marketing Research – An Applied Orientation.3rd edn. New Delhi: Pearson Education.
NOTES
Self-InstructionalMaterial 201
Chi-Square AnalysisBLOCK - IV
RESEARCH REPORT
UNIT 11 CHI-SQUARE ANALYSIS
Structure11.0 Introduction11.1 Objectives11.2 A Chi-square Test for the Goodness of Fit11.3 A Chi-square Test for the Independence of Variables11.4 A Chi-square Test for the Equality of More than
11.4.1 Two Population Proportions11.5 Answers to Check Your Progress Questions11.6 Summary11.7 Key Words11.8 Self Assessment Questions and Exercises11.9 Further Readings
11.0 INTRODUCTION
In the last unit, we discussed the Z test for the equality of two population proportions.Now, in case we have more than two populations and want to test the equality of allof them simultaneously, it is not possible to do it using Z test. This is because Z testcan examine the equality of two proportions at a time. In such a situation, the chi-square test can come to our rescue and can carry out the test in one go.
The chi-square test is widely used in research. For the use of chi-squaretest, data is required in the form of frequencies. Data expressed in percentages orproportion can also be used, provided it could be converted into frequencies. Themajority of the applications of chi-square (2) are with discrete data. The testcould also be applied to continuous data, provided it is reduced to certain categoriesand tabulated in such a way that the chi-square may be applied.
Some of the important properties of the chi-square distribution are:
Unlike the normal and t distribution, the chi-square distribution is notsymmetric.
The values of a chi-square are greater than or equal to zero.
The shape of a chi-square distribution depends upon the degrees of freedom.With the increase in degrees of freedom, the distribution tends to normal.
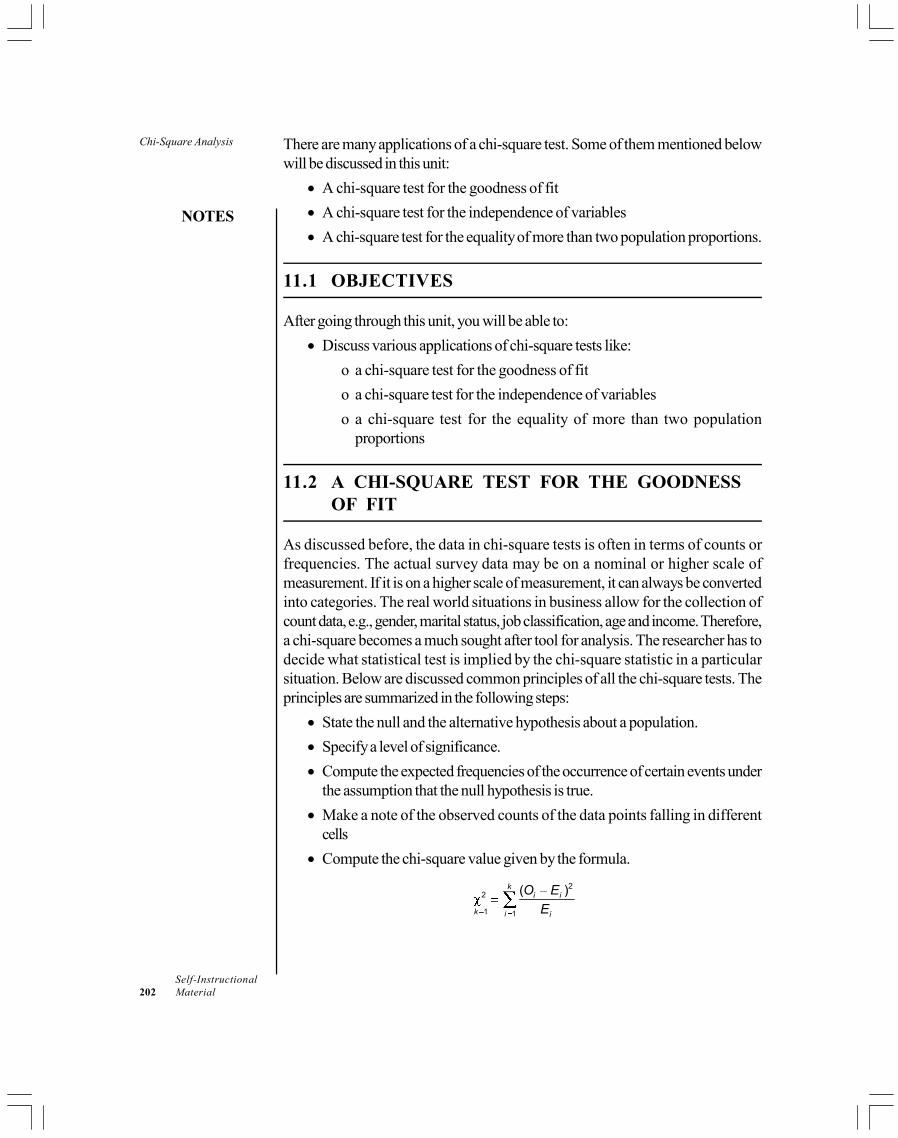
Chi-Square Analysis
NOTES
Self-Instructional202 Material
There are many applications of a chi-square test. Some of them mentioned belowwill be discussed in this unit:
A chi-square test for the goodness of fit
A chi-square test for the independence of variables
A chi-square test for the equality of more than two population proportions.
11.1 OBJECTIVES
After going through this unit, you will be able to:
Discuss various applications of chi-square tests like:
o a chi-square test for the goodness of fit
o a chi-square test for the independence of variables
o a chi-square test for the equality of more than two populationproportions
11.2 A CHI-SQUARE TEST FOR THE GOODNESSOF FIT
As discussed before, the data in chi-square tests is often in terms of counts orfrequencies. The actual survey data may be on a nominal or higher scale ofmeasurement. If it is on a higher scale of measurement, it can always be convertedinto categories. The real world situations in business allow for the collection ofcount data, e.g., gender, marital status, job classification, age and income. Therefore,a chi-square becomes a much sought after tool for analysis. The researcher has todecide what statistical test is implied by the chi-square statistic in a particularsituation. Below are discussed common principles of all the chi-square tests. Theprinciples are summarized in the following steps:
State the null and the alternative hypothesis about a population.
Specify a level of significance.
Compute the expected frequencies of the occurrence of certain events underthe assumption that the null hypothesis is true.
Make a note of the observed counts of the data points falling in differentcells
Compute the chi-square value given by the formula.
2
2
1 1
( )ki i
k i i
O E
E
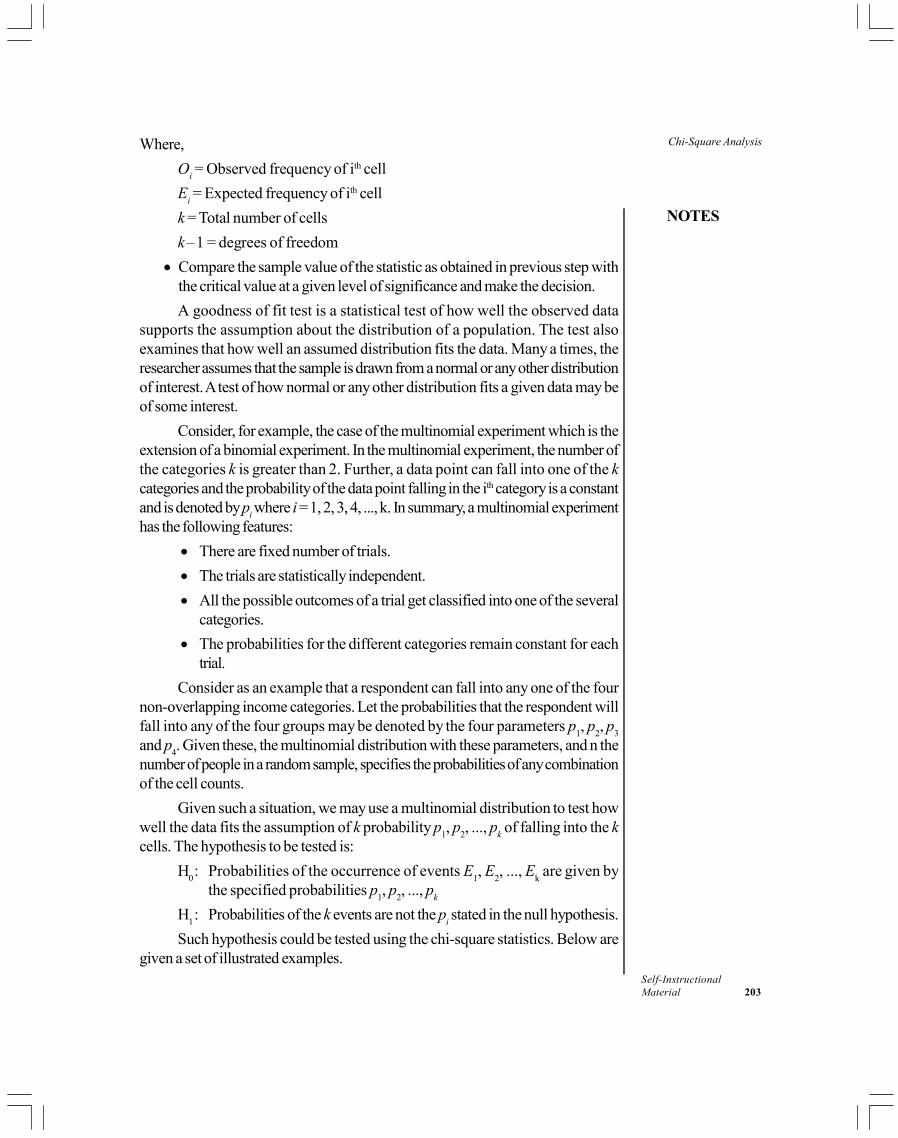
NOTES
Self-InstructionalMaterial 203
Chi-Square AnalysisWhere,
Oi = Observed frequency of ith cell
Ei = Expected frequency of ith cell
k = Total number of cells
k–1 = degrees of freedom
Compare the sample value of the statistic as obtained in previous step withthe critical value at a given level of significance and make the decision.
A goodness of fit test is a statistical test of how well the observed datasupports the assumption about the distribution of a population. The test alsoexamines that how well an assumed distribution fits the data. Many a times, theresearcher assumes that the sample is drawn from a normal or any other distributionof interest. A test of how normal or any other distribution fits a given data may beof some interest.
Consider, for example, the case of the multinomial experiment which is theextension of a binomial experiment. In the multinomial experiment, the number ofthe categories k is greater than 2. Further, a data point can fall into one of the kcategories and the probability of the data point falling in the ith category is a constantand is denoted by p
i where i = 1, 2, 3, 4, ..., k. In summary, a multinomial experiment
has the following features:
There are fixed number of trials.
The trials are statistically independent.
All the possible outcomes of a trial get classified into one of the severalcategories.
The probabilities for the different categories remain constant for eachtrial.
Consider as an example that a respondent can fall into any one of the fournon-overlapping income categories. Let the probabilities that the respondent willfall into any of the four groups may be denoted by the four parameters p
1, p
2, p
3
and p4. Given these, the multinomial distribution with these parameters, and n the
number of people in a random sample, specifies the probabilities of any combinationof the cell counts.
Given such a situation, we may use a multinomial distribution to test howwell the data fits the assumption of k probability p
1, p
2, ..., p
k of falling into the k
cells. The hypothesis to be tested is:
H0 : Probabilities of the occurrence of events E
1, E
2, ..., E
k are given by
the specified probabilities p1, p
2, ..., p
k
H1 : Probabilities of the k events are not the p
i stated in the null hypothesis.
Such hypothesis could be tested using the chi-square statistics. Below aregiven a set of illustrated examples.

Chi-Square Analysis
NOTES
Self-Instructional204 Material
Example 11.1: The manager of ABC ice-cream parlour has to take a decisionregarding how much of each flavour of ice-cream he should stock so that thedemands of the customers are satisfied. The ice-cream suppliers claim that amongthe four most popular flavors, 62 per cent customers prefer vanilla, 18 per centchocolate, 12 per cent strawberry and 8 per cent mango. A random sample of200 customers produces the results as given below. At the = 0.05 significancelevel, test the claim that the percentages given by the supplies are correct.
Flavour Vanilla Chocolate Strawberry Mango
Number preferring 120 40 18 22
Solution:
Let
pv
: proportion of customers preferring vanilla flavour.
pc
: proportion of customers preferring chocolate flavour.
ps
: proportion of customers preferring strawberry flavour.
pm
: proportion of customers preferring mango flavour.
H0
: pv = 0.62, p
c = 0.18, p
s = 0.12, p
m = 0.08
H1
: Proportions are not that specified in the null hypothesis
The expected frequencies corresponding to the various flavors under theassumption that the null hypothesis is true are:
Vanilla = 200 × 0.62 = 124
Chocolate = 200 × 0.18 = 36
Strawberry = 200 × 0.12 = 24
Mango = 200 × 0.08 = 16
The computations for 23 are as under:
2
1
( )ki i
i i
O E
E
Flavour
O (Observed
Frequencies)
E (Expected
Frequencies) O – E (O – E)2
( )2O – E
E
Vanilla 120 124 – 4 16 0.129 Chocolate 40 36 4 16 0.444 Strawberry 18 24 – 6 36 1.500 Mango 22 16 6 36 2.250 Total 4.323
The computed value of chi-square is 4.323.
Table 23 (5 per cent) = 9.488 (see Table 11.1)
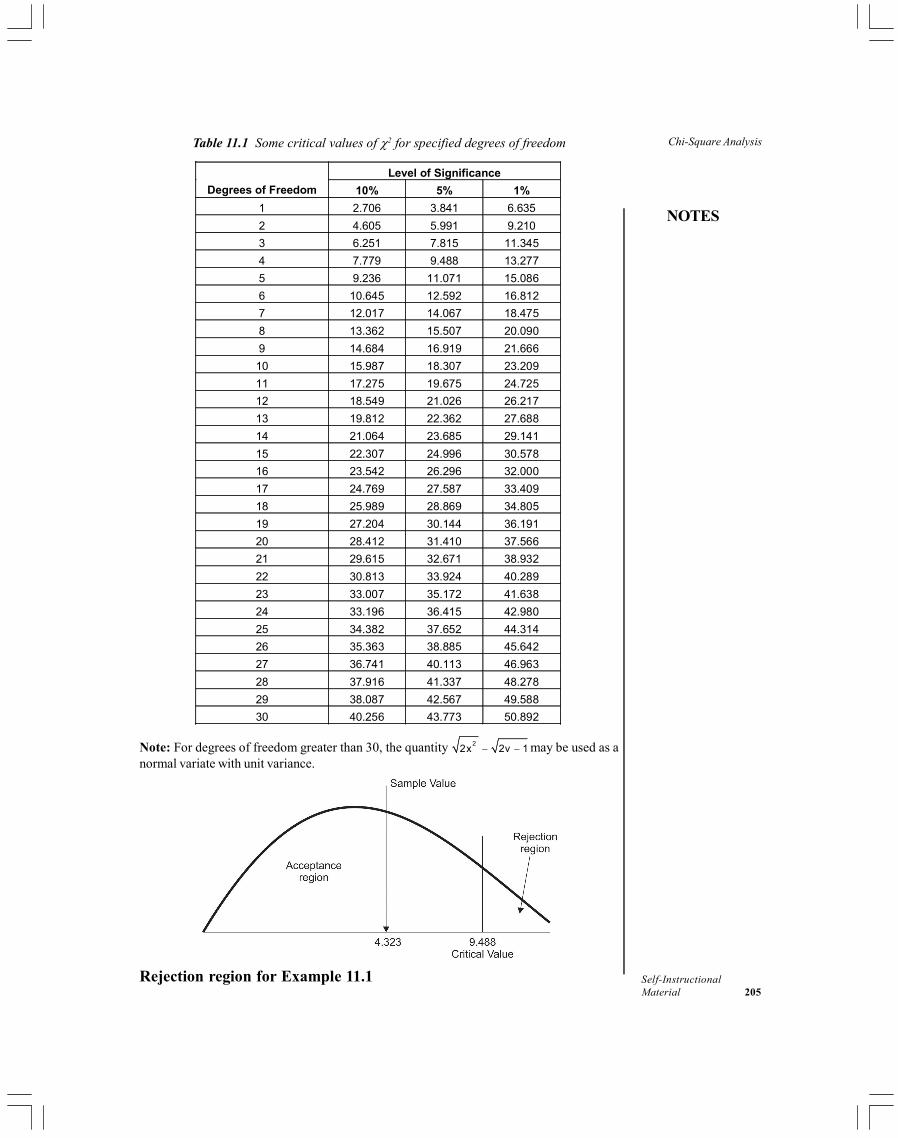
NOTES
Self-InstructionalMaterial 205
Chi-Square AnalysisTable 11.1 Some critical values of 2 for specified degrees of freedom
Level of Significance
Degrees of Freedom 10% 5% 1%
1 2.706 3.841 6.635
2 4.605 5.991 9.210
3 6.251 7.815 11.345
4 7.779 9.488 13.277
5 9.236 11.071 15.086
6 10.645 12.592 16.812
7 12.017 14.067 18.475
8 13.362 15.507 20.090
9 14.684 16.919 21.666
10 15.987 18.307 23.209
11 17.275 19.675 24.725
12 18.549 21.026 26.217
13 19.812 22.362 27.688
14 21.064 23.685 29.141
15 22.307 24.996 30.578
16 23.542 26.296 32.000
17 24.769 27.587 33.409
18 25.989 28.869 34.805
19 27.204 30.144 36.191
20 28.412 31.410 37.566
21 29.615 32.671 38.932
22 30.813 33.924 40.289
23 33.007 35.172 41.638
24 33.196 36.415 42.980
25 34.382 37.652 44.314
26 35.363 38.885 45.642
27 36.741 40.113 46.963
28 37.916 41.337 48.278
29 38.087 42.567 49.588
30 40.256 43.773 50.892
Note: For degrees of freedom greater than 30, the quantity 2
2x 2v 1 may be used as anormal variate with unit variance.
Rejection region for Example 11.1

Chi-Square Analysis
NOTES
Self-Instructional206 Material
As sample 2 lies in the acceptance region, accept H0. Therefore, the customer
preference rates are as stated.
It may be worth pointing out that for the application of a chi-square test, theexpected frequency in each cell should be at least 5.0. Further the sampleobservation should be independently and randomly taken. In case it is found thatone or more cells have the expected frequency less than 5, one could still carryout the chi-square analysis by combining them into meaningful cells so that theexpected number has a total of at least 5. Another point worth mentioning is thatthe degree of freedom, usually denoted by df in such cases, is given by k – 1,where k denotes the number of cells (categories).
It may be noted that in Example 11.1, the hypothesized probabilities werenot equal. There are situations where the hypothesized probabilities in each categoryare equal or in other words, the interest is in investigating the uniformity of thedistribution. The following example would illustrate it.
Example 11.2: An insurance company provides auto insurance and is analysingthe data obtained from fatal crashes. A sample of the motor vehicle deaths israndomly selected for a two-year period. The number of fatalities is listed belowfor the different days of the week. At the 0.05 significance level, test the claim thataccidents occur on different days with equal frequency.
Day Monday Tuesday Wednesday Thursday Friday Saturday Sunday
Number of fatalities
31 20 20 22 22 29 36
Solution:
Let
p1
= Proportion of fatalities on Monday
p2
= Proportion of fatalities on Tuesday
p3
= Proportion of fatalities on Wednesday
p4
= Proportion of fatalities on Thursday
p5
= Proportion of fatalities on Friday
p6
= Proportion of fatalities on Saturday
p7
= Proportion of fatalities on Sunday

NOTES
Self-InstructionalMaterial 207
Chi-Square Analysis
H0
: p1 = p
2 = p
3 = p
4 = p
5 = p
6 = p
7 =
1
7
H1
: At least one of these proportions is incorrect.
n = Total frequency = 31 + 20 + 20 + 22 + 22 + 29 + 36 = 180
The expected number of fatalities on each day of the week under theassumption that the null hypothesis is true is given as under:
Monday = 180 × 1
7 = 25.714
Tuesday = 180 × 1
7 = 25.714
Wednesday = 180 × 1
7 = 25.714
Thursday = 180 × 1
7 = 25.714
Friday = 180 × 1
7 = 25.714
Saturday = 180 × 1
7 = 25.714
Sunday = 180 × 1
7 = 25.714
The computation of sample chi-square value is given in the following table:
Day Observed Frequencies
(O)
Expected Frequencies
(E)
O – E (O – E)2 2(O – E)
E
Monday 31 25.714 5.286 27.942 1.087
Tuesday 20 25.714 – 5.714 32.650 1.270 Wednesday 20 25.714 – 5.714 32.650 1.270 Thursday 22 25.714 – 3.714 13.794 0.536 Friday 22 25.714 – 3.714 13.794 0.536 Saturday 29 25.714 3.286 10.798 0.420 Sunday 36 25.714 10.286 105.802 4.114
Total 9.233
The value of sample 2 =2( )O E
E = 9.233
Degrees of freedom = 7 – 1 = 6
Critical (Table) 26 = 12.592

Chi-Square Analysis
NOTES
Self-Instructional208 Material
Since the sample chi-square value is less than the tabulated 2, there is notenough evidence to reject the null hypothesis as shown in the figure below.
Rejection region for Example 11.2
11.3 A CHI-SQUARE TEST FOR INDEPENDENCEOF VARIABLES
The chi-square test can be used to test the independence of two variables eachhaving at least two categories. The test makes use of contingency tables, alsoreferred to as cross-tabs with the cells corresponding to a cross classification ofattributes or events. A contingency table with 3 rows and 4 columns (as an example)is shown in Table 11.2.
Table 11.2 Contingency Table with 3 Rows and 4 Columns
First Classification Category Second Classification
Category 1 2 3 4 Total
1 O11 O12 O13 O14 R1 2 O21 O22 O23 O24 R2 3 O31 O32 O33 O34 R3
Total C1 C2 C3 C4 n
Assuming that there are r rows and c columns, the count in the cellcorresponding to the ith row and the jth column is denoted by O
ij, where i = 1, 2,
..., r and j = 1, 2, ..., c. The total for row i is denoted by Ri whereas that
corresponding to column j is denoted by Cj. The total sample size is given by n,
which is also the sum of all the r row totals or the sum of all the c column totals.
The hypothesis test for independence is:
H0 : Row and column variables are independent of each other.
H1 : Row and column variables are not independent.
The hypothesis is tested using a chi-square test statistic for independence given by:
2 = 2
1 1
( )r cij ij
i j ij
O E
E
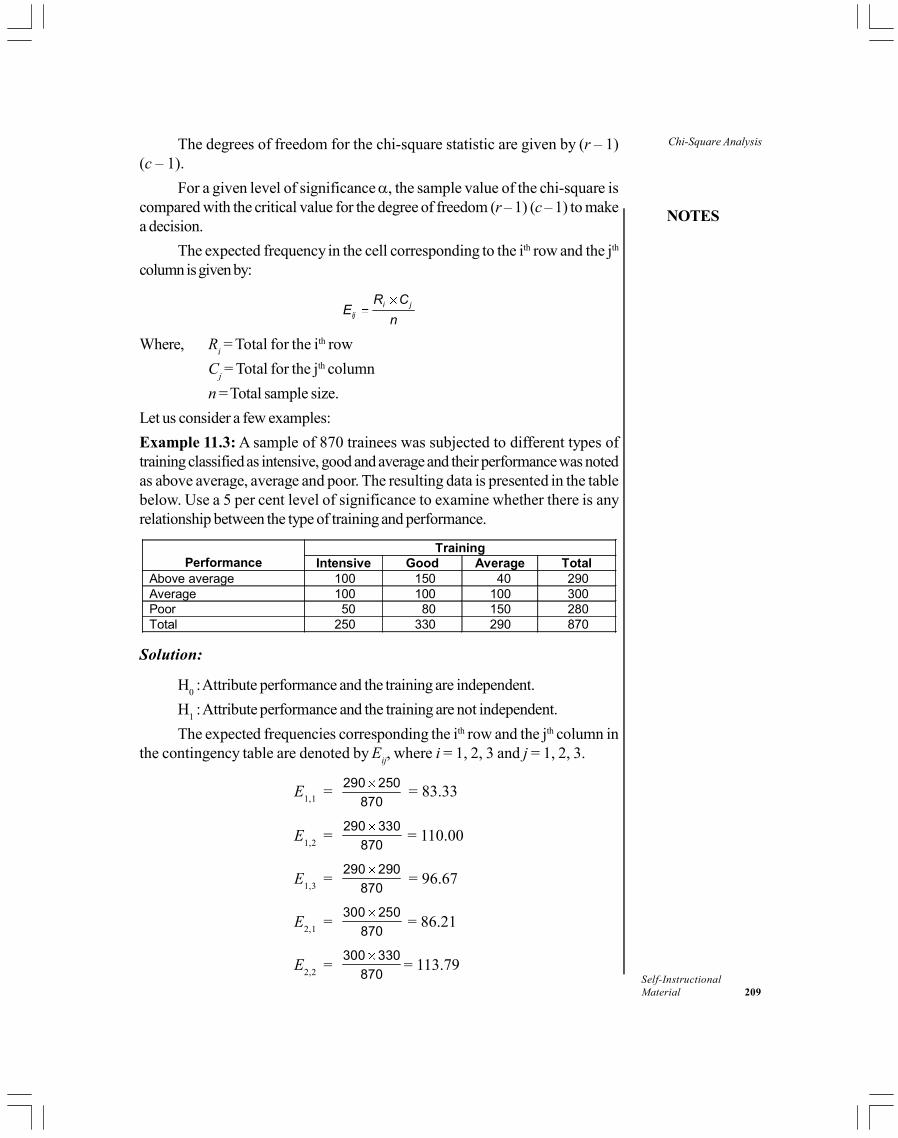
NOTES
Self-InstructionalMaterial 209
Chi-Square AnalysisThe degrees of freedom for the chi-square statistic are given by (r – 1)(c – 1).
For a given level of significance , the sample value of the chi-square iscompared with the critical value for the degree of freedom (r – 1) (c – 1) to makea decision.
The expected frequency in the cell corresponding to the ith row and the jth
column is given by:
i jij
R CE
n
Where, Ri = Total for the ith row
Cj = Total for the jth column
n = Total sample size.
Let us consider a few examples:
Example 11.3: A sample of 870 trainees was subjected to different types oftraining classified as intensive, good and average and their performance was notedas above average, average and poor. The resulting data is presented in the tablebelow. Use a 5 per cent level of significance to examine whether there is anyrelationship between the type of training and performance.
Training Performance Intensive Good Average Total
Above average 100 150 40 290 Average 100 100 100 300 Poor 50 80 150 280 Total 250 330 290 870
Solution:
H0 : Attribute performance and the training are independent.
H1 : Attribute performance and the training are not independent.
The expected frequencies corresponding the ith row and the jth column inthe contingency table are denoted by E
ij, where i = 1, 2, 3 and j = 1, 2, 3.
E1,1
=290 250
870 = 83.33
E1,2
=290 330
870 = 110.00
E1,3
=290 290
870 = 96.67
E2,1
=300 250
870 = 86.21
E2,2
=300 330
870= 113.79
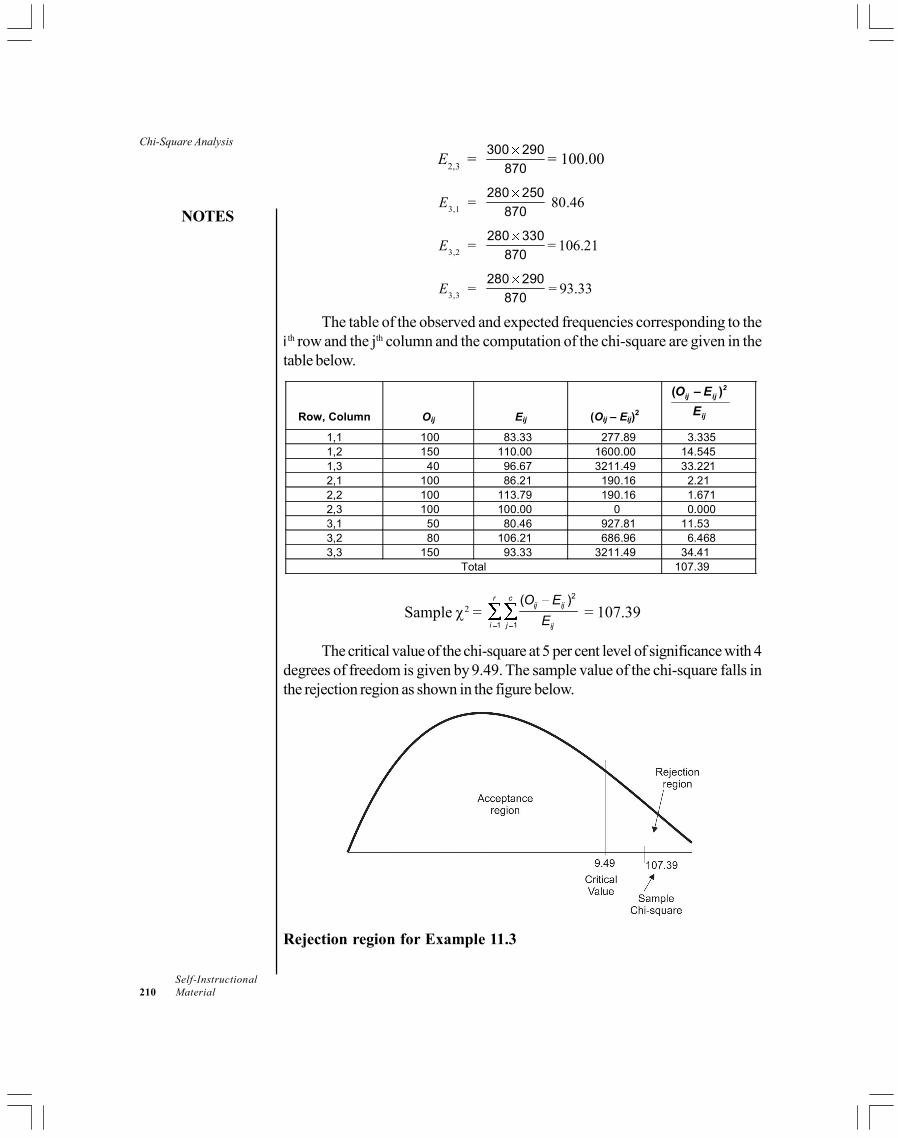
Chi-Square Analysis
NOTES
Self-Instructional210 Material
E2,3
=300 290
870= 100.00
E3,1
=280 250
870 80.46
E3,2
=280 330
870= 106.21
E3,3
=280 290
870= 93.33
The table of the observed and expected frequencies corresponding to thei th row and the jth column and the computation of the chi-square are given in thetable below.
Row, Column Oij Eij (Oij – Eij)2
( )2ij ij
ij
O – E
E
1,1 100 83.33 277.89 3.335 1,2 150 110.00 1600.00 14.545 1,3 40 96.67 3211.49 33.221 2,1 100 86.21 190.16 2.21 2,2 100 113.79 190.16 1.671 2,3 100 100.00 0 0.000 3,1 50 80.46 927.81 11.53 3,2 80 106.21 686.96 6.468 3,3 150 93.33 3211.49 34.41
Total 107.39
Sample 2 = 2
1 1
( )r cij ij
i j ij
O E
E = 107.39
The critical value of the chi-square at 5 per cent level of significance with 4degrees of freedom is given by 9.49. The sample value of the chi-square falls inthe rejection region as shown in the figure below.
Rejection region for Example 11.3
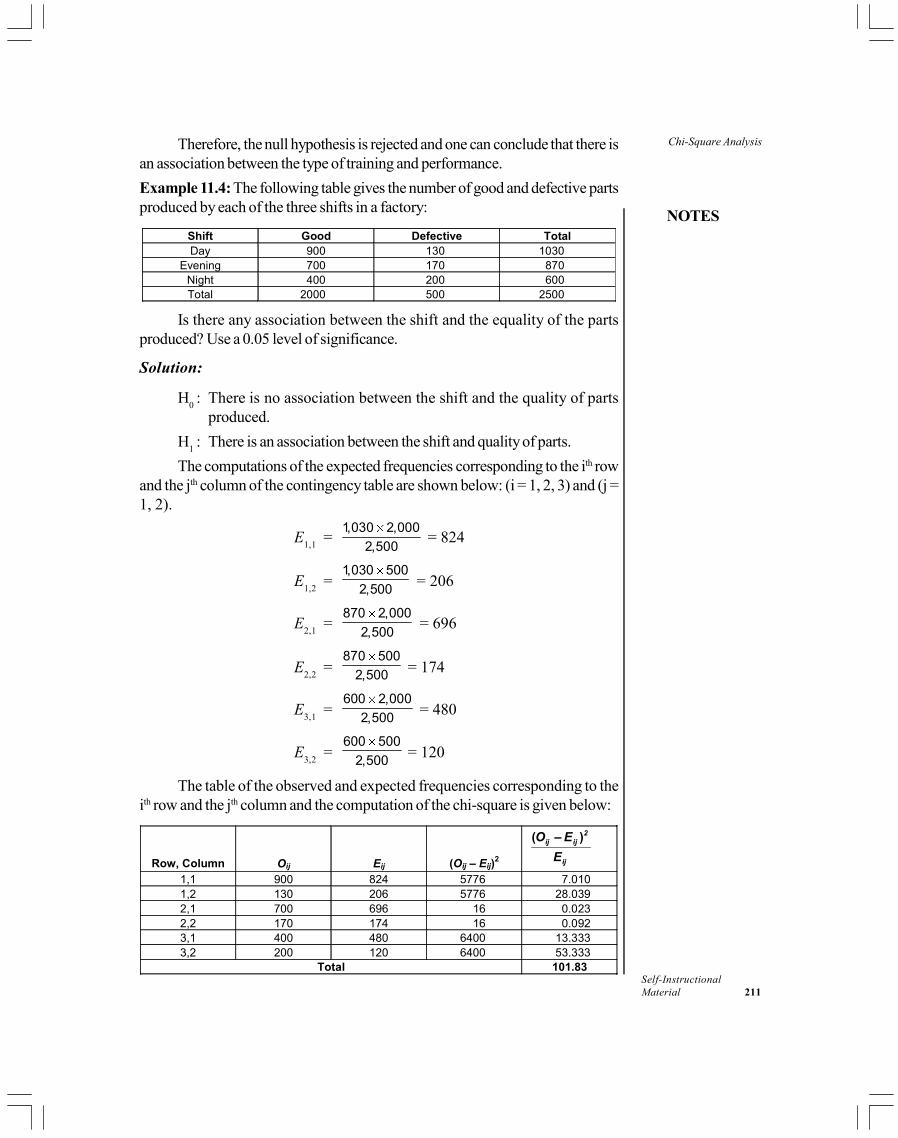
NOTES
Self-InstructionalMaterial 211
Chi-Square AnalysisTherefore, the null hypothesis is rejected and one can conclude that there isan association between the type of training and performance.
Example 11.4: The following table gives the number of good and defective partsproduced by each of the three shifts in a factory:
Shift Good Defective Total Day 900 130 1030
Evening 700 170 870 Night 400 200 600 Total 2000 500 2500
Is there any association between the shift and the equality of the parts
produced? Use a 0.05 level of significance.
Solution:
H0 : There is no association between the shift and the quality of parts
produced.
H1 : There is an association between the shift and quality of parts.
The computations of the expected frequencies corresponding to the ith rowand the jth column of the contingency table are shown below: (i = 1, 2, 3) and (j =1, 2).
E1,1
=1,030 2,000
2,500 = 824
E1,2
=1,030 500
2,500 = 206
E2,1
=870 2,000
2,500 = 696
E2,2
=870 500
2,500 = 174
E3,1
=600 2,000
2,500 = 480
E3,2
=600 500
2,500 = 120
The table of the observed and expected frequencies corresponding to theith row and the jth column and the computation of the chi-square is given below:
Row, Column Oij Eij (Oij – Eij)2
( )2ij ij
ij
O – E
E
1,1 900 824 5776 7.010 1,2 130 206 5776 28.039 2,1 700 696 16 0.023 2,2 170 174 16 0.092 3,1 400 480 6400 13.333 3,2 200 120 6400 53.333
Total 101.83

Chi-Square Analysis
NOTES
Self-Instructional212 Material
The sample chi-square is 2 = 23 2
1 1
( )ij ij
i j ij
O E
E = 101.83
The critical value of the chi-square with 2 degrees of freedom at 5 per centlevel of significance is given by 5.991. The null hypothesis is rejected as the samplechi-square lies in the rejection region as shown in the figure below. Therefore, thequality of parts produced is related to the shifts in which they were produced.
Rejection region for Example 11.4
It may be worth mentioning again that for the application of a chi-squaretest of independence, the sample should be selected at random and the expectedfrequency in each cell should be at least 5.
Check Your Progress
1. What is a goodness of fit test?
2. State the minimum expected frequency in each cell required for theapplication of a chi-square test.
3. What is the assumption under which the expected frequencies in a crosstable are computed?
4. Can the chi-square test of independence be applied in a case where thesample is selected by criteria and the expected frequency in each cell is atleast 5?
11.4 A CHI-SQUARE TEST FOR THE EQUALITYOF MORE THAN TWO POPULATIONPROPORTIONS
In certain situations, the researchers may be interested to test whether theproportion of a particular characteristic is the same in several populations. Theinterest may lie in finding out whether the proportion of people liking a movie is the
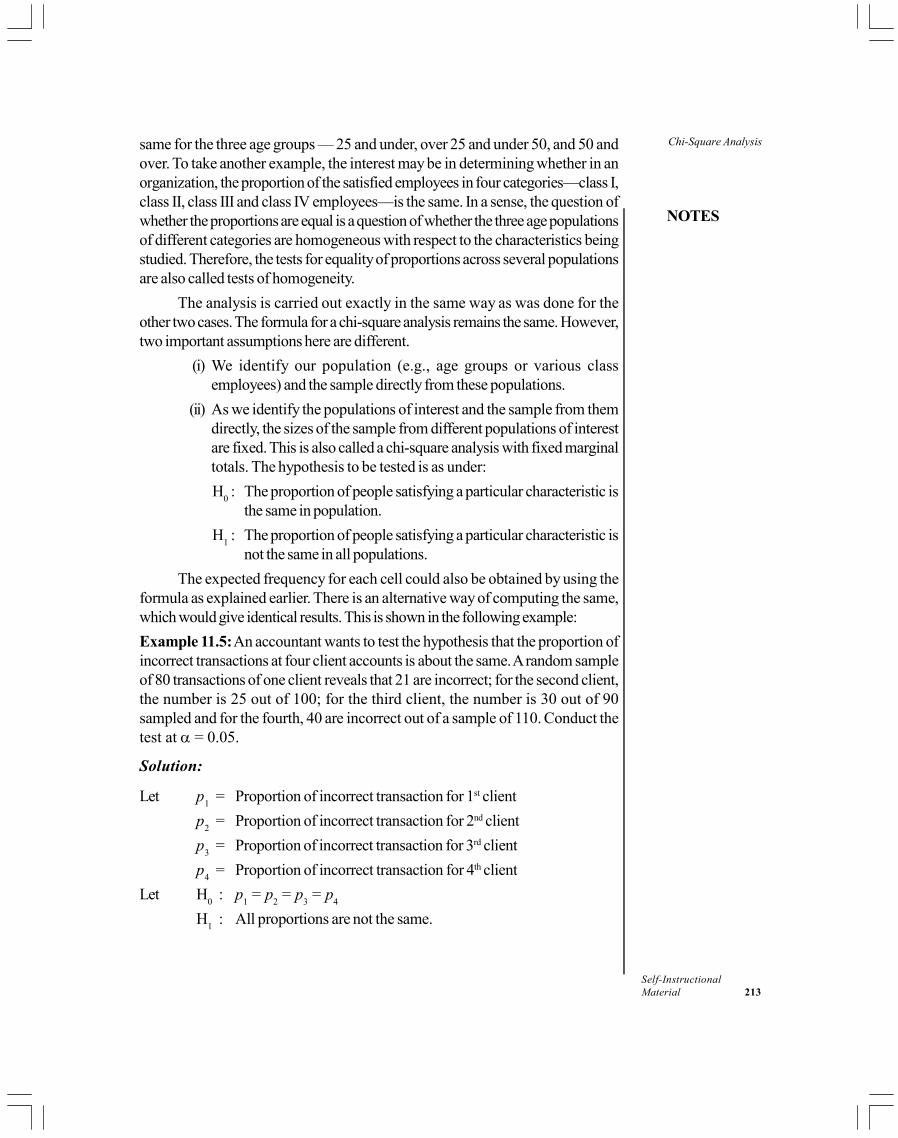
NOTES
Self-InstructionalMaterial 213
Chi-Square Analysissame for the three age groups — 25 and under, over 25 and under 50, and 50 andover. To take another example, the interest may be in determining whether in anorganization, the proportion of the satisfied employees in four categories—class I,class II, class III and class IV employees—is the same. In a sense, the question ofwhether the proportions are equal is a question of whether the three age populationsof different categories are homogeneous with respect to the characteristics beingstudied. Therefore, the tests for equality of proportions across several populationsare also called tests of homogeneity.
The analysis is carried out exactly in the same way as was done for theother two cases. The formula for a chi-square analysis remains the same. However,two important assumptions here are different.
(i) We identify our population (e.g., age groups or various classemployees) and the sample directly from these populations.
(ii) As we identify the populations of interest and the sample from themdirectly, the sizes of the sample from different populations of interestare fixed. This is also called a chi-square analysis with fixed marginaltotals. The hypothesis to be tested is as under:
H0 : The proportion of people satisfying a particular characteristic is
the same in population.
H1 : The proportion of people satisfying a particular characteristic is
not the same in all populations.
The expected frequency for each cell could also be obtained by using theformula as explained earlier. There is an alternative way of computing the same,which would give identical results. This is shown in the following example:
Example 11.5: An accountant wants to test the hypothesis that the proportion ofincorrect transactions at four client accounts is about the same. A random sampleof 80 transactions of one client reveals that 21 are incorrect; for the second client,the number is 25 out of 100; for the third client, the number is 30 out of 90sampled and for the fourth, 40 are incorrect out of a sample of 110. Conduct thetest at = 0.05.
Solution:
Let p1
= Proportion of incorrect transaction for 1st client
p2
= Proportion of incorrect transaction for 2nd client
p3
= Proportion of incorrect transaction for 3rd client
p4
= Proportion of incorrect transaction for 4th client
Let H0
: p1 = p
2 = p
3 = p
4
H1
: All proportions are not the same.
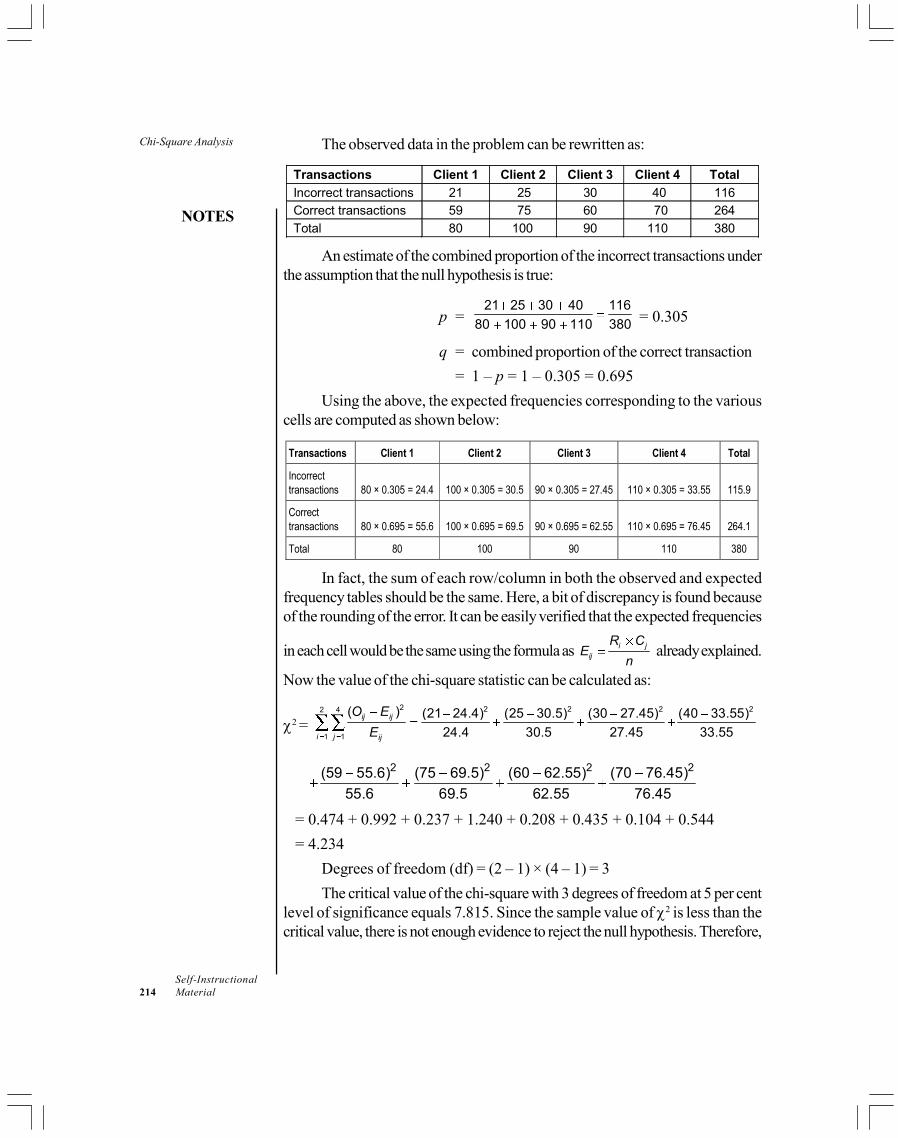
Chi-Square Analysis
NOTES
Self-Instructional214 Material
The observed data in the problem can be rewritten as:
Transactions Client 1 Client 2 Client 3 Client 4 Total
Incorrect transactions 21 25 30 40 116
Correct transactions 59 75 60 70 264
Total 80 100 90 110 380
An estimate of the combined proportion of the incorrect transactions under
the assumption that the null hypothesis is true:
p =21 25 30 40 116
80 100 90 110 380 = 0.305
q = combined proportion of the correct transaction
= 1 – p = 1 – 0.305 = 0.695
Using the above, the expected frequencies corresponding to the variouscells are computed as shown below:
Transactions Client 1 Client 2 Client 3 Client 4 Total
Incorrect transactions 80 × 0.305 = 24.4 100 × 0.305 = 30.5 90 × 0.305 = 27.45 110 × 0.305 = 33.55 115.9
Correct transactions 80 × 0.695 = 55.6 100 × 0.695 = 69.5 90 × 0.695 = 62.55 110 × 0.695 = 76.45 264.1
Total 80 100 90 110 380
In fact, the sum of each row/column in both the observed and expected
frequency tables should be the same. Here, a bit of discrepancy is found becauseof the rounding of the error. It can be easily verified that the expected frequencies
in each cell would be the same using the formula as i jij
R CE
nalready explained.
Now the value of the chi-square statistic can be calculated as:
2 = 2 2 2 2 22 4
1 1
( ) (21 24.4) (25 30.5) (30 27.45) (40 33.55)
24.4 30.5 27.45 33.55ij ij
i j ij
O E
E
2 2 2 2(59 55.6) (75 69.5) (60 62.55) (70 76.45)
55.6 69.5 62.55 76.45
= 0.474 + 0.992 + 0.237 + 1.240 + 0.208 + 0.435 + 0.104 + 0.544
= 4.234
Degrees of freedom (df) = (2 – 1) × (4 – 1) = 3
The critical value of the chi-square with 3 degrees of freedom at 5 per centlevel of significance equals 7.815. Since the sample value of 2 is less than thecritical value, there is not enough evidence to reject the null hypothesis. Therefore,
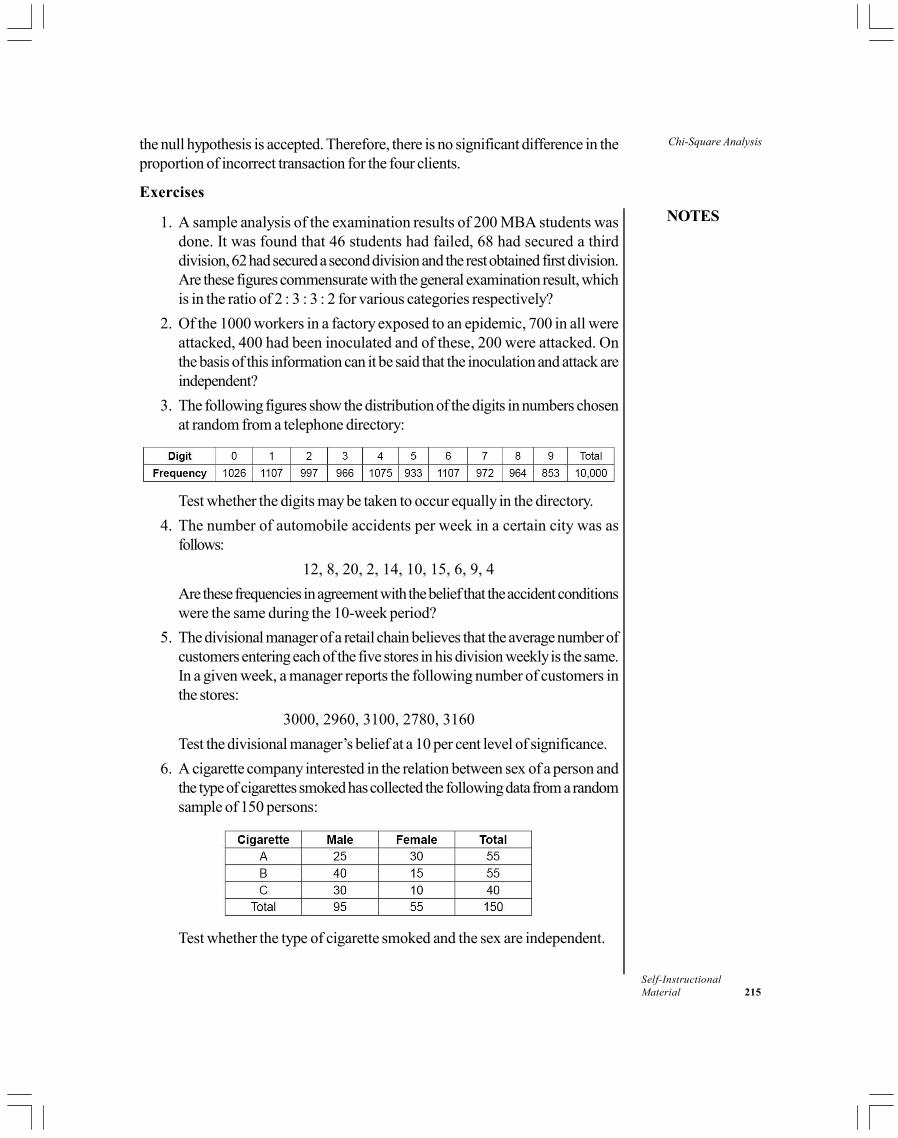
NOTES
Self-InstructionalMaterial 215
Chi-Square Analysisthe null hypothesis is accepted. Therefore, there is no significant difference in theproportion of incorrect transaction for the four clients.
Exercises
1. A sample analysis of the examination results of 200 MBA students wasdone. It was found that 46 students had failed, 68 had secured a thirddivision, 62 had secured a second division and the rest obtained first division.Are these figures commensurate with the general examination result, whichis in the ratio of 2 : 3 : 3 : 2 for various categories respectively?
2. Of the 1000 workers in a factory exposed to an epidemic, 700 in all wereattacked, 400 had been inoculated and of these, 200 were attacked. Onthe basis of this information can it be said that the inoculation and attack areindependent?
3. The following figures show the distribution of the digits in numbers chosenat random from a telephone directory:
Test whether the digits may be taken to occur equally in the directory.
4. The number of automobile accidents per week in a certain city was asfollows:
12, 8, 20, 2, 14, 10, 15, 6, 9, 4
Are these frequencies in agreement with the belief that the accident conditionswere the same during the 10-week period?
5. The divisional manager of a retail chain believes that the average number ofcustomers entering each of the five stores in his division weekly is the same.In a given week, a manager reports the following number of customers inthe stores:
3000, 2960, 3100, 2780, 3160
Test the divisional manager’s belief at a 10 per cent level of significance.
6. A cigarette company interested in the relation between sex of a person andthe type of cigarettes smoked has collected the following data from a randomsample of 150 persons:
Test whether the type of cigarette smoked and the sex are independent.
Chi-Square Analysis
NOTES
Self-Instructional216 Material
Check Your Progress
5. What is another name for tests for equality of proportions across severalpopulations?
6. Mention the degrees of freedom for chi-square test, if there are 3 rowsand two columns.
11.5 ANSWERS TO CHECK YOUR PROGRESSQUESTIONS
1. A goodness of fit test is a statistical test of how well the observed datasupports the assumption about the distribution of a population.
2. For the application of a chi-square test, the expected frequency in each cellshould be at least 5.0.
3. The expected frequencies in a cross table are computed under theassumption that null hypothesis is true.
4. No, for the application of a chi-square test of independence, the sampleshould be selected at random and the expected frequency in each cell shouldbe at least 5.
5. The tests for equality of proportions across several populations are alsocalled tests of homogeneity.
6. If there are 3 rows and two columns, the degrees of freedom for chi-squaretest is 3.
11.6 SUMMARY
Chi-square test has a variety of applications in research. Chi-square is non-symmetrical distribution taking non-negative values.
It can be used to test the goodness of fit of a distribution, independence ofvariables and equality of more than two population proportions.
A necessary condition for the application of chi-square test is that theexpected frequency in each cell should be at least 5.
The first and foremost thing for the application of chi-square is thecomputation of expected frequencies.
The data in chi-square test is in terms of counts or frequencies. In case theactual data is on a scale higher than that of nominal or ordinal, it can alwaysbe converted into categories.
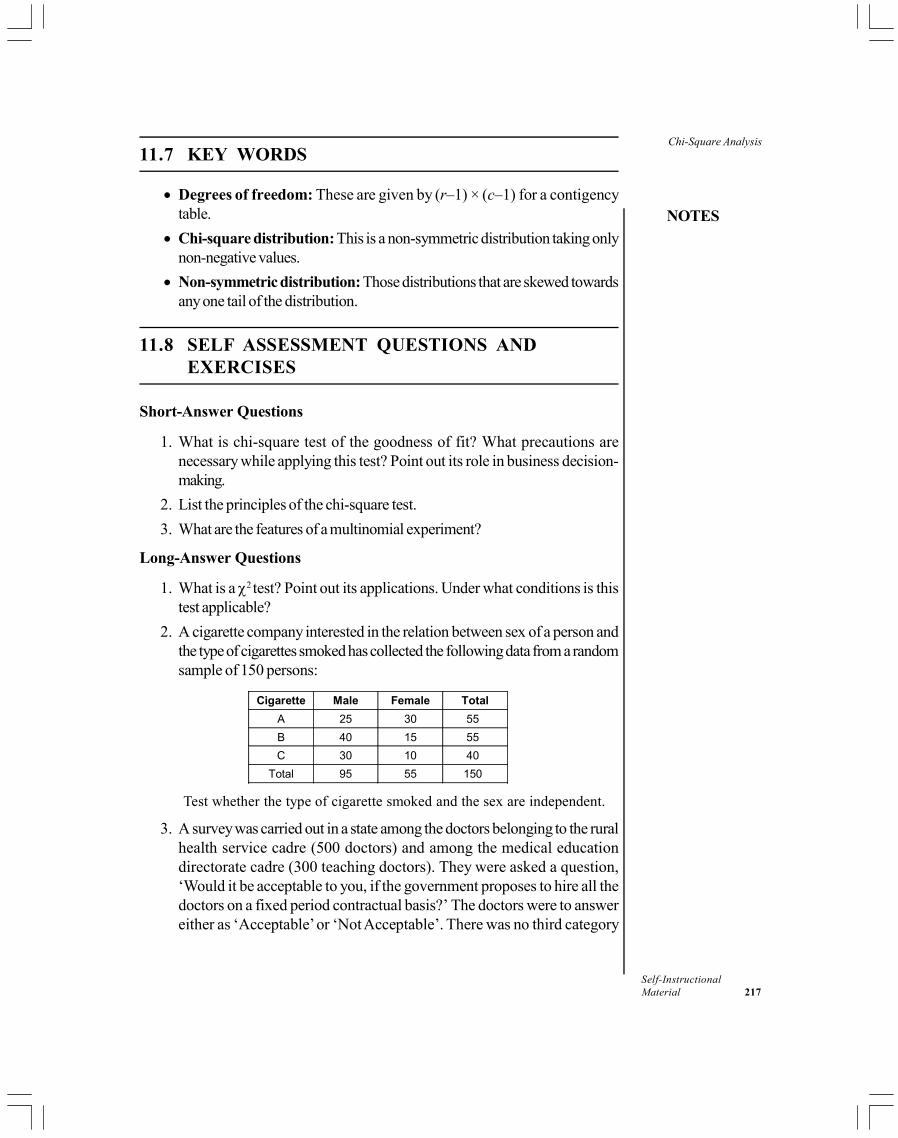
NOTES
Self-InstructionalMaterial 217
Chi-Square Analysis11.7 KEY WORDS
Degrees of freedom: These are given by (r–1) × (c–1) for a contigencytable.
Chi-square distribution: This is a non-symmetric distribution taking onlynon-negative values.
Non-symmetric distribution: Those distributions that are skewed towardsany one tail of the distribution.
11.8 SELF ASSESSMENT QUESTIONS ANDEXERCISES
Short-Answer Questions
1. What is chi-square test of the goodness of fit? What precautions arenecessary while applying this test? Point out its role in business decision-making.
2. List the principles of the chi-square test.
3. What are the features of a multinomial experiment?
Long-Answer Questions
1. What is a 2 test? Point out its applications. Under what conditions is thistest applicable?
2. A cigarette company interested in the relation between sex of a person andthe type of cigarettes smoked has collected the following data from a randomsample of 150 persons:
Cigarette Male Female Total
A 25 30 55
B 40 15 55
C 30 10 40
Total 95 55 150
Test whether the type of cigarette smoked and the sex are independent.
3. A survey was carried out in a state among the doctors belonging to the ruralhealth service cadre (500 doctors) and among the medical educationdirectorate cadre (300 teaching doctors). They were asked a question,‘Would it be acceptable to you, if the government proposes to hire all thedoctors on a fixed period contractual basis?’ The doctors were to answereither as ‘Acceptable’ or ‘Not Acceptable’. There was no third category

Chi-Square Analysis
NOTES
Self-Instructional218 Material
‘Undecided’. The following was the data compiled in a cross-tabulatedformat:
Doctors Acceptable Not Acceptable Total
Rural Cadre 195 305 500
Teaching Cadre 140 160 300
Total 335 465 800
Test an appropriate hypothesis using a 5 per cent level of significance.
4. The following figures show the distribution of the digits in numbers chosenat random from a telephone directory:
Digit 0 1 2 3 4 5 6 7 8 9 Total
Frequency 1,026 1,107 997 966 1,075 933 1,107 972 964 853 10,000
Test whether the digits may be taken to occur equally in the directory.
11.9 FURTHER READINGS
Chawla D and Sondhi N. 2016. Research Methodology: Concepts and Cases,2nd edition. New Delhi: Vikas Publishing House.
Kothari, C R. 1990. Research Methodology: Methods and Techniques. NewDelhi: Wiley Eastern.
Zikmund, William G. 2000. Business Research Methods. Fort Worth: DrydenPress,
NOTES
Self-InstructionalMaterial 219
Analysis of Variance
UNIT 12 ANALYSIS OF VARIANCE
Structure
12.0 Introduction12.1 Objectives12.2 Completely Randomized Design in a One-way ANOVA12.3 Randomized Block Design in Two-way ANOVA12.4 Factorial Design12.5 Answers to Check Your Progress Questions12.6 Summary12.7 Key Words12.8 Self Assessment Questions and Exercises12.9 Further Readings
12.0 INTRODUCTION
In Unit 10, we discussed the test of hypothesis concerning the equality of twopopulation means using both the Z and t tests. However, if there are more thantwo populations, the test for the equality of means could be carried out byconsidering two populations at a time. This would be a very cumbersomeprocedure. One easy way out could be to use the Analysis of Variance (ANOVA)technique. The technique helps in performing this test in one go and, therefore, isconsidered to be important technique of analysis for the researcher. Through thistechnique it is possible to draw inferences whether the samples have been drawnfrom populations having the same mean.
The technique has found applications in the fields of economics, psychology,sociology, business and industry. It becomes handy in situations where we want tocompare the means of more than two populations. Some examples could be tocompare:
the mean cholesterol content of various diet foods
the average mileage of, say, five automobiles
the average telephone bill of households belonging to four different incomegroups and so on.
R A Fisher developed the theory concerning ANOVA. The basic principleunderlying the technique is that the total variation in the dependent variable isbroken into two parts—one which can be attributed to some specific causes andthe other that may be attributed to chance. The one which is attributed to thespecific causes is called the variation between samples and the one which is attributedto chance is termed as the variation within samples. Therefore, in ANOVA, thetotal variance may be decomposed into various components corresponding to thesources of the variation.
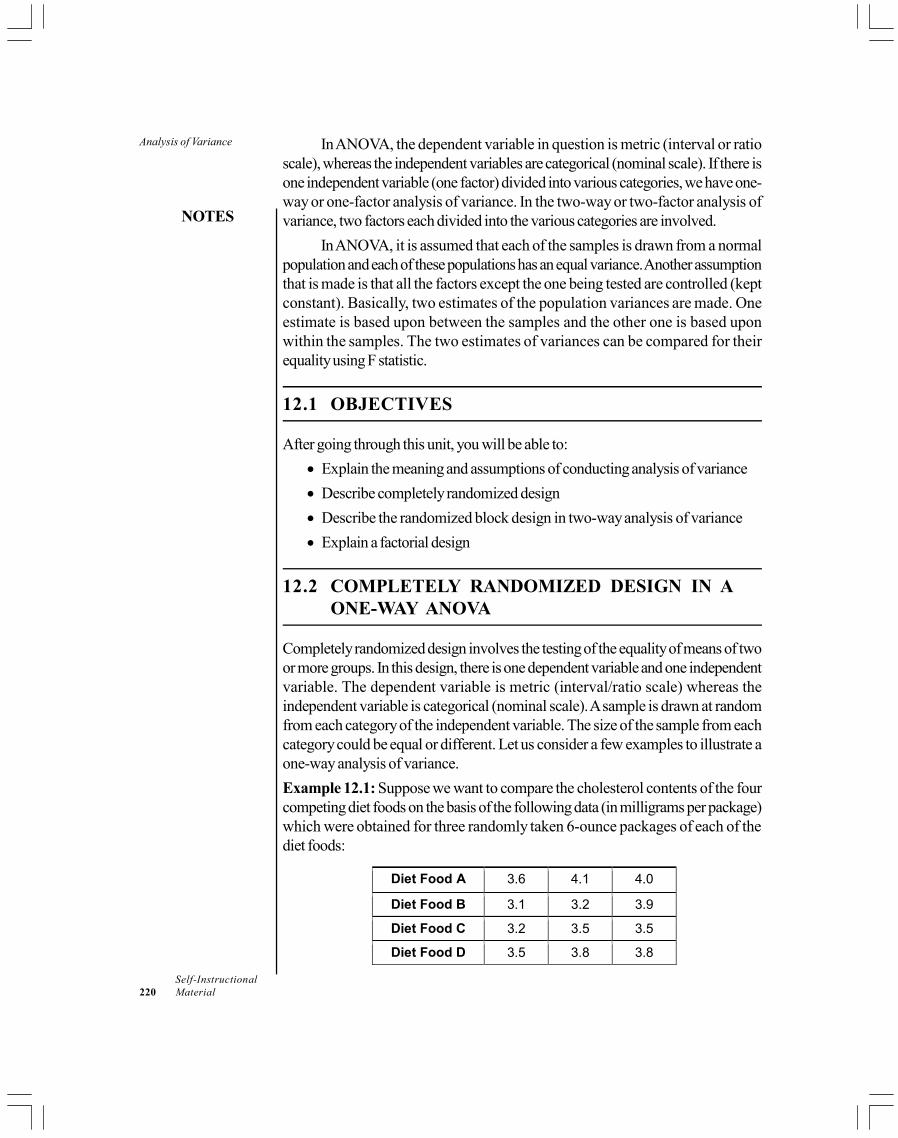
Analysis of Variance
NOTES
Self-Instructional220 Material
In ANOVA, the dependent variable in question is metric (interval or ratioscale), whereas the independent variables are categorical (nominal scale). If there isone independent variable (one factor) divided into various categories, we have one-way or one-factor analysis of variance. In the two-way or two-factor analysis ofvariance, two factors each divided into the various categories are involved.
In ANOVA, it is assumed that each of the samples is drawn from a normalpopulation and each of these populations has an equal variance. Another assumptionthat is made is that all the factors except the one being tested are controlled (keptconstant). Basically, two estimates of the population variances are made. Oneestimate is based upon between the samples and the other one is based uponwithin the samples. The two estimates of variances can be compared for theirequality using F statistic.
12.1 OBJECTIVES
After going through this unit, you will be able to:
Explain the meaning and assumptions of conducting analysis of variance
Describe completely randomized design
Describe the randomized block design in two-way analysis of variance
Explain a factorial design
12.2 COMPLETELY RANDOMIZED DESIGN IN AONE-WAY ANOVA
Completely randomized design involves the testing of the equality of means of twoor more groups. In this design, there is one dependent variable and one independentvariable. The dependent variable is metric (interval/ratio scale) whereas theindependent variable is categorical (nominal scale). A sample is drawn at randomfrom each category of the independent variable. The size of the sample from eachcategory could be equal or different. Let us consider a few examples to illustrate aone-way analysis of variance.
Example 12.1: Suppose we want to compare the cholesterol contents of the fourcompeting diet foods on the basis of the following data (in milligrams per package)which were obtained for three randomly taken 6-ounce packages of each of thediet foods:
Diet Food A 3.6 4.1 4.0
Diet Food B 3.1 3.2 3.9
Diet Food C 3.2 3.5 3.5
Diet Food D 3.5 3.8 3.8

NOTES
Self-InstructionalMaterial 221
Analysis of VarianceWe want to test whether the difference among the sample means can beattributed to chance at the 5 per cent level of significance.
Solution: As explained earlier, the total variation in the data set can be expressedas a sum of the variations that can be attributed to specific sources (in this example,the various diet foods) plus the one which is attributed due to chance. The totalvariation in the data set is called the total sum of squares (TSS) and is computedas:
TSS = 2 2
1 1
1k n
iji j
xkn
T
Where, (i = 1, ... k and j = 1, 2,....n)
xij
= the jth observation of the ith sample (diet food)
T••
= Grand total of all the data
k = 4 (Number of diet foods)
n = 3 (number of observations in each sample)
The term 21T
kn is referred to as the correction factor. The variation between
the sample means which is attributed to specific sources or causes is referred to asthe treatment sum of squares (TrSS). This is computed using the following formula:
TrSS = 2 2
1
1 1k
ii
T Tn kn
Where, iT = Total of observations for the ith treatment.
The variation within the sample, which is attributed to chance, is referred toas the error sum of squares (SSE). This could be computed by subtracting thetreatment sum of squares from the total sum of squares. This is shown as:
SSE = TSS – TrSS
= 2 2 2 2
1 1 1
1 1 1k n k
ij ii j i
x T T Tkn n kn
In order to test the null hypothesis,
H0 :
A =
B =
C =
D
against the alternative hypothesis
H1 : At least two means are not equal
(Treatment means are not equal)
We test the equality of TrSS with SSE. The necessary workings requiredfor this are presented in Table 12.1, which is called one-way analysis of the variancetable. The first column of the table indicates the sources of variation. The secondcolumn lists the degrees of freedom. There are k treatments; therefore the

Analysis of Variance
NOTES
Self-Instructional222 Material
corresponding degrees of freedom are k – 1. Similarly, the total number ofobservations in the data set is kn and therefore, the corresponding degrees offreedom are kn – 1. The degrees of freedom for errors are obtained by subtractingfrom the total degrees of freedom, the degrees of freedom corresponding to thetreatment, i.e., (kn – 1) – (k – 1) = k (n – 1). The third column lists the sum ofsquares due to the various sources of variation. The fourth column lists the meansquare due to treatment MSTr = (TrSS/k–1) and the mean square due to errorMSE = (SSE/k(n–1)) obtaining by dividing the corresponding sum of squares bytheir degrees of freedom. The last column indicates the F statistic given as the ratioof the two mean squares with k–1 degrees of freedom for the numerator and k(n–1) degrees of freedom for the denominator. For a given level of significance, thecomputed F statistic is compared with the table value of F with k–1 degrees offreedom in the numerator and k(n–1) degrees of the freedom for the denominator.If the computed F value is greater than the tabulated F value, the null hypothesis isrejected.
Table 12.1 One-way ANOVA
Sources of Variation
Degrees of Freedom
Sum of Squares
Mean Square 1
( 1)
k
k nF
Treatments (Diet food)
k – 1 TrSS
1
TrSSMSTr
k
MSTr
MSE
Error k(n – 1) SSE
( 1)
SSEMSE
k n
Total kn – 1 TSS
The required computations in case of Example 12.1 are given below:
k = 4,n = 3
T•• = 3.6 + 4.1 + 4.0 + 3.1 + 3.2 + 3.9 + 3.2 + 3.5 + 3.5 + 3.5 + 3.8 + 3.8 = 43.2
T1• = 3.6 + 4.1 + 4.0 = 11.7
T2• = 3.1 + 3.2 + 3.9 = 10.2
T3• = 3.2 + 3.5 + 3.5 = 10.2
T4• = 3.5 + 3.8 + 3.8 = 11.1
4 32
1ij
i j j
x
= (3.6)2 + (4.1)2 + (4.0)2 + (3.1)2 + (3.2)2 + (3.9)2 + (3.2)2 + (3.5)2 + (3.5)2 + (3.5)2 + (3.8)2 + (3.8)2
= 156.70
TSS = 4 3
2 2 2
1
1 1156.70 (43.2) 1.18
12iji j j
x Tkn
TrSS =4
2 2
1
1 1i
i
T Tn kn
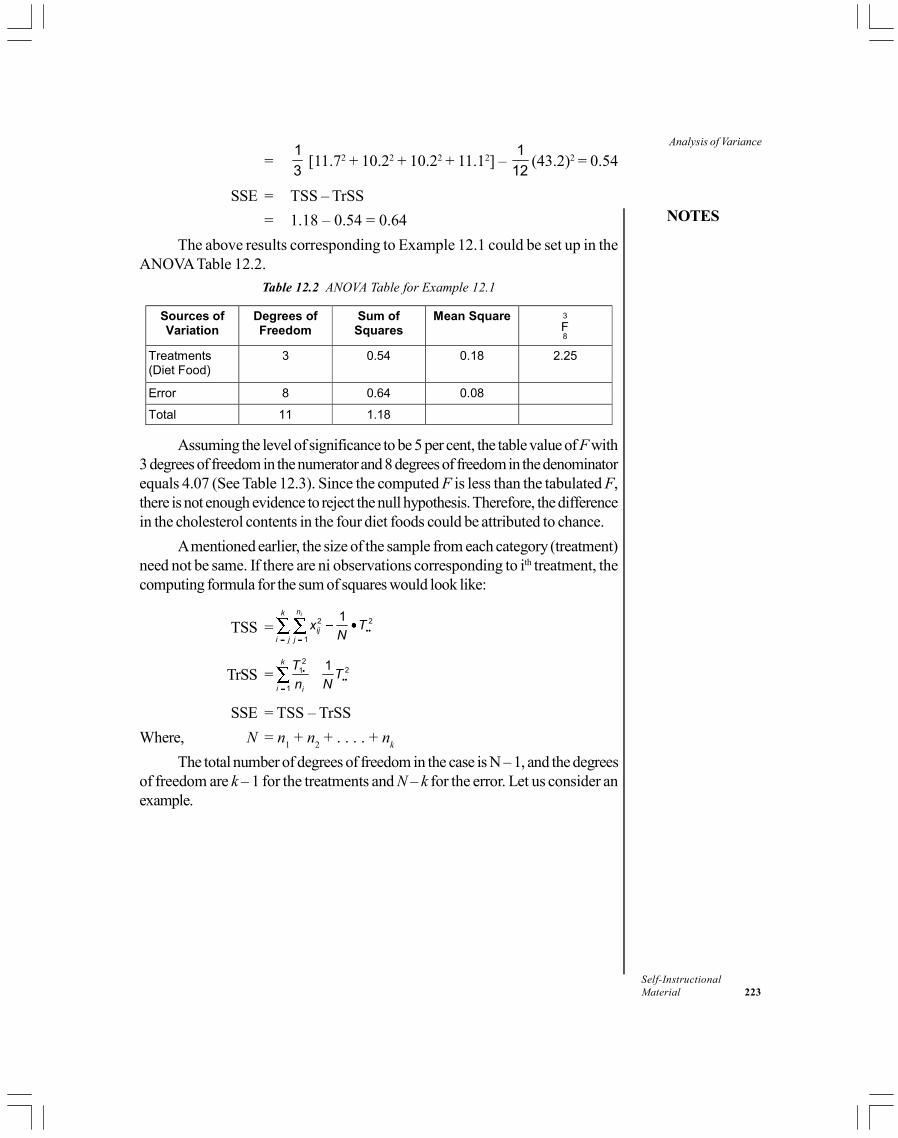
NOTES
Self-InstructionalMaterial 223
Analysis of Variance
=1
3 [11.72 + 10.22 + 10.22 + 11.12] –
1
12(43.2)2 = 0.54
SSE = TSS – TrSS
= 1.18 – 0.54 = 0.64
The above results corresponding to Example 12.1 could be set up in theANOVA Table 12.2.
Table 12.2 ANOVA Table for Example 12.1
Sources of Variation
Degrees of Freedom
Sum of Squares
Mean Square 3
8F
Treatments (Diet Food)
3 0.54 0.18 2.25
Error 8 0.64 0.08
Total 11 1.18
Assuming the level of significance to be 5 per cent, the table value of F with
3 degrees of freedom in the numerator and 8 degrees of freedom in the denominatorequals 4.07 (See Table 12.3). Since the computed F is less than the tabulated F,there is not enough evidence to reject the null hypothesis. Therefore, the differencein the cholesterol contents in the four diet foods could be attributed to chance.
A mentioned earlier, the size of the sample from each category (treatment)need not be same. If there are ni observations corresponding to ith treatment, thecomputing formula for the sum of squares would look like:
TSS =2 2
1
1ink
iji j j
x TN
TrSS =2
21
1
1k
i i
TT
n N
SSE = TSS – TrSS
Where, N = n1 + n
2 + . . . . + n
k
The total number of degrees of freedom in the case is N – 1, and the degreesof freedom are k – 1 for the treatments and N – k for the error. Let us consider anexample.

Analysis of Variance
NOTES
Self-Instructional224 Material
Table 12.3(a) Significance points of the variance-ratio ‘F’ 5 per cent points of F
v1
v2 1 2 3 4 5 6 8 12 24
1 161.4 199.5 215.7 224.6 230.2 234.0 238.9 243.9 249.0 254.3
2 18.51 19.00 19.16 19.25 19.30 19.33 19.37 19.41 19.45 19.50
3 10.13 9.55 9.28 9.12 9.01 8.94 8.84 8.74 8.64 8.53
4 7.71 6.94 6.59 6.39 6.26 6.16 6.04 5.91 5.77 5.63
5 6.61 5.79 5.41 5.19 5.05 4.95 4.82 4.68 4.53 4.36
6 5.99 5.14 4.76 4.53 4.39 4.28 4.15 4.00 3.84 3.67
7 5.59 4.74 4.35 4.12 3.97 3.87 3.73 3.57 3.41 3.23
8 5.32 4.46 4.07 3.84 3.69 3.58 3.44 3.28 3.12 3.93
9 5.12 4.26 3.86 3.63 3.48 3.37 3.23 3.07 2.90 2.71
10 4.96 4.10 3.71 3.48 3.33 3.22 3.07 2.91 2.74 2.54
11 4.84 3.98 3.59 3.36 3.20 3.09 2.95 2.79 2.61 2.40
12 4.75 3.88 3.49 3.26 3.11 3.00 2.85 2.69 2.50 2.30
13 4.67 3.80 3.41 3.18 3.02 3.92 2.77 2.60 2.42 2.21
14 4.60 3.74 3.34 3.11 2.96 2.85 2.70 2.53 2.35 2.13
15 4.54 3.68 3.29 3.06 2.90 2.79 2.64 2.48 2.29 2.07
16 4.49 3.63 3.24 3.01 2.85 2.74 2.59 2.42 2.24 2.01
17 4.45 3.59 3.20 2.96 2.81 3.70 2.55 2.38 2.19 1.96
18 4.41 3.55 3.16 2.93 2.77 2.66 2.51 2.34 2.15 1.92
19 4.38 3.52 3.13 2.90 2.74 2.63 2.48 2.31 2.11 1.88
20 4.35 3.49 3.10 2.87 2.71 2.60 2.45 2.28 2.08 1.84
21 4.32 3.47 3.07 2.84 2.68 2.57 2.42 2.25 2.05 1.81
22 4.30 3.44 3.05 2.82 2.66 2.55 2.40 2.23 2.03 1.78
23 4.28 3.42 3.03 2.80 2.64 2.53 2.38 2.20 2.00 1.76
24 4.26 3.40 3.01 2.78 2.62 2.51 2.36 2.18 1.98 1.73
25 4.24 3.38 2.99 2.76 2.60 2.49 2.34 2.16 1.96 1.71
26 4.22 3.37 2.98 2.74 2.59 2.47 2.32 2.15 1.95 1.69
27 4.21 3.35 2.96 2.73 2.57 2.46 2.30 2.13 1.93 1.67
28 4.20 3.34 2.95 2.71 2.56 2.44 2.29 2.12 1.91 1.65
29 4.18 3.33 2.93 2.70 2.54 2.43 2.28 2.10 1.90 1.64
30 4.17 3.32 2.92 2.69 2.53 2.42 2 .27 2.09 1.89 1.62
40 4.08 3.23 2.84 2.61 2.45 2.34 2.18 2.00 1.79 1.51
60 4.00 3.15 2.76 2.52 2.37 2.25 2.10 1.92 1.70 1.89
120 2.92 3.07 2.68 2.45 2.29 2.17 2.02 1.83 1.61 1.25
3.84 2.99 2.60 2.37 2.21 2.09 1.94 1.75 1.52 1.00
v1 = Degrees of freedom for greater variance.
v2 = Degrees of freedom for smaller variance.
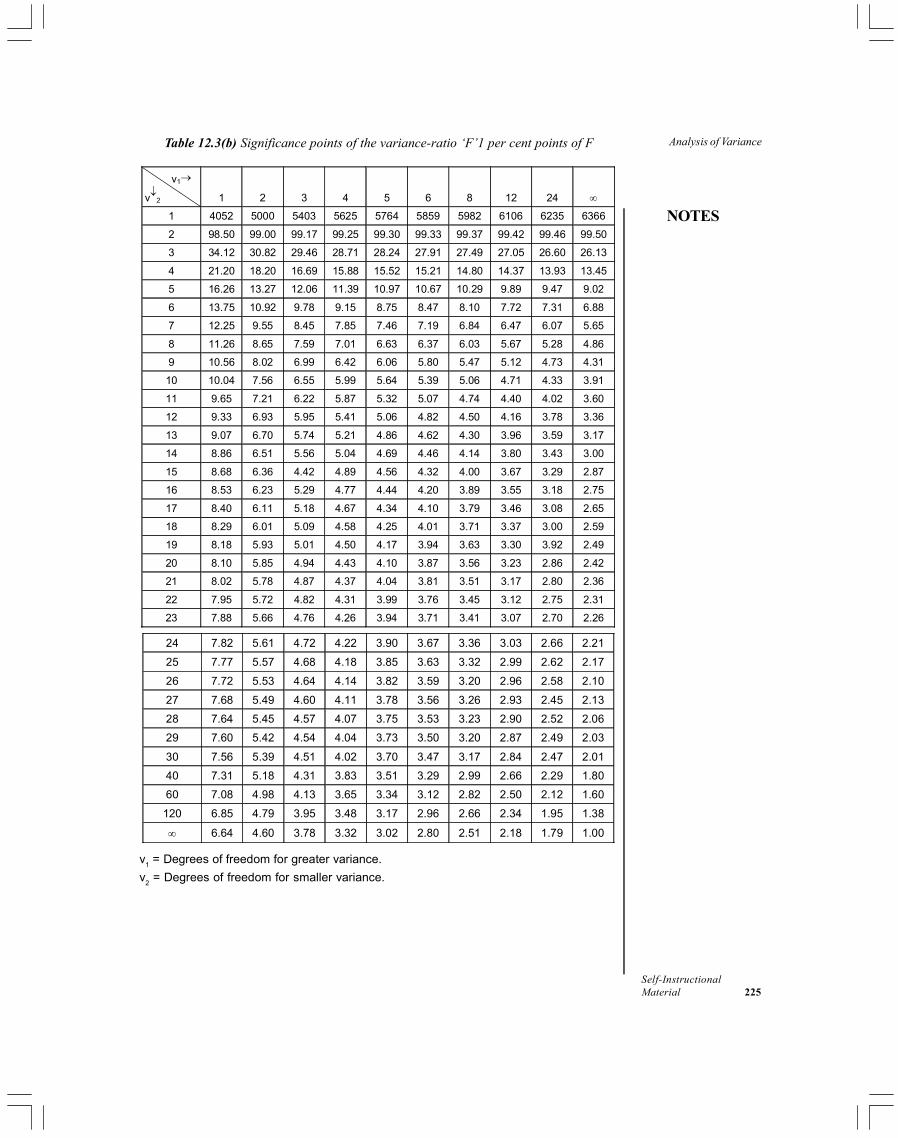
NOTES
Self-InstructionalMaterial 225
Analysis of VarianceTable 12.3(b) Significance points of the variance-ratio ‘F’1 per cent points of F
v1
v2 1 2 3 4 5 6 8 12 24
1 4052 5000 5403 5625 5764 5859 5982 6106 6235 6366
2 98.50 99.00 99.17 99.25 99.30 99.33 99.37 99.42 99.46 99.50
3 34.12 30.82 29.46 28.71 28.24 27.91 27.49 27.05 26.60 26.13
4 21.20 18.20 16.69 15.88 15.52 15.21 14.80 14.37 13.93 13.45
5 16.26 13.27 12.06 11.39 10.97 10.67 10.29 9.89 9.47 9.02
6 13.75 10.92 9.78 9.15 8.75 8.47 8.10 7.72 7.31 6.88
7 12.25 9.55 8.45 7.85 7.46 7.19 6.84 6.47 6.07 5.65
8 11.26 8.65 7.59 7.01 6.63 6.37 6.03 5.67 5.28 4.86
9 10.56 8.02 6.99 6.42 6.06 5.80 5.47 5.12 4.73 4.31
10 10.04 7.56 6.55 5.99 5.64 5.39 5.06 4.71 4.33 3.91
11 9.65 7.21 6.22 5.87 5.32 5.07 4.74 4.40 4.02 3.60
12 9.33 6.93 5.95 5.41 5.06 4.82 4.50 4.16 3.78 3.36
13 9.07 6.70 5.74 5.21 4.86 4.62 4.30 3.96 3.59 3.17
14 8.86 6.51 5.56 5.04 4.69 4.46 4.14 3.80 3.43 3.00
15 8.68 6.36 4.42 4.89 4.56 4.32 4.00 3.67 3.29 2.87
16 8.53 6.23 5.29 4.77 4.44 4.20 3.89 3.55 3.18 2.75
17 8.40 6.11 5.18 4.67 4.34 4.10 3.79 3.46 3.08 2.65
18 8.29 6.01 5.09 4.58 4.25 4.01 3.71 3.37 3.00 2.59
19 8.18 5.93 5.01 4.50 4.17 3.94 3.63 3.30 3.92 2.49
20 8.10 5.85 4.94 4.43 4.10 3.87 3.56 3.23 2.86 2.42
21 8.02 5.78 4.87 4.37 4.04 3.81 3.51 3.17 2.80 2.36
22 7.95 5.72 4.82 4.31 3.99 3.76 3.45 3.12 2.75 2.31
23 7.88 5.66 4.76 4.26 3.94 3.71 3.41 3.07 2.70 2.26
24 7.82 5.61 4.72 4.22 3.90 3.67 3.36 3.03 2.66 2.21
25 7.77 5.57 4.68 4.18 3.85 3.63 3.32 2.99 2.62 2.17
26 7.72 5.53 4.64 4.14 3.82 3.59 3.20 2.96 2.58 2.10
27 7.68 5.49 4.60 4.11 3.78 3.56 3.26 2.93 2.45 2.13
28 7.64 5.45 4.57 4.07 3.75 3.53 3.23 2.90 2.52 2.06
29 7.60 5.42 4.54 4.04 3.73 3.50 3.20 2.87 2.49 2.03
30 7.56 5.39 4.51 4.02 3.70 3.47 3.17 2.84 2.47 2.01
40 7.31 5.18 4.31 3.83 3.51 3.29 2.99 2.66 2.29 1.80
60 7.08 4.98 4.13 3.65 3.34 3.12 2.82 2.50 2.12 1.60
120 6.85 4.79 3.95 3.48 3.17 2.96 2.66 2.34 1.95 1.38
6.64 4.60 3.78 3.32 3.02 2.80 2.51 2.18 1.79 1.00
v
1 = Degrees of freedom for greater variance.
v2 = Degrees of freedom for smaller variance.

Analysis of Variance
NOTES
Self-Instructional226 Material
Example 12.2: The following are the number of kilometres/litre which a test driverwith three different types of cars has obtained randomly on different occasions.
Car 1 15 14.5 14.8 14.9
Car 2 13 12.5 13.6 13.8 14
Car 3 12.8 13.2 12.7 12.6 12.9 13
Using a 5 per cent level of significance, perform a one-way ANOVA toexamine the hypothesis that the difference in the average mileage in the three typesof cars can be attributed to chance.
Solution:
H0 :
1 =
2 =
3 (Average mileage in the three types of cars is the same.)
H1 : At least two types of cars do not have the same mileage.
K = 3, n1 = 4, n
2 = 5, n
3 = 6
N = n1 + n
2 + n
3 = 4 + 5 + 6 = 15
T•• = 15 + 14.5 + 14.8 + 14.9 + 13 + 12.5 + 13.6 + 13.8 + 14 + 12.8 + 13.2 + 12.7 + 12.6 + 12.9 + 13
= 203.3
T1• = 15 + 14.5 + 14.8 + 14.9 = 59.2
T2• = 13 + 12.5 + 13.6 + 13.8 + 14 = 66.9
T3• = 12.8 + 13.2 + 12.7 + 12.6 + 12.9 + 13 = 77.2
3 82
1ij
i j j
x
= (15)2 + (14.5)2 + (14.8)2 + (14.9)2 + (13)2 + (12.5)2 + (13.6)2 + (13.8)2 + (14)2 + (12.8)2 + (13.2)2 + (12.7)2 + (12.6)2 + (12.9)2 + (13)2
= 2766.49
TSS =3
2 2
1 1
1ni
iji j
x TN
= 2766.49 – 1
15 (203.3)2
= 2766.49 – 2755.393= 11.097
TrSS =23
2
1
1i
i i
TT
n N
=2 2 2
259.2 66.9 77.2 1(203.3)
4 5 6 15

NOTES
Self-InstructionalMaterial 227
Analysis of Variance= 2764.5886 – 2755.3926= 9.196
SSE = TSS – TrSS= 11.097 – 9.196= 1.901
The ANOVA table in the case of Example 12.2 can be set up as shown inTable 12.4.
Table 12.4 One-way ANOVA for Example 12.2
Sources of Variation
Degrees of Freedom
Sum of Squares
Mean Square 212F
Treatments (Between groups)
2 9.196 4.598 29.02
Error (within groups) 12 1.901 0.158
Total 14 11.097
The computed F statistics equals 29.02. The table value of F with 2 degreesof freedom in the numerator and 12 degrees of freedom in the denominator at a 5per cent level of significance is given by 3.89. As the computed F statistic isgreater than the table F value, the null hypothesis is rejected. Therefore, the averagemileage in these types of cars is statistically different.
Check Your Progress
1. What is the nature of the dependent and independent variables in acompletely randomized design?
2. What does the fourth column of a one-way analysis of the variance tabledenote?
12.3 RANDOMIZED BLOCK DESIGN IN TWO-WAYANOVA
In Example 12.1, it could not be shown that there really is a significant differencein the average cholesterol content of the four diet foods. The results were notstatistically different because there was a considerable difference in the valueswithin each of the samples resulting in a large experimental error. However, if wehave additional information that each of the value was randomly measured in thethree different laboratories in such a way that the first value of each sample camefrom laboratory 1, the second value from laboratory 2, and the third value fromlaboratory 3 (the random assignment of test units to labs). In such a case, a two-way analysis of variance is suggested. We had earlier partitioned the total sum of
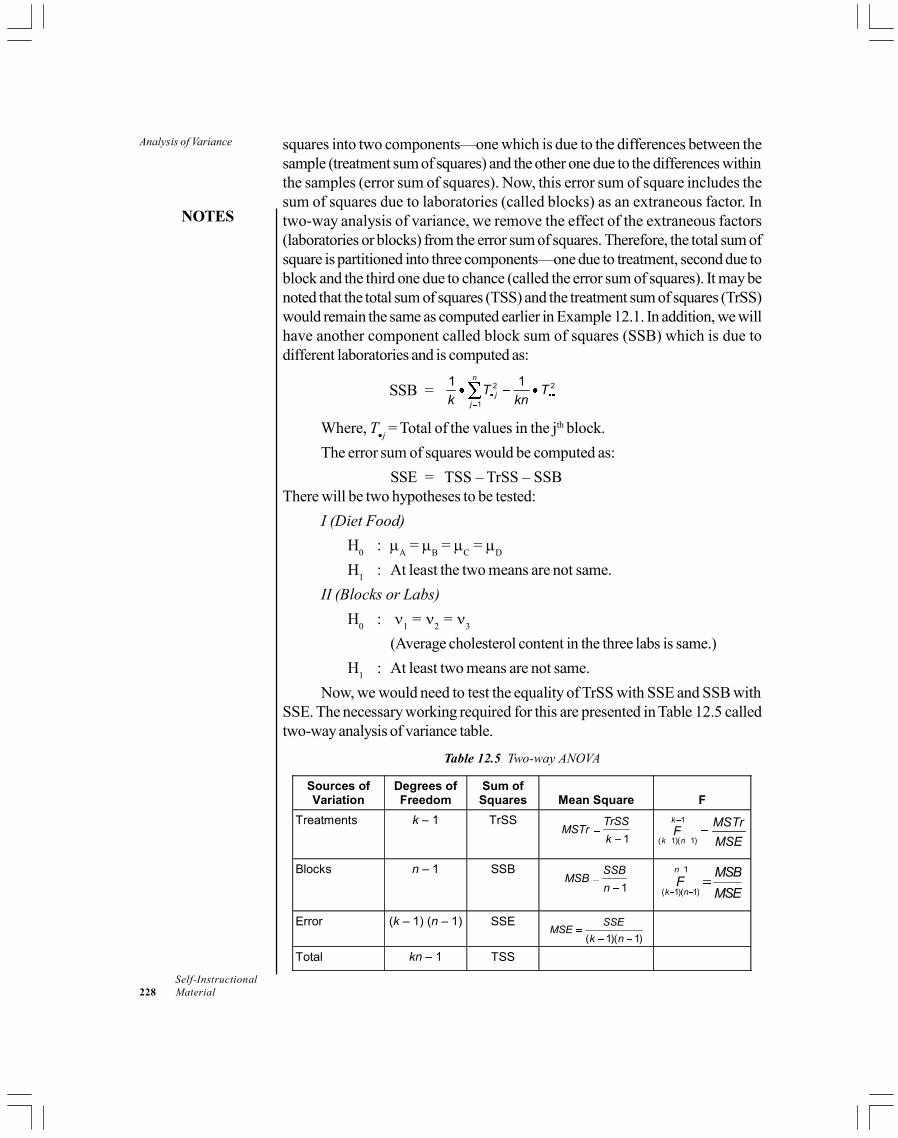
Analysis of Variance
NOTES
Self-Instructional228 Material
squares into two components—one which is due to the differences between thesample (treatment sum of squares) and the other one due to the differences withinthe samples (error sum of squares). Now, this error sum of square includes thesum of squares due to laboratories (called blocks) as an extraneous factor. Intwo-way analysis of variance, we remove the effect of the extraneous factors(laboratories or blocks) from the error sum of squares. Therefore, the total sum ofsquare is partitioned into three components—one due to treatment, second due toblock and the third one due to chance (called the error sum of squares). It may benoted that the total sum of squares (TSS) and the treatment sum of squares (TrSS)would remain the same as computed earlier in Example 12.1. In addition, we willhave another component called block sum of squares (SSB) which is due todifferent laboratories and is computed as:
SSB = 2 2
1
1 1n
jj
T Tk kn
Where, Tj = Total of the values in the jth block.
The error sum of squares would be computed as:
SSE = TSS – TrSS – SSBThere will be two hypotheses to be tested:
I (Diet Food)
H0
: A =
B =
C =
D
H1
: At least the two means are not same.
II (Blocks or Labs)
H0
: 1 =
2 =
3
(Average cholesterol content in the three labs is same.)
H1
: At least two means are not same.
Now, we would need to test the equality of TrSS with SSE and SSB withSSE. The necessary working required for this are presented in Table 12.5 calledtwo-way analysis of variance table.
Table 12.5 Two-way ANOVA
Sources of Variation
Degrees of Freedom
Sum of Squares Mean Square F
Treatments k – 1 TrSS
1
TrSSMSTr
k
1
( 1)( 1)
k
k n
MSTrF
MSE
Blocks n – 1 SSB
1
SSBMSB
n
1
( 1)( 1)
n
k n
MSBF
MSE
Error (k – 1) (n – 1) SSE ( 1)( 1)
SSEMSE
k n
Total kn – 1 TSS

NOTES
Self-InstructionalMaterial 229
Analysis of VarianceThe various columns of the above table are filled up in the same fashion aswas done for Table 12.1. Example 12.1 can be rewritten as Example 12.3.
Example 12.3: Suppose in Example 12.1, the measurement of the cholesterolcontent was performed in three different laboratories. The first value of eachsample came from one laboratory, the second value came from anotherlaboratory, and the third value came from a third laboratory. The data is presentedbelow:
Laboratory Diet Food One Two Three
Diet Food A 3.6 4.1 4.0
Diet Food B 3.1 3.2 3.9
Diet Food C 3.2 3.5 3.5
Diet Food D 3.5 3.8 3.8
Perform a two-way ANOVA using a 0.05 level of significance.
Solution: There will be two hypotheses to be tested in this case; one correspondingto the treatment (diet food) and the other corresponding to laboratories (blocks).These are listed below:
I (Diet Food)
H0
: A =
B =
C =
D (Average cholesterol content of the four diet
foods is same.)
H1
: At least two means are not same.
II (Blocks or labs)
H0
: 1 =
2 =
3 (Average cholesterol content in the three labs is
same.)
H1
: At least two means are not same.
The TSS and TrSS here would be the same as computed in Example 12.1. Asmentioned earlier, the block sum of square would be required in this problemusing the formula:
SSB = 2 2
1
1 1n
jj
T Tk kn
Where, Tj = Total of the values in the jth block.
The error sum of squares would be obtained as
SSE = TSS – TrSS – SSB
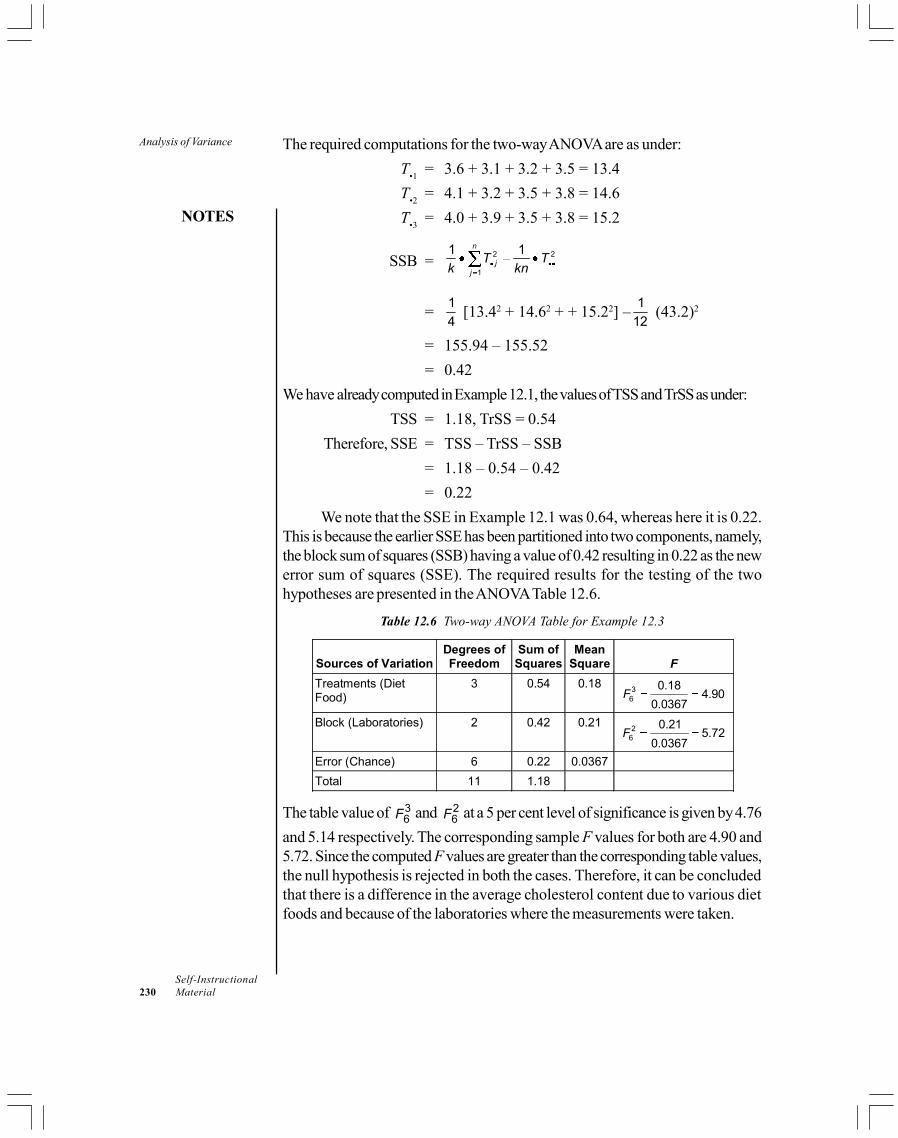
Analysis of Variance
NOTES
Self-Instructional230 Material
The required computations for the two-way ANOVA are as under:
T•1
= 3.6 + 3.1 + 3.2 + 3.5 = 13.4
T•2
= 4.1 + 3.2 + 3.5 + 3.8 = 14.6
T•3
= 4.0 + 3.9 + 3.5 + 3.8 = 15.2
SSB =2 2
1
1 1n
jj
T Tk kn
=1
4 [13.42 + 14.62 + + 15.22] –
1
12 (43.2)2
= 155.94 – 155.52
= 0.42
We have already computed in Example 12.1, the values of TSS and TrSS as under:
TSS = 1.18, TrSS = 0.54
Therefore, SSE = TSS – TrSS – SSB
= 1.18 – 0.54 – 0.42
= 0.22
We note that the SSE in Example 12.1 was 0.64, whereas here it is 0.22.This is because the earlier SSE has been partitioned into two components, namely,the block sum of squares (SSB) having a value of 0.42 resulting in 0.22 as the newerror sum of squares (SSE). The required results for the testing of the twohypotheses are presented in the ANOVA Table 12.6.
Table 12.6 Two-way ANOVA Table for Example 12.3
Sources of Variation Degrees of Freedom
Sum of Squares
Mean Square F
Treatments (Diet Food)
3 0.54 0.18 3
6
0.184.90
0.0367F
Block (Laboratories) 2 0.42 0.21 2
6
0.215.72
0.0367F
Error (Chance) 6 0.22 0.0367
Total 11 1.18
The table value of 36F and 2
6F at a 5 per cent level of significance is given by 4.76
and 5.14 respectively. The corresponding sample F values for both are 4.90 and5.72. Since the computed F values are greater than the corresponding table values,the null hypothesis is rejected in both the cases. Therefore, it can be concludedthat there is a difference in the average cholesterol content due to various dietfoods and because of the laboratories where the measurements were taken.

NOTES
Self-InstructionalMaterial 231
Analysis of Variance
Check Your Progress
3. What are the three components under which the total sum of square ispartitioned?
4. Which variable’s effect is removed in a randomized block design?
12.4 FACTORIAL DESIGN
In factorial design, the dependent variable is the interval or the ratio scale andthere are two or more independent variables which are nominal scale. In the factorialdesign, it is possible to examine the interaction between the variables. If there aretwo independent variables each having three cells, there would be a total of nineinteractions. The details on this are already explained in Unit 3 (Research Design).The main advantage of factorial design over randomized block design is that it ispossible to measure the main effects as well as the interaction effects of two ormore independent variables at various levels. Further, the randomized block designhas only two independent variables whereas, factorial design can take care ofmore than two independent variables. Let us consider an illustration to explainfactorial design.
It is generally observed that there are differences in the pay packages offeredto fresh MBA graduates. The variations could be either due to the type of businessschool where they have studied or it could be due to their area of specialization.The variation can also be due to an interaction between the business school andthe area of specialization. For example, the specialization in finance at one businessschool might fetch a better package. All these presumptions could be tested withthe help of the factorial design explained with the help of the following example.
Example 12.4: The following data refers to the salary package (in lakhs) offeredto MBA graduates with different specializations and having studied at four differentbusiness schools. For the sake of simplification, only two students are taken foreach interaction between the institute and field of specialization.
Business School Specialization
I II III IV
6 4 8 6 Marketing
5 5 6 4
7 6 6 9 Finance
6 7 7 8
8 5 10 9 Operations
7 5 9 10

Analysis of Variance
NOTES
Self-Instructional232 Material
Test the hypothesis (i) whether the difference between the pay packagesoffered can be attributed to chance (ii) average pay packages by all specializationsare equal. (iii) the average pay package for 12 interactions are equal.
You may use a 5 per cent level of significance.
Solution: The following set of hypotheses is required to be tested.
Business schools:
H0
: Average pay package for all the institutions are equal.
H1
: Average pay package for all the institutions are not equal
Specialization:
H0
: Average pay package for all the specializations are equal.
H1
: Average pay package for all the specializations are not equal
Interaction:
H0
: Average pay package for all 12 interactions are equal.
H1
: Average pay package for all 12 interactions are not equal
Let us compute the following:
Correction factor (CF) = 2(Sum of all observations)
Total number of observations
= 2(163) 26569
24 24 = 1107.04
Total sum of squares = (Sum of squares of observations) – CF
= 62 + 42 + 82 + 62 + - - - + 72 + 52 + 92 + 102 – 1107.04
= 1179 – 1107.04
= 71.96
Sum of squares due to specialization (row)/SSR
=2 2 244 56 63
8 8 8 – CF
= 1130.13 – 1107.04
= 23.08
Where,
Sum total for Marketing = 44
Sum total for Finance = 56
Sum total for Operations = 63
Sum of squares due to school (column)/SSC
=2 2 2 239 32 46 46
6 6 6 6 – CF
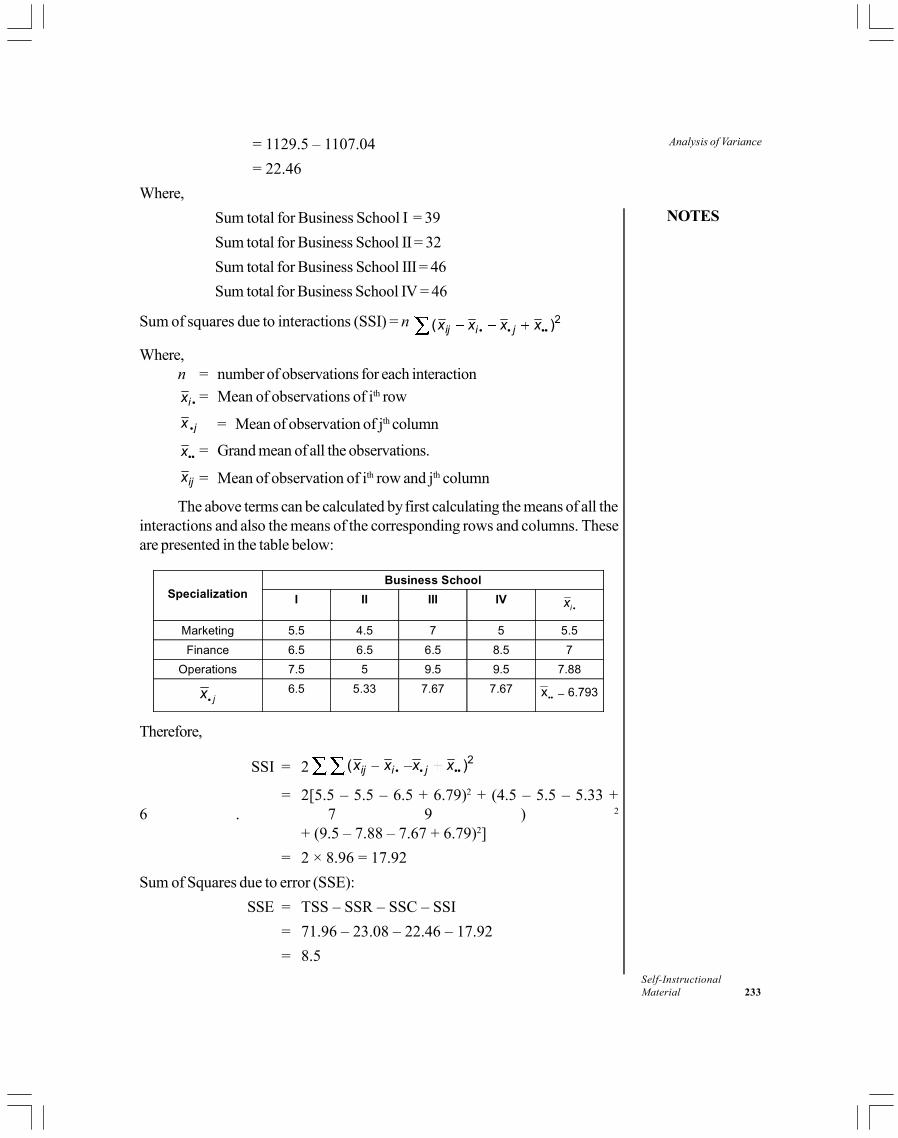
NOTES
Self-InstructionalMaterial 233
Analysis of Variance= 1129.5 – 1107.04
= 22.46
Where,
Sum total for Business School I = 39
Sum total for Business School II = 32
Sum total for Business School III = 46
Sum total for Business School IV = 46
Sum of squares due to interactions (SSI) = n 2( )ij i jx x x x
Where,n = number of observations for each interaction
ix = Mean of observations of ith row
jx = Mean of observation of jth column
x = Grand mean of all the observations.
ijx = Mean of observation of ith row and jth column
The above terms can be calculated by first calculating the means of all theinteractions and also the means of the corresponding rows and columns. Theseare presented in the table below:
Business School Specialization I II III IV
ix
Marketing 5.5 4.5 7 5 5.5
Finance 6.5 6.5 6.5 8.5 7
Operations 7.5 5 9.5 9.5 7.88
jx 6.5 5.33 7.67 7.67 6.793x
Therefore,
SSI = 2 2( )ij i jx x x x
= 2[5.5 – 5.5 – 6.5 + 6.79)2 + (4.5 – 5.5 – 5.33 +6 . 7 9 ) 2
+ (9.5 – 7.88 – 7.67 + 6.79)2]
= 2 × 8.96 = 17.92
Sum of Squares due to error (SSE):
SSE = TSS – SSR – SSC – SSI
= 71.96 – 23.08 – 22.46 – 17.92
= 8.5
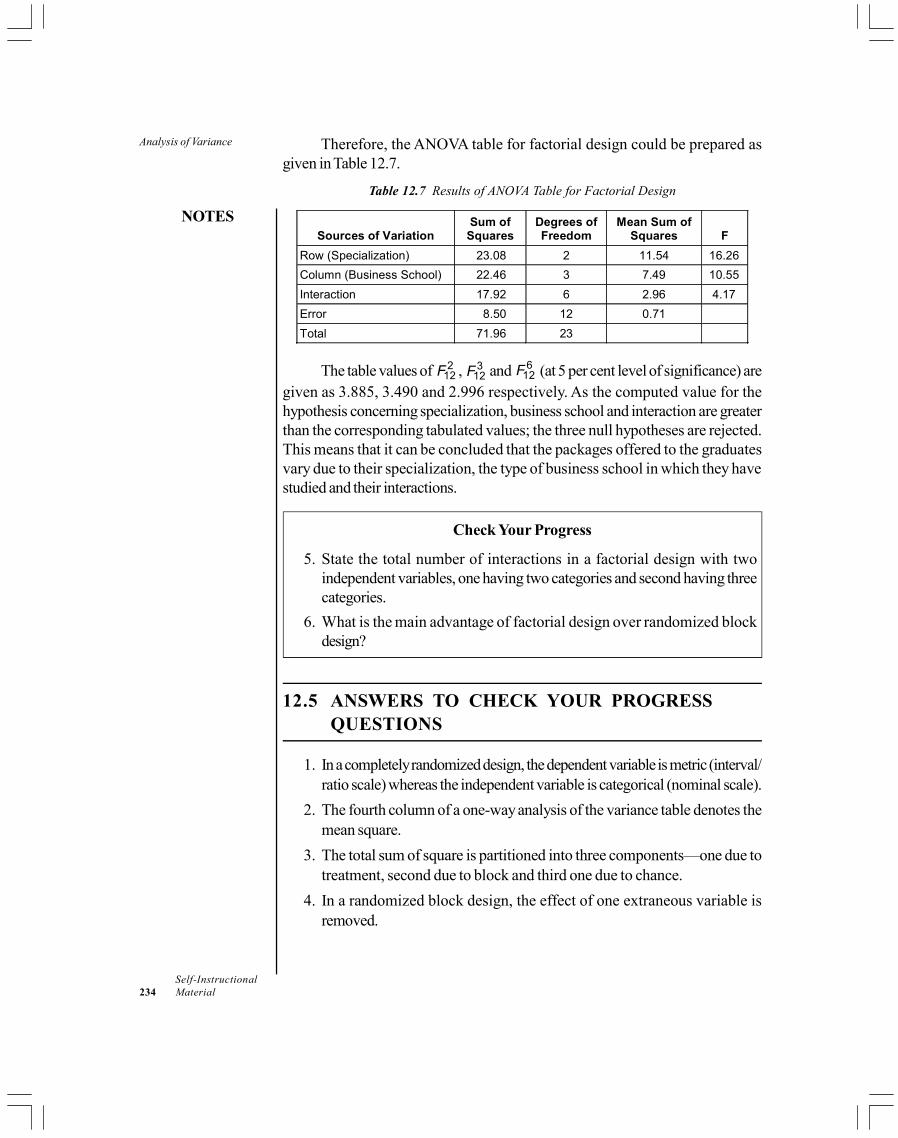
Analysis of Variance
NOTES
Self-Instructional234 Material
Therefore, the ANOVA table for factorial design could be prepared asgiven in Table 12.7.
Table 12.7 Results of ANOVA Table for Factorial Design
Sources of Variation Sum of
Squares Degrees of Freedom
Mean Sum of Squares F
Row (Specialization) 23.08 2 11.54 16.26
Column (Business School) 22.46 3 7.49 10.55
Interaction 17.92 6 2.96 4.17
Error 8.50 12 0.71
Total 71.96 23
The table values of 212F , 3
12F and 6
12F (at 5 per cent level of significance) aregiven as 3.885, 3.490 and 2.996 respectively. As the computed value for thehypothesis concerning specialization, business school and interaction are greaterthan the corresponding tabulated values; the three null hypotheses are rejected.This means that it can be concluded that the packages offered to the graduatesvary due to their specialization, the type of business school in which they havestudied and their interactions.
Check Your Progress
5. State the total number of interactions in a factorial design with twoindependent variables, one having two categories and second having threecategories.
6. What is the main advantage of factorial design over randomized blockdesign?
12.5 ANSWERS TO CHECK YOUR PROGRESSQUESTIONS
1. In a completely randomized design, the dependent variable is metric (interval/ratio scale) whereas the independent variable is categorical (nominal scale).
2. The fourth column of a one-way analysis of the variance table denotes themean square.
3. The total sum of square is partitioned into three components—one due totreatment, second due to block and third one due to chance.
4. In a randomized block design, the effect of one extraneous variable isremoved.

NOTES
Self-InstructionalMaterial 235
Analysis of Variance5. In a factorial design with two independent variables, one having twocategories and second having three categories, the total number of interactionsis six.
6. The main advantage of factorial design over randomized block design isthat it is possible to measure the main effects as well as the interactioneffects of two or more independent variables at various levels.
12.6 SUMMARY
RA Fisher developed the theory of analysis of variance. This techniquecould be used to test the equality of more than two population means in onego. The basic principle underlying the technique is that the total variations inthe dependent variable can be broken into two components—one whichcan be attributed to specific causes and the other one may be attributed tochance. In analysis of variance, the dependent variable is metric, where as,the independent variable is categorical (nominal scale).
The analysis of variance techniques in this unit are illustrated through thecompletely randomized design, randomized block design and factorialdesign.
In a completely randomized design, there is one dependent and oneindependent variable. The dependent variable is metric whereas theindependent variable is categorical. Random samples are drawn from eachcategory of the independent variable. The sample size from each categorycould be same or different.
In the randomized block design, there is one independent variable and oneextraneous factor (block). Both independent variable and extraneous factor(block) are nominal scale variables. The effect of the extraneous factor isremoved from the analysis.
In factorial design, the dependent variable is metric and there are two ormore independent variables which are non-metric. In this design, it is possibleto examine the interaction between the variables. If there are two independentvariables each having three cells, there would be a total of nine interactions.
12.7 KEY WORDS
Analysis of variance: A technique used to compare means of two ormore samples (using the F distribution). This technique can be used only fornumerical data.
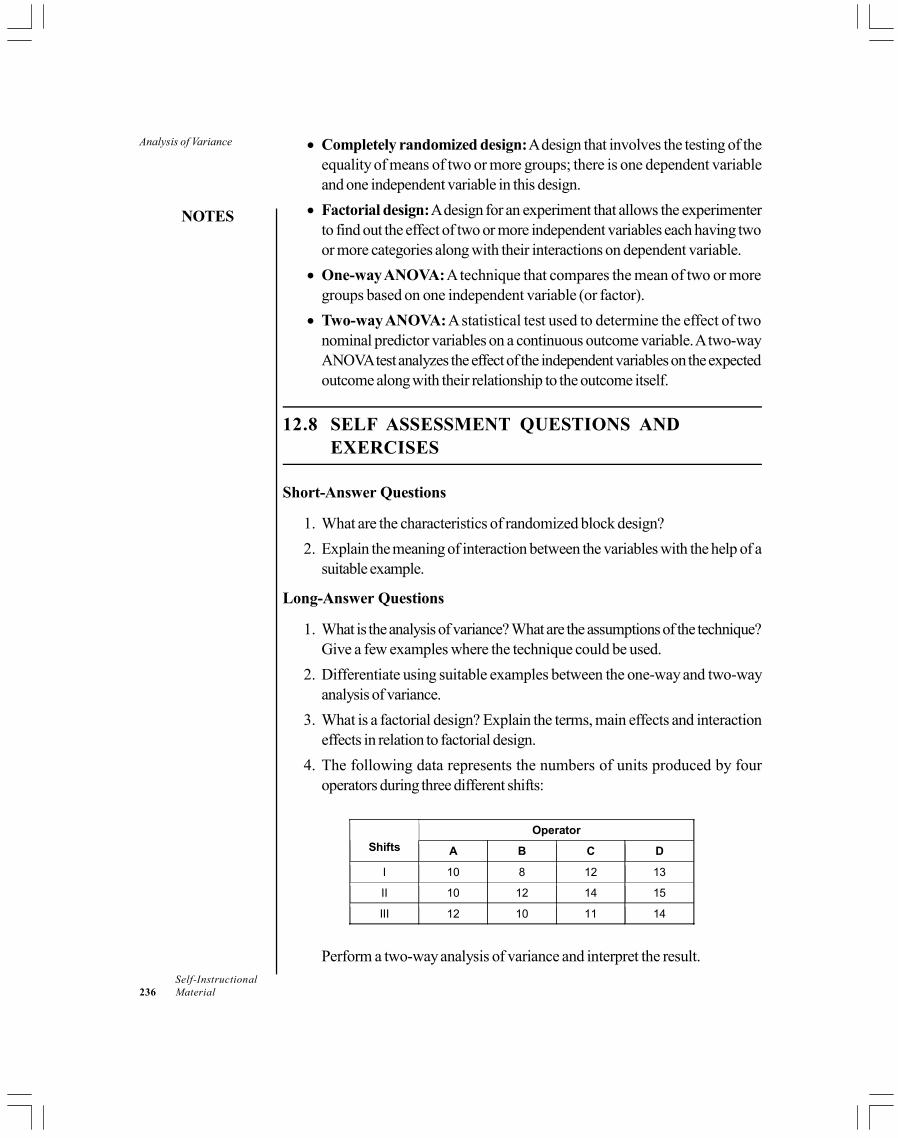
Analysis of Variance
NOTES
Self-Instructional236 Material
Completely randomized design: A design that involves the testing of theequality of means of two or more groups; there is one dependent variableand one independent variable in this design.
Factorial design: A design for an experiment that allows the experimenterto find out the effect of two or more independent variables each having twoor more categories along with their interactions on dependent variable.
One-way ANOVA: A technique that compares the mean of two or moregroups based on one independent variable (or factor).
Two-way ANOVA: A statistical test used to determine the effect of twonominal predictor variables on a continuous outcome variable. A two-wayANOVA test analyzes the effect of the independent variables on the expectedoutcome along with their relationship to the outcome itself.
12.8 SELF ASSESSMENT QUESTIONS ANDEXERCISES
Short-Answer Questions
1. What are the characteristics of randomized block design?
2. Explain the meaning of interaction between the variables with the help of asuitable example.
Long-Answer Questions
1. What is the analysis of variance? What are the assumptions of the technique?Give a few examples where the technique could be used.
2. Differentiate using suitable examples between the one-way and two-wayanalysis of variance.
3. What is a factorial design? Explain the terms, main effects and interactioneffects in relation to factorial design.
4. The following data represents the numbers of units produced by fouroperators during three different shifts:
Operator
Shifts A B C D
I 10 8 12 13
II 10 12 14 15
III 12 10 11 14
Perform a two-way analysis of variance and interpret the result.

NOTES
Self-InstructionalMaterial 237
Analysis of Variance12.9 FURTHER READINGS
Chawla D and Sondhi N. 2016. Research Methodology: Concepts and Cases,2nd edition. New Delhi: Vikas Publishing House.
Cooper, Donald R and Schindler, P S. 1998. Business Research Method. 6th
edn. New Delhi: Tata McGraw Hill Publishing Company Ltd,.
Kinnear, Thomas C and Taylor, J R. 1996. Marketing Research:An Applied Approach. 5th edn. New York: McGraw Hill, Inc.
Luck, David J and Rubin, R S. 1992. Marketing Research. 7th edn. New Delhi:Prentice Hall of India Ltd.
Research Report Writing
NOTES
Self-Instructional238 Material
UNIT 13 RESEARCH REPORTWRITING
Structure
13.0 Introduction13.1 Objectives13.2 Types of Research Reports
13.2.1 Brief Reports13.2.2 Detailed reports
13.3 Report Writing: Structure of the Research Report13.3.1 Preliminary Section13.3.2 Main Report13.3.3 Interpretations of Results and Suggested Rcommendations
13.4 Report Writing: Formulation Rules for Writing the Report13.4.1 Guidelines for Presenting Tabular Data13.4.2 Guidelines for Visual Representations: Graphs
13.5 Answers to Check Your Progress Questions13.6 Summary13.7 Key Words13.8 Self Assessment Questions and Exercises13.9 Further Readings
13.0 INTRODUCTION
In the previous units, we have discussed and learnt about data collection andprocessing. On completion of the research study and after obtaining the researchresults, the real skill of the researcher lies in analysing and interpreting the findingsand linking them with the propositions formulated in the form of research hypothesesat the beginning of the study. The statistical or qualitative summary of results wouldbe little more than numbers or conclusions unless one is able to present thedocumented version of the research endeavour.
One cannot overemphasize the significance of a well-documented andstructured research report. Just like all the other steps in the research process, thisrequires careful and sequential treatment. In this unit, we will be discussing in detailthe documentation of the research study. The format and the steps might bemoderately adjusted and altered based on the reader’s requirement. Thus, it mightbe for an academic and theoretical purpose or might need to be clearly spelt andlinked with the business manager’s decision dilemma.
NOTES
Self-InstructionalMaterial 239
Research Report Writing13.1 OBJECTIVES
After going through this unit, you will be able to:
Classify the various types of research reports
Explain the process of report writing and presentation in business research
Discuss the key features to be kept in mind in terms of the report format
13.2 TYPES OF RESEARCH REPORTS
The research report has a very important role to play in the entire research process.It is a concrete proof of the study that was undertaken. It is a one-waycommunication of the researcher’s study and analysis to the reader/manager, andthus needs to be all-inclusive and yet neutral in its reporting. The significant rolethat a research report can play is as follows:
The research report documents all the steps followed right from framing theresearch question to the interpretation of the study findings
Each step also includes details on how and why that step was conducted,i.e. the justification for choosing one technique over the other.
It also serves to authenticate the quality of the work carried out andestablishes the strength of the findings obtained.
The report gives a clear direction in terms of the implication of the resultsfor the decision maker. This could be academic or applied depending onthe orientation
The report serves as a very important framework for anyone who wouldlike to do research in the same area or topic.
13.2.1 Brief Reports
These kinds of reports are not formally structured and are generally short, sometimesnot running more than four to five pages. The information provided has limitedscope and is a prelude to the formal structured report that would subsequentlyfollow. These reports could be designed in several ways.
Working papers or basic reports are written for the purpose of recordingthe process carried out in terms of scope and framework of the study, themethodology followed and instrument designed. The results and findingswould also be recorded here. However, the interpretation of the findingsand study background might be missing, as the focus is more on the presentstudy rather than past literature.
Survey reports might or might not have an academic orientation. The focushere is to present findings in easy-to-comprehend format that includes figures

Research Report Writing
NOTES
Self-Instructional240 Material
and tables. The advantage of these reports is that they are simple and easyto understand and present the findings in a clear and usable format.
13.2.2 Detailed reports
These are more formal and could be academic, technical or business reports.
Technical reports: These are major documents and would include allelements of the basic report, as well as the interpretations and conclusions,as related to the obtained results. This would have a complete problembackground and any additional past data/records that are essential forunderstanding and interpreting the study results. All sources of data, samplingplan, data collection instrument(s), data analysis outputs would be formallyand sequentially documented.
Business reports: These reports include conclusions as understood bythe business manager. The tables, figures and numbers of the first reportwould now be pictorially shown as bar charts and graphs and the reportingtone would be more in business terms. Tabular data might be attached inthe appendix.
Check Your Progress
1. Name the type of report whose focus is more on the present study ratherthan past literature.
2. Do survey reports always have an academic orientation?
13.3 REPORT WRITING: STRUCTURE OF THERESEARCH REPORT
Whatever the type of report, the reporting requires a structured format and byand large, the process is standardized. The major difference amongst the types ofreports is that all the elements that make a research report would be present onlyin a detailed technical report in comparison to management report. Usage oftheoretical and technical jargon would be higher in the technical report and visualpresentation of data would be higher in the management report.
The process of report formulation and presentation is presented inFigure 13.1. As can be observed, the preliminary section includes the title page,followed by the letter of authorization, acknowledgements, executive summaryand the table of contents. Then come the background section, which includes theproblem statement, introduction, study background, scope and objectives of thestudy and the review of literature (depends on the purpose). This is followed bythe methodology section, which, as stated earlier, is again specific to the technicalreport. This is followed by the findings section and then come the conclusions.The technical report would have a detailed bibliography at the end.

NOTES
Self-InstructionalMaterial 241
Research Report WritingIn the management report, the sequencing of the report might be reversedto suit the needs of the decision-maker, as here the reader needs to review andabsorb the findings. Thus, the last section on interpretation of findings would bepresented immediately after the study objectives and a short reporting onmethodology could be presented in the appendix.
Bibliography
AppendicesGlossary of Terms
Conclusions SectionConclusion RecommendationsLimitations of the Study
and
Findings SectionResultsInterpretation of Results
Methodology SectionResearch DesignSampling DesignData CollectionData Analysis
Background SectionProblem StatementStudy Introduction and BackgroundScope Objectives of the StudyReview of Literature
and
Preliminary SectionTitle PageLetter of AuthorizationExecutive SummaryAcknowledgementsTable of Contents
Fig. 13.1 The Process of Report Formulation and Writing
As presented in Figure 13.1, most research reports include the followingsections:

Research Report Writing
NOTES
Self-Instructional242 Material
13.3.1 Preliminary Section
This section mainly consists of identification information for the study conducted.It has the following individual elements:
Title page: The title should be crisp and indicative of the nature of the project, asillustrated in the following examples.
Comparative analysis of BPO workers and schoolteachers withreference to their work–life balance
Segmentation analysis of luxury apartment buyers in the NationalCapital Region (NCR)
Letter of transmittal: This is the letter that broadly refers to the purpose behindthe study. The tone in this note can be slightly informal and indicative of the rapportbetween the client-reader and the researcher. A sample letter of transmittal ispresented in Exhibit 13.1. The letter broadly refers to three issues. It indicates theterm of the study or objectives; next it goes on to broadly give an indication of theprocess carried out to conduct the study and the implications of the findings. Theconclusions generally are indicative of the researcher’s learning from the study.
Exhibit 1
Sample Letter of Transmittal
To: Mr Prem Parashar From: Nayan Navre
Company: Just Bondas Corporation (JBC) Company: Jigyasa Associates
Location: Mumbai 116879 Location: Sabarmati Dham,Mumbai
Telephone: 8786767; 4876768 Telephone: 41765888
Fax: 48786799 Fax: 41765899
Addendums: Highlight of findings (pages: 20)
15 January 2012
Dear Prem,
Please find the enclosed document which covers a summary of the findings of theNovember- December 2011 study of the new product offering and its acceptibility. Iwould be sending three hard copies of the same tomorrow.
Once the core group has discussed the direction of the expected results I would requestyou to kindly get back with your comments/queries/suggestions, so that they can beincorporated in the preparation of the final report document.
The major findings of the study were that the response of the non-vegetariansconsuming the new keema bonda pav at Just Bondas was positive. As you can observe,however, the introduction of the non-vegetarian bonda has not been well received bythe regular customers who visit the outlets for their regular alloo bonda. These findings,though on a small respondent base, are significant as they could be an indication of adeflecting loyal customer base.
Best regards,
Nayan

NOTES
Self-InstructionalMaterial 243
Research Report WritingLetter of authorization: The author of this letter is the business manager whoformally gives the permission for executing the project. The tone of this letter,unlike the above document, is very precise and formal.
Table of contents: All reports should have a section that clearly indicates thedivision of the report based on the formal areas of the study as indicated in theresearch structure. The major divisions and subdivisions of the study, along withtheir starting page numbers, should be presented. Once the major sections of thereport are listed, the list of tables come next, followed by the list of figures andgraphs, exhibits (if any) and finally the list of appendices.
Executive summary: The summary of the entire report, starting from the scopeand objectives of the study to the methodology employed and the results obtained,has to be presented in a brief and concise manner. The executive summaryessentially can be divided into four or five sections. It begins with the studybackground, scope and objectives of the study, followed by the execution, includingthe sample details and methodology of the study. Next comes the findings andresults obtained. The fourth section covers the conclusions and finally, the lastsection includes recommendations and suggestions.
Acknowledgements: A small note acknowledging the contribution of therespondents, the corporates and the experts who provided inputs for accomplishingthe study is included here.
13.3.2 Main Report
This is the most significant and academically robust part of the report.
Problem definition: This section begins with the formal definition of the researchproblem.
Study background: Study background essentially begins by presenting thedecision-makers’ problem and then moves on to a description of the theoreticaland contemporary market data that laid the foundation that guided the research.
In case the study is an academic research, there is a separate section devotedto the review of related literature, which presents a detailed reporting of workdone on the same or related topic of interest.
Study scope and objectives: The logical arguments then conclude in the form ofdefinite statements related to the purpose of the study. In case the study is causalin nature, the formulated hypotheses are presented here as well.
Methodology of research: The section would essentially have five to six sectionsspecifying the details of how the research was conducted. These would essentiallybe:
Research framework or design: The variables and concepts beinginvestigated are clearly defined, with a clear reference to the relationshipbeing studied. The justification for using a particular design also has to bepresented here.

Research Report Writing
NOTES
Self-Instructional244 Material
Sampling design: The entire sampling plan in terms of the population beingstudied, along with the reasons for collecting the study-related informationfrom the given group is given here.
Data collection methods: In this section, the researcher should clearly listthe information needed for the study as drawn from the study objectivesstated earlier. The secondary data sources considered and the primaryinstrument designed for the specific study are discussed here. However, thefinal draft of the measuring instrument can be included in the appendix.
Data analysis: The assumptions and constraints of the analysis need to beexplained here in simple, non-technical terms.
Study results and findings: This is the most critical chapter of the reportand requires special care; it is probably also one of the longest chapters inthe document.
13.3.3 Interpretations of Results and Suggested Rcommendations
This section comes after the main report and contains interpretations of resultsand suggested recommendations. It presents the information in a summarized andnumerical form.
Sometimes, the research results obtained may not be in the direction asfound by earlier researchers. Here, the skill of the researcher in justifying the obtaineddirection is based on his/her individual opinion and expertise in the area of study.After the interpretation of results, sometimes, the study requirement might be toformulate indicative recommendations to the decision-makers as well. Thus, incase the report includes recommendations, they should be realistic, workable andtopically related to the industry studied.
Limitations of the study
The last part in this section is a brief discussion of the problems encounteredduring the study and the constraints in terms of time, financial or human resources.
End notes
The final section of the report provides all the supportive material in the study.Some of the common details presented in this section are as follows:
Appendices: The appendix section follows the main body of the report andessentially consists of two kinds of information:
1. Secondary information like long articles or in case the study uses/is basedon/refers to some technical information that needs to be understood by thereader; long tables or articles or legal or policy documents.
2. Primary data that can be compressed and presented in the main body ofthe report. This includes original questionnaire, discussion guides, formula

NOTES
Self-InstructionalMaterial 245
Research Report Writingused for the study, sample details, original data, long tables and graphswhich can be described in statement form in the text.
Bibliography: This is an important part of the final section as it provides thecomplete details of the information sources and papers cited in a standardizedformat. It is recommended to follow the publication manuals from the AmericanPsychological Association (APA) or the Harvard method of citation for preparingthis section.The reporting content of the bibliography could also be in terms of:
Selected bibliography: Selective references are cited in terms of relevanceand reader requirement. Thus, the books or journals that are technical andnot really needed to understand the study outcomes are not reported.
Complete bibliography: All the items that have been referred to, evenwhen not cited in the text, are given here.
Annotated bibliography: Along with the complete details of the cited work,some brief information about the nature of information sought from the articleis given.
At this juncture we would like to refer to citation in the form of a footnote.To explain the difference we would first like to explain what a typical footnote is:
Footnote: A typical footnote, as the name indicates, is part of the main report andcomes at the bottom of a page or at the end of the main text. This could refer to asource that the author has referred to or it may be an explanation of a particularconcept referred to in the text.
The referencing protocol of a footnote and bibliography is different. In afootnote, one gives the first name of the person first and the surname next. However,this order is reversed in the bibliography. Here we start first with the surname andthen the first name. In a bibliography, we generally mention the page numbers ofthe article or the total pages in the book. However, in a footnote, the specific pagefrom which the information is cited is mentioned. A bibliography is generally arrangedalphabetically depending on the author’s name, but in the footnote the reporting isbased on the sequence in which they occur in the text.
Glossary of terms: In case there are specific terms and technical jargon used inthe report, the researcher should consider putting a glossary in the form of a wordlist of terms used in the study. This section is usually the last section of the report.
Check Your Progress
3. Name the section which includes the title page, followed by the letter ofauthorization, acknowledgements, executive summary and the table ofcontents.
4. What does the annotated bibliography include?

Research Report Writing
NOTES
Self-Instructional246 Material
13.4 REPORT WRITING: FORMULATION RULESFOR WRITING THE REPORT
Listed below are some features of a good research study that should be kept inmind while documenting and preparing the report.
Clear report mandate: While writing the research problem statement andstudy background, the writer needs to be absolutely clear in terms of whyand how the problem was formulated.
Clearly designed methodology: Any research study has its uniqueorientation and scope and thus has a specific and customized research design,sampling and data collection plan. In researches, that are not completelytransparent on the set of procedures, one cannot be absolutely confident ofthe findings and resulting conclusions.
Clear representation of findings: Complete honesty and transparencyin stating the treatment of data and editing of missing or contrary data isextremely critical.
Representativeness of study finding: A good research report is alsoexplicit in terms of extent and scope of the results obtained, and in terms ofthe applicability of findings.
Thus, some guidelines should be kept in mind while writing the report.
Command over the medium: A correct and effective language ofcommunication is critical in putting ideas and objectives in the vernacular ofthe reader/decision-maker.
Phrasing protocol: There is a debate about whether or not one makes useof personal pronoun while reporting. The use of personal pronoun such as ‘Ithink…..’ or ‘in my opinion…..’ lends a subjectivity and personalization ofjudgement. Thus, the tone of the reporting should be neutral. For example:
‘Given the nature of the forecasted growth and the opinion of therespondents, it is likely that the……’
Whenever the writer is reproducing the verbatim information from anotherdocument or comment of an expert or published source, it must be in invertedcommas or italics and the author or source should be duly acknowledged. Forexample:
Sarah Churchman, Head of Diversity, PricewaterhouseCoopers, states ‘AtPricewaterhouseCoopers we firmly believe that promoting work–life balance is a
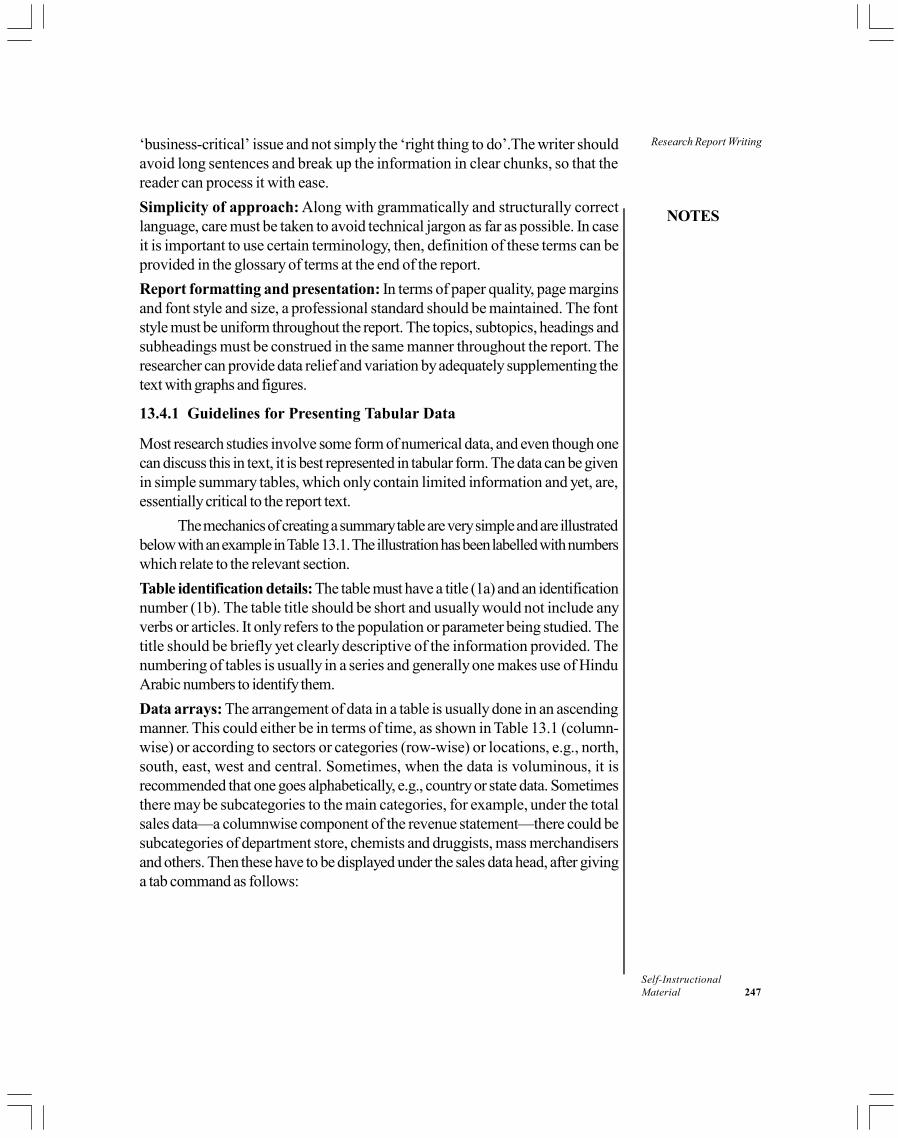
NOTES
Self-InstructionalMaterial 247
Research Report Writing‘business-critical’ issue and not simply the ‘right thing to do’.The writer shouldavoid long sentences and break up the information in clear chunks, so that thereader can process it with ease.
Simplicity of approach: Along with grammatically and structurally correctlanguage, care must be taken to avoid technical jargon as far as possible. In caseit is important to use certain terminology, then, definition of these terms can beprovided in the glossary of terms at the end of the report.
Report formatting and presentation: In terms of paper quality, page marginsand font style and size, a professional standard should be maintained. The fontstyle must be uniform throughout the report. The topics, subtopics, headings andsubheadings must be construed in the same manner throughout the report. Theresearcher can provide data relief and variation by adequately supplementing thetext with graphs and figures.
13.4.1 Guidelines for Presenting Tabular Data
Most research studies involve some form of numerical data, and even though onecan discuss this in text, it is best represented in tabular form. The data can be givenin simple summary tables, which only contain limited information and yet, are,essentially critical to the report text.
The mechanics of creating a summary table are very simple and are illustratedbelow with an example in Table 13.1. The illustration has been labelled with numberswhich relate to the relevant section.
Table identification details: The table must have a title (1a) and an identificationnumber (1b). The table title should be short and usually would not include anyverbs or articles. It only refers to the population or parameter being studied. Thetitle should be briefly yet clearly descriptive of the information provided. Thenumbering of tables is usually in a series and generally one makes use of HinduArabic numbers to identify them.
Data arrays: The arrangement of data in a table is usually done in an ascendingmanner. This could either be in terms of time, as shown in Table 13.1 (column-wise) or according to sectors or categories (row-wise) or locations, e.g., north,south, east, west and central. Sometimes, when the data is voluminous, it isrecommended that one goes alphabetically, e.g., country or state data. Sometimesthere may be subcategories to the main categories, for example, under the totalsales data—a columnwise component of the revenue statement—there could besubcategories of department store, chemists and druggists, mass merchandisersand others. Then these have to be displayed under the sales data head, after givinga tab command as follows:
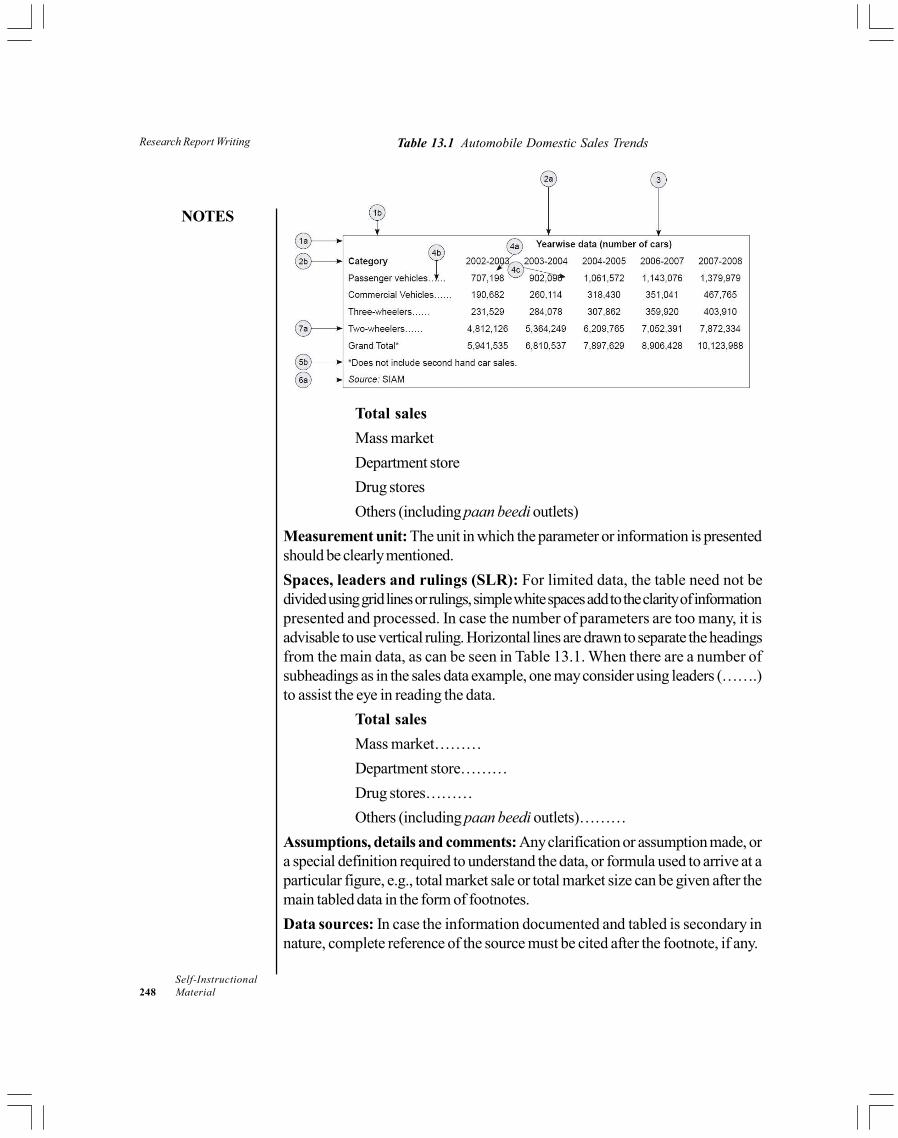
Research Report Writing
NOTES
Self-Instructional248 Material
Table 13.1 Automobile Domestic Sales Trends
Total sales
Mass market
Department store
Drug stores
Others (including paan beedi outlets)
Measurement unit: The unit in which the parameter or information is presentedshould be clearly mentioned.
Spaces, leaders and rulings (SLR): For limited data, the table need not bedivided using grid lines or rulings, simple white spaces add to the clarity of informationpresented and processed. In case the number of parameters are too many, it isadvisable to use vertical ruling. Horizontal lines are drawn to separate the headingsfrom the main data, as can be seen in Table 13.1. When there are a number ofsubheadings as in the sales data example, one may consider using leaders (…….)to assist the eye in reading the data.
Total sales
Mass market………
Department store………
Drug stores………
Others (including paan beedi outlets)………
Assumptions, details and comments: Any clarification or assumption made, ora special definition required to understand the data, or formula used to arrive at aparticular figure, e.g., total market sale or total market size can be given after themain tabled data in the form of footnotes.
Data sources: In case the information documented and tabled is secondary innature, complete reference of the source must be cited after the footnote, if any.
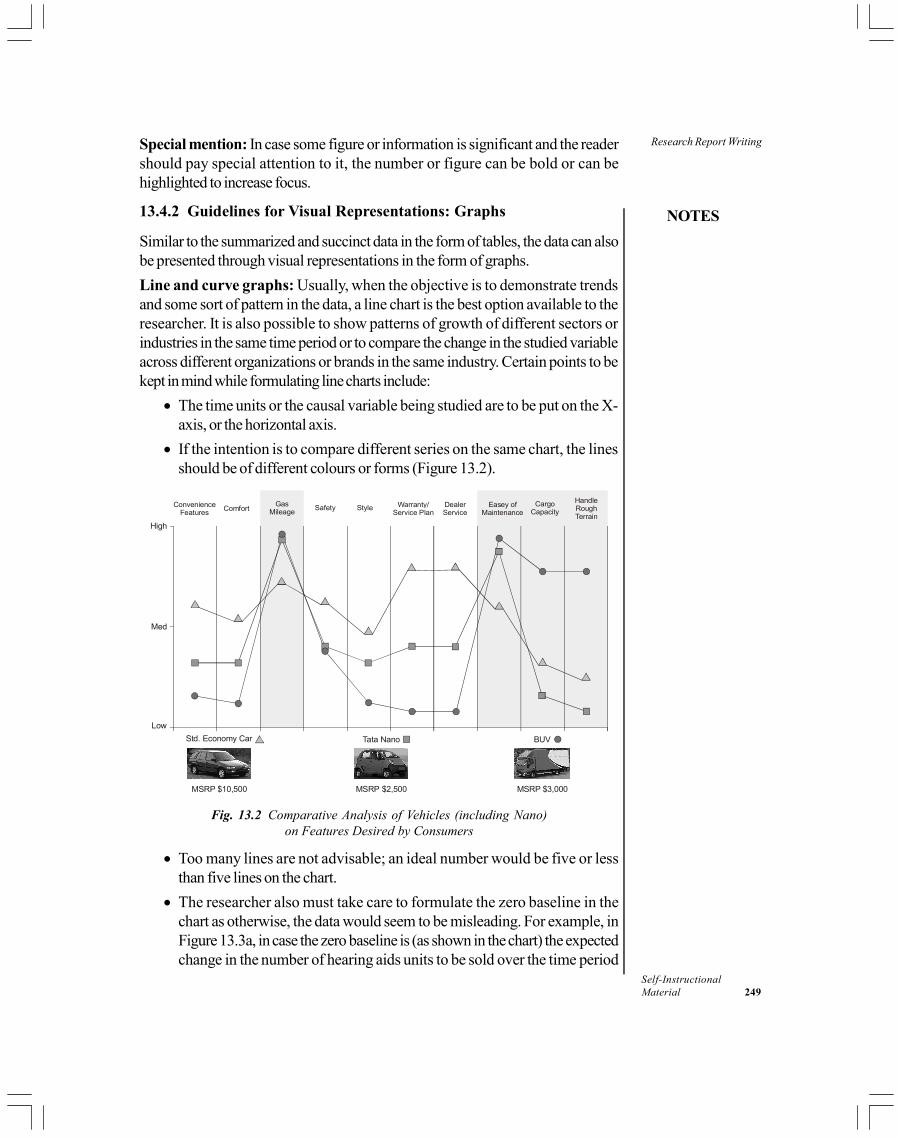
NOTES
Self-InstructionalMaterial 249
Research Report WritingSpecial mention: In case some figure or information is significant and the readershould pay special attention to it, the number or figure can be bold or can behighlighted to increase focus.
13.4.2 Guidelines for Visual Representations: Graphs
Similar to the summarized and succinct data in the form of tables, the data can alsobe presented through visual representations in the form of graphs.
Line and curve graphs: Usually, when the objective is to demonstrate trendsand some sort of pattern in the data, a line chart is the best option available to theresearcher. It is also possible to show patterns of growth of different sectors orindustries in the same time period or to compare the change in the studied variableacross different organizations or brands in the same industry. Certain points to bekept in mind while formulating line charts include:
The time units or the causal variable being studied are to be put on the X-axis, or the horizontal axis.
If the intention is to compare different series on the same chart, the linesshould be of different colours or forms (Figure 13.2).
Std. Economy Car Tata Nano BUV
MSRP $3,000MSRP $2,500MSRP $10,500
Low
Med
High
ConvenienceFeatures
HandleRoughTerrain
ComfortGas
MileageSafety Style Warranty/
Service PlanDealerService
Easey ofMaintenance
CargoCapacity
Fig. 13.2 Comparative Analysis of Vehicles (including Nano)on Features Desired by Consumers
Too many lines are not advisable; an ideal number would be five or lessthan five lines on the chart.
The researcher also must take care to formulate the zero baseline in thechart as otherwise, the data would seem to be misleading. For example, inFigure 13.3a, in case the zero baseline is (as shown in the chart) the expectedchange in the number of hearing aids units to be sold over the time period
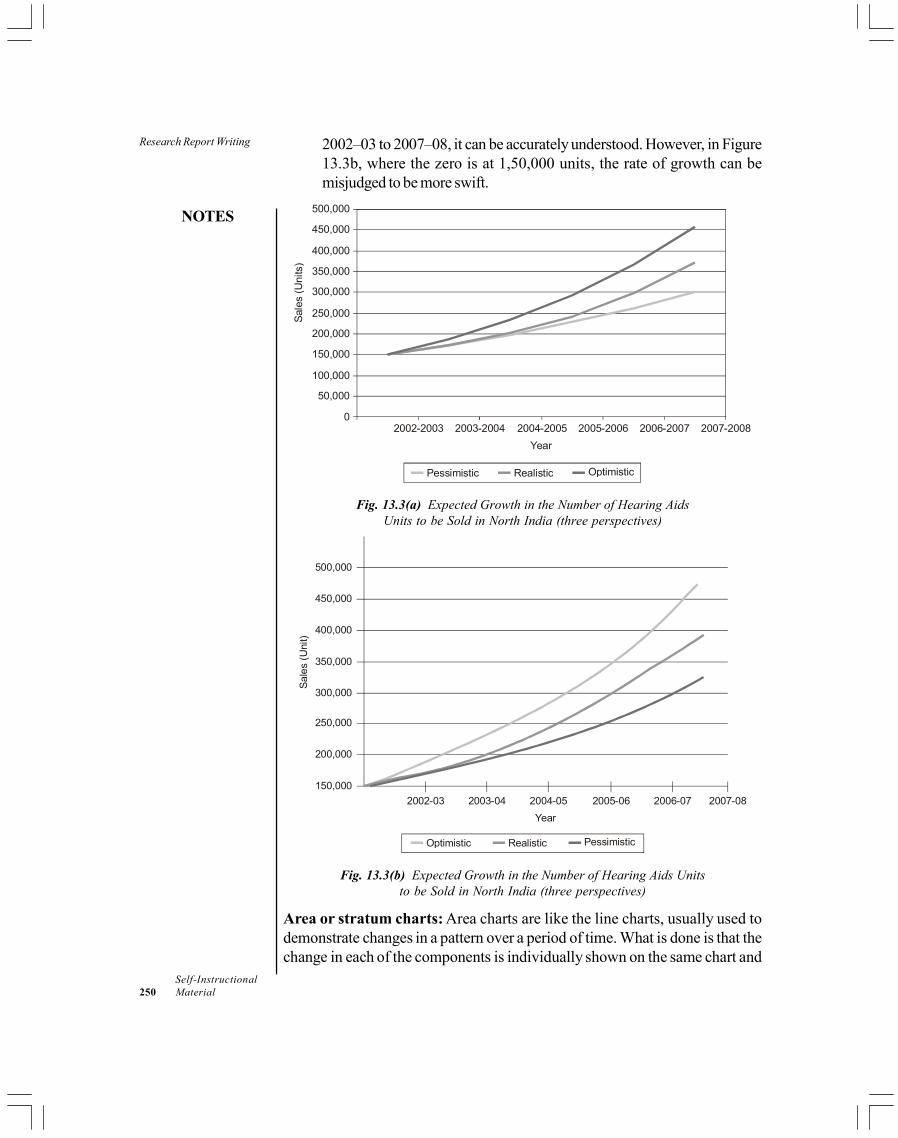
Research Report Writing
NOTES
Self-Instructional250 Material
2002–03 to 2007–08, it can be accurately understood. However, in Figure13.3b, where the zero is at 1,50,000 units, the rate of growth can bemisjudged to be more swift.
0
50,000
100,000
150,000
200,000
250,000
300,000
350,000
400,000
450,000
500,000
2002-2003 2003-2004 2004-2005 2005-2006 2006-2007 2007-2008
Year
Sal
es (
Uni
ts)
Pessimistic Realistic Optimistic
Fig. 13.3(a) Expected Growth in the Number of Hearing AidsUnits to be Sold in North India (three perspectives)
Optimistic Realistic Pessimistic
150,000
200,000
250,000
300,000
350,000
400,000
450,000
500,000
Year
2002-03 2003-04 2004-05 2005-06 2006-07 2007-08
Sal
es (
Uni
t)
Fig. 13.3(b) Expected Growth in the Number of Hearing Aids Unitsto be Sold in North India (three perspectives)
Area or stratum charts: Area charts are like the line charts, usually used todemonstrate changes in a pattern over a period of time. What is done is that thechange in each of the components is individually shown on the same chart and

NOTES
Self-InstructionalMaterial 251
Research Report Writingeach of them is stacked one on top of the other. The areas between the variouslines indicate the scale or volume of the relevant factors/categories (Figure 13.4).
45.0044.0043.0042.0041.0040.0039.0038.0037.0036.0035.0034.0033.0032.0031.0030.0029.0028.0027.0026.00
Nano perception
30
25
20
15
10
5
0
Cou
nt
Dogmatic buyer
Patriotic buyer
Innovator
Cluster Numberof Case
Fig. 13.4 Perception of Nano by Three PsychographicSegments of Two-wheeler Owners
Pie charts: Another way of demonstrating the area or stratum or sectionalrepresentation is through the pie charts. The critical difference between a line andpie chart is that the pie chart cannot show changes over time. It simply shows thecross-section of a single time period. There are certain rules that the researchershould keep in mind while creating pie charts.
The complete data must be shown as a 100 per cent area of the subjectbeing graphed.
It is a good idea to have the percentages displayed within or above the pierather than in the legend as then it is easier to understand the magnitude ofthe section in comparison to the total. For example,
Figure 13.5 shows the brand-wise sales in units for the sample of existing brandsof hearing aids in the North Indian market.
Brandwise Sales (Units)
GN Resound10%
Siemens13%
Alps Oticon26%Elkon
20%
Widex3%
Phonak2%
Novax7%
Arphi7%
Others12%
GN Resound
Siemens
Alps Oticon
Elkon
Widex
Phonak
Novax
Arphi
Others
Fig. 13.5 Brandwise Sales (units) of Hearing Aidsin the North Indian Market (2002–03)

Research Report Writing
NOTES
Self-Instructional252 Material
Showing changes over time is difficult through a pie chart, as stated earlier.However, the change in the components at different time periods could bedemonstrated as in Figure 13.6, showing a sample share of the car marketin India in 2009 and the expected market composition of 2015.
Maruti Suzuki
Toyota
Tata
GM
Hyundai
Others
46%
9%
26%
3%3% 13%
39%
14%15%
15%
1% 15%2009
2015
Fig. 13.6 Sample Structure of the Indian Car Market (2009)and the Forecasted Structure for 2015
Bar charts and histograms: A very useful representation of quantum or magnitudeof different objects on the same parameter are bar diagrams. The comparativeposition of objects becomes very clear. The usual practice is to formulate verticalbars; however, it is possible to use horizontal bars as well if none of the variable istime related [Figure 13.7(a)]. Horizontal bars are especially useful when one isshowing both positive and negative patterns on the same graph [Figure 13.7(b)].These are called bilateral bar charts and are especially useful to highlight the objectsor sectors showing a varied pattern on the studied parameter.
0 5 10 15 20
Mc Donald's
Mumbai Masala
Cafe mumbai
Just Bondas
Unit sales in thousandsUnit sales in thousand
Fa
st f
ood
out
lets
Fig. 13.7(a) Bar Chart per Day, Unit Sales (thousands)at Fast Food Outlets in Mumbai

NOTES
Self-InstructionalMaterial 253
Research Report Writing
! 30 ! 20 ! 10 0 10 20 30 40 50
Chicago Pizza
Local Bakery
Flavors
Pino's Pizza
Sphaghetti
Slice of Italy
Pizza Hut
Nirulas
Local Bakery
Recalled Purchased
Fig. 13.7(b) Bilateral Bar Chart—the Brand Recall andBrand Purchase Response for Pizza Joints in the NCR
Another variation of the bar chart is the histogram (Figure 13.8) herethe bars are vertical and the height of each bar reflects the relative or cumulativefrequency of that particular variable.
Marks
72.070.068.066.064.062.060.058.056.054.052.050.048.046.0
14
12
10
8
6
4
2
0
Std. Dev = 6.24Mean = 61.2N = 37.00
Fig. 13.8 Histogram (with normal curve) Displaying Marksin a Course on Research Methods for Management

Research Report Writing
NOTES
Self-Instructional254 Material
Check Your Progress
5. What is the best option available to the researcher when the objective is todemonstrate trends and some sort of pattern in the data?
6. State the ideal number of lines in a chart.7. Mention the things a pie chart cannot show.
13.5 ANSWERS TO CHECK YOUR PROGRESSQUESTIONS
1. Working papers or basic reports are the type of report whose focus ismore on the present study rather than past literature.
2. No, the survey reports might or might not have an academic orientation.
3. The preliminary section is the section which includes the title page, followedby the letter of authorization, acknowledgements, executive summary andthe table of contents.
4. The annotated bibliography contains complete details of the cited work,along with some brief information about the nature of information soughtfrom the article.
5. Line chart is the best option available to the researcher when the objectiveis to demonstrate trends and some sort of pattern in the data.
6. The ideal number of lines in a chart is five or less.
7. The pie chart cannot show changes over time, as it simply shows the cross-section of a single time period.
13.6 SUMMARY
The most important task ahead of the researcher is to document the entirework done in the form of a well structured research report.
The orientation and structure of the report will depend on what kind ofreport is being constructed. These could be brief or detailed; academic,technical or business report.
The, reports generally follow a standardized structure. The entire reportcan be divided into three main sections—the preliminary section, the mainbody and endnotes.

NOTES
Self-InstructionalMaterial 255
Research Report Writing There must be no ambiguity in either presenting the findings orrepresentativeness of the findings.
Visual relief for the written can be provided through figures, tables and graphs.
13.7 KEY WORDS
Annotated bibliography: A bibliography that includes brief explanationsor notes for each reference.
Bibliography: A list of the works of a specific author or publisher.
Executive summary: The summary of the entire report, starting from thescope and objectives of the study to the methodology employed and theresults obtained, presented in a brief and concise manner.
Letter of transmittal: The letter that broadly refers to the purpose behindthe study.
Working paper: Report that is written for the purpose of recording theprocess carried out in terms of scope and framework of the study, themethodology followed and instrument designed.
13.8 SELF ASSESSMENT QUESTIONS ANDEXERCISES
Short-Answer Questions
1. What should be the ideal structure of a research report? What are theelements of the structure defined by you?
2. What are the guidelines a researcher must follow for tabular representationof the research results?
3. Differentiate between the referencing protocol of a footnote and bibliography.
4. How is a technical report different from a management report?
Long-Answer Questions
1. What are the different kind of reports available to the researcher? Do thecriteria become different for different kinds of reports? Explain with examples.
2. What are the guidelines for effective report writing? Illustrate with suitableexamples.
3. Discuss the guidelines for graphical representations of data in reports. Whatare the audio-visual aids available for the purpose?

Research Report Writing
NOTES
Self-Instructional256 Material
13.9 FURTHER READINGS
Chawla D and Sondhi N. 2016. Research Methodology: Concepts and Cases,2nd edition. New Delhi: Vikas Publishing House.
Easterby-Smith, M, Thorpe, R and Lowe, A. 2002. Management Research: AnIntroduction, 2nd edn. London: Sage.
Grinnell, Richard Jr (ed.). 1993. Social Work, Research and Evaluation 4th
edn. Itasca, Illinois: F E Peacock Publishers.
Kerlinger, Fred N. 1986. Foundations of Behavioural Research, 3rd edn. NewYork: Holt, Rinehart and Winston.
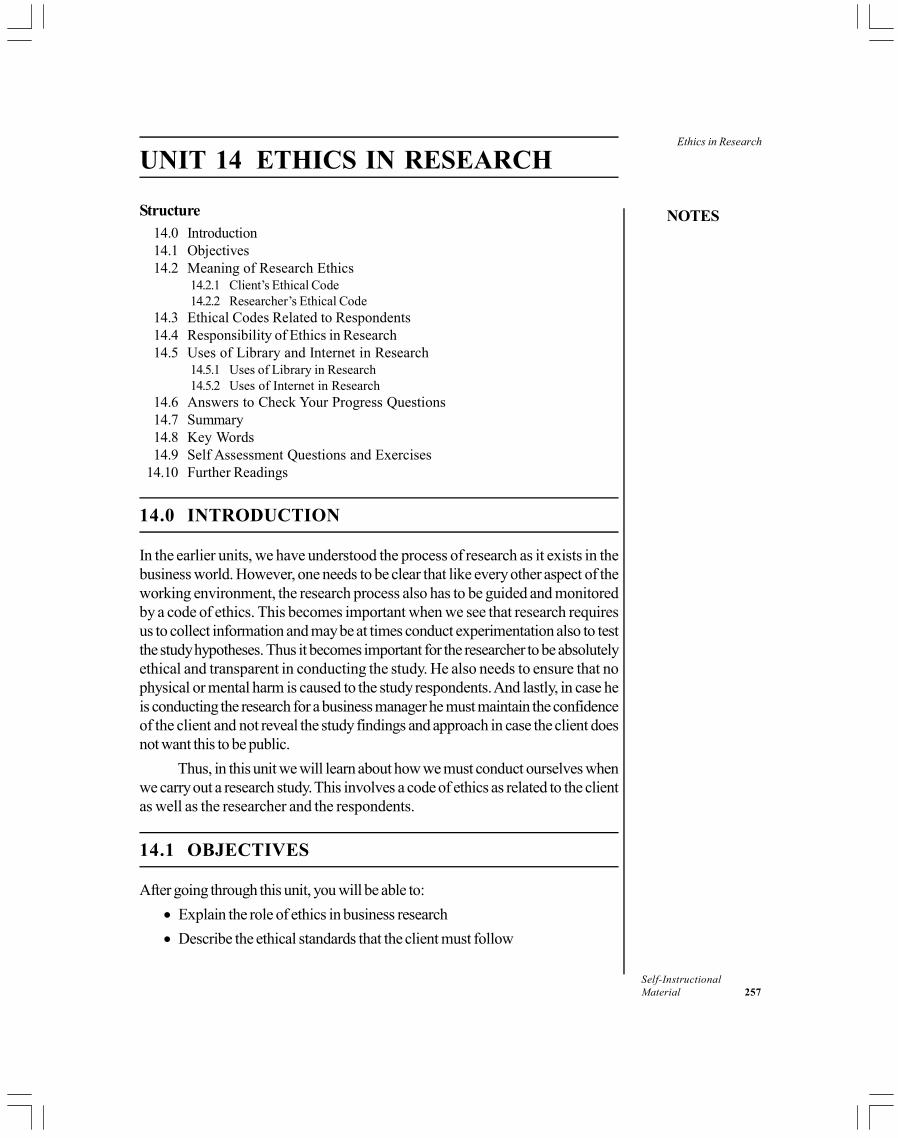
NOTES
Self-InstructionalMaterial 257
Ethics in Research
UNIT 14 ETHICS IN RESEARCH
Structure
14.0 Introduction14.1 Objectives14.2 Meaning of Research Ethics
14.2.1 Client’s Ethical Code14.2.2 Researcher’s Ethical Code
14.3 Ethical Codes Related to Respondents14.4 Responsibility of Ethics in Research14.5 Uses of Library and Internet in Research
14.5.1 Uses of Library in Research14.5.2 Uses of Internet in Research
14.6 Answers to Check Your Progress Questions14.7 Summary14.8 Key Words14.9 Self Assessment Questions and Exercises
14.10 Further Readings
14.0 INTRODUCTION
In the earlier units, we have understood the process of research as it exists in thebusiness world. However, one needs to be clear that like every other aspect of theworking environment, the research process also has to be guided and monitoredby a code of ethics. This becomes important when we see that research requiresus to collect information and may be at times conduct experimentation also to testthe study hypotheses. Thus it becomes important for the researcher to be absolutelyethical and transparent in conducting the study. He also needs to ensure that nophysical or mental harm is caused to the study respondents. And lastly, in case heis conducting the research for a business manager he must maintain the confidenceof the client and not reveal the study findings and approach in case the client doesnot want this to be public.
Thus, in this unit we will learn about how we must conduct ourselves whenwe carry out a research study. This involves a code of ethics as related to the clientas well as the researcher and the respondents.
14.1 OBJECTIVES
After going through this unit, you will be able to:
Explain the role of ethics in business research
Describe the ethical standards that the client must follow

Ethics in Research
NOTES
Self-Instructional258 Material
Discuss the ethical responsibilities of the researcher
Explain how to protect the rights of the respondent
Describe the ethical principles to be followed in the overall research process
14.2 MEANING OF RESEARCH ETHICS
Ethical standards are extremely important no matter what be the field of study.This takes a special meaning in the conduction of research. Rowley (2004) hasput it very simply as ‘conducting research ethically is concerned with respectingprivacy and confidentiality, and being transparent in the use of research data. Ethicalpractices hinge on respect and trust and approaches that seek to build rather thandemolish relationships.’ Russeft et al. (1999) advocated that while conductingbusiness research, the approach must be professional and responsible, the datacollection must be attempted with the respondent's consent under appropriateand ethically correct methods; and, last but not the least, the interpretation has tobe done in a careful unbiased manner.
A number of corporations have developed their own code of ethics regardingthe conduct of research. While this practice of defining business ethics, whichincludes research ethics, is common in most organizations in the West, in India thisis spelt out and documented in the pharmaceutical sector and some banks likeHSBC. Besides this, there are also well established and detailed ethical guidelinesavailable from international bodies, for example, the Social Research Association’s(SRA's) ethical guidelines, the American Psychological Association (APA) codeof ethics, code of standards and ethics for survey research designed by the Councilof American Survey Research Organizations (CASRO), American MarketingAssociation (AMA) and Business Marketing Association (BMA) code of conductand ethics.
To understand the code of ethics involved in research, one needs tounderstand the three significant stakeholders involved in any research, namely:
The sponsoring clients or decision-makers.
The respondents from whom one seeks the information.
The researcher himself/herself while administering and compiling the study.
Each one of these entities has their own specific interests and needs and,thus, the ethical concerns regarding each one would be unique. Thus, the followingsections present brief guidelines on the ethical issues and their management.
14.2.1 Client’s Ethical Code
Similar to any other business transaction, research is also an exchange processbetween various people. The first of these is the one between the sponsoringclient and the investigator. Thus both parties have an ethical obligation towards theother. In case the study is being conducted for a business client, complete

NOTES
Self-InstructionalMaterial 259
Ethics in Researchtransparency in terms of data gathering and interpreting is a must. It has beenobserved that the client might be a business manager who because of his ownpersonal interests might steer the results in a specific direction in order to fulfil ahidden agenda. For example, in case a warehousing organization is looking atbusiness expansion and hires a research agency to conduct a research study inorder to provide directions.It might so happen that the business manager from theclient side, who is dealing with the research agency owns a transport fleet and thuswants the researcher to recommend courier and transit warehousing services asbusiness opportunities that the company can go into.
It has been commonly found amongst small and relatively younger firms toask for proposals from research agencies for the conduct of a study. However,once they obtain the details of the intended methodology, they usually get thestudy conducted by their own team or by trainees at a low to minimal cost to thecompany. And since the proposals are the first stage of a research bid, the companyis under no obligation to pay for the research methodology collected by them in anunderhand manner.
Another instance could be that even though the initial exploratory researchand literature review indicate the nature of the respondent population, the clientmight, based on his own notions, force the researcher to undertake the study on aspecific population. For example, if a new technology is being introduced in thecompany and the use requires computer literacy, the client might ask the researcherto measure the acceptability of the product amongst only the computer-savvypopulation. Thus the results would automatically be bent towards acceptance.
Sometimes, the interpretation and recommendations might be beyond thescope of a study. For example, in the organic food study, which was conductedamongst retailers and consumers, the client might ask the researcher to suggeststrategies for educating and building usage and recommendations amongst dieticiansand doctors.
It is recommended in this instance that the researcher must conduct acomprehensive exploratory research and develop clearly stated objectives thatdo not leave any scope for unethical intervention. Secondly, he must tell businessmanager that unless the results are unbiased the study will not contribute to informeddecision making. In case of an unethical manager or client, it is best to avoidmaking recommendations and formulating strategies and leave the use or non-useof the data to the manager. And if nothing works it is best to terminate the researchstudy, as unethical reporting and compilation is bound to spoil the researcher’sreputations.
14.2.2 Researcher’s Ethical Code
Since the researcher is the most involved and main person responsible for thestudy, it is very important that the highest ethical standards be maintained by him.Some specific checks he can look at are as follows:

Ethics in Research
NOTES
Self-Instructional260 Material
Quality control
A very important consideration, both short-term and long-term, is to maintain thestandards of quality in the conduct of the study. The researcher must be absolutelyobjective and correct in choosing the research design that would be right for thestudy. For example, for studying the impact of a mathematics study programmeon an experimental group of children, the researcher must have a matched controlgroup of children with a similar understanding of mathematics so that the comparisonis correct.
Sometimes, the client might be unaware of the analytical rules and conditionsfor the result to be valid, thus it is the responsibility of the researcher to be absolutelytransparent about the significance of the results obtained and refrain fromemphasizing findings that might be of very little strength or value.
Privacy control
The most significant and important ethical concern of a research study is the issueof trust and confidentiality. At no cost must the researcher reveal any aspect of thestudy without the consent of the client. This could be in terms of not revealing thename of the company. For example, if the client is interested in finding out thecomparative standing of their product with the competitor’s product, it becomescritical to conduct the study amongst users of the product category rather thanonly the company brand in order to get an unbiased evaluation.
The researcher might also need to guard the reason or purpose of the study.For example if the client wants to measure a new product potential, then revealingthe reason for the study might lead to the concept or idea being adopted andconverted into a product prototype by someone else before the client is out withthe offering. The third level of confidentiality that the researcher must ensure is thecomplete confidentiality of the findings till the research outcome has been convertedinto a business decision. For example, based on the organizational health index ofits workers and the attrition rate, the correlation between the two variables mightbe alarming enough to require a major restructuring of the existing employee benefitsand work policy. Or the research study might involve a comprehensive and detailedstudy of potential candidates being considered for the role of the CEO, as theexisting leader is due for retirement. Thus, revelation of the findings of such researchmight lead to turbulence and divided opinion in the organization. Thus the resultsshould not be made available to all till they have been brought into action.
Check Your Progress
1. List some of the international bodies which have provided well establishedand detailed ethical guidelines.
2. State the most significant and important ethical concern of a research study.
3. Mention the controls which are important checks in a study.
NOTES
Self-InstructionalMaterial 261
Ethics in Research14.3 ETHICAL CODES RELATED TO
RESPONDENTS
The most important and vulnerable person in the research study is the respondentfrom whom the data is to be collected. Every association and organization that isdirectly or indirectly involved with research has made clear and detailed guidelinesfor ensuring that unethical treatment of the respondent does not happen.
The American Association for Public Opinion Research has formulated thefollowing code of ethics for survey researchers, with reference to the respondent:
We shall strive to avoid the use of practices or methods that may harm,humiliate or seriously mislead survey respondents.
Unless the respondent waives confidentiality for specific uses, we shall holdas privileged and confidential all information that might identify a respondentwith his or her responses. We shall also not disclose or use the names ofrespondents for non-research purposes unless the respondent grants uspermission to do so.
Study disclosure
The researcher needs to have complete and transparent information regarding thepurpose of collecting data and what sort of information would be required fromthe respondent. The person must know what kind of questioning would be done,so that he is able to understand what the researcher is looking for and whether hehas the information, whether he wants to share all or part of it and also how muchtime and effort would be needed. For example, for a new concept test or asegmentation analysis or an organizational climate survey the administration wouldrequire considerable time and commitment from the respondent. Secondly, if it isa before-and-after product acceptability or usage study, again the person wouldbe contacted twice to assess the experience.Thus the researcher needs to beabsolutely truthful about the nature and objectives of the study.
Coercion and influence
The researcher should not at any stage, either before or during the data collectionstage, try to pressurize the respondent through persuasive influence or by forcinghim to share information. For example, if the respondent has been through sometraumatic experience, he/she might not want to share all details with a stranger,even if it is for an objective study. Schinke and Gilchrist (1993) state that understandards set by the National Commission for the protection of human subjects,all informed-consent procedures must meet three criteria:
Participants must be competent to give consent
Sufficient information must be provided to allow for a reasonable decision
Consent must be voluntary and uncoerced
Ethics in Research
NOTES
Self-Instructional262 Material
Sometimes, it may so happen that the respondent is too young or too old ornot literate and thus, unable to understand when the researcher might be eitherleading him/her to give certain preset answers or trying to force the person toshare information that he does not want to reveal or which once shared might bemisinterpreted.
Sensitivity and respect
There are certain issues like shoplifting or sexual orientation, which are not topicsthat can be managed in a structured, impersonal manner. The researcher shoulddevote more time here and also keep the questions more open-ended, and usuallysuch situations need a considerable rapport formation and a non-threateningatmosphere. The researcher, at all times, would need to treat the respondent withdue respect and be transparent about the nature and objective of the questioning.
Experimentation and implication
In case the respondent is going to be part of the experimental group subjected toany sort of treatment, for example, a new shampoo trial or an interventionprogramme that may involve some behavioural change, complete information mustbe given regarding the course of the experiment and any risk, even minimal, whichmight be involved. The researcher, thus, must ensure minimal risk to the respondentand should in no way cause any harm to the person, even if it is for the quest ofknowledge. Bailey (1978) describes this ‘harm’ as not only hazardous or medicalexperiments but also any social research that might involve such things as discomfort,anxiety, harassment, invasion of privacy or demeaning or dehumanizing procedures.
Agreement or consent
Once the researcher has clearly communicated the purpose, the nature and likelyoutcome of the study, it is advisable to make a mutual written or unwritten contract.This ensures that there is no unpleasantness or legal confrontation on either side.Another advantage of this is that in case a point was not very clear the issue getsclarified. For example, for a personal care usage study, the consumer might beunder the impression that a questionnaire on usage would be filled in when actuallythe researcher wants to observe/record the usage ritual. This might call for someinvasion of privacy of the respondent by the researcher, and thus taking the consentbeforehand would make things clear for both the parties.
Sometimes, the nature of the study might require that the name of the companybe disguised. For example, one cannot start a study by saying, ‘We are conductinga survey for Mother Dairy milk; which do you think is the best milk in the city?’Thus, here the debriefing about the company sponsoring the research can berevealed after the data has been collected, and the purpose of the disguise can berevealed. This ensures respondents’ goodwill and cooperation.
NOTES
Self-InstructionalMaterial 263
Ethics in Research14.4 RESPONSIBILITY OF ETHICS IN RESEARCH
Besides ensuring that specific protocols and codes be followed for the twobenefactors (client) and contributors (respondents), there are some basic tenetsthat the researcher must not forego. These are significant not only for the body ofknowledge that the researcher is contributing to but also for the society in whichwe exist.
Professional creed
We have already discussed this in detail in both the sections above. However,here for professional creed, we refer to the overall conduct of the researcher, whohas to be truthful during all phases of the study, whether in the conceptualization,conduction or presentation of the research study.
At no stage should the researcher exaggerate or underplay the expense oreffort incurred in the conduct of the study. Thus, sometimes the investigatormight overclaim the expense incurred in travel or field visit. On the otherhand, he might underpay the field investigators that he has kept for datacollection by hiring undergraduate students rather than professionalinvestigators.
The respondent group being studied should be a true representative of theidentified respondent population studied and not a skewed and biasedsample. Another unethical practice observed is that the researcher mightconduct the study with a professional group of respondents who are wellversed in the response technique and thus give ‘good’ or predictable answers.
The data and the questionnaire completed should be on authentic, real-timeconduction, with actual respondents representative of the population understudy and not fake completion done by the field investigators themselves.
The findings and results should be presented as they were found based onactual conduction and under no circumstances must the researcher attemptto fudge or manipulate the results of the study.
Professional confidentiality
The researcher must bear the responsibility to maintain the confidentiality ofthe research findings and not making public any aspects of the study, in anapparent or camouflaged manner. This code of ethics applies both to thesponsoring client, as well as the respondent. The anonymity and privacy of therespondent is to be respected and not violated. Also, recording private orpersonal behaviour with hidden devices is considered a monumental violationof an individual’s right to privacy (e.g., observing people in a fitting room witha hidden camera).
Ethics in Research
NOTES
Self-Instructional264 Material
The right to privacy and confidentiality takes on a new meaning incyberspace, where the respondent’s personal and demographic details are madeavailable to the researching company and this could be compiled and collatedand sold as databases to various service providers as authentic locational detailsfor tapping potential customers. Thus, maintaining anonymity and confidentialityof information shared is a professional norm that any ethical researcher shouldfollow. In case the data is to be shared, it must be done with the consent of therespondent.
Professional objectivity
As a true researcher and contributor to the existing body of knowledge, theresearcher must maintain the objectivity of an absolutely neutral reporter of facts.He must maintain objectivity in all phases of the study while:
Designing the research objectives which must be based on facts and soundanalysis rather than simple opinion.
Collecting information by using a standard and not differential set ofinstructions. For example, in the intervention study quoted earlier, theresearcher must give the instructions in the same way to both the experimentaland control group and in no way try to exaggerate the actual impact of thetreatment.
Interpreting and presenting the findings as they are and not in a particulardirection based on the researcher’s own gut feel or liking. For example,a researcher who is a consumer of organic food will attempt toexaggerate the health benefits of the products not because that is whatwas found but because as a consumer of the category, that is what hebelieves.
Thus, as stated earlier, just like any other business function a code of ethicsfor conducting research is well structured and laid out by almost every businessassociation. At all times, the researcher must remember that besides aiding inbusiness decision-making, research also contributes to the huge domain ofmanagement knowledge. Thus, an authentic, transparent and objective reportingand compilation of the research becomes that much more critical.
Check Your Progress
4. Who is the most important and vulnerable person in the research study?
5. What is the benefit of a mutual written or unwritten contract?
6. What is professional creed in research?
NOTES
Self-InstructionalMaterial 265
Ethics in Research14.5 USES OF LIBRARY AND INTERNET IN
RESEARCH
In this section, you will study the aspects of using library and internet in research.
14.5.1 Uses of Library in Research
It is common for a researcher to be confused and disoriented while using thelibrary for research. Usually, this happens because the researchers feel at aloss as to where from and how to start searching the library resources.Therefore, a systematic and methodical approach towards the vast source ofinformation that libraries usually offer is very essential. This can facilitateresearchers in using quality time for conducting his/her search and collectingthe essential information. Researchers should, therefore, create a concretelibrary research plan. Such a plan can enable him/her make an effective use oflibrary materials for research.
Library Research Plan
A library research plan is a predefined activity that gives direction to your research.It is an act that involves evaluation that helps determine the subsequent activities tobe followed by the researcher. As such, the research plan is a sequence of stepsthat the researcher should follow in order to get a comprehensible and reliableoutline to adhere to. The various steps contained in a research plan can be statedas follows:
Subject evaluation: This involves analysing the research subject with aninformative perspective. The researcher should find out the extent ofinformation that is already available and known to him/her. This can give aclear idea about the unknown information that needs to be searched in thelibrary.
Determine the scope of research: This involves identifying whether theresearch is a general study of occurrences or is concerned with more specificinvestigation. For example, whether your research is concerned with studyingthe eating habits of working women or eating habits of working people.Accordingly, you have to search for the relevant content. You should alsocheck the chronological, geographical, political and other such aspects ofyour research study. You need to also analyse if your research deals withany specific locality, a particular time span or any current issue.
Sort-out keywords: The research subject should be disintegrated into aset of key terms or key words. A key word can be defined as a term thatexpresses the most basic words of the research content, which describesyour broad topic. The researcher should separate the distinct and unique

Ethics in Research
NOTES
Self-Instructional266 Material
words and important concepts contained in the research to use as subjectkey words. This will greatly help the researcher keep in track the relatedtopics of the research subject and avoid deviation. It is thus the mostsignificant activity of a researcher wherein he/she should determine the basicterms to be adhered to while searching for books and other similar informationresources.
Select the right library tool: Depending upon the scope of your research,you can resort to the appropriate library tools required for collecting theinformation for research. There is a wide range of tools offered by a libraryin modern times. These tools span from small almanacs and handbooks tothe most comprehensive books and anthological volumes, and most obviouslythe computerized library catalogue, which is the result of informationtechnology revolution.
Library Research Tools
Once the researcher has executed the activities involved in the research plan, he/she should start looking for the essential and relevant information. This involvesexploring information through traditional and modern library research tools, whichcontain specific bits of information as well as voluminous records and theories. Tobe able to make full use of these tools, it is necessary for the researcher to becomefamiliar with the applications of these specific library tools. The most commonlibrary research tools available in any library are as follows:
Library catalogue: A library catalogue is an informative list of resourcesand materials available in the library. It comprises the name of books orjournals along with the name of authors, subjects and publishing houses.It thus, informs the researcher what is available in the library. Usually, inthe developed countries, such catalogues are stored as computerizeddatabases, which use featured searches with headings like ‘author,’ ‘title,’‘subject’ and ‘keywords.’ However, in India, many government-fundededucational libraries are still using the paper-oriented catalogue techniqueexcept for such private libraries like the British Council Library, AmericanLibrary, Indian Institute of Technology Library, etc. It is, therefore,advisable for a researcher to refine his/her research subject to specifickey words and search for the necessary information using these keywords.
Almanacs: An almanac is a chronological tabular publication that is publishedannually. Traditional almanacs, usually, contained information regardingweather forecasts, astronomical data and several other statistics like therising and setting of sun, moon, eclipses etc. However, in the current times,almanacs have become all comprehensive and include statistical andexplanatory information regarding happenings in the whole world. Topical

NOTES
Self-InstructionalMaterial 267
Ethics in Researchweather developments, historical events, factual information, etc., are thefeatures of the present almanacs. A researcher can use these for quick graspingof facts of his research topic.
Dictionaries: Dictionaries are most often regarded as a superficial sourceof information as it is supposed to be performing the sole function of definingthe meanings of words. However, contemporary editions of dictionariesare much innovative in their own way and explain innumerable terms incontext of several usages of the specific term. As such, a researcher shouldseek factual information in the dictionary and also search for related phrasesmentioned in the context of the word being searched to get a broader viewof his/her topic of interest.
Encyclopaedia: Encyclopaedia, in general, is a bulk informative volumecontaining a synopsis of the concerned subject, which is published inalphabetical order. Encyclopaedia is, in fact, an extension of the concept ofdictionary wherein the words are described precisely. A background context,however, can make the reader get more acquainted with the research termand, therefore, it is always preferable to consult an encyclopaedia to get abetter knowledge of the subject matter. This also helps the researcher tounderstand several jargons and terminologies related to his/her subject ofresearch.
Bibliographies: A bibliography usually comprises a list of reference materialsmentioned by the researcher. This list gives the names of various sourcesthat the researcher has resorted to, such as books and articles forresearch. The bibliographies are mentioned at the end of the article orresearch paper. It gives information regarding any particular topic that hasbeen published together as a book. There are two types of bibliographiesdepending upon the information they provide. These two types can be statedand explained as follows:
o Enumerative bibliography: This is also known as compilative, referenceor systematic bibliography. It gives a general idea of the relevantpublications in a specific subject matter. The most common format to beused by the researcher while giving citations in such bibliography is asfollows:
Author
Title
Publishing company
Publication date
o Analytical bibliography: This type is further classified into descriptive,historical and textual bibliographies. Usually, these are concerned with
Ethics in Research
NOTES
Self-Instructional268 Material
the physical attributes and contemporary importance of a book. Theytake into account the size, format and context in which the book wasprinted and published, etc. Therefore, such bibliographies are not veryclosely connected to any form of research.
Bibliographies, however, provide a good research tool to refer to for aneffective exploring through the vast data available in a library.
Indexes: Indexes, as is well known, are the alphabetical lists of authors’name and subjects containing the relevant page numbers where these topicsand authors have been discussed or described in the book. In research,they facilitate searching through a number of journals simultaneously andthus provide considerable information at the start of the research process.Indexes cover a large variety of sources, ranging from books, periodicals,conference papers, reports, thesis and articles, etc.
Search engines: Search engines refer to software that browse through theInternet for the queried information and provide sites, which contain theconcerned information within a few seconds. They operate automaticallyand collect words available on a vast number of web pages. A researcherneeds to understand and learn the technique of effective utilization of asearch engine. He/She should also be aware regarding the evaluation of theresults that the search engines provide. The most popular search enginesused all over the world today are Google and Alta Vista.
It is evident from the above discussion that with technological inventions,the nature of library research has changed tremendously. It has extended its scopeand deals with vast range of information simultaneously. The researcher today,therefore, needs to familiarize himself/herself with various jargons and terminologiesto get a good grasp of the research tools. The description that follows includes thevarious words commonly used in library research.
Use of Library Resources
There are innumerable information materials available in a library. In general, theprime sources of information can be classified and explained in the context ofresearch usability as follows:
Books: Undoubtedly, books are the most significant and chief resource ofinformation in any library. However, irrelevance can greatly hamper a book’susability for the researcher. It is, therefore, very essential for a researcher toexamine whether the book he/she is referring is relevant to his/her researchstudy or not. A researcher should also check for the authority of the book,i.e., whether the author is an expert in the field or a well-known publishinghouse has published the book. Checking for the contemporariness will alsofacilitate the researcher to remain up-to-date in conducting his/her researchstudy.
NOTES
Self-InstructionalMaterial 269
Ethics in Research Journals: Journals refer to a periodical collection of articles. They alsoinclude such sources like reports, bulletins or proceedings, published monthlyby any organization or an institution. There are also certain scholarly journals,which are of great help to a researcher working in the field of humanities orsocial sciences. Usually, journals contain articles, which can offer thoroughknowledge or up-to-date information regarding the subject matter ofresearch.
Thesis: In simple terms, thesis refers to a piece of research work conductedby an individual to qualify for a degree. Usually, libraries often hold copiesof thesis, which have been submitted and approved for Ph.D. A researchercan browse through such thesis to get an idea of the layout and presentationoptions for his/her own thesis. While making use of such thesis, the researchershould remember that they are copyright protected materials and for quotingfrom a thesis, it is essential to take a prior written consent from the concernedauthor.
Manuscripts and archives: These are unpublished, sometimes hand-written or typed original and primary sources of information. A study ofthese manuscripts gives the researcher an idea of the original studyconducted in the past and thus guides him/her in conducting the research.Manuscripts can be used for citing examples to prove his/her points byreferring to past occurrences and events. It is, however, absolutelyimportant to preserve the integrity of such sources and, therefore, aresearcher should repeat the original text exactly if required without anyomissions, additions or corrections.
It is absolutely important for the researcher to check the relevance of theconcerned materials while referring anything from the mentioned sources in his/herresearch study. Usually, there is a general tendency to simply use what comes firstat hand. Secondly, one is bound to believe anything when it is in print. However, agood research is not the result of such quick and simple adaptations. A researchershould give plenty of time to conduct the research study. He/She should examineevery available source of information to its fullest usable degree.
It is also necessary to check the accuracy, timeliness and depth of the contentin the concerned source of information. Check out if the topic is being coveredexhaustively by the book, or thesis or journal to which you have resorted. It isalways advisable for the researcher to consider the target audience he/she is goingto address and scrutinize. For example, a research that aims at conducting a studyamong the students of postgraduate courses should use refined and superior levelof vocabulary. In that case, resorting to a book meant for high school studentsshould be restricted till the extent of selecting basic ideas required for the research.However, it is obviously the researcher’s job to adapt his/her target audience andpresent the ideas in his/her own unique style.
Ethics in Research
NOTES
Self-Instructional270 Material
The researcher, while conducting a research, collects a large amount ofdata and stores them in the computer. However, it depends on the hardware andsoftware capacity of the computer to store the information and data. The hardwareand software capacity can be changed or managed as per the requirements of theorganization.
14.5.2 Uses of Internet in Research
Before the evolution of the Internet, conducting a research work involved a set ofencyclopaedias and a trip to library. However, now we live in an age where theinformation is easily accessible via computer using Internet. Today, informationand data can be easily accessed with the help of the Internet. The Internet is thefastest developing and the largest repository of data. A researcher on the Internetcan find information about any topic he/she desires. The Internet acts as a hugedatabase of the content where a researcher can access an unlimited number ofinformative sources.
Research itself is a very wide term. It means a systematic enquiry of thefacts. There are various common applications of Internet research. One suchapplication of the Internet research includes the personal research that is undertakenin order to enquire about a particular subject such as news or health problems.Various other applications of the Internet research also include research undertakenby the students for academic projects and papers, and writers and journalistsresearching stories.
One of the advantages of conducting research using the Internet is thathundreds or thousands of pages can be found with some relation to the topic,within seconds, which is not possible if the same topic is to be searched frombooks or encyclopaedias. Moreover, the Internet also includes e-mail, onlinediscussion forums and other communication facilities such as instant messagingand newsgroups that help the researchers have a direct access to the experts andother individuals with relevant knowledge and interests.
There are various tools such as Internet search engine and Internet guidethat a researcher can use for collecting the information. A search engine is anonline database of Internet resources. When the researcher poses a queryabout a particular topic, the search engine looks for the likely matches withinthe database and displays the relevant content accordingly. Unlike, a standardsearch engine, the information that is contained within an Internet guide iscompiled and organized by the humans, not computer programmes.Encyclopaedia Britannica is an example of Internet guide that covers a vastcategory of different topics.
However, there is one disadvantage for the researchers in conducting aresearch with the help of the Internet. The disadvantage is that the majority of thecontent available on the Internet is self-submitted and there are few rules and
NOTES
Self-InstructionalMaterial 271
Ethics in Researchregulations that a researcher has to adhere with regard to what a researcher canpublish and what he/she cannot. Moreover, the content on the Internet maysometimes be inaccurate and opinion based.
However, the Internet must not be disregarded as the major source ofconducting research. It is one of the major sources of journals, books, generalinformation and other relevant content. Therefore, we can say that the Internet isa very important source for the researchers in this modern age for the purpose ofcollecting information.
Check Your Progress
7. What is the importance of thesis in research?
8. Give an example of internet guides.
14.6 ANSWERS TO CHECK YOUR PROGRESSQUESTIONS
1. Some of the international bodies which have provided well establishedand detailed ethical guidelines include the Social Research Association(SRA), the American Psychological Association (APA), the Councilof American Survey Research Organizations (CASRO), the AmericanMarketing Association (AMA), Business Marketing Association(BMA), etc.
2. The most significant and important ethical concern of a research study is theissue of trust and confidentiality.
3. The control of quality and privacy are important checks in a study.
4. The most important and vulnerable person in the research study is therespondent from whom the data is to be collected.
5. The benefit of a mutual written or unwritten contract is that there is nounpleasantness or legal confrontation on either side. Another advantages ofthis is that in case a point was not very clear, the issue gets clarified.
6. Professional creed refers to the overall conduct of the researcher, who hasto be truthful during all phases of the study, whether in the conceptualization,conduction or presentation of the research study.
7. A researcher can browse through the prevailing thesis to get an idea of thelayout and presentation options for his/her own thesis.
8. Unlike, a standard search engine, the information that is contained within anInternet guide is compiled and organized by the humans, not computer
Ethics in Research
NOTES
Self-Instructional272 Material
programmes. Encyclopaedia Britannica is an example of Internet guide thatcovers a vast category of different topics.
14.7 SUMMARY
Ethics are extremely important in research and standard guidelines for thisare available from different associations.
The client must not use pressure to steer the results in the direction theywant.
The researcher has maximum responsibility in following a code to ensurequality of reporting, being transparent and yet maintain the privacy of boththe client as well as the respondent.
Utmost care must be taken at all times to protect the rights of the respondent.
The researcher has to be absolutely transparent and objective whileconducting and interpreting the research study results.
A library research plan is a predefined activity that gives direction to yourresearch. It is an act that involves evaluation that helps determine thesubsequent activities to be followed by the researcher. As such, the researchplan is a sequence of steps that the researcher should follow in order to geta comprehensible and reliable outline to adhere to.
Once the researcher has executed the activities involved in the researchplan, he/she should start looking for the essential and relevant information.This involves exploring information through traditional and modern libraryresearch tools, which contain specific bits of information as well as voluminousrecords and theories.
Before the evolution of the Internet, conducting a research work involved aset of encyclopaedias and a trip to library. However, now we live in an agewhere the information is easily accessible via computer using Internet. Today,information and data can be easily accessed with the help of the Internet.The Internet is the fastest developing and the largest repository of data. Aresearcher on the Internet can find information about any topic he/she desires.The Internet acts as a huge database of the content where a researcher canaccess an unlimited number of informative sources.
14.8 KEY WORDS
BMA: Business Marketing Association.
Quality control: Maintaining the highest quality standards while conductingthe research study

NOTES
Self-InstructionalMaterial 273
Ethics in Research Research ethics: A set of principles or guidelines that will assist theresearcher in making difficult research decisions and in deciding which goalsare most important in reconciling conflicting values.
Stakeholders of research: Client, researcher and the respondents
Library research plan: A library research plan is a predefined activity thatgives direction to your research.
Library catalogue: A library catalogue is an informative list of resourcesand materials available in the library. It comprises the name of the book orjournal, along with the concerned author names and also includes subjectnames and the name of the relevant publishing house.
Search engines: Search engines refer to software that browse through theInternet for the queried information and provide sites that contain theconcerned information, within a few seconds.
14.9 SELF ASSESSMENT QUESTIONS ANDEXERCISES
Short-Answer Questions
1. What are the three basic principles of professional ethics that any researchmust follow?
2. Who are the three significant stakeholders involved in any research?
3. What is study disclosure?
4. Write a note on library catalogues.
5. Explain the use of manuscripts and archives in research.
Long-Answer Questions
1. How can you follow an ethical path for conducting your research? Arethere any guidelines available for this? Elaborate.
2. Does the client also need to maintain certain ethical standards? Explain.
3. What are the aspects that the researcher has to be careful about whileconducting a study?
4. How do you follow an ethical practice while collecting information from therespondents?
5. Discuss the various library research tools available to today’s researchers.
6. Explain the importance of the Internet in research.

Ethics in Research
NOTES
Self-Instructional274 Material
14.10 FURTHER READINGS
Chawla D and Sondhi N. 2016. Research Methodology: Concepts and Cases,2nd edition. New Delhi: Vikas Publishing House.
Easterby-Smith, M, Thorpe, R and Lowe, A. 2002. Management Research: AnIntroduction, 2nd edn. London: Sage.
Grinnell, Richard Jr (ed.). 1993. Social Work, Research and Evaluation 4th
edn. Itasca, Illinois: F E Peacock Publishers.
Kerlinger, Fred N. 1986. Foundations of Behavioural Research, 3rd edn. NewYork: Holt, Rinehart and Winston.