ON GENERAL RESEARCH METHODOLOGY
22
NAME : MWAI CATHERINE NYAWIRA ADM NO.: C50/23611/2013 UNIT CODE: PUCU 800 UNIT TITLE: RESEARCH METHODS PRESENTED TO: DR. CALVIN KAYI SCHOOL: SOCIAL SCIENCES AND HUMANITIES DEPARTMENT: GEOGRAPHY QUESTION: USING APPROPRIATE EXAMPLES, DISCUSS THE KEY STEPS IN ANALYZING QUALITATIVE DATA.
Transcript of ON GENERAL RESEARCH METHODOLOGY
NAME : MWAI CATHERINENYAWIRA
ADM NO.: C50/23611/2013
UNIT CODE: PUCU 800
UNIT TITLE: RESEARCH METHODS
PRESENTED TO: DR. CALVIN KAYI
SCHOOL: SOCIAL SCIENCES AND HUMANITIES
DEPARTMENT: GEOGRAPHY
QUESTION: USING APPROPRIATE EXAMPLES, DISCUSSTHE KEY STEPS IN ANALYZING QUALITATIVE DATA.

INTRODUCTION
This essay discusses, with appropriate examples, the key steps in analyzing qualitative data.
DEFINITION
Williams, (2007) argues that a researcher anticipates the type
of data needed to respond to research questions they have.
They will use qualitative approach for research questions
requiring textural data. Qualitative research is a holistic
approach which involves discovery. It requires natural
setting. It contains a social phenomenon which is
investigated from the participant’s point of view.
Qualitative research involves purposeful use for describing,
explaining and interpret the collected data. Qualitative data
formulates and builds new theories.
It is built on inductive rather than deductive reasoning. That
is, from what is observed, one poses questions that they
attempt to explain.

Creswell & Creswell, (2003) explain that, unlike the
quantitative data that contains close-ended information in
which the researcher sets in advance the response
possibilities, the qualitative data consist of open-ended
information without pre-determined response categories .
Qualitative researchers analyze text or image data like
transcriptions, field notes from observations, journals,
pictures, and so on. This is unlike in quantitative research
where numeric data is analyzed.
Qualitative data analysis involves organizing the data
collected and summarising it to make conclusions. This means
that once the data is collected, the researcher needs to
organize it for him/her to be able to make conclusions.
(Miles and Huberman, 1994: 12) illustrate the components of
data analysis as follows:
Data
collection Data
display

STEPS IN QUALITATIVE DATA ANALYSIS
1. Data collection and Recording
For data to be analyzed, it must be available in the first
place! Therefore, the initial stage for qualitative data
analysis, is data collection. Data for analysis can be
collected from various sources like, interviews or focus
groups, observation, group discussions, field notes, case
study and journals. Analysis of data occurs, as Miles and
Huberman, (1994) illustrate, simultaneously and iterative with
data collection, data interpretation, and report writing. That
means, as the researcher collects the data, the analysis is
done at the same time. As the researcher collects the data,
they also reflect on what the data says about the research
Data
reduction
Conclusions:
Drawing/verifying
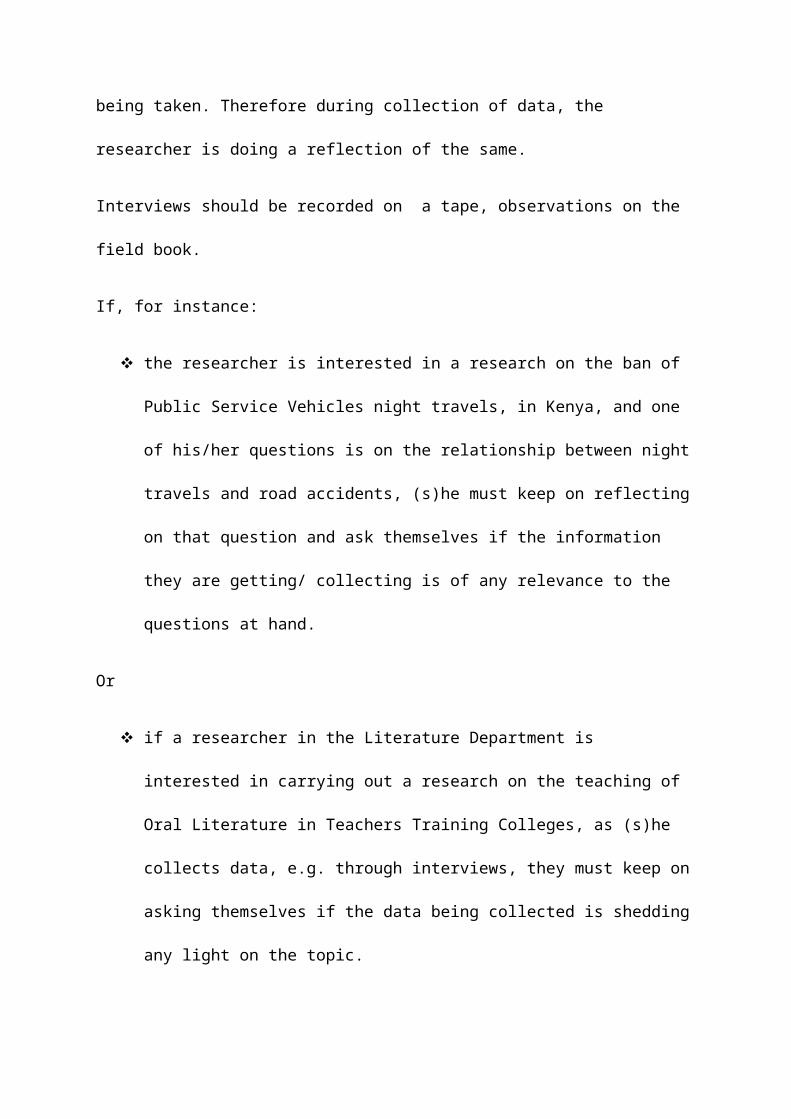
being taken. Therefore during collection of data, the
researcher is doing a reflection of the same.
Interviews should be recorded on a tape, observations on the
field book.
If, for instance:
the researcher is interested in a research on the ban of
Public Service Vehicles night travels, in Kenya, and one
of his/her questions is on the relationship between night
travels and road accidents, (s)he must keep on reflecting
on that question and ask themselves if the information
they are getting/ collecting is of any relevance to the
questions at hand.
Or
if a researcher in the Literature Department is
interested in carrying out a research on the teaching of
Oral Literature in Teachers Training Colleges, as (s)he
collects data, e.g. through interviews, they must keep on
asking themselves if the data being collected is shedding
any light on the topic.

2. Transcription of the Data Collected
Once data is collected the researcher moves to the next step
which involves transcription of the data collected.
Transcription involves presenting the data collected, e.g.
from an interview into a written form ( a transcript of the
interview). Though transcription is time consuming, it helps
the researcher to get completely involved and familiar with
what the data says about the research undertaken.
Once the researcher has transcribed the data, they should
read through the text several times to understand it
completely. A copy of the original script should also be kept
in its original form as it may be required for future use.
3. Data Display
Data displays organize, compress and assemble information.
Data displaying involves organizing the data and summarising
the large amount of information collected so that the
researcher is able to analyse it. Organization of data is done
as by using matrices as Miles and Huberman, (1994) explain.
The researcher can use hierarchical trees, figures in boxes or

come up with comparison tables to compare themes, participants
and sites.
For example:
Question 4: In your opinion, why do you think the ban of Public Service
Vehicles (PSV) night travels , in Kenya is justified?
RESPONDENT RESPONSE1 Most accidents occur between
evenings and early mornings.
At that time, the roads are generally not clear as it is ratherdark and
the drivers are also too tired.
When the driver is not able to seethe roads clearly, especially
where the roads are poor,
he is likely to cause accidents.2 Drivers, especially of buses and
trailers
are most of the times too tired from driving throughout the day.
At night they are tempted to doze off
and this may cause accidents. 3 Most drivers, especially of Public
Service Vehicles and trailers
want to arrive to their places of

destination earlier, before the next scheduled travel
so that they can get time to rest, as they are usually too tired, and see their families.
As a result, they over speed the vehicles and overtake dangerously to make it intime.
This may result to accidents on theroads.
Or in a research on teaching of Oral literature in Teachers Training Colleges the researcher may display data as follows:
Question 4: How is Oral Literature taught in your college?
Respondent
Answer
A Oral literature is never allocated a lesson as a subject but integrated in the teaching of language skills.
B Oral literature is taught during reading of novels.
C Oral literature is taught as a methodology in listening and speaking.
D We teach/learn oral literature during English language lessons especially inthe reading, listening and speaking skills.
E There is no single lesson that is indicated as Oral Literature lesson on
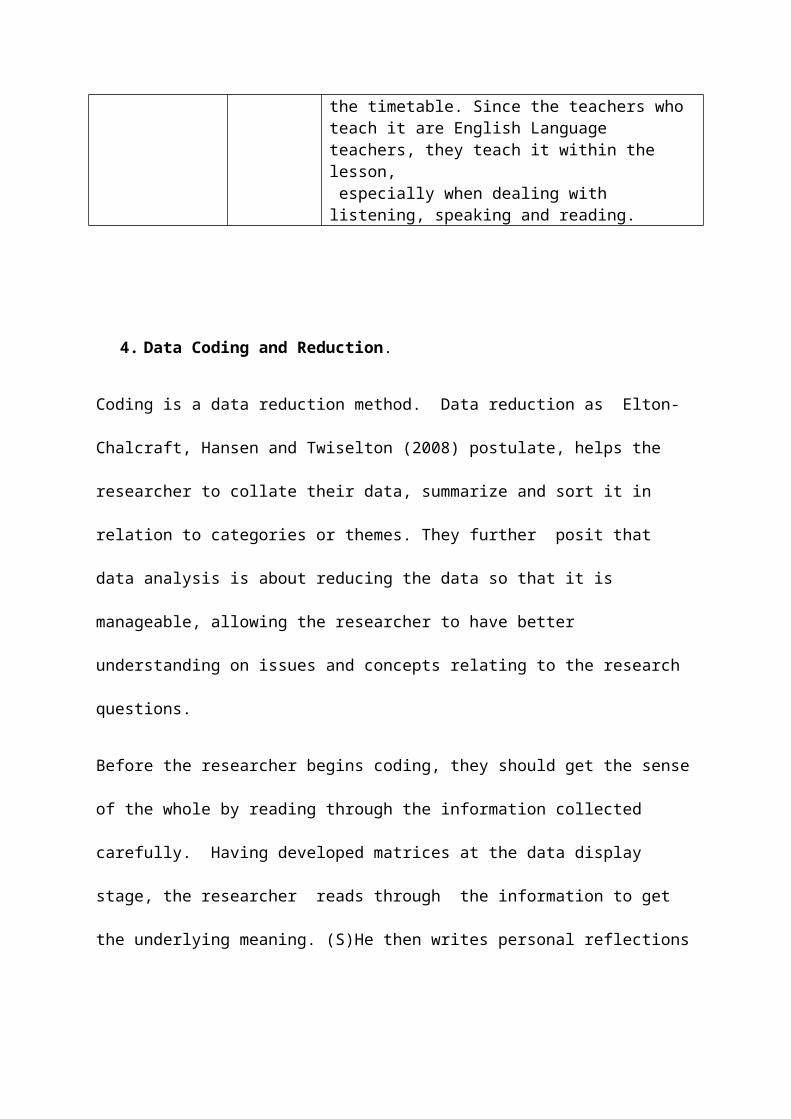
the timetable. Since the teachers who teach it are English Language teachers, they teach it within the lesson, especially when dealing with listening, speaking and reading.
4. Data Coding and Reduction.
Coding is a data reduction method. Data reduction as Elton-
Chalcraft, Hansen and Twiselton (2008) postulate, helps the
researcher to collate their data, summarize and sort it in
relation to categories or themes. They further posit that
data analysis is about reducing the data so that it is
manageable, allowing the researcher to have better
understanding on issues and concepts relating to the research
questions.
Before the researcher begins coding, they should get the sense
of the whole by reading through the information collected
carefully. Having developed matrices at the data display
stage, the researcher reads through the information to get
the underlying meaning. (S)He then writes personal reflections

or other comments in the margin. The topics are abbreviated
using codes .
Codes, can be of few letters, words or symbols, according to
(Taylor-Powell and Marcus Renner, 2003). They are placed next
to the themes and ideas that the researcher finds. This is
done for several informants, and similar topics are clustered
together. The topics are then arranged into major topics,
unique topics and leftovers; what to include and what to
exclude. As categorization occurs, the researcher is able to
identify and label all the relevant themes.
Similar things that are brought out in the data are brought
together and they make a theme. In conclusion, coding is done
to reduce information into themes and categories.
This means that from many pages of a text, the researcher
comes up with many segments. (S)He then reduces the segments
to several categories, which are then reduced to a few
categories or themes.
For instance:
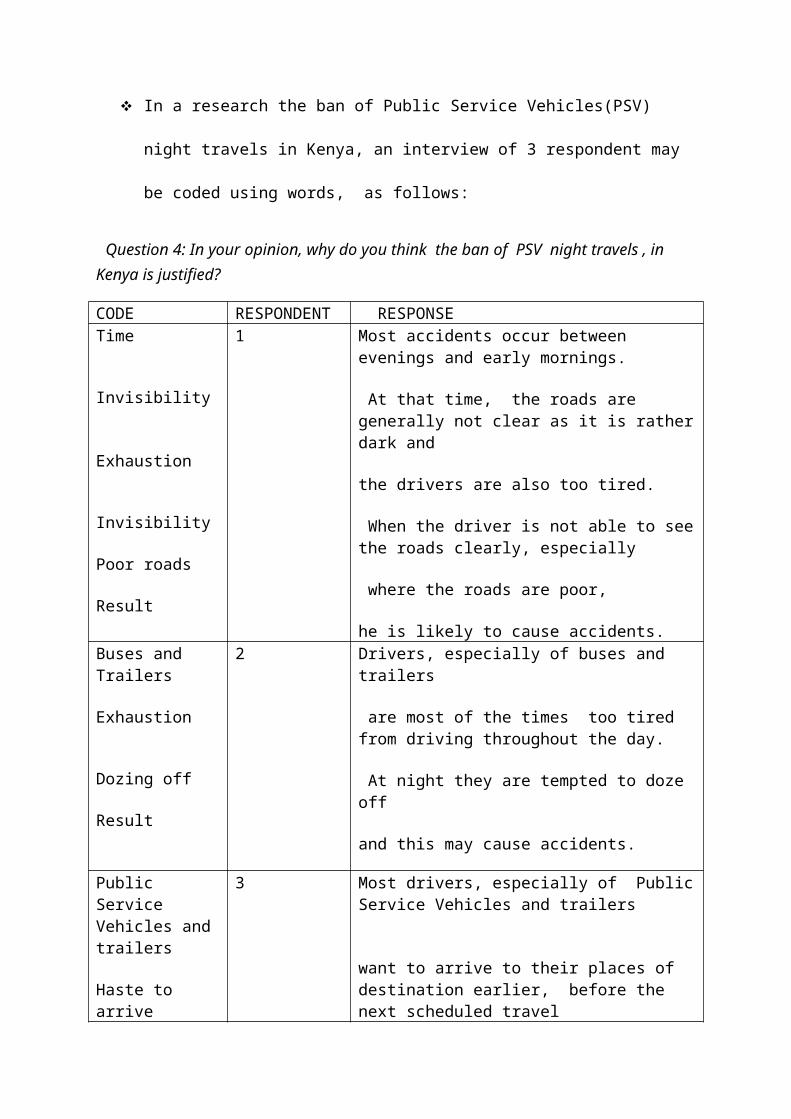
In a research the ban of Public Service Vehicles(PSV)
night travels in Kenya, an interview of 3 respondent may
be coded using words, as follows:
Question 4: In your opinion, why do you think the ban of PSV night travels , in Kenya is justified?
CODE RESPONDENT RESPONSETime
Invisibility
Exhaustion
Invisibility
Poor roads
Result
1 Most accidents occur between evenings and early mornings.
At that time, the roads are generally not clear as it is ratherdark and
the drivers are also too tired.
When the driver is not able to seethe roads clearly, especially
where the roads are poor,
he is likely to cause accidents.Buses and Trailers
Exhaustion
Dozing off
Result
2 Drivers, especially of buses and trailers
are most of the times too tired from driving throughout the day.
At night they are tempted to doze off
and this may cause accidents.
Public Service Vehicles and trailers
Haste to arrive
3 Most drivers, especially of PublicService Vehicles and trailers
want to arrive to their places of destination earlier, before the next scheduled travel

Need to rest and
bond with families
Over speedingDangerous overtaking
Result
so that they can get time to rest, as they are usually too tired, and see their families.
As a result, they over speed the vehicles and overtake dangerously to make it intime.
This may result to accidents on theroads.
Abbreviated codes, as stated by Taylor-Powell and Renner,
(2003) argue can also be used as follows, in a research
on Teaching of Oral Literature in Teachers Training
Colleges, where five respondents are interviewed:
Categories: Integrated (Int), English Language skills ( E LangS), Listening (L), Speaking(S), intensive reading (Intens R), Reading (R)
Question 4: How is Oral Literature taught in your college?
Code Respondent
Answer
IntE Lang S
A Oral literature is never allocated a lesson as a subject but integrated in the teaching of language skills.
IntIntens R
B Oral literature is taught during reading of novels.
IntL, S
C Oral literature is taught as a methodology in listening and speaking.

IntE Lang SR, L, S
D We teach/learn oral literature during English language lessons especially inthe reading, listening and speaking skills.
IntE Lang SL, S, R
E There is no single lesson that is indicated as Oral Literature lesson onthe timetable. Since the teachers who teach it are English Language teachers, they teach it within the lesson, especially when dealing with listening, speaking and reading.
5. Generating and Grouping themes
This is done by constant comparative of the constant
patterns from the codes assigned to the sections of the
interview. Boeije, (2002) explains that comparison helps the
researcher to do what is necessary to develop a theory more
or less inductively, that is, coding, delineating categories,
and connecting them. He adds, “Constant comparison goes hand
in hand with theoretical sampling” (p. 393) Themes can also be

generated from the literature review and are grounded in the
research questions. The researcher should keep on referring to
the research question in order to establish how the ideas from
their data answers the questions.
For instance, in the research about the ban of PSV night
travels in Kenya, one of the research questions may based on
the relationship between occurrence of road accidents and
night travel. The researcher should establish those ideas from
the data gotten from the interview conducted, that answer
such a question.
Similar themes are grouped together to reduce their number.
The researcher, according to Taylor-Powell and Marcus
Renner, (2003) creates super categories whereby several
categories are combined into larger ideas and concepts.
In the research on the ban of night travels, a super
category_ CAUSES OF ACCIDENTS can be created. The code
can be made up of: poor roads, exhaustion in drivers,
over-speeding and dangerous overtaking.

In the Research on teaching of Oral Literature in
Colleges, we can create a super category- LANGUAGE SKILLS
which is made up of: Listening (L), Speaking (S), and
Reading (R)
It may also be found out that two or more themes consistently
occur together in the data, so that whenever one is found, the
other does not miss. The researcher, from such occurrences,
may want to suggest a cause and effect relationship.
For instance, from the above interviews,
Exhaustion in drivers of public service vehicles and trailers
is linked to accidents. The researcher may therefore argue
that most accidents are as a result of exhaustion in drivers.
In the second example. teaching of Oral literature goes hand
in hand with integration and language skills. From this, one
may argue that oral literature helps in the teaching of
Language skills.
Or if in an interview, poverty is constantly linked to poor
performance among students, a researcher may argue that
poverty causes poor performance among students.

6. Interpretation of data and Conclusion
Interpreting the data as explained by Taylor-Powell and
Renner, (2003) simply means, “ …attaching meaning and
significance to the analysis.” (p. 5) It involves
synthesizing the ideas learnt and attaching meaning and
significance to the data analysed which they refer to as, “
Bringing it all together” The significant ideas from the
analysis are gotten after studying the patterns and the
relationship between themes. Once the themes are gotten, the
researcher can easily select lessons learnt from the research.
Interpretation of data helps the researcher to reflect
critically on the findings to enable them come up with claims
or hypothesis which helps in description of the phenomenon
under study. Themes and connections are used to explain the
findings. The field data helps in identifying the theory to
use.
For instance,
The interpretation of the data on the ban of night bus
travels in Kenya, as far as causes of accidents at night
is concerned, can be as follows:
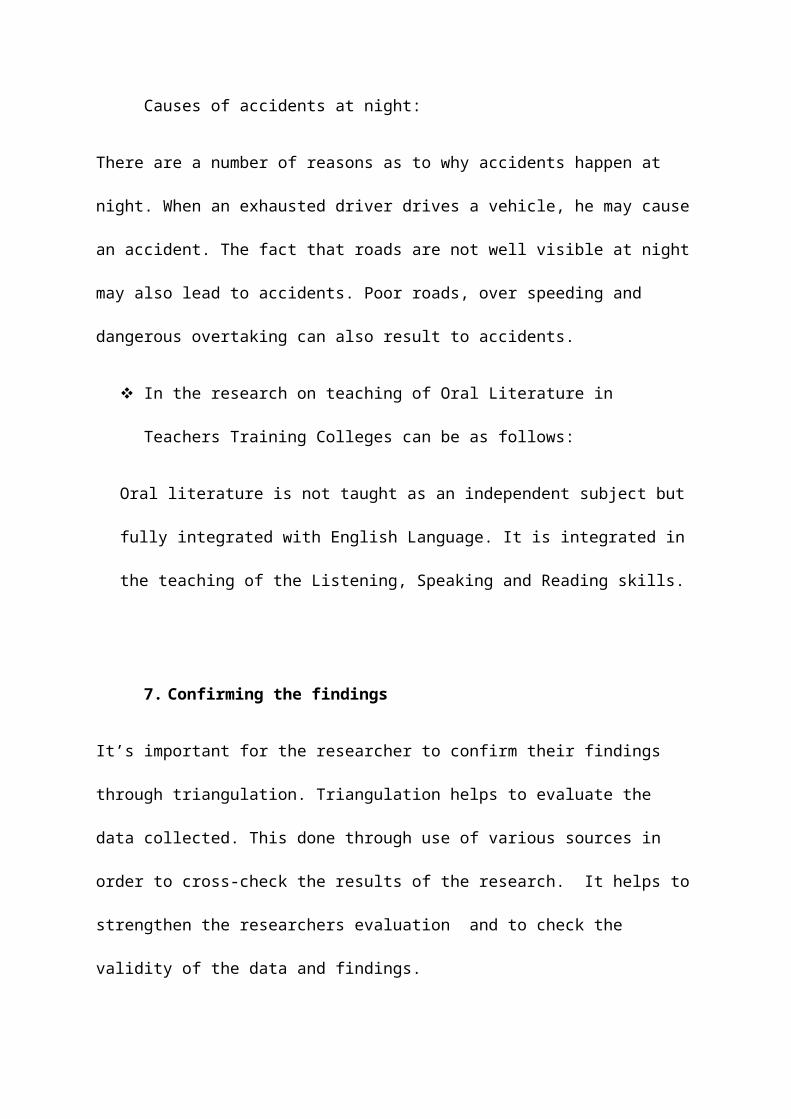
Causes of accidents at night:
There are a number of reasons as to why accidents happen at
night. When an exhausted driver drives a vehicle, he may cause
an accident. The fact that roads are not well visible at night
may also lead to accidents. Poor roads, over speeding and
dangerous overtaking can also result to accidents.
In the research on teaching of Oral Literature in
Teachers Training Colleges can be as follows:
Oral literature is not taught as an independent subject but
fully integrated with English Language. It is integrated in
the teaching of the Listening, Speaking and Reading skills.
7. Confirming the findings
It’s important for the researcher to confirm their findings
through triangulation. Triangulation helps to evaluate the
data collected. This done through use of various sources in
order to cross-check the results of the research. It helps to
strengthen the researchers evaluation and to check the
validity of the data and findings.

O' Conor and Gibson, (2003) expound on how data can be
confirmed using a number of dependent sources. They too
argue that when the findings are confirmed by more than one
‘instrument’ measuring same thing, the validity is enhanced.
Triangulation can be from different sources. The researcher
can also interview different members of the community who can
give different perspectives on specific questions or topic.
For instance:
In the research on the banning of night travels by PSV in
Kenya, the researcher may ask traffic police officers
questions, to enhance the validity of the data given by
the drivers and the general public on the topic.
In the research on teaching of Oral Literature in
Teachers Training Colleges, the researcher can ask the
consumers of the content given in class(student-teachers)
questions to confirm the findings derived from the data
given by tutors of these colleges.
Data can also be confirmed by using different methods. For
instance, if data was collected using interviews, the

researcher may be interested in looking at the same questions
or topics by trying to answer them using a different research
method like observation or focus groups. The researcher may as
well use quantitative data to triangulate qualitative data.
This can be done by designing a short questionnaire of close –
ended questions to cross-check the findings of the qualitative
data. For instance:
After conducting an interview using open-ended questions,
the researcher may design a questionnaire with close-
ended questions on the topic on the ban of night travels
of PSV in Kenya. E.g.
Question 3: At what time do most accidents occur on the
roads in Kenya
a. Between 6a.m- 9a.m
b. Between 9a.m – 6p.m
c. Between 6p.m-6a.m
Question 4. : Indicate whether the following
propositions about occurrence of road accidents in Kenya,
at night are true or false.

a. Most accidents occur due to poor visibility of the
roads.
b. Exhausted drivers are likely to cause accidents at
night.
c. Exhausted drivers tend to over speed and overtake
dangerously on the roads.
d. Road accidents at night and mostly involve buses and
trailers
Triangulation can also be done by having different researchers
conduct the same research, or analyze the same data. The
findings are then compared. This is a good way to test the
validity of the research done.
The researcher needs to ask themselves if the findings are
what they were expecting, if there were major surprises in
the findings and if they find anything similar or different
from the literature from other similar studies. The answers
can be found by reviewing the research questions,
triangulation using information from the previous studies on
the same topic, personal notes, observations or journals on
the same topic.

CONCLUSION
The steps in qualitative data analysis are iterative and run
simultaneously. As the researcher is doing one thing he is
also doing another. For instance, as collection and recording
is being done, the researcher is reflecting and looking for
relationship between the data being collected and the findings
(s)he expects. Data reduction is also done in all stages after
collection and recording. This enables the researcher to
reduce the information to few themes and thus enable them to
draw conclusions. One step is dependent of the other.
REFERENCE
Boeije, H. (2002). A Purposeful Approach to the Constant ComparativeMethod in the Analysis of Qualitative Interviews. Quality and Quantity ,391-409.
Creswell, J. W., & Creswell, J. D. (2003). Mixed Methods Research: Developments,Debates, and Dilemmas. In R. A. Swanson, & E. ElwoodF. Holton, Research in Organizations: Foundations and Methods of Inquiry (pp. 315-326). San Francisco: Berrett- Koehler Publishers.
Ellen Taylor-Powell; Marcus Renner. (2003). Analyzing Qualitative Data. Programme Devevopment & Evaluation , 1-12.

Helene O' Conor; Nancy Gibson. (2003). A Step-by-Step Guide to Qualitative Data Analysis. A Journal of Obriginal and Indigenous Community Health , 1-100.
Miles, M.; Huberman, A. (1994). Qualitative Data Analysis: An Expanded Source Book (2nd Edition). Thousand Oakes: Sage.
Sally Elton-Chalcraft; Alice Hansen; Samantha Twiselton. (2008). Doing Classroom Ressearch: A Step-by-Step Guide for Student Teachers. Berkshire: Open University Press.
Williams, C. (2007). Research Methods. Journal of Business & Economic Research , 65-72.