Research Design and Methodology
37
1 Research Design and Methodology Contents List of Tables ........................................................................................................................................................................ 2 List of Figures....................................................................................................................................................................... 3 1.0 RESEARCH DESIGN OVERVIEW ......................................................................................................4 1.1 Planning and Preliminary Phase...................................................................................................................... 4 1.1.1 Defining the Study Population ................................................................................................................. 4 1.1.2 Defining Community .................................................................................................................................... 5 1.1.3 Defining Rural Communities .................................................................................................................... 5 1.1.4 Defining Aboriginal Communities .......................................................................................................... 6 1.2 Data Collection ........................................................................................................................................................ 7 1.2.1 Desktop Research.......................................................................................................................................... 8 1.2.2 Community-Based Research..................................................................................................................... 9 1.2.3 Surveys .............................................................................................................................................................. 9 1.2.4 University Ethics............................................................................................................................................ 9 1.2.5 Informed Consent ..................................................................................................................................... 9 1.2.6 Moderator Guides ....................................................................................................................................... 10 1.3 Data Analysis.......................................................................................................................................................... 10 1.4 Quality Assurance/Quality Control .............................................................................................................. 10 1.4.1 Data Dictionary and Explanation File ................................................................................................. 10 1.4.2 Data Limitations .......................................................................................................................................... 11 2.0 DATA COLLECTION METHODOLOGY ........................................................................................ 13 2.1 Statistical Data....................................................................................................................................................... 13 2.1.1 Sampling Method .................................................................................................................................... 13 2.1.2 Completed Data Collection .................................................................................................................. 13 2.1.3 Notes About Statistical Data ................................................................................................................... 13 2.1.4 Data Analysis ............................................................................................................................................ 14 2.2 Community Meetings.......................................................................................................................................... 14 2.2.1 Sampling Method......................................................................................................................................... 14 2.2.2 Meetings Held ............................................................................................................................................... 16
-
Upload
khangminh22 -
Category
Documents
-
view
1 -
download
0
Transcript of Research Design and Methodology
1
Research Design and Methodology
Contents List of Tables ........................................................................................................................................................................ 2
List of Figures....................................................................................................................................................................... 3
1.0 RESEARCH DESIGN OVERVIEW ......................................................................................................4 1.1 Planning and Preliminary Phase...................................................................................................................... 4
1.1.1 Defining the Study Population ................................................................................................................. 4
1.1.2 Defining Community .................................................................................................................................... 5
1.1.3 Defining Rural Communities .................................................................................................................... 5
1.1.4 Defining Aboriginal Communities .......................................................................................................... 6
1.2 Data Collection ........................................................................................................................................................ 7
1.2.1 Desktop Research .......................................................................................................................................... 8
1.2.2 Community-Based Research ..................................................................................................................... 9
1.2.3 Surveys .............................................................................................................................................................. 9
1.2.4 University Ethics............................................................................................................................................ 9
1.2.5 Informed Consent ..................................................................................................................................... 9
1.2.6 Moderator Guides ....................................................................................................................................... 10
1.3 Data Analysis.......................................................................................................................................................... 10
1.4 Quality Assurance/Quality Control .............................................................................................................. 10
1.4.1 Data Dictionary and Explanation File ................................................................................................. 10
1.4.2 Data Limitations .......................................................................................................................................... 11
2.0 DATA COLLECTION METHODOLOGY ........................................................................................ 13 2.1 Statistical Data ....................................................................................................................................................... 13
2.1.1 Sampling Method .................................................................................................................................... 13
2.1.2 Completed Data Collection .................................................................................................................. 13
2.1.3 Notes About Statistical Data ................................................................................................................... 13
2.1.4 Data Analysis ............................................................................................................................................ 14
2.2 Community Meetings.......................................................................................................................................... 14
2.2.1 Sampling Method ......................................................................................................................................... 14
2.2.2 Meetings Held ............................................................................................................................................... 16

2
2.2.3 Meeting Overview ....................................................................................................................................... 17
2.2.4 Data Analysis ................................................................................................................................................. 19
2.3 Key Informant Interviews ................................................................................................................................ 19
2.3.1 Sampling Method ......................................................................................................................................... 19
2.3.2 Process ............................................................................................................................................................. 20
2.3.3 Data Analysis ................................................................................................................................................. 20
2.4 Telephone Survey ................................................................................................................................................ 20
2.4.1 Questionnaire Development........................................................................................................................ 21
2.4.2 Sampling Method ......................................................................................................................................... 21
2.4.3 Surveys Completed ..................................................................................................................................... 22
2.4.4 Notes about the Telephone Survey ...................................................................................................... 24
2.4.5 Data Analysis ................................................................................................................................................. 25
2.5 Web-Based Survey ............................................................................................................................................... 31
2.5.1 Sampling Method ......................................................................................................................................... 31
2.5.2 Surveys Completed ..................................................................................................................................... 32
2.5.3 Notes About the Web-Based Survey ........................................................................................................ 34
2.5.4 Data Analysis ................................................................................................................................................. 34
3.0 CONCLUSION .............................................................................................................................. 37
List of Tables Table 1 Definition of Study Population .......................................................................................................................... 5 Table 2 Study Population CSDs .......................................................................................................................................... 6 Table 3 Number of CSDs in the Study Population ...................................................................................................... 7 Table 4 Sample Draw for Community Meetings ....................................................................................................... 15 Table 5 Sample CCS Selected, by Province, after draw .......................................................................................... 16 Table 6 Overview of meetings held by province and rural/Aboriginal CSD ................................................. 16 Table 7 Overview of communities invited to meetings, by province and rural/Aboriginal CSD ......... 17 Table 8 Original Telephone Survey Responses ......................................................................................................... 21 Table 9 Demographic Analysis of First Round Telephone Survey .................................................................... 22 Table 10 Final Telephone Survey Sample Responses ............................................................................................ 22 Table 11 Median Age of Survey Sample Compared to Study Population ....................................................... 23 Table 12 Communities Represented by Telephone Survey (n=1,756) ........................................................... 23 Table 13 Factors extracted by means of EFA (Exploratory Factor Analysis) loading and Cronbach’s Alpha ........................................................................................................................................................................................... 29 Table 14 Initial Web Survey Respondents by CSD and Province ...................................................................... 32 Table 15 Web Survey, by community and province ............................................................................................... 33 Table 16 Factor Dimensions, Variables, Adaptation from Telephone Survey, and Cronbach’s Alpha ....................................................................................................................................................................................................... 35

3
List of Figures Figure 1 Data Collection to support four research dimensions ........................................................................... 8 Figure 2 Research Framework for Co-operative Innovation Project ................................................................. 8 Figure 3 Map of Community Meetings .......................................................................................................................... 17 Figure 4 Community Posters Examples ....................................................................................................................... 18 Figure 5 Map of Telephone Survey Respondents ..................................................................................................... 24 Figure 6 Map of Web Survey Respondents ................................................................................................................. 34

4
1.0 Research Design Overview
The CIP was an ambitious, multi-disciplinary, multi-faceted research project. It used mixed methods
(qualitative and quantitative) research to study co-op development. The aim of the research was to
provide both theoretical and practical outcomes. CIP relied on multiple techniques for data
collection and analysis. Quantitative and qualitative research and analysis occurred concurrently,
continually informing iterations of data collection and data analysis.
The data collection techniques included literature reviews of existing academic research and
practitioner documents on co-op development, community engagement events with focus groups,
interviews with co-op developers, telephone surveys of community residents, web-based surveys of
community administrators, and the compilation of existing statistical and other public and private
data. The qualitative analysis was primarily inductive and informed by grounded theory.1 The
quantitative analysis was primarily deductive and identified correlations between variables and
constructs. Where possible, triangulation of results supported validation and further investigation
of patterns.
1.1 Planning and Preliminary Phase
1.1.1 Defining the Study Population The scope of this research project was limited to rural communities, and rural Aboriginal
communities. There are multiple ways of defining “rural”, “Aboriginal” and “community”, and
establishing definitions for use in this project was crucial to determine the study and sample
populations. Any definition is likely to be contestable, but it was important to be consistent in our
use of the terms throughout the project to facilitate some comparison across data sources.
Numerous discussions were held among the project team, drawing in research and opinions from
academics who had done extensive empirical work in rural development, as well as those who had deep Aboriginal knowledge and experience, particularly in and of First Nation and Metis
communities in Western Canada.
Note, when we use ‘Aboriginal’, we are referring to those communities that are rural and
Aboriginal, and ‘Rural’ when we are referring to communities that are rural and non-Aboriginal. We
outline more detailed definitions in the sections below. For the purposes of this project, Statistics
Canada geographical boundaries and definitions are from the 2011 census unless otherwise stated.
1 Suddaby, R. “From the editors: What grounded theory is not.” The Academy of Management Journal. 2006: 49(4): 633-642; Johnson, R.B., & A.J. Onwuegbuzie. “Mixed Methods Research: A Research Paradigm whose Time has come.” Educational Researcher, 2004: 33(7): 14-26; Harrits, G.S. “More than Method?: A discussion of paradigm differences within mixed methods research. Journal of Mixed Methods Research, 2011: 5(2): 150-166.

5
Table 1 Definition of Study Population
Location
Demographic Urban Rural Aboriginal Urban Aboriginal Aboriginal Non-Aboriginal Urban Non-Aboriginal Rural
1.1.2 Defining Community There are many definitions of community. Oxford Dictionary provides several definitions, two of
which are: “a group of people living in the same place or having a particular characteristic in
common;” and “a particular area or place considered together with its inhabitants.”2 These
definitions show both the underlying question of whether space or people come first in drawing
boundaries around communities, and the inherent importance of both.
For the purpose of this study, we used the Statistics Canada census subdivision (CSD) as our
boundary of a community. The CSDs are drawn along boundaries that represent unique governing
arrangements. For example, a CSD encompassing a rural municipality may completely surround a
number of other CSDs representing towns or Aboriginal reserves. Keeping in mind the importance
of people to the definition of community, any CSDs with zero population were dropped from our
study population.
This demarcation of a community does not always align with an individual’s perception and
definition of their community, or with the governing reality in that community, and we explore this
in the community meetings. However, using the CSDs to develop our initial study population
allowed us to link statistical information drawn from the census and surveys to both describe the
communities in our study and to better understand the general socio-economic realities of the
communities that we visited.
1.1.3 Defining Rural Communities There are numerous definitions of ‘rural’ and the choice of the definition by an analyst should be
determined by the topic being addressed.3 For this project, we went with a simple notion of rural –
rural is all territory lying outside an urban area.4 Using Statistics Canada definitions, this allowed us
to utilize CSDs that are located outside of Census Metropolitan Amalgamations (CMAs) or Census
Agglomerations (CAs). A CMA is an area with a population of at least 100,000 of which more than
50,000 live in the core, and a CA has a core population of at least 10,000.5
The idea of rural is much more complex, however, than simply defining it by population. One
limitation with this definition is that communities near to large urban centres may be included, but
their socio-economic reality is much closer to that of an urban area. To account for CSDs that are
2 Oxford Dictionaries, http://www.oxforddictionaries.com/definition/english/community. Accessed November 16, 2015. 3 du Plessis, Valerie, Roland Behiri, Ray D. Bollman, and Heather Clemenson. “Rural and Small Town Canada Analysis,” Statistics Canada Bulletin 3 (3) November 2001. Catalogue no. 21-006-XIE. 4 Statistics Canada, 2001, 261. 5 See Statistics Canada, 2011 for a full description of CMAs and CAs.

6
strongly influenced by urban areas, we eliminated any CSDs that have been identified by Statistics
Canada as being in a strong Metropolitan Influenced Zone (MIZ).6 This group of CSDs has
populations where more than 30% of the employed workforce commutes to a CMA or CA for
employment. All CSDs associated with CMAs, CAs, and strong MIZ have been classified as urban for
the purpose of this study.
Given the above parameters, our study population was all CSDs with a population above zero,
outside of a CMA, a CA and/or a strong MIZ, and within the provinces of Manitoba (MB), Saskatchewan (SK), Alberta (AB) and British Columbia (BC). There are 165 CSDs in the study area
with a zero population. Table 2 gives a breakdown of our study CSDs.
Table 2 Study Population CSDs
Province Total CSDs with population > 0
CMA/CA CSDs Strong MIZ CSDs
Rural CSD (Study Population)
Manitoba 279 19 17 243 Saskatchewan 903 64 62 777 Alberta 421 81 52 288 British Columbia
656 199 34 423
Total 2259 363 165 1731
1.1.4 Defining Aboriginal Communities To determine which CSDs are Aboriginal, we used the Statistics Canada CSD type descriptor.
Communities that met our definition of rural, and have a CSD type of Indian reserve / Réserve
indienne (IRI), Indian Government District (IGD), Indian settlement / Établissement indien (S-É),
Settlement (SET), Terres réservées aux Cris (TC), Terres réservées aux Naskapis (TK), and Nisga'a
land (NL) were counted as Aboriginal.7
Other rural communities, especially in northern and remote areas, may have a high percentage of
population that identifies as Aboriginal. There may be good reasons to consider the impact of the
demographic composition of a community on the needs and assets of the community, which may
offer an argument to classify some rural communities as Aboriginal, or vice versa. The depth of
analysis to make these determinations for each of our communities was outside the scope and
constraints of this project, though on the telephone and web surveys we did ask people to identify
whether their community was predominantly Aboriginal or not.
Additionally, many Aboriginal CSDs are associated with the same community name. Some of the
CSDs associated with the same community name have a zero population and have been eliminated
from our study population. In other cases, population is recorded in multiple CSDs associated with
the same community name. This could happen when there is geographic distance between the
portions of a community that are governed by one governing body. It could also be an instance
where multiple governing bodies exist under one community name.
6 See Statistics Canada, 2011, for a full explanation of MIZs. 7 For a complete listing of CSD types and their meanings please see Census Canada, 2015 available here: http://www.statcan.gc.ca/eng/subjects/standard/sgc/2011/sgc-leg-4

7
Using only Statistics Canada information, it is not possible to discern which governing pattern is
playing out in each case. As a result, the project has generally counted each CSD with a positive
population as an independently governed community, although we recognize that this may not
always be the case. Where it is appropriate for analysis purposes for the CSDs associated with the
same community name to be combined into one community, the methodology is explained.
Error! Reference source not found.
Table 3 below delineates the number of rural and Aboriginal CSDs in our study.
Table 3 Number of CSDs in the Study Population
Province Rural CSDs
Aboriginal CSDs
Total CSDs (Study
Population)
Aboriginal CSDs
associated with same
community name
Modified Population
after combinations of Aboriginal
CSDs (a) (b) (c) = (a) + (b) (d) (e) = (c) – (d) Manitoba 171 72 243 8 235 Saskatchewan 665 112 777 40 737 Alberta 229 59 288 20 268 British Columbia
179 244 423 83 340
Total 1244 487 1731 151 1580
1.2 Data Collection
The project aimed to collect data from a variety of sources to bring together knowledge of the four
research dimensions: community need, social capacity, business capacity, and knowledge of co-
operative model. (For more on these dimensions, see the CIP Overview chapter in the final report).

8
Figure 1 Data Collection to support four research dimensions
Simultaneously, the team began to research the existing literature and current practices regarding
the stages of development for an individual co-operative. This review and interview process helped
to determine if the existing development frameworks would work in rural and Aboriginal
communities or if other models or supports were needed.
Figure 2 Research Framework for Co-operative Innovation Project
1.2.1 Desktop Research Desktop-based research consisted of a document and database review of available information,
statistics, and other data from private, federal, provincial, regional, and local sources. A statistical
• Desktop Research• Community meetings• Surveys• Statistical
Information• Developer Interviews
• Desktop Research• Statistical
Information• Community Meetings• Surveys• Developer Interviews
• Community Meetings• Surveys• Desktop Research• Statistical
Information• Developer Interviews
• Desktop Research• Community Meetings• Surveys• Co-operative
Statistics• Developer Interviews
Knowledge of
Cooperative Model
Community Need
Social Capacity
Business Capacity
Data Analysis Development Framework
Dimensions of
Development
Stages of Development
Co-op Data
Community Data
StatisiticalData
Developer Interviews
Co-operative Development Environment
Model
Data Collection
9
and bibliographic search was completed to identify, extract and compile available information that
may influence co-operative development.
Statistical data was derived largely from government sources. Key sources include the 2006 and
2011 census of Canada, the 2011 National Household Survey (NHS), population reports from
Provincial Ministries of Health; and data from the four provincial Bureaus of Statistics or similar
entities. Together these sources provide general demographic, economic and education information
for the communities in our study.
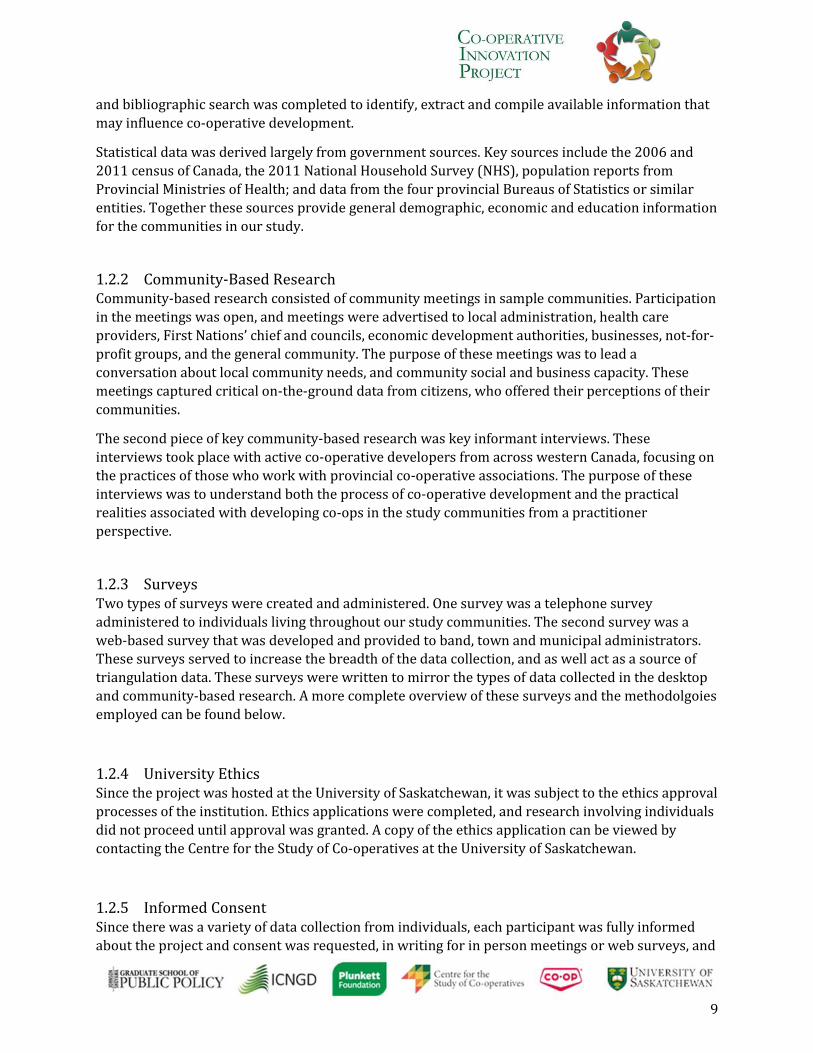
1.2.2 Community-Based Research Community-based research consisted of community meetings in sample communities. Participation
in the meetings was open, and meetings were advertised to local administration, health care
providers, First Nations’ chief and councils, economic development authorities, businesses, not-for-
profit groups, and the general community. The purpose of these meetings was to lead a
conversation about local community needs, and community social and business capacity. These
meetings captured critical on-the-ground data from citizens, who offered their perceptions of their
communities.
The second piece of key community-based research was key informant interviews. These
interviews took place with active co-operative developers from across western Canada, focusing on
the practices of those who work with provincial co-operative associations. The purpose of these
interviews was to understand both the process of co-operative development and the practical
realities associated with developing co-ops in the study communities from a practitioner
perspective.
1.2.3 Surveys Two types of surveys were created and administered. One survey was a telephone survey
administered to individuals living throughout our study communities. The second survey was a
web-based survey that was developed and provided to band, town and municipal administrators. These surveys served to increase the breadth of the data collection, and as well act as a source of
triangulation data. These surveys were written to mirror the types of data collected in the desktop
and community-based research. A more complete overview of these surveys and the methodolgoies
employed can be found below.
1.2.4 University Ethics Since the project was hosted at the University of Saskatchewan, it was subject to the ethics approval
processes of the institution. Ethics applications were completed, and research involving individuals
did not proceed until approval was granted. A copy of the ethics application can be viewed by
contacting the Centre for the Study of Co-operatives at the University of Saskatchewan.
1.2.5 Informed Consent Since there was a variety of data collection from individuals, each participant was fully informed
about the project and consent was requested, in writing for in person meetings or web surveys, and

10
verbally for telephone surveys or interviews. Consent applied to both participation in the project,
and the Centre’s right to use, publish and transfer the data. A copy of the consent form is available
in the Appendix.
1.2.6 Moderator Guides A standardized interview/meeting moderator guide was created and modified through two pilot
meetings to ensure reliability and to minimize potential data errors that can stem from vague or
unclear questions or interviewer bias. This guide included standard questions for each
interview/meeting; however researchers had the opportunity to alter the format modestly to
ensure that the flow of conversation and the flow of the meeting were appropriate for each
community.
1.3 Data Analysis Data analysis consisted of two main types of analysis. The first was content analysis, which was
used to analyze community meeting notes, websites, and interviews. Content analysis helps
researchers broadly identify key concepts and factors related to the dimensions, code and
categorize keywords, and identify patterns within and across the data.
The second type was gap analysis, the intent of which was to review existing data to identify which
areas need to be the focus of future research. This analysis looked at the outcomes of the content
analysis to identify potential indicators that need to be further explored. The result of the gap
analysis will be a direction or path forward into future research, informing a research agenda to
measure aspects of co-operative development in rural and Aboriginal communities in western
Canada in the future.
1.4 Quality Assurance/Quality Control Quality assurance and quality control (QA/QC) ensures accurate data collection and analysis to
minimize potential errors. Community visits and desktop research complement each other by
allowing for the cross-checking of information consistency and saturation.
Potential sources of error in information and data collection can include:
• Inaccurate statistical collection by Statistics Canada or other data collection firms; • Inaccurate or out-of-date websites and reports; • Measurement methods used in secondary information sources; • Human error; • Rounding error(s); and • Coding errors.
1.4.1 Data Dictionary and Explanation File A data dictionary was created to help future researchers understand how CIP defined and analyzed
the collected statistical data from Statistics Canada and related sources, and from the telephone and
web surveys. This dictionary describes the variables that have been used as part of the quantitative
analysis. It contains: variable name, coding, number of unique observations, a short description, a
long description, type of variable, and source of variable.

11
A master file with individual explanations of each data file was also created. It contains greater
depth of information on each data source, including data that was collected but not used in-depth
for the quantitative analysis. These files are internal to the Co-operative Innovation Project, but will
be useful as training tools for groups who may wish to access or share data created by the Co-
operative Innovation Project.
1.4.2 Data Limitations The limitations of the baseline information are dependent on the data collection, analysis, and
presentation methods used. Existing statistical information is limited, particularly for smaller
communities where confidentiality concerns restrict the kinds of published data and information
sources that are more readily available in larger centres.
In the absence of existing data, some sections rely in part on contextual information for the wider
region and anecdotal evidence from community professionals and authorities with first-hand
knowledge of the communities. In these cases, attempts have been made to verify opinions and
anecdotes through triangulation with other sources. There are a number of more minor technical
caveats and limitations associated with using census information that will be outlined, as there are
with the use of any secondary data sources.
1.4.2.1 Community Visits
Four potential limitations were identified:
• inaccuracy in the information provided due to misunderstanding of questions; • potential for limited, biased, or strategic answers can develop when collecting
information in a community setting, leading to inaccuracies in the information collected; • limitations depending on the number of people attending the meeting, which can lead to
a less accurate or representative view of community needs, social capacity, or business capacity; and
• quality and accuracy of the notetaker notes and field notes.
The project team used the following techniques to address limitations:
• developed and reviewed the moderator guides to watch for misunderstanding; • took courses on focus group facilitation to train moderators; • created a template for notetakers and field notes, for team members and hired
notetakers to follow; • provided an oral overview of notetaker expectations prior to the beginning of each
community meeting; • used multiple field notes and notetaker notes for each community to mitigate potential
inaccuracies; • advertised community meetings in multiple ways, to ensure robust community
participation.
1.4.2.2 Desktop Sources
As noted above, desktop sources generally consist of reviewing previous studies and data sources
for information. In this case, there is no control over the methods used to obtain the results. The

12
choice of information sources by researchers is a potential source of bias. The team worked to
minimize bias by cross-referencing between team members from different backgrounds and
experiences, using multiple search engines and databases to find references, and using both current
and historical sources where necessary.

13
2.0 Data Collection Methodology
The CIP used a variety of data collection techniques to generate different kinds of data sources to be
used in the overall analysis. Each method of data collection required different expertise and
skillsets from the larger project team.
2.1 Statistical Data
2.1.1 Sampling Method There is an array of statistical information related to our research that is publicly available in a
variety of formats. Based on a literature review and extensive discussions, the team preselected
over 100 statistical variables that were thought to be of interest to the research. A data analyst then
set about trying to find usable data sources for our purposes.
For consistency and comparability of data, the CIP team focused primarily on data products from
Statistics Canada. This allowed us to accurately compare data to the CSD level, and to define our
communities. While variables are available outside of what was used by our project, a secondary
review of the variable list halfway through the project indicated that further work to obtain and
clean more variables would be outside the scope of our timelines. As a consequence, the team
identified a limited number of key variables that were both available and applicable to the project
goals and purpose.
Secondary data was collected through agreements with the provincial co-operative associations,
data purchases from provincial registries, and primary data collection by students, which included
distances from rural and Aboriginal study communities to the nearest CAs and CMAs.
2.1.2 Completed Data Collection The full listing of statistical information that the CIP captured and utilized is available in the project
data dictionaries. Individuals interested in this information should contact the Centre for the Study
of Co-operatives at the University of Saskatchewan as the size and scope of everything in these files
is too large to capture in this report.
2.1.3 Notes About Statistical Data One of the critical challenges with statistical data is creating time comparisons between 2006 and
2011 data. Census CSD boundaries often changed between these time periods. As such, it can be
challenging to create accurate comparisons over time. A good example is data that the team
collected on quality of life. The data is collated to the health region level, which does not align with
the CSD boundaries, or even the boundaries of multiple CSDs. As a result, it was not possible for our
team to use this information in great depth.
There are well-known issues with the 2011 National Household Survey (NHS) that was completed
in place of the previous long-form census. Response rates are very low in some communities,
particularly in some of the communities of most interest to our research. Information is also
suppressed in many of the communities due to their small size. The decision was made to utilize the
14
data in good faith and to make note of potential data problems or unreliability when completing
analysis at the individual community level. If the opportunity exists to collect and compare data
that will be collected in the 2016 census, reliability problems in the 2011 data will become more
apparent.
2.1.4 Data Analysis Analysis of the statistical data primarily used a variety of classifications (community type, province,
western Canada, community size, etc.) to determine and compare means and medians of the data
and changes between 2006 and 2011. This statistical information drew a picture of the
communities in western Canada, to look for patterns of similarities, differences, and changes
connected to the dimensions of our research.
In future research, the potential exists to utilize the data collected to this point to serve as a
baseline to examine changes. These changes may be related to CIP defined variables of interest
relating to business capacity, education, housing or other indicators, and/or variables that may be
affected by the presence or absence of co-operatives or by the activities of co-operative
development in a community.
2.2 Community Meetings
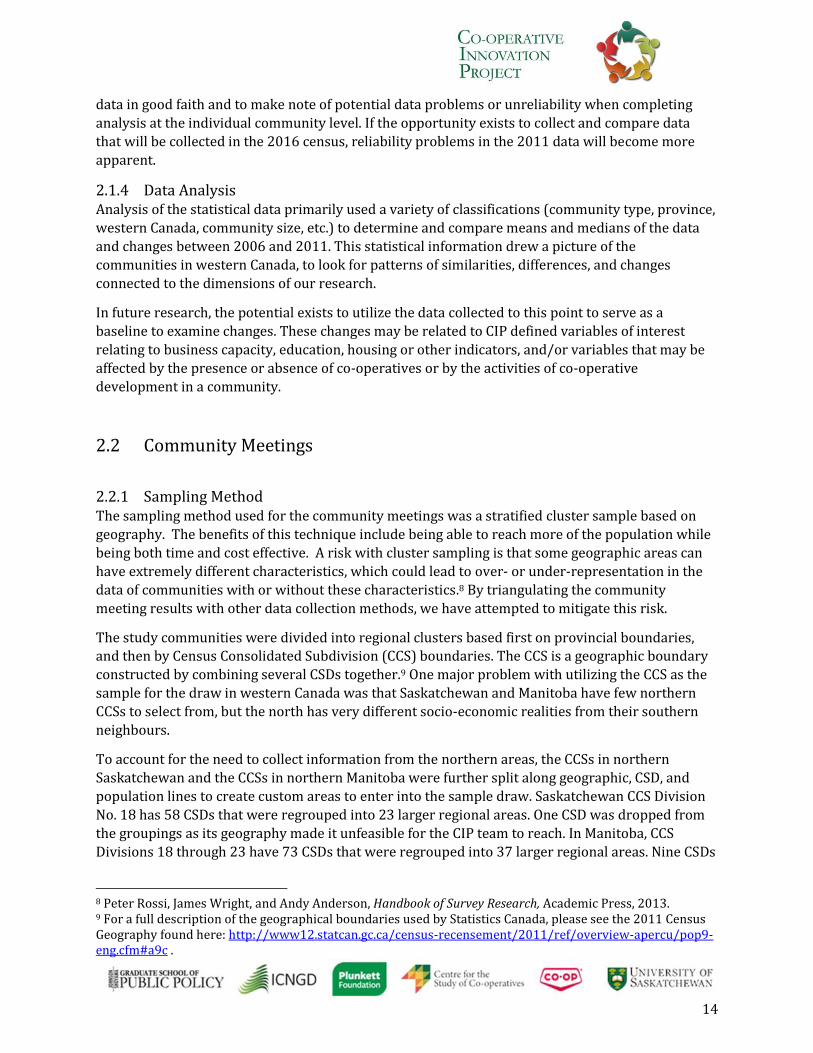
2.2.1 Sampling Method The sampling method used for the community meetings was a stratified cluster sample based on
geography. The benefits of this technique include being able to reach more of the population while
being both time and cost effective. A risk with cluster sampling is that some geographic areas can
have extremely different characteristics, which could lead to over- or under-representation in the
data of communities with or without these characteristics.8 By triangulating the community
meeting results with other data collection methods, we have attempted to mitigate this risk.
The study communities were divided into regional clusters based first on provincial boundaries, and then by Census Consolidated Subdivision (CCS) boundaries. The CCS is a geographic boundary
constructed by combining several CSDs together.9 One major problem with utilizing the CCS as the
sample for the draw in western Canada was that Saskatchewan and Manitoba have few northern
CCSs to select from, but the north has very different socio-economic realities from their southern
neighbours.
To account for the need to collect information from the northern areas, the CCSs in northern
Saskatchewan and the CCSs in northern Manitoba were further split along geographic, CSD, and
population lines to create custom areas to enter into the sample draw. Saskatchewan CCS Division
No. 18 has 58 CSDs that were regrouped into 23 larger regional areas. One CSD was dropped from
the groupings as its geography made it unfeasible for the CIP team to reach. In Manitoba, CCS
Divisions 18 through 23 have 73 CSDs that were regrouped into 37 larger regional areas. Nine CSDs
8 Peter Rossi, James Wright, and Andy Anderson, Handbook of Survey Research, Academic Press, 2013. 9 For a full description of the geographical boundaries used by Statistics Canada, please see the 2011 Census Geography found here: http://www12.statcan.gc.ca/census-recensement/2011/ref/overview-apercu/pop9-eng.cfm#a9c .

15
were dropped from the groupings as they were urban in nature or geographically unfeasible to
visit. Please see Appendix for the full listing of CSDs/CCS that were grouped together.
Random sampling using STATA software selected 10 CCSs (2 northern and 8 southern in
Saskatchewan and Manitoba) from each of the 4 provinces. Given the sampling method, collecting
information from 5 or 6 CCSs per province would likely provide an adequate understanding of the
needs, business capacity and social capacity in not only individual communities, but also in
provinces as a whole.
Table 4 Sample Draw for Community Meetings
Province Total Number of CCS
Number of CCSs selected
Total number of CSDs in selected CCSs
MB North 37 2 6 South 98 8 17
SK North 21 2 7 South 272 8 25
AB All 293 10 52 British Columbia
All 103 10 73
Total 598 40 180
The selected CCSs were the locations for the meetings, consisting of one or two meetings held in a
central location within each CCS. 10 CCSs were drawn per province with the recognition that the
difficulty or cost of planning a meeting in every location may be outside the scope of the project.
The oversampling allowed the researchers to move to the next community as required. Further
monitoring to determine content saturation was conducted during the data analysis activities.
The final CCS draw by province is reflected in the following table. In CCSs that are highlighted in
green, meetings were held. CCSs highlighted in blue indicate locations where project staff
attempted to schedule a meeting but were not successful. CCSs highlighted orange were added to
the draw towards the end of the project to ensure a geographically and demographically diverse
sample. Two pilot meetings were held; however, the methodology of the first pilot meeting was
changed considerably enough to not include those results in our community meeting data. This
meeting is in the CCS coloured grey.

16
Table 5 Sample CCS Selected, by Province, after draw
Draw # North MB MB North SK SK AB BC
1 Cross Lake (Division No. 22)
Lac du Bonnet
Southend (4718090_10)
Snipe Lake No. 259
Lesser Slave River No. 124
Central Kootenay H
2 Gillam (Division No. 23)
Dauphin Buffalo Narrows (4718090_18)
Humboldt No. 370
Willow Creek No. 26
Columbia-Shuswap A
3 Division No. 21
Glenboro
La Ronge (4718090_15)
Arborfield No. 456
Forty Mile County No. 8
Cowichan Valley G
4 Arborg Meadow Lake No. 588
Opportunity No. 17
Okanagan-Similkameen
5 Blanshard Scott No. 98 Mountain View County
Skeena-Queen Charlotte A
6 Melita Grassy Creek No. 78
Brazeau County
Kootenay Boundary B
7 Gladstone Round Valley No. 410
Bighorn No. 8 Sunshine Coast A
8 Morris Laird No. 404
Ponoka County Thompson-Nicola E
9 Stettler County No. 6
Squamish-Lillooet B
10 Smoky Lake County
Kitimat-Stikine B
Added to Draw
Mackenzie County
Skeena-Queen Charlotte O
Pilots St. Louis No. 431
Eldon No. 471
2.2.2 Meetings Held In the end, 26 meetings involving 63 communities were held. This represents just over 3.5% of our
study communities. Fifty rural and thirteen Aboriginal communities were invited to meetings.
Table 6 Overview of meetings held by province and rural/Aboriginal CSD
Province Rural Aboriginal Total Manitoba 4 1 5 Saskatchewan 4 2 6 Alberta 4 3 7 British Columbia 6 2 8 Total 18 9 26
17
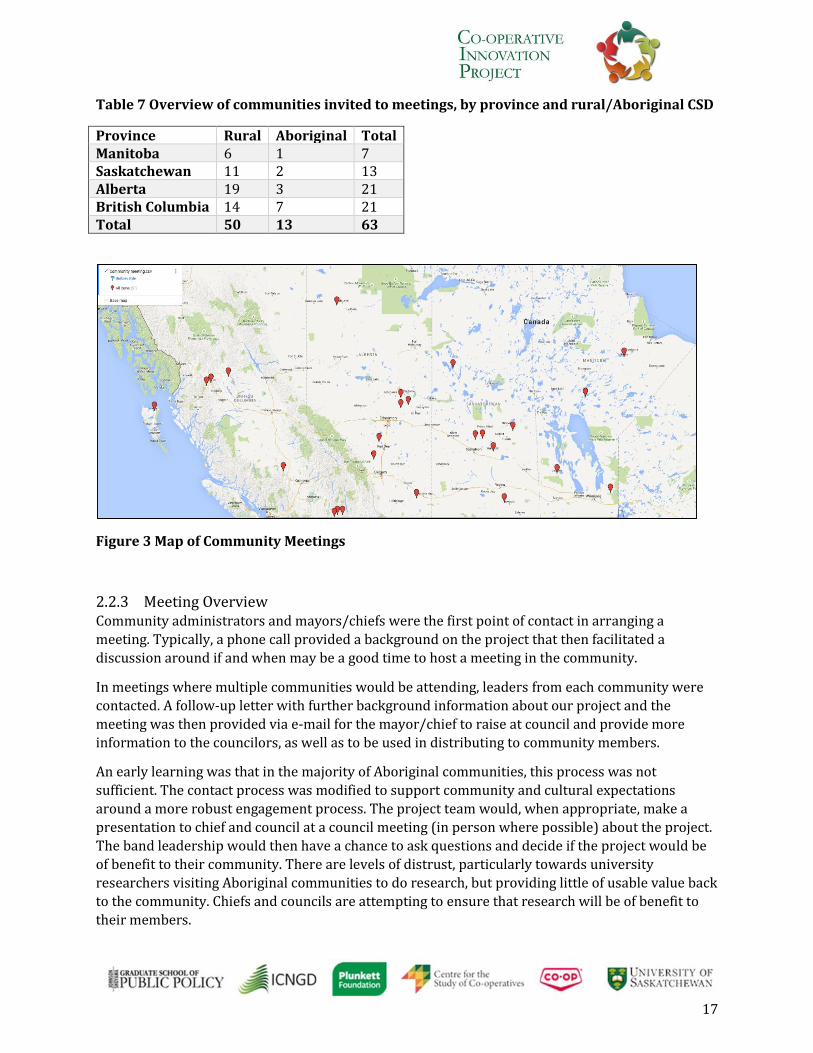
Table 7 Overview of communities invited to meetings, by province and rural/Aboriginal CSD
Province Rural Aboriginal Total Manitoba 6 1 7 Saskatchewan 11 2 13 Alberta 19 3 21 British Columbia 14 7 21 Total 50 13 63
Figure 3 Map of Community Meetings
2.2.3 Meeting Overview Community administrators and mayors/chiefs were the first point of contact in arranging a
meeting. Typically, a phone call provided a background on the project that then facilitated a
discussion around if and when may be a good time to host a meeting in the community.
In meetings where multiple communities would be attending, leaders from each community were
contacted. A follow-up letter with further background information about our project and the
meeting was then provided via e-mail for the mayor/chief to raise at council and provide more
information to the councilors, as well as to be used in distributing to community members.
An early learning was that in the majority of Aboriginal communities, this process was not
sufficient. The contact process was modified to support community and cultural expectations
around a more robust engagement process. The project team would, when appropriate, make a
presentation to chief and council at a council meeting (in person where possible) about the project.
The band leadership would then have a chance to ask questions and decide if the project would be
of benefit to their community. There are levels of distrust, particularly towards university
researchers visiting Aboriginal communities to do research, but providing little of usable value back
to the community. Chiefs and councils are attempting to ensure that research will be of benefit to
their members.

18
Some communities declined meetings. Earning and building trust can be a lengthy process. Due to
the short timelines to set up and conduct meetings, it was found that personal connections were the
best way to introduce our project to communities. If a member of the research team or PMG had a
current relationship with a particular community within the parameters of our draw, these
connections could help form a better working relationship between the project and the community.
As a result, some Aboriginal communities were contacted out of order in the draws.
Of the communities that we contacted, one rural community and several Aboriginal communities from regions in the draw declined to participate.
The research team compiled detailed contact invitation lists for each community. Contact lists were
comprised of businesses, not-for-profits, religious, government and educational institutions that
were publicly listed. Contact information was compiled, and each of these agencies was phoned, e-
mailed and/or faxed to invite them to the meeting. Where possible, e-mail contacts were
established. Further details of the project, radio or other interviews, and the poster advertising that
community’s upcoming meeting could then be e-mailed. These contact lists remain in the project
archives.
We encouraged pre-registration to facilitate catering and to decide how many team members
would be needed at each meeting as facilitators. Pre-registrants from all community meetings
across western Canada were eligible for a draw for an iPad mini.
Figure 4 Community Posters Examples
A poster was created as soon as the date and location was solidified. The poster was e-mailed to all
community contacts. During the contacting process, the team would try to identify community
helpers that could hang posters in their community on our behalf. If these helpers were not found,
we would mail them to the municipal/band office for distribution. The posters were also published
digitally, on local community Facebook pages or other on-line venues.

19
Community meetings were usually (with one exception) 3 hours in length and scheduled in the
early evening. The meeting consisted of a light meal followed by a project introduction and
breakout discussion groups. After the small group discussions, we reconvened for a large group
discussion which included a results debriefing, guided discussion, and a Q & A.
Each meeting was facilitated by a minimum of two facilitators from the project. At each meeting, a
minimum of two community members acted as notetakers to capture participant comments,
meeting discussion items, and questions that arose throughout the course of the evening. Templates were provided for this purpose.
Notetakers were paid $100 for their work by the University of Saskatchewan payroll. As a result,
they were required to have valid social insurance numbers and be legally able to work, but no other
special criteria were needed. Where appropriate, an elder or community leader would open the
meeting for us by offering a prayer or describing our purpose in holding the meeting. Elders were
also given an honorarium of $100.
As soon as possible after a meeting had concluded, the facilitators captured their impressions of the
meeting, discussion, meeting planning and any other information relating to the communities that
were described by participants at the meeting. A template was used for this purpose. Please see the
Appendix for a copy of the templates used by both the notetakers and the facilitators as well as a
typical meeting agenda.
2.2.4 Data Analysis Once the meeting was concluded, the documents from the notetakers and the facilitators were
uploaded into NVivo software. NVivo is a computer software program designed to help analyze
text-rich qualitative documentation. The documents were coded by meeting and by province. They
were also organized and coded by the agenda sections as outlined during the meetings.
Each document was open coded by two members of the research team. Where possible, we tried to
have at least one person from the meeting code the meeting documents. Open coding required the
researcher to come up with descriptive and in-depth words to associate with segments of text. Once
a first level of coding was completed, the codes were analyzed and reorganized into similar
‘baskets’ of codes. The full results of the data analysis that has been concluded to date can be found
in the community needs and community capacity chapters of the final report.
2.3 Key Informant Interviews In general, although a co-op can be self-created by a group, most new co-ops in western Canada are
assisted in their formation and development through the work of an experienced co-operative
developer. The Co-operative Innovation Project aimed to speak with active co-op developers who
have worked with rural and Aboriginal communities in western Canada.
2.3.1 Sampling Method The CIP Research Officer conducted a total of seven semi-structured interviews with co-operative
developers in western Canada in March and April of 2015. Purposive sampling was used. CIP
identified and contacted co-operative developers at each of the four provincial co-operative
associations, which have a mandate to pursue co-operative development within their respective
province. One developer from Manitoba, two from Saskatchewan, two from Alberta and one from
20
British Columbia were selected. During the interview process, all of the developers recognized the
mentorship and training provided by an additional person from British Columbia, who participated.
An eighth interview from Manitoba was deferred, due to a sabbatical.
While there are more co-operative developers working in western Canada, such as those working
exclusively in Francophone communities, those who work for a provincial government, or those
who operate privately, saturation (where similar meta-themes are present) developed after six
interviews. In addition, there were time constraints at play that limited the number of interviews that could be conducted, transcribed, and analyzed.
2.3.2 Process The CIP research team developed a series of twelve questions to guide the semi-structured
interview process. These questions probed the process and related activities of co-operative
development, the characteristics of the leaders and communities where co-ops are developed, and
questions relating to the politics and environment of co-operative development. This set of
questions can be found in the Appendix.
All of the co-operative developers selected for interview were contacted prior to the interview by
telephone to develop a relationship and set a date and time for a 1.5 to 2 hour interview process.
Five interviews were conducted by telephone. They were recorded via a digital recording device
attached to the telephone line and saved as MP3 files. Two were recorded live with the same
technology. All of the interviews started with a verbal reading of the ethics release from the
University of Saskatchewan, with oral acceptance of the ethics review recorded. All interviews
followed the question guide, but not necessarily in a linear order. In semi-structured interviews,
there is an allowable level of deviance to support the flow of conversation.
2.3.3 Data Analysis All of the interviews were transcribed verbatim. Three were transcribed by the Research Officer,
three by a professional transcription firm, and one by a private transcriptionist. All of the
interviews were re-checked against the recording for accuracy. They resulted in over 400 pages of
typed interview transcripts. The transcription process took about a month, and finished in June
2015.
These transcripts were uploaded to NVivo, and coded for themes. The coding process took place
over the course of the summer and into the fall. These themes were drawn both from the questions,
and from the larger research cross-cutting themes relating to the growing CIP model of co-
operative development, relating to inspire, explore, create, thrive, and connect. The importance and
impact of co-operative, community, business, and political culture became clear during the coding
process.
The CIP aimed to have a second person re-code these documents, but time constraints prevented
this extra level of analysis. Results of this coding can be found in the chapters on co-operative
development in the final report.
2.4 Telephone Survey A standard telephone survey was created by the CIP project team with the assistance of the Social
Sciences Research Laboratory (Survey and Group Analysis Lab) (SSRL) at the University of

21
Saskatchewan. The survey was initially designed to measure the primary dimensions and variables
of interest for the project: community need, social capacity, and business capacity, as well as
knowledge of co-ops. An added theme asked questions about quality of life.
We attempted to strike a balance between collecting a wide variety of data about communities,
internal validity of responses for scale items, and keeping survey length short enough to ensure
high response and survey completion rates. See the Appendix for the complete telephone survey
questionnaire.
2.4.1 Questionnaire Development The questionnaire measured 16 pre-determined services, programs, and educational programs to
measure community need. A further 5 questions were developed to determine business skills and
access to business development resources. The questionnaire also included 16 questions that
measured various aspects of social capacity. Co-operative existence and knowledge was polled
through 3 questions, and there are several other related questions, including demographic
questions. The survey was designed to take about fifteen minutes to complete, but in many cases
took slightly longer. For a more complete explanation of the results, see the chapter on telephone
survey.
2.4.2 Sampling Method The telephone survey targeted residents aged 18 years and older in our study population of rural
and Aboriginal communities in Manitoba, Saskatchewan, Alberta, and British Columbia. It was
completed between January 8 and March 15, 2015. The research team provided the postal codes
associated with the study CSDs to the Social Sciences and Research Laboratories (SSRL) at the
University of Saskatchewan. The SSRL used random digit dialing of land-lines (not cell phones) to
contact 62,839 phone numbers through three phases of calling; of those, 21% of calls reached
someone on the other end. The end goal was to collect 500 survey participants (individuals aged 18
and above) per province in total, 50 of which (10%) should be respondents from Aboriginal
communities.
There was a desire to have a representative sample of respondents from rural and Aboriginal
communities, and to ensure a degree of representativeness based on mean age. After the initial run
was completed, the results were analyzed to identify gaps in the representativeness of the sample,
and to identify strategies for SSRL to fill these gaps in subsequent runs.
The descriptive information from the first run of the survey can be seen in Table 8 Original
Telephone Survey Responses and Table 9 Demographic Analysis of First Round Telephone Survey
below. Respondents from Manitoba were under-sampled due to non-response, as were Aboriginal
respondents in all provinces except Alberta.
Table 8 Original Telephone Survey Responses
Rural Aboriginal Total Manitoba 144 29 173 Saskatchewan 344 35 379 Alberta 478 75 553 British Columbia 306 35 341 Total 1272 174 1446

22
Table 9 Demographic Analysis of First Round Telephone Survey
Community Rural Aboriginal Total Population Sample Population Sample Population Sample Population Manitoba 57 50-54 55 35-39 57 45-49 Saskatchewan 59 50-54 53 35-39 58 50-54 Alberta 59 45-49 52 35-39 59 45-59 British Columbia 64 50-54 63 40-44 64 50-54 Total 61 50-54 56 35-59 60 45-49
Based on the initial telephone survey, instructions were provided to the SSRL to collect additional
respondents from a subset under 55 years of age. A third run was also conducted to focus on
collecting more responses from residents of Aboriginal communities.
2.4.3 Surveys Completed In total, 2,025 surveys were completed. The maximum response rate was 21%, the percent of
refusal was 76% and the percent of respondent termination was 2%.10 For more information about
the representativeness of this survey based on key community characteristics, please see the
telephone survey chapter results.
As is common in all surveys, non-response bias may be present, as there were a number of
respondents that initially did not agree to respond to the survey, and/or did not answer all of the
questions in the survey. The survey had 41 perception-based questions around community needs,
business capacity, and social capacity. Not all survey respondents completed all of the questions. To
determine which surveys to consider complete, we identified 39 key questions. If more than 8 of
these 39 questions had a response of don’t know or refused to answer, we dropped their response
from the sample.
After dropping the responses that did not meet these criteria, we had a total of 1,756 surveys in our final sample that was used for most of the subsequent analysis.
Table 10 shows the frequency of responses by province and type of community, and
Table 11 shows the median age of our survey respondents by province and type of community.
Table 10 Final Telephone Survey Sample Responses
Rural Aboriginal Total Manitoba 353 85 438 Saskatchewan 382 50 432 Alberta 384 52 436 British Columbia 395 55 450 Total 1514 242 1756
10 The maximum response rate was calculated as follows: completed interviews (1,951) / refusals (7,013) + interviewer terminations (5) + respondent terminations (221) + completed interviews (1,951). The maximum refusal rate was calculated as follows: refusals/refusals + interview terminations + respondent terminations + completed interviews. The SSRL made a total of 62,389 phone calls. If this number is used in calculations, the minimum response rate changes to 3% and the minimum refusal rate changes to 11%.

23
Table 11 Median Age of Survey Sample Compared to Study Population
Community Rural Aboriginal Total Population Sample Population Sample Population Sample Population Manitoba 54 50-54 48 35-39 54 45-49 Saskatchewan 53 50-54 42.5 35-39 53 50-54 Alberta 54 45-49 52 35-39 54 45-59 British Columbia 59 50-54 55 40-44 59 50-54 Total 55 50-54 49 35-59 54 45-49
Again, please see the telephone survey chapter for information about the representativeness of this
survey based on key community variables.
Random sampling by random-digit dialing resulted in many communities with multiple
respondents, and we clustered our analyses to account for this. Table 12 summarizes the number of
communities for which we have data by province and community type. 11
Table 12 Communities Represented by Telephone Survey (n=1,756)
Province Rural Communities Aboriginal Communities Total Communities Manitoba 57 24 81
Saskatchewan 87 21 108 Alberta 120 28 148 British Columbia 77 34 111 Total 341 107 448
Figure 5 shows a map of the communities represented in our telephone survey. The blue stars
represent respondents who stated that they lived in rural communities, and the red markers
represent those who stated that they lived in Aboriginal communities. The darker the marker, the
more respondents we had in that particular community.
11 Respondents’ self-reported community type may differ from the Statistics Canada definition. We used the Statistics Canada CSD boundary combined with the respondents’ subjective community type to separate communities.

24
Figure 5 Map of Telephone Survey Respondents
2.4.4 Notes about the Telephone Survey Our survey asked respondents to give responses based on a 4-point Likert scale. Although 5-7 point
Likert scale items are generally preferable, based on advice from the SSRL we chose to adopt a 4-
point Likert scale for most responses to reduce the number of response options. SSRL data analysts
indicated to us that telephone survey respondents face greater difficulty in responding as the
number of response options increases. Having the 4-point scale reduced the depth of differentiation
when analyzing responses.
There is often difficulty wording survey questions in a way that ensures reliability and validity of
responses. We encountered a few such problems with our survey. Some of the wording invited
personal perceptions rather than focusing on an overall community analysis, limiting the
possibilities for interpretation and analysis of those questions. For instance, when collecting
information about community needs, it would have been preferable to determine whether or not
the need was provided for in the community with a simple “yes” or a “no”. If the response was yes,
then the respondent should have been asked to respond regarding the quality and scope of the
service or program. If the answer was no, then the respondent could have been asked if it was
actually perceived as needed, and if so, how urgently. However, these changes would have made the
overall survey longer and more complex, both of which were a concern.
Likewise, questions concerning knowledge of co-operatives should be redesigned in future
iterations to capture the depth of respondents’ relevant knowledge. For instance, providing several
short statements about co-operatives and asking respondents to choose the one(s) that reflect the
nature of co-operatives would provide a more in-depth measure.

25
The telephone survey was our only data collection method that did not ask respondents to rate
overall social capacity and need in the same way as in the other tools, which limits comparisons
across all the data tools. Asking respondents to make an overall assessment of need, business and
social capacity as we did in the web survey and at community meetings would have improved
comparability of data.
The survey was administered by the SSRL. Student employees trained in administering telephone
surveys conducted the telephone interviews with respondents, and one of the CIP project members oversaw a pilot testing of the surveys, making minor tweaks to the survey after this pilot.
An issue arose with time zones. The survey was conducted in Saskatchewan, creating some
problems with the work hours of the SSRL. This led in part to the response imbalance in some
provinces. After the first round of data collection, surveys were conducted both earlier and later
than normal to improve the distribution of calls. Additionally, the phoning lists SSRL uses are for
landlines only, contributing further to accessing an older population.
Telephone numbers were identified according to postal code; however, postal codes do not align to
CSD boundaries and can include both rural areas and towns. As such, secondary coding had to occur
to place respondents in the correct community to align with our study population. This was time
consuming and may increase data input/coding errors. Where there were multiple CSDs that a
respondent could be placed in, we systematically placed them in the CSD associated with the largest
community within the postal code. In situations where respondents indicated they were from an
Aboriginal community, we systematically assigned their response to the Aboriginal community within that postal code.
We should also note that respondents sometimes self-reported that they were from an Aboriginal
community, but this did not align with the CSD based on the postal code. For much of our analysis of
the telephone survey, we used respondents’ self-reported community type when comparing results
across community types.
2.4.5 Data Analysis Once the final dataset was received from the SSRL, analysis was conducted using STATA/SE 13.1
software. A variety of different quantitative analysis methods were conducted to look for patterns
in the data, including factor analysis, correlations between factors, and regressions.
For analysis, the questions were grouped into a variety of baskets of needs.
Needs were divided into 3 groups:
a) Primary services included drinking water, sanitation and waste management, recycling, roads, housing, health care, and Internet access.12
b) Education included questions around education, daycare, preschool, elementary school, and high school; and
c) Secondary services included programs: senior’s programs, arts and culture programs, physical activity programs, and youth programs.
12 Food security was not listed as a primary service on our telephone or web surveys, but came out when respondents listed what they felt was missing. During community visits, food and food access/security was listed as a community need, but did not code as high as other needs.
26
Business Capacity was measured through questions on post-secondary training, general business
skills, financing, technology, labour, and networking opportunities.
Social Capacity was grouped into questions around:
a) Willingness to work together: individual and community levels, relationships, taking on new projects, adopting new mindsets or ways of thinking, volunteerism;
b) Safety and security: perception of frequency of violent crimes, frequency of property crimes, sense of safety and security, law compliance, cleanliness; and
c) Diversity: age, religion, language, race, type of work, income, and so forth.
Although there may have been multiple responses from the same community, for analysis at a
western Canadian level, each respondent was treated as a unique observation, and clustered by
community where appropriate in our statistical analyses.
2.4.5.1 Data Analysis Statistical Methodology
While we theoretically developed particular questions to measure each of our constructs of
interest, because these were not pre-validated scales, in the first stage we performed an
exploratory factor analysis (EFA) to determine the underlying structure of the variables (or
questions). In this study, we have 39 variables, which interact with each other. For instance,
respondents’ rating of a service could be either an indicator for a need for that service or an
indicator for business capacity or social capacity. Post-secondary service provides a good example.
Dissatisfaction may imply a need for improving the depth or breadth of post-secondary training in
the community. On the other hand, it may also indicate a low level of human capital, and thus a low
business capacity. Given the large number of variables and the interactions among them, EFA is a
tool that can help researchers draw a clearer understanding of the underlying relationships
between and among variables.
EFA is a powerful multivariate statistical technique that is useful for dealing with a large number of
variables intended to measure a smaller number of overarching constructs. By examining the
pattern of correlations between the variables, EFA brings a large number of intercorrelated
variables together under a smaller number of more general factors that are unknown and often
unknowable variables to explain the covariance among the measured variables.
In theory, these factors are the underlying causes of the measured variables. More specifically,
factor analysis attempts to reduce the “dimensionality of the original space and to give an
interpretation to the new space, spanned by a reduced number of new dimensions which are
supposed to underlie the old ones,”13 or to create factors to explain the variance in the observed
variables. Therefore, factor analysis enables researchers, by analyzing the multivariate patterns of
the data, to have a clearer view of the data and replace observed variables with a smaller number of
factors in subsequent analysis.
We decided to use common factor analysis, the technique best suited to identifying underlying
factors that summarize an original set of variables. To deal with missing data, we followed the
13 Toni Rietveld and Roeland Van Hout, Statistical Techniques for the Study of Language and Language Behaviour. Berlin: Walter de Gruyter & Co, 1993. pp.254.

27
approach suggested by Truxillo,14 which allows the use of maximum likelihood with the
expectation-maximization (EM) algorithm to deal with missing data in the estimation of the
covariance matrix, and then to factor analyze the imputed correlation matrix to obtain a solution.
In the second stage, we examined the construct on the basis of the EFA result, and then calculated
and analyzed factor scores. Although the derived factor scoring weights can produce reliable and
accurate factor scores in the sample,15 unit weighting for all of the variables with high loadings on
the factors can yield factor scores that are virtually as accurate in the sample as using the factor
score weights, and more importantly, unit weights will outperform the factor scoring weights in any
new samples. Therefore, in this stage, rather than relying on the factor scoring weights and the
predicted factor scores, we computed the factor scores by assigning equal weights to all variables,
whether they loaded highly in our factors or not.
Analysis of means (ANOM) was performed on all of our factors to identify the differences between
the Aboriginal and rural communities and among the four study provinces. Because random digit
dialing technique was used, it is likely to have generated more than one response in one particular
geographic location/community (CSD). The responses may be intercorrelated, as randomly selected
respondents from the same location are likely to respond more similarly than respondents
randomly selected from different locations. We take this into account when analyzing the data
because if we do not, the standard errors of the estimates may be underestimated, resulting in invalid significance tests. The existence of correlations between observations violates the
assumption of independent observations on which the estimation of standard errors is based. Given
this, we used clustered robust standard errors in the analysis of means.
Associations among factors were analyzed by means of correlation coefficients. Fisher’s z
transformation was performed to investigate whether the associations differ between rural and
Aboriginal communities. Differences in factor associations between provinces were not
investigated.
All data analysis was conducted using Stata/SE 13.1 and most of it is reported in detail in the
telephone survey results chapter.
2.4.5.2 EFA Results of the Telephone Survey
Evaluation of Validity of the EFA Before performing the EFA, the validity of the data was evaluated. Three standard tests were
performed: (1) the determinant of the correlation matrix; the calculated determinant was
0.0000101, above the threshold value 0.000001, suggesting that multicollinearity is not a problem
for the data; (2) the Kaiser-Meyer-Olkin (KMO) measurement of adequacy; all KMOs exceeded 0.6,
indicating the EFA is acceptable;16 and (3) the Bartlett’s Test of Sphericity; the significance
probability was 0.000, rejecting the null hypothesis that there is no intercorrelation among
14 Catherine Truxillo, “Maximum likelihood parameter estimation with incomplete data,” Proceedings of the 30th SAS Users Group International Conference, Philadelphia, April 10-13, 2005. Paper 111-30. 15 As pointed out by Richard Gorsuch, Factor Analysis (2nd Edition), Hillsdale, New Jersey: Lawrence Erlbaum Associates, 1983. 16 KMO takes the values between 0 and 1. A big KMO indicates that variables have a lot in common, thus warrants the factor analysis. KMO value in excess of 0.6 is acceptable.
28
variables. The results from these three tests ensure the suitability of the EFA.
Number of Factors to Extract The number of factors to retain was determined by combining Kaiser’s stopping rule and the scree
test. Kaiser’s stopping rule recommends using factors with eigenvalues greater than 1. The scree
test plots eigenvalues of unrotated factors in descending order, thus enabling the visual
examination of the factors’ contributions to the variability in the data. The factors before the plot
starts to straighten (or the slope of the plot starts to approach zero) should be retained.
When deciding the number of factors to retain, we started from Kaiser’s rule, then inspected the
scree plot and examined a number of trial solutions. We also examined factor solutions with both
less and more factors than what were initially derived. The final decision for the number of factors
to retain was made based on whether or not the factor solution provides the best simple structure.
A simple structure means that each variable loads heavily on one and only one factor.
The EFA with principal factor extraction was conducted. The initial extraction identified 4 factors
with eigenvalues greater than 1. The scree plot was then examined. Three, five, six and seven factor
solutions were compared, and finally, the seven-factor solution was selected as it produced a simple
structure. Out of the seven factors: the first extracted factor is more related to business capacity, the
second, third and the fifth extracted factors are more related to needs, and the other three are more
related to social capacity.
Factor Interpretation and Naming
Following extraction, rotation is ordinarily used. The goal of rotation is to maximize high
correlations between factors and variables and minimize low ones to improve the interpretability
of the factors. We used the Promax rotation technique that allows the factors to correlate. The EFA
result is summarized in the CIP project data folder, which can be viewed by contacting the Centre
for the Study of Co-operatives.
We interpreted and named the extracted factors in our three-dimension framework. When
interpreting the extracted factors, factor loadings provide the most important information. Factor
loadings indicate the association between each variable to the underlying factor. The higher the
absolute value of a loading, the stronger the relationship between the variable and the underlying
factor. As a result, the variables with the highest loadings on a factor provide the greatest value in
interpreting and naming the factor. The terms ‘weak’, ‘moderate’ and ‘strong’ refer to absolute
values of loadings of 0.3-0.5, 0.5-0.7, and >.7, respectively.
The first identified factor was labeled as business capacity, as this factor represents the issues
related to the business capacity of the community. It has strong positive loading on general
business skill (0.70), moderate positive loadings on technology (0.65), networking opportunities
(0.62), financing capacity (0.57), and labor (0.55), and a weak positive loading on post-secondary
training (0.36).
The second extracted factor relates to need for basic services in community. It has strong positive
loading on sanitation and waste management (0.73), moderate positive loading on drinking water
(0.68), and weak positive loadings on recycling (0.49) and roads (0.31). As a low level of

29
satisfaction is likely to signal a high need for the service, this factor was thus labeled as need for
basic services.
The third extracted factor relates to the need for educational services. It has strong positive loading
on elementary school (0.73), and moderate positive loadings on preschool (0.67), high school
(0.65), and daycare (0.53). We labeled this factor as the need for educational services.
The fourth extracted factor was labeled as willingness to work together. It has strong positive
loading on the willingness of the community to partner with neighbouring communities (0.74),
moderate positive loadings on level of sharing and working together at the administrative level
between the community and neighbouring communities (0.58), the willingness and supportiveness
of community people coming together to take action to solve community needs (0.58) and
willingness of the community to adopt new mindsets or ways of thinking to solve problems (0.55),
and moderate positive loadings on relationships between residents in the community and the
neighbouring communities (0.48), level of volunteerism (0.35) and willingness to undertake new
projects in the community (0.33).
The fifth extracted factor relates to the need for extra-curricular services and programs in the
community. It has moderate positive loadings on arts and culture programs (0.52), and weak
positive loadings on physical activity programs (0.50) and youth programs (0.43) and seniors’ programs (0.43). It was thus labeled as the need for programs.
The sixth extracted factor was labeled sense of safety and security. It has strong negative loading on
occurrence of violent crime in the community (-0.71), moderate negative loading on occurrence of
property crime in the community (-0.69), moderate positive loading on feeling of safety and
security for yourself and the family in the community (0.58), and weak positive loadings on
compliance with laws by most people in the community (0.42) and cleanliness of the community
(0.37).
The last extracted factor was labeled similarities. It has moderate positive loadings on three
variables: similarity in language spoken (0.70), similarity in race among members (0.68) and
similarity in religions (0.5), weak positive loadings on three variables: similarity in income (0.41),
similarity in ages (0.358), and similarity in type of work (0.36).
Table 13 Factors extracted by means of EFA (Exploratory Factor Analysis) loading and Cronbach’s Alpha
Factor/Variable Loading Cronbach’s
Alpha
Business Capacity (Factor 1): Business Capacity 0.72
Post-Secondary Training 0.36
General Business Skills 0.70
Financing 0.57
Technology 0.65
Labour 0.55
Networking Opportunities 0.63

30
Community Need (Factor 2): Need for Basic Services 0.70
Drinking Water Service 0.68
Sanitation and Waste Management 0.73
Recycling Service 0.48
Roads 0.31
Housing Service* <0.3
Health Care* <0.3
Internet Access* <0.3
Community Need (Factor 3): Need for Educational Service 0.77
Daycare Service 0.52
Preschool Service 0.66
Elementary School 0.73
High School 0.65
Community Need (Factor 5): Need for Programs 0.78
Seniors’ Programs 0.39
Arts and Culture Programs 0.53
Physical Activity Programs 0.50
Youth Programs 0.43
Social Capacity (Factor 4): Willingness to Work Together 0.77
Level of Willingness to Undertake New Projects in the Community 0.33
Level of Sharing and Working Together at the Administrative Level between the
Community and Neighbouring Communities
0.58
Level of Volunteerism in the Community 0.35
Relationships Between Residents in the Community and the Neighbouring
Communities
0.48
Willingness and Support of the Community of People Coming Together to Take
Action to Solve Community Needs
0.58
Willingness of the Community to Partner with Neighbouring Communities 0.74
Willingness of the Community to Adopt New Mindsets or Ways of Thinking to
Solve Problems
0.55
Social Capacity (Factor 6): Sense of Safety and Security 0.70
Occurrence of Property Crime in the Community (0.69)
Occurrence of Violent Crime in the Community (0.71)
Compliance with the Law by Most People in the Community 0.42
Cleanliness of the Community 0.37
Feelings of Safety and Security for You and Your Family in the Community 0.58
Social Capacity (Factor 7): Similarity 0.67
Ages Among Community Members 0.38
Race Among Community Members 0.68
Languages Spoken in The Community 0.69
Religions 0.51
Income Among Community Members 0.41
Type of Work Performed Among Community Members 0.36

31
Total 0.88
Reliability Analysis
Cronbach’s Alpha was examined for each factor and is presented in Table 13. The Cronbach’s alpha
value exceeded 0.7 except the alpha for the seventh factor – similarity – which was 0.67, meaning
that the resulting consistency degree of measurement is acceptable.
Analysis of Mean Results
To identify and analyze the differences between rural and Aboriginal communities, we calculated
the average score for each factor by taking the average of variables that loaded on it (for the need
for basic services factor, we incorporated health care, housing and Internet access into the factor).
The results are presented in Table 13.
Correlations between seven factors
The survey data does not allow us to examine the causal relationships between community need,
business capacity and social capacity. Given this, we analyze their correlations and examine
whether or not their correlations differ between rural and Aboriginal communities and across
provinces by applying the Fisher’s z transformation technique:
𝑧 =1
2∗ln [
1 + 𝑟11 − 𝑟1] − ln [
1 + 𝑟21 − 𝑟2]
√ 1𝑛1 − 3 +
1𝑛2 − 3
Where r1 and r2 are the correlation coefficients of rural and Aboriginal communities, and n1 and
n2 are the sample sizes of the two groups. Under the null hypothesis that the population
correlations are equal, z has approximately a standard normal distribution. See the telephone
results chapter for more detail about the methods, analysis, and reporting of the results.
2.5 Web-Based Survey A standard web-based survey was created by the CIP project team with the assistance of the Social Sciences and Humanities Research Laboratory (SSRL) at the University of Saskatchewan. The
survey was initially designed to measure the primary dimensions and variables of interest for the
project: community need, social capacity, business capacity, as well as knowledge of co-ops. A
cross-cutting variable related to quality of life.
The survey was designed for community administrators, to capture their unique perspective
related to the administrative and political environments of their communities. We attempted to
closely mimic the telephone survey, while focusing the questions to community administrators to
allow for potential comparison between the telephone and web-based responses. Please see the
Appendix for the complete web-based survey questionnaire.
2.5.1 Sampling Method The web survey was completed from January 2015 to June 15, 2015. The research team used the
Internet to locate the names and e-mail addresses associated with administrators linked to our
rural and Aboriginal study CSD communities across western Canada. We provided the e-mail

32
addresses to the Social Sciences Research Lab at the University of Saskatchewan. The research lab
used their software to create an e-mail panel to e-mail unique survey links to eligible participants,
along with a letter of introduction and invitation from CIP to participate in the survey. Respondents
were able to complete the survey in one sitting, or return to a partially completed survey at a later
date. Individuals completing the survey could enter a draw to win an iPad.
The end goal was to attain a 20% response rate by province, with representation from rural and
Aboriginal communities. After the initial run was completed, the results were analyzed to identify gaps in the representativeness of the sample, and to identify strategies for SSRL to fill these gaps in
subsequent runs.
The results from the initial round of the survey can be seen in Table 14 below. Although the overall
response rate met our target, certain community types and provinces were underrepresented and
required further sampling. Areas of the table that are shaded yellow indicate areas where
additional data needed to be collected to improve sample representativeness. Respondents from
Manitoba and British Columbia were initially under-sampled as were all Aboriginal communities.
Table 14 Initial Web Survey Respondents by CSD and Province
Province Total Number of CSDs
Number of Aboriginal
CSDs
Number of Rural Respondents (%
of Rural CSDs)
Number of Aboriginal
Respondents (% of Ab CSDs)
Total Number of Responses
Overall Response
Rate
Manitoba 235 66 30 (18%) 4 (6%) 34 14% Saskatchewan 737 69 161 (24%) 12 (17%) 173 23% Alberta 268 39 51 (22%) 1 (3%) 52 19% British Columbia
340 161 26 (15%) 26 (16%) 52 15%
Total 1580 335 268 (22%) 43 (13%) 311 22%
Based on the initial web-based survey results, instructions were provided to the SSRL to collect
additional respondents by re-emailing the full list of non-respondents.
Responses at the end of the second stage still showed under-representation from Manitoba and
Aboriginal communities. As such, the research team reviewed e-mail addresses and looked for
alternate e-mail addresses. Saskatchewan communities and rural Alberta communities were not
included in this effort since they were adequately represented.
For communities of interest that had an e-mail that still bounced, or had not completed the survey,
the community was contacted by the research team by phone to invite them to complete the survey
and collect the correct e-mail address to which to send the survey link. This method proved time
intensive and yielded few additional results but did improve representativeness. Data collection
was completed by June 20, 2015.
2.5.2 Surveys Completed In total, 359 surveys representing 361 communities were completed. The overall response rate was
23%. As is common in all surveys, non-response bias may be present, as there were a number of
respondents that we were not able to reach via e-mail, did not participate in the survey, and/or did
not answer all of the questions in the survey. As mentioned previously, we performed additional

33
runs to ensure our final sample was as representative as possible of type and location of
community.
Not all respondents answered all of the questions. Similar to the analysis of the telephone survey
used by CIP, the web-based survey had 41 perception-based questions around community needs,
business capacity, and social capacity. To determine which surveys to consider complete, we
identified 37 key questions. If more than 8 of these 37 had a response of don’t know or refused to
answer, we dropped their response from the sample. Five responses were dropped. The analysis was thus based on the responses of 354 respondents who answered questions in regards to 356
communities (combined CSDs) in total.
Table 15 shows the results of all three rounds of surveys and the percent of CSDs represented.
Responses from Aboriginal communities in Manitoba and Alberta are still very under-represented
with only a single response collected from Aboriginal communities in Alberta. This limitation
requires caution when comparing or generalizing the results.
Table 15 Web Survey, by community and province
Community
Type
Indicator Manitoba Saskatchewan Alberta British
Columbia
Total
Rural # of Responses 35 193 62 29 319
# of Communities 171 665 229 179 1244
Response Rate (%) 20.47 29.02 27.07 16.20 25.64
Aboriginal # of Responses 5 10 1 25 41
# of Communities 62 66 38 149 315
Response Rate (%) 8.06 15.15 2.63 16.78 13.02
Sum # of Responses 40 203 63 54 360
# of Communities 233 731 267 328 1559
Response Rate (%) 17.17 27.77 23.60 16.46 23.09 Source: Tabulated based on Statistics Canada Census of Population 2011 and Geographic Attribute File 2011. Note: in
total, there were 11 Aboriginal respondents in Saskatchewan; however, one was placed in a community for which
Statistics Canada reported a population of zero in 2011, and thus was not included in the table.
When administrators answered the survey, they entered the community on behalf of which they
were answering. Some administrators perform duties on behalf of multiple communities, and
entered more than one community. For statistical analysis purposes, we have treated each response
as one response, even if it was given for multiple communities.
Figure 6 shows a map of the communities represented in our web-based survey. The red markers
indicate an Aboriginal community, and the blue indicate a rural community.

34
Figure 6 Map of Web Survey Respondents
2.5.3 Notes About the Web-Based Survey Our survey asked respondents to give responses based on a 4-point Likert scale. Although 5-7 point
Likert scale items are generally preferable, we chose to adopt a 4-point Likert scale for most
responses to reduce the number of response options, and to make it more comparable to the
telephone survey. The 4-point scale reduced the variability in our measures.
As noted in the telephone survey above, there is often difficulty wording survey questions in a way
that ensures reliability and validity of responses. We encountered a few such problems with our
survey. Some of the wording invited personal perceptions rather than focusing on an overall
community analysis, limiting the possibilities for interpretation and analysis of those questions. For
instance, when collecting information about community needs, it would have been preferable to
determine whether or not the need was provided for in the community with a simple “yes” or a
“no”. If the response was yes, then the respondent should have been asked to respond regarding
the quality and scope of the service or program. If the answer was no, then the respondent could
have been asked if it was actually perceived as needed, and if so, how urgently. However, these
changes would have made the overall survey longer, which was a concern.
A large number of e-mail addresses, particularly for Aboriginal communities, bounced back. The
research team was unable to find active e-mail addresses for all communities. As a result, every
community in our list was not given the opportunity to respond to the survey. It is impossible to tell
if the survey was actually answered by the community administrator, of if the task of answering the
questions was delegated to another employee; however this is not a major concern given that many
of these communities are small enough that they would likely not employ substantive numbers of
employees.
2.5.4 Data Analysis Once the final dataset was received from the SSRL, analysis was conducted using STATA software. A
variety of different deductive quantitative analysis methods were conducted to look for patterns in

35
the data, including correlations between factors and regressions. The factor analysis from the
telephone survey was applied to the web survey data to allow for comparison.
For analysis, the questions were grouped into a variety of baskets.
Needs were divided into 3 groups:
a) Primary services: drinking water, sanitation and waste management, recycling, roads, housing, health care, and internet access.
b) Education: questions around daycare, preschool, elementary school, and high school; and c) Secondary services (primarily programs): senior’s programs, arts and culture programs,
physical activity programs, and youth programs.
Business Capacity was measured through questions on post-secondary training, general business
skills, financing, technology, labour, and networking opportunities.
Social Capacity was grouped into questions around:
a) Willingness to work together: individual and community levels, relationships, taking on new projects, adopting new mindsets of ways of thinking, volunteerism
b) Safety and security: frequency of violent crimes, frequency of property crimes, sense of safety and security, law compliance, cleanliness; and
c) Diversity: age, religion, language, race, type of work, income, and so forth.
For analysis at a western Canada level, each respondent was viewed as its own community.
Constructing Factors
Based on the factor analysis of the telephone survey, 7 factors were constructed for the web survey
with some adaptions from the telephone survey (see Table 16).
Table 16 Factor Dimensions, Variables, Adaptation from Telephone Survey, and Cronbach’s Alpha
Dimension/Factor/Variable Adaptation Cronbach’s Alpha
Business Capacity (Factor 1): Business Capacity 0.8659
Post-Secondary Training
General Business Skills
Financing
Technology
Labour
Networking Opportunities
Community Need (Factor 2): Need for Basic Services 0.7623
Drinking Water Service
Sanitation and Waste Management
Recycling Service

36
Roads
Housing Service
Health Care
Internet Access
Community Need (Factor 3): Need for Educational Services 0.8319
Daycare Service
Preschool Service
Elementary School
High School
Community Need (Factor 5): Need for Programs 0.8262
Seniors’ Programs
Arts and Culture Programs
Physical Activity Programs
Youth Programs
Social Capacity (Factor 4): Willingness to Work Together 0.6929
Level of Willingness to Undertake New Projects in the Community
Level of Sharing and Working Together at the Administrative Level
between the Community and Neighbouring Communities
Level of Volunteerism in the Community
Relationships Between Residents in the Community and the
Neighbouring Communities
Not Included
in the Web
Survey
Willingness and Support of the Community of People Coming
Together to take Action to Solve Community Needs
Willingness of the Community to Partner with Neighbouring
Communities
Willingness of the Community to Adopt New Mindsets or Ways of
Thinking to Solve Problems
Reliance on Government for Problem-Solving New to the
Web Survey
Social Capacity (Factor 6): Sense of Safety And Security 0.7140
Occurrence of Property Crime in the Community
Occurrence of Violent Crime in the Community
Compliance with the Law by most people in the Community Not Included
in the Web
Survey
Cleanliness of The Community Not Included
in the Web
Survey

37
See the web survey results chapter for more detail about the data analysis and reporting of results.
3.0 Conclusion
The Co-operative Innovation Project used mixed qualitative and quantitative methods to capture
and analyze data to answer two questions: one, is the co-operative model feasible in rural and
Aboriginal communities in western Canada and if so, what is needed to inspire rural and Aboriginal
communities to explore and create co-operatives that thrive?
This chapter provides additional details relating to the research design and methodology employed
by the CIP team to answer these questions. Further information can also be found in each of the
report chapters in the larger final report: https://coopinnovation.wordpress.com/final-report/.
You can also contact the Centre for the Study of Co-operatives at the University of Saskatchewan at
306-966-8509 or email [email protected].
Feelings of Safety and Security for you and your Family in the
Community
Not Included
in the Web
Survey
Social Capacity (Factor 7): Similarity 0.6301
Ages Among Community Members
Race Among Community Members
Languages Spoken in The Community
Religions
Income Among Community Members
Type of Work Performed Among Community Members
Overall 0.8983

![Post-qualitative research methodology. [Guest lecture]](https://static.fdokumen.com/doc/165x107/632542807fd2bfd0cb035ec1/post-qualitative-research-methodology-guest-lecture.jpg)