Joana Bonifácio Andrade Early stage design methodology to ...
Upload
khangminh22Category
view
1download
0
47
CHAPTER 3: RESEARCH DESIGN AND METHODOLOGY
3.1 INTRODUCTION
The aim of this research was to investigate the perceptions of South African taxpayers with
regard to taxation, with particular emphasis on possible differences in the perceptions of the
four major population groups. As the efficient and effective collection of taxes depends to a
great extent on narrowing the tax gap, knowledge about how taxpayers perceive a tax regime
could assist the fiscal authorities, through communication and taxpayer education, to achieve
this.
The research takes, as its point of departure, a broad framework of sociological and
psychological reasons why citizens avoid paying taxes (as established in previous research)
in order to include a reasonably comprehensive range of questions in the design of the
questionnaire used for the research. The link between the theoretical framework and the
design of the questionnaire is discussed in this chapter.
As the research was essentially of an exploratory nature, statistical hypothesis testing was not
used. While a phenomenological approach could have been employed, the reasons why a
broad-based survey design was used are elaborated on in the chapter. This decision has
influenced the ontological positioning of the research and is explained in more detail. Further,
the techniques used to enhance the validity and reliability of the research outcome, are
described and the ethical considerations are addressed.
3.2 RESEARCH DESIGN
A discussion of the research design aims to highlight, in technical terms, what is to be done
(Cooper & Schindler, 2003:146-151).

48
The research design applied in this study is based on the classification scheme provided by
Cooper and Schindler (2003:146-151) and is described in this section. This scheme takes
cognisance of the degree of research question crystallisation, method of data collection,
researcher control of variables, the purpose of the study, the time dimension, topical scope
and the research environment. These aspects are addressed below.
This was an exploratory study as it tended towards loose structures and attempted to
highlight areas for future research (see section 6.6). As the data was collected from
respondents by means of interviews using a questionnaire as the measuring instrument, an
interrogation/communication approach was followed (Cooper & Schindler, 2003:146-147).
The trained fieldworkers merely recorded the responses of the respondents and did not
attempt to control or manipulate the variables in any way. Therefore, an ex post facto design
was followed. This was a descriptive study as it was concerned with establishing the
likelihood (how much) that taxpayers’ (who) perceptions with regard to taxation would
influence their attitudes towards tax compliance (what) in Tshwane (where) during February
2006 (when) (Cooper & Schindler, 2003:149).
This was a cross-sectional study as the data was only collected on one occasion and
represents a snapshot of the respondents’ responses at that specific point in time (that is,
during February 2006). The study was also a statistical study and was designed for breadth
rather than depth. It attempted to highlight the perceptions of a sample of South African
taxpayers with regard to taxation and made numeric inferences based on the data obtained
(Cooper & Schindler, 2003:149-150).
Finally, the research was carried out under field conditions as it was conducted under actual
environmental conditions (that is, the respondents were interviewed in their homes and the
fieldworkers merely recorded the respondents’ responses with no manipulation of variables
taking place) (Cooper & Schindler, 2003:150).

49
3.3 SAMPLING
The intention of the study was not to generalise the findings to all taxpayers and potential
taxpayers in South Africa, but to obtain a large and sufficiently diverse sample in order to
obtain a meaningful spread of perceptions concerning tax issues. The sample was, therefore,
not intended to be statistically representative of the perceptions of the four South African
population groups selected for this research.
3.3.1 Target population defined for the study
The universe for the sample included residents who were twenty-one years and older of the
White, Coloured, Indian and Black/African population groups (that is, the four major South
African population groups as defined by Statistics South Africa (2004:1)) residing in the
Tshwane metropolitan area (which includes Pretoria, the capital city of South Africa).
3.3.2 Sample size and sampling method employed
Due to constraints such as time, budget and geographic distances, it was not possible to
collect data from the entire population of South African taxpayers. Therefore, a census was
not conducted, and a sample was drawn from the four selected South African population
groups (Cooper & Schindler, 2003:179; Du Plooy, 2002:100).
A sample of South African taxpayers was selected from the greater Tshwane metropolitan
area. This target area was selected, not only for reasons of convenience and cost, but also
because it is an area that includes all the selected population groups, from many different age
groups, who speak a variety of languages and represent a wide range of earnings (that is,
from those who have no income to those who are extremely wealthy). The Tshwane
metropolitan area also includes people who differ vastly in their educational background,
employment status, as well as the type of dwelling and the number of people residing within a

50
specific household. This area was thus not only selected for practical purposes, but also
because it represents a heterogeneous population.
A sample size of 260 South African taxpayers was selected from this area. For this particular
study, in order to comply with statistical requirements, a minimum sample size of 200 would
have been acceptable. To improve the results of the study and because the budget allowed
for this, a sample size of 260 was feasible. This was considered to be an appropriate sample
size by leaders of and committees who approved the research project (that is, the Research,
Post-graduate and Ethics Committees).
A probability sampling approach was employed in the study as the population elements were
randomly selected based on a controlled procedure and each population element had a
known and equal chance of selection (Cooper & Schindler, 2003:183). Although an
unrestricted simple random sample approach is the simplest form of probability sampling, this
was not practical considering the large number of taxpayers in South Africa, as well as
budgetary constraints. An alternative probability approach in the form of cluster sampling was
thus applied (Cooper & Schindler, 2003:192).
The study followed the most important form of cluster sampling known as area sampling
because the sample of South African taxpayers was identified from a specific geographical
area (Tshwane). The particular households within the Tshwane metropolitan area were then
selected based on further groups (that is, specific areas within the Tshwane region) (Cooper
& Schindler, 2003:196; Diamantopoulos & Schlegelmilch, 2000:16).
The specific manner in which the sample was selected for the study is now discussed. In
order to comply with statistical requirements, the distribution for the target population groups
was disproportionate to achieve a minimum of 40 Coloured and Indian, 80 White and 100
Black/African respondents (see Table 2).

51
Table 2: Number of respondents intended to be surveyed in each population group Population Group Number of respondents intended to be surveyed Black/African 100 White 80 Indian 40 Coloured 40 Total 260
The sample was based on the 1996 census population figures. The specific areas that were
included in the sample (see Appendix A) were selected in the following manner:
• Indian areas - The two main Indian areas in Tshwane (that is, Laudium and Lotus
Gardens) were included.
• Black areas - The areas with the highest Black/African population in Tshwane, namely,
Soshanguve, Mamelodi, Saulsville and Atteridgeville were included, as well as
Sunnyside and the Arcadia area, which are mixed areas.
• Coloured areas - The main area in Tshwane with Coloured residents, namely,
Eersterus was selected.
• White areas - The traditional White suburbs in Tshwane (see Appendix A) were
selected by means of selecting random numbers by using a random sampling
programme in SPSS (Version 13).
The abovementioned areas were divided into quadrants and an even number of interviews
were allocated to each quadrant. A minimum of two interviews was allocated to a suburb. The
households were selected systematically from a random starting point. Selection of specific
households was determined as follows:
• The number of respondents required in each area for each population group was
determined (for example, 40 respondents from Eersterus and 35 respondents from
Mamelodi were required – see Appendix A).
• The households in each specific area were then divided by the number of respondents
that were required (for example, the households in Eersterus were divided by 40 and
the households in Mamelodi were divided by 35).
• The specific households were then selected by means of simple random sampling.

52
Following this, the individual respondents were selected from qualifying household members
by means of a Kish Grid. A Kish Grid, named after the statistician who invented it, is a table of
numbers. The number of people in a household is discovered and a random number is
chosen to select a particular person (Audience Dialogue, 2002).
A Kish Grid is used in the following manner:
• The number of people living in the household that are eligible to be interviewed (in this
case, household members over twenty-one years of age) is determined. This includes
people who sleep there but who are not present when the interview is conducted.
• The youngest household member is number one, the second youngest is number two,
and, so on up, until the eldest household member.
• The first household where an interview is conducted is household one, the second is
household two, and so on, up to household eight – the last in the cluster.
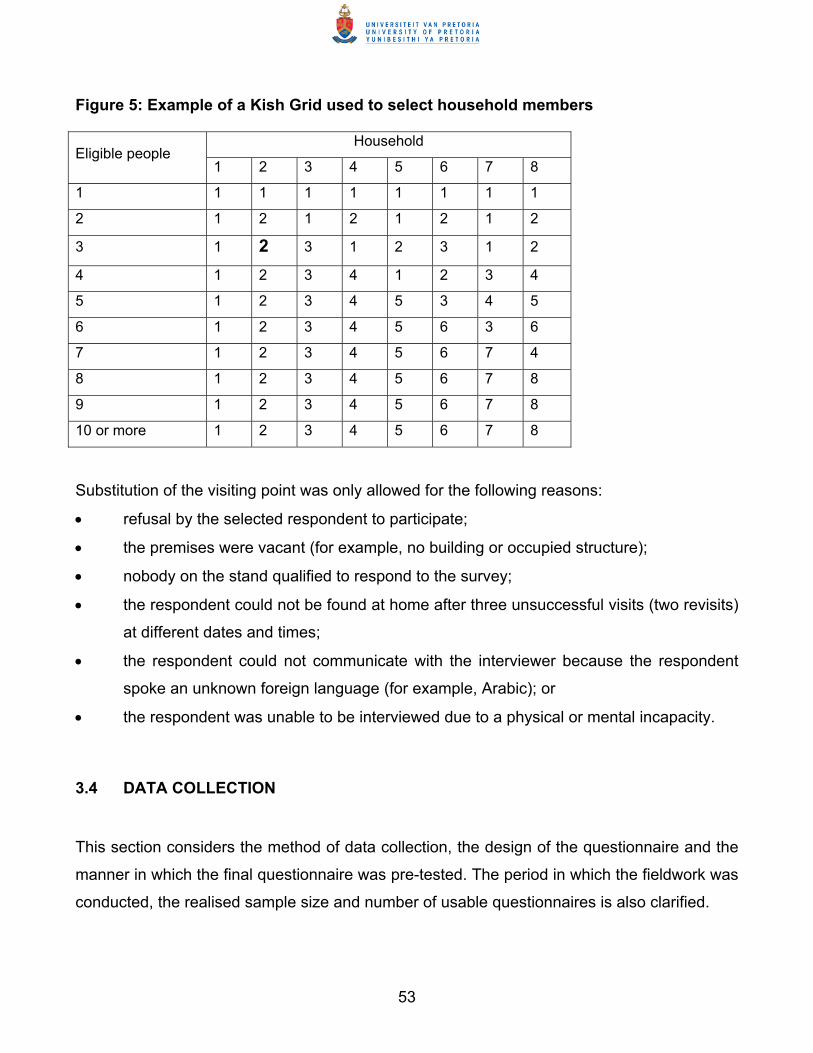
• The interviewer then finds the column for the household member and the row for the
number of eligible people. The number in the cell, where the column and row intersect
one another, is the person selected for the interview. For example, if household two
has three adults, the second youngest (shown in bold in Figure 5) is interviewed after
arranging to meet with that specific person (Audience Dialogue, 2002).
The reason for numbering the household members from the youngest to oldest (rather than
the seemingly more obvious oldest to youngest) is that younger people are usually more
difficult to find at home (Audience Dialogue, 2002).
53
Figure 5: Example of a Kish Grid used to select household members
Substitution of the visiting point was only allowed for the following reasons:
• refusal by the selected respondent to participate;
• the premises were vacant (for example, no building or occupied structure);
• nobody on the stand qualified to respond to the survey;
• the respondent could not be found at home after three unsuccessful visits (two revisits)
at different dates and times;
• the respondent could not communicate with the interviewer because the respondent
spoke an unknown foreign language (for example, Arabic); or
• the respondent was unable to be interviewed due to a physical or mental incapacity.
3.4 DATA COLLECTION
This section considers the method of data collection, the design of the questionnaire and the
manner in which the final questionnaire was pre-tested. The period in which the fieldwork was
conducted, the realised sample size and number of usable questionnaires is also clarified.
Household Eligible people
1 2 3 4 5 6 7 8
1 1 1 1 1 1 1 1 1
2 1 2 1 2 1 2 1 2
3 1 2 3 1 2 3 1 2
4 1 2 3 4 1 2 3 4
5 1 2 3 4 5 3 4 5
6 1 2 3 4 5 6 3 6
7 1 2 3 4 5 6 7 4
8 1 2 3 4 5 6 7 8
9 1 2 3 4 5 6 7 8
10 or more 1 2 3 4 5 6 7 8

54
3.4.1 Method of data collection
Data may be grouped into two categories, namely, quantitative (that is, collecting data in the
form of numbers) and qualitative (that is, data in the form of words or pictures) (Neuman,
2000:33).
Kumar (1999:10) explains that a study is classified as qualitative if its purpose is primarily to
describe a situation, phenomenon, problem or event; the information is gathered through the
use of variables measured on nominal or ordinal scales (that is, qualitative measurement
scales); and an analysis is done to establish the variation in the situation, phenomenon or
problem without quantifying it. This approach is sometimes called the interpretative,
constructivist or postpositivist approach (Leedy & Ormrod, 2005:94).
Alternatively, if the researcher wants to quantify the variation in a phenomenon, situation,
problem or issue, if information is gathered using predominantly quantitative variables
(interval and ratio scales), and if the analysis is geared to ascertain the magnitude of the
variation, the study is classified as a quantitative study (Kumar, 1999:10). Examples of
quantitative aspects of a research study include: “How many people have a particular
problem?” or “How many people have a particular attitude?” (Kumar, 1999:10). This approach
is sometimes called the traditional, experimental or positivist approach (Leedy & Ormrod,
2005:94).
The aim of this study was to determine and quantify how many South African taxpayers have
positive/negative perceptions of taxation and how this influences their attitudes towards tax
compliance. The study was thus classified as a quantitative study. In addition, a positivist
framework was followed as it was an empirical study with the core of the scientific endeavour
being observation and measurement (Henning, Van Rensburg & Smit, 2004:17).
Further support for classifying this study as following a positivist approach is provided by
Bryman (in Ritchie & Lewis, 2003:6). These authors note that beliefs and practices associated
with positivism usually include the following:

55
• the methods of the natural sciences are appropriate for the study of social
phenomenon;
• only those phenomena which are observable can be regarded as knowledge;
• knowledge is developed inductively through the accumulation of verified facts;
• hypotheses are derived deductively from scientific theories to be tested empirically (the
scientific method);
• observations are the final arbiter in theoretical disputes; and
• facts and values are distinct, thus making it possible to conduct an objective enquiry.
As this study adhered to the above beliefs and practices, it would be appropriate to assert that
a predominantly positivist framework was followed. In the design of the questionnaire,
provision was made for limited open-ended responses, and in this respect a very limited
qualitative component was included in the design of the research.
In order to ensure improved controls of the fieldwork, a private, independent company,
MarkData Pty (Ltd) (referred to as MarkData from this point forward), was contracted to carry
out the data collection phase for this research project. MarkData operates in the Tshwane
metropolitan area and specialises in providing strategic research solutions on a variety of
issues for numerous national and international clients.
MarkData’s experience in the field of research dates back to the early eighties. The company
has a track record of vast experience in the field of planning, health, demographic and
population surveys, as well as studies in support of community development and monitoring
surveys in the field of development and of the Reconstruction and Development Programme
(RDP). In addition, MarkData regularly conducts countrywide surveys (of up to 20 000
interviews) in all areas of communities. The company staff compliment is made up of very
experienced supervisors and interviewers who, between them, are conversant in all of the
official South African languages.

56
Personal, face-to-face interviews were conducted to collect the data for the study using a
structured and semi-structured questionnaire. These interviews took place at the respondents’
homes.
Throughout the survey, constant communication was maintained with MarkData to ensure
that the quality of data collection was upheld. During fieldwork, once interviews were
conducted, the completed questionnaires were collected and checked for correct completion.
These were then returned to the office for further checking.
Interviews were often conducted after hours to ensure that the selected respondents were
available. If the selected person was not at home during the first visit, but was available
during the survey period, an appointment was made and the interview was conducted with the
person concerned. If, however, no person in the household qualified to be interviewed, or was
not available during the fieldwork period, this household was substituted according to a
specific procedure (as explained in section 3.3.2). Two revisits were made before a
household was substituted.
The assistance of experienced coordinators and interviewers was obtained for the survey.
The interviewers conducted the interviews in close proximity to their own residential areas
and had to comply with the following minimum requirements:
• a matric or grade 12 educational qualification (that is, the highest level of education
obtainable in South African schools and a prerequisite to register for a tertiary
qualification at a university) or equivalent;
• multi-linguistic, in order to speak the relevant language in a particular fieldwork area;
and
• training in personal, face-to-face interviewing with structured and semi-structured
questionnaires.
The fieldworkers were trained on 10 February 2006 in Pretoria. The questionnaire was
compiled in English. During training, all questions were translated by the responsible
coordinator from MarkData into the relevant languages for the fieldworkers. Interviews were

57
conducted in the respondents’ language of choice. Fieldworkers were instructed to adhere to
the sequence of the questions in order to ensure that respondents were not lead in answering
the questions.
3.4.2 Design of the questionnaire
In research, measurement consists of assigning numbers to empirical events in compliance
with a set of rules. This means that observable empirical events are selected, a scheme is
developed for assigning numbers or symbols to represent aspects of the event being
measured and that the mapping rule(s) is applied to each observation of that event (Cooper &
Schindler, 2003:221). A questionnaire was compiled and served as the measuring instrument
for the study. The specific measurement scales that comprised the questionnaire are
considered below.
The aim of this study was to measure the likelihood that South African taxpayers’ perceptions
with regard to taxation would influence their attitudes towards tax compliance. This study
assumed that if taxpayers have negative perceptions about tax, they will also have negative
attitudes towards tax compliance, and vice versa.
Standardised scales did not exist to measure the constructs in the study. A customised scale
was thus developed for the study (see questionnaire in Appendix B) (Cooper & Schindler,
2003:250). Simple category, multiple choice single-response, as well as multiple choice
multiple-response scales were used in the final questionnaire to determine taxpayers’
perceptions with regard to taxation.
The simple category scale (also known as a dichotomous scale) offers two mutually exclusive
response choices (for example, “yes” and “no”, “important” and “unimportant”, “agree” and
“disagree”). This response strategy is particularly useful for demographic questions or where
a dichotomous response is adequate (Cooper & Schindler, 2003:253). In the final

58
questionnaire (see Appendix B), questions 2, 9, 13, 17, 19, 22 and 23 represented simple
category scales.
The multiple choice single-response scale is appropriate where the respondent has multiple
options but only one answer is sought (Cooper & Schindler, 2003:253). Questions 1, 3, 4, 5,
6, 7, 8, 10, 11, 14, 15, 16, 18, 20 and 21 represented multiple choice single-response scales.
A variation on the previous scale is the multiple choice multiple-response scale (also called a
checklist) which provides multiple options but the respondent can select anything from one to
several alternatives. Although question 12 in the final questionnaire reflected a multiple choice
single-response scale, the results of the study showed that respondents often selected more
than one option. Hence, question 12 was treated as a multiple choice multiple-response scale
when reporting the results of the study.
The questionnaire for the study was developed taking cognisance of research that had been
conducted previously. For a review of the findings of these studies, see chapter 2. The
section below describes the individual questions included in the questionnaire, together with
the literature that provides support for the inclusion of each question in the questionnaire.
Questions 1-4 and 6: Respondents were requested to indicate their age, gender, population
group, home language and educational background respectively in questions 1, 2, 3, 4 and 6.
Lewis’s (1982:172) model of tax evasion highlights that the characteristics of taxpayers, in
terms of their individual, group and demographic differences, influence their attitudes and
perceptions of fiscal policy and constitutional structure. This, in turn, influences tax
compliance or evasion. Some of these variables identified in previous surveys, include age,
sex, and educational factors. In addition, according to the Australian Cash Economy Task
Force (1998:18), taxpayer compliance decisions can be affected by sociological factors (for
example, age, gender, ethnic background and education level).

59
Previous studies have also identified that age (Mueller, 1963:233; Webley et al., 1991:68-77),
gender (Friedland et al., 1978:113; Webley et al., 1991:110) and educational background
(Almond & Verba, 1963:379-387; Fallan, 1999:173-184; Groenland & Van Veldhoven 1983, in
Webley et al., 1991:59; Vogel, 1974:501) are factors which influence tax evasion.
The above provides support for investigating these issues in the current study. Hence, these
abovementioned variables were included in the final questionnaire.
Questions 7 and 9: Question 7 requested respondents to indicate their employment status.
Question 9 asked respondents whether they earn a second or other additional income (for
example, income from a second trade or from renting out premises) in addition to their
monthly salary.
The literature indicates that there are several facts that implicate framing outcomes as gains
or losses in taxpayer decision-making (Jackson & Milliron, 1986:152; Schadewald, 1989:69;
Smith & Kinsey, 1987:648). For instance, tax that has to be paid has greater utility than tax
that is already withheld. In addition, the majority of taxpayers in the United States prefer
having more tax withheld than is strictly necessary. This implies that, in a system where tax is
withheld by the authorities, individuals who expect a refund and perceive this as a gain, would
avoid the risks associated with evasion. On the other hand, those expecting to pay additional
tax (a certain loss) would be more likely to take the risky alternative and evade tax.
Previous studies have also revealed that a person’s employment status can be associated
with tax evasion behaviour (Webley et al., 1991:68-77; Vogel, 1974:507). Therefore, the
investigation of these variables, as well as their inclusion in the questionnaire is justified.
Question 8: Question 8 requested respondents to indicate their income per month before
deductions. According to Lewis’s (1982:172) model of tax evasion, characteristics of
taxpayers in terms of their individual, group and demographic differences, influence their
attitudes and perceptions of fiscal policy and constitutional structure. This, in turn, influences
tax compliance or evasion. The taxpayer’s income (including perceived economic well-being

60
and anticipated future economic well-being) is included in these characteristics. The brackets
used in the questionnaire were designed taking the tax threshold into account. Hence,
support is provided for including this question in the questionnaire.
Questions 5, 10 and 11: Lewis’s (1982:172) model of tax evasion emphasises that
characteristics of taxpayers, in terms of their individual, group and demographic differences,
influence their attitudes and perceptions of fiscal policy and constitutional structure. This, in
turn, influences tax compliance or evasion on the part of the taxpayer.
Question 5 requested respondents to indicate their type of dwelling and question 11
requested respondents to specify the number of persons living within their household. These
questions, based on the 2001 census, were included, as they focus on demographics and
also indicate individual and group differences.
Question 10 required respondents to indicate the frequency of visits to state-funded medical
facilities per month. This question was included as it provides further demographic information
and implies the extent to which they are dependent on the government.
Question 12: In this question respondents were requested to indicate how they would invest
R10 000 if they were to inherit or win this sum of money. The options which respondents
could select included: 1) invest the amount in a bank/post office savings account; 2) invest the
sum of money in a bank/post office fixed deposit; 3) keep the money in a safe place at home;
or 4) invest this amount of money on the Johannesburg Stock Exchange (JSE) (the name of
the JSE has recently been amended and is now referred to as JSE Securities Ltd). Lewis’s
(1982:172) model of tax evasion includes risk aversion as a behavioural aspect of taxpayers.
In addition, according to the Australian Cash Economy Task Force (1998:18), taxpayer
compliance decisions can be affected by psychological factors such as risk.
Questions 13 and 14: Question 13 requested respondents to indicate whether they are
registered as a taxpayer with SARS. Question 14 asked whether respondents had consulted
with SARS officials in the past. If so, respondents were asked to agree or disagree with a

61
number of statements that related to the manner in which they were treated by SARS officials.
Regarding these issues, Lewis (1982:172) in his second model on the relationship between
tax attitudes and tax behaviour, suggests that tax inspectors influence a person’s attitude and
behaviour. This provides support for including questions 13 and 14 in the questionnaire.
Naidoo (2005:13) also mentions that taxpayers often believe that they are being treated as
criminals by SARS officials.
Question 15: In Lewis’s (1982:172) model of tax evasion, in relation to individuals, fiscal
attitudes and perceptions (which include the individual’s support for government policies)
affect a taxpayer’s decision whether or not to evade paying tax. Therefore, support is
provided for the inclusion of question 15, which requested respondents, in the final
questionnaire, to indicate how strongly they support the present government.
Question 16: Question 16 requested respondents to indicate their views concerning the
future of South Africa. According to Lewis’s (1982:172) model of tax evasion, some taxpayers
may have a better understanding of the working of fiscal policy than others. By contrast, tax
authorities who are perceived as rigorous invaders of personal liberty may, in turn, engender
more antipathetic tax attitudes. This is also influenced by the characteristics of taxpayers in
terms of their individual, group and demographic differences. Surveys have identified a host
of these variables, including anticipated future economic well-being. This provides support for
the inclusion of question 16 in the questionnaire.
Question 17: Question 17 requested respondents to indicate their view on income
distribution in South Africa (that is, whether they believe that all income earned should accrue
to the government, which should then distribute this evenly among all South Africans, or
whether everyone should be entitled to retain the income they earn). Considering Lewis’s
(1982:172) model of tax evasion, as far as the authorities are concerned one of the factors
that is regarded as important, is the government’s fiscal policy. In addition, according to the
Australian Cash Economy Task Force (1998:18), taxpayer compliance decisions can be
affected by economic factors such as the tax system. This provides support for including this
question in the questionnaire.

62
Question 18: Question 18 requested respondents to indicate whether they agreed, disagreed
or had no opinion concerning a number of statements dealing with general issues related to
tax. The statement, and the section in the literature review that provides support for the
inclusion of each statement, is provided in Table 3.
Table 3: Support from the literature for the inclusion of specific statements that relate to general tax issues
Statement Section in the literature that provides support for inclusion of statement
A large proportion of taxes is used by the government for meaningless purposes
When considering taxpayers’ attitudes towards and perceptions of constitutional structure, government and fiscal policy, Lewis’s (1982:172) model on tax evasion includes taxpayers’ perceptions of the uses of tax revenue. A previous study that examined taxpayers’ perceptions on the tax system in South Africa revealed that one of the main contributors as to why people are reluctant to pay tax is that they believe that the government does not spend the collected revenue effectively and responsibly (Coetzee, 1993:5-7). According to Pravin Gordhan, the present SARS Commissioner, as quoted by Sawyer (1998:6), a possible reason for tax fraud in South Africa is the government’s perceived mismanagement of funds.
It is unfair to pay tax In Lewis’s (1982:172) model of tax evasion, in relation to taxpayers’ attitudes towards and perceptions of constitutional structure, government and fiscal policy, taxpayers’ perceptions of the purposes and fairness of taxation (perhaps in terms of equity) is included. According to the Australian Cash Economy Task Force (1998:18), taxpayer compliance decisions can be affected by psychological factors such as fairness/equity. A study by Webley et al. (1991:68-77) shows that people use the unfairness of the tax system as a justification of evasion. Delport (2003:4) notes that South African taxpayers dislike paying taxes, due to a perception that the tax system is unfair.
Income tax rates must be reduced
Allingham and Sandmo’s (1972:338) classical model assumes that a person’s behaviour is influenced by the tax rate (which determines the benefits of evasion). Song and Yarbrough (1978:450) found that a shortcoming of income tax is that the tax rate is too high.

63
In a South African study undertaken by Oberholzer (2005:249-275), a substantial proportion of the respondents indicated that they would not object if lower tax rates were introduced. De Villiers (1996:23) examined four groups of taxpayers (that is, formal enterprises, informal enterprises, White, Asian and Coloured population groups, and the Black population group). All four of these groups agreed that tax rates are too high and should be reduced. According to Slemrod and Bakija (1996:1), the most common complaint regarding taxes from taxpayers is that they are too high.
The VAT rate must be reduced
Allingham and Sandmo’s (1972:338) classical model assumes that a person’s behaviour is influenced by the tax rate (which determines the benefits of evasion). In a South African study undertaken by Oberholzer (2005:249-275), a substantial proportion of the respondents indicated that they would not object if lower tax rates were introduced. De Villiers (1996:23) examined four groups of taxpayers (that is, formal enterprises, informal enterprises, White, Asian and Coloured population groups, and the Black population group). All four of these groups agreed that tax rates are too high and should be reduced. According to Slemrod and Bakija (1996:1), the most common complaint regarding taxes from taxpayers is that they are too high.
The income tax rate (%) should be the same regardless of the amount of income earned (i.e. everybody pays income tax using the same percentage irrespective of the amount you earn)
According to Lewis’s (1982:172) model of tax evasion, one of the factors that is regarded as important as far as the authorities are concerned is the government’s fiscal policy. According to the Australian Cash Economy Task Force (1998:18), taxpayer compliance decisions can be affected by economic factors such as the tax system and government policies.
I do not know why I have to pay tax
In Lewis’s (1982:172) model of tax evasion, when considering taxpayers’ attitudes towards and perceptions of constitutional structure, government and fiscal policy, taxpayers’ perceptions of the purposes and fairness of taxation (perhaps in terms of equity) is included.
Waste and corruption in government is high
Concerning taxpayers’ attitudes towards and perceptions of constitutional structure, government and fiscal policy, Lewis’s (1982:172) model on tax evasion includes taxpayers’ perceptions of the uses of tax. A study by Dean et al. (1980:42) reveals that a possible reason for the cause of tax evasion is government wastage.

64
According to Pravin Gordhan, the present SARS Commissioner, as quoted by Sawyer (1998:6), possible reasons for tax fraud in South Africa is the government’s perceived mismanagement of funds and fraud within SARS.
Rich people should pay tax at a higher rate
According to Lewis’s (1982:172) model of tax evasion, one of the factors that is regarded as important as far as the authorities are concerned is the government’s fiscal policy. According to the Australian Cash Economy Task Force (1998:18), taxpayer compliance decisions can be affected by economic factors such as the tax system and government policies.
Tax is very complicated - I do not know how to calculate my own tax liability
Smith and Kinsey (1987:645) present a flow chart, which shows the factors that shift people from their habitual behaviour to consciously taking a decision and forming intentions. These authors note that expressive factors or “psychic costs” have a direct effect on intentions. These are simply the subjective costs and benefits involved with taxpaying, such as the frustration involved in completing tax forms. After all their experimental studies into tax evasion, Webley et al. (1991:122) contend that for some participants the task is too difficult and they are unsure of how to calculate their tax liability. Song and Yarbrough (1978:450) found that a shortcoming of income tax is that the regulations are too complicated. A past study that examined taxpayers’ perceptions on the tax system in South Africa shows that one of the main contributors as to why people are reluctant to pay tax is that the taxpayer does not fully understand how to calculate his tax liability (Coetzee, 1993:5-7). De Villiers (1997:54-55) is of the opinion that South Africa’s tax system is very complex.
The amount of tax I have to pay is reasonable considering the benefits received
In Lewis’s (1982:172) model of tax evasion, when considering taxpayers’ attitudes towards and perceptions of constitutional structure, government and fiscal policy, taxpayers’ perceptions of the purposes and fairness of taxation (perhaps in terms of equity) is included. According to the Australian Cash Economy Task Force (1998:18), taxpayer compliance decisions can be affected by sociological factors such as reciprocity, as well as psychological factors such as fairness/equity. A previous study that examined taxpayers’ perceptions on the tax system in South Africa indicated that one of the main contributors as to why people are reluctant to pay tax is that taxpayers believe that they do not get value for their money, for example, in poor

65
infrastructure, inferior health care and education (Coetzee, 1993:5-7). Findings in a South African study by Oberholzer (2005:249-275) show that generally, the respondents are positive towards paying tax if the government applies it appropriately for the benefit of the taxpayer.
The government does not provide enough information about how they use taxpayers’ money
Concerning taxpayer’s attitudes towards and perceptions of constitutional structure, government and fiscal policy, Lewis’s (1982:172) model on tax evasion includes taxpayers’ perceptions of the uses of tax revenue. A previous study by De Villiers (1996:23) examined four groups of taxpayers (that is, formal enterprises, informal enterprises, White, Asian and Coloured population groups, and the Black population group). Their findings reveal that millions of people in South Africa are not paying taxes. De Villiers (1996:23) postulates that one reason for this may be that they are not well-informed regarding tax issues. A South African study conducted by Oberholzer (2005:249-275) shows that a significant percentage of the respondents believe that the government should be transparent in the utilisation of taxpayers’ money.
Question 19: Question 19 exposed the respondents to the statement: “People who open their
own business are usually willing to take risks to do this”. Respondents were then requested to
indicate whether they regard themselves to be the type of person who likes to take a risk.
According to Lewis’s (1982:172) model of tax evasion, the characteristics of taxpayers
influence their attitudes and perceptions of fiscal policy and constitutional structure which, in
turn, influences their perceived enforcement and opportunity. Surveys have identified risk
aversion as a characteristic of taxpayers which may influence their perceptions. This provides
support for the inclusion of question 19 in the questionnaire.
Question 20: Question 20 requested respondents to indicate whether they agreed, disagreed
or had no opinion regarding a number of statements that relate to tax evasion. Each specific
statement, as it appeared in the questionnaire, as well as the section in the literature that
provides support for the inclusion of each statement, is indicated in Table 4.

66
Table 4: Support from the literature for including specific statements that relate to tax evasion
Statement Section in the literature that provides support for inclusion of statement
The fiscal authorities (SARS) would notice if I decided to evade tax
Allingham and Sandmo’s (1972:338) classical model assumes that a person’s behaviour is influenced by the probability of detection (which determines the cost). Taxpayers contemplating tax fraud may well assess the chance of being caught as being very remote. In Lewis’s (1982:172) model of tax evasion, in the case of individuals, perceptions of enforcement and opportunity influence a taxpayer’s decision as whether or not to evade. Dean et al. (1980:39-40) found that tax evasion may increase if people believe that they will not be detected. In an experiment by Webley et al. (1991:102), strong support was provided for the proposition that greater opportunity leads to greater tax evasion. It is noted in Slemrod’s (1992:6) summary of Kent Smith’s (1992:223-250) study that normative commitment to compliance could be positively reinforced by the effective detection of tax evasion, particularly for tax laws not rooted in values based on the relationships among individuals.
Government receives enough tax so it does not matter if some people evade tax
The Corchon model (Cowell, 1990:122), a game-playing model, is an extension to Allingham and Sandmo’s (1972:338) classical model. In the Corchon model, the tax situation is treated as a two-person game involving the taxpayer and the authorities. The taxpayer has two choices - he can either comply or not comply. The authorities also have two choices - they can investigate the taxpayer or not. An extension to the Corchon model takes into account the behaviour of other taxpayers (for example, certain social psychological variables such as stigma, reputation and social norms).
The burden of tax is so heavy that many people are forced to evade it in order to survive
In Lewis’s (1982:172) model of tax evasion, when considering taxpayers’ attitudes towards and perceptions of constitutional structure, government and fiscal policy, taxpayers’ perceptions of the purposes and fairness of taxation (perhaps in terms of equity) is included. Questions concerning the perceived equity of opportunity for tax evasion are considered in this model, in particular, the perception that the tax system may appear unfair, in the sense that people with higher incomes are perceived as having greater opportunities legally to avoid paying tax and income tax. According to the Australian Cash Economy Task Force (1998:18), taxpayer compliance decisions can be affected by sociological factors such as reciprocity as well as psychological factors such as fairness/equity.

67
A past study by Coetzee (1993:5-7) examined taxpayers’ perceptions on the tax system in South Africa and shows that one of the main contributing factors as to why people are reluctant to pay tax is that fiscal drag on personal incomes has resulted in a gradual impoverishment, as, after tax, salaries decline, despite remuneration increases. A study by Dean et al. (1980:42) indicates that a possible cause of tax evasion is financial hardship.
Since so many other people are evading tax, I cannot be blamed for evading tax
The interactive models (or game-playing models) (Benjamini & Maital, 1985:245-264; Corchon (1984, in Webley et al. 1991:10)), which are extensions to Allingham and Sandmo’s (1972:338) classical model, stem from the recognition that a taxpayer is not taking decisions in isolation and that there are other “players” in the “game”. In this case, the behaviour of other taxpayers is relevant – a taxpayer’s reputation may suffer if they are caught evading in a population largely comprised of non-evaders but will be unaffected or may even rise if the majority evade taxes (Webley et al., 1991:10). An extension to the Corchon model (that is, a game-playing model) includes the behaviour of other taxpayers (for example, stigma, reputation and social norms).
I work hard for the income I receive so I should be allowed to keep it all for myself
If one were to stop a person in the street and ask him or her why they think people evade tax, their response would almost certainly be very straightforward and easy, “greed” (Webley et al., 1991:8). Dean et al. (1980:42) also found that greed is a possible cause of tax evasion.
People evade tax because the risk that the authorities will find out is low
Allingham and Sandmo’s (1972:338) classical model assumes that a person’s behaviour is influenced by the probability of detection (which determines the cost). Taxpayers contemplating tax fraud may well calculate that the chance of being caught is very remote. In Lewis’s (1982:172) model of tax evasion, on the individual side, perceptions of enforcement and opportunity influence a taxpayer’s decision as whether to evade or not. Dean et al. (1980:39-40) indicate that tax evasion may increase if people believe that they will not be detected. An experiment by Webley et al. (1991:102) showed strong support for the proposition that greater opportunity leads to greater tax evasion. Slemrod’s (1992:6) summary of Kent Smith’s (1992:223-250) study also reveals that normative commitment to compliance could be positively reinforced by effective detection, particularly for tax laws not rooted in values based on the relationships among individuals.
Wealthy people evade tax more often than poor people
The perceived equity of opportunity for tax evasion in Lewis’s (1982:172) model of tax evasion considers the perception that the tax system may appear unfair, in the sense that people with higher incomes are perceived as having greater opportunities legally to avoid paying tax.

68
Questions 21 and 22: A Swedish study by Vogel (1974:499-513) requested taxpayers to
choose suitable penalties for tax evasion from a set of fixed alternative penalties. The
penalties ran from no penalty or a fine, to prison sentences of various lengths. It was found
that the choice of a prison term appears to be a good indicator of the perceived seriousness
of tax offences. Questions 21 and 22 followed a similar approach.
Question 21 listed a range of crimes which are appropriate in a South African context. These
include shoplifting, housebreaking, tax evasion, drunken driving, failing to report additional
income and hijacking. Hijacking forms one of the sub-categories of armed robbery (National
Hijack Prevention Academy, 2007).
Respondents were requested to indicate which penalty (that is, no penalty, fine or
imprisonment) they considered to be appropriate for each crime. A person who commits tax
evasion is guilty of an offence and liable on conviction to a fine or to imprisonment for a period
not exceeding five years (section 104 of the Income Tax Act).
Question 22 requested respondents to indicate whether they thought that these penalties
were too severe (that is, too high).
Allingham and Sandmo’s (1972:338) classical model assumes that behaviour is influenced by
the penalties for fraud. The classical model predicts that the severity of penalties will affect
evasion and it is logical to infer that if penalties are severe, people will be more compliant.
The above discussion provides support for the inclusion of these questions in the
questionnaire.
Question 23: Question 23 requested respondents to answer “yes” or “no” (as honestly as
possible) to a number of statements. The first six statements relate to tax compliance and the
last three statements concern the risk profile of respondents. The statements are listed in
Table 5, followed by substantiation from the consulted literature for the inclusion of these
statements in the questionnaire.

69
Table 5: Support from the literature for including specific statements that relate to tax compliance and respondents’ risk profile
Statement Section in the literature that provides support for inclusion of statement
Every year I report all of my income to the fiscal authorities (SARS) when I submit my income tax return
According to the Australian Cash Economy Task Force (1998:18), taxpayer compliance decisions can be affected by sociological factors (that is, norms, reciprocity, age, gender, education level and ethnic background).
I would consider not reporting all of my income to the fiscal authorities (SARS) when I submit my income tax return in future
The Australian Cash Economy Task Force (1998:18) notes that taxpayer compliance decisions can be affected by sociological factors (that is, norms, reciprocity, age, gender, education level and ethnic background).
I have sometimes made higher deductions than was legally permitted when I submitted my income tax return
According to the Australian Cash Economy Task Force (1998:18), taxpayer compliance decisions can be affected by sociological factors (that is, norms, reciprocity, age, gender, education level and ethnic background).
I would consider making higher deductions than legally permitted when I submit my income tax return in future
It is noted by the Australian Cash Economy Task Force (1998:18) that taxpayer compliance decisions can be affected by sociological factors (that is, norms, reciprocity, age, gender, education level and ethnic background).
I would still accept a job if the employer offers not to deduct any income tax even though, by law, the employer should
The Australian Cash Economy Task Force (1998:18) highlights that taxpayer compliance decisions can be affected by sociological factors (that is, norms, reciprocity, age, gender, education level and ethnic background). An experiment conducted by Webley et al. (1991:102), showed strong support for the proposition that greater opportunity leads to greater tax evasion.
If a tax advisor advises me not to declare all of my income, I would take his advice
According to the Australian Cash Economy Task Force (1998:18), taxpayer compliance decisions can be affected by sociological factors (that is, norms, reciprocity, age, gender, education level and ethnic background). An experiment conducted by Webley et al. (1991:102), showed strong support for the proposition that greater opportunity leads to greater tax evasion.
I partake in gambling such as betting on horses, visiting casinos more than four times per month
According to the Australian Cash Economy Task Force (1998:18), taxpayer compliance decisions can be affected by psychological factors (that is, risk, fear, trust, values, fairness/equity and opportunity to evade).
I partake in the Lotto at least four times per month
The Australian Cash Economy Task Force (1998:18) notes that taxpayer compliance decisions can be affected by psychological

70
factors (that is, risk, fear, trust, values, fairness/equity and opportunity to evade).
I think that the Lotto is good because a portion of the money is allocated for charitable purposes
According to the Australian Cash Economy Task Force (1998:18), taxpayer compliance decisions can be affected by psychological factors (that is, risk, fear, trust, values, fairness/equity and opportunity to evade).
Question 24: The final question in the questionnaire was an open-ended question. Open-
ended questions are appropriate when the objective is to discover opinions and degrees of
knowledge (Cooper & Schindler, 2003:375). The aim of question 24 was to gather additional
information and learn more about the respondents’ perceptions and knowledge of taxation.
The only open-ended question included in the questionnaire for this study, therefore, was: “Do
you have any further comments with regard to tax in South Africa (for example, would you like
to be more informed about tax by receiving brochures, pamphlets, etc)”.
A study by Oberholzer (2005:249-275) that investigated taxpayers’ perceptions in South
Africa, identified a need for more knowledge regarding tax systems and the application
thereof. This provides support for the inclusion of this open-ended question in the
questionnaire.
3.4.3 Pre-testing the questionnaire and period in which fieldwork was conducted
The data-gathering phase of the research process generally begins with a pilot study. A pilot
test is carried out in order to detect weaknesses in design and instrumentation and to provide
proxy data for selection of a probability sample. Thus, it should draw subjects from the target
population and imitate the procedures and protocols that have been designated for data
collection. The size of a pilot group may range from twenty-five to one hundred subjects,
depending on the method to be tested, but the respondents do not have to be statistically
selected (Cooper & Schindler, 2003:86).
There are a number of variations on pilot testing. Some are intentionally restricted to data
collection activities. One form, pre-testing, may rely on colleagues, respondent surrogates, or

71
actual respondents in order to refine a measuring instrument. Pre-testing may be repeated
several times to refine questions, instruments or procedures (Cooper & Schindler, 2003:86).
This study followed two phases with regard to pilot testing. First, the questionnaire was pre-
tested by fifteen academic colleagues. No major problems were detected and only minor
comments in relation to the style and grammar of the questionnaire were received. These
comments were taken into account and the questionnaire was amended accordingly.
For the second pre-testing phase, twenty-five respondents were drawn from the target
population. The pilot test was carried out in a manner similar to the way in which the actual
data for this study was to be collected. Fieldworkers from MarkData conducted interviews with
the pilot group using the questionnaire.
MarkData revealed that, overall, the questionnaire worked well. The following problem areas
were, however, revealed:
• a “not applicable” option had to be added to one of the questions (see question 10);
• a “no opinion” option had to be added to three of the questions (see question 14, 18
and 20); and
• in one of the questions where the respondents had to indicate whether they agreed,
disagreed or had no opinion regarding a specific statement, the statement needed to
be explained more clearly (see fifth statement in question 18).
These aspects were addressed and the final questionnaire amended accordingly (refer to
Appendix B for an example of the final questionnaire). The actual data for this study was
collected, using this questionnaire, during the month of February 2006.
3.4.4 Realised sample size and number of usable questionnaires
As highlighted above (see section 3.3.1), the target population for the study consisted of 260
respondents. As the services of MarkData were used to carry out the research and this

72
organisation had access to all the respondents, they were able to follow up on any problem
areas concerning the completed questionnaires (for example, missing responses, obvious
errors or illegible writing for the open-ended questions). A sample size of 260 was thus
realised. This aspect is further addressed in the following section.
3.5 PREPARATION, ANALYSIS AND INTERPRETATION OF DATA
This section considers the manner in which the data was edited and coded for this study. The
method of analysis and statistical techniques applied are also discussed.
3.5.1 Editing and coding the data
Editing refers to the process of detecting errors and omissions, correcting them where
possible and certifying that minimum data quality standards have been achieved. Two forms
of editing include field and central editing (Cooper & Schindler, 2003:455).
Field editing is where the researcher checks for errors that may have occurred during the
stress of data collection soon after the data has been gathered. The researcher may have
used ad hoc abbreviations and special symbols and it is often difficult to complete what was
abbreviated or written in shorthand or noted illegibly if the entry is not clarified that day.
Respondents are often re-contacted if there are entry gaps or if an answer is unclear, rather
than merely guessing what the respondent “probably would have said” (Cooper & Schindler,
2003:455; Diamantopoulos & Schlegelmilch, 2000:40). Central editing, on the other hand, is
when ambiguous, inconsistent, or missing data is dealt with by the researcher and they are
unable to clarify the problem with the appropriate respondent (Cooper & Schindler, 2003:455;
Diamantopoulos & Schlegelmilch, 2000:40). Field editing was applied in this study.
Field editing was performed by MarkData. When the fieldworkers left the respondents’ homes
they immediately examined the completed questionnaires in order to ensure that there were
no missing responses and that the answers to the open-ended question were legible. The

73
coordinators also examined the questionnaires to ensure comprehensive and correct
completion. In addition, MarkData performed a further field control function in the form of back
checks. They re-contacted 15% of the respondents to ensure that the interview did in fact
take place and that it was conducted in the appropriate manner. These checks ensured that
the interviews were completed according to the correct procedures. As it was possible for
respondents to be contacted by MarkData to clarify any problems, no ambiguous,
inconsistent, or missing data had to be dealt with. Central editing was, therefore, not required.
Coding involves assigning numbers or other symbols to responses so that the responses can
be grouped into a limited number of classes or categories (Cooper & Schindler, 2003:456).
Numeric codes were assigned to each option for each of the questions in the questionnaire
(for example, age 21-29 years was coded as “1”, 30-39 was coded as “2”). When the
completed questionnaires were received from MarkData, these numeric codes were entered
into the coding boxes on the questionnaires by a research assistant. The accuracy of the
coding was verified by the researcher based on a random sample. This process was followed
in order for the data capturer in the Department of Statistics at the University of Pretoria to
capture the coded responses. These numbers were used to analyse the data and carry out
the appropriate statistical procedures.
Questions 1 to 23 in the questionnaire were closed-ended questions and numeric codes could
thus be assigned. Question 24, on the other hand, was an open-ended question. A content
analysis approach was thus applied to capture the open-ended responses. According to
Cooper and Schindler (2003:460), a content analysis is: “…a research technique for the
objective, systematic and quantitative description of the manifest content of a
communication”. Content analysis can be used to analyse written material, audio or video
data from experiments, observations, surveys, and secondary data studies (Cooper &
Schindler, 2003:460).
Similar responses for the open-ended question were grouped into specific categories of
responses. The findings for the open-ended questions were then reported, based on these
categories, following a content analysis approach.

74
3.5.2 Method of analysis and statistical techniques
Diamantopoulos and Schlegelmilch (2000:64) note that the focus of any analysis takes one of
three basic forms, namely, description, estimation and hypothesis-testing. This study followed
a descriptive focus.
With a descriptive focus, the aim is to paint a summary picture of the sample (or population) in
terms of the variable(s) of interest. There are a number of statistical techniques that can be
used to undertake descriptive analysis and these are referred to as descriptive statistics
(Diamantopoulos & Schlegelmilch, 2000:64-65).
The starting point in a descriptive analysis is the construction of a frequency distribution for
each variable of interest. This indicates in absolute or relative (that is, percentage) terms how
often the different values of the variable are actually encountered in the sample
(Diamantopoulos & Schlegelmilch, 2000:65).
The data was analysed electronically using the Statistical Analysis Software (SAS) package
(Version 8.2). The analysis was performed by the Department of Statistics at the University of
Pretoria. The findings were provided in the form of frequencies and percentages in a report
format.
In order to perform a more detailed statistical analysis, a number of amendments were made
to the raw data. The initial variables from the questionnaire are listed in Table 6. This table
also provides the new variables that were formed by re-grouping the original variables (in
order to provide higher frequencies per variable).
Table 6: Variables initially used in the questionnaire and new variables formed
Initial variables used in the questionnaire Variable number on questionnaire
Representation of variable
V1 Number of questionnaire representing each respondent V2 Age group

75
V3 Gender V4 Population group V5 Home language V6 Type of dwelling V7 Educational background V8 Employment status V9 Income per month before deductions V10 Earning of a second/other additional income (for example, income from a second
trade, income from renting out premises) V11 Frequency of visits to state-funded medical facilities (for example, hospitals,
clinics) per month V12 Number of persons living within a household V13 Manner in which respondent would invest R10 000 that was won or inherited V14 Registration with SARS as a taxpayer V15 Consulted with SARS officials in the past V16 Perception that SARS officials were efficient (that is, did not have to wait long for
assistance) during consultation V17 Perception that SARS officials treated respondent with respect during
consultation V18 Perception during consultation that SARS officials have a high standard of
knowledge relating to tax issues V19 Level of support for the current government V20 View about the future of South Africa V21 View on income distribution in South Africa V22 Perception that a large proportion of taxes is used by the government for
meaningless purposes V23 Perception that it is unfair to pay tax V24 Perception that income tax rates must be reduced V25 Perception that the VAT rate must be reduced V26 Perception that the income tax rate (%) should be the same regardless of the
amount of income earned (that is, everybody pays income tax using the same percentage irrespective of the amount a person earns)
V27 Knowing why a person has to pay tax V28 Perception that waste and corruption in government is high V29 Perception that wealthy people should pay tax at a higher rate V30 Perception that tax is very complicated and not knowing how to calculate one’s
own tax liability V31 Perception that the amount of tax a person has to pay is reasonable considering
the benefits received

76
V32 Perception that the government does not provide enough information about how they use taxpayers’ money
V33 Whether a person considers him/herself to be a risk-taker (that is, would be willing to open their own business and take a risk by doing so)
V34 Perception that the fiscal authorities (SARS) would notice if a person decided to evade tax
V35 Perception that the government receives enough tax so it does not matter if some people evade tax
V36 Perception that the burden of tax is so heavy that many people are forced to evade tax in order to survive
V37 Perception that since so many other people are evading tax, a person cannot be blamed for evading tax
V38 Perception that people work hard for the income they receive so they should be allowed to keep it all for themselves
V39 Perception that people evade tax because the risk that the authorities would find out is low
V40 Perception that wealthy people evade tax more often than poor people V41 Penalty considered to be appropriate for shoplifting V42 Penalty considered to be appropriate for housebreaking V43 Penalty considered to be appropriate for tax evasion V44 Penalty considered to be appropriate for drunken driving V45 Penalty considered to be appropriate for failing to report additional income V46 Penalty considered to be appropriate for hijacking V47 Perception that the penalties for tax evasion (that is, the person is guilty of an
offence and liable on conviction to a fine or to imprisonment for a period not exceeding five years) is too severe
V48 Every year reporting all income to the fiscal authorities (SARS) when submitting income tax return
V49 Consideration of not reporting all income to the fiscal authorities (SARS) when submitting future tax returns
V50 Have sometimes made higher deductions than was legally permitted when submitting income tax returns
V51 Consideration of making higher deductions than legally permitted when submitting future income tax returns
V52 Would still accept a job if the employer offers not to deduct any income tax even though, by law, the employer should do so
V53 Would not declare all income if tax advisor advises not to do so V54 Partake in gambling such as betting on horses and visiting casinos more than
four times per month V55 Partake in the Lotto at least four times per month V56 Belief that the Lotto is good because a portion of the money is allocated for

77
charitable purposes New variables formulated by regrouping initial variables
New variable number
Variables combined
VV2 Age groups: 21 – 29; 30 – 39; 40 – 49; 50 – 59; 60+
60+: Combined last two age groups (that is, 60 – 69 and 70+) VV5 Language groups: Afrikaans, English, Nguni, Sotho, Other
Nguni languages: Combined IsiNdebele, IsiXhosa, IsiZulu and SiSwati Sotho languages: Combined Sepedi, Sesotho and Setswana Other languages: Combined Tshivenda and Xitsonga
VV6 Type of dwelling: House, Formal housing and Informal housing
Formal housing: Combined flat in a block of flats and house/flat/room in backyard Informal housing: Combined informal dwelling/shack in backyard and informal dwelling/shack not in backyard
VV7 Educational background: No matric, matric, higher education
No matric: Combined no schooling, some primary, completed primary and some secondary
VV8 Employment status: salaried, self-employed and no income
Salaried: Combined salaried employee public and private sector No income: Combined unemployed and economically inactive
VV9 Income groups: R0 – R2 917; R2 918 – R10 000 and R10 000+
R0 – R2 917: Combined R0 – R1 000 and R1 001 – R2 017 R2 918 – R10 000: Combined R2 918 – R5 000 and R5 001 – R10 000 R10 000+: Combined R10 001 – R15 000, R15 001 – R20 000, R20 001 – R30 000 and R30 0001 or more
VV11 New categories: Less than 1 visit per month, on average 2 – 5 visits per month and not applicable
2 – 5 visits per month: Combined options on average 2, 3, 4 and 5 visits per month
VV12 Number of persons within household new groups: 1-2, 3, 4, 5 and 6+
1-2: Combined 1 and 2
6+: Combined 6, 7, 8, 9 and 10 or more

78
3.6 VALIDITY AND RELIABILITY OF DATA
The need to ensure validity and reliability in research affects all aspects of the research
design. Various strategies were used in this study to ensure that the conclusions are
warranted by the data. The questionnaires were appropriately pre-tested. Removing bias from
a study ensures validity. The services of an autonomous company, MarkData, were used in
order to ensure independence. However, the researcher was involved with the training of the
fieldworkers to ensure a proper understanding of the questions in the questionnaire. All the
questions were translated into the relevant languages for the fieldworkers by the responsible
coordinator from MarkData.
The questions initially did not have a “no opinion” option but MarkData recommended the
inclusion of this option to enable a comprehensive and correct completion of the
questionnaire. The interviewers were, however, discouraged to provide this as an option and
central tendency was limited to a minimum.
In order to ensure that there were no missing responses and that the answers to the open-
ended question were legible, the fieldworkers examined the completed questionnaires as
soon as they left a respondent’s home. Comprehensive and correct completion of the
questionnaires was also checked at this time. In addition, MarkData performed a further field
control function in the form of back checks whereby they re-contacted 15% of the
respondents to ensure that the interview did in fact take place and that it was conducted in the
appropriate manner. These checks ensured that the interviews were completed according to
the correct procedures.
The use of experienced interviewers from MarkData ensured the elimination of any sampling
bias in the sample selection.

79
3.7 ETHICAL CONSIDERATIONS
As in other aspects of business, all parties in research need to exhibit ethical behaviour.
Ethics can be described as: “…norms or standards of behaviour that guide moral choices
about our behaviour and our relationship with others” (Cooper & Schindler, 2003:120). The
main aim of ethics in research is to ensure that no one is harmed or suffers adverse
consequences from research activities (Cooper & Schindler, 2003:120).
Stack (2005:18), in a summary based on Leedy and Ormrod (2005:101), points out that the
essential ethical attributes of any researcher are academic honesty, integrity and modesty.
Stack (2005:18) additionally asserts that where living beings are the focus of investigation,
there are other important ethical implications that deserve consideration. These include:
• protection from harm;
• informed consent – the use of deception is only permissible under very limited
circumstances and only when the study cannot be conducted meaningfully without it;
• the right of privacy and confidentiality, including giving information about how the raw
data will be dealt with;
• the right of a participant to withdraw at any stage;
• the use of internal review boards for research proposals; and
• professional codes of ethics.
The above aspects were addressed in the study as follows:
Protection from harm: The coordinators and interviewers who gathered the data for the
study reside in the areas in which the interviews were conducted and were thus familiar with
the surroundings (that is, this differs from the situation where interviewers are sent into
unknown areas). Furthermore, MarkData took the following precautions with regard to
ensuring the safety of the fieldworkers:
• Where interviews were conducted in situations or areas that were considered to be
dangerous, the interviewers worked in teams with the coordinator. The coordinator
identified the houses where the interviews were to be conducted and went inside with

80
the interviewer to ensure that everything was in order. The coordinator then fetched the
interviewer at a prearranged time.
• The coordinators were trained to identify potentially dangerous situations and to
withdraw before it became a problem (or in exceptional cases - where the situation
demanded it - to defuse the situation).
• If there was any sign of danger, or merely a feeling of being threatened, MarkData
instructed the interviewer to leave the area as quickly as possible.
• Before conducting interviews, the coordinators informed police stations in the
surrounding areas so that the police were aware of their presence and would be able
to assist swiftly if such a need arose.
Informed consent: According to Maxwell and Satake (1997:216) and Stein and Cutler
(1997:211), an informed consent document must contain the following information:
• A heading, which must include the name and address of the department and
institution, name of the researcher(s) and contact details - This letter was drafted on a
letterhead which included the name and address of the department (Taxation) and the
institution (University of Pretoria). The first paragraph stated the name of the
researcher.
• Title of the study - The title of the study was included on the cover letter to the
questionnaire.
• Purpose of the study - The purpose of the study was stated in the final paragraph on
the informed consent letter. It was noted that the study was conducted to determine
South Africans’ perceptions about taxation in order to enable the government to market
itself and its services more effectively to the general public. It was emphasised that the
researcher was only interested in understanding the perceptions regarding taxation
amongst all South Africans.
• Procedures (for example, explanation of the procedures to be followed and their
purposes, the nature of activities such as filling in questionnaires, time required,
schedule of participation and duration of survey) - The letter of consent stated that the
survey should take a maximum of 20 minutes to complete. The respondents were
requested to indicate their answers, by circling their choice.

81
• Risks and discomforts (if applicable) - This aspect was not applicable to this study as
the respondents were interviewed in their own homes.
• Benefits (this includes any personal or societal gains, as well as financial gain or lack
thereof) - As noted above in the third bullet, the letter of consent stated that the study
would assist the government in its efforts to market itself and its services more
effectively to the general public.
• Participants' rights (that is, participation is voluntary and individuals may withdraw from
participation in the study at any time and without adverse consequences) - It was
stressed that the respondents’ participation in the research project was voluntary.
• Confidentiality (that is, the assurance that all information is treated as confidential, that
anonymity is assured, that the data would be destroyed should the subject withdraw
and that all persons having access to the research data must be identified) - It was
stated that the survey is anonymous and confidential and that the identity of the
respondents would not be revealed. In addition, MarkData provided only a
questionnaire which was numbered in advance, without a respondent’s name or other
details. The research data would be stored in a locked facility to which only the
researcher has access. This addressed the need to ensure the right of privacy and
confidentiality, and the right of participants to withdraw at any stage.
• The subject's (or in the case of a minor, the parent or guardian's) right of access to the
researcher must be established, and the means clearly delineated to ensure clarity on
all issues - As all the participants of the study were required to be over the age of
twenty-one, no minors were involved in this study. The contact details of the
researcher were clearly stated on the covering letter of the questionnaire, making it
possible to clarify any issues, should the need arise.
The use of internal review boards for research proposals: The research proposal was
reviewed by the Research Committee of the Department, as well as the Ethical and
Postgraduate Committee of the Faculty of Economic and Management Sciences at the
University of Pretoria.

82
Professional codes of ethics: The researcher adhered to the code of ethics as specified by
the Ethical Committee of the Faculty of Economic and Management Sciences at the
University of Pretoria.
Finally, honesty with one’s professional colleagues is of paramount importance (Stack,
2005:18). Where the work of another is used or consulted, this must be fully acknowledged to
prevent deliberate or inadvertent plagiarism. Full and accurate referencing of all source
material was adhered to throughout the study.
3.8 SUMMARY
This chapter discussed the research design for and methodology applied to this study and
provided details of the research design, the sampling method employed, as well as the
manner in which the data was collected and analysed for this study. The link between the
theoretical framework (discussed in chapter 2) and the design of the questionnaire was
clarified. The techniques used to enhance the validity and reliability of the research outcome,
were also described and the ethical considerations were addressed.
The following chapter considers the profile of the respondents in the study, in the form of
descriptive statistics.
Copyright © 2022 FDOKUMEN