CHAPTER III RESEARCH DESIGN This chapter explains the ...
14
CHAPTER III RESEARCH DESIGN This chapter explains the methodology of the study, and it covers the research design, participants and data collection techniques, instrument, and data analysis techniques 3.1. Research Design This research uses quantitative research or numeric description of trends, attitudes, or opinion of a population by studying a sample of that population, and according to Creswell (2014), quantitative research approach is to test the theory of objective by examining the relationships between variables. This research method is specific for correlation research. According to Cresswell (2006 ) correlation researches is one part of the ex-post facto research because researchers generally do not manipulate the existing variable and directly search for the existence of the relationship and the level of relationship variable which is reflected in the correlation coefficient. The researcher uses correlation research because researcher wants to know the correlation of two variables. The correlation of two variables can be known from the correlation coefficient. There are three results in correlation research; they are positive
-
Upload
khangminh22 -
Category
Documents
-
view
0 -
download
0
Transcript of CHAPTER III RESEARCH DESIGN This chapter explains the ...

CHAPTER III
RESEARCH DESIGN
This chapter explains the methodology of the study, and it covers the research
design, participants and data collection techniques, instrument, and data analysis
techniques
3.1. Research Design
This research uses quantitative research or numeric description of trends,
attitudes, or opinion of a population by studying a sample of that population, and
according to Creswell (2014), quantitative research approach is to test the theory of
objective by examining the relationships between variables. This research method is
specific for correlation research. According to Cresswell (2006 ) correlation
researches is one part of the ex-post facto research because researchers generally do
not manipulate the existing variable and directly search for the existence of the
relationship and the level of relationship variable which is reflected in the correlation
coefficient. The researcher uses correlation research because researcher wants to
know the correlation of two variables.
The correlation of two variables can be known from the correlation
coefficient. There are three results in correlation research; they are positive

correlation, no correlation and no relationship. Nunan (1991) state that result of
positive correlation research is +1.00, for negative correlation the result is -1.00and
for no correlation result is 0. To investigative the correlation between student’s
anxiety and speaking performance, the researcher will use questionnaire as the
instrument to survey on students’ anxiety and result of students speaking performance
in public speaking class. The two variables in this research are students’ anxiety and
students speaking performance. Variable of students anxiety become the independent
variable (X), and variable of students speaking performance become the dependent
variable(Y).
3.2. Population and Sample
3.2.1. Population
A population is a group of individuals who have the same characteristics
(Creswell, 2012). The participants of this research are students of Public Speaking
class in English Language Education Department Islamic University of Indonesia.
This research was designed to know the correlation of student’s anxiety to their
speaking performance, also designed to find the language learning strategies used by
students of Public Speaking class. The total members of participant in this research
were 101 students. Public Speaking class is one of the subjects at English Language
Education Program in Islamic University of Indonesia. The subject Public Speaking
class was used as the population of this study because this was speaking class. This

subject is the basic of learning to speak which is learning to speak for speaking
performance. The participant of this research was at English education department in
Islamic University of Indonesia. Population is the overall subject of study (Arikunto,
2006). Public Speaking classes have one meeting in a week, the time for meeting in a
week around 100 minutes. The population of this study is consists of 101 students
from Public Speaking students, the class of Public Speaking divided into four classes
(Public Speaking A, Public Speaking B, Public Speaking C, and Public Speaking D)
which is about the student’s language learning for speaking performance The
researcher had several reasons why use Public Speaking class as a participant.
The researcher chose Public Speaking class:
1. Public Speaking is the first class that focuses to learn about speaking skill in
English Language Department in Islamic University of Indonesia.
2. The researcher chooses students Public Speaking of English Language
Department in Islamic University of Indonesia, because the students already
have experience speaking performance in class public speaking.
3. The students’ Public Speaking need to more active in speech. So this class is
appropriate with this research.
3.2.2. Sample
Sample is a part of population which has same characteristics (Arikunto, 2006).
According to her books if the population is more than 100, all population can be
sampled but if the population is over 100, the researcher can take 10% up to 15% or

20% up to 25% or more from all population as a sample (Arikunto, 2006). The
population of this research more than 100 participants, so the researcher use more
than 50% population sampling. It takes more than 50% from total population as a
sample because the population is more than 100. Acquired total of the respondents
are 101 students. This is table for sampling of respondent based on Public Speaking
class. This research is random sampling. Random sampling is a technique of taking a
subject in which each of the subjects has same chance to be the sample of the
research (Arikunto, 2006). In this research, the data of students’ anxiety was collected
by distributing 77 questionnaires, actually the total of students’ public speaking is
101 but some students off from public speaking class, and some students were absent
the class. The questionnaires were distributed directly by attending the place of
respondents in Department of English Education Islamic University of Indonesia.
There are four classes in public speaking subject and in this research the researcher
use public speaking class A and public speaking class D as the sample in this
research. In this research the researchers use public speaking class A and B as the
sample in this research.
Table 1. Population and Sample:
No Class Population Sample
1. Public Speaking A 30 23
2. Public Speaking B 40 28
3. Public Speaking C 15
4. Public Speaking D 16
Total Population 101 51

3.3. Data Collecting Technique
In this research there are two variables, there are independent and dependent
variable. Independent variable is a variable that affect the dependent variable, and
dependent variable is a variable that is effected. In this research students’ anxiety is
the independents variable and students speaking performance is the dependent
variable.
3.3.1. Research Instrument
Research instrument is a tool for measuring, observing, or documenting the
quantitative data (Creswell, 2014). Instrument is a mean used by the researcher to
collect data. Instruments are tools or facilities used by the researchers to collect data
to make easier and good results, complete and systematic so more easily processed
(Arikunto, 2006). In this passage researcher explains about the instrument that used to
collect the data to find the results of the research. The instrument of this research is
FLCAS. The FLCAS is the most widely used scale for measuring foreign language
anxiety and has been translated into many languages and used to measure learners’
foreign language anxiety in various countries all over the world. The questionnaire
takes from foreign language classroom anxiety (Horwitz, Horwitz, & Cope, 1986)
this questionnaire made in 1986, published by: Blackwell Publishing on behalf of the
National Federation of Modern Language Teachers Associations. The questionnaire
of foreign language classroom anxiety there are 33 questions and he code of

questionnaire chooses are SA: strongly agree, A: agree, N: neither agree disagree, D:
disagree, SD: strongly disagree. The researcher takes all items of questioner as
instrument, and there 3 type of anxiety in the questionnaire and the researcher used
the entire item. The questionnaire use likert’s scale which ranged from 1 to 5.
Table 2. The items of questionnaires are design to survey:
Component of Anxiety Questionnaire Number
Communication Apprehension 1, 4, 9, 14, 15, 18, 24, 27, 29, 30, 32
Test Anxiety 3, 5, 6, 8, 10, 11, 12, 16, 17, 20, 21, 25, 26, 28
Fear of Negative Evaluation 2, 7, 13, 19, 23, 31, 33
The second instrument is rubric of student’s Public Speaking. The rubric is
from the lectures of public speaking class. The components of the rubric are fluency,
pronunciation and accent, vocabulary, grammar, and details. The detail components
of fluency are smooth and fluid speech, speech is relatively smooth, and speech is
slow, hesitant and strained except for short memorized phrase. The detail components
of pronunciation and accent are pronunciation is excellent, pronunciation is good,
pronunciation is okay, and pronunciation is lacking and hard to understand. The detail
components of vocabulary are excellent control of language features, good language
control, adequate language control, and weak language control. The detail
components of grammar are accuracy and variety of grammatical structures, some
error in grammatical structures, and frequent grammatical error even in simple
structures; meaning is obscured. The last is the details components in public speaking
rubric there are excellent level of description, good level of description, adequate

description, and description lacks some critical details that make it difficult for the
listener to understand, and description is so lack in that the listener cannot
understand.
3.3.2. Validity of the Instrument
Before gaining the data through questionnaires, researcher checked the
validity and reliability of the questionnaire. Validity is one of the strengths of
research and is based on determining whether the findings are accurate (Creswell,
2012). Validity is defined as the extent to which a concept is accurately measured in a
quantitative study. Questionnaire that used by a researcher is had checked by
(Horwitz, Horwitz, & Cope, 1986) and it has good validity, and this questionnaire is
already used by many researcher in anxiety research. The second instrument is rubric
of speaking performance, this rubric has been checked by the researcher with SPSS
and has good validity, the validity result of the rubric is 0.80.
3.3.3. Reliability of the Instrument
According to Creswell (2012) reliability refers to the consistency and stability of
the score from one administration of an instrument to another. Reliability refers to a
sense an instrument have a good enough to be used as instrument in collecting data
(Arikunto, 2010). The first instrument is questionnaire and according to (Horwitz,
Horwitz, & Cope, 1986) for the reliability of questionnaire is 0.83. Reliability shows

a measure of consistency in measuring the phenomenon. The second instrument is
rubric of speaking performance, the rubric has been check on SPSS and the result of
reliability is 1.00.
3.4.Data Analysis Technique
According to Sugiyono (2012) activity in data analysis refers to a grouping of
data based on variables and types of respondents tabulate data based on variable all
respondents, presenting the data of each of the variables examined, do the
calculations to answer formulation problems, and perform calculations to test the
hypotheses that have been proposed. However, before testing the hypothesis, the
researchers analyze all the data collected and examine the data to measure the
normality as the prerequisite test. In this sub chapter show and explain about specific
measurement to answer the research question or to prop the hypothesis.
3.4.1. Questionnaire FLCAS and Speaking Performance Result
The purpose of this research is to measure the correlation of students’ anxiety
and speaking performance in public speaking class. The data were analyzed using
statistical analysis. The questionnaire gave to the students who took of Public
Speaking class via a link. The questionnaire is intended to measure the level of
students’ anxiety who taking public speaking class. Public speaking class had 14
meeting in 1 semester and the questionnaire given to public speaking students. After

finished handing out questionnaires, researcher checked again the questionnaire, after
checking the questionnaire and input the data to Microsoft Excel a researcher knew
the result of questionnaire. After that researcher asked the speaking performance
result of students’ public speaking to the lectures, after researcher god all the data
collected then researcher began to test the hypothesis. However, before testing the
hypothesis, the researchers analyzed all the data collected and examined the data to
measure the normality as the prerequisite test. Researcher found the questioner about
anxiety, and checks the questioner one by one to made sure the questioner is relevant
with the research and make sure it was easy to understand the meaning. The
questionnaire used is likert’s scale which ranged from 1 to 5. The data were
calculated with the range of score started from 33 to 165. The second instrument is
speaking performance result of Public Speaking students. Researcher will ask the
result of speaking skill task of Public Speaking students to the lectures who teach
Public Speaking subject. The researchers change the result of students speaking
performance into interval class scale.
The Likert’s scoring scale table to measure students’ anxiety level using FLCAS
is shown below:
Table 3. Likerts’ scoring table Adopted from Horwitz et al. (1986)
SCORING
Strongly
agree
Agree Neither agree nor
disagree
Disagree Strongly disagree
1 2 3 4 5

Based on (Sudjana, 2002) the formulation to determine the length of the
interval class, as follow:
p =
p = interval
Range = highest score – lowest score
Class of interval = 5
3.4.2. Correlation Students Anxiety and Speaking Performance (FLCAS Score
and Speaking Performance Result)
The researcher used Microsoft Excel to summarize the instrument scores of
student’s public speaking. To interpret the correlation score, the researcher used the
interpretation of correlation based on (Arikunto, 2010). The detailed information
about the interpretation can be seen as follow:
Table 4. Interpretation correlation
Correlation Value (r) Interpretation
0,800-1,00 High correlation
0,600-0,800 Enough
0,400-0,600 Moderate
0,200-0,400 Low
0,000-0,200 Very low correlation

To correlate students’ anxiety and speaking performance researcher input the
data into SPSS 23.0 the statistical analysis descriptive statistical procedures and
correlation procedure to correlation between students’ anxiety and speaking
performance. The type of analysis in this research is Product Moment Correlation to
analyze the correlation between students’ anxiety (X) and speaking performance (Y).
3.4.3. Hypothesis test
The hypothesis testing was used in this research because the researcher should
check whether there is or no correlation between students anxiety and speaking
performance. The researcher used a survey method through correlation technique and
researcher analyzed the data using Product Moment Correlation to know the result.
Product Moment Correlation is one of technique usually used to find the significant
correlation between two variables (Sugiyono, 2012).
3.4.4. Steps of Data Analysis Technique
The steps of data analysis in this research are the first researcher reviewing the
literature of foreign language anxiety, speaking skill, and speaking performance. The
second researchers choose the questionnaire from (Horwitz, Horwitz, & Cope, 1986)
as instrument, and translate the questionnaire from English to Indonesia. The
researcher check one by one item of questionnaire to make sure that all was easy to

understand the meaning. The researcher distributed 33 items of questionnaire to
public speaking students, and then researcher ask the middle test result of public
speaking students to the lectures. The next step researcher used Microsoft Excel to
analyze the data from questionnaire and middle test result into statistical package or
SPSS.
The last step in this chapter is analyst data of this research. The purpose of
this analysis is to see whether there is significance correlation between anxiety and
speaking performance. The other purpose is to find out the result of this research,
than the researcher analyzed the by using Person’s Product Moment Correlation.
The steps of analyzing data to test the hypothesis first and second are as
follows; to test the hypothesis that there is a positive correlation between students
anxiety and speaking performance students, researchers using the formula correlation
Pearson product moment. Pearson r is a measure of relationship between two
variables of the interval or ratio, and can have a value between -1 and 1. This is a
simple way to assess the relationship between the two variables; do they share the
variance (covary), if it is positive or negative relationship, and the degree to which
they are correlated.
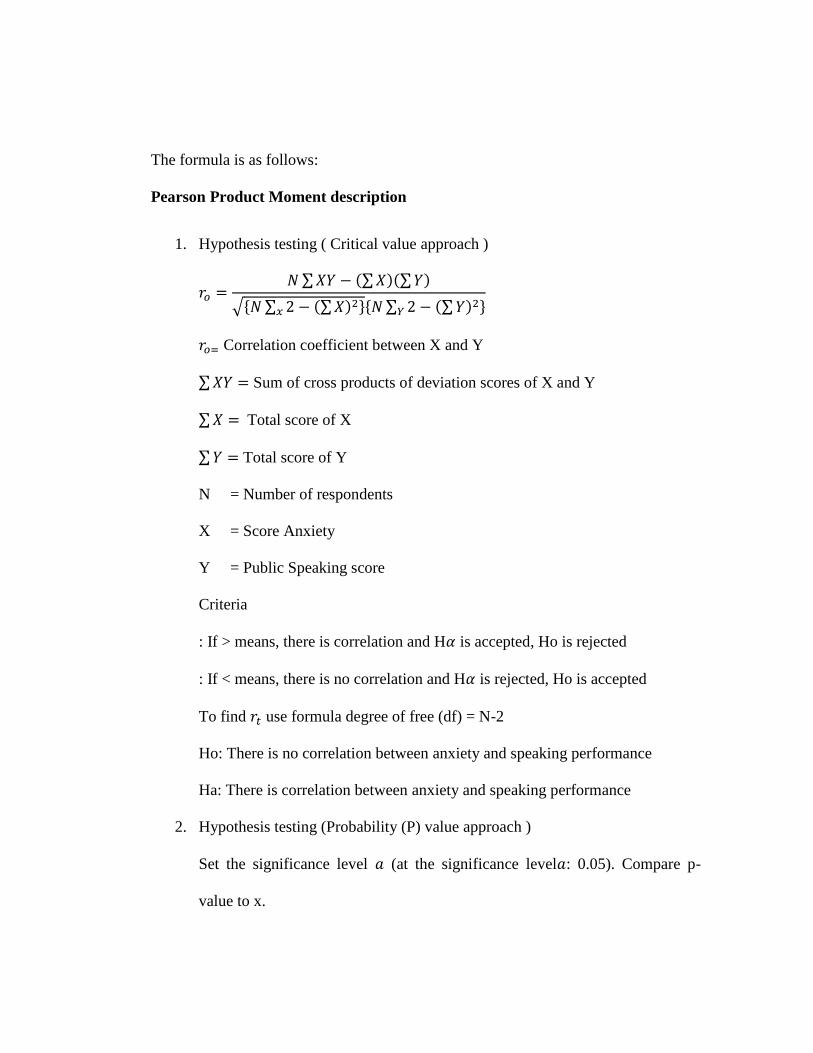
The formula is as follows:
Pearson Product Moment description
1. Hypothesis testing ( Critical value approach )
∑ (∑ )(∑ )
√* ∑ (∑ ) +* ∑ (∑ ) +
Correlation coefficient between X and Y
∑ Sum of cross products of deviation scores of X and Y
∑ Total score of X
∑ Total score of Y
N = Number of respondents
X = Score Anxiety
Y = Public Speaking score
Criteria
: If > means, there is correlation and H is accepted, Ho is rejected
: If < means, there is no correlation and H is rejected, Ho is accepted
To find use formula degree of free (df) = N-2
Ho: There is no correlation between anxiety and speaking performance
Ha: There is correlation between anxiety and speaking performance
2. Hypothesis testing (Probability (P) value approach )
Set the significance level (at the significance level : 0.05). Compare p-
value to x.
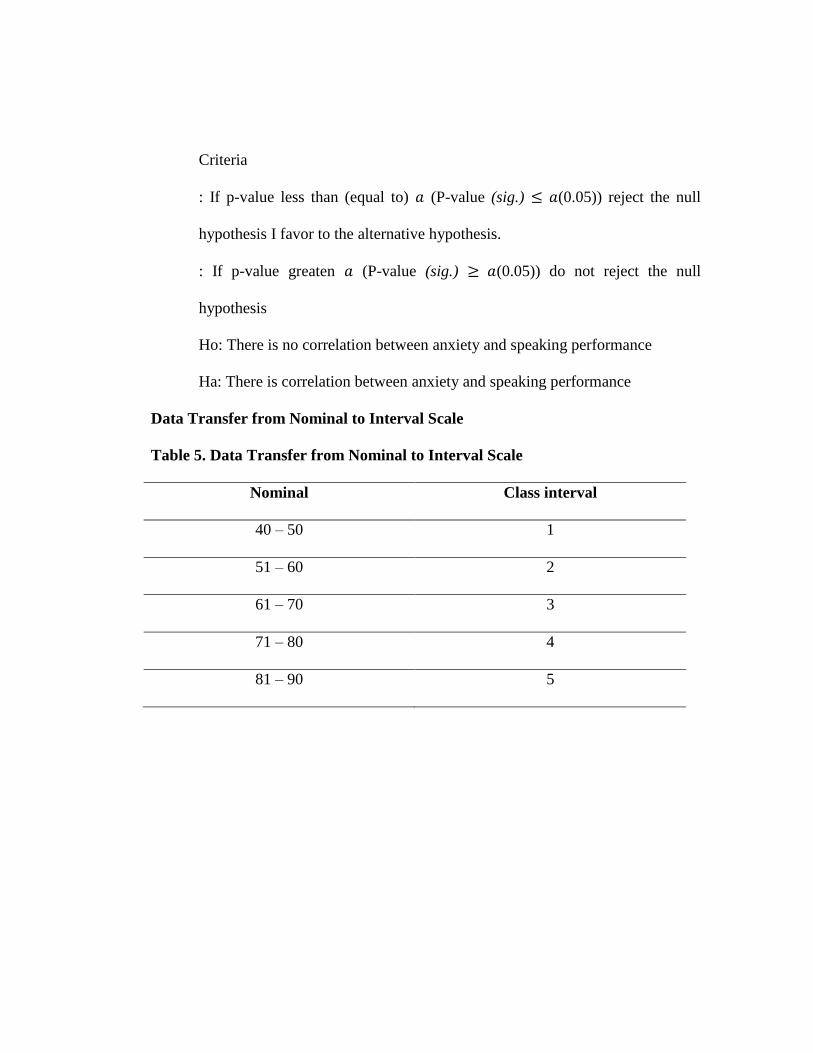
Criteria
: If p-value less than (equal to) (P-value (sig.) (0.05)) reject the null
hypothesis I favor to the alternative hypothesis.
: If p-value greaten (P-value (sig.) (0.05)) do not reject the null
hypothesis
Ho: There is no correlation between anxiety and speaking performance
Ha: There is correlation between anxiety and speaking performance
Data Transfer from Nominal to Interval Scale
Table 5. Data Transfer from Nominal to Interval Scale
Nominal Class interval
40 – 50 1
51 – 60 2
61 – 70 3
71 – 80 4
81 – 90 5