The Management of Capital Key Topics in This Chapter The Many Tasks of Capital
35
Rose-Hudgins: Bank Management and Financial Services, Seventh Edition V. Managing Sources of Funds for Banks and Their Principal Competitors 15. The Management of Capital © The McGraw-Hill Companies, 2008 475 CHAPTER FIFTEEN The Management of Capital Key Topics in This Chapter • The Many Tasks of Capital • Capital and Risk Exposures • Types of Capital In Use • Capital as the Centerpiece of Regulation • Basel I and Basel II • Planning to Meet Capital Needs 15–1 Introduction In a book like this one all topics are important, all have a bearing upon the profitability and viability of financial firms. But some topics are clearly more important than others. Capital is one of those. Raising sufficient capital and retaining enough capital to protect the interests of customers, employees, owners, and the general public is one of the great challenges in the management of a financial-service provider. What is capital? For bankers and many of their competitors the word capital has a spe- cial meaning. It refers principally to the funds contributed by the owners of a financial firm. In the case of a bank this means the stockholders—investors in the common and pre- ferred stock that a financial firm has issued. In the case of banking’s closest competitors, the thrift institutions, the “owners” may be stockholders if the thrift is a corporation or may be its customers in the case of a credit union or mutual savings bank. (For a customer- owned financial firm, capital consists of an accumulation of reinvested profits.) What is it that the owners contribute? Their money—a portion of their wealth—is placed at the financial firm’s disposal in the hope of earning a competitive rate of return on those contributed funds. Sometimes that desired rate of return on the wealth con- tributed by the owners emerges and sometimes it doesn’t. Indeed, if the financial-firm fails, the owners may lose everything they invested. Thus, capital consists mainly of owners’ funds placed at risk in the pursuit of a rate of return commensurate with the risks accepted by the owners. What form does the owners’ investment in a financial institution take? As we will see later in this chapter, some of the owners’ capital contribution takes the form of purchases of stock. Another important component consists of annual earnings that the owners reinvest in the financial firm, building up its reserves in the hope that management will profitability invest those retained earnings, increasing the owners’ future returns.
-
Upload
independent -
Category
Documents
-
view
0 -
download
0
Transcript of The Management of Capital Key Topics in This Chapter The Many Tasks of Capital
Rose−Hudgins: Bank Management and Financial Services, Seventh Edition
V. Managing Sources of Funds for Banks and Their Principal Competitors
15. The Management of Capital
© The McGraw−Hill Companies, 2008
475
C H A P T E R F I F T E E N
The Management of CapitalKey Topics in This Chapter
• The Many Tasks of Capital
• Capital and Risk Exposures
• Types of Capital In Use
• Capital as the Centerpiece of Regulation
• Basel I and Basel II
• Planning to Meet Capital Needs
15–1 IntroductionIn a book like this one all topics are important, all have a bearing upon the profitabilityand viability of financial firms. But some topics are clearly more important than others.Capital is one of those. Raising sufficient capital and retaining enough capital to protectthe interests of customers, employees, owners, and the general public is one of the greatchallenges in the management of a financial-service provider.
What is capital? For bankers and many of their competitors the word capital has a spe-cial meaning. It refers principally to the funds contributed by the owners of a financialfirm. In the case of a bank this means the stockholders—investors in the common and pre-ferred stock that a financial firm has issued. In the case of banking’s closest competitors,the thrift institutions, the “owners” may be stockholders if the thrift is a corporation ormay be its customers in the case of a credit union or mutual savings bank. (For a customer-owned financial firm, capital consists of an accumulation of reinvested profits.)
What is it that the owners contribute? Their money—a portion of their wealth—isplaced at the financial firm’s disposal in the hope of earning a competitive rate of returnon those contributed funds. Sometimes that desired rate of return on the wealth con-tributed by the owners emerges and sometimes it doesn’t. Indeed, if the financial-firm fails,the owners may lose everything they invested. Thus, capital consists mainly of owners’funds placed at risk in the pursuit of a rate of return commensurate with the risks acceptedby the owners.
What form does the owners’ investment in a financial institution take? As we will seelater in this chapter, some of the owners’ capital contribution takes the form of purchasesof stock. Another important component consists of annual earnings that the owners reinvestin the financial firm, building up its reserves in the hope that management will profitabilityinvest those retained earnings, increasing the owners’ future returns.
Rose−Hudgins: Bank Management and Financial Services, Seventh Edition
V. Managing Sources of Funds for Banks and Their Principal Competitors
15. The Management of Capital
© The McGraw−Hill Companies, 2008
476 Part Five Managing Sources of Funds for Banks and Their Principal Competitors
Why is capital so important in financial-services management? Capital performs suchindispensable functions as supplying resources to start a new financial firm, creating a baseof resources for future growth, providing a cushion of protection against risk, and promot-ing public confidence in the long-term viability of a financial firm. Moreover, capital hasbecome the centerpiece of supervision and regulation today—the lever that regulators canpull whenever the alarm bell sounds in an effort to prevent the collapse of a financial firm.Indeed, it is difficult to name anything else on the balance sheet of a financial institutionthat performs so many vital tasks. Yes, capital is important.
15–2 The Many Tasks Capital PerformsThe capital accounts play several vital roles in supporting the daily operations and ensur-ing the long-run viability of financial firms. In the first place, capital provides a cushionagainst the risk of failure by absorbing financial and operating losses until managementcan address the institution’s problems and restore its profitability.
Second, capital provides the funds needed to charter, organize, and operate a financialfirm before other sources of funds come flowing in. A new institution needs start-up fund-ing to acquire land, build or lease facilities, purchase equipment, and hire officers and staffeven before opening day.
Third, capital promotes public confidence and reassures creditors concerning an institu-tion’s financial strength. Capital must also be strong enough to reassure borrowers that alending institution will be able to meet their credit needs even if the economy turns down.
Fourth, capital provides funds for the organization’s growth and the development ofnew services and facilities. Most financial-service providers eventually outgrow the facili-ties they start with. An infusion of additional capital will permit a financial firm to expandinto larger quarters or build additional branch offices in order to keep pace with itsexpanding market and follow its customers.
Fifth, capital serves as a regulator of growth, helping to ensure that growth is sustain-able in the long run. Both the regulatory authorities and the financial markets require thatcapital increases roughly in line with the growth of risky assets. Thus, the cushion toabsorb losses is supposed to increase along with a financial institution’s growing risk expo-sure. For example, a bank that expands its loans and deposits too fast will start receivingsignals from the market and the regulatory community that its growth must be slowed oradditional capital must be added.
Relatively recent research evidence suggests that capital has played a key role in therapid growth of mergers among financial firms. For example, Peek and Rosengren [5] of theFederal Reserve Bank of Boston find evidence that hundreds of smaller banks have disap-peared via merger because of burgeoning growth in large business loans (over $1 millioneach), which can only be made by bigger lenders with stronger capital positions. Bothbanks’ internal loan policies and federal regulations limit the maximum size of not fullysecured loans made to a single borrower to no more than 15 percent of a bank’s unimpairedcapital and surplus, while fully collateralized loans are limited to no more than 25 percentof a federally chartered bank’s unimpaired capital and surplus. Lenders whose capital failsto grow fast enough find themselves losing market share in the competition for the largestborrowing customers.
Finally, capital regulation has become an increasingly important tool to limit howmuch risk exposure financial firms can accept. In this role capital not only tends to pro-mote public confidence in the financial system but also serves to protect the government’sdeposit insurance system (“safety net”) from serious losses.
Rose−Hudgins: Bank Management and Financial Services, Seventh Edition
V. Managing Sources of Funds for Banks and Their Principal Competitors
15. The Management of Capital
© The McGraw−Hill Companies, 2008
Chapter 15 The Management of Capital 477
15–3 Capital and RiskCapital and risk are intimately related to each other. Capital itself is mainly the funds con-tributed by the owners of a financial-firm that have been placed in the firm at the owners’risk—the risk that the institution will earn a less-than-satisfactory return on owners’ fundsor may even fail, with the stockholders recovering little or nothing. Thus, the risks facingthe owners are substantial.
Key Risks in Banking and Financial Institutions’ ManagementCredit RiskThere is, first of all, credit risk. For example, financial intermediaries make loans and takeon securities that are nothing more than promises to pay. When borrowing customers failto make some or all of their promised payments, these defaulted loans and securities resultin losses that can eventually erode capital. Because owners’ capital is usually no more than10 percent of the volume of loans and risky securities (often much less than that), it doesn’ttake too many defaults before capital simply becomes inadequate to absorb further losses. Atthis point, the financial firm fails and will close unless the regulatory authorities elect to keepit afloat until a buyer can be found.
Liquidity RiskDepository institutions encounter substantial liquidity risk—the danger of running out ofcash when cash is needed to cover deposit withdrawals and to meet credit requests fromgood customers. For example, if a bank cannot raise cash in timely fashion, it is likely to losemany of its customers and suffer a loss in earnings for its owners. If the cash shortage per-sists, it may lead to runs by depositors and ultimate collapse. The inability to meet liquidityneeds at reasonable cost is often a prime signal that a financial institution is in trouble.
Interest Rate RiskFinancial intermediaries also encounter risk to their spread—the danger that revenuesfrom earning assets will decline or that interest expenses will rise, squeezing the spreadbetween revenues and expenses and thereby reducing net income. Changes in the spreadare usually related to either portfolio management decisions (i.e., changes in the compositionof assets and liabilities) or to interest rate risk—the probability that fluctuating interest rateswill result in significant appreciation or depreciation in the value of and return from theinstitution’s assets. In recent years financial firms have found ways to reduce their interestrate risk exposure, but such risks have not been completely eliminated—nor can they be.
Operational RiskFinancial-service providers also face operational risk due to weather damage, aging orfaulty computer systems, breakdowns in quality control, inefficiencies in producing anddelivering services, natural disasters, terrorist acts, errors in judgment by management, andfluctuations in the economy that impact the demand for each financial service. Thesechanges can adversely affect revenue flows, operating costs, and the value of the owner’sinvestment in the institution (e.g., its stock price).
Exchange RiskLarger banks and securities firms face exchange risk from their dealings in foreign cur-rency. The world’s most tradable currencies float with changing market conditions today.Institutions trading in these currencies for themselves and their customers continually runthe risk of adverse price movements on both the buying and selling sides of this market.
FilmtoidWhat 1977 comedyrevolves around twobank officers, played byBurgess Meredith andRichard Basehart,covering up employeeembezzlement in theface of an on-siteexamination byregulators?Answer: The GreatBank Hoax.
Rose−Hudgins: Bank Management and Financial Services, Seventh Edition
V. Managing Sources of Funds for Banks and Their Principal Competitors
15. The Management of Capital
© The McGraw−Hill Companies, 2008
478 Part Five Managing Sources of Funds for Banks and Their Principal Competitors
Concept Check
15–1. What does the term capital mean as it applies tofinancial institutions?
15–2. What crucial roles does capital play in the man-agement and viability of a financial firm?
15–3. What are the links between capital and risk expo-sure among financial-service providers?
Crime RiskFinally, all financial firms encounter significant crime risk. Fraud or embezzlement byemployees or directors can severely weaken a financial institution and, in some instances,lead to its failure. In fact, the Federal Deposit Insurance Corporation lists fraud and embez-zlement from insiders as one of the prime causes of recent bank closings. Moreover, thelarge amounts of money that banks keep in their vaults often prove to be an irresistibleattraction to outsiders. As outlaw Jesse James was reputed to have said when asked why herobbed banks, “because that’s where the money is.”
Robberies of depository institutions approached record levels during the 1970s and1980s. These thefts were frequently a by-product of bankers’ efforts to make their lobbies,drive-up windows, and teller machines more accessible to the public. While the 1990sbegan an ongoing decline in the daily rate at which robberies were occurring, the extentand intensity of crime remain high by historical standards. The focus of robberies hasshifted somewhat with changes in technology; theft from ATMs and from patrons usingelectronic networks has become one of the most problematic aspects of crime risk amongfinancial institutions today.
Defenses against RiskOf course, financial firms are not devoid of protection against these many risks. In fact,there are several rings of defense that owners can rely upon to protect their institution’sfinancial position.
Quality ManagementOne of these defenses is quality management—the ability of top-notch managers to moveswiftly to deal with problems before they overwhelm a financial firm.
DiversificationDiversification of a financial institution’s sources and uses of funds also has risk-reducingbenefits. For example, managers of financial firms generally strive to achieve two types ofrisk-reducing diversification: portfolio and geographic. Portfolio diversification meansspreading out credit accounts and deposits among a wide variety of customers, includinglarge and small business accounts, different industries, and households with a variety ofsources of income and collateral. Geographic diversification refers to seeking out cus-tomers located in different communities or countries, which presumably will experiencesomewhat different economic conditions. These forms of diversification are most effectivein reducing the risk of loss when cash flows from different groups of customers move in dif-ferent patterns over time. Thus, declines in cash flow from one customer segment may beat least partially offset by increases in cash flow from other customer segments.
Deposit InsuranceStill another line of defense against risks is deposit insurance. The Federal Deposit Insur-ance Corporation, established in the United States in 1934 and today protectingdepositors holding up to $100,000 in any federally insured depository institution, was
Rose−Hudgins: Bank Management and Financial Services, Seventh Edition
V. Managing Sources of Funds for Banks and Their Principal Competitors
15. The Management of Capital
© The McGraw−Hill Companies, 2008
Chapter 15 The Management of Capital 479
designed to promote and preserve public confidence. While it has not stopped depositoryinstitutions from failing, the FDIC appears to have stopped runs on neighboring institu-tions when any one of them fails. Moreover, its power to examine depositories, issue ceaseand desist orders, levy civil money penalties, and seek criminal prosecution of violators offederal laws inhibits much risk taking by management and shareholders. This is why mostindustrialized countries today have some form of deposit insurance system.
Owners’ CapitalWhen all else fails, it is owners’ capital (net worth) that forms the ultimate defense againstrisk. Owners’ capital absorbs losses from bad loans, poor securities investments, crime, andmanagement misjudgment so that a financial firm can keep operating until its problems arecorrected and its losses are recovered. Only when losses are so large they overwhelm notonly all the other defenses but also the owners’ capital will the institution be forced to closeits doors. Owners’ capital is the last line of defense against failure. Thus, the greater the riskof failure, from whatever source, the more capital a financial institution should hold.
15–4 Types of Capital in UseSeveral different types of capital are in use in the industry today:
1. Common stock, measured by the par (face) value of common equity shares outstanding,which pay a variable return depending on whether the issuing institution’s board ofdirectors votes to pay a dividend.
2. Preferred stock, measured by the par value of any shares outstanding that promise topay a fixed rate of return (dividend rate); preferred stock may be perpetual, have onlylimited life, or be issued as trust preferred stock.
3. Surplus, representing the excess amount above each share of stock’s par value paid inby the institution’s shareholders.
4. Undivided profits, representing the net earnings that have been retained in the businessrather than being paid out as dividends.
5. Equity reserves, representing funds set aside for contingencies, such as legal actionagainst the institution, as well as providing a reserve for dividends expected to be paidbut not yet declared and a sinking fund to retire stock or debt in the future.
6. Subordinated debentures, representing long-term debt capital contributed by outsideinvestors, whose claims legally follow (i.e., are subordinated to) the claims of deposi-tors; these debt instruments may carry a convertibility feature, permitting their futureexchange for shares of stock.
7. Minority interest in consolidated subsidiaries, where the financial firm holds owner-ship shares in other businesses.
8. Equity commitment notes, which are debt securities repayable from the sale of stock.
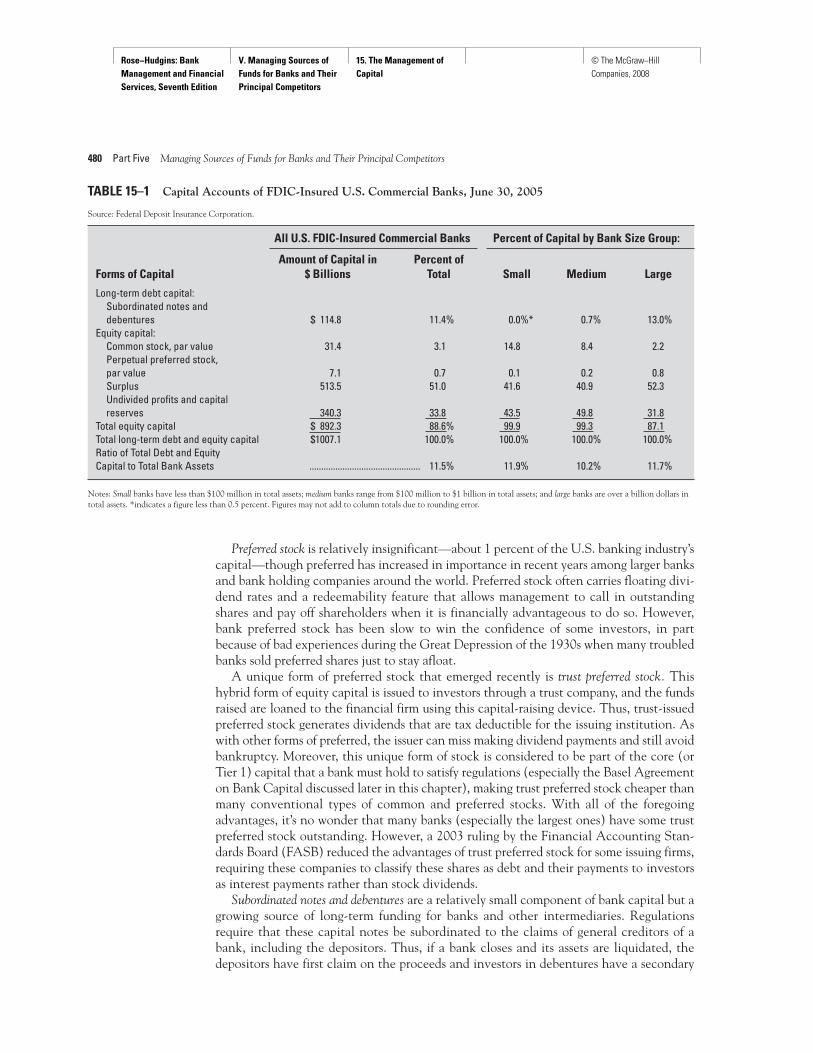
Relative Importance of Different Sources of CapitalTo get some idea of the relative importance of the different kinds of capital we examinethe capital account for all U.S.-insured banks. Table 15–1 shows these various sources ofcapital are by no means equal in importance. First, the surplus market value of all commonand preferred stock above the stock’s face or par value represents the largest proportion ofU.S. bank capital, accounting for just over 50 percent of all long-term debt and equity cap-ital. Close behind is undivided profits (retained earnings) and capital reserves, representinga third of U.S. banks’ capitalization. The remainder is divided up among all other types ofcapital, including long-term debt (subordinated notes and debentures) at close to 12 percentand the par value of common stock at almost 5 percent.
Rose−Hudgins: Bank Management and Financial Services, Seventh Edition
V. Managing Sources of Funds for Banks and Their Principal Competitors
15. The Management of Capital
© The McGraw−Hill Companies, 2008
480 Part Five Managing Sources of Funds for Banks and Their Principal Competitors
All U.S. FDIC-Insured Commercial Banks Percent of Capital by Bank Size Group:
Amount of Capital in Percent of Forms of Capital $ Billions Total Small Medium Large
Long-term debt capital:Subordinated notes and debentures $ 114.8 11.4% 0.0%* 0.7% 13.0%
Equity capital:Common stock, par value 31.4 3.1 14.8 8.4 2.2Perpetual preferred stock, par value 7.1 0.7 0.1 0.2 0.8Surplus 513.5 51.0 41.6 40.9 52.3Undivided profits and capital reserves 340.3 33.8 43.5 49.8 31.8
Total equity capital $ 892.3 88.6% 99.9 99.3 87.1Total long-term debt and equity capital $1007.1 100.0% 100.0% 100.0% 100.0%Ratio of Total Debt and Equity Capital to Total Bank Assets ............................................... 11.5% 11.9% 10.2% 11.7%
TABLE 15–1 Capital Accounts of FDIC-Insured U.S. Commercial Banks, June 30, 2005
Source: Federal Deposit Insurance Corporation.
Notes: Small banks have less than $100 million in total assets; medium banks range from $100 million to $1 billion in total assets; and large banks are over a billion dollars intotal assets. *indicates a figure less than 0.5 percent. Figures may not add to column totals due to rounding error.
Preferred stock is relatively insignificant—about 1 percent of the U.S. banking industry’scapital—though preferred has increased in importance in recent years among larger banksand bank holding companies around the world. Preferred stock often carries floating divi-dend rates and a redeemability feature that allows management to call in outstandingshares and pay off shareholders when it is financially advantageous to do so. However,bank preferred stock has been slow to win the confidence of some investors, in partbecause of bad experiences during the Great Depression of the 1930s when many troubledbanks sold preferred shares just to stay afloat.
A unique form of preferred stock that emerged recently is trust preferred stock. Thishybrid form of equity capital is issued to investors through a trust company, and the fundsraised are loaned to the financial firm using this capital-raising device. Thus, trust-issuedpreferred stock generates dividends that are tax deductible for the issuing institution. Aswith other forms of preferred, the issuer can miss making dividend payments and still avoidbankruptcy. Moreover, this unique form of stock is considered to be part of the core (orTier 1) capital that a bank must hold to satisfy regulations (especially the Basel Agreementon Bank Capital discussed later in this chapter), making trust preferred stock cheaper thanmany conventional types of common and preferred stocks. With all of the foregoingadvantages, it’s no wonder that many banks (especially the largest ones) have some trustpreferred stock outstanding. However, a 2003 ruling by the Financial Accounting Stan-dards Board (FASB) reduced the advantages of trust preferred stock for some issuing firms,requiring these companies to classify these shares as debt and their payments to investorsas interest payments rather than stock dividends.
Subordinated notes and debentures are a relatively small component of bank capital but agrowing source of long-term funding for banks and other intermediaries. Regulationsrequire that these capital notes be subordinated to the claims of general creditors of abank, including the depositors. Thus, if a bank closes and its assets are liquidated, thedepositors have first claim on the proceeds and investors in debentures have a secondary
Rose−Hudgins: Bank Management and Financial Services, Seventh Edition
V. Managing Sources of Funds for Banks and Their Principal Competitors
15. The Management of Capital
© The McGraw−Hill Companies, 2008
Chapter 15 The Management of Capital 481
Concept Check
15–4. What forms of capital are in use today? What arethe key differences between the different types ofcapital?
15–5. Measured by volume and percentage of totalcapital, what are the most important and least
important forms of capital held by U.S.-insuredbanks? Why do you think this is so?
15–6. How do small banks differ from large banks in thecomposition of their capital accounts and in thetotal volume of capital they hold relative to theirassets? Why do you think these differences exist?
claim. However, subordinated debtholders have a prior claim over common and preferredstockholders against earnings and assets.
Bank holding companies have issued substantial quantities of subordinated debt inrecent years (especially to pension and mutual funds and insurance companies). Fre-quently, such notes are callable shortly after issue and carry either fixed or floatinginterest rates (often tied to interest rates on government securities or short-termEurodollar deposits). One advantage of subordinated debt from a regulatory viewpointis that it provides a form of market discipline. Because federal insurance does not coverdebt subordinated to deposits, investors in subordinated notes will demand higheryields on their securities due to the issuing firm’s acceptance of more risk. Holders ofsubordinated debt tend to be more risk sensitive than depositors and will thereforemonitor financial firm behavior more closely, possibly reducing the incidence of failure.Subordinated notes and debentures generally can be issued successfully only by largerfinancial institutions whose credit standing is trusted by securities investors. Manysecurities dealers simply refuse to handle small debt issues because of the cost and riskinvolved.
The composition of capital is markedly different for the largest versus the smallestfinancial firms. The smallest banks, for example, rely most heavily upon retained earnings(undivided profits) to build their capital positions and issue minuscule amounts of long-term debt (subordinated notes and debentures). In contrast, the biggest banks rely princi-pally upon the surplus value of their stock sold in the financial marketplace, as well asretained earnings, and also issue significant amounts of long-term debt capital. These dif-ferences reflect, in part, the greater ability of the biggest institutions to sell their capitalinstruments in the open market and attract thousands of investors, while the smallestinstitutions, having only limited access to the financial markets, must depend principallyupon their ability to generate adequate income and retain a significant portion of thoseearnings in order to build an acceptable capital cushion.
Nevertheless, it is generally the smallest banks that maintain the thickest cushion ofcapital relative to their asset size. For example, in 2005, the smallest American banks (eachholding less than $100 million in aggregate assets) posted an overall ratio of total equity anddebt capital to total assets of 11.9 percent, compared to a 10.2 percent capital-to-asset ratiofor medium-size banks (with assets totaling $100 million to $1 billion) and 11.7 percent forthe largest FDIC-insured banks (whose asset holdings each exceed $1 billion). Manyauthorities in the field believe that the smallest financial firms should maintain largercapital-to-asset ratios because these smallest institutions are less well diversified, bothgeographically and by product line, and, therefore, run a greater risk of failing. Greaterfailure risk, in turn, poses a larger risk of loss to the government insurance fund that pro-tects the public’s deposits.
FactoidThe largest source ofcapital for commercialbanks is surplus—theexcess value of bankstock at the time it wasissued above its parvalue. What is thelargest component ofcapital among thriftinstitutions, banking’smost importantcompetitor?Answer: Retainedearnings.
Rose−Hudgins: Bank Management and Financial Services, Seventh Edition
V. Managing Sources of Funds for Banks and Their Principal Competitors
15. The Management of Capital
© The McGraw−Hill Companies, 2008
482 Part Five Managing Sources of Funds for Banks and Their Principal Competitors
15–5 One of the Great Issues in the History of Banking: How Much Capital Is Really Needed?
How much capital a financial firm should hold has been one of the most controversialissues in the history of the banking industry. Banks are at the center of the financial sys-tem. If they fail because of a perceived shortage of capital, those failures could threaten thestability of the whole financial system. Much of this historic controversy has evolvedaround two questions, applicable to just about all financial institutions:
1. Who should set capital standards, the market or regulatory agencies?2. What is a reasonable standard for the proper amount of capital?
Regulatory Approach to Evaluating Capital NeedsReasons for Capital RegulationThe capital position of banks has been regulated for generations—longer than any otherfinancial firm. Banks must meet minimum capital requirements before they can be char-tered, and they must hold at least the minimum required level of capital throughout theircorporate life. Regulatory agencies also indicate the forms of capital that are acceptable.As Wall [6] notes, the fundamental purposes of regulating capital are threefold:
1. To limit the risk of failures.2. To preserve public confidence.3. To limit losses to the federal government arising from deposit insurance claims.
The underlying assumption is that the private marketplace cannot accomplish all threeof these objectives simultaneously because the market does not correctly price the impactof failures on the banking system’s stability, nor is the market likely to accurately price thecost of bank failure to the deposit insurance fund.
Banks are unique in that they hold an unusually large proportion of short-term liabili-ties (especially transaction deposits) that can be withdrawn immediately when public con-fidence falls. Few banks are in a position to liquidate their asset portfolios immediatelywhen threatened with massive customer withdrawals. Moreover, the managers of individ-ual banks do not consider the possible external effects of their risk taking on other finan-cial institutions, which may be dragged down by the collapse of neighboring institutions.
Large bank failures are a special problem, as Wall [6] observes. The failure of a big bankattracts significant media attention, causing depositors to raise questions about the soundnessof their banks. Moreover, the largest banking organizations generally have a high proportionof nondeposit liabilities and large-denomination deposits that are not adequately covered byinsurance. The failure of a large bank can have a greater impact on the government’s depositinsurance fund than the failures of numerous small insured depository institutions.
One of the damaging side effects of government-funded deposit insurance is that it low-ers the normal level of vigilance among depositors over bank safety and risk taking. Feel-ing fully protected, most depositors do not monitor the risk of the financial institutionsthey patronize, nor do they penalize those that take on excessive risk by moving theirfunds to lower-risk institutions. This “moral hazard” feature of government-sponsoredinsurance encourages insured depository institutions to drive their capital-to-deposit ratioslower, thus exposing government insurance funds to even greater risk of loss.
Research EvidenceConsiderable research has been conducted in recent years on the issue of whether the pri-vate marketplace or government regulatory agencies exert a bigger effect on bank risk tak-ing and capital decisions. The results of these studies are varied, but most find that the
Rose−Hudgins: Bank Management and Financial Services, Seventh Edition
V. Managing Sources of Funds for Banks and Their Principal Competitors
15. The Management of Capital
© The McGraw−Hill Companies, 2008
Chapter 15 The Management of Capital 483
Concept Check
15–7. What is the rationale for having the governmentset capital standards for financial institutions asopposed to letting the private marketplace setthose standards?
15–8. What evidence does recent research provide onthe role of the private marketplace in determiningcapital standards?
15–9. According to recent research, does capital preventa financial institution from failing?
private marketplace is probably more important than government regulation in the longrun in determining the amount and type of capital financial firms must hold. However,recently government regulation appears to have become nearly as important as the privatemarketplace by tightening capital regulations and imposing minimum capital requirements.
The financial markets do seem to react to the differential risk positions of banks bydowngrading the debt and equity securities offered by riskier banking companies. How-ever, as Eisenbeis and Gilbert [2] note, we are not at all sure market disciplining works aswell for small and medium-size insured depository institutions whose capital instrumentsare not as actively traded in the open market. Nor is it clear that the risk premiums themarket imposes on lower-quality bank securities (in the form of lower prices and higherinterest rates) are really large enough to discipline bank risk taking. Also, while the mar-ket may make efficient use of all the information it possesses, some of the most pertinentinformation needed to assess a bank’s true level of risk exposure is hidden from the marketand is known only to government regulators.
Is a bank’s capital-to-assets ratio significantly related to its probability of failure? Mostresearch studies find little connection between capital ratios and the incidence of failure.For example, Santomero and Vinso [1] found that increased capital does not materiallylower a bank’s failure risk. Many banks would still fail even if their capital were doubled ortripled—a conclusion backed up by a study in New England by Peek and Rosengren [5],which found that four-fifths of banks failing there in the 1980s and 1990s were classifiedby examiners as “well capitalized” before they failed. It is by no means certain that impos-ing higher capital requirements will reduce banking risk. As Wall [6] observes, financialfirms confronted with higher capital requirements may take on more risk in other aspectsof their operations in order to keep from earning lower returns.
FactoidTrue or false—theamount of capital abank holds has provento be a good predictor ofits chances to fail?Answer: False—banksthat subsequently failappear to have about asmuch capital, onaverage, as those whodon’t fail. Earnings andexpenses appear to bebetter indicators offailure or survival.
15–6 The Basel Agreement on International Capital Standards: A Historic Contract among Leading Nations
While research evidence on the benefits and costs of imposing capital requirements onfinancial-service firms continues, the regulatory community has taken important steps inrecent years to strengthen government’s role in assessing how much capital banks andtheir closest competitors really need and in making sure they comply with government-imposed capital standards.
In 1988 the Federal Reserve Board, representing the United States, and representativesfrom other leading countries (including Belgium, Canada, France, Germany, Italy, Japan,the Netherlands, Spain, Sweden, Switzerland, the United Kingdom, and Luxembourg) an-nounced agreement on new capital standards—usually referred to as the Basel Agreementfor the city in Switzerland where this agreement was reached. The new Basel standards wereto be applied uniformly to all banking institutions in their respective countries (with modi-fications for varying local conditions), even though the original guidelines were intendedonly for “internationally active” banks.
Key URLFor a summary of thecontents of the originalBasel Agreement of1988 see the Bank forInternationalSettlements atwww.bis.org.
Rose−Hudgins: Bank Management and Financial Services, Seventh Edition
V. Managing Sources of Funds for Banks and Their Principal Competitors
15. The Management of Capital
© The McGraw−Hill Companies, 2008
484 Part Five Managing Sources of Funds for Banks and Their Principal Competitors
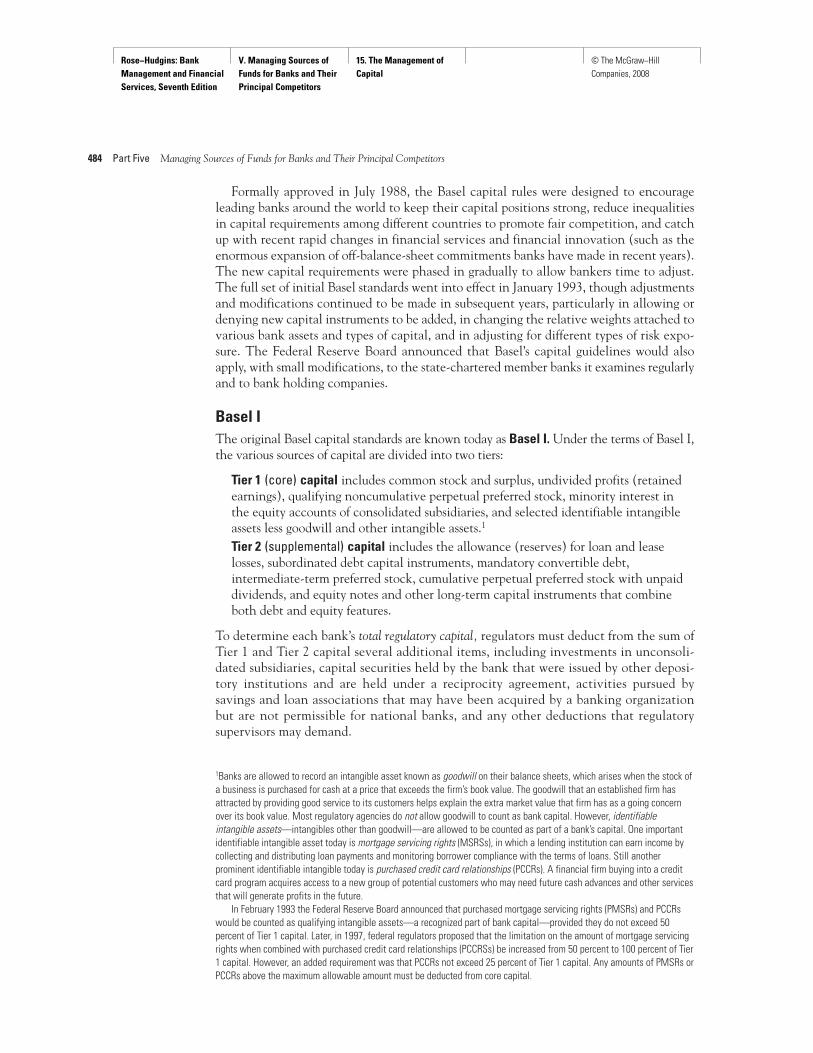
1Banks are allowed to record an intangible asset known as goodwill on their balance sheets, which arises when the stock ofa business is purchased for cash at a price that exceeds the firm’s book value. The goodwill that an established firm hasattracted by providing good service to its customers helps explain the extra market value that firm has as a going concernover its book value. Most regulatory agencies do not allow goodwill to count as bank capital. However, identifiableintangible assets—intangibles other than goodwill—are allowed to be counted as part of a bank’s capital. One importantidentifiable intangible asset today is mortgage servicing rights (MSRSs), in which a lending institution can earn income bycollecting and distributing loan payments and monitoring borrower compliance with the terms of loans. Still anotherprominent identifiable intangible today is purchased credit card relationships (PCCRs). A financial firm buying into a creditcard program acquires access to a new group of potential customers who may need future cash advances and other servicesthat will generate profits in the future.
In February 1993 the Federal Reserve Board announced that purchased mortgage servicing rights (PMSRs) and PCCRswould be counted as qualifying intangible assets—a recognized part of bank capital—provided they do not exceed 50percent of Tier 1 capital. Later, in 1997, federal regulators proposed that the limitation on the amount of mortgage servicingrights when combined with purchased credit card relationships (PCCRSs) be increased from 50 percent to 100 percent of Tier1 capital. However, an added requirement was that PCCRs not exceed 25 percent of Tier 1 capital. Any amounts of PMSRs orPCCRs above the maximum allowable amount must be deducted from core capital.
Formally approved in July 1988, the Basel capital rules were designed to encourageleading banks around the world to keep their capital positions strong, reduce inequalitiesin capital requirements among different countries to promote fair competition, and catchup with recent rapid changes in financial services and financial innovation (such as theenormous expansion of off-balance-sheet commitments banks have made in recent years).The new capital requirements were phased in gradually to allow bankers time to adjust.The full set of initial Basel standards went into effect in January 1993, though adjustmentsand modifications continued to be made in subsequent years, particularly in allowing ordenying new capital instruments to be added, in changing the relative weights attached tovarious bank assets and types of capital, and in adjusting for different types of risk expo-sure. The Federal Reserve Board announced that Basel’s capital guidelines would alsoapply, with small modifications, to the state-chartered member banks it examines regularlyand to bank holding companies.
Basel IThe original Basel capital standards are known today as Basel I. Under the terms of Basel I,the various sources of capital are divided into two tiers:
Tier 1 (core) capital includes common stock and surplus, undivided profits (retainedearnings), qualifying noncumulative perpetual preferred stock, minority interest inthe equity accounts of consolidated subsidiaries, and selected identifiable intangibleassets less goodwill and other intangible assets.1
Tier 2 (supplemental) capital includes the allowance (reserves) for loan and leaselosses, subordinated debt capital instruments, mandatory convertible debt,intermediate-term preferred stock, cumulative perpetual preferred stock with unpaiddividends, and equity notes and other long-term capital instruments that combineboth debt and equity features.
To determine each bank’s total regulatory capital, regulators must deduct from the sum ofTier 1 and Tier 2 capital several additional items, including investments in unconsoli-dated subsidiaries, capital securities held by the bank that were issued by other deposi-tory institutions and are held under a reciprocity agreement, activities pursued bysavings and loan associations that may have been acquired by a banking organizationbut are not permissible for national banks, and any other deductions that regulatorysupervisors may demand.
Rose−Hudgins: Bank Management and Financial Services, Seventh Edition
V. Managing Sources of Funds for Banks and Their Principal Competitors
15. The Management of Capital
© The McGraw−Hill Companies, 2008
Chapter 15 The Management of Capital 485
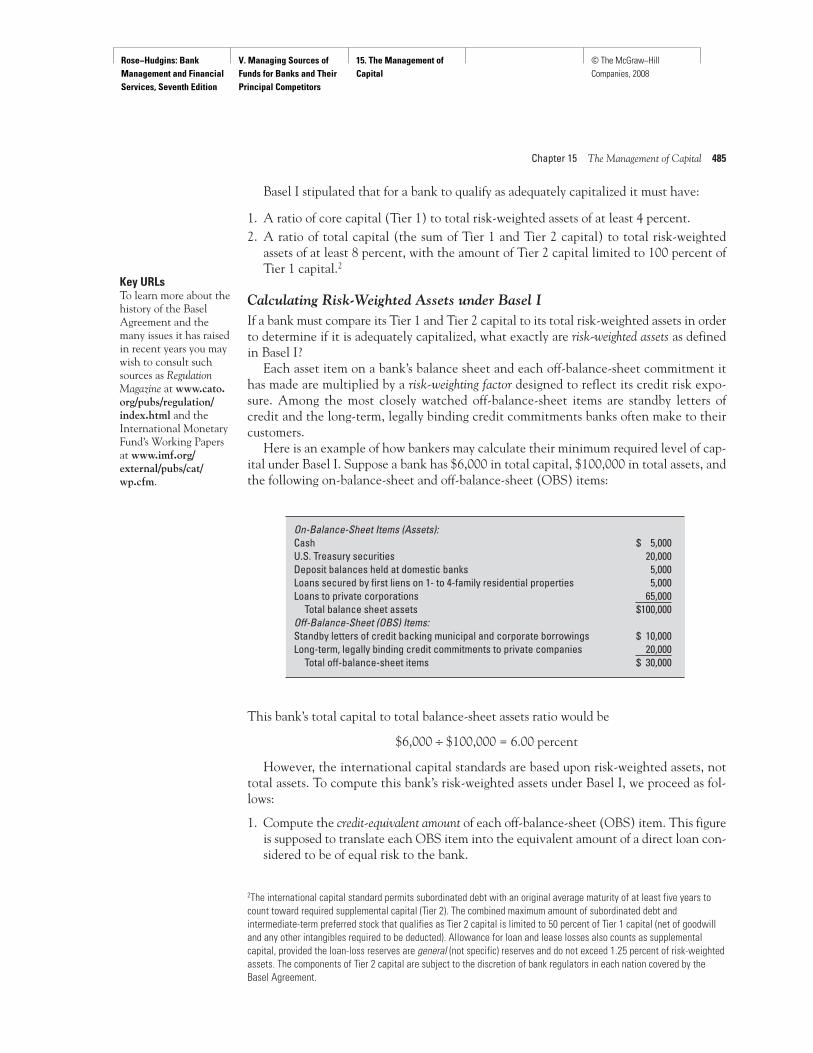
On-Balance-Sheet Items (Assets):Cash $ 5,000U.S. Treasury securities 20,000Deposit balances held at domestic banks 5,000Loans secured by first liens on 1- to 4-family residential properties 5,000Loans to private corporations 65,000
Total balance sheet assets $100,000Off-Balance-Sheet (OBS) Items:Standby letters of credit backing municipal and corporate borrowings $ 10,000Long-term, legally binding credit commitments to private companies 20,000
Total off-balance-sheet items $ 30,000
Key URLsTo learn more about thehistory of the BaselAgreement and themany issues it has raisedin recent years you maywish to consult suchsources as RegulationMagazine at www.cato.org/pubs/regulation/index.html and theInternational MonetaryFund’s Working Papersat www.imf.org/external/pubs/cat/wp.cfm.
Basel I stipulated that for a bank to qualify as adequately capitalized it must have:
1. A ratio of core capital (Tier 1) to total risk-weighted assets of at least 4 percent.2. A ratio of total capital (the sum of Tier 1 and Tier 2 capital) to total risk-weighted
assets of at least 8 percent, with the amount of Tier 2 capital limited to 100 percent ofTier 1 capital.2
Calculating Risk-Weighted Assets under Basel IIf a bank must compare its Tier 1 and Tier 2 capital to its total risk-weighted assets in orderto determine if it is adequately capitalized, what exactly are risk-weighted assets as definedin Basel I?
Each asset item on a bank’s balance sheet and each off-balance-sheet commitment ithas made are multiplied by a risk-weighting factor designed to reflect its credit risk expo-sure. Among the most closely watched off-balance-sheet items are standby letters ofcredit and the long-term, legally binding credit commitments banks often make to theircustomers.
Here is an example of how bankers may calculate their minimum required level of cap-ital under Basel I. Suppose a bank has $6,000 in total capital, $100,000 in total assets, andthe following on-balance-sheet and off-balance-sheet (OBS) items:
2The international capital standard permits subordinated debt with an original average maturity of at least five years tocount toward required supplemental capital (Tier 2). The combined maximum amount of subordinated debt andintermediate-term preferred stock that qualifies as Tier 2 capital is limited to 50 percent of Tier 1 capital (net of goodwilland any other intangibles required to be deducted). Allowance for loan and lease losses also counts as supplementalcapital, provided the loan-loss reserves are general (not specific) reserves and do not exceed 1.25 percent of risk-weightedassets. The components of Tier 2 capital are subject to the discretion of bank regulators in each nation covered by theBasel Agreement.
This bank’s total capital to total balance-sheet assets ratio would be
$6,000 ÷ $100,000 = 6.00 percent
However, the international capital standards are based upon risk-weighted assets, nottotal assets. To compute this bank’s risk-weighted assets under Basel I, we proceed as fol-lows:
1. Compute the credit-equivalent amount of each off-balance-sheet (OBS) item. This figureis supposed to translate each OBS item into the equivalent amount of a direct loan con-sidered to be of equal risk to the bank.
Rose−Hudgins: Bank Management and Financial Services, Seventh Edition
V. Managing Sources of Funds for Banks and Their Principal Competitors
15. The Management of Capital
© The McGraw−Hill Companies, 2008
486 Part Five Managing Sources of Funds for Banks and Their Principal Competitors
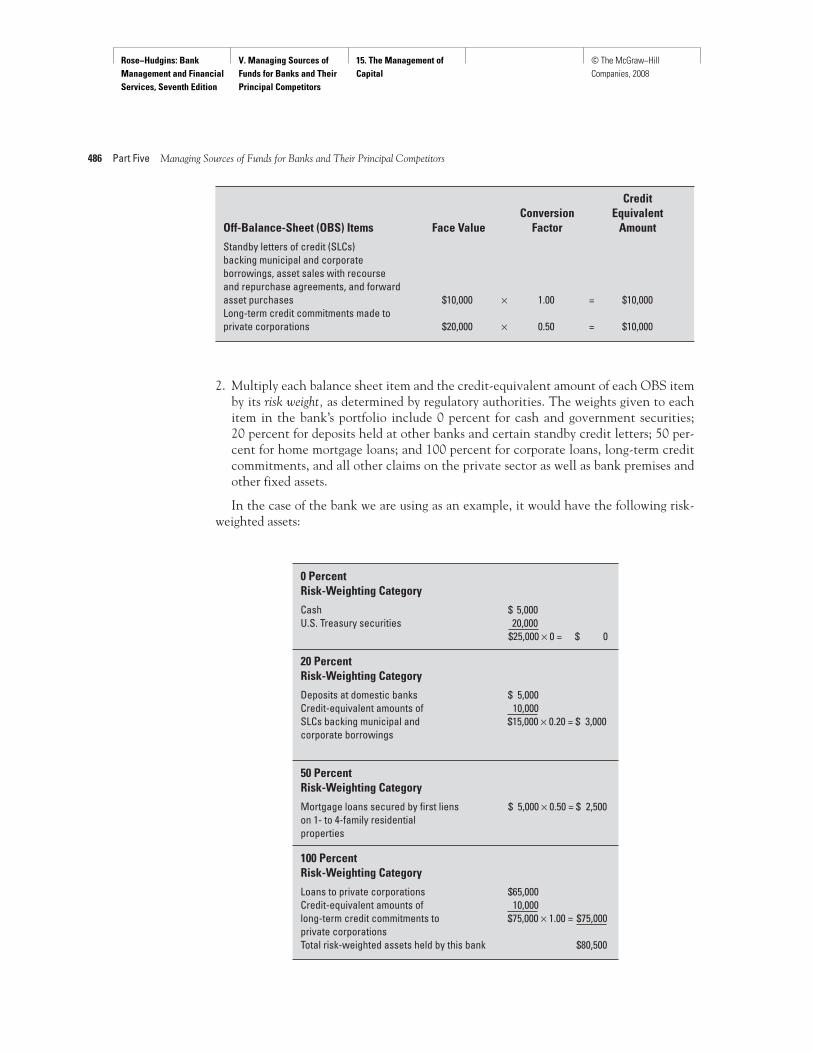
2. Multiply each balance sheet item and the credit-equivalent amount of each OBS itemby its risk weight, as determined by regulatory authorities. The weights given to eachitem in the bank’s portfolio include 0 percent for cash and government securities; 20 percent for deposits held at other banks and certain standby credit letters; 50 per-cent for home mortgage loans; and 100 percent for corporate loans, long-term creditcommitments, and all other claims on the private sector as well as bank premises andother fixed assets.
In the case of the bank we are using as an example, it would have the following risk-weighted assets:
CreditConversion Equivalent
Off-Balance-Sheet (OBS) Items Face Value Factor Amount
Standby letters of credit (SLCs) backing municipal and corporate borrowings, asset sales with recourse and repurchase agreements, and forward asset purchases $10,000 × 1.00 = $10,000Long-term credit commitments made to private corporations $20,000 × 0.50 = $10,000
0 Percent Risk-Weighting Category
Cash $ 5,000U.S. Treasury securities 20,000
$25,000 × 0 = $ 0
20 Percent Risk-Weighting Category
Deposits at domestic banks $ 5,000Credit-equivalent amounts of 10,000SLCs backing municipal and $15,000 × 0.20 = $ 3,000corporate borrowings
50 Percent Risk-Weighting Category
Mortgage loans secured by first liens $ 5,000 × 0.50 = $ 2,500on 1- to 4-family residential properties
100 Percent Risk-Weighting Category
Loans to private corporations $65,000Credit-equivalent amounts of 10,000long-term credit commitments to $75,000 × 1.00 = $75,000private corporationsTotal risk-weighted assets held by this bank $80,500
Rose−Hudgins: Bank Management and Financial Services, Seventh Edition
V. Managing Sources of Funds for Banks and Their Principal Competitors
15. The Management of Capital
© The McGraw−Hill Companies, 2008
Chapter 15 The Management of Capital 487
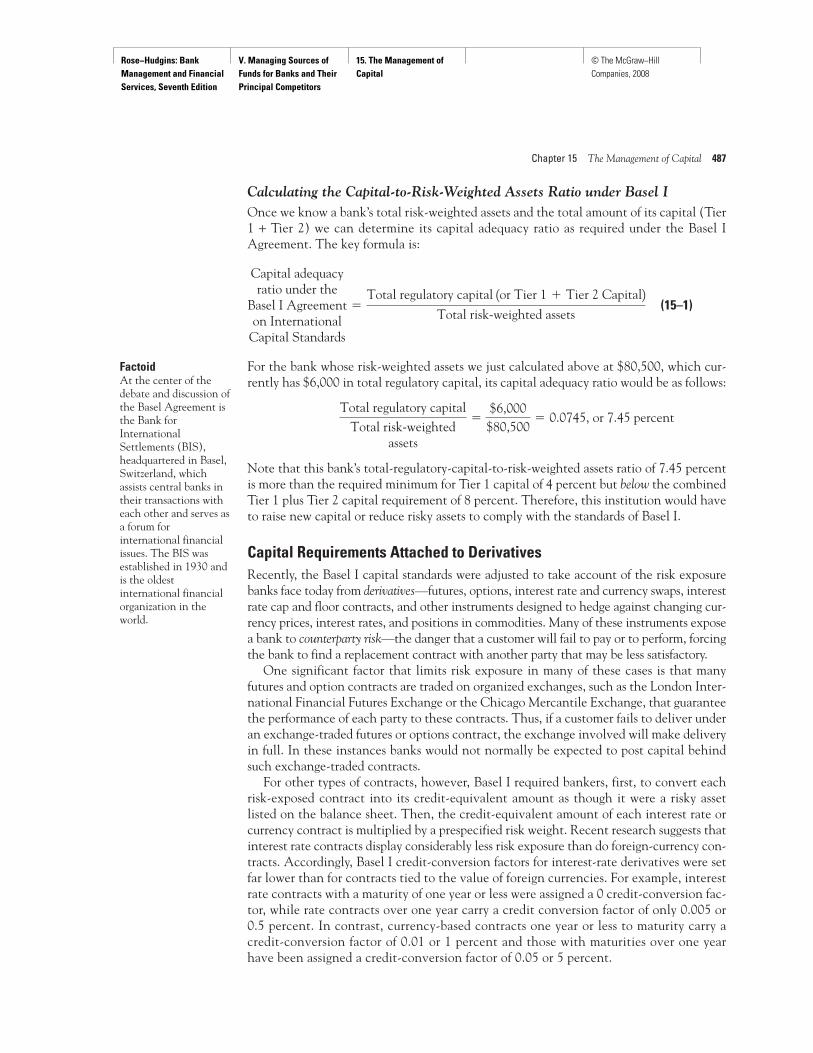
Calculating the Capital-to-Risk-Weighted Assets Ratio under Basel IOnce we know a bank’s total risk-weighted assets and the total amount of its capital (Tier1 + Tier 2) we can determine its capital adequacy ratio as required under the Basel IAgreement. The key formula is:
(15–1)
For the bank whose risk-weighted assets we just calculated above at $80,500, which cur-rently has $6,000 in total regulatory capital, its capital adequacy ratio would be as follows:
Note that this bank’s total-regulatory-capital-to-risk-weighted assets ratio of 7.45 percentis more than the required minimum for Tier 1 capital of 4 percent but below the combinedTier 1 plus Tier 2 capital requirement of 8 percent. Therefore, this institution would haveto raise new capital or reduce risky assets to comply with the standards of Basel I.
Capital Requirements Attached to DerivativesRecently, the Basel I capital standards were adjusted to take account of the risk exposurebanks face today from derivatives—futures, options, interest rate and currency swaps, interestrate cap and floor contracts, and other instruments designed to hedge against changing cur-rency prices, interest rates, and positions in commodities. Many of these instruments exposea bank to counterparty risk—the danger that a customer will fail to pay or to perform, forcingthe bank to find a replacement contract with another party that may be less satisfactory.
One significant factor that limits risk exposure in many of these cases is that manyfutures and option contracts are traded on organized exchanges, such as the London Inter-national Financial Futures Exchange or the Chicago Mercantile Exchange, that guaranteethe performance of each party to these contracts. Thus, if a customer fails to deliver underan exchange-traded futures or options contract, the exchange involved will make deliveryin full. In these instances banks would not normally be expected to post capital behindsuch exchange-traded contracts.
For other types of contracts, however, Basel I required bankers, first, to convert eachrisk-exposed contract into its credit-equivalent amount as though it were a risky assetlisted on the balance sheet. Then, the credit-equivalent amount of each interest rate orcurrency contract is multiplied by a prespecified risk weight. Recent research suggests thatinterest rate contracts display considerably less risk exposure than do foreign-currency con-tracts. Accordingly, Basel I credit-conversion factors for interest-rate derivatives were setfar lower than for contracts tied to the value of foreign currencies. For example, interestrate contracts with a maturity of one year or less were assigned a 0 credit-conversion fac-tor, while rate contracts over one year carry a credit conversion factor of only 0.005 or0.5 percent. In contrast, currency-based contracts one year or less to maturity carry acredit-conversion factor of 0.01 or 1 percent and those with maturities over one yearhave been assigned a credit-conversion factor of 0.05 or 5 percent.
Total regulatory capitalTotal risk-weighted
assets
�$6,000
$80,500� 0.0745, or 7.45 percent
Capital adequacyratio under the
Basel I Agreementon International
Capital Standards
�Total regulatory capital 1or Tier 1 � Tier 2 Capital2
Total risk-weighted assets
FactoidAt the center of thedebate and discussion ofthe Basel Agreement isthe Bank forInternationalSettlements (BIS),headquartered in Basel,Switzerland, whichassists central banks intheir transactions witheach other and serves asa forum forinternational financialissues. The BIS wasestablished in 1930 andis the oldestinternational financialorganization in theworld.
Rose−Hudgins: Bank Management and Financial Services, Seventh Edition
V. Managing Sources of Funds for Banks and Their Principal Competitors
15. The Management of Capital
© The McGraw−Hill Companies, 2008
488 Part Five Managing Sources of Funds for Banks and Their Principal Competitors
In determining the credit-equivalent amounts of these off-balance-sheet contracts, BaselI requires a banker to divide each contract’s risk exposure into two categories: (1) potentialmarket risk exposure and (2) current market risk exposure. Potential market risk exposurerefers to the danger of loss at some future time if the customer who entered into a market-based contract with the bank fails to perform. In contrast, the current market risk exposure isdesigned to measure the risk of loss should a customer default today on its contract, whichwould compel the bank to replace the failed contract with a new one. Basel I requiredbankers to determine the current market value for a contract that is similar to the contractthey have actually made with a customer in order to figure out the latter’s replacement cost.Future cash flows expected under current contracts must be discounted back to their pres-ent values using today’s interest rates, currency, or commodity prices to determine the valueof such a contract in today’s market.
Once the replacement cost of a contract is determined, the estimated potential marketrisk exposure amount is then added to the estimated current market risk exposure amount toderive the total credit-equivalent amount of each contract. This total is multiplied by thecorrect risk weight, which in most cases is 50 percent, or 0.50, to find the equivalent amountof risk-weighted bank assets represented by each contract. We then add this risk-weightedamount to all of a bank’s other risk-weighted assets to derive its total on-balance-sheet andoff-balance-sheet risk-weighted assets. As we saw in the preceding section, with Basel I thetotal of all risk-weighted assets is then divided into each bank’s total regulatory capital(Tier 1 plus Tier 2) to determine if it is adequately capitalized.
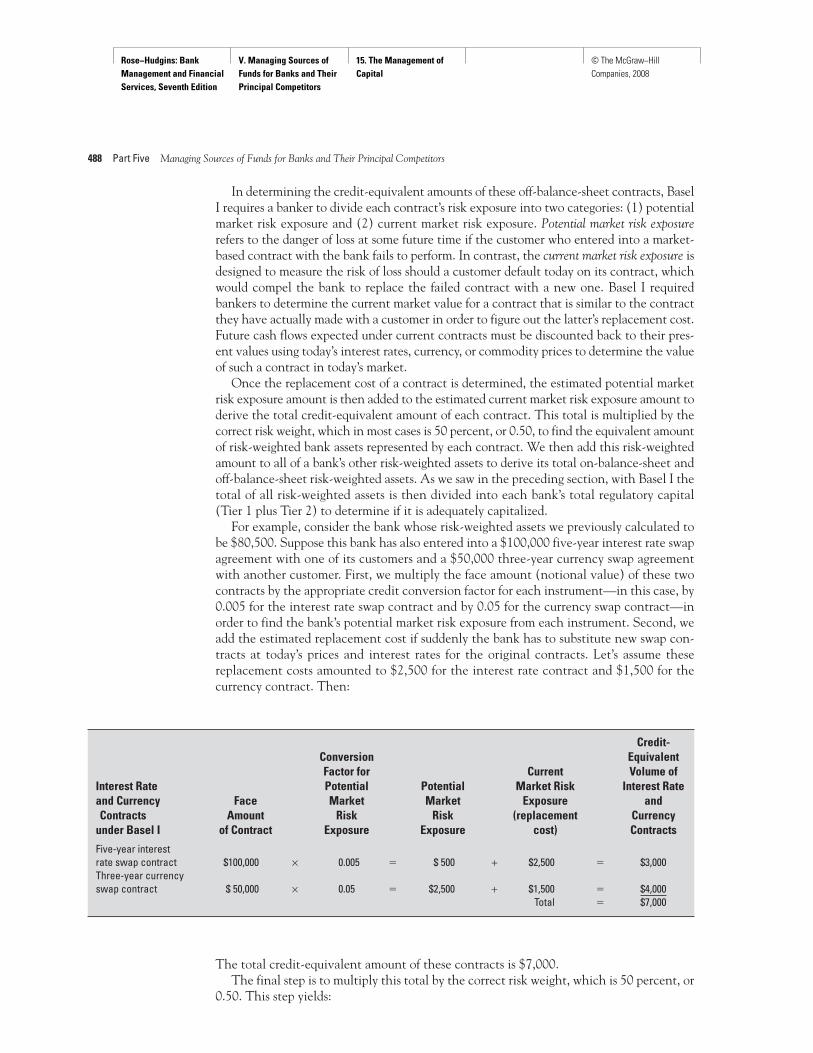
For example, consider the bank whose risk-weighted assets we previously calculated tobe $80,500. Suppose this bank has also entered into a $100,000 five-year interest rate swapagreement with one of its customers and a $50,000 three-year currency swap agreementwith another customer. First, we multiply the face amount (notional value) of these twocontracts by the appropriate credit conversion factor for each instrument—in this case, by0.005 for the interest rate swap contract and by 0.05 for the currency swap contract—inorder to find the bank’s potential market risk exposure from each instrument. Second, weadd the estimated replacement cost if suddenly the bank has to substitute new swap con-tracts at today’s prices and interest rates for the original contracts. Let’s assume thesereplacement costs amounted to $2,500 for the interest rate contract and $1,500 for thecurrency contract. Then:
Credit-Conversion Equivalent Factor for Current Volume of
Interest Rate Potential Potential Market Risk Interest Rate and Currency Face Market Market Exposure and Contracts Amount Risk Risk (replacement Currency
under Basel I of Contract Exposure Exposure cost) Contracts
Five-year interest rate swap contract $100,000 × 0.005 � $ 500 + $2,500 � $3,000Three-year currency swap contract $ 50,000 × 0.05 � $2,500 + $1,500 � $4,000
Total � $7,000
The total credit-equivalent amount of these contracts is $7,000.The final step is to multiply this total by the correct risk weight, which is 50 percent, or
0.50. This step yields:
Rose−Hudgins: Bank Management and Financial Services, Seventh Edition
V. Managing Sources of Funds for Banks and Their Principal Competitors
15. The Management of Capital
© The McGraw−Hill Companies, 2008
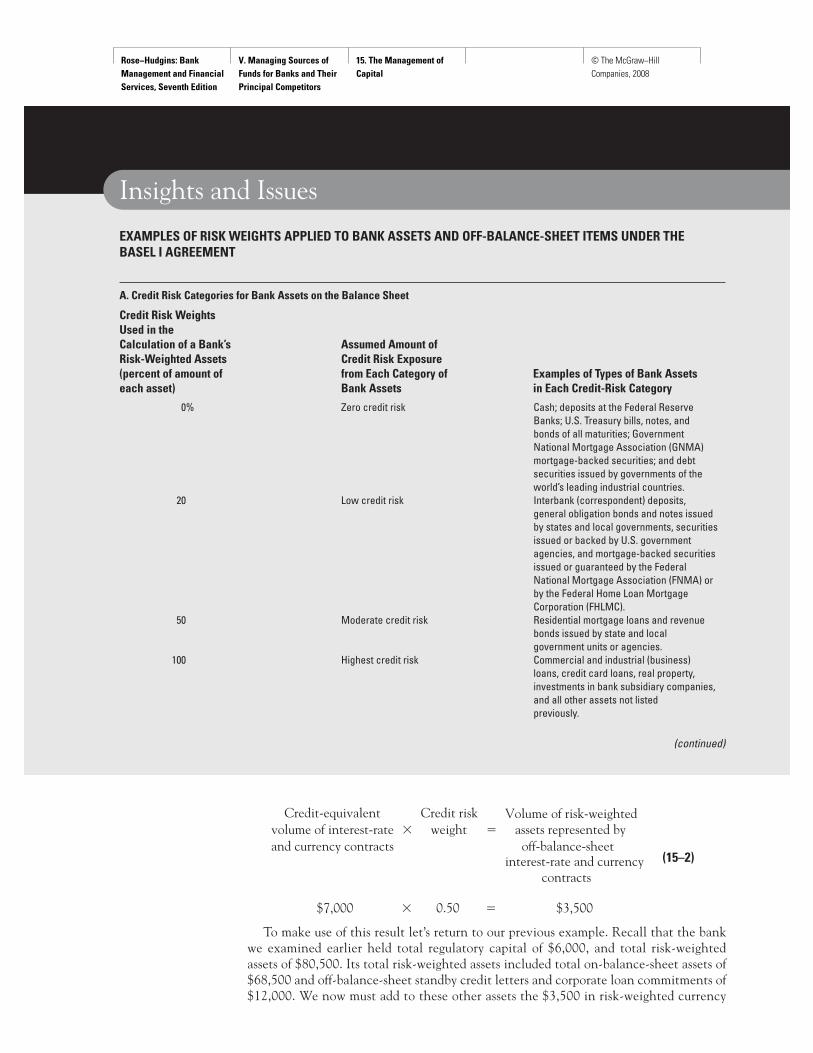
(15–2)
To make use of this result let’s return to our previous example. Recall that the bankwe examined earlier held total regulatory capital of $6,000, and total risk-weightedassets of $80,500. Its total risk-weighted assets included total on-balance-sheet assets of$68,500 and off-balance-sheet standby credit letters and corporate loan commitments of$12,000. We now must add to these other assets the $3,500 in risk-weighted currency
$7,000 � 0.50 � $3,500
Credit-equivalent Credit risk Volume of risk-weightedvolume of interest-rate � weight � assets represented byand currency contracts off-balance-sheet
interest-rate and currency
contracts
Insights and Issues
EXAMPLES OF RISK WEIGHTS APPLIED TO BANK ASSETS AND OFF-BALANCE-SHEET ITEMS UNDER THE BASEL I AGREEMENT
A. Credit Risk Categories for Bank Assets on the Balance Sheet
Credit Risk Weights Used in the Calculation of a Bank’s Assumed Amount of Risk-Weighted Assets Credit Risk Exposure (percent of amount of from Each Category of Examples of Types of Bank Assets each asset) Bank Assets in Each Credit-Risk Category
0% Zero credit risk Cash; deposits at the Federal Reserve Banks; U.S. Treasury bills, notes, and bonds of all maturities; Government National Mortgage Association (GNMA) mortgage-backed securities; and debt securities issued by governments of the world’s leading industrial countries.
20 Low credit risk Interbank (correspondent) deposits, general obligation bonds and notes issued by states and local governments, securities issued or backed by U.S. government agencies, and mortgage-backed securities issued or guaranteed by the Federal National Mortgage Association (FNMA) or by the Federal Home Loan Mortgage Corporation (FHLMC).
50 Moderate credit risk Residential mortgage loans and revenue bonds issued by state and local government units or agencies.
100 Highest credit risk Commercial and industrial (business) loans, credit card loans, real property, investments in bank subsidiary companies, and all other assets not listed previously.
(continued)
Rose−Hudgins: Bank Management and Financial Services, Seventh Edition
V. Managing Sources of Funds for Banks and Their Principal Competitors
15. The Management of Capital
© The McGraw−Hill Companies, 2008
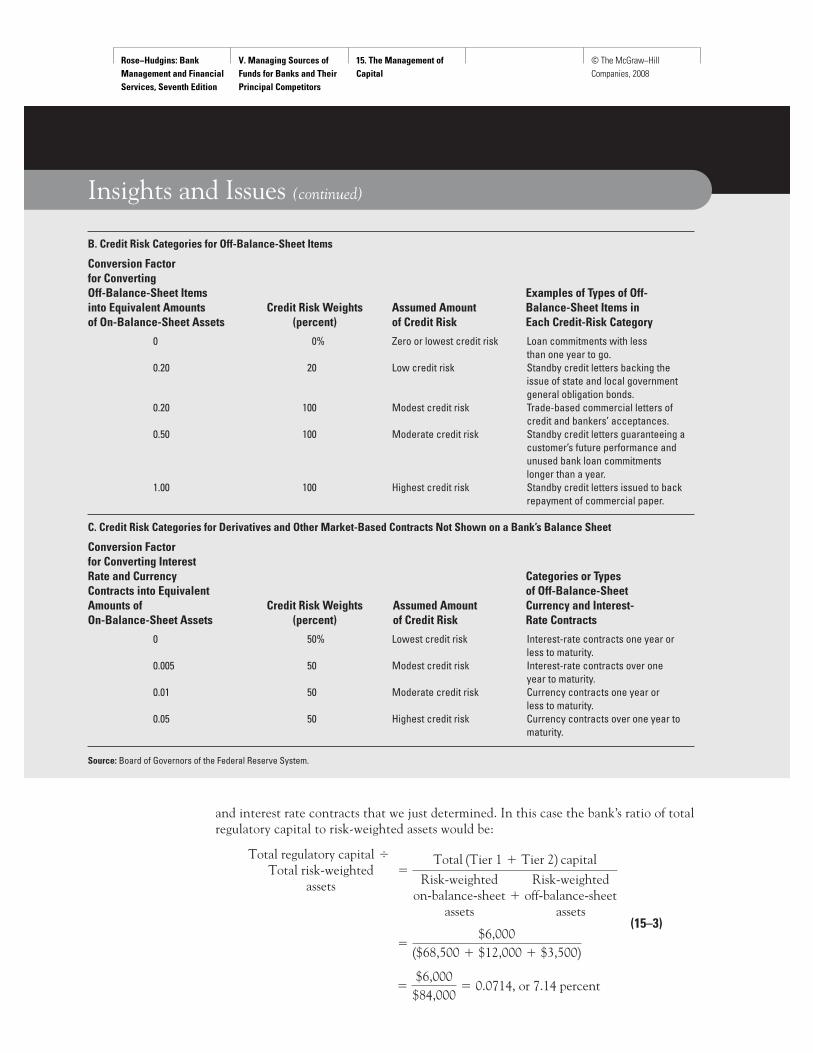
and interest rate contracts that we just determined. In this case the bank’s ratio of totalregulatory capital to risk-weighted assets would be:
(15–3)
�$6,000$84,000
� 0.0714, or 7.14 percent
�$6,000
1$68,500 � $12,000 � $3,5002
Total regulatory capital �Total risk-weighted
assets�
Total 1Tier 1 � Tier 22 capital
Risk-weightedon-balance-sheet
assets�
Risk-weightedoff-balance-sheet
assets
Insights and Issues (continued)
B. Credit Risk Categories for Off-Balance-Sheet Items
Conversion Factor for Converting Off-Balance-Sheet Items Examples of Types of Off-into Equivalent Amounts Credit Risk Weights Assumed Amount Balance-Sheet Items in of On-Balance-Sheet Assets (percent) of Credit Risk Each Credit-Risk Category
0 0% Zero or lowest credit risk Loan commitments with less than one year to go.
0.20 20 Low credit risk Standby credit letters backing the issue of state and local government general obligation bonds.
0.20 100 Modest credit risk Trade-based commercial letters of credit and bankers’ acceptances.
0.50 100 Moderate credit risk Standby credit letters guaranteeing a customer’s future performance and unused bank loan commitments longer than a year.
1.00 100 Highest credit risk Standby credit letters issued to back repayment of commercial paper.
C. Credit Risk Categories for Derivatives and Other Market-Based Contracts Not Shown on a Bank’s Balance Sheet
Conversion Factor for Converting Interest Rate and Currency Categories or Types Contracts into Equivalent of Off-Balance-Sheet Amounts of Credit Risk Weights Assumed Amount Currency and Interest-On-Balance-Sheet Assets (percent) of Credit Risk Rate Contracts
0 50% Lowest credit risk Interest-rate contracts one year or less to maturity.
0.005 50 Modest credit risk Interest-rate contracts over one year to maturity.
0.01 50 Moderate credit risk Currency contracts one year or less to maturity.
0.05 50 Highest credit risk Currency contracts over one year to maturity.
Source: Board of Governors of the Federal Reserve System.
Rose−Hudgins: Bank Management and Financial Services, Seventh Edition
V. Managing Sources of Funds for Banks and Their Principal Competitors
15. The Management of Capital
© The McGraw−Hill Companies, 2008
Chapter 15 The Management of Capital 491
We note that this bank is now substantially below the minimum total regulatory capitalrequirement of 8 percent of total risk-weighted assets. This capital-deficient bank willprobably be compelled to dispose of some of its risky assets and to raise new capital throughretained earnings or, perhaps, through sales of stock to bring its capital position up to thelevels stipulated by Basel I. Notice, too, that we have only taken credit risk into account inthe calculation of capital adequacy. We have not even considered the possibility ofdeclines in the market value of assets on bank balance sheets due to increasing interestrates or falling currency or commodity prices. If regulators detect an excessive amount ofrisk exposure from these market forces, the bank would be asked to post even more capitalthan the $6,000 it already holds. In this instance this financial firm would face an evendeeper capital deficiency than we calculated above and would be placed under consider-able regulatory pressure to improve its capital position.
Bank Capital Standards and Market RiskOne of the most glaring holes in the original Basel Agreement was its failure to deal withmarket risk. The risk weights on bank assets were designed primarily to take account of creditrisk—the danger that a borrowing customer might default on his or her loan. But banks alsoface significant market risk—the losses a bank may suffer due to adverse changes in interestrates, security prices, and currency and commodity prices. For example, banks are leadingtraders in foreign securities and overseas business property and can be severely damagedfinancially when foreign currency prices change (usually referred to as exchange rate or cur-rency risk). In an effort to deal with these and other forms of market risk, the Basel Com-mittee on Banking Supervision released new proposals during the 1990s that would requirebanks facing greater exposure to market risk to hold larger amounts of capital.
Market Risk and Value at Risk (VaR) ModelsIn January 1996 the Basel Committee formally approved a modification to the rules, per-mitting the largest banks to conduct internal risk measurement, and estimate the amountof capital necessary to cover market risk. Two years later regulators imposed capital require-ments on the market risk exposure of the trading positions of the largest banks (those withtrading accounts of more than $1 billion or that represent at least 10 percent of their totalassets). Of particular concern was the potential loss to bank earnings and net worth (cap-ital) if the market value of their asset portfolios were to fall significantly.
Value at Risk (VaR)Revised Basel rules began to allow the largest banks in the world to use their own preferredmethods to determine the maximum loss they might sustain over a designated period oftime—known as value at risk (VaR) models. These models are complex computer algo-rithms used to determine the maximum amount a bank might lose over a specific timeperiod. They attempt to measure the market risk of a portfolio of assets whose value maydecline due to adverse movements in interest rates, stock prices, currency values, or com-modity prices.
For example, suppose a bank estimates that its portfolio’s daily average value at risk is$100 million over a 10-day interval with a 99 percent level of confidence. Then, if thisVaR estimate of $100 million is correct, losses in portfolio value greater than $100 millionshould occur less than 1 percent of the time. More precisely, the bank’s management antic-ipates losing at most $100 million for 99 out of 100 10-day intervals.
An analysis of the bank’s historical distribution of losses in its trading portfolio willindicate whether this estimate is reasonable or not. Management would want to comparethe estimated future loss to the bank’s current level of equity capital to make sure the insti-tution is sufficiently capitalized in order to avoid failure. If management determines that
Key URLsGreater detail on theuse of VaR modeling toassess market risk maybe found at www.riskmetrics.com andwww.barcap.com.
Rose−Hudgins: Bank Management and Financial Services, Seventh Edition
V. Managing Sources of Funds for Banks and Their Principal Competitors
15. The Management of Capital
© The McGraw−Hill Companies, 2008
492 Part Five Managing Sources of Funds for Banks and Their Principal Competitors
its VaR estimates are rising, the bank must consider either increasing the amount ofregulatory-defined capital it holds in order to absorb the rising level of risk or take stepsto reduce its risk exposure.
The central elements of the VaR method under Basel’s rules must include:
1. An estimate of the maximum loss in a bank’s portfolio value that could occur at a spec-ified level of risk over intervals of 10 business days.
2. A statement of the confidence level management attaches to its estimate of the proba-bility of loss. Under current rules this must be 99 percent (in a one-tailed test).
3. An estimate of the time period over which the assets in question could be liquidatedshould the market deteriorate (for example, 24 hours for the most liquid assets and per-haps two weeks for less liquid assets).
4. A statement of the historical period management uses to help develop forecasts of mar-ket value and market rates of interest (under current regulations this period must coverat least one year).
Limitations and Challenges of VaR and Internal ModelingWhile a possible step forward, VaR estimates and internal modeling to determine eachbank’s market risk exposure and the amount of capital it needs are not perfect—thisapproach has several potential glitches that could challenge bankers and regulators in theperiod ahead. For example, inaccurate VaR estimates can expose a bank to excessive riskfor which it may be ill-prepared (i.e., its capital position may turn out not to be largeenough to cover the actual losses the bank faces). Moreover, the portfolios of the largestbanks are so huge and complex with thousands of risk factors it may be impossible to con-sistently forecast VaRs accurately. This may explain why some banks today appear to makevery conservative VaR estimates, which increases the amount of capital they must hold.
One potentially useful stipulation to promote accuracy is “backtesting,” which evalu-ates a bank’s past forecasting performance and slaps on a higher capital requirement if ithas a track record of frequent inaccuracies, thus encouraging bankers to develop betterestimating models. Even if an individual bank is a good forecaster, however, there may stillbe trouble in the system due to systemic risk—that is, market losses may occur at severalbanks simultaneously due to the interdependence of the financial system, magnifying eachbank’s risk exposure and possibly presenting regulators with a major crisis.
Basel II: A New Capital Accord UnfoldingWhy Basel II Appears to Be NeededSoon after the first Basel Agreement was adopted, work began on the next “edition” of theinternational bank capital accord, known today as Basel II. Of special concern to bankers,regulatory agencies, and industry analysts was how to correct the obvious weaknesses ofBasel I, particularly its insensitivity to innovation in the financial marketplace, somethingthat is happening all the time.
Smart bankers have found ways around many of Basel I’s restrictions. For example,many of the largest banks have used capital arbitrage to increase their profitability and min-imize their required levels of capital. These banking firms discovered that the broad assetrisk categories in Basel I actually encompass many different levels of risk exposure. Forexample, business loans and credit card loans were placed in the same risk category withthe same weight, even though credit card loans are often far riskier. However, because riskweights were the same for all assets in the same risk category, a bank could simply sell offlower-risk assets and acquire more risky (but higher-yielding) assets without increasing itscapital requirement. Thus, instead of making banks less risky, some parts of Basel I seemedto be encouraging them to become more risky.
Key URLsResearch on the riskexposures of banks andother financial firmsand the possible role ofmarket discipline inshaping capitalrequirements may befound at www.frbsf.org./publications andhttp://ideas.repec.org.
Rose−Hudgins: Bank Management and Financial Services, Seventh Edition
V. Managing Sources of Funds for Banks and Their Principal Competitors
15. The Management of Capital
© The McGraw−Hill Companies, 2008
Chapter 15 The Management of Capital 493
Moreover, Basel I represents a “one size fits all” approach to capital regulation. It failedto recognize that no two banks are alike in terms of their risk profiles. Different banks havedifferent risk exposure and, therefore, should use different models to estimate risk and besubject to different capital requirements.
On June 26, 2004, international bank supervisors agreed on a revised framework for theworld’s largest banks to calculate their capital requirements. The new framework will applyinitially only to about 20 of the largest U.S. banks plus a handful of leading foreign banks.The remaining 7,000-plus U.S. banks as well as smaller banks abroad will be guided, atleast for a time, by rules paralleling the requirements of Basel I. Under current plans BaselII will be gradually phased in for the largest banks starting in 2008. Bankers are encouragedto gradually adjust their policies and procedures so they will be ready for the new capitalaccord when the official start takes place.
Basel II sets up a system in which capital requirements are more sensitive to risk andprotect against more types of risk than has been true under Basel I. Basel II attempts toensure that, consistently, low-risk assets require less capital than high-risk assets, whereasthe reverse was often the case with Basel I. However, for the majority of banks Basel Iseems to be working reasonably well and frees up smaller banks from having to undertakethe complex calculations of probable loss for the wide range of asset categories typicallyfound in each bank’s portfolio.
While most banks will not be required, at least initially, to meet the standards of BaselII, all banks will likely be affected by Basel II due to competition. The biggest banks that usethe most advanced risk-calculation techniques allowed under Basel II will, in many cases,be able to hold less capital per dollar of risky assets than is true for many smaller banks usingthe older Basel I approach. This would tend to give Basel II banks a competitive advantagein granting certain kinds of loans to borrowers (such as residential mortgage loans) atlower cost and may even result in smaller banks still using Basel I to take on more risk.
Some experts believe the advent of Basel II may consolidate the banking industry evenfurther in favor of the biggest banks. Stockholders, depositors, credit rating agencies, andother industry observers may conclude that Basel II banks are better able to determine truerisk exposure and better able to manage risk than smaller Basel I banks. Moreover, Basel IIbanks may be able to conduct risk analysis more cheaply than smaller Basel I banks, whichmay eventually force some Basel-I size banks to sell out to the huge international banksgoverned by Basel II. Eventually, all banks may be required to follow the guidelines of BaselII and, therefore, Basel I banks will have to play “catch up” with industry leaders. The ulti-mate hope of regulators and the public is that Basel II’s approach to determining minimumcapital requirements based upon advanced risk-measurement techniques will significantlyreduce the chances of instability in the global financial system.
Pillars of Basel IIThe three “pillars” of Basel II are:
1. Minimum capital requirements for each bank are based on its own estimated risk exposurefrom credit, market and operational risks.
2. Supervisory review of each bank’s risk-assessment procedures and the adequacy of its cap-ital will be done to ensure they are “reasonable.”
3. Greater public disclosure of each bank’s true financial condition so that market disciplinecan become a powerful force compelling excessively risky banks to lower their riskexposure.
Internal Risk AssessmentBasel II represents a revolutionary change in regulatory philosophy. Banks will be permit-ted to measure their own risk exposure and determine how much capital they will need to
Rose−Hudgins: Bank Management and Financial Services, Seventh Edition
V. Managing Sources of Funds for Banks and Their Principal Competitors
15. The Management of Capital
© The McGraw−Hill Companies, 2008
494 Part Five Managing Sources of Funds for Banks and Their Principal Competitors
meet that exposure, subject, of course, to review by the regulators to make sure those mea-surements are “reasonable.” Moreover, participating banks are required to carry out theirown repeated stress testing, using an internal-rating-based (IRB) approach, to ensure theyare prepared for the possibly damaging impacts of ever-changing market conditions.
The hope is that allowing each bank to assess its own risks and determine its ownunique capital needs will promote greater flexibility in responding to changing marketconditions and continuing innovation in the financial-services industry. Hopefully, BaselII will counteract one of the great weaknesses of the original Basel Accord—rigid rulesthat simply couldn’t keep up with the ability of the largest financial institutions todevelop new services and new methods. The fundamental goal of Basel II is to create abetter alignment of capital regulations with the risks international banks actually face inthe modern world.
Operational RiskOne of the key innovations associated with Basel II is requiring banks to hold capital todeal with operational risk in addition to credit and market risks. This type of risk exposureincludes losses from employee fraud, product flaws, accounting errors, computer break-downs, terrorism, and natural disasters (such as storms and earthquakes) that may damagea bank’s physical assets and reduce its ability to communicate with customers. To lowertheir capital requirement, bankers must demonstrate they are using effective measures toreduce operational risk, including adequate insurance coverage, backup service capability,effective internal audits, quality contingency plans, and effective management informa-tion systems. Banks subject to Basel II will be asked to estimate the probability of adverseoperating events and the potential losses these may generate.
Basel II and Credit Risk ModelsParalleling the development of VaR models to estimate market risk exposure has been therapid rise of credit risk models under the leadership of such organizations as Credit Met-rics and J. P. Morgan Chase. These computer algorithms attempt to measure a lender’sexposure to default by its borrowing customers or to credit downgradings that result in low-ering the value of some of the lender’s loans. Such changes tend to reduce the resale valueof loans and the probability of full recovery of monies owed the lender.
The fundamental purpose of credit risk models is to ask and answer the question: If anadverse situation develops in the future, what magnitude of losses (loan defaults and declining loanvalues) can be expected? While there are many different risk models in use today, most gen-erate credit risk estimates based upon: (a) borrower credit ratings; (b) the probability thosecredit ratings will change; (c) the probable amount of recovery should some loans default;and (d) the possibility of changing interest-rate spreads between riskier and less risky loans.
This is a challenging exercise, even more difficult than assessing a lending institution’smarket risk. Statistical credit risk models must take into account the degree of concentra-tion of loans extended to a few large borrowers and variations in loan portfolio diversifi-cation across a wide range of borrowers with markedly different credit ratings. Moreover,when they occur, loan losses can come in bunches (joint defaults), often due to a weaken-ing economy. Management must be prepared for extreme credit losses during some periods,but only minimal losses during other periods.
Then, too, the statistical distribution of loan defaults is not normal, but heavily skewedwith low probabilities of large losses and high probabilities of only modest returns. (Mostloans, after all, have only limited upside earnings potential because borrowers will repayno more than they have promised to repay.) Regardless of the difficulties involved, how-ever, credit risk models provide a quantitative basis for estimating how much capital is nec-essary to cover potential loan losses and still protect the solvency of the lendinginstitution.
Key URLsTo learn more aboutcredit risk models seewww.defaultrisk.comand www.moodyskmv.com.
Key URLsTo gather moreinformation about thedevelopment of BaselII’s new capital rules,consult such sources aswww.bundesbank.de/index and www.bis.org/.
Rose−Hudgins: Bank Management and Financial Services, Seventh Edition
V. Managing Sources of Funds for Banks and Their Principal Competitors
15. The Management of Capital
© The McGraw−Hill Companies, 2008
Credit risk models are likely to be used more heavily in the future when Basel II is in fullforce. Under Basel I, minimum capital requirements remain the same for most types of loansregardless of credit rating. Under Basel II, however, minimum capital requirements may varysignificantly with credit quality. One example that the FDIC cited recently (see FDIC NewsRelease PR-3-2003) shows a AAA-rated commercial loan under Basel II bearing a projectedminimum capital requirement as low as $0.37 or as high as $4.45 per $100 loaned. If the loanis BBB rated, however, its minimum capital requirement may range from as low as $1.01 to ashigh as $14.13. In contrast, Basel I’s minimum capital requirement for such a loan remainsfixed at $8 per $100. Clearly, Basel II is much more sensitive to credit risk than its predecessor.
A Dual (Large-Bank, Small-Bank) Set of RulesBasel II will operate under one set of capital rules for the handful of largest multinationalbanks and another set for the much more numerous smaller banking firms. Regulators areespecially concerned that smaller banks could be overwhelmed by the heavy burdens ofgathering risk-exposure information and performing complicated risk calculations. Then,too, if Basel II results in lowering the capital requirements of many of the world’s largestbanks, this “bifurcated” system could create a competitive disadvantage for smaller bankingfirms. It is expected that smaller institutions will be able to continue to use simpler andmore standardized approaches in determining their capital requirements and risk exposures,paralleling the rules under Basel I.
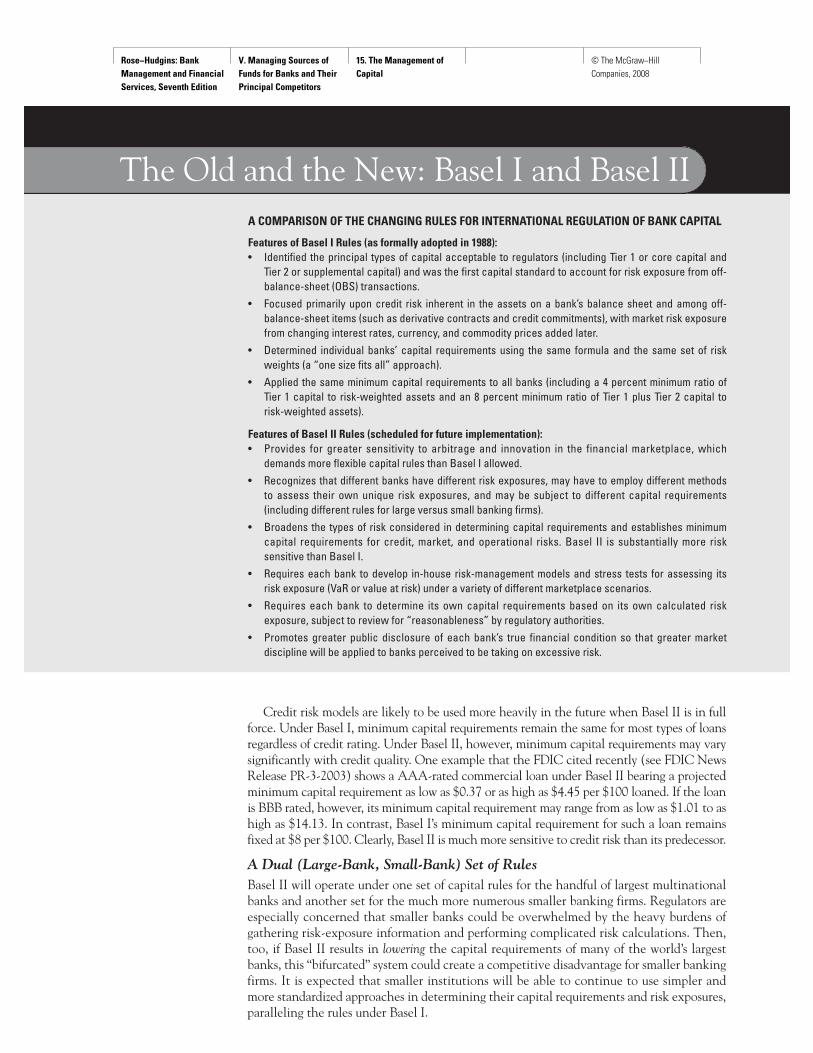
The Old and the New: Basel I and Basel IIA COMPARISON OF THE CHANGING RULES FOR INTERNATIONAL REGULATION OF BANK CAPITAL
Features of Basel I Rules (as formally adopted in 1988):• Identified the principal types of capital acceptable to regulators (including Tier 1 or core capital and
Tier 2 or supplemental capital) and was the first capital standard to account for risk exposure from off-balance-sheet (OBS) transactions.
• Focused primarily upon credit risk inherent in the assets on a bank’s balance sheet and among off-balance-sheet items (such as derivative contracts and credit commitments), with market risk exposurefrom changing interest rates, currency, and commodity prices added later.
• Determined individual banks’ capital requirements using the same formula and the same set of riskweights (a “one size fits all” approach).
• Applied the same minimum capital requirements to all banks (including a 4 percent minimum ratio ofTier 1 capital to risk-weighted assets and an 8 percent minimum ratio of Tier 1 plus Tier 2 capital torisk-weighted assets).
Features of Basel II Rules (scheduled for future implementation):• Provides for greater sensitivity to arbitrage and innovation in the financial marketplace, which
demands more flexible capital rules than Basel I allowed.• Recognizes that different banks have different risk exposures, may have to employ different methods
to assess their own unique risk exposures, and may be subject to different capital requirements(including different rules for large versus small banking firms).
• Broadens the types of risk considered in determining capital requirements and establishes minimumcapital requirements for credit, market, and operational risks. Basel II is substantially more risksensitive than Basel I.
• Requires each bank to develop in-house risk-management models and stress tests for assessing itsrisk exposure (VaR or value at risk) under a variety of different marketplace scenarios.
• Requires each bank to determine its own capital requirements based on its own calculated riskexposure, subject to review for “reasonableness” by regulatory authorities.
• Promotes greater public disclosure of each bank’s true financial condition so that greater marketdiscipline will be applied to banks perceived to be taking on excessive risk.
Rose−Hudgins: Bank Management and Financial Services, Seventh Edition
V. Managing Sources of Funds for Banks and Their Principal Competitors
15. The Management of Capital
© The McGraw−Hill Companies, 2008
496 Part Five Managing Sources of Funds for Banks and Their Principal Competitors
Problems Accompanying the Implementation of Basel IIThe Basel II plan is by no means perfect at this stage. Major questions and issues remain tobe resolved. First, the technology of risk measurement still has a long way to go. For exam-ple, some forms of risk (such as operational risk) have no generally accepted measurementscale. In these instances we don’t know exactly how to calculate the amount of risk expo-sure present and how that exposure may be changing over time.
Then, too, there is the complex issue of risk aggregation. How do we add up the differ-ent forms of risk exposure in order to get an accurate picture of a bank’s total risk exposure?Clearly, the different forms of risk considered in Basel II must be quantified in some way sowe can combine them into one corporate risk index that guides us in figuring out howmuch regulatory capital each bank needs to have.
Moreover, what should we do about the business cycle? It is likely that most banks willface greater risk exposure in the middle of an economic recession than they will in a periodof economic expansion. This implies that most banks will need greater amounts of capitalwhen the economy is down. But how much? Is it possible that some forms of risk will berising and while others are falling over the course of the business cycle?
Finally, some financial experts have expressed concern about improving regulator compe-tence. As the technology of advanced risk-management models moves forward, regulatorsmust be trained to keep up so they can assess the effectiveness of the different risk modelsand procedures each bank has adopted. The regulatory community must change alongwith changes in the financial-services industry.
Concept Check
15–10. What are the most popular financial ratios regu-lators use to assess the adequacy of bank capitaltoday?
15–11. What is the difference between core (or Tier 1)capital and supplemental (or Tier 2) capital?
15–12. A bank reports the following items on its latestbalance sheet: allowance for loan and leaselosses, $42 million; undivided profits, $81 million;subordinated debt capital, $3 million; commonstock and surplus, $27 million; equity notes, $2 mil-lion; minority interest in subsidiaries, $4 million;mandatory convertible debt, $5 million; identifiableintangible assets, $3 million; and noncumulativeperpetual preferred stock, $5 million. How muchdoes the bank hold in Tier 1 capital? In Tier 2 cap-ital? Does the bank have too much Tier 2 capital?
15–13. What changes in the regulation of bank capitalwere brought into being by the Basel Agreement?What is Basel I? Basel II?
15–14. First National Bank reports the following items onits balance sheet: cash, $200 million; U.S. govern-ment securities, $150 million; residential real estateloans, $300 million; and corporate loans, $350 mil-lion. Its off-balance-sheet items include standbycredit letters, $20 million, and long-term creditcommitments to corporations, $160 million. Whatare First National’s total risk-weighted assets? Ifthe bank reports Tier 1 capital of $30 million andTier 2 capital of $20 million, does it have a capitaldeficiency?
15–15. How is the Basel Agreement likely to affect abank’s choices among assets it would like toacquire?
15–16. What are the most significant differencesbetween Basel I and Basel II? Explain the impor-tance of the concepts of internal risk assessment,VaR, and market discipline.
15–7 Changing Capital Standards Inside the United StatesInside the United States, regulatory agencies stress the need for strong capital positions beforethey will approve the offering of new services or the establishment or acquisition of newoffices or subsidiary firms. Strongly capitalized banks will be allowed to venture into new fields

Rose−Hudgins: Bank Management and Financial Services, Seventh Edition
V. Managing Sources of Funds for Banks and Their Principal Competitors
15. The Management of Capital
© The McGraw−Hill Companies, 2008
Chapter 15 The Management of Capital 497
(such as investment banking or insurance underwriting) and expand geographically. Bankswith weak capital face more regulatory pressure and will be restricted in their activities untilthey improve their capital positions. The underlying rationale for “capital-based supervision”is that financial firms will be less likely to fail or take on excessive risk if their owners areforced to place more of their own money at risk. In effect, the more capital backing a finan-cial firm’s activities, the more its stockholders will likely exercise quality control over its oper-ations. However, there are limits on how much capital regulators can demand. Demandingtoo much capital throttles back a financial firm’s ability to lend funds profitably in order tosupport economic growth and tends to lower the overall return on equity (ROE), making thefirm less attractive to investors and making it more difficult to raise new capital in the future.
Several new capital rules created recently by U.S. regulatory agencies were mandatedby the FDIC Improvement Act passed by Congress in November 1991. This law requiresfederal regulators to take Prompt Corrective Action (PCA) when an insured depositoryinstitution’s capital falls below acceptable levels. Section 131 of the act allows regulatorsto impose tougher restrictions on an insured depository institution as its capital leveldeclines, such as prohibiting the payment of management fees or stockholder dividends. Ifan institution’s ratio of tangible equity capital to total assets drops to 2 percent or less, adepository institution is considered “critically undercapitalized,” and it can be placed inconservatorship or receivership within 90 days unless the institution’s principal regulatorand the FDIC determine that it would be in the interest of the public to allow the troubledinstitution to continue under present ownership and management. To avoid seizure, adepository institution must have a positive net worth and demonstrate that it is actuallyimproving its condition.
In the fall of 1992 the FDIC and the other federal regulators created five capital-adequacy categories for depository institutions for purposes of implementing promptcorrective action when a bank or thrift becomes inadequately capitalized. These fivecategories describe how well capitalized each depository institution is:
A. Well capitalized—a U.S. depository institution in this category has a ratio of capital torisk-weighted assets of at least 10 percent, a ratio of Tier 1 (or core) capital to risk-weighted assets of at least 6 percent, and a leverage ratio (Tier 1 capital to averageassets) of at least 5 percent. A well-capitalized institution faces no significant regulatoryrestrictions on its expansion.
B. Adequately capitalized—a U.S. depository institution in this group has a minimum ratioof capital to risk-weighted assets of at least 8 percent, a ratio of Tier 1 capital to risk-weighted assets of at least 4 percent, and a leverage ratio of at least 4 percent. Such aninstitution cannot accept broker-placed deposits without regulatory approval.
C. Undercapitalized—a U.S. depository institution that fails to meet one or more of thecapital minimums for an adequately capitalized institution is considered undercapital-ized and is subject to a variety of mandatory or discretionary regulatory restrictions,including limits on the dividends and management fees it is allowed to pay, on accessto the Federal Reserve’s discount window, on its maximum asset growth rate, on theexpansion of its facilities or services, or on any proposed merger unless approval isobtained in advance from federal regulators. Such a depository institution is subject toincreased monitoring and must pursue a plan for capital recovery.
D. Significantly undercapitalized—a U.S. depository institution belonging to this group pos-sesses a ratio of total capital to risk-weighted assets of less than 6 percent, a Tier 1 cap-ital to risk-weighted assets ratio of under 3 percent, and a leverage ratio average of lessthan 3 percent. A depository institution in this category is subject to all the restrictionsfaced by undercapitalized institutions plus other restrictions, such as mandatory prohi-bitions on paying bonuses and raises to senior officers without regulator approval, lim-its on deposit interest rates that may be paid, and, in some cases, mandatory merger.
Key URLsTo learn more about thecapital requirements ofU.S. depositoryinstitutions see especiallythe following Web sites:www.fdic.gov, www.occ.treas.gov, www.ots.treas.gov, and www.federalreserve.gov/regulations/default.htm.
Rose−Hudgins: Bank Management and Financial Services, Seventh Edition
V. Managing Sources of Funds for Banks and Their Principal Competitors
15. The Management of Capital
© The McGraw−Hill Companies, 2008
498 Part Five Managing Sources of Funds for Banks and Their Principal Competitors
E. Critically undercapitalized—this category applies to those U.S. depository institutionswhose ratio of tangible equity capital to total assets is 2 percent or less (where tangibleequity includes common equity capital and cumulative perpetual preferred stock minusmost forms of intangible assets). Depository institutions in this lowest capital group faceall the restrictions applying to undercapitalized institutions plus required regulatorapproval for such transactions as granting loans to highly leveraged borrowers, makingchanges in their charter or bylaws, paying above-market interest rates on deposits,changing their accounting methods, or paying excessive compensation or bonuses toconsultants or staff. A critically undercapitalized institution may be prevented frompaying principal and interest on its subordinated debt and will be placed in conserva-torship or receivership if its capital level is not increased within a prescribed time limit.U.S. federal banking agencies plan to retain both the current Prompt CorrectiveAction (PCA) and leverage capital requirements discussed above as part of the U.S.domestic implementation of Basel II.
In recent years the FDIC has analyzed the financial reports of federally insured deposi-tory institutions and found that over 90 percent fall in either the well-capitalized or ade-quately capitalized groups. Regulators have repeatedly concluded that the Americanbanking system must be in reasonably good shape. Unfortunately, this conclusion usuallyis based upon the book values of assets and capital, not on market values, and could turnout to be an exaggeration of the industry’s true condition. Only time will tell.
15–8 Planning to Meet Capital NeedsFacing regulatory pressures to maintain adequate capital, financial institutions are increas-ingly recognizing the need to plan for their long-range capital needs and to raise new cap-ital as they grow from both internal and external sources.
Raising Capital InternallyIn most years, the principal source of capital is from earnings kept inside rather than paid outto stockholders. Internally generated capital has the advantage of not having to depend onthe open market for funds, thus avoiding flotation costs. Not only is internal capital gen-erally less expensive to raise, but it also does not threaten existing stockholders with lossof control—that is, it avoids dilution of their share of ownership and their earnings pershare of stock held. For example, if a financial firm chooses to sell stock, some shares maybe sold to new stockholders, who will then be entitled to share in any future earnings andto vote on policies. However, internal capital has the disadvantage of being fully taxableand is significantly affected by changing interest rates and economic conditions not con-trollable by management.
Dividend PolicyRelying on the growth of earnings to meet capital needs means that a decision must bemade concerning the amount of earnings retained in the business versus the amount paidout to stockholders in the form of dividends. That is, the board of directors and manage-ment must agree on the appropriate retention ratio—current retained earnings divided bycurrent after-tax net income—which then determines the dividend payout ratio—currentdividends to stockholders divided by current after-tax income.
The retention ratio is of great importance to management. A retention ratio set too low(and, therefore, a dividend payout ratio set too high) results in slower growth of internalcapital, which may increase failure risk and retard the expansion of assets. A retentionratio set too high (and, therefore, a dividend payout ratio set too low) can result in a cut
Rose−Hudgins: Bank Management and Financial Services, Seventh Edition
V. Managing Sources of Funds for Banks and Their Principal Competitors
15. The Management of Capital
© The McGraw−Hill Companies, 2008
Chapter 15 The Management of Capital 499
in the stockholders’ dividend income. Other factors held constant, such a cut wouldreduce the market value of stock issued by a financial institution. The optimal dividendpolicy is one that maximizes the value of the stockholders’ investment. New stockholderswill be attracted and existing stockholders retained if the rate of return on owners’ equitycapital at least equals returns generated by other investments of comparable risk.
It is important for management to achieve a stable dividend track record. If the finan-cial institution’s dividend payout ratio is kept relatively constant, interested investors willperceive less risk in their dividend payments and the institution will look more attractiveto investors. As a study of banks by Keen [4] suggests, stock prices typically drop quicklyafter a dividend cut is announced. This not only disappoints current stockholders but alsodiscourages potential buyers of equity shares, making it more difficult to raise new capitalin the future.
How Fast Must Internally Generated Funds Grow?A key factor affecting management’s decision about an appropriate retention ratio anddividend payout ratio is how fast the financial firm can allow its assets to grow so that itsexisting ratio of capital assets is protected from erosion. In other words, how fast mustearnings grow to keep the capital-to-assets ratio protected if the financial firm continuespaying the same dividend rate to its stockholders?
The following formula helps management and the board of directors answer suchquestions:
Internal capital growth rate, or Retained earnings
� Equity capital � ROE � Retention ratio(15–4)
The reader will recall the ROE relationship discussed in Chapter 6:
ROE � Profit margin � Asset utilization � Equity multiplier (15–5)
Then it must be true that
(15–6)
This formula shows that if we want to increase internally generated capital, we mustincrease earnings (through a higher profit margin, asset utilization ratio, and/or equitymultiplier) or increase the earnings retention ratio, or both.
To illustrate the use of this formula, imagine that management has forecast a return onequity (ROE) of 10 percent for this year and plans to pay the stockholders 50 percent ofany net earnings generated. How fast can assets grow without reducing the current ratio oftotal capital to total assets? Equation (15–4) above yields
ICGR � ROE � Retention ratio � 0.10 � 0.50 � 5 percent
Thus, assets cannot grow more than 5 percent under the assumptions made. Otherwise,the capital-to-assets ratio will fall. If it falls far enough, the regulatory authorities will insistthat capital be increased.
�Total assets
Equity capital�
Retained earningsNet income
Retained earningsEquity capital
�Net income
Operating revenue�
Operating revenueTotal assets
�Net income
Equity capital�
Retained earningsNet income
Rose−Hudgins: Bank Management and Financial Services, Seventh Edition
V. Managing Sources of Funds for Banks and Their Principal Competitors
15. The Management of Capital
© The McGraw−Hill Companies, 2008
500 Part Five Managing Sources of Funds for Banks and Their Principal Competitors
To take one more example, suppose assets are forecast to grow 10 percent this year.What options are open to management in terms of an earnings rate, measured by ROE,and an earnings retention ratio if the current ratio of capital to total assets is to be pre-served? There are, of course, numerous possibilities that the formula above will generate,as revealed in the following table. For example, if management can boost return on equityto 20 percent, it can pay out 50 percent of its net after-tax income, retain the other 50 per-cent, and still protect its current capital-to-assets ratio. With an ROE of 10 percent, how-ever, management must retain all of its current earnings. It should also be clear that if ROEfalls below 10 percent, the capital-to-assets ratio must decline as well, even if it retains allcurrent income. In this instance, management may find regulators insisting on raisingmore capital from outside to offset a poor earnings record.
Example: If assets are expected to grow at a 10 percent rate this year, what combination ofreturn on equity and retention rate for earnings will preserve its current capital-to-assets ratio?
Raising Capital ExternallyIf a financial firm does need to raise capital from outside sources, it has several options:(1) selling common stock, (2) selling preferred stock, (3) issuing debt capital, (4) sellingassets, (5) leasing certain fixed assets, especially buildings and (6) swapping stock for debtsecurities. Which alternative management chooses will depend primarily on the impacteach source would have on returns to stockholders, usually measured by earnings pershare (EPS). Other key factors to consider are the institution’s risk exposure, the impacton control by existing stockholders, the state of the market for the assets or securitiesbeing sold, and regulations.
Issuing Common StockThe sale of equity shares is generally the most expensive way to raise external capital, con-sidering flotation costs and the greater risk to earnings that stockholders face compared todebtholders. Unless current stockholders can absorb all the new shares, a new stock issuemay dilute control and EPS unless the institution can earn more on funds raised than theircost of issue. Issuing stock also reduces the degree of leverage a financial firm can employ.The offsetting advantage, however, is that increasing ownership shares tends to increasefuture borrowing capacity.
Issuing Preferred StockThe sale of preferred stock is, like the sale of common stock, generally among the more expen-sive sources of capital. Because preferred shareholders have a prior claim on earnings overholders of common equity, dividends to common stockholders may be lower after preferredshares are issued. However, preferred stock has an advantage over debt in the form of greaterflexibility (because dividends need not be paid), and newly issued preferred shares add futureborrowing capacity. Moreover, as we saw earlier in this chapter, new hybrid forms of preferredshares (such as trust preferred stock) have appeared recently that carry lower cost.
Issuing Subordinated Notes and DebenturesThe advantage of issuing new debt capital is the generation of increased financial lever-age to boost EPS if more can be earned from the use of borrowed funds than their cost.
Forecasted asset growth rate of 10 percent0.100.100.10
� ROE �
� 0.20 �
� 0.15 �
� 0.10 �
Retention ratio0.500.671.00
Rose−Hudgins: Bank Management and Financial Services, Seventh Edition
V. Managing Sources of Funds for Banks and Their Principal Competitors
15. The Management of Capital
© The McGraw−Hill Companies, 2008
Chapter 15 The Management of Capital 501
Moreover, interest payments on debt securities are tax deductible. However, debt adds tofailure and earnings risk and may make it more difficult to sell stock in the future.
Selling Assets and Leasing FacilitiesOccasionally, financial-service providers sell all or a portion of their office facilities andlease back from the new owner space to carry on their operations. Recent examplesinclude Bank of America and Barclays PLC selling and then leasing back bank branchesand other offices. Such a transaction usually creates a substantial inflow of cash and a siz-able addition to net worth strengthening the selling institution’s capital position.
The most successful sale-and-leaseback transactions have occurred where inflation andeconomic growth have significantly increased current property values over the book valueof the property recorded on the balance sheet. When faster write-offs of commercial realestate are possible, the economic incentive from selling and leasing back property can bemost attractive. However, this potentially attractive feature was dimmed a bit in 1986 withpassage of the Tax Reform bill. This law lengthened real estate depreciation requirementsfor most structures, thus requiring management to evaluate their real estate transactionsmore in terms of economic benefits rather than tax benefits. However, the leasing institu-tion usually receives substantial amounts of cash at low cost, increasing earnings.
Many depository institutions in recent years have sold assets to improve their capital-to-assets ratios. They have also frequently slowed the growth of more risky assets and redis-tributed some of their assets toward lower-risk investments so that their risk-weightedassets decline. A related strategy is to avoid booking loans, thereby avoiding an increase inassets and capital requirements, by referring loan customers to alternative sources of out-side funds, such as securitizations or standby credit agreements (as described, for example,in Chapter 9).
Swapping Stock for Debt SecuritiesIn recent years a number of banking organizations have undertaken stock-for-debt swaps.For example, a bank may have $2 million in subordinated debentures on its balancesheet, issued at an interest cost of 8 percent. Following conventional practice, thesebonds are recorded at their issue price (book value). If interest rates have risen recently,say to 10 percent, these notes may now have a market value of just $1 million. By sellingnew stock in the amount of $1 million and buying back the notes at their current marketprice, the bank is able to remove a $2 million debt from its balance sheet. From the reg-ulators’ perspective, the swapping institution has strengthened its capital and saved thecost of future interest payments on the notes. Moreover, most debt issues have a sinkingfund requirement, which requires annual payments into the fund to retire the bonds.These future cash outlays are no longer needed after a stock-for-debt swap is completed.
Choosing the Best Alternative for Raising Outside CapitalThe choice of which method to use in raising outside capital should be made on the basisof a careful financial analysis of the alternatives and their effects on a financial firm’s earn-ings per share. Table 15–2 gives an example of a bank that needs to raise $20 million inexternal capital. The institution currently has 8 million shares of common stock out-standing at a $4-per-share par value and has assets of close to $1 billion, with $60 millionin equity capital. If this bank can generate total revenue of about $100 million and holdoperating expenses to no more than $80 million, it should have about $10.8 million inearnings left after taxes. If management elects to raise the needed $20 million in new cap-ital by issuing 2 million new equity shares, each at a net price of $10, the common stock-holders will receive $1.30 in earnings per share.
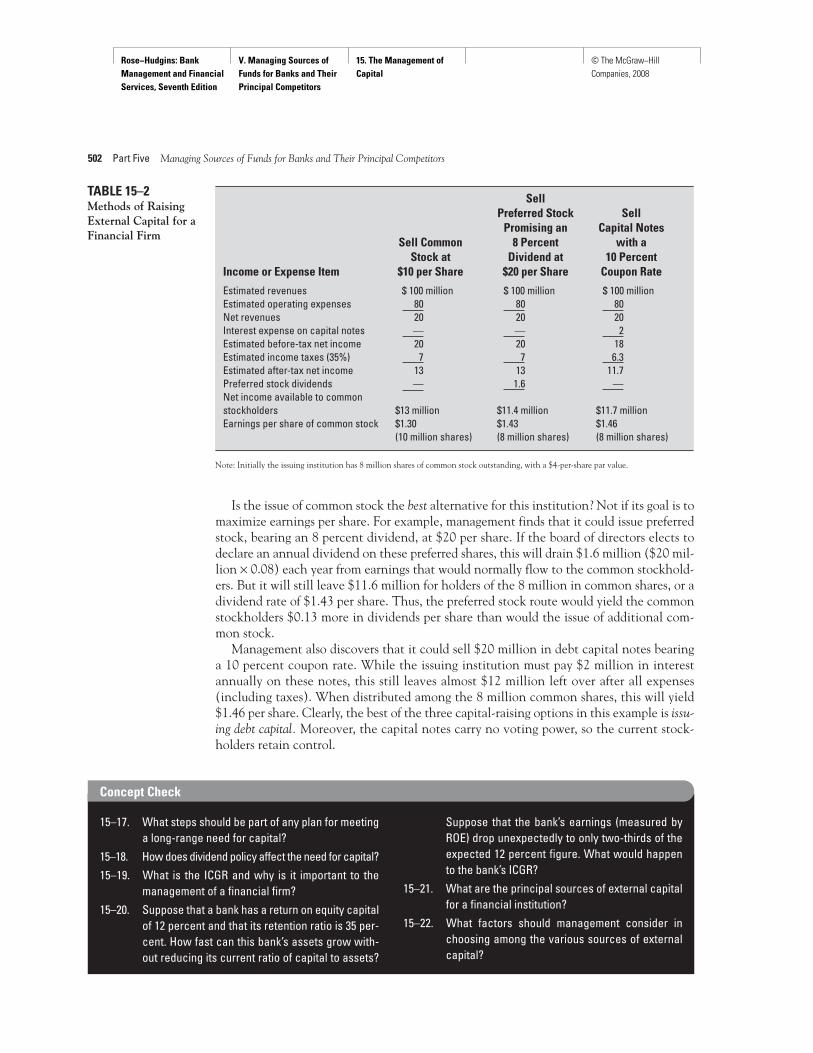
Rose−Hudgins: Bank Management and Financial Services, Seventh Edition
V. Managing Sources of Funds for Banks and Their Principal Competitors
15. The Management of Capital
© The McGraw−Hill Companies, 2008
502 Part Five Managing Sources of Funds for Banks and Their Principal Competitors
SellPreferred Stock Sell
Promising an Capital Notes Sell Common 8 Percent with a
Stock at Dividend at 10 Percent Income or Expense Item $10 per Share $20 per Share Coupon Rate
Estimated revenues $ 100 million $ 100 million $ 100 millionEstimated operating expenses 80 80 80Net revenues 20 20 20Interest expense on capital notes — — 2Estimated before-tax net income 20 20 18Estimated income taxes (35%) 7 7 6.3Estimated after-tax net income 13 13 11.7Preferred stock dividends — 1.6 —Net income available to common stockholders $13 million $11.4 million $11.7 millionEarnings per share of common stock $1.30 $1.43 $1.46
(10 million shares) (8 million shares) (8 million shares)
TABLE 15–2Methods of RaisingExternal Capital for aFinancial Firm
Note: Initially the issuing institution has 8 million shares of common stock outstanding, with a $4-per-share par value.
Is the issue of common stock the best alternative for this institution? Not if its goal is tomaximize earnings per share. For example, management finds that it could issue preferredstock, bearing an 8 percent dividend, at $20 per share. If the board of directors elects todeclare an annual dividend on these preferred shares, this will drain $1.6 million ($20 mil-lion × 0.08) each year from earnings that would normally flow to the common stockhold-ers. But it will still leave $11.6 million for holders of the 8 million in common shares, or adividend rate of $1.43 per share. Thus, the preferred stock route would yield the commonstockholders $0.13 more in dividends per share than would the issue of additional com-mon stock.
Management also discovers that it could sell $20 million in debt capital notes bearinga 10 percent coupon rate. While the issuing institution must pay $2 million in interestannually on these notes, this still leaves almost $12 million left over after all expenses(including taxes). When distributed among the 8 million common shares, this will yield$1.46 per share. Clearly, the best of the three capital-raising options in this example is issu-ing debt capital. Moreover, the capital notes carry no voting power, so the current stock-holders retain control.
Concept Check
15–17. What steps should be part of any plan for meetinga long-range need for capital?
15–18. How does dividend policy affect the need for capital?
15–19. What is the ICGR and why is it important to themanagement of a financial firm?
15–20. Suppose that a bank has a return on equity capitalof 12 percent and that its retention ratio is 35 per-cent. How fast can this bank’s assets grow with-out reducing its current ratio of capital to assets?
Suppose that the bank’s earnings (measured byROE) drop unexpectedly to only two-thirds of theexpected 12 percent figure. What would happento the bank’s ICGR?
15–21. What are the principal sources of external capitalfor a financial institution?
15–22. What factors should management consider inchoosing among the various sources of externalcapital?
Rose−Hudgins: Bank Management and Financial Services, Seventh Edition
V. Managing Sources of Funds for Banks and Their Principal Competitors
15. The Management of Capital
© The McGraw−Hill Companies, 2008
Chapter 15 The Management of Capital 503
ww
w.m
hhe.com/rose7e
Summary In the history of banking and financial institutions there are few more controversial issuesthan those surrounding capital. A long-standing debate among bankers, regulators, andfinancial analysts concerns how much and what types of capital should be held. Not onlythe definition and concept of capital but also our views on the proper role for capital incontrolling the behavior of financial firms are changing. Among the key points in thischapter are the following:
• The term capital in the financial-services field refers to the funds contributed by theowners—money invested in a financial firm and placed at risk in the hope of earning acompetitive return. Banks are corporations and their owners are shareholders—investors in common and preferred stock, while for some other financial firms, such ascredit unions and mutual savings banks, the owners are customers who invest theirdeposits in the institution and capital is an accumulation of reinvested profits.
• Capital consists principally of common and preferred stock, surplus (the excess value ofstock over its par value), reserves for contingencies, undivided profits, equity reserves,minority interest in consolidated subsidiaries, and equity commitment notes. Mostfinancial firms don’t have all of these types of instruments in their capital account. Themost important capital sources include stock, surplus, undivided profits, and equityreserves. However, increasingly in recent years depository institutions have issued long-term debt subordinated to the claims of depositors, which is also recognized as capitalby most regulatory agencies.
• Capital is the ultimate line of defense against failure, giving the financial firm time torespond to the various kinds of risks it faces and return to profitability again. Capitalalso supplies long-term money to get a new financial institution started, provide a basefor future growth, and promote public confidence in each financial firm and in thefinancial system.
• The volume of capital a regulated financial institution holds and the makeup of its cap-ital account are determined by both regulation and the financial marketplace. Because notall the information on the true condition of regulated financial firms is normallyreleased to the public, the private marketplace alone may not be completely reliable asan effective regulator in promoting the public interest, creating a role for governmentregulation of each institution’s capital account.
• Capital requirements today are set by regulatory agencies and, for banks in more than100 nations today, under rules laid out in the Basel Agreement on International BankCapital Standards—one of the first successful efforts in history to impose common ruleson banks from many different countries. These government agencies set minimum cap-ital requirements and assess the capital adequacy of the financial firms they regulate.
• Capital regulation aimed primarily at the largest international banks formally began in1988 with a multinational agreement known as Basel I. This set of international rulesrequires many of the largest banks to separate their on-balance-sheet and off-balance-sheet assets and commitments into risk categories and to multiply each asset by itsappropriate risk weight to determine total risk-weighted assets. The ratio of total regu-latory capital relative to total risk-weighted assets and off-balance-sheet commitmentsis a key indicator of the strength of each bank’s capital position.
• Weaknesses in Basel I, especially its inability to respond to change and innovation inthe financial marketplace, have led to a Basel II agreement to be phased in. This newapproach to capital regulation will require the world’s largest banking firms to conducta continuing internal assessment of their risk exposures, including stress testing, and tocalculate their required level of capital. Thus, each participating bank will have its own

Rose−Hudgins: Bank Management and Financial Services, Seventh Edition
V. Managing Sources of Funds for Banks and Their Principal Competitors
15. The Management of Capital
© The McGraw−Hill Companies, 2008
ww
w.m
hhe.com/rose7e
504 Part Five Managing Sources of Funds for Banks and Their Principal Competitors
unique capital requirements based on its own unique risk profile. Smaller banks will usea simpler, standardized approach to determining their minimum capital requirementssimilar to the rules of Basel I.
• Financial firms in need of additional capital have several different sources to drawupon, including internal and external sources of funds. The principal internal source isretained earnings. The principal external sources include (a) selling common stock; (b)selling preferred stock; (c) issuing capital notes; (d) selling assets; (e) leasing fixedassets; and (f) swapping stock for debt.
• Choosing among the various sources of capital requires the management of a financialinstitution to consider the relative cost and risk of each capital source, the institution’soverall risk exposure, the potential impact of each source on returns to shareholders,government regulations, and the demands of investors in the private marketplace.
Profit margin of net income over operating revenue 8.30%Asset utilization (operating revenue ÷ assets) 9.25%Equity multiplier 15.22XNet earnings retention ratio 45.00%
Net Income ï Net Income ïTotal Assets Total Equity
Name of Bank (or ROA) Capital (or ROE)
First National Bank of Hopkins 1.6% 15%Safety National Bank 1.3% 13%Ilsher State Bank 0.95% 10%Mercantile Bank and Trust Company 0.83% 9%Lakeside National Trust –0.43% –5%
Key Terms capital, 475operational risk, 477exchange risk, 477crime risk, 478portfoliodiversification, 478geographicdiversification, 478common stock, 479preferred stock, 479
surplus, 479undivided profits, 479equity reserves, 479subordinateddebentures, 479minority interest inconsolidatedsubsidiaries, 479equity commitment notes, 479
Basel Agreement, 483Basel I, 484Tier 1 capital, 484Tier 2 capital, 484value at risk (VaR)models, 491Basel II, 492credit risk models, 494internal capital growthrate, 499
1. Carter Savings Association has forecast the following performance ratios for the yearahead. How fast can Carter allow its assets to grow without reducing its ratio of equitycapital to total assets, assuming its performance holds steady over the period?
Problemsand Projects
2. Using the formulas developed in this chapter and in Chapter 6 and the informationthat follows, calculate the ratios of total capital to total assets for the banking firmslisted below. What relationship among these banks’ return on assets, return on equitycapital, and capital-to-assets ratios did you observe? What implications or recommen-dations would you draw for the management of each of these institutions?
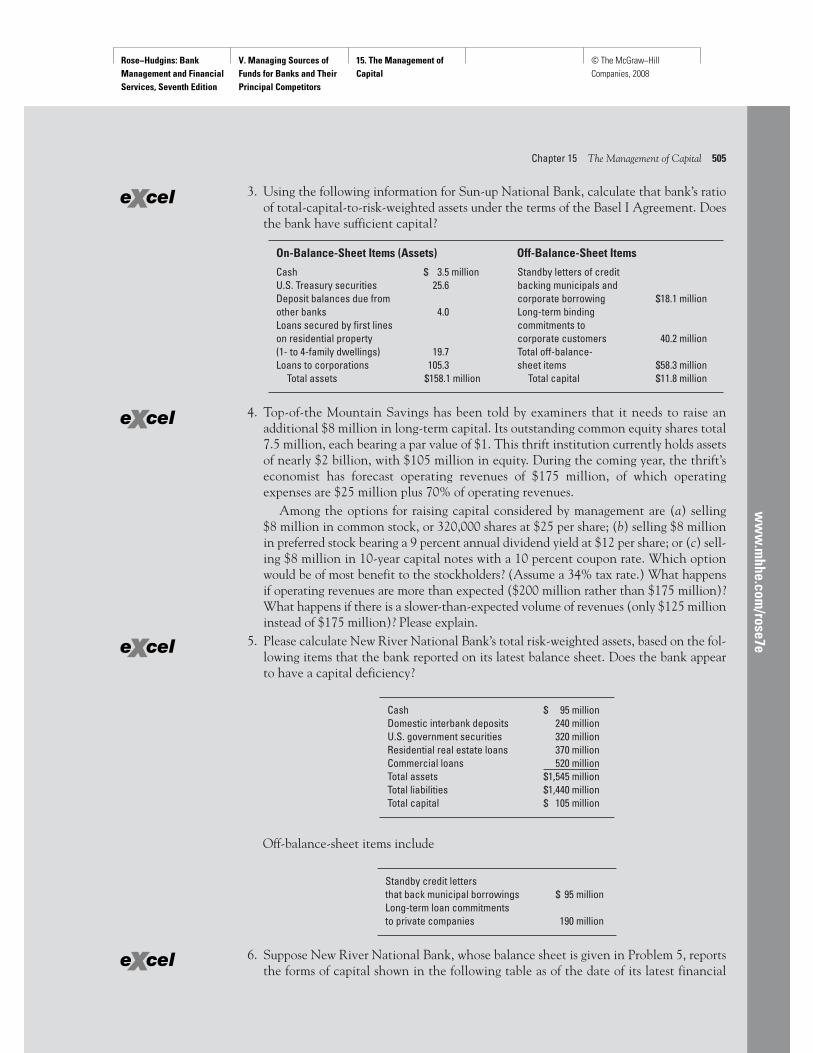
Rose−Hudgins: Bank Management and Financial Services, Seventh Edition
V. Managing Sources of Funds for Banks and Their Principal Competitors
15. The Management of Capital
© The McGraw−Hill Companies, 2008
Chapter 15 The Management of Capital 505
ww
w.m
hhe.com/rose7e
3. Using the following information for Sun-up National Bank, calculate that bank’s ratioof total-capital-to-risk-weighted assets under the terms of the Basel I Agreement. Doesthe bank have sufficient capital?
4. Top-of-the Mountain Savings has been told by examiners that it needs to raise anadditional $8 million in long-term capital. Its outstanding common equity shares total7.5 million, each bearing a par value of $1. This thrift institution currently holds assetsof nearly $2 billion, with $105 million in equity. During the coming year, the thrift’seconomist has forecast operating revenues of $175 million, of which operatingexpenses are $25 million plus 70% of operating revenues.
Among the options for raising capital considered by management are (a) selling $8 million in common stock, or 320,000 shares at $25 per share; (b) selling $8 millionin preferred stock bearing a 9 percent annual dividend yield at $12 per share; or (c) sell-ing $8 million in 10-year capital notes with a 10 percent coupon rate. Which optionwould be of most benefit to the stockholders? (Assume a 34% tax rate.) What happensif operating revenues are more than expected ($200 million rather than $175 million)?What happens if there is a slower-than-expected volume of revenues (only $125 millioninstead of $175 million)? Please explain.
5. Please calculate New River National Bank’s total risk-weighted assets, based on the fol-lowing items that the bank reported on its latest balance sheet. Does the bank appearto have a capital deficiency?
On-Balance-Sheet Items (Assets) Off-Balance-Sheet Items
Cash $ 3.5 million Standby letters of credit U.S. Treasury securities 25.6 backing municipals and Deposit balances due from corporate borrowing $18.1 millionother banks 4.0 Long-term bindingLoans secured by first lines commitments to on residential property corporate customers 40.2 million(1- to 4-family dwellings) 19.7 Total off-balance-Loans to corporations 105.3 sheet items $58.3 million
Total assets $158.1 million Total capital $11.8 million
Cash $ 95 millionDomestic interbank deposits 240 millionU.S. government securities 320 millionResidential real estate loans 370 millionCommercial loans 520 millionTotal assets $1,545 millionTotal liabilities $1,440 millionTotal capital $ 105 million
Off-balance-sheet items include
Standby credit letters that back municipal borrowings $ 95 millionLong-term loan commitments to private companies 190 million
6. Suppose New River National Bank, whose balance sheet is given in Problem 5, reportsthe forms of capital shown in the following table as of the date of its latest financial
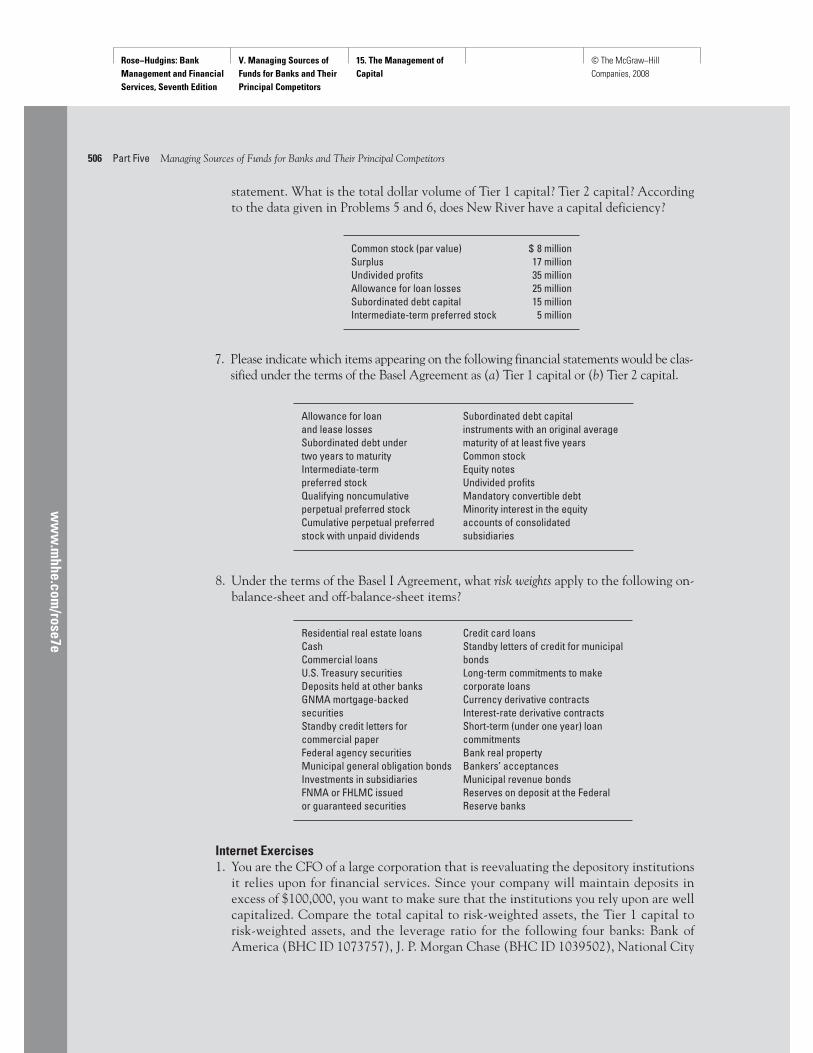
Rose−Hudgins: Bank Management and Financial Services, Seventh Edition
V. Managing Sources of Funds for Banks and Their Principal Competitors
15. The Management of Capital
© The McGraw−Hill Companies, 2008
ww
w.m
hhe.com/rose7e
506 Part Five Managing Sources of Funds for Banks and Their Principal Competitors
statement. What is the total dollar volume of Tier 1 capital? Tier 2 capital? Accordingto the data given in Problems 5 and 6, does New River have a capital deficiency?
8. Under the terms of the Basel I Agreement, what risk weights apply to the following on-balance-sheet and off-balance-sheet items?
Internet Exercises1. You are the CFO of a large corporation that is reevaluating the depository institutions
it relies upon for financial services. Since your company will maintain deposits inexcess of $100,000, you want to make sure that the institutions you rely upon are wellcapitalized. Compare the total capital to risk-weighted assets, the Tier 1 capital torisk-weighted assets, and the leverage ratio for the following four banks: Bank ofAmerica (BHC ID 1073757), J. P. Morgan Chase (BHC ID 1039502), National City
Common stock (par value) $ 8 millionSurplus 17 millionUndivided profits 35 millionAllowance for loan losses 25 millionSubordinated debt capital 15 millionIntermediate-term preferred stock 5 million
7. Please indicate which items appearing on the following financial statements would be clas-sified under the terms of the Basel Agreement as (a) Tier 1 capital or (b) Tier 2 capital.
Allowance for loan Subordinated debt capital and lease losses instruments with an original average Subordinated debt under maturity of at least five yearstwo years to maturity Common stockIntermediate-term Equity notespreferred stock Undivided profitsQualifying noncumulative Mandatory convertible debtperpetual preferred stock Minority interest in the equity Cumulative perpetual preferred accounts of consolidated stock with unpaid dividends subsidiaries
Residential real estate loans Credit card loansCash Standby letters of credit for municipal Commercial loans bondsU.S. Treasury securities Long-term commitments to make Deposits held at other banks corporate loansGNMA mortgage-backed Currency derivative contractssecurities Interest-rate derivative contractsStandby credit letters for Short-term (under one year) loan commercial paper commitmentsFederal agency securities Bank real propertyMunicipal general obligation bonds Bankers’ acceptancesInvestments in subsidiaries Municipal revenue bondsFNMA or FHLMC issued Reserves on deposit at the Federalor guaranteed securities Reserve banks
Rose−Hudgins: Bank Management and Financial Services, Seventh Edition
V. Managing Sources of Funds for Banks and Their Principal Competitors
15. The Management of Capital
© The McGraw−Hill Companies, 2008
Chapter 15 The Management of Capital 507
ww
w.m
hhe.com/rose7e
Corp (BHC ID 1069125), and Wachovia (BHC ID 1073551). This is easily accom-plished at www3.fdic.gov/sdi/ where you can create a report for the four BHCs.
If you need some help maneuvering within the FDIC’s Statistics on Depository Insti-tutions (SDI), read on. The process to create a report requires you to select the numberof columns. You want to select “4” to develop the format to collect data for the mostrecent report. This provides four pull-down menus, each labeled Select One. In thecolumns select Bank Holding Company from the menu and go on to type in the BHCID #. After defining the four columns click on Next. At this point you focus on ReportSelection, choosing to view and do calculations in percentages. Then you get to iden-tify the information you want to collect before creating the report by clicking Next.You will find the “Performance and Conditions” report to be quite helpful. Are all theinstitutions well capitalized? Which institution has the highest capital ratios?
2. You are moving to Philadelphia and two savings banks have been recommended bysoon-to-be colleagues. They are Beneficial Mutual Savings Bank (OTS Docket #15697) and United Savings Banks (OTS Docket # 28836). You thought you wouldcompare their capital adequacy, which is easily accomplished at www3.fdic.gov/sdi/where you can create a report for the two savings associations. If you need some helpcreating a report using SDI continue reading. The process to create a report requiresyou to select the number of columns. You want to select “2” to develop the format tocollect data for the most recent report. This provides two pull-down menus, eachlabeled Select One. In the columns select Single Institution from the menu and go onto type in the OTS Docket Number. After defining the two columns, click on Next. Atthis point you focus on Report Selection, choosing to view and do calculations in per-centages. Then you get to identity the information you want to collect before creatingthe report by clicking Next. You will find the “Performance and Conditions” report tobe helpful. What capital adequacy category is appropriate?
3. The Basel Agreement is always evolving. Visit http://www.bis.org/publ/bcbsca.htm tofind out what the current state of the new agreement is. What are the key issues?
S&P Market Insight Challenge (www.mhhe.com/edumarketinsight)1. Capital levels capture the abilities of depository institutions to sustain losses and are
very important to regulatory agencies watching this industry. For an up-to-date viewof capital levels in the banking and thrift industries, please use the Industry tab inS&P’s Market Insight, Educational Version and the drop-down menu to select amongthe subindustry choices of Diversified Banks, Regional Banks, and Thrifts & Mort-gage Finance. By choosing among these subgroups, you will be able to access the S&PIndustry Survey on Banking and the Survey on Savings and Loans. Please downloadboth surveys and explore the sections, “How to Analyze a Bank” and “How to Ana-lyze a Savings and Loan Company,” with particular focus on the capital adequacyissue. Compare and contrast the most recent capital levels posted by banks and thriftinstitutions.
2. One of the most important topics in this chapter centers around the Basel Agreementon standards for bank capital. Basel I established minimum capital requirements for allbanks in participating countries based on Tier 1 and Tier 2 capital and the risk-weighted assets of each bank. Choose the banks listed in Market Insight. How well cap-italized are these banks relative to Basel’s requirements? Do you see any apparentweaknesses? Are there other facts you’d like to know before relying exclusively on thecapital ratios you have just calculated to make a judgment?
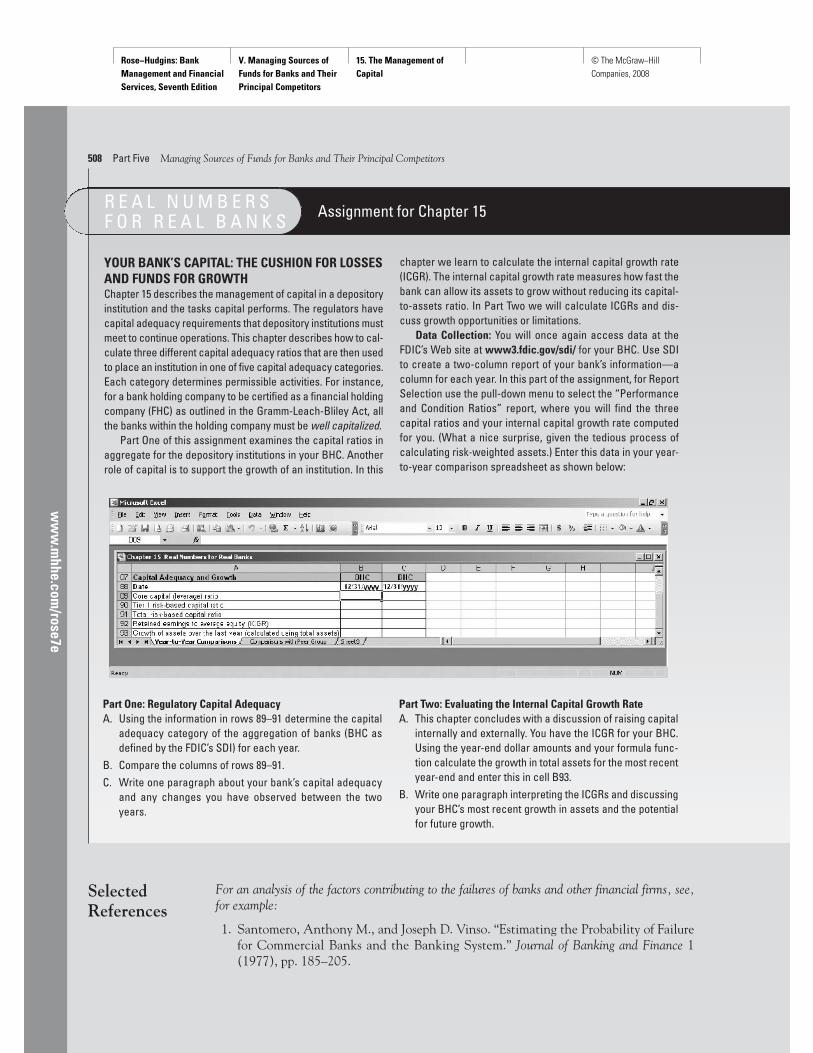
Rose−Hudgins: Bank Management and Financial Services, Seventh Edition
V. Managing Sources of Funds for Banks and Their Principal Competitors
15. The Management of Capital
© The McGraw−Hill Companies, 2008
ww
w.m
hhe.com/rose7e
508 Part Five Managing Sources of Funds for Banks and Their Principal Competitors
For an analysis of the factors contributing to the failures of banks and other financial firms, see,for example:
1. Santomero, Anthony M., and Joseph D. Vinso. “Estimating the Probability of Failurefor Commercial Banks and the Banking System.” Journal of Banking and Finance 1(1977), pp. 185–205.
YOUR BANK’S CAPITAL: THE CUSHION FOR LOSSESAND FUNDS FOR GROWTHChapter 15 describes the management of capital in a depositoryinstitution and the tasks capital performs. The regulators havecapital adequacy requirements that depository institutions mustmeet to continue operations. This chapter describes how to cal-culate three different capital adequacy ratios that are then usedto place an institution in one of five capital adequacy categories.Each category determines permissible activities. For instance,for a bank holding company to be certified as a financial holdingcompany (FHC) as outlined in the Gramm-Leach-Bliley Act, allthe banks within the holding company must be well capitalized.
Part One of this assignment examines the capital ratios inaggregate for the depository institutions in your BHC. Anotherrole of capital is to support the growth of an institution. In this
chapter we learn to calculate the internal capital growth rate(ICGR). The internal capital growth rate measures how fast thebank can allow its assets to grow without reducing its capital-to-assets ratio. In Part Two we will calculate ICGRs and dis-cuss growth opportunities or limitations.
Data Collection: You will once again access data at theFDIC’s Web site at www3.fdic.gov/sdi/ for your BHC. Use SDIto create a two-column report of your bank’s information—acolumn for each year. In this part of the assignment, for ReportSelection use the pull-down menu to select the “Performanceand Condition Ratios” report, where you will find the threecapital ratios and your internal capital growth rate computedfor you. (What a nice surprise, given the tedious process ofcalculating risk-weighted assets.) Enter this data in your year-to-year comparison spreadsheet as shown below:
Assignment for Chapter 15R E A L N U M B E R SF O R R E A L B A N K S
Part One: Regulatory Capital AdequacyA. Using the information in rows 89–91 determine the capital
adequacy category of the aggregation of banks (BHC asdefined by the FDIC’s SDI) for each year.
B. Compare the columns of rows 89–91.C. Write one paragraph about your bank’s capital adequacy
and any changes you have observed between the twoyears.
Part Two: Evaluating the Internal Capital Growth RateA. This chapter concludes with a discussion of raising capital
internally and externally. You have the ICGR for your BHC.Using the year-end dollar amounts and your formula func-tion calculate the growth in total assets for the most recentyear-end and enter this in cell B93.
B. Write one paragraph interpreting the ICGRs and discussingyour BHC’s most recent growth in assets and the potentialfor future growth.
SelectedReferences
Rose−Hudgins: Bank Management and Financial Services, Seventh Edition
V. Managing Sources of Funds for Banks and Their Principal Competitors
15. The Management of Capital
© The McGraw−Hill Companies, 2008
Chapter 15 The Management of Capital 509
ww
w.m
hhe.com/rose7e
For an overview of the market’s role in influencing bank capital positions, see:
2. Eisenbeis, Robert A., and Gary G. Gilbert. “Market Discipline and the Prevention ofBank Problems and Failure.” Issues in Bank Regulation 3 (Winter 1985), pp. 16–23.
3. Federal Reserve Bank of New York. Beyond Pillar 3 in International Banking Regulation:Disclosure and Market Discipline of Financial Firms. Proceedings of a conference cospon-sored by the Federal Reserve Bank of New York and the Jerome A. Chazen Institute ofInternational Business at Columbia University, 10, no. 2 (September 2004).
4. Keen, Howard, Jr. “The Impact of a Dividend Cut Announcement on Bank SharePrices.” Journal of Bank Research, Winter 1983, pp. 274–281.
For a discussion of capital adequacy standards, their effects, and recent changes, see the following:
5. Peek, Joe, and Eric Rosengren. “Have Borrower Concentration Limits EncouragedBank Consolidation?” New England Economic Review, Federal Reserve Bank of Boston,January/February 1997, pp. 37–47.
6. Wall, Larry D. “Regulation of Bank Equity Capital.” Economic Review, Federal ReserveBank of Atlanta, November 1985, pp. 4–18.
For more information about Basel II and the issues it raises, see especially:
7. Basel Committee on Bank Supervision. International Convergence of Capital Measure-ment and Capital Standards: A Revised Framework. Bank for International Settlements,June 2004.
8. Lopez, Jose A. “What Is Operational Risk?” FRBSF Economic Letter, Federal ReserveBank of San Francisco, no. 2002-02 (January 25, 2002).
9. Lopez, Jose A. “Disclosure as a Supervisory Tool: Pillar 3 of Basel II.” FRBSF EconomicLetter, Federal Reserve Bank of San Francisco, no. 2003-22 (August 1, 2003).
10. Santomero, Anthony M. “Process and Progress in Risk Management.” BusinessReview, Federal Reserve Bank of Philadelphia, First Quarter 2003, pp. 1–5.
11. Emmons, William R., Vahe Lskavyan, and Timothy J. Yeager. “Basel II Will TrickleDown to Community Bankers, Consumers.” Regional Economist, Federal Reserve Bankof St. Louis, April 2005.
For a detailed discussion of U.S. regulation of bank capital, known as PCA (“prompt correctiveaction”), see, in particular:
12. Shibut, Lynn, Tim Critchfield, and Sarah Bohn. “Differentiating among CriticallyUndercapitalized Banks and Thrifts.” FDIC Banking Review 15, no. 2 (2003), pp. 1–38.
To learn more about credit risk modeling for financial firms, see especially:
13. Lopez, Jose A. “Stress Tests: Useful Complements to Financial Risk Models.” FRBSFEconomic Letter, Federal Reserve Bank of San Francisco, no. 2005-14 (June 24, 2005),pp. 1–3.
For further information about Value at Risk (VaR) and what it tells us, see for example:
14. Jorion, Philippe. “How Informative Are Value-at-Risk Disclosures?” The AccountingReview 77 (2003), pp. 911–931, www.edhec-risk.com/site.