FODDER SCARCITY SURVEY TOPICS AND METHODS
34
PARTICIPATORY SITUATION ANALYSIS WITH LIVESTOCK KEEPERS: A GUIDE Czech Conroy 2001 BAIF
-
Upload
khangminh22 -
Category
Documents
-
view
1 -
download
0
Transcript of FODDER SCARCITY SURVEY TOPICS AND METHODS

PARTICIPATORY SITUATION ANALYSIS WITH LIVESTOCK KEEPERS:
A GUIDE
Czech Conroy
2001
BAIF

CONTENTS Foreword Acknowledgements 1. Introduction 2. Social Groups, Livelihood Systems and Livestock 3. Advantages and Benefits of Different Types of Livestock 4. Describing Livestock Production Systems 5. Feeding Systems and Resources 6. Animal Health 7. Collecting More Detailed Production Information 8. Analysis of Constraints, Problems and Opportunities 9. Concluding Comments References
2

Foreword This guide draws heavily on the field experiences of a collaborative project involving BAIF Development Research Foundation and the Natural Resources Institute. The project has been seeking to identify and address feed-related constraints affecting goat production in semi-arid India. The four-year project, which finishes on 31 March 2002, is funded by the Livestock Production Programme1 of the UK’s Department for International Development, whose support we gratefully acknowledge. This guide is intended for use by livestock development practitioners in India and elsewhere: since many field-level staff in India do not speak English the guide is also available in Hindi. A companion guide on participatory technology development with livestock-keepers, including on-farm trials, will also be published in the near future. Copies of this and other reports produced by the project can be obtained by contacting us at the addresses given below. Czech Conroy Dr. A L Joshi Principal Scientist (Socioeconomics) Executive Vice-President Natural Resources Institute BAIF Development Research Foundation University of Greenwich Dr. Manibhai Desai Nagar Central Avenue N.H.No.4 Chatham Maritime Warje Chatham Pune Kent ME4 4TB 411 029 United Kingdom India Email: [email protected] Email:[email protected] Acknowledgements Several BAIF staff have taken part in the field work on which this guide is based, and without their contribution this guide could not have been prepared. They include Mr G Bausar, Mr Chaura, Dr A Jape, Mr Panchal, Mr M Pandya, Dr D Shindey, Mr Shyam Singh Lakhawat, Mr LR Singh, Dr M Sharma, Dr DV Rangnekar, Mrs S. Rangnekar, Mr Rawal and Mr M Vadher. We would also like to thank two other staff of NRI who also contributed to the fieldwork, namely Dr Richard Matthewman and Dr Dannie Romney. Dr Ann Waters-Bayer kindly made some valuable comments on a draft of the report. Last, but not least, we would like to thank all the livestock-keepers who cooperated with us in doing the studies that provided the basis for this report.
1 This document is an output from a project (R6953) funded by the UK Department for International Development (DFID) for the benefit of developing countries. The views expressed are not necessarily those of DFID.
3

1. Introduction This guide is an output from a joint BAIF/NRI goat research project that has been working with agro-pastoralist2 and labour households in parts of semi-arid India. The project’s main focus has been on understanding and addressing seasonal feed scarcity for goats, through a participatory approach. As well as developing suitable technologies with goat-keepers, the project is testing and developing participatory methods. The guide draws heavily on the experience of the BAIF/NRI project, as well as on a few important secondary sources (notably RRA Notes, 1994; Waters-Bayer and Bayer, 1994). There have been several useful publications on participatory rural appraisal (PRA), but most of the material in them relates to crop production, and the application of PRA in livestock development has been relatively neglected in such publications. Although most of the tools of PRA are common to various development sectors, we have found that in livestock development there are certain pitfalls to be avoided, and various ways of enhancing their application, and we wish to share this experience with others. The guide is intended to assist people who are involved in aspects of livestock research and development, such as development NGO staff, animal husbandry extensionists and livestock scientists involved in field-based research. The information collected using the participatory methods described below will provide a sound basis for planning development interventions, or for planning research to develop new technologies to address the priority constraints identified. It will ensure that interventions address priority needs and that the benefits to livestock-keepers are maximised. We assume that the reader is already familiar with the basics of PRA through training and/or practical application in the field. Nevertheless, in this introductory section we briefly re-state certain key points that are sometimes forgotten or overlooked. Participatory methods for analysing situations The general approach used is semi-structured interviews, combined with various visual techniques. These include: • Timelines/historical profiles • Mapping and modelling • Ranking and scoring (showing proportions) • Matrices • Diagrams (such as seasonal calendars and transects). Group discussions are usually used, particularly in the initial stages, because they are an efficient way of obtaining a general picture. Where appropriate, individual interviews and other methods, some formal and quantitative, can subsequently be used to collect more detailed information (see Section 7). Visual techniques are used because they encourage people to get involved in the process, to express the information in a way that is easily intelligible to them, to discuss issues amongst themselves, and to add to, refine and correct this information. When people have made the diagram or map it provides a useful basis for questions and discussion. There may be high
2 The project is working with livestock-keepers who are generally ‘sedentary’ – that is, based in one place: we have not worked with transhumant pastoralists. There are a few participatory techniques that are relevant to pastoralists, but not to agro-pastoralists, for which the reader should consult Waters-Bayer and Bayer (1994) and RRA Notes (1994).
4
levels of illiteracy among disadvantaged groups, especially women. Where this is the case, by utilising symbols, rather than words and numbers, mapping and diagramming make it possible for these people to be involved in the process as much as literate people. Visual techniques are usually categorised as part of the suite of techniques used in PRA. However, PRA is more than a collection of techniques – it is a general approach, whose effectiveness depends heavily on the attitude of its practitioners: it will only work well if they listen to and respect the views of the local people with whom they are working. PRA (and the closely related approach called Rapid Rural Appraisal) has a few basic principles or characteristics. One is that it should be conducted in a relaxed way, not a hurried way. For example, a transect walk should be done in a leisurely fashion, stopping along the route to ask questions about things that are observed, and to ask questions of people encountered. Driving along the route in a jeep is not a transect walk and is not PRA/RRA! A second principle of PRA/RRA is triangulation - which basically means cross-checking information from different sources and using different approaches. The reason for doing this is that without cross-checking there is a danger of producing findings that are not entirely correct. This can be due to: misunderstandings between the survey team and the participants; or only getting part of the picture; or participants deliberately giving false information; or unrepresentative individuals dominating the discussions. An example of triangulation is the collection of information on forage resources in three different ways: through mapping, a transect walk and production of a seasonal feed diagram. The use of triangulation does not guarantee that the information generated will be accurate, but it certainly increases the likelihood that they will be. A third principle of PRA/RRA is optimal ignorance. This means that we only seek information about things that are relevant to our aims, and to the level of detail that we require: we do not collect information that is not relevant, even if we find it interesting personally. One important reason for adopting this principle is that the time of the people we are surveying is precious, and we do not want to waste it. Another important reason is that experience has shown that the collection of large amounts of detailed, quantitative information during the diagnostic or needs assessment phase tends to create problems. Analysis of the data is a lengthy and complicated process that creates a long delay before any technology development work or intervention is implemented, and as a result local people rapidly lose interest and their participation is undermined (Roeleveld, 1996). Direct observation Another important way of learning about various aspects of livestock production is by direct observation. Apart from general casual observation there are a number of specific types of observation that can be adopted. Ones that are specifically related to livestock production include: • village walks that take in the major sources of forage, such as common grazing areas, crop
fields and private wasteland or fallow land; • accompanying the herder(s) for a day; and • types of learning by doing, such as milking animals and feeding them. Getting organised for PRA It is important to be clear about the purpose of any survey work before it is undertaken, so that neither livestock owners’ time nor development workers’ time is wasted. Being clear about the purpose will help to focus the topics to be covered, and may also influence the selection of villages to be covered. One should also be aware that undertaking participatory situation
5

analysis is likely to raise people’s expectations of the development agency bringing material benefits to the community. The purpose of the work should be clearly explained to the community at the outset, so that they do not have false expectations, and so that they have a basis for deciding whether or not they want to become involved. Data collection requires resources – time, money and skilled staff – some of which may be in short supply, so the resources available should also be taken into account before any work is undertaken. Before starting participatory studies full use should be made of any existing sources of information, such as previous surveys of villages in the locality, reports on livestock production that rely more on formal data, and livestock census data. The responsibilities of team members should be identified in advance: at least one member should keep a detailed record of the discussions, and copy maps/diagrams that are produced; while another asks most of the questions and facilitates the discussion. This will enable the information collected to be used to maximum effect, and will avoid duplication in the future. Selection of villages The selection criteria will depend on the purpose of the work to be undertaken. For example, a development agency may want to analyse the situation in all villages in a particular area, because it plans to implement a programme of work in that area. Another common scenario, particularly in research-oriented work, is that the agency wants to cover a representative sample of villages in a district or region, in order to get a reliable overview of certain conditions or practices. Another factor that may be a pre-requisite in some situations is the need to have a good rapport already with the community where the situation analysis is to be undertaken. Trade-offs may be necessary between the extent to which the locations included are representative, and other criteria (need for good rapport, resource costs involved, etc.). A guiding principle is that well-informed choices, based on clear criteria, are always preferable to the selection, by default, of non-representative situations (e.g. adjacent to research stations, major roads, previous projects, or a researcher’s home village) (Conroy et al., 1999). Topics and sequencing This will depend on the purpose of the PRA, and on what is known already. As the term implies, semi-structured discussions should be flexible as to: (a) what they cover, and (b) the sequence in which topics are covered; and they should allow the villagers to influence the topics through some open-ended discussions. Particularly in exploratory PRAs, the survey team should not dominate the discussions and limit the topics covered. The structured aspect concerns the prior identification by the survey team of certain key topics that it would like to cover during the discussions: these are normally noted in a check list that is made available to all team members. One general guideline that follows from the need for flexibility is that the discussions should start off at a fairly general level, and only gradually focus more narrowly on specific topics that the survey team may have identified in advance. For example, one possible sequence would be to: • start with general matters - livelihood systems • move on to livestock production in general for each of the main livestock types found
in the village (production objectives, benefits, marketing, constraints); then • gradually focus more on important issues that have emerged. A more detailed illustrative (and optimistic) schedule is given in Box 1. This process needs to be repeated for each major sub-group (e.g. tribals, scheduled castes, Gujjars).
6

BOX 1 AN ILLUSTRATIVE SURVEY SCHEDULE WITH A FOCUS ON FORAGE Day 1 Livelihood Systems * Introduction * Identify and rank activities making up the livelihood systems (matrix ranking) * Seasonality of activities, labour and cash flow (seasonal diagram) * Identify and analyse long-term trends affecting people’s livelihoods (timeline) * Daily schedule of activities for men and women, including goat-keeping (Activity schedule) Day 2 Livestock Production System, Benefits and Constraints * Historical trends in livestock ownership (Timeline) * Benefits/reasons for keeping small and large ruminants (SRs and LRs) (Matrix Ranking) * Production constraints for SRs and LRs (Ranking) * Goat production system over a year - showing feed resources, breeding and kidding seasons, disease and marketing times (Seasonal calendar) Day 3 Forage Resource Mapping and Transect * Forage Resource Map (Participatory Mapping) - Current (and Historical?) * 2 Dry season forage maps - for an average year and a drought year (showing: (a) tree tenure - owners’ trees, communal, & purchased lopping rights; (b) typical daily herding route.) * Transect Walk, visiting key forage resource points Day 4 Feeding Systems and Seasonality * Dry Season Diagram - showing feed types by month * Discussion about whether or not there is a goat feed problem - and its precise nature. * Discussion about what happens to goats in the dry season (Average and Severe) - liveweight gain, milk production, herding time etc. * Coping strategy in Average and Severe Years (e.g. distress sales, longer distance migration) * Preliminary Discussion of Possible Interventions/Solutions (if there is a scarcity problem).
7

2 Social Groups, Livelihood Systems and Livestock 2.1 Identifying different sub-groups and production systems Different socio-economic groups may have different livelihood systems, and hence different livestock systems; and different livestock systems may have differing constraints and may require different interventions to remove those constraints. Thus, the identification of different sub-groups should be one of the first activities of any situation analysis; and the analysis of various aspects of livestock production will need to be undertaken separately with each sub-group. Even within one village there may be several sub-groups with quite distinctive livelihood systems. Important influences on livelihood systems include caste and ethnic group, wealth and size and quality of landholding. For example, one sub-group may be landless and may depend primarily on wage labour for their survival; while another may be farmers who do little, if any, wage labour. The principal criteria for determining sub-groups will vary from village to village, and region to region. Wealth-ranking Wealth ranking is a tool by which sub-groups within a community can be differentiated in economic terms. Only a brief description is given here, and other references should be consulted for detailed guidance on how to do it (e.g. Grandin, 1988). The first stage of wealth-ranking involves members of the community identifying those criteria that they consider to be most important and relevant for this purpose, and identifying a number of wealth categories on the basis of them. (One way of doing this is described in Box 2.1 below.) The second stage involves getting 2-3 members to place all households in the community into the appropriate category. An example of wealth categories and criteria identified in one wealth-ranking exercise is given in Table 2.1. Wealth can be a sensitive subject, and this kind of exercise needs to be handled tactfully, particularly the second stage. Table 2.1 Wealth Categories among Tribals in Naganwat Chotti, Jhabua District,
Madhya Pradesh Category No. of
households Characteristics
Very poor
3 They have 2 acres of land, no bullocks and food grains llast up to 2 months. Families are dependent on migration, and have to abandon property, leading to degradation of private land.
Poor 22 They have up to 3 acres of land, food grains for up to 4 months, and they have insufficient bullocks for ploughing. Most members of the household migrate for up to 6-8 months. They have no silver ornaments, and it is difficult for them to buy a wife.
Medium 30 They have up to 6 acres of land, and food grains for up to 10 months. They have 2 bullocks and men migrate for 2-3 months/year.
Better off 9 They have food grains for the whole year and sufficient bullocks. They can easily get money from money lenders and save the money that they earn when they migrate.
Source: Turton et al. (1996) It is not always necessary to do the second stage of wealth-ranking. It may be sufficient to identify the categories, and then to say that you want to have separate meetings with a few people belonging to each category. When you have the meetings you can ask the individuals present for the relevant information, to check that they do belong to that group.
8
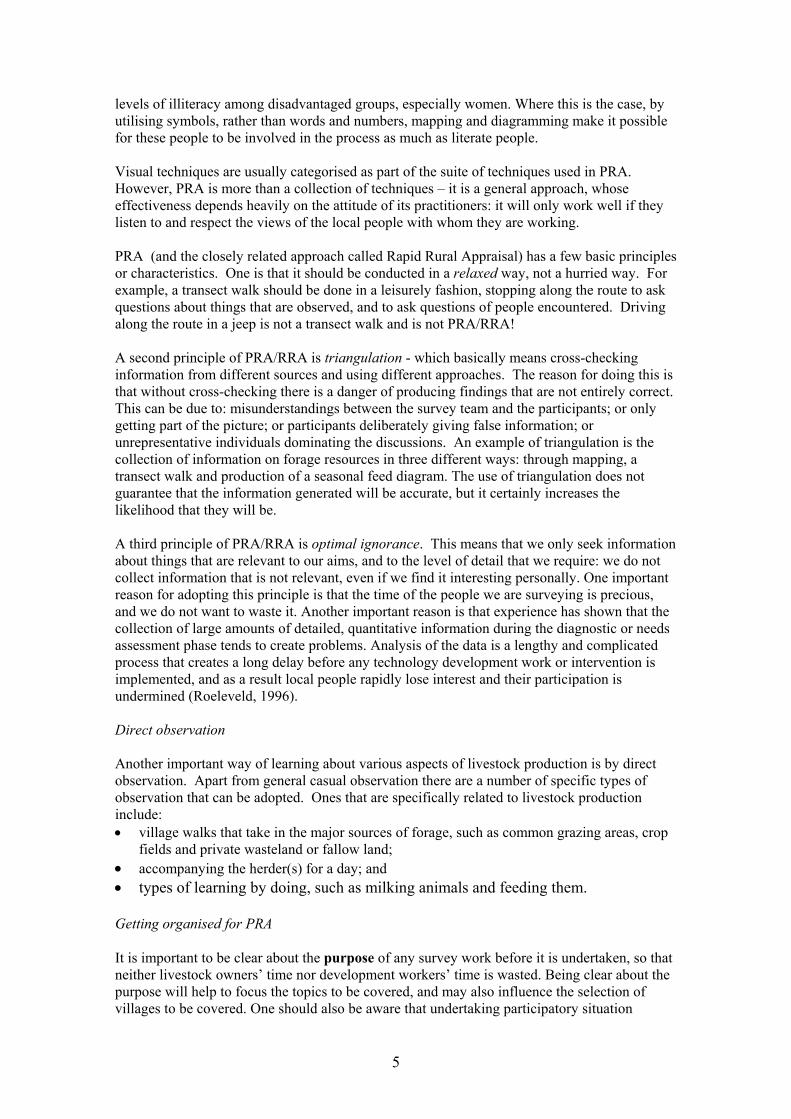
BOX 2.1 Eliciting Information about Wealth Categories This box describes one way of getting a general overview of the proportions of households in different wealth categories, and the characteristics of these households in the views of local people, that is both easy and fun. Sit with a group of villagers and make a big pile of beans, each of which should represent a household in the village. Then divide the pile into, say, three smaller piles, calling them "rich", "medium" and "poor" households, and putting most of the beans in the "rich" pile. The people in the group will soon correct you and start moving the beans around to make the piles closer in size to "reality" (at least the reality they want to convey to you). This process will generate discussions about what makes the households in one pile different from those in another – for example, the participants might tell you that the people in the ‘poor’ pile have few or no livestock. In one case in Sudan, the villagers decided to divide the poor pile into two piles, one of which was the ‘very poor’. This group had no livestock whatsoever, whereas the ‘poor’ had some goats. Source: Ann Waters-Bayer, personal communication. Social mapping Social mapping is widely used for identifying all of the households belonging to a particular hamlet or village, and the various castes found there. The livestock owned by each household can also be shown on the map: this will enable the survey team to get an overview of the pattern of livestock ownership in the village, and to see whether there is a relationship between this and caste. If the relationship between the survey team and the community is not conducive to wealth-ranking (e.g. if community members are suspicious about your intentions), social mapping can be a less sensitive alternative approach to identifying sub-groups. Information about livestock and land ownership (if the latter is not too sensitive) may provide a reasonable basis for this. 2.2 Working with women Women often play a lead role in livestock-keeping, particularly in the case of smallstock, such as goats and scavenging poultry. Where this is the case, it clearly makes sense to do the PRA work with them, as they will be more knowledgeable than men. At other times it may be desirable to work with both women and men (although preferably in separate groups), so that any differences in views and priorities can be identified. When working with women, the survey team should include a female member if possible. If there is no woman in the team, it may still be possible to obtain some basic, factual information; but discussions about possible interventions may be difficult to facilitate. Gender division of labour A daily activity schedule (see section 2.4) will provide some insight into this, and so will direct observation. Group discussions specifically on this subject are also useful, since some activities, like marketing and disease control, may only happen at certain times of the year. It is important to discuss this with men and women separately - to avoid men dominating the discussion, and because men and women’s views on how tasks are divided between them sometimes differ a little. The gender division of labour should be discussed at an early stage, as this may have implications as to whether further discussions on particular topics should be with men or women. Gender differences in the ranking of constraints The different responsibilities of men and women in livestock production are liable to affect their perceptions of what are the main
9

production constraints or problems. This is illustrated by the following table. In this village, the men were responsible for disease management, while the women were responsible for collecting drinking water from the village well and carrying it back to the home for the goats. Table 2.2 Gender Differences in the Ranking of Constraints on Goat Production in
Kumbhan village, Bhavnagar District, Gujarat - Scheduled Castes Rank Men Women 1 Disease Water scarcity 2 Forage scarcity 2.4 Describing and analysing livelihood systems A livelihood comprises the capabilities, assets (including both material and social resources) and activities required for a means of living. People’s livelihood systems can determine whether they get involved in keeping animals, the types of animals they keep, the ways in which they look after them, and the constraints on livestock production that they face. This is why it is important to obtain a good understanding of what their livelihood systems are. These linkages are illustrated by the examples given in Box 2.2. BOX 2.2 THREE EXAMPLES OF LIVELIHOOD AND GOAT -KEEPING SYSTEMS Smallholder agro-pastoral systems These systems can be subdivided into those of small ruminant specialists and non-specialists. In South Rajasthan, there are many tribal people, who are non-specialists, who sometimes live in the same village as specialist castes (mainly Gujjars or Gayris). What they have in common is that the feed resources include: crop residues from their own land; forage from their private wasteland; and forage from common lands. Specialists have larger herds, comprising mainly sheep, with flocks of 50-150, which are kept for their meat and wool; but also some goats. They tend to be more self-sufficient in feed resources; and the animals are herded by adult males. Non-specialists keep goats rather than sheep: they have smaller landholdings and hence depend more on common grazing lands around the village, where the goats are herded by children or women. Adult non-specialists are often involved in seasonal migration for wage labour, which may be a constraint on the numbers and types of animals that can be kept. Landless wage-labourer system In Bhavnagar District, Gujarat, some of the scheduled caste goat-keepers are landless and their livelihoods depend primarily on wage labour, usually by both adult males and females. Most wage labour is agricultural labour, and there are about four months in the year when there is little, if any, available. These households keep 1-4 breeding does. The feeding system is a combination of stall-feeding, with forage collected in the fields where they work or on their way home, and some herding by old family members or children. Families who do not have any members available for herding tend to pay the livestock specialists, Rabaris, to do the herding for them. Milk for subsistence use is the main product, and people of higher castes would not want to purchase milk from them anyway (social stigma). Marginal/landless livestock specialist In Bhavnagar, the Rabaris are the specialist livestock caste. They tend to be landless, or only own a small amount of land, which may be of poor quality: at certain times of the year some of them do wage labour. Their livestock include goats, herds of 30-50 being common, and large ruminants. They spend most of their time
10

herding their animals. Being landless, they graze them primarily on common lands and on other people’s agricultural fields after harvesting. Nearly all of their income comes from livestock production: milk production is the major source of revenue, with some income also from the sale of manure and the occasional animal sale. Assets People may have, or have access to, various kinds of assets. Five general types of capital assets have been identified, namely: natural, social, human, physical and financial. These are briefly described in Box 2.3. Natural capital includes forage and water resources, so there tends to be a relationship between the natural capital assets to which people have access and their ownership of livestock. Livestock themselves are assets: they could be natural, physical or financial capital. For example, a cow is a form of natural capital, from which milk is derived; a bullock is part of the equipment used for land preparation and transporting goods; and a goat that is kept as a ‘savings bank’ is a form of financial capital. Enterprises/activities To understand fully the contribution that livestock make to people’s livelihoods we need to know what people’s livelihood systems are. Livelihood systems include a number of activities or enterprises, each of which may produce benefits in terms of cash and/or subsistence products. We need to know what these activities are, and to get an idea of their relative importance. Common types of activities in rural areas are crop production, animal husbandry, wage labour, collection and marketing of forest products and various non-farm activities (e.g. barber, locksmith). It may be useful to disaggregate wage labour into agricultural and non-agricultural (such as house construction, or working in a mine or quarry). It is also important to know whether there is seasonal migration for work, as this may have significant implications for livestock-keeping. BOX 2.3 TYPES OF CAPITAL Natural capital The natural resource stocks from which resource flows useful for livelihoods are derived (e.g. land, water, wildlife, biodiversity, environmental resources) Social capital The social resources (networks, membership of groups, relationships of trust, access to wider institutions of society) upon which people draw in pursuit of livelihoods. Human capital The skills, knowledge, ability to labour, and good health important to the ability to pursue different livelihood strategies. Physical capital The basic infrastructure (transport, shelter, water, energy and communications) and the production equipment and means which enable people to pursue their livelihoods. Financial capital The financial resources which are available to people (whether savings, supplies of credit or regular remittances or pensions) and which provide them with different livelihood options.
11
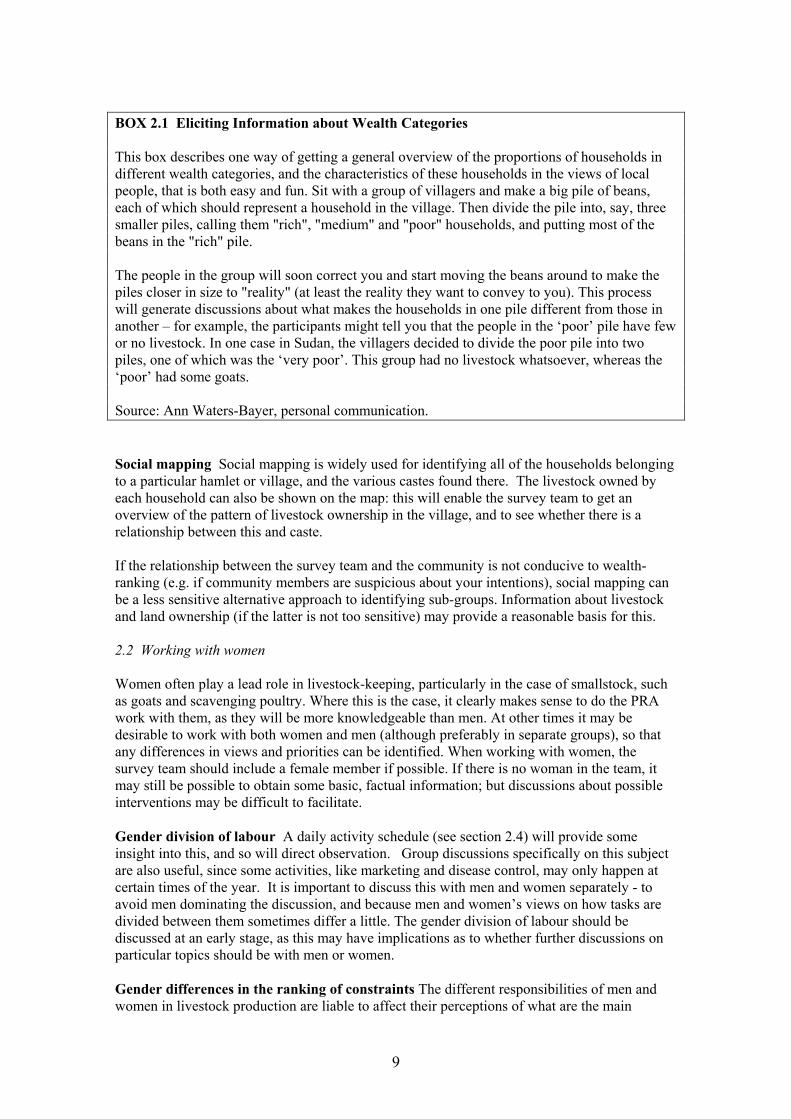
Matrix scoring and ranking is a useful tool for assessing the relative importance of different activities in people’s livelihoods, and for obtaining an indication of the importance of livestock. Once the main activities have been identified, participants should be asked what criteria (the column headings in the matrix below are examples of criteria3) they think are important when making comparisons between them. When these have been agreed, the activities can be compared and scored, and then ranked in importance through matrix scoring and ranking. Figure 2.1 Scoring and Ranking of Livelihood Activities Enterprise Income Food Other subsistence
products Total score Overall
rank Crop production 3 5 1 9 1 Animal husbandry
1 2 1 4 4
Wage labour (non-agriculture)
5 0 0 5 2
Forest products 2 1 3 6 3
A hypothetical example of this is given in Figure 2.1. Scoring is on a scale of 0 to 5 (maximum). It should be noted that the total scores for each enterprise will not necessarily correspond with the rankings. This is because different criteria may have different weights (importance) in the minds of the participants. In this example, wage labour is ranked more highly than forest products, despite having a slightly lower total score, because income is considered more important than other subsistence products. Seasonality of activities, labour and cash (income and expenditure) This can best be explored through the construction of a seasonal calendar, showing: when the various activities are undertaken during the year; peaks and troughs in labour demand; and peaks and troughs in income and expenditure. (See Figure 4.2 for a calendar that looks at income.) When discussing labour try and clarify who does what, so that a general idea is obtained of the gender and age division of labour. Construction of a seasonal calendar can be time-consuming, but is worthwhile. The information about labour and cash should help to identify when the use of these factors of production is most constrained, and will thus give an indication of when different types of intervention (capital-intensive or labour-intensive ones) are likely to be most and least feasible. Daily activity schedule/profile Livelihood systems can also be usefully looked at in relation to people’s daily cycle of activities. This can be done by asking men and women (separately) to construct a daily activity schedule, showing what they do during the course of a normal day, from the time they get up to the time they go to bed. Daily activity schedules are another way of obtaining information about the gender division of labour. It is advisable to construct at least one schedule for each season, since the daily pattern of activity may vary substantially over the course of a year. Livestock-
3 Other criteria that people sometimes use include: enterprise available most of the year; and flexibility (work can easily be fitted in around other activities).
12
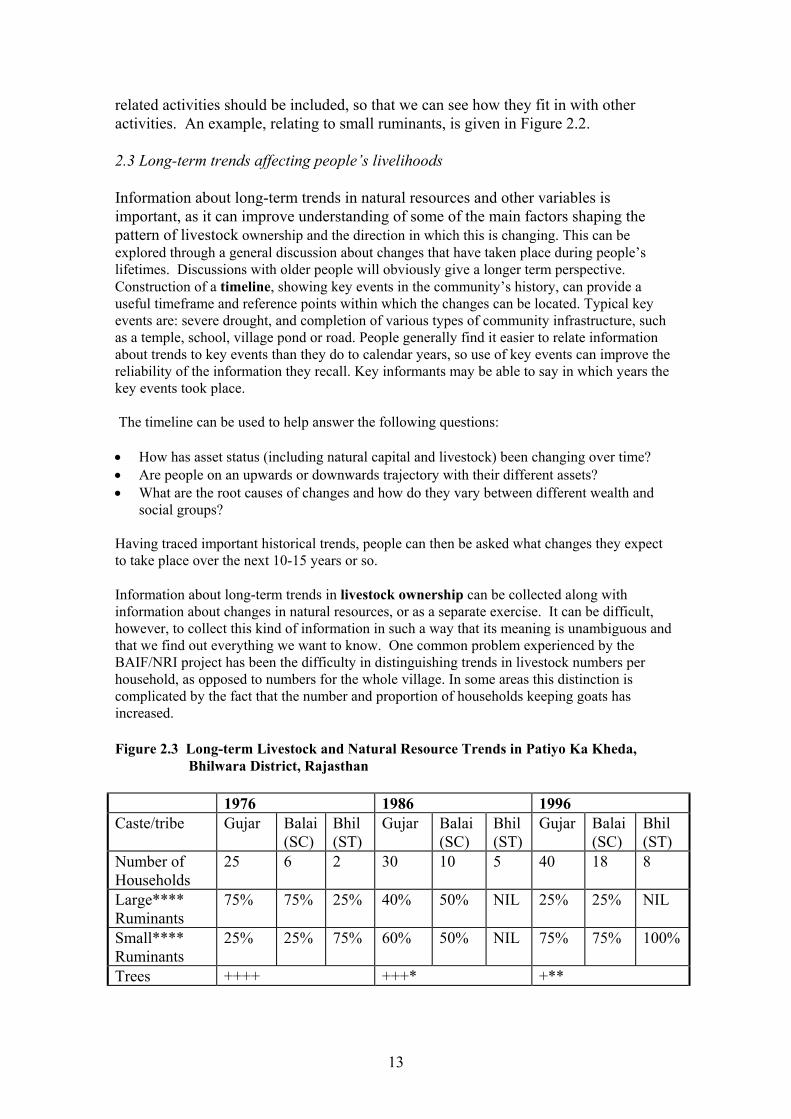
related activities should be included, so that we can see how they fit in with other activities. An example, relating to small ruminants, is given in Figure 2.2. 2.3 Long-term trends affecting people’s livelihoods Information about long-term trends in natural resources and other variables is important, as it can improve understanding of some of the main factors shaping the pattern of livestock ownership and the direction in which this is changing. This can be explored through a general discussion about changes that have taken place during people’s lifetimes. Discussions with older people will obviously give a longer term perspective. Construction of a timeline, showing key events in the community’s history, can provide a useful timeframe and reference points within which the changes can be located. Typical key events are: severe drought, and completion of various types of community infrastructure, such as a temple, school, village pond or road. People generally find it easier to relate information about trends to key events than they do to calendar years, so use of key events can improve the reliability of the information they recall. Key informants may be able to say in which years the key events took place. The timeline can be used to help answer the following questions: • How has asset status (including natural capital and livestock) been changing over time? • Are people on an upwards or downwards trajectory with their different assets? • What are the root causes of changes and how do they vary between different wealth and
social groups? Having traced important historical trends, people can then be asked what changes they expect to take place over the next 10-15 years or so. Information about long-term trends in livestock ownership can be collected along with information about changes in natural resources, or as a separate exercise. It can be difficult, however, to collect this kind of information in such a way that its meaning is unambiguous and that we find out everything we want to know. One common problem experienced by the BAIF/NRI project has been the difficulty in distinguishing trends in livestock numbers per household, as opposed to numbers for the whole village. In some areas this distinction is complicated by the fact that the number and proportion of households keeping goats has increased. Figure 2.3 Long-term Livestock and Natural Resource Trends in Patiyo Ka Kheda,
Bhilwara District, Rajasthan 1976 1986 1996 Caste/tribe Gujar Balai
(SC) Bhil (ST)
Gujar Balai (SC)
Bhil (ST)
Gujar
Balai (SC)
Bhil (ST)
Number of Households
25 6 2 30 10 5 40 18 8
Large**** Ruminants
75% 75% 25% 40% 50% NIL 25% 25% NIL
Small**** Ruminants
25% 25% 75% 60% 50% NIL 75% 75% 100%
Trees ++++ +++* +**
13

Farm Size (ha)
7 1 1 3.5 0.5 0.5 1 1*** 1***
* One reason given for this decline was increased demand for timber for building ** Further decline was because of the use of trees for fuel wood *** Balai and Bhil farm sizes increased because Government land was redistributed to them **** The livestock figures refer to the percentages of large small ruminants per household. Figure 2.3 summarises one attempt to obtain data on long-term trends in livestock ownership and two other types of natural capital, farms and trees. Its strengths are that it gives data that is unambiguously on a per household basis, and it distinguishes between different socio-economic groups. Its weakness is that all the data are percentages, so we do not know how total numbers of livestock have changed, nor whether the changes in percentages are due to small ruminant ownership increasing or large ruminant ownership decreasing. To get a more precise and accurate picture of livestock population trends it may be necessary to conduct individual interviews with one or more members of each household. 3 Livestock-Keeping – Reasons and Benefits The keeping of livestock can contribute to people’s livelihoods in several ways. They can be: • a source of cash income • one of the few assets available to the poor and women • a central component of farming systems (draught power and manure) • a means of allowing the poor to capture private benefits from common property resources • a source of livelihood security, by diversifying risk and buffering crop yields, particularly
in drought-prone environments • a source of food, transport, fuel, access to social support networks, cultural well-being and
a variety of other functions (Livestock and Development, 1999). Matrix scoring is a very useful tool for exploring the advantages of keeping different types of livestock and the benefits they provide. 3.1 Tangible benefits Matrix scoring is a useful technique for generating quantitative information about the benefits, and relative importance, of keeping different types of livestock: it is one which people enjoy using. Livestock-keepers are asked to construct a matrix or table on the ground, with one column for each type of livestock that is widely owned by their group, and one row for each of the kinds of benefits that livestock may provide. It is important to have a good discussion about these things before the matrix is made, so that no benefits are overlooked. Each benefit is illustrated by a symbol (e.g. a jug or drink container for milk, or a piece of dung for manure), as is each type of livestock (these are usually depicted through drawings using ash or coloured powders). Scoring involves indicating the relative importance of each benefit for each type of livestock. For example, people might show that 50% of the benefits provided by goats takes the form of sales, 30% milk and 20% manure; whereas for bullocks 80% of the benefits might be from animal traction (ploughing etc.) and 20% from manure. In many parts of India people do not think in terms of percentages, but they can express
14

proportions or fractions in terms of Anas4. The same approach can be used, allocating 16 Anas for each livestock type between the various benefits that it provides. An example of matrix scoring of benefits is given in Figure 3.1. Figure 3.1 Matrix Scoring of Livestock Product Benefits by Tribals in Khakad, Udaipur (Anas) Benefits Buffalo Cow Bullock Goat Poultry Manure 2 3 2 1 Milk 4 2 2 Ghee 5 2 1 Income 4 8 8 8 Meat 1(home consumption)
1 8
Draught power
13
Leather 1 1 1 1 Liquid asset2 2 1 In some areas/societies, there is a custom that goat-keepers do not consume their own goats. Thus, the score given to meat may need to be interpreted carefully. 2 Since this is not a tangible product, goat-keepers may not identify it without prompting. In this example, they were deliberately prompted by the survey team, who wanted to know the relative importance of sales to meet contingencies versus sales to maximise net income. 3.2 Advantages of different types of livestock Matrix scoring of material benefits, as illustrated in Figure 3.1, does not give a complete perspective on why people are keeping different types of livestock. It is also useful to ask people about the advantages of different types of livestock. This line of questioning reveals other important factors, such as: ease of milking, ease of sale, and ability to survive a severe dry season. For two examples, see Figures 3.2 and 3.3 below (source: ISPA Bulletin). Figure 3.2 Livestock Species Ranking, Sheep and Goats
Farmers’ SCORE Criteria Goat Sheep
Require less grazing land ********* ** Diseases are less ******** ***** Ability to produce young ****** ***** Market demand ****** ****** TOTAL 29 18 This scoring/ranking exercise was done in Anmaspally in Andhra Pradesh. The reason shepherds ranked goats more favourably than sheep in grazing land requirement is that Anmaspally is a forest area with plenty of browse trees, and is therefore more suitable 4 In the old Indian currency one Rupee was comprised of 16 Anas: thus, 8 Anas is equivalent to 50 percent, etc.
15

for goats. The availability of browse in good quantity made goats healthier and more disease-resistant than sheep in their situation. Figure 3.3 Livestock Species Ranking, Cows and Buffalos Farmers’ Criteria Buffalo Cross-
bred cow Local cow
Utilisation of straws 7 4 6 Milk price 8 5 5 Disease problems 7 3 6 Milk production 4 6 1 Produces bullocks 1 3 9 TOTAL 27 21 27 4. Describing the Livestock Production System 4.1 Seasonal dimensions of the production system A general livestock production calendar can give a very useful overview of some key aspects of a livestock production system. It can be used to show breeding and kidding seasons, the temporal distribution of disease, marketing times and the utilisation of feed resources (in general terms). Different calendars can be produced for each major type of livestock. It is best to show the information on a monthly basis, not just by season, as this gives a more detailed and informative picture. The seasons should be illustrated through the use of symbols, so that illiterate people can easily contribute to the preparation of the calendar. If the people identify three seasons, then four columns can be made under each season to indicate months. It is also advisable to show festivals on the calendar, so that everyone is clear when a season starts or ends. Different sub-groups may have different ideas about this (for example, one group may regard Holi as coming towards the end of the winter season, while another thinks it comes at the start of the summer season). Clearly, if this is not done it may appear that there are major differences between the calendars of different groups, even though there are not. The use of a seasonal calendar like this can reveal patterns and possible inter-relationships. For example, seasonal calendars constructed in Udaipur villages revealed that most disease occurs at the start of the rainy season, and this suggested that there might be a link between weakness due to feed scarcity in the dry season and susceptibility to disease. Figure 4.1 is an example of a goat production calendar.
16

The seasonal production calendar provides a basis for questions and discussion. Any apparent contradictions should be clarified. For example, ‘you have shown goat kidding as occurring four months after kidding, but the gestation period is five months – can you clarify this, please?’ Issues like breeding and marketing of livestock or their products can be explored. Why does breeding take place at this time? Is breeding time controlled, or does the availability of a particular feed trigger oestrus? 4.2 Sale of livestock products, marketing and income The production calendar can provide a basis for discussing questions like: • Why does marketing take place at these times? • Are these preferred times because of prices being higher, or are some of the sales
‘distress sales’? • To whom do you sell your goats, and for what sort of price? Seasonal calendars can be used to describe how prices of livestock and their products vary during the year. If small ruminant keepers are selling their animals to traders they may not know much about the ultimate destination of their animals, which could be in a major city a few hundred kilometres away. To gain an understanding of the marketing system, it may be necessary, therefore, to talk to traders, butchers and other key informants. Where livestock are producing multiple marketed products that vary seasonally, it may also be useful to produce a seasonal product calendar. Figure 4.2 is one example, which was prepared by Rabari women, and which was used to analyse seasonality of income for Rabaris. Milk production was shown per animal, in percentage terms, since different households represented in the group had different numbers of animals. The vast majority of the milk is sold, so the quantity produced is synonymous with income. The women said that cash was scarcest in late summer, when milk production has fallen to a low level. During the rainy season they earn money from agricultural labour, which helps them cope with the fact that income from sale of animal products is lowest at that time. Figure 4.2 Rabari Women Seasonal Livestock Product and Income Calendar Percent milk production
WINTER SUMMER RAINY SEASON
10 8 8 8 8 8 20 8 8 8 30 8 8 8 40 8 8 8 50 8 8 60 8 8 70 8 8 80 8 8 90 8
17
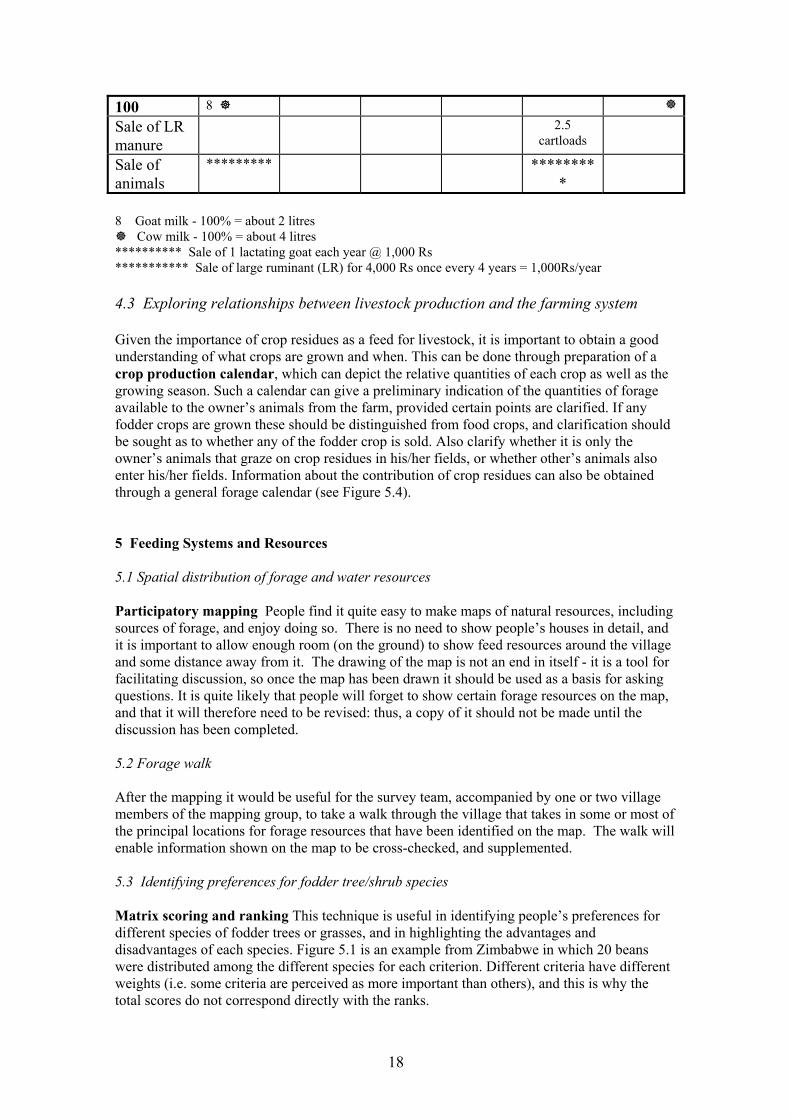
100 8 Sale of LR manure
2.5 cartloads
Sale of animals
********* *********
8 Goat milk - 100% = about 2 litres
Cow milk - 100% = about 4 litres ********** Sale of 1 lactating goat each year @ 1,000 Rs *********** Sale of large ruminant (LR) for 4,000 Rs once every 4 years = 1,000Rs/year 4.3 Exploring relationships between livestock production and the farming system Given the importance of crop residues as a feed for livestock, it is important to obtain a good understanding of what crops are grown and when. This can be done through preparation of a crop production calendar, which can depict the relative quantities of each crop as well as the growing season. Such a calendar can give a preliminary indication of the quantities of forage available to the owner’s animals from the farm, provided certain points are clarified. If any fodder crops are grown these should be distinguished from food crops, and clarification should be sought as to whether any of the fodder crop is sold. Also clarify whether it is only the owner’s animals that graze on crop residues in his/her fields, or whether other’s animals also enter his/her fields. Information about the contribution of crop residues can also be obtained through a general forage calendar (see Figure 5.4). 5 Feeding Systems and Resources 5.1 Spatial distribution of forage and water resources Participatory mapping People find it quite easy to make maps of natural resources, including sources of forage, and enjoy doing so. There is no need to show people’s houses in detail, and it is important to allow enough room (on the ground) to show feed resources around the village and some distance away from it. The drawing of the map is not an end in itself - it is a tool for facilitating discussion, so once the map has been drawn it should be used as a basis for asking questions. It is quite likely that people will forget to show certain forage resources on the map, and that it will therefore need to be revised: thus, a copy of it should not be made until the discussion has been completed. 5.2 Forage walk After the mapping it would be useful for the survey team, accompanied by one or two village members of the mapping group, to take a walk through the village that takes in some or most of the principal locations for forage resources that have been identified on the map. The walk will enable information shown on the map to be cross-checked, and supplemented. 5.3 Identifying preferences for fodder tree/shrub species Matrix scoring and ranking This technique is useful in identifying people’s preferences for different species of fodder trees or grasses, and in highlighting the advantages and disadvantages of each species. Figure 5.1 is an example from Zimbabwe in which 20 beans were distributed among the different species for each criterion. Different criteria have different weights (i.e. some criteria are perceived as more important than others), and this is why the total scores do not correspond directly with the ranks.
18

Additional trees Most trees are multi-purpose as far as rural people are concerned, so their preferences may be influenced by other criteria, apart from fodder-related ones. Furthermore, for project planning purposes a development agency may want to know what additional trees people would like to have, which may be different from their most preferred species. They may, for example, have a relative abundance of the latter, but a shortage of another species that has a particular fodder or other value (e.g. providing fodder at the time of greatest scarcity). These issues can be explored by asking people about their preferences for additional trees/shrubs. Figure 5.1 An Example of Matrix Scoring and Ranking of Fodder Trees SPECIES Trait/criterion Mupane Mubhondo Mupanda Mususu Mipwezha Early shooting of leaves
7 4 5 2 2
Dry leaves can be eaten
1 - - 19 -
Good taste/salty 7 4 5 2 2 High water content
- - 13 - 7
Total score 15 8 23 23 11 Overall rank 1 4 3 2 5 Source: Scoones, RRA Notes, 1994. If they could have 50 or 100 more trees/shrubs, which species would they prefer? Why? What are their criteria? This line of discussion can be useful in indirectly finding out whether feed scarcity is important, by seeing whether the capacity of a species to provide forage at a particular time of the year is one of the criteria used. 5.4 Feeding systems and seasonality Seasonal feed calendars These can show (a) general types of feed or (b) sources of feed, and the proportions of each that are used in each month5. This kind of information can also be incorporated into a general seasonal production calendar. The advantage of this is that it makes it easier to identify possible relationships between feeding systems and other aspects of production. The potential disadvantage is that it may make the diagram rather difficult to understand – partly because percentages (or Anas) are allocated by column for feed types (see Figure 5.2), whereas in the production calendar they are allocated by row (see Figure 4.1). An example of a feed source calendar is given in Figure 5.2, in which the SCs have allocated 16 Anas in each month between the different sources of feed. These diagrams, like any others, should be discussed with the goat-keepers, and anything that is puzzling or unclear should be clarified. Footnotes can be added, giving additional information, as in this example. Alternatively, this information can be incorporated 5 Be careful not to confuse seasonal availability of forage and seasonal use of forage. Information about use is generally more useful.
19

into the general text of the survey report in which the diagrams appear. It is important to bear in mind that the most appropriate and meaningful categories may vary from one village to another, or from one socio-economic group to another. Goat-keepers in Rajasthan said that they find this kind of feed diagram useful, as it enabled them to take a systematic look at how their feeding systems change over a year, and made them more aware of how significant purchased feeds become at certain times. They resolved to take steps to reduce the amount of purchased feed required. Another kind of seasonal feed diagram is that which shows particular types of forage and the seasons or months6 of the year when each is used: an example is given in Figure 5.3. The species can be illustrated by collecting samples of their stalks, leaves, pods etc. It is important to remember that materials for some species may not be easily available when the calendar is being prepared: rather than omit the species from the diagram, another way should be found to represent it7. It is probably best to start with a general feed diagram; and then move on to individual forage species and types of supplement, either in a new diagram or by extending the first one. Figure 5.4 is a hybrid calendar, in that it contains information about types of forage and sources. Figure 5.3 Species-based Seasonal Feed Calendar from Bhilwara District, Rajasthan Winter
(November-March) Summer (April-June)
Monsoon (July-October)
Arunjia (A. leucophloea) Neem (Azadirachta indica) Ber (Zizyphus mauritiana) Cotton leaves (Gossypium spp.) Desi babul (A. nilotica) Thor (Cactus, Opuntia spp.) (chopped) (buds) Bordi (dry leaves of Z. nummularia)
Groundnut hay Lucerne Khejri (Prosopis cineraria) Fresh grass Concentrate Once information has been assembled about the various forage resources used during the year, this can be related to the owners’ livestock production objectives and used to identify when feed scarcity occurs. A distinction should be made between overall scarcity (i.e. insufficient quantity) and a shortage of high quality feeds.
6 A calendar based on months, rather than seasons, is preferable, as it should show whether there are any particular months within a season when scarcity is more acute. 7 One seasonal diagram constructed in Kirat village, Udaipur District, appeared to be showing June as the month of greatest scarcity, yet the seasonal production calendar had shown June as the time when breeding started. When the villagers were asked to explain this discrepancy it turned out that the species thought to trigger oestrus had been omitted from the diagram because there was no vegetative material available to illustrate it.
20

People, particularly those who are illiterate, tend to find it more difficult to draw seasonal diagrams than to draw maps. This is probably partly because the kind of diagrams usually found in the PRA literature are largely a product of western culture and concepts. However, one approach that works well is to ask people to show the seasons and major festivals (using symbols), and to draw one column for each month. Thus, if there are three seasons of equal length, there will be four columns under each season. It is also helpful to: (a) start discussions about feeding systems with the forage resource mapping to get people thinking about this; and (b) give people time to think about how they would like to illustrate principal feeds during a year – for example, by leaving preparation of a calendar until the following day. Forage resource maps and seasonality The issue of seasonal dimensions of feeding systems can also be explored during mapping exercises, referring to the map; and ways of coping with scarcity, if they experience it. When referring to the dry season, it can be useful to distinguish between years of typical rainfall and drought years, as livestock-keepers may modify their feeding systems in a drought year. It is helpful to focus on specific years - for example, by asking: - where (on the map) did you get your feed from in the last dry season (this year); - where did you get it from in the last severe dry season? - what happened to your livestock (specify which type) in the last severe dry season? It may be worthwhile making a new map for a drought year, as people may be forced to take their animals further away from their village than they normally would, and the more distant resources may not be shown on the initial map. People who normally stay in their village all year round sometimes migrate in a drought year, as is illustrated by the following two examples from Bhilwara District, Rajasthan. In a drought year, some Gujjars there leave their village in September/October and take their large herds of animals (mainly sheep) to parts of Madhya Pradesh, not returning until the following June. People with smaller flocks of goat sometimes migrate shorter distances for shorter periods in a drought year – for example, spending 4-6 weeks in places 10-20 kms away where there are concentrations of Acacia nilotica, which produces nutritious pods around April. 6 Animal Health 6.1 Body maps Livestock-keepers may have their own local names for particular diseases, and outsiders may not be familiar with these. In this situation it is useful for the owners to draw the animal’s body and indicate on it where visible symptoms are found. Using this and other information, members of the survey team will often be able to clarify what the disease is. 6.2 Seasonality of diseases
21

A preliminary indication of this may have been obtained already in a livestock production calendar. A more detailed description, showing different types of disease, can be captured in a disease calendar. The calendar should have a different row for each kind of disease, and may also distinguish between diseases that simply lower productivity and those that tend to result in the death of the animal. Several diseases are associated with the rainy season(s), so it may also be useful to illustrate the distribution of rainfall on the calendar. It is likely that some diseases will be present every year, while others are irregular, so the calendar or the discussion based on it will need to clarify the occurrence of each disease. 6.3 Production practices and disease The prevalence of various diseases, or the susceptibility of the animals to them, may be affected by some of the livestock-keepers’ production practices. It is helpful, therefore, to discuss potentially relevant factors, such as housing conditions and water sources, and to observe them where possible. 7 Collecting More Detailed Production Information Virtually all of the survey methods described so far are based on exercises involving groups of livestock-keepers. They have the advantage of providing a general picture relatively quickly, as compared with discussions with many individuals. Once the general picture has been obtained, and one or more critical issues identified, it may be desirable to obtain more detailed information, and this may require discussions with individual livestock keepers. As with villages (see section 1) careful consideration should be given to the basis on which people will be selected, particularly where it is desirable to have a representative sample. 7.1 Participatory herd histories The BAIF/NRI project has developed a way of collecting detailed livestock production information that we call the “participatory herd history” method. It involves making an inventory of the current herd, and working backwards over 1-2 years to document what changes to the herd have taken place and when, either in terms of acquisitions or removals. (In the case of small herds of goats, the owner’s recall appears to become increasingly unreliable after 1-2 years.) Thus, it provides information about births, deaths, slaughter, sales, purchases, abortions and stillbirths. It can be used to investigate various issues, some of which are described in Box 7.1. The survey team (or livestock-keepers themselves) prepares a set of cards for the species being studied, each of which represents one animal. It helps if large cards are used for adults, and small cards for young animals: sometimes an intermediate size might also be appropriate. Each card has a picture of the animal drawn on it, and the pictures of adults indicate their sex. A calendar, covering one or two years up to the present, is constructed on the ground, showing the seasons, months and important festivals. Several rows are made below the temporal headings, using sticks, cereal stalks, etc. - or chalk if the diagram is on a stone
22

floor (see Figure 7.1). The livestock-keeper is asked: how many goats (s)he has in her herd; how many of these are kids and how many adults; and the sex of the adults. (S)he is then asked to select cards to represent each of the animals, and to lay these out in a column, at the end of the calendar, corresponding to the current point in time. To facilitate recall, each animal is referred to by its name, if they have names. Having done this, (s)he is asked about the mother of each of the kids; and if the mother is part of the current herd, (s)he is asked to place the kid’s card with that of its mother - as indicated in Figure 7.1. In this diagram there are five adult (breeding) females and one adult male. Three of the females have kids that are part of the current herd, and one of these has twins: the other two adult females do not have kids in the herd. BOX 7.1 USES OF THE PARTICIPATORY HERD HISTORY METHOD Disease-related mortality Discussions with groups of goat-keepers in Udaipur revealed that they perceived kid mortality from disease in the rainy season as their main problem or constraint. The herd history method was used to obtain quantitative information about the problem and to estimate mortality rates. Reproductive performance The herd history method can provide information about the kidding interval of each breeding female (at least for small ruminants), and about abortions, stillbirths, twinning rates and peri-natal mortality of their progeny. The herd history method is useful for collecting baseline data for use in evaluating the effect of trials - e.g. regarding the effect of feed supplementation on reproductive performance - as it enables before and after comparisons to be made. This can be a valuable supplement to data comparing the treatment and control groups (i.e. with and without comparison), particularly since some of the animals may be the same. The next step is to work backwards from the current herd, taking each adult in turn. Thus, with the doe in the top row of the diagram, the goat-keeper is asked to show on the calendar when it kidded, and to move the card for the kid to that point. (S)he is then asked whether any other kid (i.e. a twin) was born at that time, and if so what has happened to it. If there was a twin that has since left the herd another small card, of a different colour, is placed on the diagram at the time when it left the herd. The survey team make a note of the reason why it left (e.g. death from pneumonia). Figure 7.1 A Participatory Herd History Summer Rainy season Winter Current herda O o O o O O oo O M
23

a O = adult female, o = kid, M = adult male The process is then repeated for each of the other adult females, and then for any adult male. If an adult female does not have a kid in the herd the reason for this needs to be clarified - did she kid or not? If she did, what has happened to the kid? If she did not, why was this? Tips - Dos and Don’ts • When asking about the current herd, be careful not to focus exclusively on mothers and
their kids: remember to ask about adult males and about adult females without kids. • It is important to remember to ask whether any adults have left the herd, something that
becomes more likely if the calendar covers two years rather than one. Over two years it may turn out that one of the adult females in the current herd was born to one of the others.
• Remember to ask about abortions, stillbirths and the number of kids born. • If the timing of births, deaths, sales etc. is important remember to record it carefully. • The cards symbolising the animals should not be made of paper otherwise they may be
moved by the wind (unless a stone is placed on them). • Rows should be clearly delineated, otherwise a card may be placed in the wrong row. • The livestock owner should be the person who manipulates the cards, NOT a member of
the survey team. • Make sure the person you are working with is intimately familiar with the herd, otherwise
they will not be able to complete the exercise. Even one knowledgeable person may struggle a little, and it sometimes helps to have two involved.
• The larger the number of animals involved, the more difficult the owner will find it to
recall details about each individual. There are limits, therefore, on the size of herd for which this technique (and any other dependent on recall) will be feasible. Our experience suggests that five adult goats should be straightforward, and 10 is feasible if the owner is intelligent and able to concentrate: beyond 15 may not be possible.
Advantages of the Participatory Herd History Method This method is related to two other methods that have been termed “Herder recall” and “Progeny history” (Waters-Bayer and Bayer, 1994). A key difference, however, is that the herd history method uses symbols, and is a form of diagramming; whereas with the other methods the enumerator records the data in written form. This gives it two advantages. First, it makes is more ‘participatory’, in that the livestock owner is recording the information and can see it her/himself - goat-keepers with whom we have used the method have said that they found it useful. Second, it improves the reliability of the data because: it makes it easier for the livestock owner to recall the information; it encourages her/him to think carefully before recording any information; and it makes it easier for the development agency staff to understand, or to spot any gaps or apparent anomalies, thereby reducing the likelihood of any omissions or misunderstandings between them and the livestock-owner. In fact, for goat herds with several
24

animals, the extractive methods tend to be unreliable, making the herd history method essential. 8 Analysis of Constraints, Problems and Opportunities 8.1 Preliminary identification and ranking of constraints of livestock production It is important to have a sound understanding of the production problems or constraints livestock-keepers are facing, as this will provide the basis for determining which types of interventions are needed. Various constraints are likely to become apparent through discussions of the production system, feeding system etc., but it is still useful to have a general discussion, before any ranking of constraints is done, so that nothing is overlooked. Even for the same type of livestock, the constraints identified by livestock-keepers may vary from village to village, from one production system to another, and between men and women. As part of the process of identifying constraints, the following question can produce some revealing answers: if they had 16 Anas (or 100 rupees) to spend on more livestock, which would they have and why? For example, Gujars in Rajasthan said they would spend 12 Anas (75%) on goats and 4 Anas (25%) on sheep. The reason they preferred goats to large ruminants was that it is too difficult to feed large ruminants in a year of low rainfall; whereas small ruminants can graze on common land. Different types of constraint There are various types of constraints affecting livestock production, which can be classified in different ways. Be alert to these, as it is important to understand how the owner perceives the constraints, which may be different from how a livestock development worker perceives them. There are two types of animal-related categories, namely: • limits on the number of animals kept (e.g. forage resources, labour for herding) • limits on the productivity of the herd (e.g. disease, seasonal feed scarcity).
Another important distinction is between constraints/problems that affect the animal’s productivity (which livestock scientists tend to focus on), and those that affect the owner. For example, the owner may be maintaining livestock productivity at a certain level, but incurring various costs in doing so, such as: spending money on purchased supplements; or increased fatigue caused by longer daily herding times and distances during the dry season. Ranking constraints Once the constraints have been identified the villagers should be asked to rank them in terms of their importance. This should be done separately for different types of livestock. Examples of such rankings are given in Table 8.1. Examples of constraints Goat-keepers mentioned several constraints on goat production during group interviews undertaken as part of the BAIF/NRI project. Apart from those given in Table 8.1, problems that have been mentioned include: theft, predators (fox, wolf) and lack of a breeding buck. Table 8.1 Ranked constraints on goat production in 3 villages – Rabaris in Bhavnagar District, Gujarat Rank Kumbhan Valukad Hanol
25

1 Water scarcity - summer Water scarcity - all year Disease 2 Forage scarcity - summer Forage scarcity - summer Quantity of crop residues
in late winter/summer 3 Disease Disease Water scarcity 8.2 Scratching below the surface The identification of problems, and discussions with livestock-keepers about them, are often superficial. For example, general discussions with two sub-groups in one village and another group in a second village in Bhavnagar District, Gujarat, identified water scarcity in the dry season as the main constraint or problem for goat production in all of them. However, more detailed discussions revealed that the nature of the water scarcity problem was different in each. In the first village, one of the sub-groups was Rabari men, for whom livestock husbandry is the main enterprise and who herd their animals several kilometres each day. For them the problem was the distance they have to walk with their animals to find water in the dry season, when an important water source has dried up. The other sub-group was women belonging to scheduled castes, who keep 1-2 goats, mainly stall-feeding them. The problem for these women was that they have to walk 2 kilometres to the village well to fetch drinking water and bring it back home for the goats. In the other village, water scarcity was so severe that people were dependent on government tankers bringing water every day, from which they purchased it. Since the water scarcity problem is quite different in each of the three cases, the solution is also likely to be different in each case. Sometimes constraints exist that livestock-keepers tend not to mention8. Conversely, they may mention first those problems that they think the survey agency is most likely to be able to help with (e.g. supply of inputs) - producing a shopping list. It should not be assumed, therefore, that the information gained from initial discussions is complete or entirely accurate. A better understanding of constraints is likely to emerge over a period of months of interaction with livestock-keepers. One tool that is useful in deepening understanding, Participatory Problem Tree Analysis, is described below. Planning interventions to address a constraint may sometimes require a more detailed understanding than livestock-keepers on their own can provide. For example, they may know that disease is a serious problem at certain times, but they may not know what the disease is or what causes it: in situations like this, specific studies may need to be undertaken. The identified constraints should be reviewed from time to time as understanding of them improves. 8.3 Participatory problem tree analysis
8 Marketing is seldom mentioned as a problem. Similarly, the availability of family labour for herding is not usually mentioned as a constraint by goat-keepers. However, a regression analysis that tested the relationship between herd size and other variables, using data from Rajasthan, showed that the availability of household labour is one factor that is “uniformly important in determining the herd size” (Sagar and Ahuja, 1993).
26
Problem trees are a very useful diagrammatic tool for analysing problems and gaining a more in-depth understanding of their nature. They also reveal how farmers or livestock-keepers perceive problems and relationships, which may be different from how outsiders see them. They involve identifying a core problem, the factors causing it, and the effects that it has. The core problem is represented as the trunk of the tree, the causes as its roots and the effects as its branches. When explaining the technique to livestock-keepers it is helpful to emphasize the analogy, preferably by pointing to a tree or a picture of one. The core problem may have been identified beforehand in general discussions of constraints. If not, a problem/constraints brainstorming and ranking exercise can be conducted first, and one of the highest ranked problems is then selected for more detailed analysis through use of a problem tree. Participants identify all the factors they can think of that are related to the core problem. Each of these is then symbolised on a largish piece of paper or card. The livestock owners then discuss the relationships between them, classifying them into causes and effects, and place the cards at the appropriate place on the ground. It is highly unlikely that these would be satisfactorily identified at the first attempt, so there will be a need to move the cards around. Where a causal relationship is identified between two factors these can be indicated by placing a stick or similar object between the relevant cards. An example of a problem tree is given in Figure 8.1.
27

Figure 1 Problem Tree constructed by Rabaris in Kumbhan, Gujarat, showing water scarcity as the core problem
LESS INCOME
LESS MILK PRODUCTION
LONG HERDING DISTANCE EACH
DAY
LACK OF FORAGE
WATER SCARCITY
LACK OF RAIN
LACK OF WATER HARVESTING STRUCTURE
HERDERS TIRED AT
END OF DAY
ENCROACHMENT
DISEASES
28
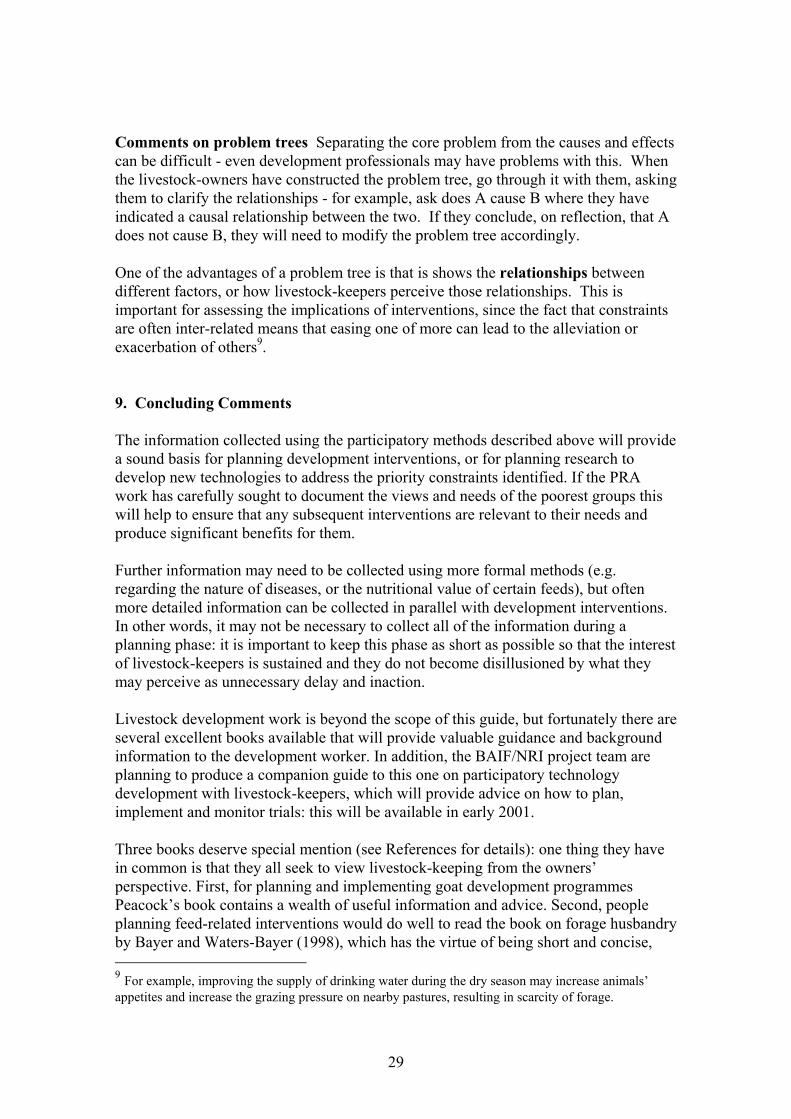
Comments on problem trees Separating the core problem from the causes and effects can be difficult - even development professionals may have problems with this. When the livestock-owners have constructed the problem tree, go through it with them, asking them to clarify the relationships - for example, ask does A cause B where they have indicated a causal relationship between the two. If they conclude, on reflection, that A does not cause B, they will need to modify the problem tree accordingly. One of the advantages of a problem tree is that is shows the relationships between different factors, or how livestock-keepers perceive those relationships. This is important for assessing the implications of interventions, since the fact that constraints are often inter-related means that easing one of more can lead to the alleviation or exacerbation of others9. 9. Concluding Comments The information collected using the participatory methods described above will provide a sound basis for planning development interventions, or for planning research to develop new technologies to address the priority constraints identified. If the PRA work has carefully sought to document the views and needs of the poorest groups this will help to ensure that any subsequent interventions are relevant to their needs and produce significant benefits for them. Further information may need to be collected using more formal methods (e.g. regarding the nature of diseases, or the nutritional value of certain feeds), but often more detailed information can be collected in parallel with development interventions. In other words, it may not be necessary to collect all of the information during a planning phase: it is important to keep this phase as short as possible so that the interest of livestock-keepers is sustained and they do not become disillusioned by what they may perceive as unnecessary delay and inaction. Livestock development work is beyond the scope of this guide, but fortunately there are several excellent books available that will provide valuable guidance and background information to the development worker. In addition, the BAIF/NRI project team are planning to produce a companion guide to this one on participatory technology development with livestock-keepers, which will provide advice on how to plan, implement and monitor trials: this will be available in early 2001. Three books deserve special mention (see References for details): one thing they have in common is that they all seek to view livestock-keeping from the owners’ perspective. First, for planning and implementing goat development programmes Peacock’s book contains a wealth of useful information and advice. Second, people planning feed-related interventions would do well to read the book on forage husbandry by Bayer and Waters-Bayer (1998), which has the virtue of being short and concise, 9 For example, improving the supply of drinking water during the dry season may increase animals’ appetites and increase the grazing pressure on nearby pastures, resulting in scarcity of forage.
29

while being packed with important information. Finally, anyone planning for the first time to develop technologies with livestock-keepers in a participatory way should consult the trainer’s guide on this subject by van Veldhuizen and others (1997). References Bayer, W. and Waters-Bayer, A. (1998) Forage Husbandry. The Tropical Agriculturalist Series. London and Basingstoke: Macmillan Education Ltd. Conroy, C., Sutherland, A. and Martin, A. (1999) Conducting Farmer Participatory Research: What, When and How. In: Grant, I and Sears, C. (eds), Decision Tools for Sustainable Development. Chatham, UK: NRI. Grandin, B. (1998) Wealth Ranking in Smallholder Communities: A Field Manual. London: Intermediate Technology. International Institute for Environment and Development (1994) RRA Notes No. 20: Special Issue on Livestock. London: IIED. Livestock in Development (1999) Livestock in Poverty-Focused Development. Crewkerne: Livestock in Development. Peacock, C. (1996) Improving Goat Production in the Tropics: A Manual for Development Workers. Oxfam/Farm-Africa. Roeleveld, A. (1996) “The Diagnostic Phase in Research on Livestock Systems”. In: Roeleveld. A. and Broek A. van den [Eds], Focusing Livestock Systems Research. Amsterdam: Royal Tropical Institute. Veldhuizen, L.van, Waters-Bayer, A. and Zeeuw, H.de (1997) Developing Technology with Farmers: A Trainer’s Guide for Participatory Learning. Zed Books/ETC Netherlands. Waters-Bayer, A. and Bayer, W. (1994) Planning with Pastoralists: PRA and more – a review of methods focused on Africa. Eschborn: GTZ
30

Figure 2.2 Daily Routine of Rural Women: Village: Patiyo Ka Khera
Monsoon Season (Jun-Sept) Winter Season (Oct-Jan) Summer Season (Feb-May) 1. 04.00-06.00h Women wake up and do household work 2. 06.00-06.30h Clean house and animals 3. 06.30-07.0h Feeding of goats, sheep, cattle and buffaloes and feeding of concentrates 4. 07.00-07.30h Women milk their animals 5. 07.30-08.00h Boil milk and prepare tea 6. 08.00-08.30h Prepare chapati for family 7. 8.30-9.0h Kids and lambs separated from adults and adults taken to graze in common or government grazing areas 8. 09.00-13.00h Work in their own or other peoples' fields if they do not have their own land. During this period women cut and collect grass from the fields for dairy animals 9. 13.00-14.00h Women rest 10. 14.00-19.00h Women work in fields 11. 19.00 All dairy animals come back to the home from pasture lands and some milked
1. 05.00-07.00h Women wake up and do household work 2. 07.00-07.30h House cleaning and cleaning of animal sheds, collecting of cow dung 3. 07.30-08.30h Feeding of goats, sheep, cattle and buffaloes; and feeding of concentrates 4. 08.30-09.00 Women milk their animals 5. 09.00-09.30h Boil milk and prepare tea 6. 9.30-10.0h Prepare chapati, feed family members and send dairy animals to graze in pastureland out of village 7. 10.0-16.00h Women go to fields to do hoeing, weeding, cutting and collecting of grasses for their dairy animals 8. 16.00-17.30h Women return to their home, children bring dairy animals back home, animals tied and water provided and then milking is done 9. 17.30-18.00h Bring water from the well 10. 18.00-20.00h Women prepare chapati 11. 21.0h They all sleep
1. 04.00h Women wake up 2. 04.00-06.00h Household work 3. 06.00-07.00h House cleaning and cleaning of animal sheds, feeding concentrates to dairy animals and then milking 4. 07.00-09.00h Boil milk and prepare tea; prepare chapati and feed family members; dairy animals go outside village for grazing 5. 09.00-12.00h Women go to fields for hoeing, weeding and collection of grasses from the fields for dairy animals 6. 12.00-14.00h Women have complete rest due to heat 7. 14.00-17.00h Again women work in fields for spreading manure and breaking clods 8. 17.00-19.00h Women provide water to dairy animals as they come back from pasture lands, feed concentrates and milk animals

Figure 4.1 Seasonal Calendar of Goat Production for Gujars in Indrapura, Asind Block, Bhilwara, Rajasthan
Topic RAINY WINTER SUMMER Breeding 4 62 6 2
Kidding 6 6 4 Sales 4 5 5 1 1
Disease3 –kids
2 4 1.5
Disease3 -adults
4 4 0.5
1 They sell at this time, when the kids are 5-6 months old, because of problems with male kids mounting and fighting. If they had a castration facility they would like to keep the kids for 12 months before selling them 2 They select these months for breeding because of the availability of Deshi Babul pods. 3 Sixteen Anas were allocated to disease as a whole.
34

Figure 5.2 General Seasonal Feed Utilisation Diagram for SCs in Indrapura, Asind Block, Bhilwara
Feed Sources &
Types
SUMMER RAINY WINTER
Community
land
12 - 41 10 8 14 12 10 10 6 8 8
Crop land (own)
- 16 4 2 - 4 4 4
Crop land (paid for)
- - 2 - -
Bida* land (own)
3 - 4 2 82 - 2 4 4 4
Bida* land (paid for)
- 21a - - 4 4
Home supplements
1 2 - - 2 23 2 44 5
* Bida is private ‘wasteland’ that is not good enough for crop production. 1 The principal species used at this time is Deshi Babul 1a This is purchased tree loppings 2 They use their own bida land for 8-10 days before the rains start. They repair the boundary fences and during August they stop grazing on the bida land, and make full use of the communal land. 3 When the rain is heavy they have to cut grass for the goats 4 They give barley (which they have grown) to lactating does. 5 Cotton
35

36
Figure 5.4 A Simple Forage Calendar
FORAGE RESOURCES*
SEASON Month A B C D E F G HDry January 2 1 2 2 2 1Dry February 2 1 1 5 1Dry March 2 1 1 6Wet 10 AprilWet 10 MayWet 10 JuneWet 10 JulyWet August 9 1Wet September 7 1 2Wet October 8 2Dry November 3 2 5Dry December 2 5 3
Source: Bayer and Waters-Bayer (1998) * Key to forage resources A upland pasture D harvested maize fields G riverine pasture B upland pasture, burnt E harvested sorghum fields H bean straw C maize leaves F harvested millet fields Numbers 1-10 refer to the relative contribution of each forage to animal diet