2018 PROXY SEASON REVIEW & OTHER TOPICS
34
2018 PROXY SEASON REVIEW & OTHER TOPICS Hugessen Breakfast Seminar | June 13, 14 & 20 2018
-
Upload
khangminh22 -
Category
Documents
-
view
0 -
download
0
Transcript of 2018 PROXY SEASON REVIEW & OTHER TOPICS

2018 PROXY SEASON REVIEW & OTHER TOPICSHugessen Breakfast Seminar | June 13, 14 & 20 2018

2
Agenda for Today’s Event
Welcome
Highlights from 2017 Proxy Season
Comments from Guests
Open Discussion
Closing Remarks

Highlights from 2018 Proxy Season
3
4
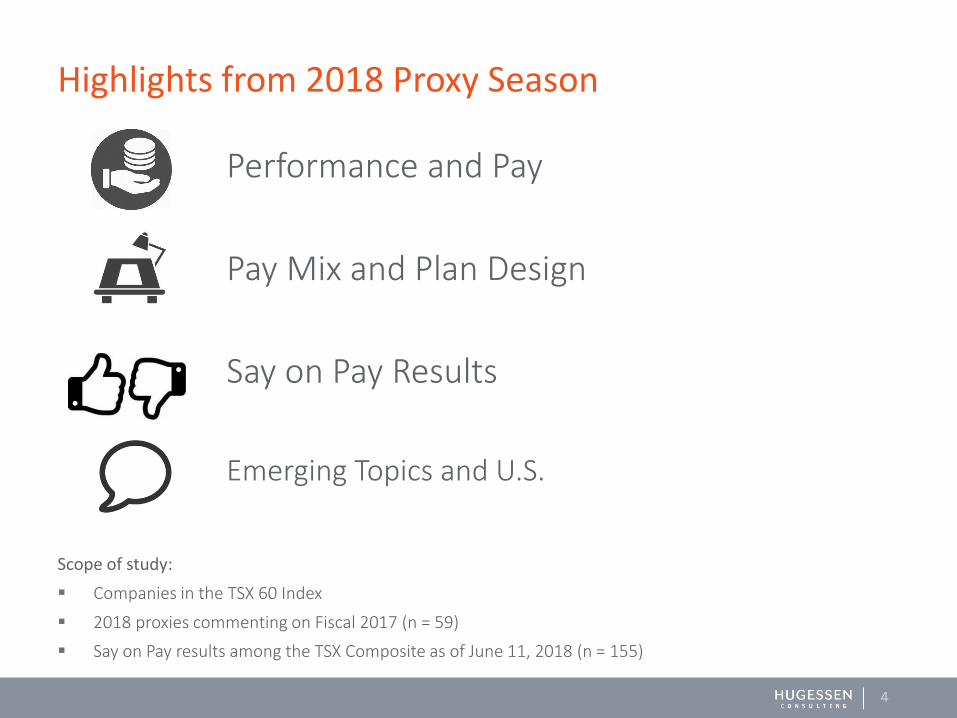
Highlights from 2018 Proxy Season
Performance and Pay
Pay Mix and Plan Design
Say on Pay Results
Emerging Topics and U.S.
Scope of study:
▪ Companies in the TSX 60 Index
▪ 2018 proxies commenting on Fiscal 2017 (n = 59)
▪ Say on Pay results among the TSX Composite as of June 11, 2018 (n = 155)
5
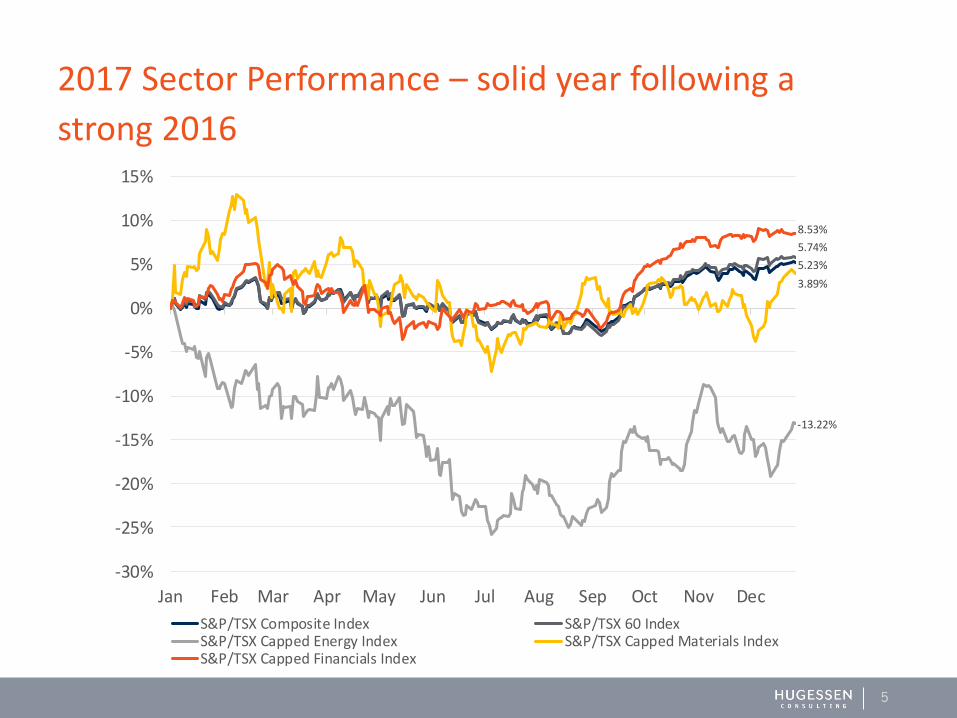
2017 Sector Performance – solid year following a
strong 2016
5.23%
5.74%
-13.22%
3.89%
8.53%
-30%
-25%
-20%
-15%
-10%
-5%
0%
5%
10%
15%
Jan Feb Mar Apr May Jun Jul Aug Sep Oct Nov Dec
S&P/TSX Composite Index S&P/TSX 60 IndexS&P/TSX Capped Energy Index S&P/TSX Capped Materials IndexS&P/TSX Capped Financials Index
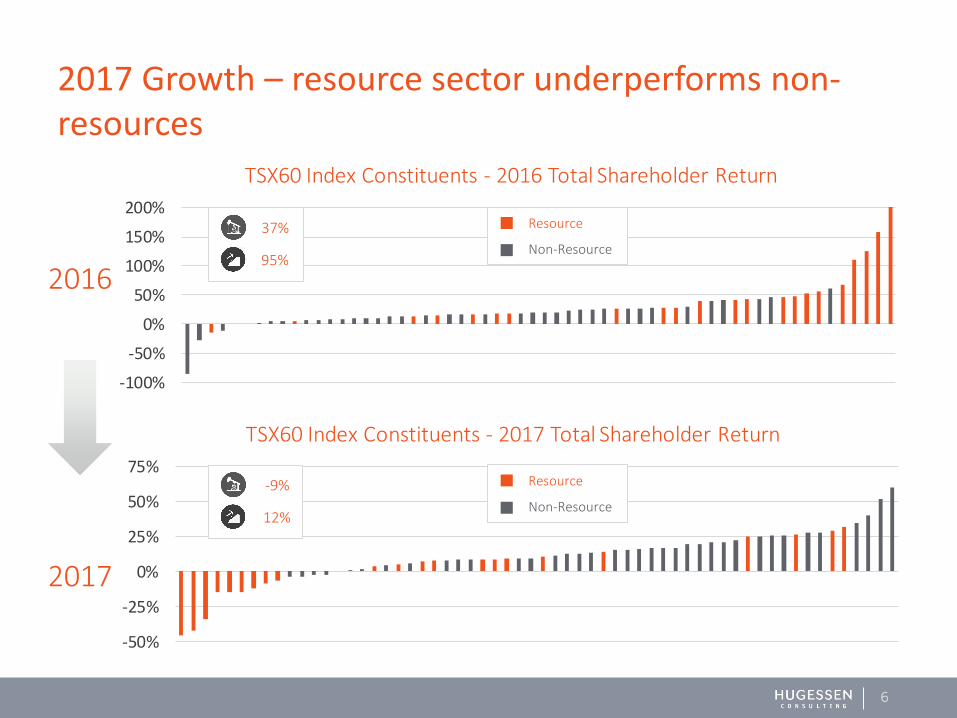
-50%
-25%
0%
25%
50%
75%
TSX60 Index Constituents - 2017 Total Shareholder Return
-100%
-50%
0%
50%
100%
150%
200%
TSX60 Index Constituents - 2016 Total Shareholder Return
6
2017 Growth – resource sector underperforms non-resources
2016
2017
-9%
12%
Resource
Non-Resource
Resource
Non-Resource
37%
95%
7
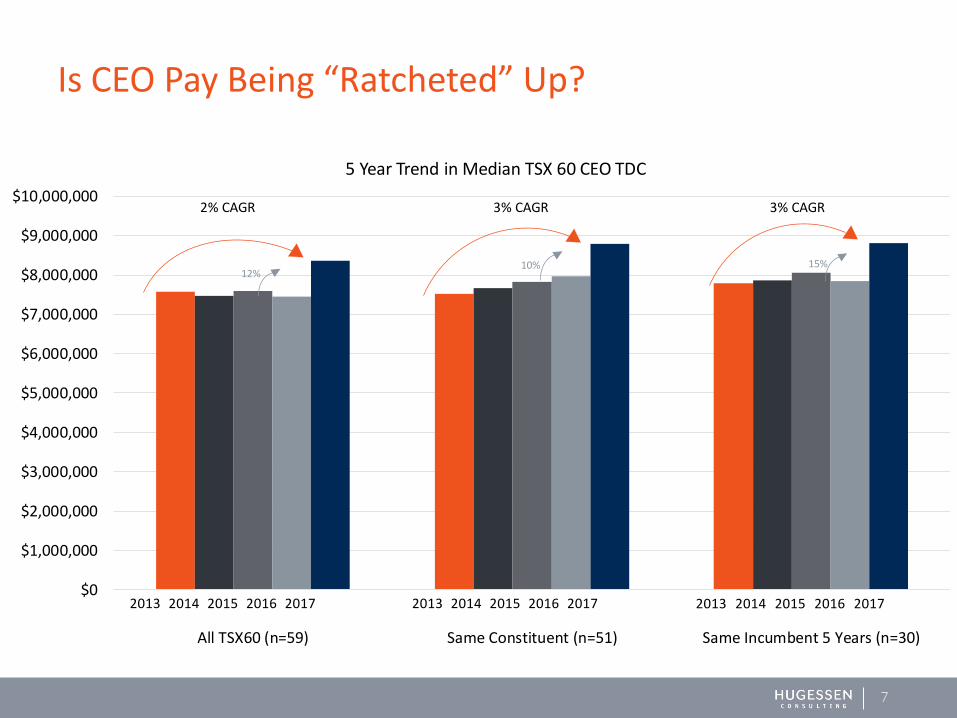
Is CEO Pay Being “Ratcheted” Up?
$0
$1,000,000
$2,000,000
$3,000,000
$4,000,000
$5,000,000
$6,000,000
$7,000,000
$8,000,000
$9,000,000
$10,000,000
All TSX60 (n=59) Same Constituent (n=51) Same Incumbent 5 Years (n=30)
5 Year Trend in Median TSX 60 CEO TDC
2% CAGR 3% CAGR 3% CAGR
2013 2014 2015 2016 2017
12%10% 15%
2013 2014 2015 2016 20172013 2014 2015 2016 2017

$7,447
$2,680
$1,116
$8,368
$3,257
$1,200
$0 $1,000 $2,000 $3,000 $4,000 $5,000 $6,000 $7,000 $8,000 $9,000
TDC
TCC
Salary
CAD '000s
TSX60: Year-Over-Year Changes in Actual Compensation 2016 & 2017
2017 2016
8
2017 CEO Pay Trends – material increase in STIP
8%
22%
12%
9
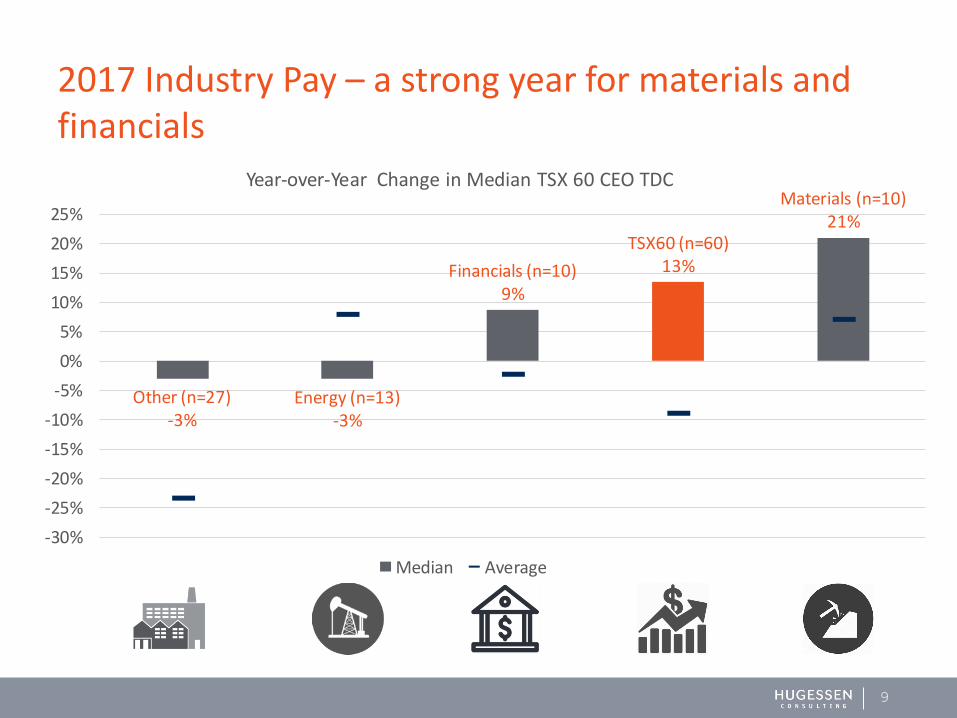
2017 Industry Pay – a strong year for materials and financials
Other (n=27)-3%
Energy (n=13)-3%
Financials (n=10)9%
TSX60 (n=60)13%
Materials (n=10)21%
-30%
-25%
-20%
-15%
-10%
-5%
0%
5%
10%
15%
20%
25%
Year-over-Year Change in Median TSX 60 CEO TDC
Median Average
10
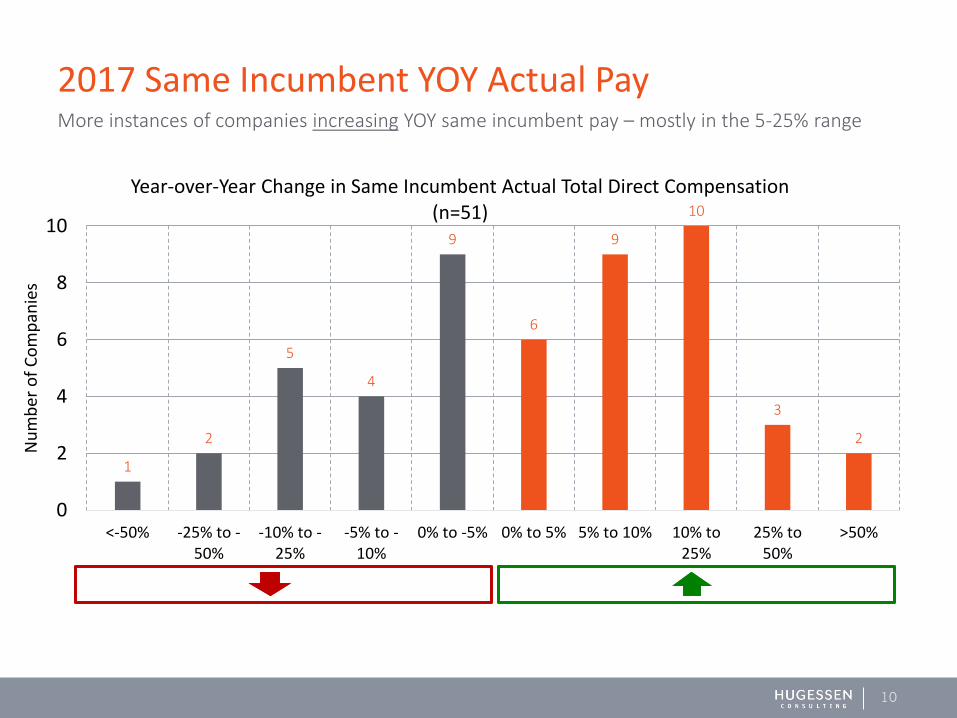
2017 Same Incumbent YOY Actual Pay
1
2
5
4
9
6
9
10
3
2
0
2
4
6
8
10
<-50% -25% to -50%
-10% to -25%
-5% to -10%
0% to -5% 0% to 5% 5% to 10% 10% to25%
25% to50%
>50%
Nu
mb
er o
f C
om
pan
ies
Year-over-Year Change in Same Incumbent Actual Total Direct Compensation (n=51)
More instances of companies increasing YOY same incumbent pay – mostly in the 5-25% range
11
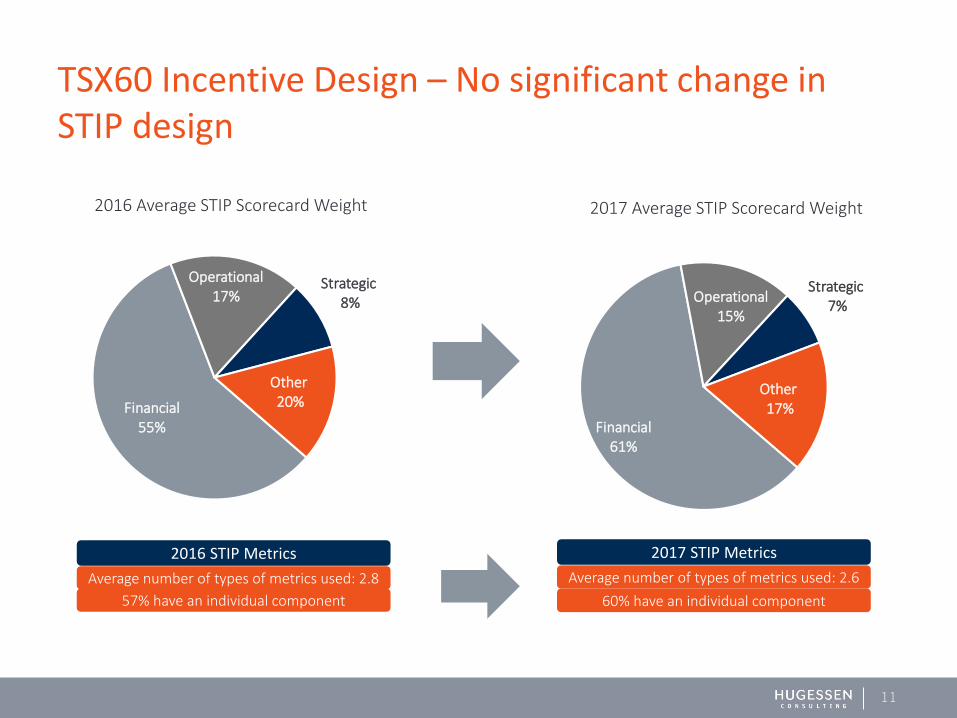
TSX60 Incentive Design – No significant change in STIP design
57% have an individual component
Average number of types of metrics used: 2.8
2016 STIP Metrics
60% have an individual component
Average number of types of metrics used: 2.6
2017 STIP Metrics
Financial55%
Operational17%
Strategic8%
Other20%
2016 Average STIP Scorecard Weight
Financial61%
Operational15%
Strategic7%
Other17%
2017 Average STIP Scorecard Weight
12
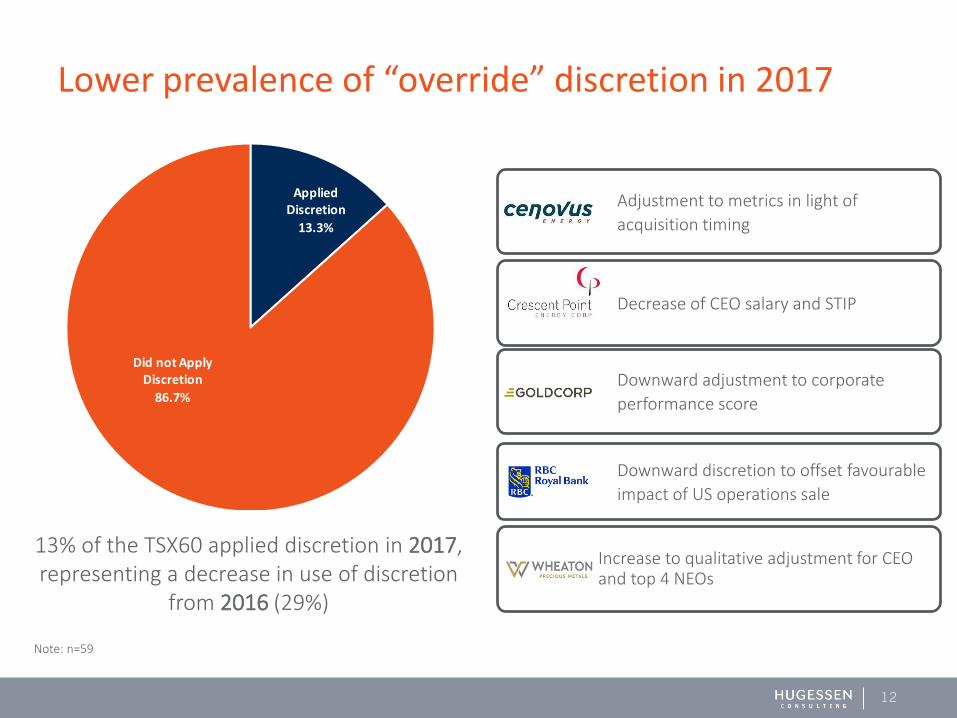
Lower prevalence of “override” discretion in 2017
Adjustment to metrics in light of
acquisition timing
Decrease of CEO salary and STIP
Downward adjustment to corporate
performance score
Downward discretion to offset favourable
impact of US operations sale
Increase to qualitative adjustment for CEO and top 4 NEOs
Note: n=59
13% of the TSX60 applied discretion in 2017, representing a decrease in use of discretion
from 2016 (29%)
Applied Discretion
13.3%
Did not Apply Discretion
86.7%
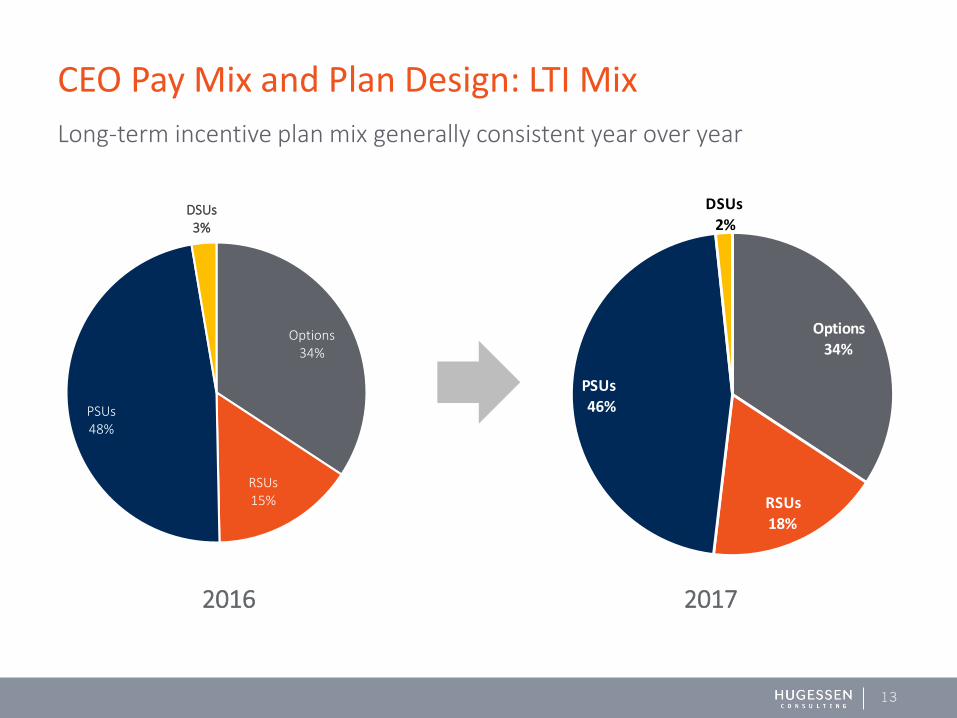
Options34%
RSUs15%
PSUs 48%
DSUs3%
Options34%
RSUs18%
PSUs46%
DSUs2%
13
Long-term incentive plan mix generally consistent year over year
CEO Pay Mix and Plan Design: LTI Mix
2016 2017
14
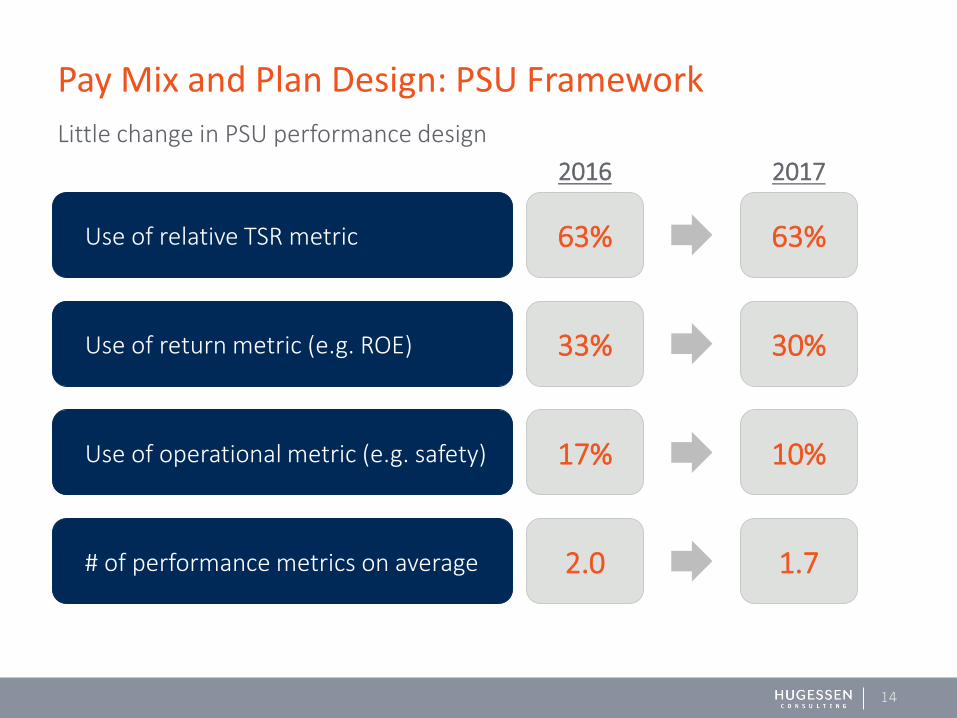
Pay Mix and Plan Design: PSU Framework
2016 2017
Use of relative TSR metric
Use of return metric (e.g. ROE)
Use of operational metric (e.g. safety)
# of performance metrics on average
63%
33%
17%
2.0
63%
30%
10%
1.7
Little change in PSU performance design
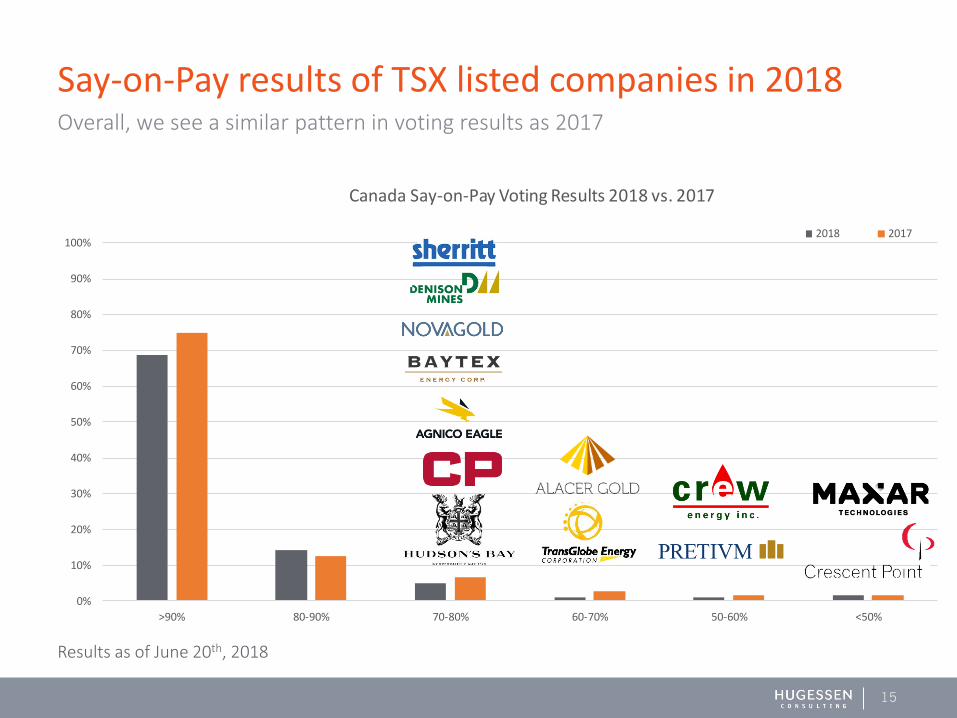
0%
10%
20%
30%
40%
50%
60%
70%
80%
90%
100%
>90% 80-90% 70-80% 60-70% 50-60% <50%
Canada Say-on-Pay Voting Results 2018 vs. 2017
2018 2017
15
Say-on-Pay results of TSX listed companies in 2018Overall, we see a similar pattern in voting results as 2017
Results as of June 20th, 2018
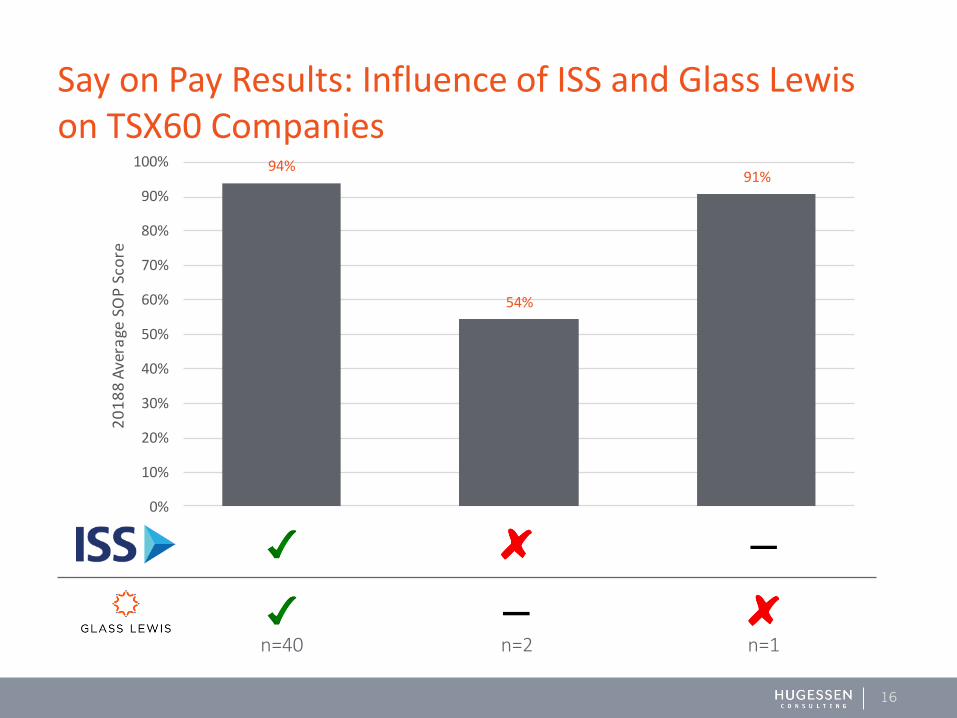
94%
54%
91%
0%
10%
20%
30%
40%
50%
60%
70%
80%
90%
100%
20
18
8 A
vera
ge S
OP
Sco
re
16
Say on Pay Results: Influence of ISS and Glass Lewis on TSX60 Companies
n=2n=40 n=1
17
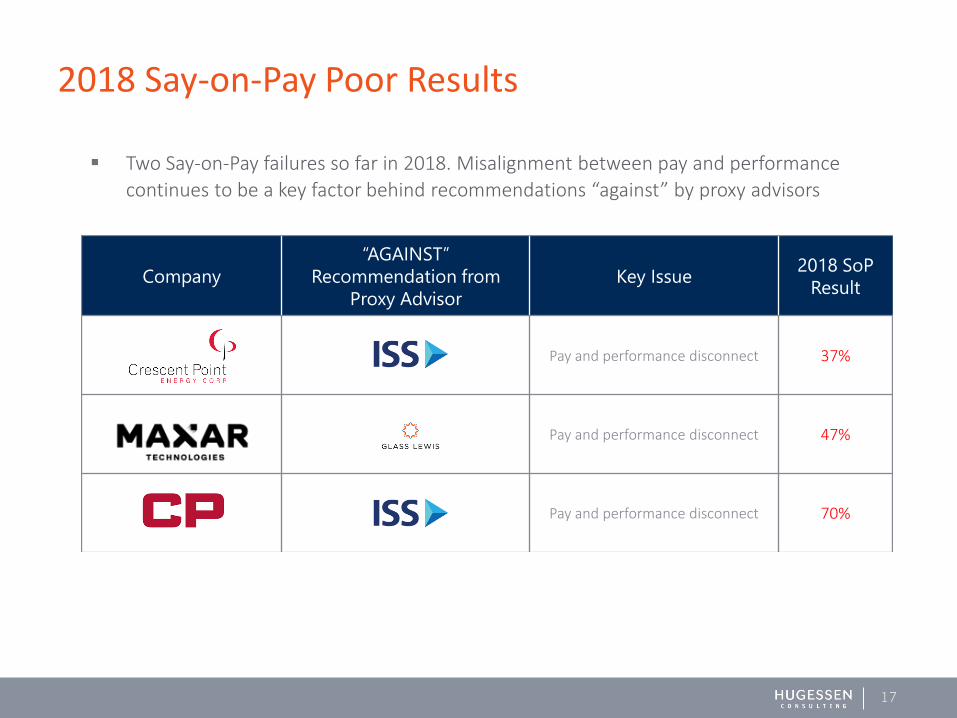
2018 Say-on-Pay Poor Results
▪ Two Say-on-Pay failures so far in 2018. Misalignment between pay and performance
continues to be a key factor behind recommendations “against” by proxy advisors
Company
“AGAINST”
Recommendation from
Proxy Advisor
Key Issue2018 SoP
Result
Pay and performance disconnect 37%
Pay and performance disconnect 47%
Pay and performance disconnect 70%
18
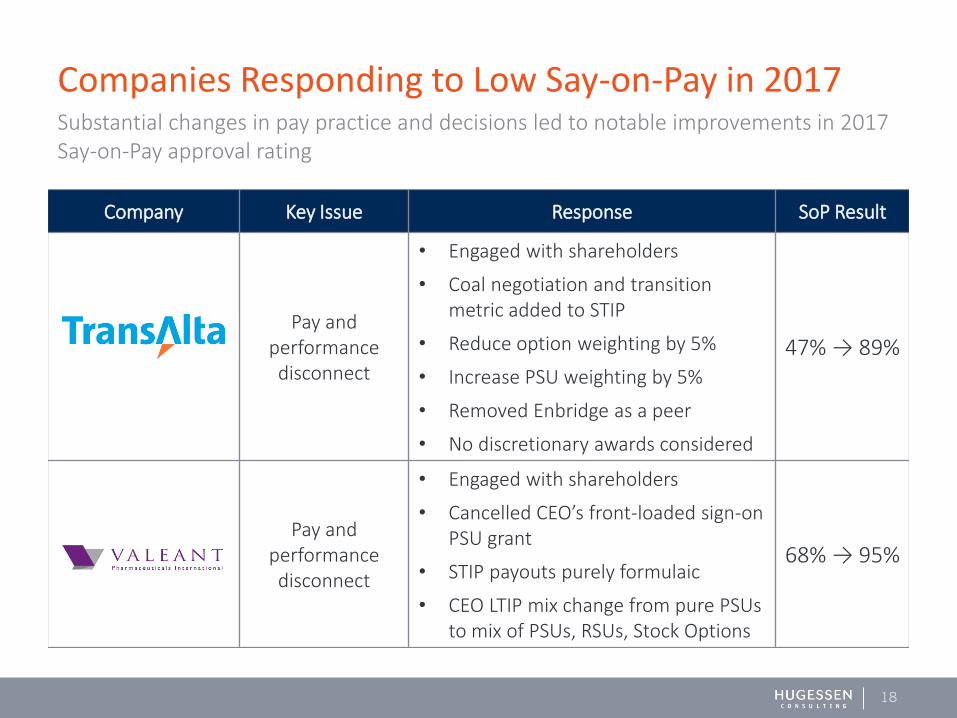
Companies Responding to Low Say-on-Pay in 2017
Company Key Issue Response SoP Result
Pay and performance disconnect
• Engaged with shareholders
• Coal negotiation and transition metric added to STIP
• Reduce option weighting by 5%
• Increase PSU weighting by 5%
• Removed Enbridge as a peer
• No discretionary awards considered
47% → 89%
Pay and performance disconnect
• Engaged with shareholders
• Cancelled CEO’s front-loaded sign-on PSU grant
• STIP payouts purely formulaic
• CEO LTIP mix change from pure PSUs to mix of PSUs, RSUs, Stock Options
68% → 95%
Substantial changes in pay practice and decisions led to notable improvements in 2017 Say-on-Pay approval rating

19
Companies Responding to Low Say-on-Pay in 2017
Company Key Issue Response SoP Result
Misalignment of value distribution
between shareholders and
executives
• Engaged with shareholders
• Removal of Working Capital and Cost/Oz metrics, addition of Strategic Initiatives metric
• 2-Year relative TSR replaced with 50/50 split between 1-Year and 3-Year relative TSR
• Clarified equity award metrics
68% → 95%
Poor overall design
• Adoption of clawback
• Improved disclosure of STIP metrics and discretionary bonuses
• STIP scorecard reweighting (50% discretionary to 25% discretionary)
• Introduction of PSU plan
73% → 96%
Substantial changes in pay practice and decisions led to notable improvements in 2018 Say-on-Pay approval rating
20
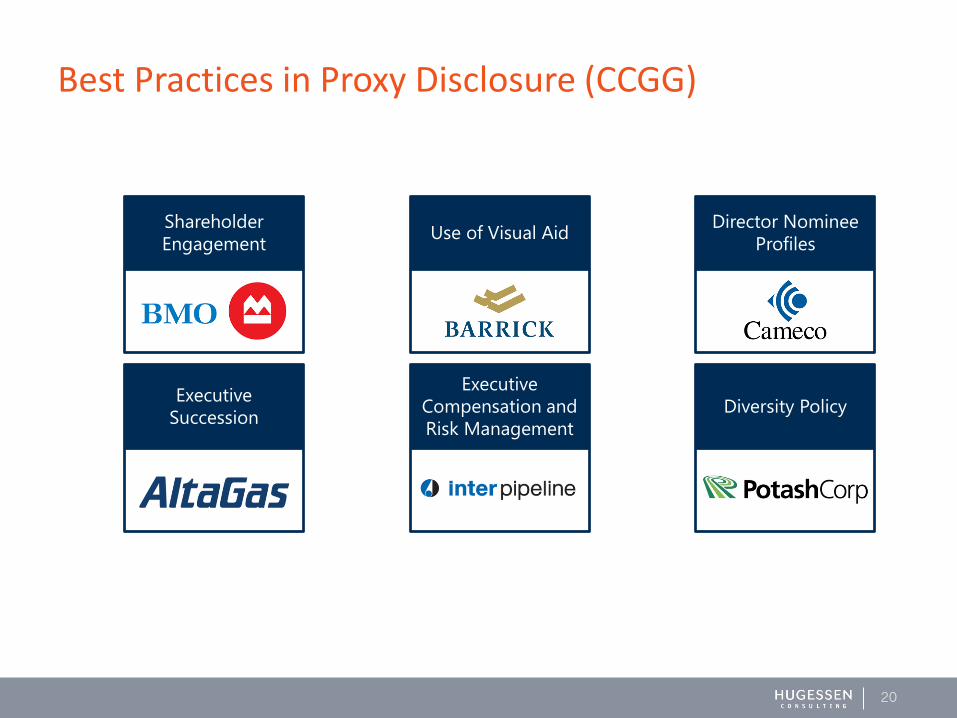
Best Practices in Proxy Disclosure (CCGG)
Shareholder
Engagement
Executive
Succession
Use of Visual Aid
Executive
Compensation and
Risk Management
Director Nominee
Profiles
Diversity Policy
21
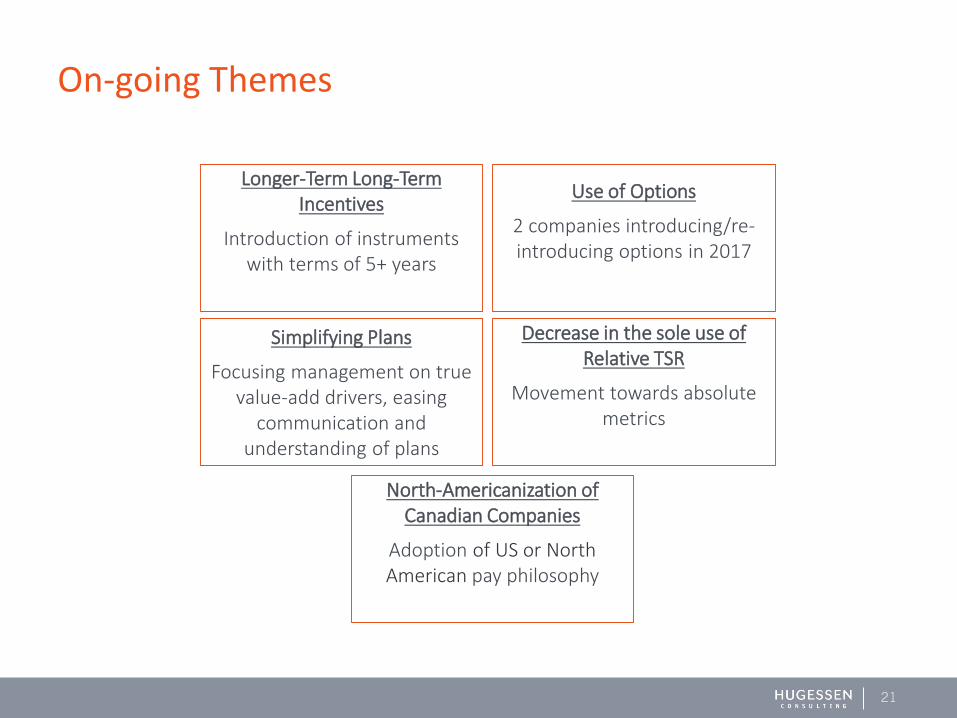
On-going Themes
Longer-Term Long-Term Incentives
Introduction of instruments with terms of 5+ years
Use of Options
2 companies introducing/re-introducing options in 2017
Decrease in the sole use of Relative TSR
Movement towards absolute metrics
Simplifying Plans
Focusing management on true value-add drivers, easing
communication and understanding of plans
North-Americanization of Canadian Companies
Adoption of US or North American pay philosophy

22
Case Studies – Crescent Point and Hydro One
• Minority shareholder, Cation Capital, launches a proxy contest in April 2018
• Cation puts forward 4 nominees, of which ISS supported two
• Shareholders voted down the proposal and voted to re-elect all Crescent Point directors
• Key Takeaways: Board quickly engaged shareholders in response to the dissident proposal
• Average Management Nominee director support: 83%
• 2018 Say-on-Pay support: 38.5%
• Hydro One’s executive and director compensation and related governance provisions drew criticism from Ontario politicians
• Province of Ontario (47% owner) abstained from voting on Say-on-Pay. Balance of shareholders voted 92% in favor on SoP
• Key Takeaways: importance of effectively communicating the rationale for pay framework (Canadian growth, expansion to the US, financial performance)
• Yet not immune from politicization
23
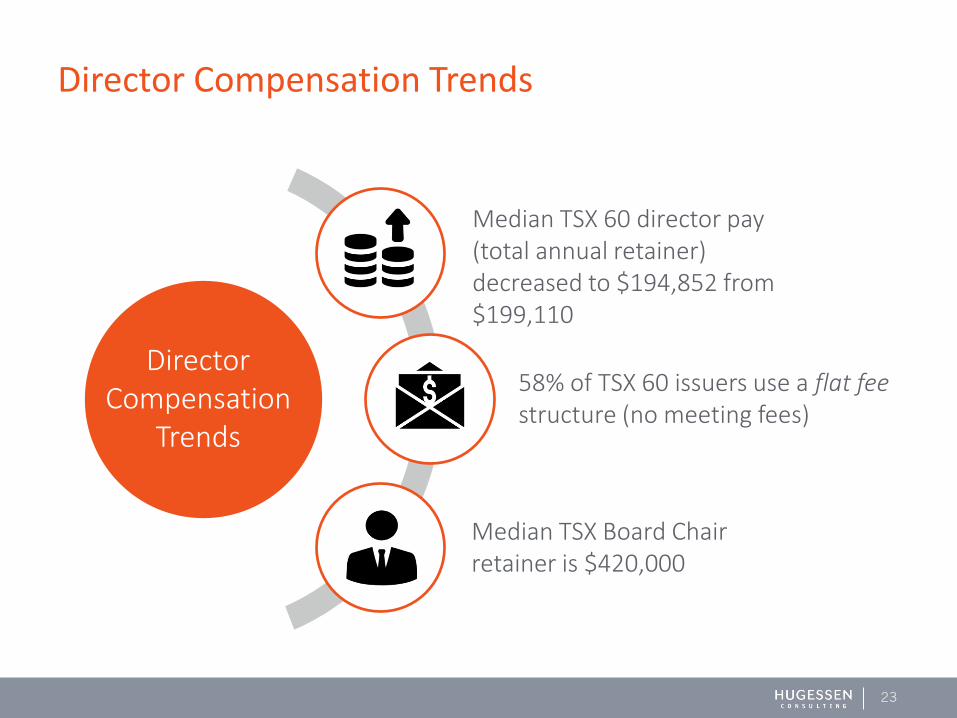
Director Compensation Trends
Median TSX 60 director pay (total annual retainer) decreased to $194,852 from $199,110
58% of TSX 60 issuers use a flat feestructure (no meeting fees)
Median TSX Board Chair retainer is $420,000
Director Compensation
Trends

Emerging Topics
24

25
Rewarding Growth vs Returns
ISS Updates – Return Metrics
• Updated pay-for-performance methodology in 2017 to include ROE, ROA and ROIC relative to peers
Board Considerations
OTPP recommendations:• STIP metrics per share and debt adjusted• Focus management on ROE and ROCE• Supplement Relative TSR with Absolute
Addition of Return Metrics
• Crescent Point
• Magna
• TD
Shareholder Community Concern
• Shareholders have become increasingly vocal on over-emphasis of growth (v. returns) in compensation design, particularly in extractive industries
• Ontario Teachers’ Pension Plan article, Sailing Stone, Paulson & Co have all commented on lack of management and shareholder alignment
26
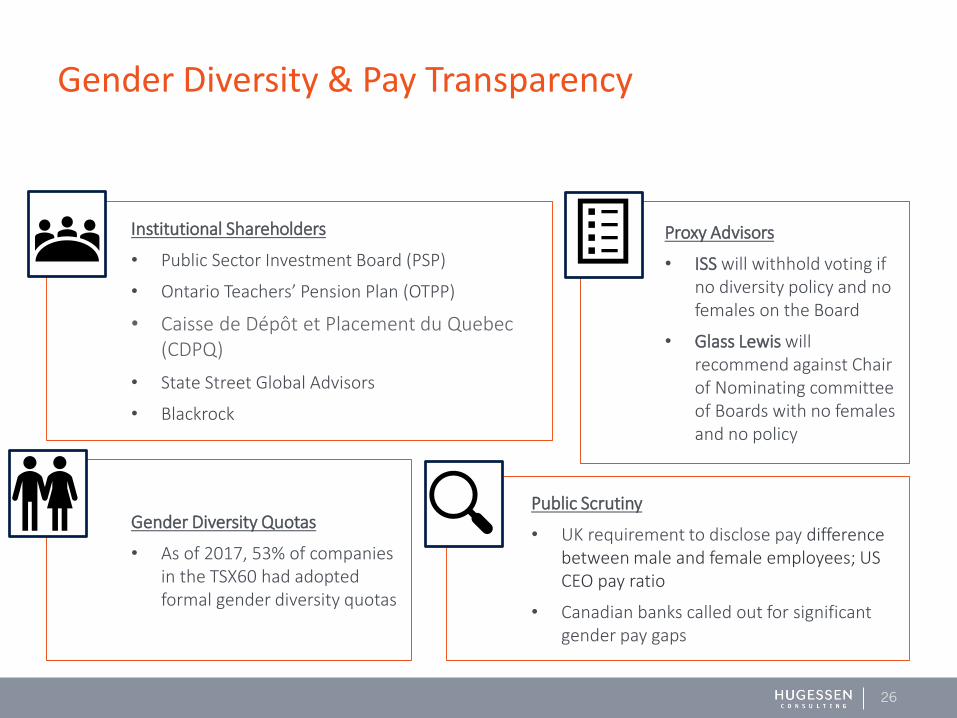
Gender Diversity & Pay Transparency
Proxy Advisors
• ISS will withhold voting if no diversity policy and no females on the Board
• Glass Lewis will recommend against Chair of Nominating committee of Boards with no females and no policy
Public Scrutiny
• UK requirement to disclose pay difference between male and female employees; US CEO pay ratio
• Canadian banks called out for significant gender pay gaps
Gender Diversity Quotas
• As of 2017, 53% of companies in the TSX60 had adopted formal gender diversity quotas
Institutional Shareholders
• Public Sector Investment Board (PSP)
• Ontario Teachers’ Pension Plan (OTPP)
• Caisse de Dépôt et Placement du Quebec (CDPQ)
• State Street Global Advisors
• Blackrock
27
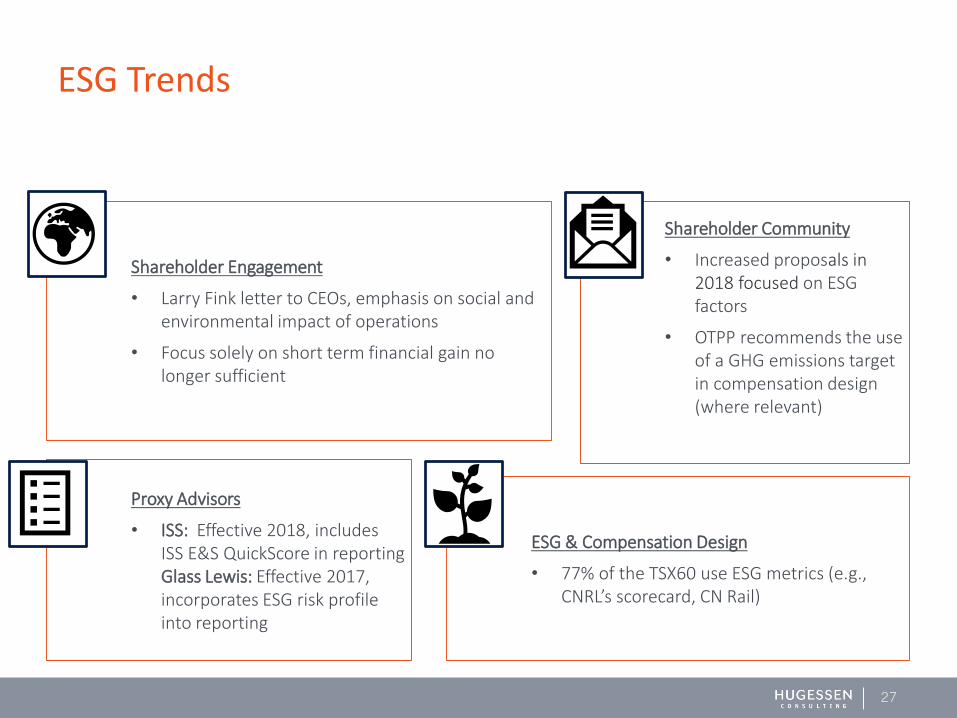
ESG Trends
Shareholder Community
• Increased proposals in 2018 focused on ESG factors
• OTPP recommends the use of a GHG emissions target in compensation design (where relevant)
ESG & Compensation Design
• 77% of the TSX60 use ESG metrics (e.g., CNRL’s scorecard, CN Rail)
Proxy Advisors
• ISS: Effective 2018, includes ISS E&S QuickScore in reporting Glass Lewis: Effective 2017, incorporates ESG risk profile into reporting
Shareholder Engagement
• Larry Fink letter to CEOs, emphasis on social and environmental impact of operations
• Focus solely on short term financial gain no longer sufficient
U.S. Compensation
28

Pay packages increased 8.5% to $11.7 million in 2017
29
2018 early proxy filer data – median 1 year change in CEO total compensation
7.9%
2.5%
5.7%
14.1%
5.9%
7.6%6.7%
11.0%
27.5%
9.8%
Total Sample(n=100)
ConsumerDiscretionary
(n=14)
ConsumerStaples(n=5)
Energy(n=5)
Financials(n=12)
Health Care(n=10)
Industrials(n=26)
InformationTechnology
(n=16)
Materials(n=8)
Utilities(n=4)

30
2018 US Say-on-Pay Votes reveals 2% of companies falling below 50%
76%
16%
6%
2%
2018 SAY-ON-PAY ‘FOR’ VOTES
>90% 70% - 90% 50% - 70% <50%
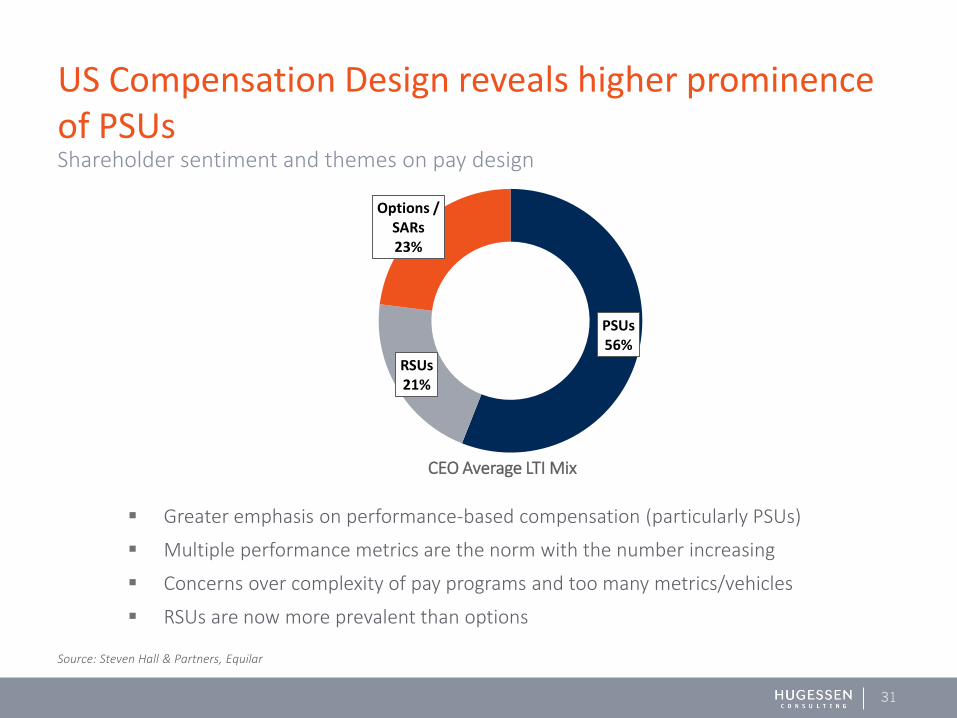
PSUs56%
RSUs21%
Options / SARs23%
CEO Average LTI Mix
▪ Greater emphasis on performance-based compensation (particularly PSUs)
▪ Multiple performance metrics are the norm with the number increasing
▪ Concerns over complexity of pay programs and too many metrics/vehicles
▪ RSUs are now more prevalent than options
31
US Compensation Design reveals higher prominence of PSUs
Source: Steven Hall & Partners, Equilar
Shareholder sentiment and themes on pay design
32
➢ Tax Cuts and Job Act of 2017
➢ Corporate Governance Reform and Transparency Act of 2017
➢Dodd-Frank Rollback
➢Wells Fargo – Federal Reserve Restrictions
➢ Continued Trends in Shareholder Engagement
➢ Pay ratio Findings
US Snapshot: Regulatory & Related Governance
33
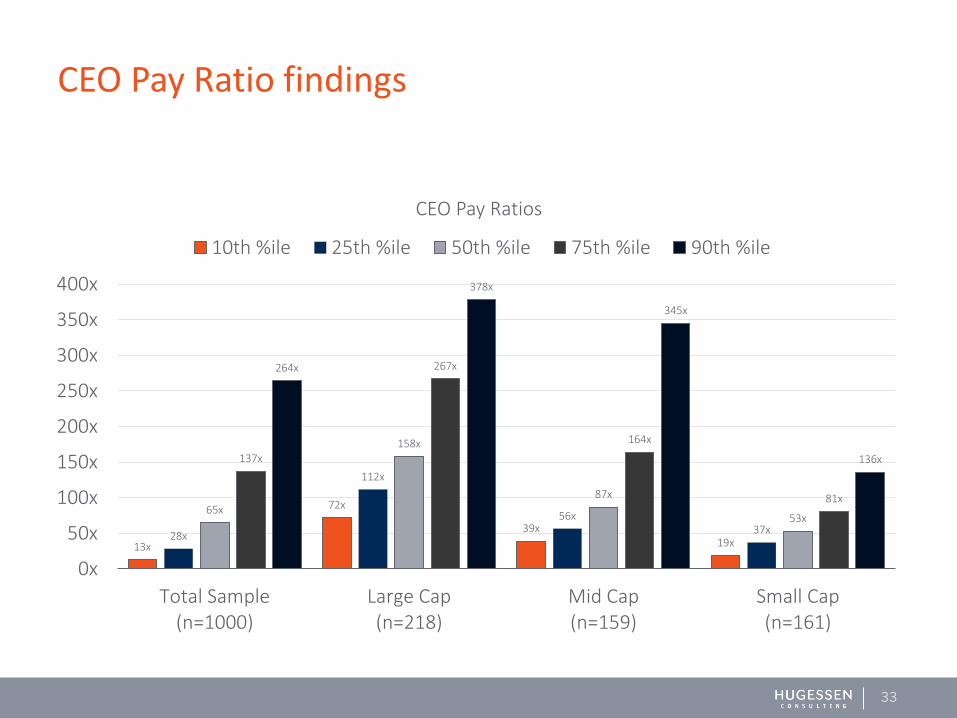
CEO Pay Ratio findings
13x
72x
39x19x
28x
112x
56x37x
65x
158x
87x
53x
137x
267x
164x
81x
264x
378x
345x
136x
0x
50x
100x
150x
200x
250x
300x
350x
400x
Total Sample(n=1000)
Large Cap(n=218)
Mid Cap(n=159)
Small Cap(n=161)
CEO Pay Ratios
10th %ile 25th %ile 50th %ile 75th %ile 90th %ile

Discussion
34