CHAPTER 3 FMEA METHODOLOGY STEPS
20
TM 5-698-4 3-1 CHAPTER 3 FMEA METHODOLOGY STEPS 3-1. Methodology - foundation In order to perform a FMECA the analysts must perform a FMEA first then the CA. The FMEA will then be used as the foundation of the Criticality Analysis. This section will discuss the process flow of a FMEA, see figure 3-1, and explain when and how to perform a FMEA at an upper system level and lower system level approach. The FMEA will identify systems and/or components and their associated failure modes. This part of the analysis will also provide an assessment of the cause and effects of each failure mode. Figure 3-1. Typical FMECA flow
-
Upload
khangminh22 -
Category
Documents
-
view
1 -
download
0
Transcript of CHAPTER 3 FMEA METHODOLOGY STEPS

TM 5-698-4
3-1
CHAPTER 3 FMEA METHODOLOGY STEPS
3-1. Methodology - foundation In order to perform a FMECA the analysts must perform a FMEA first then the CA. The FMEA will then be used as the foundation of the Criticality Analysis. This section will discuss the process flow of a FMEA, see figure 3-1, and explain when and how to perform a FMEA at an upper system level and lower system level approach. The FMEA will identify systems and/or components and their associated failure modes. This part of the analysis will also provide an assessment of the cause and effects of each failure mode.
Figure 3-1. Typical FMECA flow

TM 5-698-4
3-2
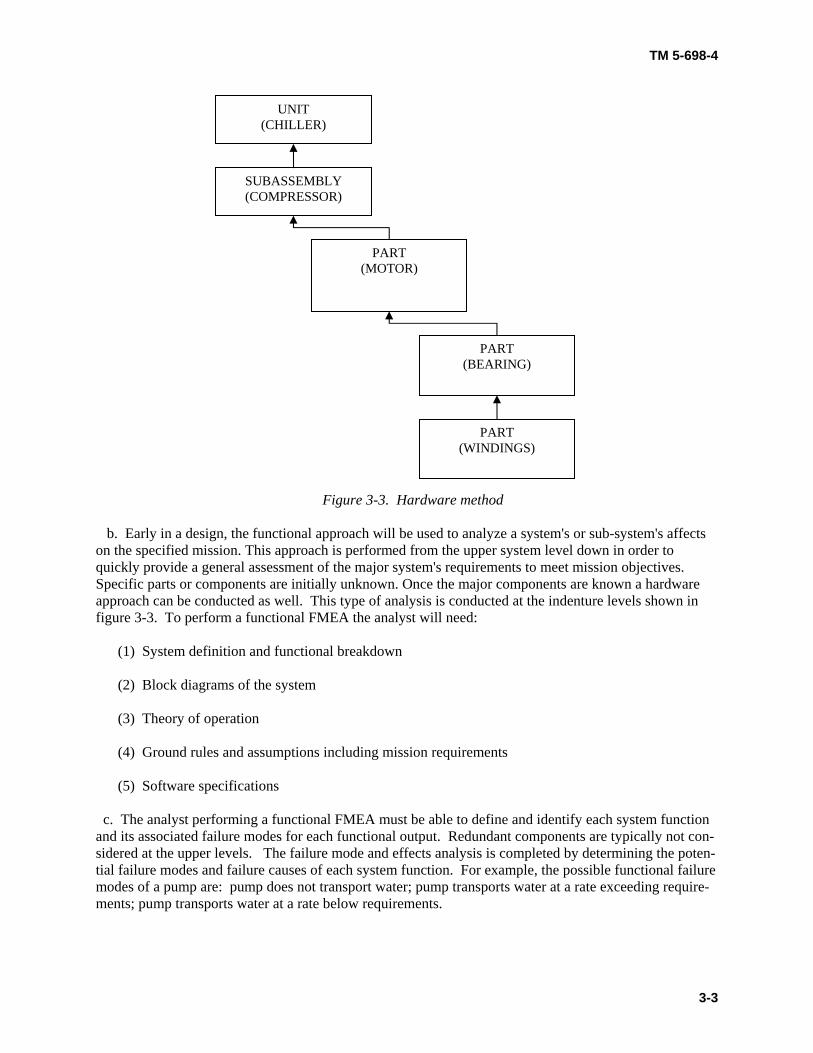
3-2. Define the system to be analyzed (functional/hardware approach) Provide schematics and operational detail of the system. Clarify the mission of the system or the ultimate goal of the system. The mission may be to provide emergency power or maintain a certain temperature to the facility. Whatever it is, it must be identified prior to analysis. Identify failure definitions, such as conditions which constitute system failure or component failure. a.. The system indenture levels must be identified. Figure 3-2 depicts typical system indenture levels. At these system indenture levels, a functional approach is usually applied. Each system's function is known and possibly the major pieces of equipment are known. However, it is possible to conduct a hardware analysis to these levels as well. But, they must begin at the lower levels and propagate them up to the higher system levels. An example of the hardware approach is shown in figure 3-3.
Figure 3-2. Functional method
MAJOR SYSTEM (FACILITY)
SYSTEM (MECHANICAL)
SUBSYSTEM (INDUSTRIAL
COOLING WATER)
UNIT (CHILLER)
PART (CONDENSER)
TM 5-698-4
3-3
Figure 3-3. Hardware method
b. Early in a design, the functional approach will be used to analyze a system's or sub-system's affects on the specified mission. This approach is performed from the upper system level down in order to quickly provide a general assessment of the major system's requirements to meet mission objectives. Specific parts or components are initially unknown. Once the major components are known a hardware approach can be conducted as well. This type of analysis is conducted at the indenture levels shown in figure 3-3. To perform a functional FMEA the analyst will need: (1) System definition and functional breakdown (2) Block diagrams of the system (3) Theory of operation (4) Ground rules and assumptions including mission requirements (5) Software specifications c. The analyst performing a functional FMEA must be able to define and identify each system function and its associated failure modes for each functional output. Redundant components are typically not con-sidered at the upper levels. The failure mode and effects analysis is completed by determining the poten-tial failure modes and failure causes of each system function. For example, the possible functional failure modes of a pump are: pump does not transport water; pump transports water at a rate exceeding require-ments; pump transports water at a rate below requirements.
UNIT (CHILLER)
SUBASSEMBLY (COMPRESSOR)
PART (MOTOR)
PART (BEARING)
PART (WINDINGS)
TM 5-698-4
3-4
d. The failure mechanisms or causes would be: motor failure; loss of power; over voltage to motor; de-graded pump; motor degraded; and, under voltage to motor. e. The functional approach should start by observing the effects of each major system, heating, ventila-tion, and air conditioning (HVAC) and power generation/distribution, has on each other. The next level down would analyze either just the required components within the HVAC or the required components of the power generation/distribution. f. The functional FMEA is crucial to the success of understanding the equipment and to determine the most applicable and effective maintenance. Once failure rates on each component within each system can be established they are added up to assign a failure rate of the system. This failure rate will aid in deter-mining where redundant components are required. g. The hardware approach is much more detailed. It lists individual hardware or component items and analyzes their possible failure modes. This approach is used when hardware items, such as what type of motors, pumps, cooling towers, or switchgear, can be uniquely identified from the design schematics and other engineering data. h. The possible hardware failure modes for a pump could be: pump will not run; pump will not start; and, pump is degraded. The mechanisms would be: motor windings are open; a coupling broke; starter relay is open; loss of power; impeller is worn; and, seal is leaking. i. The hardware approach is normally used in a bottom-up manner. Analysis begins at the lowest in-denture level and continues upward through each successive higher indenture level of the system. This type of analysis is usually the final FMEA for the design. To perform a hardware FMEA the analyst will need: (1) Complete theory or knowledge of the system (2) Reliability block diagrams/functional block diagrams (3) Schematics (4) Bill of materials/parts list (5) Definitions for indenture levels (6) Ground rules and assumptions including mission requirements j. Depending on the complexity of the system under analysis, it is sometimes necessary to utilize both the hardware and functional approach. The major difference between the two approaches is the amount of “parts” the component has and the descriptions of the failure modes. The failure mode description for a functional approach is a functional description where as the hardware approach may identify a particular part that failed. 3-3. Ground rules and assumptions To help the reader understand the FME(C)A results, the analyst must clearly document the ground rules and/or assumptions made when performing each part of the analysis. The ground rules generally apply to

TM 5-698-4
3-5
the system/equipment, its environment, mission, and analysis methods. Ground rules require customer approval and generally include: a. The mission of the item being analyzed (example: Power-Electricity) b. The phase of the mission the analysis will consider (example: Main Power Outage) c. Operating time of the item during the mission phase (example: Run Time of Generators) d. The severity categories used to classify the effects of failure (see table 3-1 on page 3-15) e. Derivation of failure mode distributions (vendor data, statistical studies, analyst's judgment) f. Source of part failure rates when required (nonelectronic parts reliability data (NPRD), vendor data, Power Reliability Enhancement Program (PREP) data) g. Fault detection concepts and methodologies. (supervisory control and data acquisition (SCADA), alarms, warnings) 3-4. Block diagrams A functional and reliability block diagram representing the operation, interrelationships and interdepend-encies of functional entities of the system should be constructed. The block diagrams provide the ability to trace the failure mode effects through each level of indenture. The block diagrams illustrate the func-tional flow sequence as well as the series or parallel dependence or independence of functions and opera-tions. a. Each input and output of an item should be shown on the diagrams and labeled. A uniform number-ing system which is developed for the functional system breakdown order is essential to provide traceabil-ity through each level of indenture. b. The functional block diagram shows the operation and interrelationships between functional parts of the system as defined by the schematic drawings and engineering data. It depicts the system functional flow, the indenture level of analysis, and the present hardware indenture level. This type of diagram should be used for hardware and functional FMEA's. c. The functional block diagram in figure 3-4 would be used at the earliest part of a design. It indicates what subsystems a facility will need to supply a room with temperature control. These subsystems are: (1) The Industrial Cooling Water system; used to remove the heat generated by the chiller. (2) The Chilled Water Supply; used to supply water at a temperature of 55°F to the Air Handling Sys-tem. (3) The Air Handling system; used to provide air flow at 3200cfm to the room and maintain a tem-perature of 72°F. (4) AC Power Supply; used to provide power to each of the above subsystems.

TM 5-698-4
3-6
Figure 3-4. Functional block diagram of system
d. The next step is to provide a functional diagram within each sub-system indicating what types of components are required and their outputs. Figure 3-5 is an example of the same system but provides the basic components and their relationship within their system and other systems.
Figure 3-5. Functional block diagram of the sub-systems

TM 5-698-4
3-7
e. If a functional or hardware FMEA is to be conducted, a reliability diagram should be constructed down to the component level after the functional diagram of the system is completed. This will visually provide information to the team of any single point failures at the component level. Additional informa-tion on the construction of functional block diagrams can be found in currently cancelled MIL-M-24100 entitled Manual, Technical; Functionally Oriented Maintenance Manuals for Systems and Equipment. f. The reliability block diagram of the same system is shown in figure 3-6. It is used to illustrate the relationship of all the functions of a system or functional group. All of the redundant components should be shown. This diagram should also indicate how many of the redundant components are actually re-quired for the whole system to be operational. In other words, it should be stated that there may be four pumps but only two are required to accomplish the mission.
Figure 3-6. Reliability block diagram
g. In this case: one cooling tower is required from either the East or West Plant Industrial Cooling Wa-ter Supply. Either the East Plant or the West Plant is sufficient enough with one cooling tower opera-tional for mission success. h. Within the Chilled Water Supply and the Air Handling System, one pump, one chiller, and one air handling unit is required to supply enough air flow and heat exchange (cooling) to the room.
TM 5-698-4
3-8
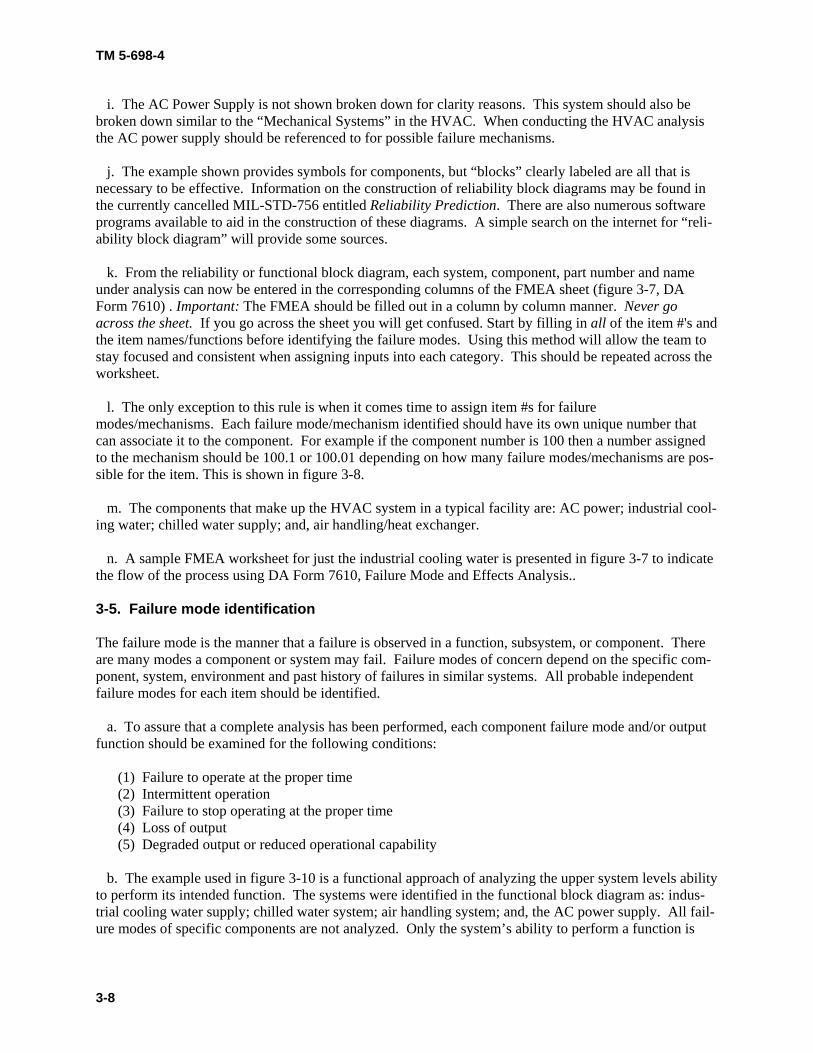
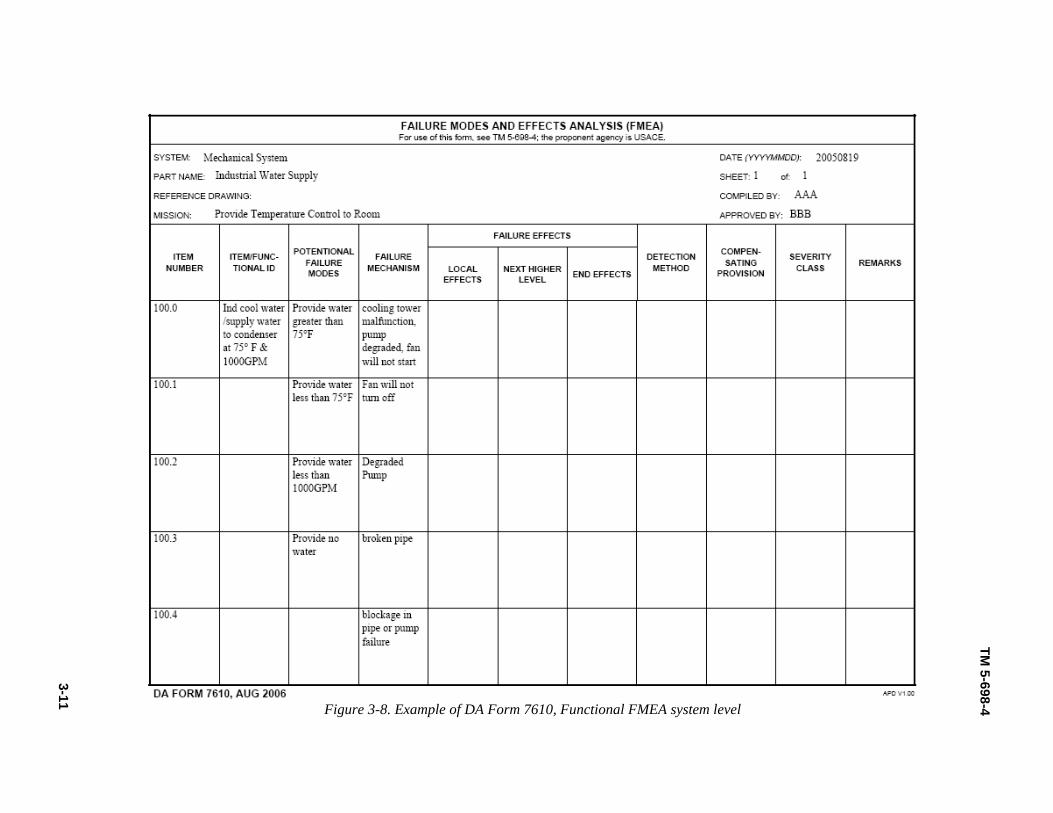
i. The AC Power Supply is not shown broken down for clarity reasons. This system should also be broken down similar to the “Mechanical Systems” in the HVAC. When conducting the HVAC analysis the AC power supply should be referenced to for possible failure mechanisms. j. The example shown provides symbols for components, but “blocks” clearly labeled are all that is necessary to be effective. Information on the construction of reliability block diagrams may be found in the currently cancelled MIL-STD-756 entitled Reliability Prediction. There are also numerous software programs available to aid in the construction of these diagrams. A simple search on the internet for “reli-ability block diagram” will provide some sources. k. From the reliability or functional block diagram, each system, component, part number and name under analysis can now be entered in the corresponding columns of the FMEA sheet (figure 3-7, DA Form 7610) . Important: The FMEA should be filled out in a column by column manner. Never go across the sheet. If you go across the sheet you will get confused. Start by filling in all of the item #'s and the item names/functions before identifying the failure modes. Using this method will allow the team to stay focused and consistent when assigning inputs into each category. This should be repeated across the worksheet. l. The only exception to this rule is when it comes time to assign item #s for failure modes/mechanisms. Each failure mode/mechanism identified should have its own unique number that can associate it to the component. For example if the component number is 100 then a number assigned to the mechanism should be 100.1 or 100.01 depending on how many failure modes/mechanisms are pos-sible for the item. This is shown in figure 3-8. m. The components that make up the HVAC system in a typical facility are: AC power; industrial cool-ing water; chilled water supply; and, air handling/heat exchanger. n. A sample FMEA worksheet for just the industrial cooling water is presented in figure 3-7 to indicate the flow of the process using DA Form 7610, Failure Mode and Effects Analysis.. 3-5. Failure mode identification The failure mode is the manner that a failure is observed in a function, subsystem, or component. There are many modes a component or system may fail. Failure modes of concern depend on the specific com-ponent, system, environment and past history of failures in similar systems. All probable independent failure modes for each item should be identified. a. To assure that a complete analysis has been performed, each component failure mode and/or output function should be examined for the following conditions: (1) Failure to operate at the proper time (2) Intermittent operation (3) Failure to stop operating at the proper time (4) Loss of output (5) Degraded output or reduced operational capability b. The example used in figure 3-10 is a functional approach of analyzing the upper system levels ability to perform its intended function. The systems were identified in the functional block diagram as: indus-trial cooling water supply; chilled water system; air handling system; and, the AC power supply. All fail-ure modes of specific components are not analyzed. Only the system’s ability to perform a function is

TM 5-698-4
3-9
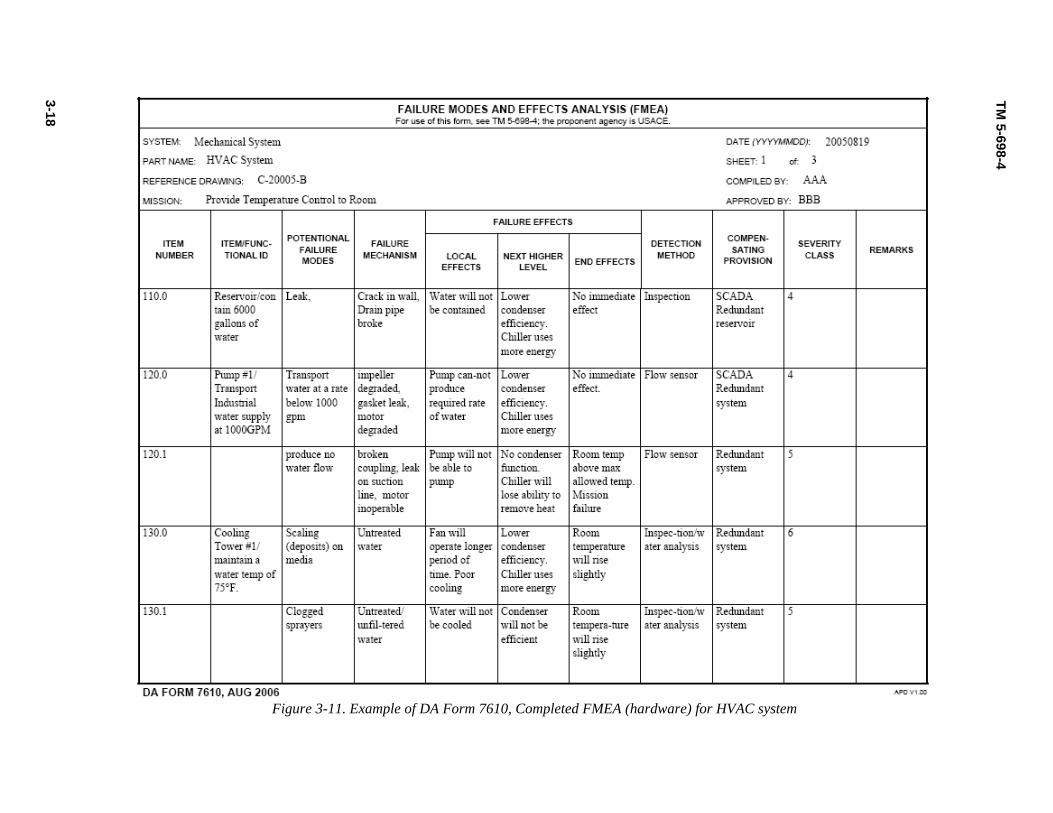
evaluated. As the analysis steps down a level, a specific component can be identified and then a failure mechanism(s) associated with the component can be analyzed as is shown in figure 3-11. c. The cause or failure mechanism of a failure mode is the physical or chemical processes that cause an item to fail. It is important to note that more than one failure cause is possible for any given failure mode. All causes should be identified including human induced causes. These can occur more frequently when initiating a redundant system upon a failure of the primary system. When analyzing the cause of each failure mode one should be careful not to over analyze why a part failed. For example, failure mode-bearing seized: (1) Why did it seize? – Contamination was in the bearing. (2) Why was there contamination? – Seal was cracked. (3) Why was the seal cracked? – Seal was not replaced during last pm. (4) Why was seal not replaced? – Because there were none in stock. d. As you can see, the root cause should be the "seal was cracked". By analyzing further you chase the cause "out of bounds". The analysts must use their judgments to decide how far to investigate root causes. 3-6. Failure effects analysis A failure effects analysis is performed on each item of the reliability block diagram. The consequence of each failure mode on item operation, and the next higher levels in the block diagram should be identified and recorded. The failure under consideration may affect several indenture levels in addition to the in-denture level under analysis. Therefore, local, next higher and end effects are analyzed. Failure effects must also consider the mission objectives, maintenance requirements and system/personnel safety. a. Example failure effect levels are shown in Figure 3-9 and are defined as follows: (1) Local effects are those effects that result specifically from the failure mode of the item in the in-denture level under consideration. Local effects are described to provide a basis for evaluating compen-sating provisions and recommending corrective actions. The local effect can be the failure mode itself. (2) Next higher level effects are those effects which concentrate on the effect of a particular failure mode has on the operation and function of items in the next higher indenture level. (3) End effects are the effects of the assumed failure on the operation, function and/or status of the system. b. Example end or system level effects of item failures are also shown in Figure 3-9 and generally fall within one of the following categories: (1) System failure where the failed item has a catastrophic effect on the operation of the system. (2) Degraded operation where the failed item has an effect on the operation of the system but the sys-tem's mission can still be accomplished. (3) No immediate effect where the failed item causes no immediate effects on the system operation.

3-10
TM 5-698-4
Figure 3-7. Example of DA Form 7610, FMEA worksheet flow (one column at a time)
3-11
TM 5-698-4
Figure 3-8. Example of DA Form 7610, Functional FMEA system level
TM 5-698-4
3-12
c. Try to be specific when assigning the effect. The above items are just categories, and are not in-tended to be the only input for "end effect". Detailed effects will provide the analyst the most useful in-formation later on in the analysis. d. Failures at the system level are those failures which hinder the performance or actual completion of the specified mission. Failures at each indenture level are defined below. (1) A major system failure would be failure in the main mission of the facility. A failure at the major system level would be defined as the inability to command, control, & communicate. (2) A system failure of a mechanical system. A failure at the system level would be defined as the inability of the mechanical system to cool the facility to a maximum allowed operating temperature for the computers. (3) A subsystem failure would be failure of the industrial cooling water. A failure at the subsystem level would be defined as the inability to provide cooling water to the facility. (4) A component failure would be failure of a chiller. A failure at the system component level could be defined as the inability of the chiller to provide chilled water. (5) A sub-component failure would be the failure of a condenser. A failure at the sub-component level would be defined as the inability of the condenser to remove heat from the water supply. e. Figure 3-9 provides an example of typical entries into the failure effects categories. Remember to be as specific as necessary so that anyone who reads this will be able to decipher what the effects are without asking questions. Note the progression of one column at a time. 3-7. Failure detection methods The FMEA identifies the methods by which occurrence of failure is detected by the system operator. Visual or audible warnings devices and automatic sensing devices, such as a SCADA (supervisory control and data acquisition) system, are examples of failure detection means. Any other evidence to the system operator that a system has failed should also be identified in the FMEA. If no indication exists, it is im-portant to determine if the failure will jeopardize the system mission or safety. If the undetected failure does not jeopardize the mission objective or safety of personnel, and allows the system to remain opera-tional a second failure situation should be explored to determine whether or not an indication will be evi-dent to the operator or maintenance technician. a. These indications can be described as follows: (1) A normal indication is an indication to the operator that the system is operating normally. (2) An abnormal indication is an indication to the operator that the system has malfunctioned or failed. (alarm-chiller overheated) (3) An incorrect indication is an erroneous indication to the operator that a malfunction has occurred when actually there is no fault. Conversely, an indication that the system is operating normally when, in fact, there is a failure.

3-13
TM 5-698-4
Figure 3-9. Example of DA Form 7610, FMEA progression

TM 5-698-4
3-14
b. Periodic testing of stand-by equipment would be one method used to detect a hidden failure of the equipment. This testing helps to assure that the stand-by equipment will be operational at the inopportune time the primary equipment fails. The ability to detect a failure in order to reduce the overall effect will influence the severity of the failure. If the detection method does not reduce the overall effect, then the severity will not be influenced. The analysts should explore an alternative method for detection if this is the case. c. Typically if the failure mode can be detected prior to occurring, the operator can prevent further damage to the system or take some other form of action to minimize the effect. An "over-temperature" alarm for a compressor would be an example. If the compressor had a loss of lubrication and was over-heating, the alarm/SCADA would shut that chiller down prior to seizure. If the compressor were allowed to run to seizure, costly damage would occur and the system would not be able to function. 3-8. Compensating provisions Compensating provisions are actions that an operator can take to negate or minimize the effect of a failure on the system. Any compensating provision built into the system that can nullify or minimize the effects of a malfunction or failure must be identified. a. Examples of design compensating provisions are: (1) Redundant item that allows continued and safe operation. (2) Safety devices such as monitors or alarm systems that permit effective operation or limit damage. (3) Automatic self compensating devices that can increase performance as unit degrades such as vari-able speed drives for a pump. (4) Operator action such as a manual over-ride. b. When multiple compensating provisions exist, the compensating provision which best satisfies the fault indication observed by the operator must be highlighted. The consequences of the operator taking the wrong action in response to an abnormal indication should also be considered and the effects of this action should be recorded in the remarks column of the worksheet. c. To be able to detect a failure and react correctly can be extremely critical to the availability of the system. For example; if a failure is detected in the primary pump (no flow) then the operator/technician must know what buttons and/or valves to actuate in order to bring in the backup pump. If by chance the operator/technician inadvertently actuates the wrong valve there may be undesirable consequences as a result of their actions. This is a basic example but should be considered in the analysis on all failure modes. 3-9. Severity Ranking After all failure modes and their effects on the system have been documented in the FMEA the team now needs to provide a ranking of the effect on the mission for each failure mode. Make sure that prior to as-signing these rankings that all prior columns of the FMEA are filled in. This will help the analyst in as-signing each severity ranking relative to each other. This ranking will be used later in the criticality analysis to establish relative "severity" rankings of all potential failure modes.

TM 5-698-4
3-15
a. Each item failure mode is evaluated in terms of the worst potential consequences upon the system level which may result from item failure. A severity classification must be assigned to each system level effect. A lower ranking indicates a less severe failure effect. A higher ranking indicates a more severe failure effect. Severity classifications provide a qualitative measure of the worst potential consequences resulting from an item failure. b. A severity classification is assigned to each identified failure mode and each item analyzed in accor-dance with the categories in table 3-1.
Table 3-1. Severity ranking table
Ranking Effect Comment 1 None No reason to expect failure to have any effect on Safety, Health, Environment
or Mission 2 Very Low Minor disruption to facility function. Repair to failure can be accomplished
during trouble call. 3 Low Minor disruption to facility function. Repair to failure may be longer than
trouble call but does not delay Mission. 4 Low to Moderate Moderate disruption to facility function. Some portion of Mission may need
to be reworked or process delayed. 5 Moderate Moderate disruption to facility function. 100% of Mission may need to be
reworked or process delayed. 6 Moderate to High Moderate disruption to facility function. Some portion of Mission is lost.
Moderate delay in restoring function. 7 High High disruption to facility function. Some portion of Mission is lost. Signifi-
cant delay in restoring function. 8 Very High High disruption to facility function. All of Mission is lost. Significant delay
in restoring function. 9 Hazard Potential Safety, Health or Environmental issue. Failure will occur with
warning. 10 Hazard Potential Safety, Health or Environmental issue. Failure will occur without
warning c. Although this chart can be used for a qualitative (without data) analysis or a quantitative (with data) analysis, some facilities may choose the following categories to assign another familiar format of severity classifications for the quantitative criticality analysis. These categories are used to "flag" the analysts to items with high severity. d. Do not use this method to categorize severity in a qualitative analysis. The qualitative analysis re-quires an equal scale (i.e. 1 through 10, or 1 through 5) for both severity and occurrence. If they are not equal, one category will hold more "weight" than the other in the criticality analysis. (1) Category I - Minor: A failure not serious enough to cause injury, property damage or system damage, but which will result in unscheduled maintenance or repair. (2) Category II - Marginal: A failure which may cause minor injury, minor property damage, or mi-nor system damage which will result in delay or loss of availability or mission degradation. (3) Category III - Critical: A failure which may cause severe injury or major system damage which will result in mission loss. A significant delay in restoring function to the system will occur.

TM 5-698-4
3-16
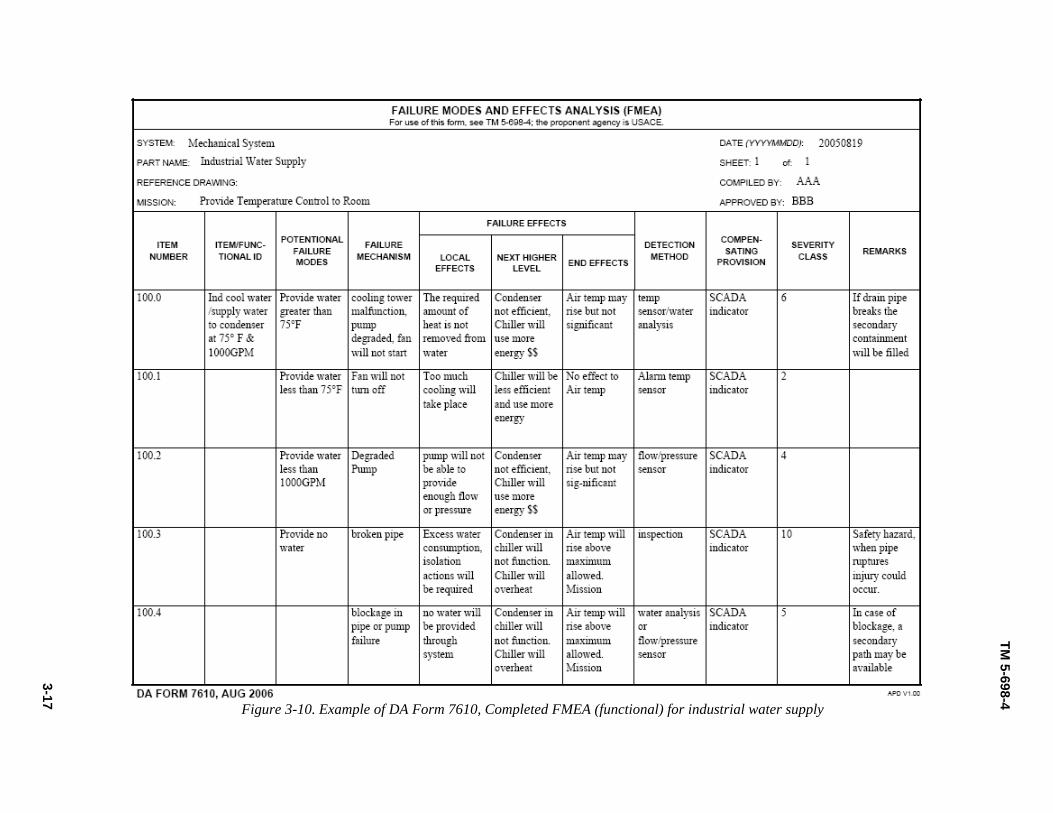
(4) Category IV - Catastrophic: A failure which may cause death or lack of ability to carry out mis-sion without warning (power failure, over-heating). e. A FMEA at the component level will have high severity rankings due to the fact that there is no re-dundancy at that level. At the system level, however, the severity may decrease due to the fact that when there is loss of one component in the system, there is a backup in place. The mission of the system at this indenture level is not compromised assuming the backup component or system is functional. f. If there are any special remarks or comments that need to be recorded should be included in the "REMARKS" category at the end of the FMEA. This should include specific hazards or explanations of the failure mode effects or other categories associated with it. g. An example of a completed functional FMEA of only the Industrial Cooling Water Supply is pro-vided in figure 3-10. Hardware FMEA’s on all of the systems are shown in figure 3-11. Notice that the functional FMEA did not include any redundancy as a consideration when assigning the effects. 3-10. Results of the FMEA The team should now review the information on the FMEA to determine if any changes should be made. It is not uncommon for people to think of more failure modes or detection methods on items during the process. Make these changes or additions prior to proceeding on to the Criticality Analysis. a. Once all of the information has been entered into the FMEA, the foundation for the Criticality Analysis has been established. The FMEA sheet will be referenced while creating the Criticality Analy-sis. Due to the amount of information on the FMEA, it is not feasible to include all of it on the CA. Con-sequently, a different sheet, which includes some of the information from the FMEA, will be used for the FMECA. b. In this particular example, a FMEA should also be conducted on the remaining systems of the HVAC System: the chilled water supply; the air handling system; and, the AC power supply system. c. Once they are completed the steps discussed in the next section for the criticality analysis should be applied in order to complete the FMECA process.
3-17
TM 5-698-4
Figure 3-10. Example of DA Form 7610, Completed FMEA (functional) for industrial water supply
3-18
TM 5-698-4
Figure 3-11. Example of DA Form 7610, Completed FMEA (hardware) for HVAC system

3-19
TM 5-698-4
Figure 3-11. Example of DA Form 7610, Completed FMEA (hardware) for HVAC system (cont’d)

3-20
TM 5-698-4
Figure 3-11.Example of DA Form 7610, Completed FMEA (hardware) for HVAC system (cont’d)