Electrical Infrastructure Design Methodology of Dynamic and ...
15
energies Article Electrical Infrastructure Design Methodology of Dynamic and Static Charging for Heavy and Light Duty Electric Vehicles Alberto Danese 1, * , Michele Garau 2 , Andreas Sumper 1 and Bendik Nybakk Torsæter 2 Citation: Danese, A.; Garau, M.; Sumper, A.; Torsæter, B.N. Electrical Infrastructure Design Methodology of Dynamic and Static Charging for Heavy and Light Duty Electric Vehicles. Energies 2021, 14, 3362. https://doi.org/10.3390/en14123362 Academic Editor: Kari Tammi Received: 19 April 2021 Accepted: 2 June 2021 Published: 8 June 2021 Publisher’s Note: MDPI stays neutral with regard to jurisdictional claims in published maps and institutional affil- iations. Copyright: © 2021 by the authors. Licensee MDPI, Basel, Switzerland. This article is an open access article distributed under the terms and conditions of the Creative Commons Attribution (CC BY) license (https:// creativecommons.org/licenses/by/ 4.0/). 1 Centre d’Innovació Tecnològica en Convertidors Estàtics i Accionaments (CITCEA-UPC), Escola Tècnica Superior d’Enginyeria Industrial de Barcelona (ETSEIB), Universitat Politècnica de Catalunya (UPC), Av. Diagonal, 647, Pl. 2, 08028 Barcelona, Spain; [email protected] 2 SINTEF Energy Research, 7465 Trondheim, Norway; [email protected] (M.G.); [email protected] (B.N.T.) * Correspondence: [email protected] Abstract: Full electrification of the transport sector is a necessity to combat climate change and a pressing societal issue: climate agreements require a fuel shift of all the modes of transport, but while uptake of passenger electric vehicles is increasing, long haul trucks rely almost completely on fossil fuels. Providing highways with proper charging infrastructure for future electric mobility demand is a problem that is not fully investigated in literature: in fact, previous work has not addressed grid planning and infrastructure design for both passenger vehicles and trucks on highways. In this work, the authors develop a methodology to design the electrical infrastructure that supplies static and dynamic charging for both modes of transport. An algorithm is developed that selects substations for the partial electrification of a highway and, finally, the design of the electrical infrastructure to be implemented is produced and described, assessing conductors and substations sizing, in order to respect voltage regulations. The system topology of a real highway (E18 in Norway) and its traffic demand is analyzed, together with medium-voltage substations present in the area. Keywords: electric vehicles; electric trucks; heavy duty vehicles; catenary charging; fast charging stations; inductive charging; grid planning; highway electrification 1. Introduction Electrification of the transport sector is central to meeting the Paris Climate agreements. In the Declaration on Electro-Mobility, parties recognized the need to electrify at least 20% of all the road transport vehicles by 2030 [1]. Currently, Heavy Duty Vehicles (HDVs) account for less than 5% of road vehicles in the EU, but are responsible for about a quarter of the total CO 2 emissions from road transport [2], and one-third in Germany [3]. The electrification of HDVs present challenges different from passenger vehicles such as high power demand, longer distance traveled compared to EVs. Truck fuel efficiency has stagnated in the last 20 years [4] and emissions have increased by 15% between 1990 and 2014, with Nordic countries increasing their fleet sizes faster than average. Future demand of long-haul transport is also expected to grow further: in Norway, the freight sector is expected to grow by 35–40% by 2040 [5]. For these reasons, the European Parliament is setting short-term targets on new HDV fleets (including specifically large lorries and heavy trucks) in order to lower their emission performance standards by 15% in 2025 and 30% by 2030 compared to 2019 [2]. Currently, the standards for high-power chargers have been developed up to 600 kW with a growing interest in mega-chargers up to 1 MW [6]. With battery sizes that range from 300 kWh up to 1 MWh [6], charging time is a major problem for the electrification of HDVs. The introduction of a large battery can reduce maximum payload, -20% for a 825 kWh battery, also negatively affecting the available space for goods [7]. On the one hand, the market of electric batteries is experiencing a process of constant innovation, Energies 2021, 14, 3362. https://doi.org/10.3390/en14123362 https://www.mdpi.com/journal/energies
-
Upload
khangminh22 -
Category
Documents
-
view
1 -
download
0
Transcript of Electrical Infrastructure Design Methodology of Dynamic and ...
energies
Article
Electrical Infrastructure Design Methodology of Dynamic andStatic Charging for Heavy and Light Duty Electric Vehicles
Alberto Danese 1,* , Michele Garau 2 , Andreas Sumper 1 and Bendik Nybakk Torsæter 2
�����������������
Citation: Danese, A.; Garau, M.;
Sumper, A.; Torsæter, B.N. Electrical
Infrastructure Design Methodology
of Dynamic and Static Charging for
Heavy and Light Duty Electric
Vehicles. Energies 2021, 14, 3362.
https://doi.org/10.3390/en14123362
Academic Editor: Kari Tammi
Received: 19 April 2021
Accepted: 2 June 2021
Published: 8 June 2021
Publisher’s Note: MDPI stays neutral
with regard to jurisdictional claims in
published maps and institutional affil-
iations.
Copyright: © 2021 by the authors.
Licensee MDPI, Basel, Switzerland.
This article is an open access article
distributed under the terms and
conditions of the Creative Commons
Attribution (CC BY) license (https://
creativecommons.org/licenses/by/
4.0/).
1 Centre d’Innovació Tecnològica en Convertidors Estàtics i Accionaments (CITCEA-UPC), Escola TècnicaSuperior d’Enginyeria Industrial de Barcelona (ETSEIB), Universitat Politècnica de Catalunya (UPC),Av. Diagonal, 647, Pl. 2, 08028 Barcelona, Spain; [email protected]
2 SINTEF Energy Research, 7465 Trondheim, Norway; [email protected] (M.G.);[email protected] (B.N.T.)
* Correspondence: [email protected]
Abstract: Full electrification of the transport sector is a necessity to combat climate change and apressing societal issue: climate agreements require a fuel shift of all the modes of transport, but whileuptake of passenger electric vehicles is increasing, long haul trucks rely almost completely on fossilfuels. Providing highways with proper charging infrastructure for future electric mobility demand isa problem that is not fully investigated in literature: in fact, previous work has not addressed gridplanning and infrastructure design for both passenger vehicles and trucks on highways. In this work,the authors develop a methodology to design the electrical infrastructure that supplies static anddynamic charging for both modes of transport. An algorithm is developed that selects substationsfor the partial electrification of a highway and, finally, the design of the electrical infrastructure to beimplemented is produced and described, assessing conductors and substations sizing, in order torespect voltage regulations. The system topology of a real highway (E18 in Norway) and its trafficdemand is analyzed, together with medium-voltage substations present in the area.
Keywords: electric vehicles; electric trucks; heavy duty vehicles; catenary charging; fast chargingstations; inductive charging; grid planning; highway electrification
1. Introduction
Electrification of the transport sector is central to meeting the Paris Climate agreements.In the Declaration on Electro-Mobility, parties recognized the need to electrify at least 20%of all the road transport vehicles by 2030 [1]. Currently, Heavy Duty Vehicles (HDVs)account for less than 5% of road vehicles in the EU, but are responsible for about a quarterof the total CO2 emissions from road transport [2], and one-third in Germany [3]. Theelectrification of HDVs present challenges different from passenger vehicles such as highpower demand, longer distance traveled compared to EVs. Truck fuel efficiency hasstagnated in the last 20 years [4] and emissions have increased by 15% between 1990 and2014, with Nordic countries increasing their fleet sizes faster than average. Future demandof long-haul transport is also expected to grow further: in Norway, the freight sector isexpected to grow by 35–40% by 2040 [5]. For these reasons, the European Parliament issetting short-term targets on new HDV fleets (including specifically large lorries and heavytrucks) in order to lower their emission performance standards by 15% in 2025 and 30% by2030 compared to 2019 [2].
Currently, the standards for high-power chargers have been developed up to 600 kWwith a growing interest in mega-chargers up to 1 MW [6]. With battery sizes that rangefrom 300 kWh up to 1 MWh [6], charging time is a major problem for the electrificationof HDVs. The introduction of a large battery can reduce maximum payload, −20% for a825 kWh battery, also negatively affecting the available space for goods [7]. On the onehand, the market of electric batteries is experiencing a process of constant innovation,
Energies 2021, 14, 3362. https://doi.org/10.3390/en14123362 https://www.mdpi.com/journal/energies
Energies 2021, 14, 3362 2 of 16
especially in terms of energy density; on the other hand, given the climate goals to bereached globally, it is highly recommended that the use of batteries be minimized, freeingup storage capacity for the overall electrification of the energy system and potentiallydecreasing its societal costs [8]. For electrification to be realized for both LDVs and HDVsthrough plug-in charging, mega-chargers have to be built along main corridors for HDVsin addition to normal FCSs for LDVs. An alternative solution for the electrification ofHDVs, especially on long-routes transport networks, is represented by dynamic charging:conductive, based on catenary charging, or inductive. This possibility shows the need toinvestigate how the electrical infrastructure can be designed, through these technologies,to electrify both passenger vehicles, indicated from now on as Light Duty Vehicles (LDVs),and HDVs on highways.
The authors of [9] assessed the demand and costs for Great Britain electrificationdue to dynamic inductive charging for both LDVs and HDV, analyzing different kinds oftransport networks, including rural areas and motorways. In [10], the authors assessed thecost-effectiveness of the implementation of plug-in and dynamic technologies (catenaryand inductive) depending on the traffic flow. In [11], the authors compared the energyand the power demand of plug-in, dynamic, hydrogen, and power-to-fuel electrificationstrategies for a real case study (the E39 highway in Western Norway).
To the best of the authors’ knowledge, the present article represents the first workthat details a comprehensive methodology to support power system planners in design-ing charging infrastructure on highways, taking into account both static, inductive, andcatenary charging technologies together with real data. The developed design procedurefocuses on grid planning, implementing a geospatial analysis which makes use of OpenStreet Maps (OSM) for the localization of substations and the analysis of the transportnetwork. Differently from [11], the methodology described in this article simulates realisticplug-in charging of electric vehicles and provides a data-driven approach to locate and sizethe electric infrastructure for different charging technologies. In fact, a limitation of [11]is that static charging is used only by LDVs and vehicles are charging only the energyconsumed while driving, with no estimation of initial and final State of Charge (SoC),which greatly affects the energy demand on the plug-in charging infrastructure. Threedifferent electrification scenarios are considered:
• Static: LDVs and HDVs charge at static charging stations located along the highway.• Inductive: LDVs and HDVs are supplied by dynamic inductive charging infrastructure
along the route.• Hybrid: LDVs charge at static charging stations, and HDVs are supplied by the
dynamic catenary charging infrastructure.
These three scenarios are considered for a highway route (E18 in Norway) that passesthrough both rural and urban areas.
The presented paper has the following structure: Section 2 introduces charging tech-nologies, with particular focus on dynamic technologies; Section 3 reports, in detail, themethodology developed to design the charging infrastructure from a grid planning per-spective; Section 4 shows the results of the implementation of the Methodology on a realcase study: outcomes are described and visualized both spatially and analytically; Section 5describes the overall conclusions and contributions of the paper.
2. Charging Technologies
Charging technologies for Electric Vehicles (EVs) can be classified according in thefollowing three main categories:
Plug-in chargers Most of the chargers are slow private chargers connected to the low-voltage network. A large part of the publicly accessible fast chargers presents powercharacteristics suitable for passenger vehicle charging, but chargers for HDVs areincreasing sensibly in the last years, with power that ranges from 150 up to 400 kW. Itfollows that Direct Current Fast Charging (DCFC) stations with rated power designed

Energies 2021, 14, 3362 3 of 16
for high-power electric trucks on highways can be directly connected to the medium-voltage grid [12].
Inductive charging In an inductive charging system, energy is transferred wirelesslythrough the magnetic field: the scheme resembles the magnetic pairing of a trans-former, where a transmitter coil beneath the asphalt of the road represents the primaryside, and a receiver coil located beneath the vessel of the car represents the secondaryside. Coils and switches below the surface of the road energize small road segments(1–50 m) when a vehicle is positioned above them. The scheme resembles the mag-netic pairing of a transformer, where a transmitter coil beneath the asphalt of theroad represents the primary side, and a receiver coil located beneath the vessel ofthe car represents the secondary side. Alternating Current (AC) electricity is usuallysupplied through power inverters at 400V AC. Inductive technology is assessedto be characterized by higher costs than other alternatives, but allows both LDVsand HDVs to charge without the installation of a pick-up element. AC electricity issupplied through inverters usually at 400V AC.
Catenary charging The catenary charging scheme resembles the one of a DC railwaypower supply, although sizing the catenary system can result in being more complexthan for trains: factors such as time schedule and distances between HDVs cannot beregulated as easily as for trains/metros. The complexity of the load demand from theaggregation of several trucks, with different conditions of slope, distance betweeneach other, etc., will not be analyzed in depth since it is not in the scope of the article.Traction substations typically include transformers and uncontrolled 6 or 12 pulsediode-based rectifiers, or in some cases, an AC–DC bi-directional converter. Despitethe fact that they do not generate imbalances, they can generate high harmonicpollution. Bi-directional converters can be installed as substitutes for or in parallel torectifiers to take advantage of the energy regenerated during breaking or downhillsegments and to inject electricity back into the grid [13].
Static plug-in charging is the dominant technology to charge EVs: in 2019, chargingstations surpassed 7 million units [12]. Dynamic technologies, on the other hand, areless widespread: inductive charging technology is still characterized by a low TRL (3–4),and conductive charging based on catenary has achieved TRL 7 in 2018, and it is expectedto reach TRL 8–9 in 2020, since there are no major technical constraints to hinder itsdevelopment [14]. Several pilot projects are in place in small fragments of highways inSweden (2 km), California (1.6 km), three field trials in Germany with the most advancedpilot ELISA (5 km) and, finally, a catenary infrastructure to be constructed in NorthernItaly (6 km in the short term and up to 62 km) with the integration of PV panels along thehighway [15]. Siemens and involved partners (Scania, road operators etc.) implementedthose electrification projects with hybrid trucks equipped with small batteries (around20 kWh). With an average consumption of 2.24 kWh/km, the trucks would not be able toreach 10 km of full electric autonomy [11]. Taking into account this limiting factor, pilotswere designed with a concept of full, 100% electrification of a particular stretch selected fortests. At the same time, the market of long-haul full electric trucks is experiencing a rapidchange: the market expects products such as Tesla Semi (Long range up to 965 km) or BYDT9 (already available with more than 200 km of full electric capacity) [6] and are opening upto new possibilities in terms of electrification concepts and designs. Independently of thechosen technology, whether inductive or conductive, the layout of the system from the HighVoltage (HV) grid to the side of the road is the same: a series of distribution substationstransforms the electricity to the Medium Voltage (MV) level (typically 20–30 kV) andtransfers it along the road through a feeder. Finally, transformers called traction substationsconvert it to the low-voltage side that supplies the elements on the road. The level atwhich both systems are run presents the drawback of requiring high currents in the lines,increasing voltage drops and forcing planners to install low-voltage elements relativelynear to each other. For example, Siemens implemented pilot schemes in which catenarytraction substations are placed at 2 km one from each other, although having declared that
Energies 2021, 14, 3362 4 of 16
the maximum distance can be increased up to 10 km [14]. Few papers have investigatedthe impact of the implementation of catenary technology on the energy system and itsimpact on the sustainability of the transport sector. The authors of [16] make use of amarket diffusion model to forecast electric truck penetration and an energy system modelto quantify the added demand and cost-optimal investment in power system from thelong-term implementation of catenary charging across Europe. The peak load wouldincrease by 2%, while electricity demand would grow by 3% by 2040. The authors concludethat even with no added renewable sources in the power system, the increased efficiencyof electric engine would still drive down transport emissions, and by up to 10% by 2040 inNordic countries considering optimistic scenarios. Similarly, the authors of [17] quantify,through a detailed life-cycle analysis (LCA), that as long as electricity production is notcoal-based, life-cycle emissions, inclusive of the infrastructure, are lower for electric trucksusing catenary charging. The greenhouse gas (GHG) payback time is mainly dependent onthe traffic: the more HDVs that are passing an electrified road, the lower the payback time.This result is also confirmed in [18], which quantified reductions in CO2 emissions of up to55% by electrifying 40% of national and European main highways in Sweden.
3. Methodology3.1. Preliminary Design Considerations
The design scheme of the charging infrastructure depends on several factors, suchas the regulatory frameworks of the country or the region where the infrastructure isbuilt, the actors involved in the infrastructure development and operations, and finally thedistance of the highway from the electrical network.
A first fundamental design choice must be made as to whether a new dedicateddistribution grid is put in place or the charging infrastructure is fed through an extension ofthe existing grid. In the first case, planners should evaluate the distance from the existingtransmission grid (420–300–220 kV) or regional grid (145–132–66 kV) to the highway tolocate points of the supply connections and decrease the length of the supply cables as wellas the costs of the infrastructure. In the case that the design choice is implementing anextension of the grid, the MV substations in the proximity of the road are listed andcharacterized in terms of their distance from the highway through a proximity analysis.Moreover, the load profile of these substations should be assessed by adding the mobilityelectrical demand on top of the existing base load (for residential or industrial uses) in orderto verify that the load increase does not lead to an overload of the transformer. Theseparameters, distance and load profile, can serve as a basis for the selection of the optimalsubstations for the electrification.
At the same time, it is relevant to highlight that the load assessment can be difficult torealize: in fact, transformer data must be anonymized due to privacy and security concerns.For the purpose of this paper, the methodology used implements an extension of the grid.
A second design choice takes into account whether to electrify the whole highwaystretch or to implement a partial electrification strategy. In [19], the authors suggest that anideal scheme should present electrified stretches between 24 and 64 km depending on thetraffic flow, with an overall Electrification Ratio (ER) of 50%, which is the optimal ER inorder to minimize the total cost of batteries and infrastructure.
3.2. Vehicle Energy Consumption Models
In order to assess the demand of the electric mobility, two energy models wereimplemented: a static model that estimates the energy supplied by the Charging Stations(CSs) and a dynamic model for both the catenary and inductive charging technologies.
3.2.1. Static Energy Model
The energy that is supplied through plug-in charging is calculated by running asimulation in which each vehicle entering in the highway is characterized in terms of thefollowing parameters:
Energies 2021, 14, 3362 5 of 16
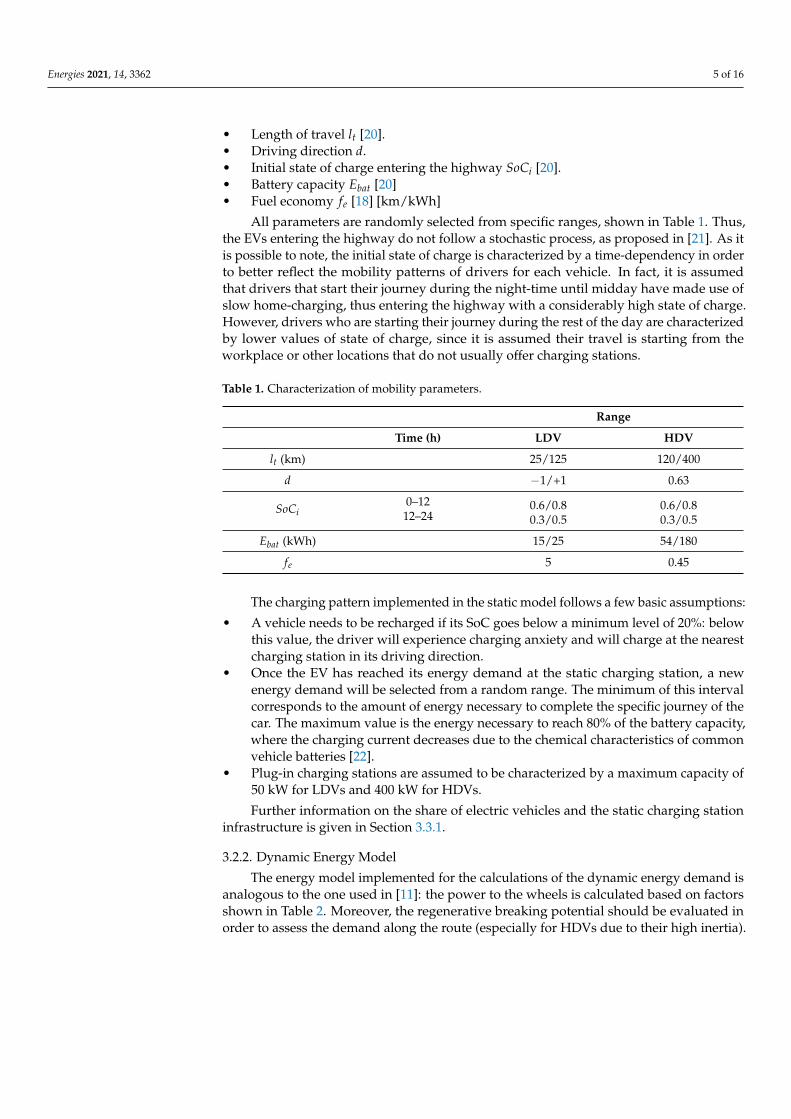
• Length of travel lt [20].• Driving direction d.• Initial state of charge entering the highway SoCi [20].• Battery capacity Ebat [20]• Fuel economy fe [18] [km/kWh]
All parameters are randomly selected from specific ranges, shown in Table 1. Thus,the EVs entering the highway do not follow a stochastic process, as proposed in [21]. As itis possible to note, the initial state of charge is characterized by a time-dependency in orderto better reflect the mobility patterns of drivers for each vehicle. In fact, it is assumedthat drivers that start their journey during the night-time until midday have made use ofslow home-charging, thus entering the highway with a considerably high state of charge.However, drivers who are starting their journey during the rest of the day are characterizedby lower values of state of charge, since it is assumed their travel is starting from theworkplace or other locations that do not usually offer charging stations.
Table 1. Characterization of mobility parameters.
Range
Time (h) LDV HDV
lt (km) 25/125 120/400
d −1/+1 0.63
SoCi0–1212–24
0.6/0.80.3/0.5
0.6/0.80.3/0.5
Ebat (kWh) 15/25 54/180
fe 5 0.45
The charging pattern implemented in the static model follows a few basic assumptions:
• A vehicle needs to be recharged if its SoC goes below a minimum level of 20%: belowthis value, the driver will experience charging anxiety and will charge at the nearestcharging station in its driving direction.
• Once the EV has reached its energy demand at the static charging station, a newenergy demand will be selected from a random range. The minimum of this intervalcorresponds to the amount of energy necessary to complete the specific journey of thecar. The maximum value is the energy necessary to reach 80% of the battery capacity,where the charging current decreases due to the chemical characteristics of commonvehicle batteries [22].
• Plug-in charging stations are assumed to be characterized by a maximum capacity of50 kW for LDVs and 400 kW for HDVs.
Further information on the share of electric vehicles and the static charging stationinfrastructure is given in Section 3.3.1.
3.2.2. Dynamic Energy Model
The energy model implemented for the calculations of the dynamic energy demand isanalogous to the one used in [11]: the power to the wheels is calculated based on factorsshown in Table 2. Moreover, the regenerative breaking potential should be evaluated inorder to assess the demand along the route (especially for HDVs due to their high inertia).
Energies 2021, 14, 3362 6 of 16
Table 2. Dynamic Energy model: parameters characterization.
LDV HDV
Mass (kg) 1500 40,000
Air resistance coefficient 0.3 0.63
Front area of the vehicle (m2) 2.1 3
Average speed (km/h) 80 80
Acceleration values (m/s2) 1.5 1
Rolling resistance coefficient 0.012 0.007
3.3. Charging Infrastructure Scenarios
Three main charging scenarios are discussed, and a corresponding design methodol-ogy is proposed.
The static scenario, as the name may suggest, makes use of the Static Energy Modelfor both LDVs and HDVs. The inductive scenario solely uses the Dynamic Energy Modelfor both LDVs and HDVs as a basis for the Substation Selection Algorithm. Finally, in theHybrid Scenario, both energy models are used: firstly, the dynamic energy demand ofHDVs is calculated and used as an input for the substation selection algorithm. Successively,static energy demand of LDVs is calculated and distributed along the substations selected.
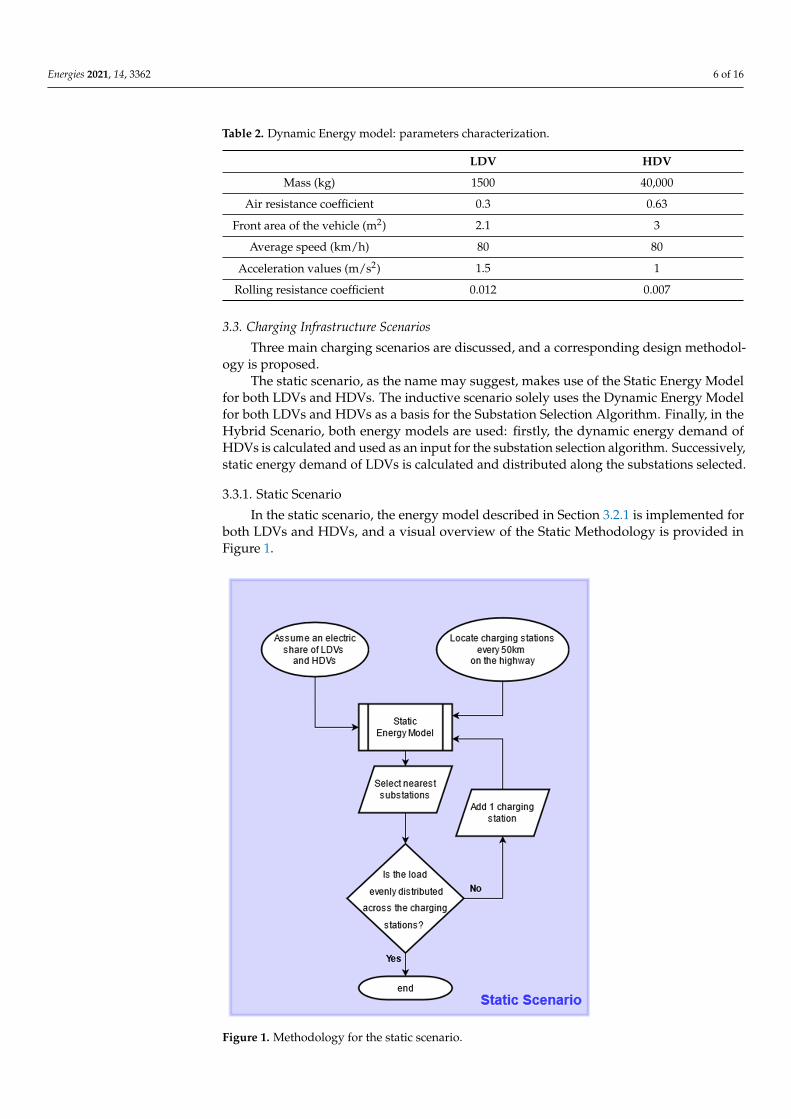
3.3.1. Static Scenario
In the static scenario, the energy model described in Section 3.2.1 is implemented forboth LDVs and HDVs, and a visual overview of the Static Methodology is provided inFigure 1.
1
Figure1
Figure 1. Methodology for the static scenario.
Energies 2021, 14, 3362 7 of 16
• As a first step, it is necessary to assume a share of electric vehicles to be electrified:based on current policies, it is expected that in 2030, up to 25% of all road transportvehicles will be electric. In order to meet global climate goals, this percentage shouldincrease up to 45% [12].
• The locations of the charging stations are defined based on heuristics: charging stationswere located every 50 km in line with the recommendation of the European JointResearch Center. It is stated that for every highway direction, a maximum distance of60 km would provide adequate infrastructure [23]. The first charging station is locatedon the stretch in order that its distance from the entry point of the road is below 50 km,and the following stations are located along the highway applying a space interval of50 km.
• A first load assessment is carried out to detect if the traffic demand is split between thestations in an even way. If the simulation output shows one or multiple stations thatare loaded substantially more than the average station along the highway, because ofthe traffic conditions, then another charging station is added in order to flatten anddistribute the demand.
3.3.2. Inductive Scenario
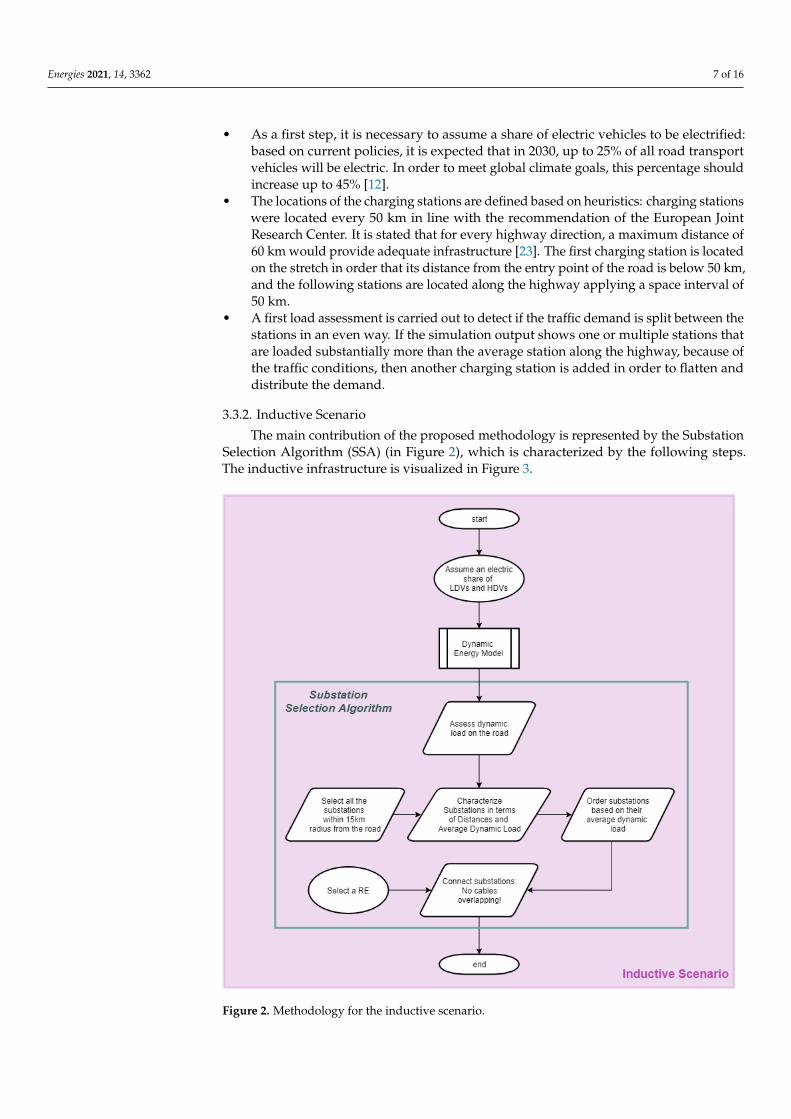
The main contribution of the proposed methodology is represented by the SubstationSelection Algorithm (SSA) (in Figure 2), which is characterized by the following steps.The inductive infrastructure is visualized in Figure 3.
Figure 2. Methodology for the inductive scenario.
Energies 2021, 14, 3362 8 of 16
2
Figure3
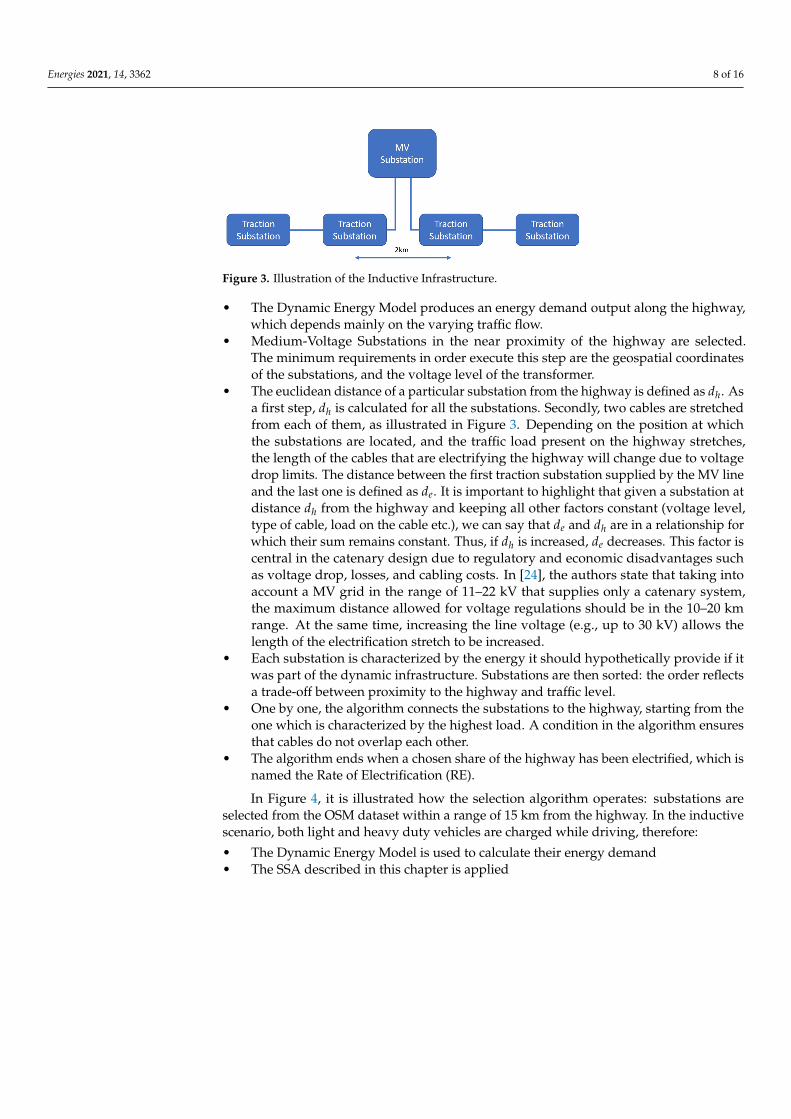
Figure 3. Illustration of the Inductive Infrastructure.
• The Dynamic Energy Model produces an energy demand output along the highway,which depends mainly on the varying traffic flow.
• Medium-Voltage Substations in the near proximity of the highway are selected.The minimum requirements in order execute this step are the geospatial coordinatesof the substations, and the voltage level of the transformer.
• The euclidean distance of a particular substation from the highway is defined as dh. Asa first step, dh is calculated for all the substations. Secondly, two cables are stretchedfrom each of them, as illustrated in Figure 3. Depending on the position at whichthe substations are located, and the traffic load present on the highway stretches,the length of the cables that are electrifying the highway will change due to voltagedrop limits. The distance between the first traction substation supplied by the MV lineand the last one is defined as de. It is important to highlight that given a substation atdistance dh from the highway and keeping all other factors constant (voltage level,type of cable, load on the cable etc.), we can say that de and dh are in a relationship forwhich their sum remains constant. Thus, if dh is increased, de decreases. This factor iscentral in the catenary design due to regulatory and economic disadvantages suchas voltage drop, losses, and cabling costs. In [24], the authors state that taking intoaccount a MV grid in the range of 11–22 kV that supplies only a catenary system,the maximum distance allowed for voltage regulations should be in the 10–20 kmrange. At the same time, increasing the line voltage (e.g., up to 30 kV) allows thelength of the electrification stretch to be increased.
• Each substation is characterized by the energy it should hypothetically provide if itwas part of the dynamic infrastructure. Substations are then sorted: the order reflectsa trade-off between proximity to the highway and traffic level.
• One by one, the algorithm connects the substations to the highway, starting from theone which is characterized by the highest load. A condition in the algorithm ensuresthat cables do not overlap each other.
• The algorithm ends when a chosen share of the highway has been electrified, which isnamed the Rate of Electrification (RE).
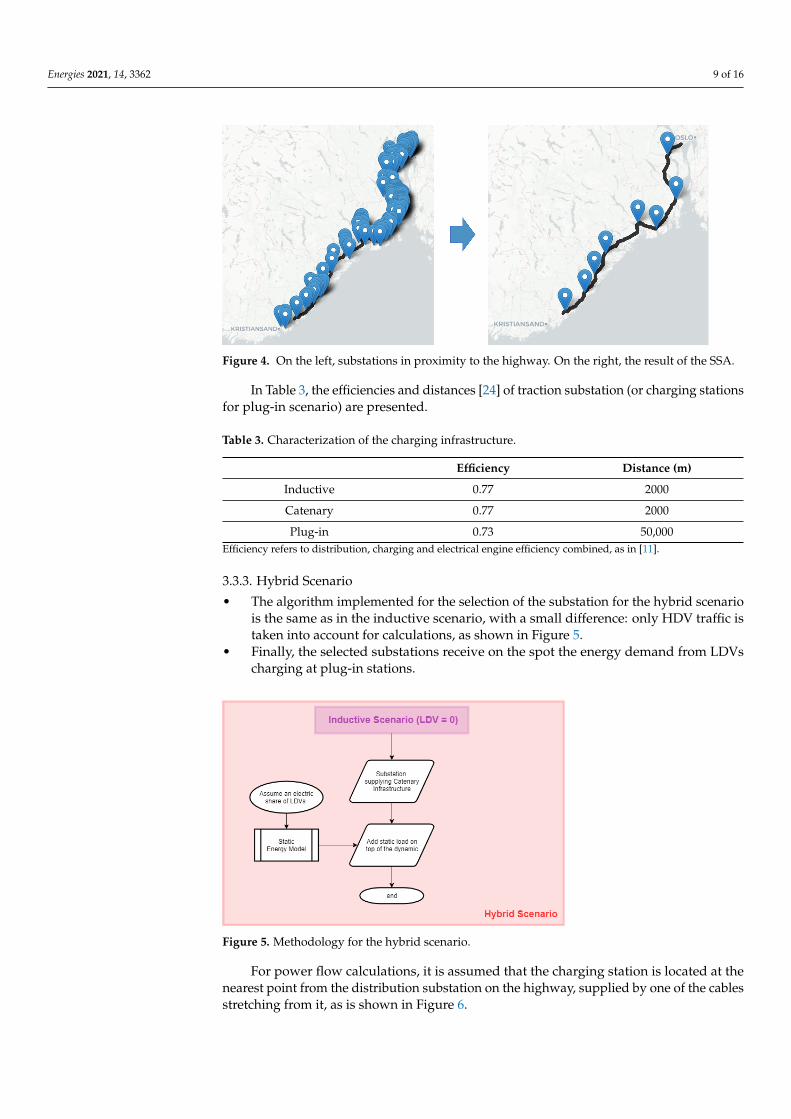
In Figure 4, it is illustrated how the selection algorithm operates: substations areselected from the OSM dataset within a range of 15 km from the highway. In the inductivescenario, both light and heavy duty vehicles are charged while driving, therefore:
• The Dynamic Energy Model is used to calculate their energy demand• The SSA described in this chapter is applied
Energies 2021, 14, 3362 9 of 16
Figure 4. On the left, substations in proximity to the highway. On the right, the result of the SSA.
In Table 3, the efficiencies and distances [24] of traction substation (or charging stationsfor plug-in scenario) are presented.
Table 3. Characterization of the charging infrastructure.
Efficiency Distance (m)
Inductive 0.77 2000
Catenary 0.77 2000
Plug-in 0.73 50,000Efficiency refers to distribution, charging and electrical engine efficiency combined, as in [11].
3.3.3. Hybrid Scenario
• The algorithm implemented for the selection of the substation for the hybrid scenariois the same as in the inductive scenario, with a small difference: only HDV traffic istaken into account for calculations, as shown in Figure 5.
• Finally, the selected substations receive on the spot the energy demand from LDVscharging at plug-in stations.
Figure 5. Methodology for the hybrid scenario.
For power flow calculations, it is assumed that the charging station is located at thenearest point from the distribution substation on the highway, supplied by one of the cablesstretching from it, as is shown in Figure 6.
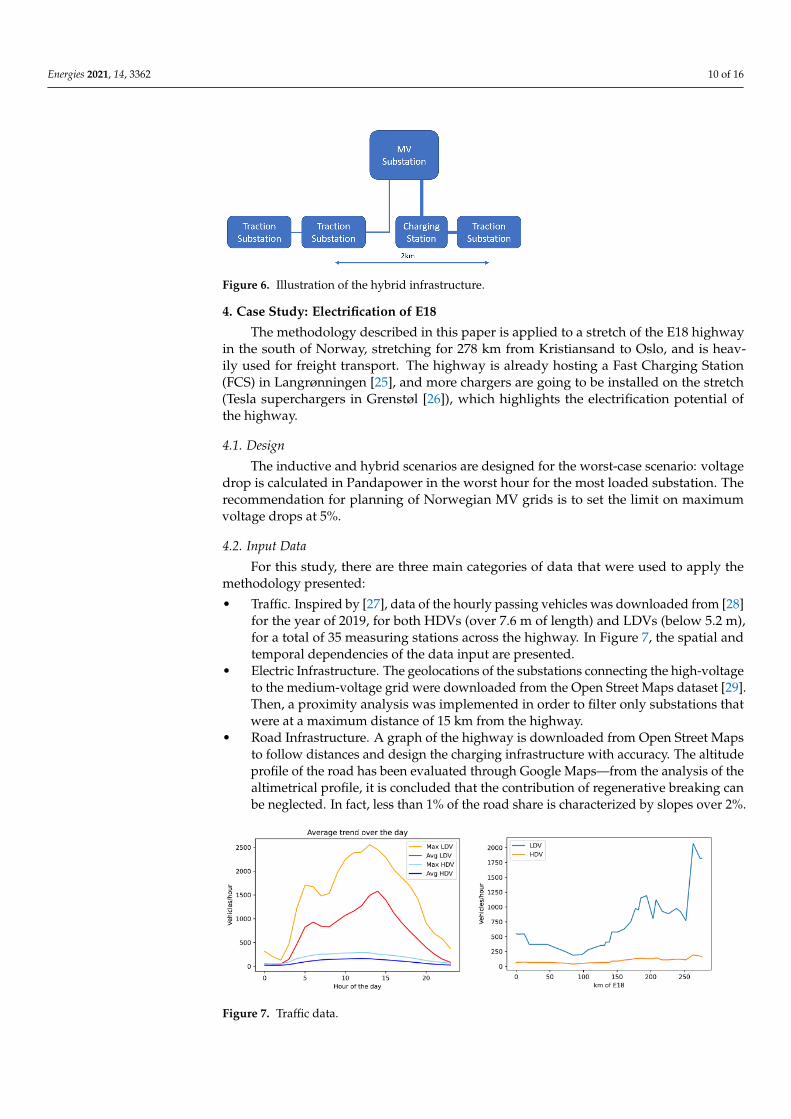
Energies 2021, 14, 3362 10 of 16
3
Figure6
Figure 6. Illustration of the hybrid infrastructure.
4. Case Study: Electrification of E18
The methodology described in this paper is applied to a stretch of the E18 highwayin the south of Norway, stretching for 278 km from Kristiansand to Oslo, and is heav-ily used for freight transport. The highway is already hosting a Fast Charging Station(FCS) in Langrønningen [25], and more chargers are going to be installed on the stretch(Tesla superchargers in Grenstøl [26]), which highlights the electrification potential ofthe highway.
4.1. Design
The inductive and hybrid scenarios are designed for the worst-case scenario: voltagedrop is calculated in Pandapower in the worst hour for the most loaded substation. Therecommendation for planning of Norwegian MV grids is to set the limit on maximumvoltage drops at 5%.
4.2. Input Data
For this study, there are three main categories of data that were used to apply themethodology presented:
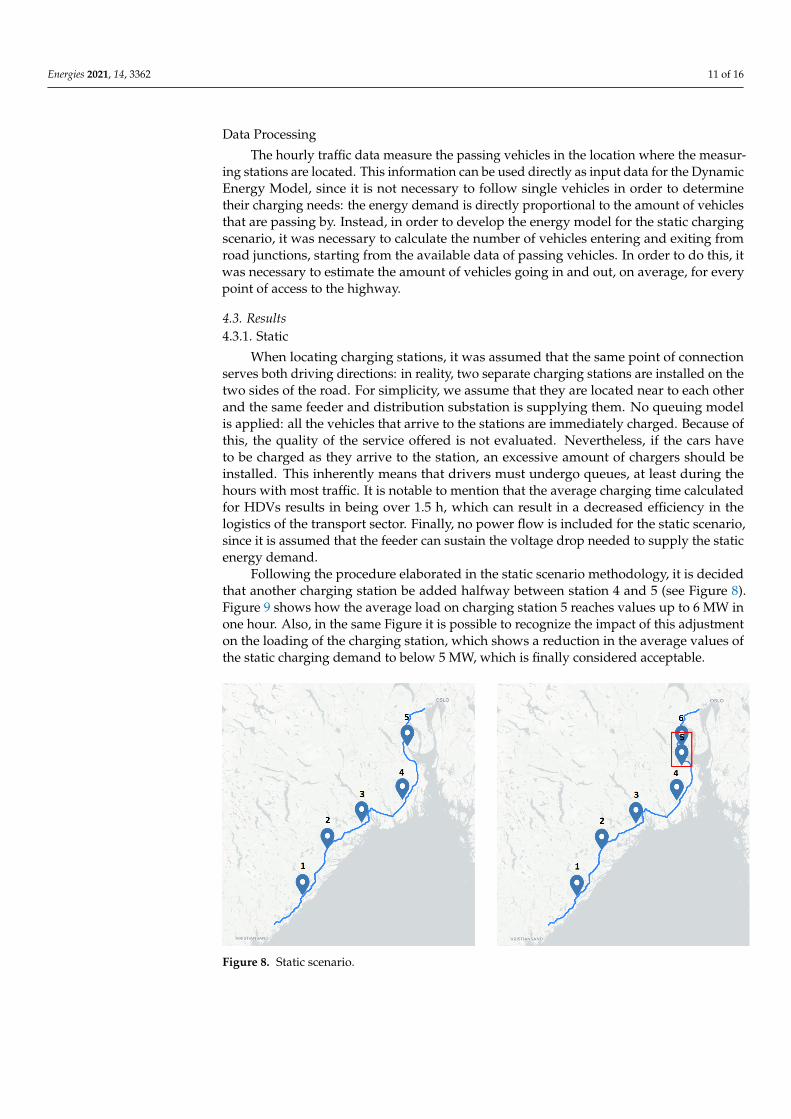
• Traffic. Inspired by [27], data of the hourly passing vehicles was downloaded from [28]for the year of 2019, for both HDVs (over 7.6 m of length) and LDVs (below 5.2 m),for a total of 35 measuring stations across the highway. In Figure 7, the spatial andtemporal dependencies of the data input are presented.
• Electric Infrastructure. The geolocations of the substations connecting the high-voltageto the medium-voltage grid were downloaded from the Open Street Maps dataset [29].Then, a proximity analysis was implemented in order to filter only substations thatwere at a maximum distance of 15 km from the highway.
• Road Infrastructure. A graph of the highway is downloaded from Open Street Mapsto follow distances and design the charging infrastructure with accuracy. The altitudeprofile of the road has been evaluated through Google Maps—from the analysis of thealtimetrical profile, it is concluded that the contribution of regenerative breaking canbe neglected. In fact, less than 1% of the road share is characterized by slopes over 2%.
Figure 7. Traffic data.
Energies 2021, 14, 3362 11 of 16
Data Processing
The hourly traffic data measure the passing vehicles in the location where the measur-ing stations are located. This information can be used directly as input data for the DynamicEnergy Model, since it is not necessary to follow single vehicles in order to determinetheir charging needs: the energy demand is directly proportional to the amount of vehiclesthat are passing by. Instead, in order to develop the energy model for the static chargingscenario, it was necessary to calculate the number of vehicles entering and exiting fromroad junctions, starting from the available data of passing vehicles. In order to do this, itwas necessary to estimate the amount of vehicles going in and out, on average, for everypoint of access to the highway.
4.3. Results4.3.1. Static
When locating charging stations, it was assumed that the same point of connectionserves both driving directions: in reality, two separate charging stations are installed on thetwo sides of the road. For simplicity, we assume that they are located near to each otherand the same feeder and distribution substation is supplying them. No queuing modelis applied: all the vehicles that arrive to the stations are immediately charged. Because ofthis, the quality of the service offered is not evaluated. Nevertheless, if the cars haveto be charged as they arrive to the station, an excessive amount of chargers should beinstalled. This inherently means that drivers must undergo queues, at least during thehours with most traffic. It is notable to mention that the average charging time calculatedfor HDVs results in being over 1.5 h, which can result in a decreased efficiency in thelogistics of the transport sector. Finally, no power flow is included for the static scenario,since it is assumed that the feeder can sustain the voltage drop needed to supply the staticenergy demand.
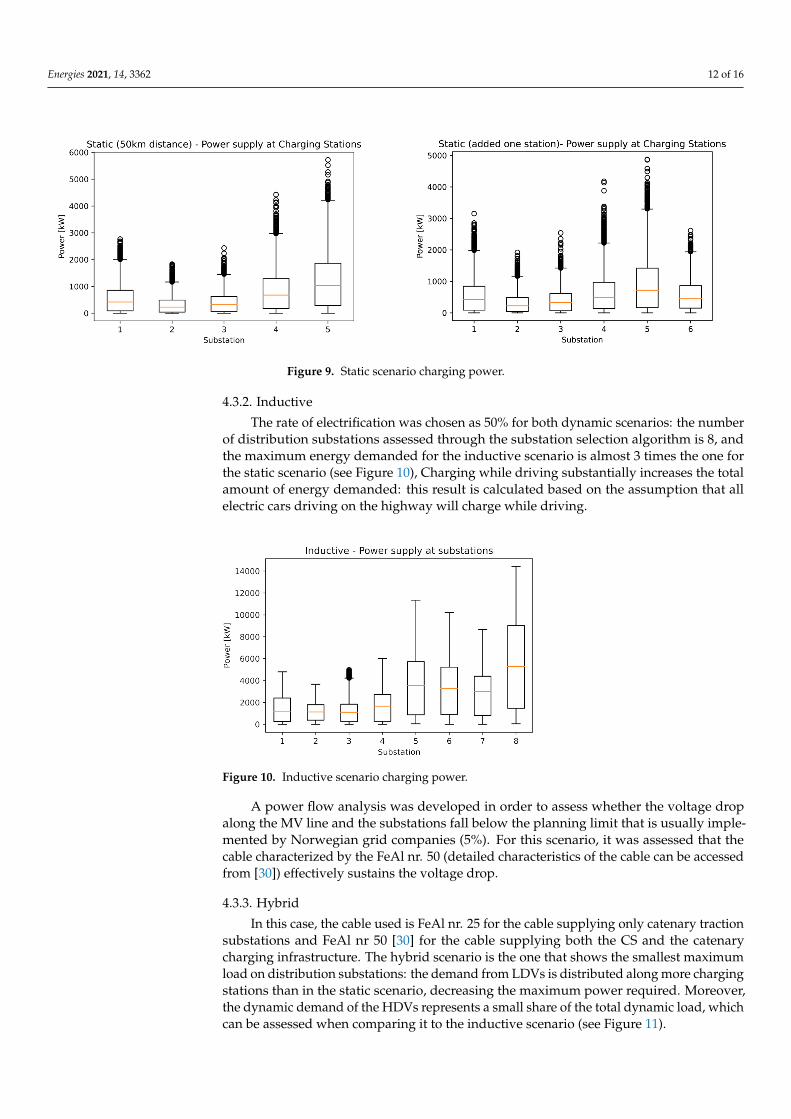
Following the procedure elaborated in the static scenario methodology, it is decidedthat another charging station be added halfway between station 4 and 5 (see Figure 8).Figure 9 shows how the average load on charging station 5 reaches values up to 6 MW inone hour. Also, in the same Figure it is possible to recognize the impact of this adjustmenton the loading of the charging station, which shows a reduction in the average values ofthe static charging demand to below 5 MW, which is finally considered acceptable.
Figure 8. Static scenario.
Energies 2021, 14, 3362 12 of 16
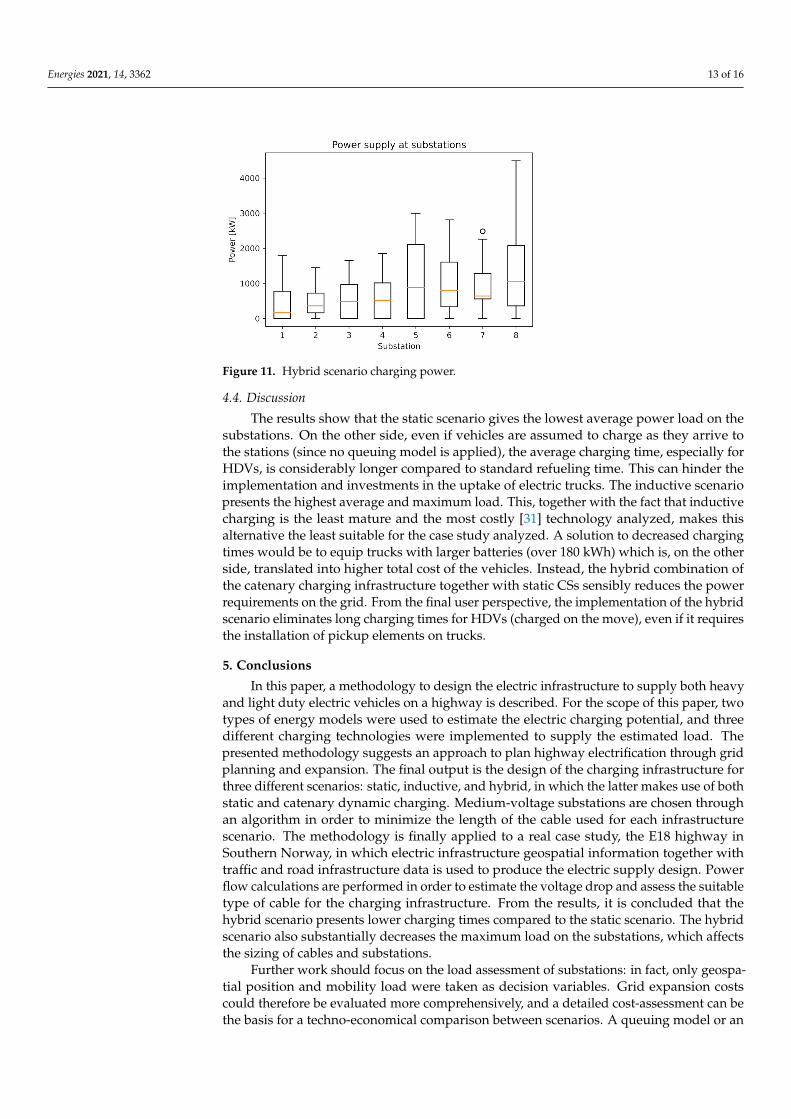
Figure 9. Static scenario charging power.
4.3.2. Inductive
The rate of electrification was chosen as 50% for both dynamic scenarios: the numberof distribution substations assessed through the substation selection algorithm is 8, andthe maximum energy demanded for the inductive scenario is almost 3 times the one forthe static scenario (see Figure 10), Charging while driving substantially increases the totalamount of energy demanded: this result is calculated based on the assumption that allelectric cars driving on the highway will charge while driving.
Figure 10. Inductive scenario charging power.
A power flow analysis was developed in order to assess whether the voltage dropalong the MV line and the substations fall below the planning limit that is usually imple-mented by Norwegian grid companies (5%). For this scenario, it was assessed that thecable characterized by the FeAl nr. 50 (detailed characteristics of the cable can be accessedfrom [30]) effectively sustains the voltage drop.
4.3.3. Hybrid
In this case, the cable used is FeAl nr. 25 for the cable supplying only catenary tractionsubstations and FeAl nr 50 [30] for the cable supplying both the CS and the catenarycharging infrastructure. The hybrid scenario is the one that shows the smallest maximumload on distribution substations: the demand from LDVs is distributed along more chargingstations than in the static scenario, decreasing the maximum power required. Moreover,the dynamic demand of the HDVs represents a small share of the total dynamic load, whichcan be assessed when comparing it to the inductive scenario (see Figure 11).
Energies 2021, 14, 3362 13 of 16
Figure 11. Hybrid scenario charging power.
4.4. Discussion
The results show that the static scenario gives the lowest average power load on thesubstations. On the other side, even if vehicles are assumed to charge as they arrive tothe stations (since no queuing model is applied), the average charging time, especially forHDVs, is considerably longer compared to standard refueling time. This can hinder theimplementation and investments in the uptake of electric trucks. The inductive scenariopresents the highest average and maximum load. This, together with the fact that inductivecharging is the least mature and the most costly [31] technology analyzed, makes thisalternative the least suitable for the case study analyzed. A solution to decreased chargingtimes would be to equip trucks with larger batteries (over 180 kWh) which is, on the otherside, translated into higher total cost of the vehicles. Instead, the hybrid combination ofthe catenary charging infrastructure together with static CSs sensibly reduces the powerrequirements on the grid. From the final user perspective, the implementation of the hybridscenario eliminates long charging times for HDVs (charged on the move), even if it requiresthe installation of pickup elements on trucks.
5. Conclusions
In this paper, a methodology to design the electric infrastructure to supply both heavyand light duty electric vehicles on a highway is described. For the scope of this paper, twotypes of energy models were used to estimate the electric charging potential, and threedifferent charging technologies were implemented to supply the estimated load. Thepresented methodology suggests an approach to plan highway electrification through gridplanning and expansion. The final output is the design of the charging infrastructure forthree different scenarios: static, inductive, and hybrid, in which the latter makes use of bothstatic and catenary dynamic charging. Medium-voltage substations are chosen throughan algorithm in order to minimize the length of the cable used for each infrastructurescenario. The methodology is finally applied to a real case study, the E18 highway inSouthern Norway, in which electric infrastructure geospatial information together withtraffic and road infrastructure data is used to produce the electric supply design. Powerflow calculations are performed in order to estimate the voltage drop and assess the suitabletype of cable for the charging infrastructure. From the results, it is concluded that thehybrid scenario presents lower charging times compared to the static scenario. The hybridscenario also substantially decreases the maximum load on the substations, which affectsthe sizing of cables and substations.
Further work should focus on the load assessment of substations: in fact, only geospa-tial position and mobility load were taken as decision variables. Grid expansion costscould therefore be evaluated more comprehensively, and a detailed cost-assessment can bethe basis for a techno-economical comparison between scenarios. A queuing model or an

Energies 2021, 14, 3362 14 of 16
admission mechanism (which redirect vehicles to nearby stations) should be applied inorder to assess a realistic design of the static scenario. In fact, the assumption that vehiclescharge as they arrive can substantially increase the maximum load on charging stations.Moreover, it could be relevant to add a user perspective and the EV users’ possible impacton the overall waiting times. Finally, there is a need to further investigate the proposedarchitecture with different traffic conditions: even if the main contribution of the studyrelies on the formulated methodology, a sensitivity analysis of the traffic volume could beevaluated for a future scientific study.
Author Contributions: Conceptualization, A.D., A.S. and B.N.T.; methodology, A.D., M.G. andB.N.T.; data curation, A.D.; writing—original draft preparation, A.D.; writing—review and editing,A.D. and M.G.; visualization, A.D; supervision, A.S. and B.N.T.; project administration, A.S. andB.N.T. All authors have read and agreed to the published version of the manuscript.
Funding: The authors would like to thank the Research Council of Norway and industry part-ners for the support in writing this paper under project 295133/E20 FuChar—Grid and ChargingInfrastructure of the Future, https://www.sintef.no/projectweb/fuchar/.
Data Availability Statement: The data characterizing traffic volume on the highway was taken fromhttps://www.vegvesen.no/ (accessed on 20 May 2020). The geospatial data involving the highwayand the electric system topography was accessed from https://www.openstreetmap.org/ (accessedon 27 January 2021).
Acknowledgments: The authors would like to thank Maria Taljegård from Chalmers University andEirik Ivarsøy at NTNU for their inputs and availability to improve our work and assumptions.
Conflicts of Interest: The authors declare no conflict of interest.
References1. UNFCCC. The Paris Declaration on Electro-Mobility and Climate Change and Call to Action; UNFCCC: New York, NY, USA, 2015.2. European Parliament. Regulation of the European Parliament and of the Council setting CO2 Emission Performance Standards for New
Heavy-Duty Vehicles; Technical Report; European Parliament: Brussels, Belgium, 2018.3. Gnann, T.; Plötz, P.; Kühn, A.; Wietschel, M. How to Decarbonise Heavy Road Transport? ECEEE Summer Study; European Council
for an Energy-Efficient Economy: Stockholm, Sweden, 2017.4. Muncrief, R. Shell Game? Debating Real-World Fuel Consumption Trends for Heavy-Duty Vehicles in Europe; International Council on
Clean Transportation: San Francisco, CA, USA, 2017.5. Kenny, S.; Cornelis, S.; Sihvonen, J.; Ambel, C.C. Roadmap to Climate-Friendly Land Freight and Buses in Europe; Technical Report;
Transport & Environment: Brussels, Belgium, 2017.6. Bunsen, T.; Cazzola, P.; D’Amore, L.; Gorner, M.; Scheffer, S.; Schuitmaker, R.; Signollet, H.; Tattini, J.; Paoli, J.T.L. Global EV
Outlook 2019 to Electric Mobility; OECD: Paris, France, 2019; p. 232.7. Mareev, I.; Becker, J.; Sauer, D.U. Battery dimensioning and life cycle costs analysis for a heavy-duty truck considering the
requirements of long-haul transportation. Energies 2018, 11, 55. [CrossRef]8. Langhelle, O.; Bohne, R.; Nørbech, T.E. Electric Roads in Norway? Summary of a Concept Analysis; Technical Report; SINTEF:
Trondheim, Norway, 2018.9. Nicolaides, D.; McMahon, R.; Cebon, D.; Miles, J. A national power infrastructure for charge-on-the-move: An appraisal for
Great Britain. IEEE Syst. J. 2019, 13, 720–728. [CrossRef]10. Marquez-Fernandez, F.J.; Domingues-Olavarria, G.; Lindgren, L.; Alakula, M. Electric roads: The importance of sharing the
infrastructure among different vehicle types. In Proceedings of the 2017 IEEE Transportation Electrification Conference and Expo,Asia-Pacific, Harbin, China, 7–10 August 2017. [CrossRef]
11. Taljegard, M.; Göransson, L.; Odenberger, M.; Johnsson, F. Spacial and dynamic energy demand of the E39 highway-Implicationson electrification options. Appl. Energy 2017. [CrossRef]
12. IEA. Global EV Outlook 2020; IEA: Paris, France, 2020. [CrossRef]13. Arboleya, P.; Mayet, C.; Mohamed, B.; Aguado, J.A.; de La Torre, S. A Review of Railway Feeding Infrastructures: Mathematical
Models for Planning and Operation. eTransportation 2020, 5, 100063. [CrossRef]14. Suul, J.A.; Guidi, G. Technology for Dynamic On-Road Power Transfer to Electric Vehicles—Overview and Electro-Technical Evaluation of
the State-of-the-Art for Conductive and Inductive Power Transfer Technologies; ELinGo: Freiburg, Germany, 2018.15. Volkswagenag. Towards a ‘Zero Impact’ eHighway; Volkswagenag: Wolfsburg, Germany, 2018.16. Plötz, P.; Gnann, T.; Jochem, P.; Ümitcan Yilmaz, H.; Kaschub, T. Impact of electric trucks powered by overhead lines on the
European electricity system and CO2 emissions. Energy Policy 2019. [CrossRef]

Energies 2021, 14, 3362 15 of 16
17. Schulte, J.; Ny, H. Electric road systems: Strategic stepping stone on the way towards sustainable freight transport? Sustainability2018, 10, 1148. [CrossRef]
18. Taljegard, M.; Thorson, L.; Odenberger, M.; Johnsson, F. Large-scale implementation of electric road systems: Associated costsand the impact on CO2 emissions. Int. J. Sustain. Transp. 2019, 1–14. [CrossRef]
19. Zhao, H.; Qian, W.; Fulton, L.; Jaller, M.; Burke, A. A Comparison of Zero-Emission Highway Trucking Technologies; University ofCalifornia Institute of Transportation Studies: Berkeley, CA, USA, 2018; p. 58. [CrossRef]
20. Malik, F.H.; Lehtonen, M. Analysis of power network loading due to fast charging of Electric Vehicles on highways. InProceedings of the 2016 Electric Power Quality and Supply Reliability (PQ), Tallinn, Estonia, 29–31 August 2016; pp. 101–106.[CrossRef]
21. Ivarsøy, E.; Torsæter, B.N.; Korpås, M. Stochastic Load Modeling of High-Power Electric Vehicle Charging—A Norwegian CaseStudy. In Proceedings of the 2020 International Conference on Smart Energy Systems and Technologies (SEST), Istanbul, Turkey,7–9 September 2020; pp. 1–6. [CrossRef]
22. Ji, H.; Zhang, W.; Pan, X.; Hua, M.; Chung, Y.; Shu, C.; Zhang, L. State of health prediction model based on internal resistance.Int. J. Energy Res. 2020, 44, 6502–6510. [CrossRef]
23. Gkatzoflias, D.; Drossinos, Y.; Zubaryeva, A.; Zambelli, P.; Dilara, P.; Thiel, C.; Doi, E. Optimal Allocation of Electric Vehicle ChargingInfrastructure in Cities and Regions; Technical Report; European Commission: Luxembourg, 2016. [CrossRef]
24. Rennemo, O.; Hjelkrem, O.A.; Terje, K.; Suul, J.; Brauhaus, P.; Aamodt, A. Energy and Infrastructure-Demands and RequirementsWork Package 3; Technical Report; 2018. Available online: https://www.sintef.no/globalassets/project/elingo/18-0733-rapport-5-memo-work-package-3-til-nett.pdf (accessed on 20 May 2020).
25. Skoglund, J. Her Blir Det Mulighet for påfyll og hvile: Det 36 mål Store Veiserviceanlegget åpner før Sommeren; Veier24.No: Oslo,Norway, 2019.
26. Tesla. Tesla Superchargers |Tesla. Available online: https://chargeatlas.com/by_id/grenstolsupercharger.html (accessed on 20May 2020).
27. Berg, K.; Hjelkrem, O.A.; Torsæter, B.N. A proposed methodology for modelling the combined load of electric roads andhouseholds for long-term grid planning. In Proceedings of the 2020 17th International Conference on the European EnergyMarket (EEM), Stockholm, Sweden, 16–18 September 2020. [CrossRef]
28. Trafficadata. Available online: https://www.vegvesen.no/ (accessed on 20 May 2020).29. OPS. OpenStreetMap. Available online: https://www.openstreetmap.org/ (accessed on 27 January 2021).30. Ivars, E. Optimal Planning of Fast Charging Stations for EVs—A Norwegian Case Study. Master’s Thesis, NTNU, Trondheim,
Norway, 2020.31. Gustavsson, M.G.H.; Hacker, F. Overview of ERS Concepts and Complementary Technologies; Swedish-German Research Collaboration
on Electric Road Systems, Ed.; Technical Report; CollERS Report; 2019. Available online: https://www.electricroads.org/report-overview-of-ers-concepts-and-complementary-technologies/ (accessed on 20 May 2020).
https://www.sintef.no/globalassets/project/elingo/18-0733-rapport-5-memo-work-package-3-til-nett.pdf