INFRASTRUCTURE DEVELOPMENT
136
530 CHAPTER 7 INFRASTRUCTURE DEVELOPMENT 7.1 ENERGY (i) POWER 1. Availability of reliable Power is a vital prerequisite for sustained economic growth and development. India has made substantial progress in the development of power sector since Independence. As a result, the installed generation capacity which was only 1300 MW at the time of Independence, has gone up to more than 1,00,000 MW today. Along with the growth in installed generation capacity, there has been a phenomenal increase in transmission & distribution capacity also. Despite these achievements, the country continues to face energy and peaking shortages. 2. In spite of State Electricity Boards (SEBs) having a greater role in the generation and supply of power, in the past , their financial health has been a matter of concern. This is mainly due to subsidised tariff for Agriculture and Domestic Consumers and high T& D losses in the system, which often disguise large scale theft, low billing and poor collection. 3. During Ninth Plan number of policy initiatives were taken namely; setting of Regulatory Commission at Centre and State level, unbundling /corporatisation of SEBs in to separate companies for generation, transmission and distribution, drafting of new electricity bill to replace the existing laws relating to electricity and one time settlement of outstanding dues of CPSUs etc. However, private investors continue to have apprehension about the bank ability of the SEBs In fact, it has been one of the main reasons for short- fall in capacity addition during the Ninth Plan. The capacity addition achieved during the Ninth Plan was only 19015 MW only (47.2% of the target) as against the capacity addition target of 40245 MW. The improvement in PLF from a level of 64.4% in 1996-97 to 69.9% in 2001- 02 has been a facilitating factor in managing the peak and energy shortages in the country. 4. Tenth Plan envisages a capacity addition programme of 41110 MW . To achieve the Tenth Plan objectives, the Government proposes to take a number of new policy initiatives and is committed to carry forward Power Sector Reforms (PSR) aggressively to improve the financial health of the SEBs and make the sector competitive and viable. Some of the key reform objectives are : (a) rationalising power tariff and making tariff setting process transparent, b) encourage competition and private participation in each element of the electricity value chain and carry forward reforms in distribution sector through redesigning APDP as APDRP (Accelerated Power Development and Reform Programme) with provision for release of funds linked to achievement of certain parameters and bench mark etc.
-
Upload
khangminh22 -
Category
Documents
-
view
0 -
download
0
Transcript of INFRASTRUCTURE DEVELOPMENT

530
CHAPTER 7
INFRASTRUCTURE DEVELOPMENT
7.1 ENERGY
(i) POWER
1. Availability of reliable Power is a vital prerequisite for sustained economic growth anddevelopment. India has made substantial progress in the development of power sectorsince Independence. As a result, the installed generation capacity which was only 1300MW at the time of Independence, has gone up to more than 1,00,000 MW today. Alongwith the growth in installed generation capacity, there has been a phenomenal increase intransmission & distribution capacity also. Despite these achievements, the countrycontinues to face energy and peaking shortages.
2. In spite of State Electricity Boards (SEBs) having a greater role in the generation andsupply of power, in the past , their financial health has been a matter of concern. This ismainly due to subsidised tariff for Agriculture and Domestic Consumers and high T& Dlosses in the system, which often disguise large scale theft, low billing and poor collection.
3. During Ninth Plan number of policy initiatives were taken namely; setting ofRegulatory Commission at Centre and State level, unbundling /corporatisation of SEBs in toseparate companies for generation, transmission and distribution, drafting of new electricitybill to replace the existing laws relating to electricity and one time settlement of outstandingdues of CPSUs etc. However, private investors continue to have apprehension about thebank ability of the SEBs In fact, it has been one of the main reasons for short- fall incapacity addition during the Ninth Plan. The capacity addition achieved during the NinthPlan was only 19015 MW only (47.2% of the target) as against the capacity addition targetof 40245 MW. The improvement in PLF from a level of 64.4% in 1996-97 to 69.9% in 2001-02 has been a facilitating factor in managing the peak and energy shortages in the country.
4. Tenth Plan envisages a capacity addition programme of 41110 MW . To achieve theTenth Plan objectives, the Government proposes to take a number of new policy initiativesand is committed to carry forward Power Sector Reforms (PSR) aggressively to improve thefinancial health of the SEBs and make the sector competitive and viable. Some of the keyreform objectives are : (a) rationalising power tariff and making tariff setting processtransparent, b) encourage competition and private participation in each element of theelectricity value chain and carry forward reforms in distribution sector through redesigningAPDP as APDRP (Accelerated Power Development and Reform Programme) with provisionfor release of funds linked to achievement of certain parameters and bench mark etc.

531
REVIEW OF ANNUAL PLAN 2001-02
Generation of Electricity (Utilities)
5. Against a target of 539.5 Billion Units (BU), actual generation during the year was515.271 BU, representing a marginal shortfall of 0.5 %. In the case of the hydel andthermal generation the achievement was 88.9% and 96.3% respectively. However, thenuclear generation exceeded the target by 7.7%. The total generation during 2001-02 washigher than that in 2000-01 by 3.1%.
6. In addition to the above, about 1.4 Bkwh of electricity also became available fromChukha Hydel project in Bhutan.
7. The source-wise generation targets and achievements for 2001-2002 with actual for2000-2001 and projections for 2002-2003 in respect of utilities are given in Table 7.1.1
8. The region-wise break-up of actual generation in 2001-2002 is given in Annexure7.1.1
9. During 2001-2002, the target for All India Plant Load Factor (PLF) was 69.9% forthermal stations. As against this, the achievement based on Actual-cum-Assessment was69.9%. Table 7.1.2 gives the sector-wise break-up of PLFs for the year 2000-2001 (Actual),2001-2002 (Target) and (Actual) and 2002-2003(Target). The target and achievement inregard to PLF for all State Electricity Boards, Central Power Organisations and PrivateSector are indicated in Annexure 7.1.2
Table 7.1.1
Source-wise Electricity Generation(Million Units)
Source 2000-2001 2001-2002 2001-2002 2002-2003Actual Target Actual Target
Hydro 74481 83241 73992 82814
Thermal 408139 438356 422001 445558
Nuclear 16928 17903 19278 17180
Total 499548 539500 * 515271 545552*Target revised
Table 7.1.2
Sector-wise Plant Load Factor (%)
Sector 2000-2001 2001-2002 2001-2002 2002-03Actual Target Achievement Target
Central Sector 74.3 72.8 74.3 74.8
State Sector 65.6 67.9 67.0 68.2
Private Sector 73.1 73.3 74.7 74.0
All India 69.0 69.9 69.9 70.8

532
Addition in capacity
10. The target for addition to generating capacity during 2001-2002 was 4764.70 MWagainst which the achievement was 3115.20 MW (65.4%) as given in the Table 7.1.3. Thiscomprised 656.1 MW capacity (2 units of 250 MW each at Suratgarh TPP St-II and 156.1MW from Hazira CCPP) commissioned outside the programme.
Table 7.1.3
Addition in Capacity (MW)
Source 2000-2001 2001-2002 2001-2002 2002-2003Actual Target Achievement Target
Hydel 1285.00 1536.20 1106.20 607.00
Thermal 2173.97 3228.50 2009.00 3502.10
Nuclear 440.00 0.00 0.00 0.00
Total 3898.97 4764.70 3115.20 4109.10
11. The project-wise details of achievements are given in Annexure 7.1.3. There were 25generating units totaling 2340.6 MW which have slipped from 2001-2002 generatingcapacity addition programme. This comprised 445 MW of hydro (10 generating units) and1895.6 MW of thermal( 15 generating units). The complete list is at Annexure 7.1.4.
Transmission & Distribution
12. The programme and achievement in respect of construction/ energisation of 800 KV/400 KV/ 220 KV transmission lines is given in Table 7.1.4.
Table 7.1.4
Transmission Lines additions(Ckt. kms)
Transmission 2000-2001 2001-2002 2001-2002 2002-2003Lines Additions Actual Target Achievement Target
+/- 500 KV HVDC 680 800 636
800 KV 375 224 51 173
400 KV 2091 1780 1780 3198
220 KV 3674 4240 3543 3024
Renovation & Modernization (R&M)
13. Since 1984 Renovation & Modernization is considered as the most cost-effectiveoption to maximize the generation from the existing generation capacity. Phase-I of R&MProgramme taken up in September 1984 for execution during the Seventh Plan covered163 thermal units with a total capacity of 13,570 MW at 34 selected power stations in thecountry. The programme was successfully completed in the year 1991-92 at a total cost of

533
Rs. 1066 crore. An average additional generation of 10,000 MU/Year was achieved asagainst the targeted benefits of 7000 MU/Year after completion of the programme.
14. Encouraged with the results of Phase-I of the R&M programme, Phase-II was takenup in 1990-91 for 44 Thermal Power Stations comprising 198 units with a total capacity of20,870 MW. The Programme was estimated to cost Rs. 2383 crore and was scheduled tobe completed during the Eighth Plan. An additional generation of 7864 MU/Year wasanticipated after completion of the programme. However, many utilities could not implementtheir, R&M Schemes on schedule, due to non-availability of funds.
15. As a result, by the end of Eighth Plan, only around 50% of the works could becompleted yielding an additional generation of 5000 MU/year. The remaining R&M activitiesunder Phase II, were taken up during the Ninth Plan period. The works for 153 thermalunits are at various stages of completion and is anticipated to be completed during theTenth Plan period.
16. By the end of the 9th Plan, Life Extension Work on 28 units (with a total capacity of1981 MW ) was taken up. Out of this, 19 units have been completed and the remaining 9units, it is anticipated to be completed by March, 2003. The life of the units covered by theprogramme is likely to be extended by 12-15 years.
17. Constraints on the R&M and Life Extension Programmes
l Non-availability of timely and adequate funds due to poor financial health of most SEBs/Utilities.
l Delay in obtaining loans from PFC due to non-fulfilment of loan conditionalities.
l Procedural delays in formulation of schemes and finalisation of orders by SEBs/ Utilities.
l Reluctance on the part of the State Electricity Board to undertake renovation and modernizationas this leads to the units going out of the system temporarily thereby lowering generation.
18. In the Ninth Plan, 36 Hydro schemes (23 under Phase-I and 13 under Phase II), withan aggregate installed capacity of 9,001 MW, were identified for Renovation, Modernizationand Uprating (RM&U) work at an estimated cost of Rs. 917.30 crore. The (RM&U)programme was estimated to add 1,609 MW of capacity and enhance generation by 4,987MU.
19. Of these 36 schemes, RM&U work has so far been completed on 18 hydro schemeswith an aggregate installed capacity of 4,860 MW at an estimated cost of Rs. 554 croreand benefits expected to accrue are to the tune of 1,123 MW/3,350 MU. Of the remaining18 RM&U schemes, five, with an aggregate installed capacity of 369 MW, have beendeclared “closed” and work on four, with an aggregate installed capacity of 380 MW, is yetto commence. The balance nine schemes, with an aggregate installed capacity of 3,392MW, are under various stages of implementation.
534
Financial Performance of SEBs
20. The SEBs continue to incur commercial losses which is a matter of concern.Commercial losses of SEBs without subsidy increased from the level of Rs. 11305 crore in1996-97 to Rs. 25394.89 crore in 2000-01. The estimates for 2001-02 (RE) and 2002-03(AP) asses these losses at Rs. 27560.68 crore and Rs. 24164.94 crore respectively. Theinternal resource of the SEBs continued to be negative. As per the resource discussions forthe Annual Plan 2001-2002, the net internal resources of the SEBs which were Rs.(-)2090.7 crore in 1996-97 increased to Rs (-) 15620.60 crore in 2000-01 (RE). In the year2001-2002, it was expected to be Rs.(-) 19103.90 crore.
21. In case the SEBs are to achieve break-even i.e. 0% ROR in 2001-2002, they wouldhave to raise average tariff on an All-India basis by 110 paise/unit over the current averagetariff. This would yield additional revenue of as much as Rs.33177 crore. For achieving 3%ROR, the average tariff on All-India basis has to be increased by 117 paise/unit and itwould yield additional revenue of Rs.35433 crore. If the minimum rate of 50 paise/unit ofagriculture tariff is levied by the SEBs, they could mobilise additional revenue of the orderof Rs. 1984 crore in the year 2001-2002.
Power Sector Reforms
22. The steps in regard to power sector reform were continued by unbundling the SEBsand separating generation, transmission & distribution into separate corporations to make itpossible to monitor efficiency levels on each activity as a profit center and also to createappropriate incentive for efficiency in each area. A brief on the status of reforms is givenbelow :
23. Central Electricity Regulatory Commission formed under the provisions of ElectricityRegulatory Commissions Act, 1998 has been made fully functional. The Commission haspassed orders on Availability Based Tariff and has also brought out terms and conditionsfor determination of tariff. Ninteen States namely, Orissa, Haryana, Andhra Pradesh, UttarPradesh, Karnataka, West Bengal, Tamil Nadu, Punjab, Delhi, Gujarat, Madhya Pradesh,Arunachal Pradesh, Maharashtra, Rajasthan, Himachal Pradesh, Assam, Chhatisgarh,Kerala and Uttarnchal have either constituted or notified the constitution of SERC. SERCsof Orissa, Andhra Pradesh, Uttar Pradesh, Maharashtra, Gujarat, Haryana, Karnataka,Rajastjan, Delhi, Madhya Pradesh, Himachal Pradesh and West Bengal have issued tarifforders.
24. Orissa, Haryana, Andhra Pradesh, Uttar Pradesh, Karnataka, Rajasthan, MadhyaPradesh and Delhi have enacted their State Electricity Reforms Acts which provide,interalia, for unbundling/corporatisation of SEBs, setting of SERCs, etc. The SEBs ofOrissa, Haryana. Andhra Pradesh, Karnataka, Uttar Pradesh, Rajasthan and Delhi havebeen unbundled/corporatised. The distribution companies formed after unbundling in theStates of Orissa and Delhi have been privatized.
25. Hundred per cent metering of 11 KV feeders have either been completed or is in thefinal stages of completion in Goa, Maharashtra, Gujarat, Andhra Pradesh, Karnataka, TamilNadu, Kerala, Lakhsdweep, Haryana, Himachal Pradesh, Delhi, Uttar Pradesh, MadhyaPradesh, Rajasthan and Punjab. The Ministry of Power has signed memorandums of

535
understanding (MoUs) with 20 States to undertake reforms in a time-bound manner. TheseMoUs provide for time-bound metering in two phases i.e. (i) metering of 11 KV feeders and(ii) all consumers. Monitoring is being done to ensure that the agreed milestones areachieved.
Electricity Bill 2001
26. The draft Electricity Bill, 2001 has been introduced in the Parliament. The newElectricity Bill would replace the existing three laws relating to electricity, namely :-
l The Indian Electricity Act, 1910 as amended from time to time.
l The Electricity (Supply) Act, 1948 as amended from time to time.
l The Electricity Regulatory Commission Act, 1998.
Accelerated Generation & Supply Programme (AG&SP) Scheme
27. AG&SP Scheme was initiated in the financial year 1997-98 of the Ninth Plan and wasextended upto the end of the Ninth Plan. The scheme provided incentives in the form ofinterest subsidy to SEBs/states and central power utilities. This has helped in carrying outpower development activities particularly in the state sector. The capacity addition in thestate sector achieved was around 88 per cent of the target, in which the contribution ofAG&SP was around 55 per cent. The scheme has also given boost to the renovation andmodernization (R&M) programme during the Ninth Plan period. The additional generationdue to the incentives given through AG&SP is estimated to be about 10,000 MU/annum. Ithas been proposed to be extend the AF&SP scheme to the Tenth Plan period with somemodifications.
Accelerated Power Development and Reforms Programme (APDRP)
28. A scheme on Accelerated Power Development Programme (APDP) was initiated inthe financial year (2000-01). In order to give a fillip to the reform process in the powersector, one of the main strategies identified in this regard is development of distributionplans/projects for all distribution circles as centers of Excellence that can be replicated bythe States in the later phase of distribution reforms. Sixty-three such circles under APDPfunding have been taken up initially, which envisages 11 KV feeders metering,improvement/strengthening of sub-transmission & distribution network, 100% metering,establishing of a MIS system to improve billing, collection etc. To ensure better Utilizationof funds for reforms, an Accelerated Power Development and Reforms Programme(APDRP) has been formulated by making certain modifications in the APDP scheme. It isaimed at promoting investment for distribution reforms. The funding under APDRP isproposed to be 50 per cent on investment stream and 50 percent on incentive stream. Thefocus is to ensure that investment must result in quantifiable physical and financial benefitsin the selected circles.
29. In order to avail of transition assistance, the States may have to achieve minimumeligibility as shown below :
l The State should have set up a State Electricity Regulatory Commission (SERC)

536
l SEB/Utility should have filed its first tariff petition before SER.
l SEB/Utility should have achieved a minimum of prescribed percentage reduction in cashlosses compared to the previous year.
30. An amount of Rs. 1000 crore and Rs. 1500 crore were provided during the year 2000-01 and 2001-02 respectively. As against this, an amount of Rs. 854.30 crore and Rs.477.60 crore were utilized during the year 2000-01 and 2001-02 respectively. For theAnnual Plan 2002-03, i.e. the first year of Tenth Plan, an amount of Rs. 3500 crore hasbeen provided under the APDP scheme.
Thrust Areas and Objectives of the Tenth Five Year Plan (2002-07)
31. The Tenth Five Year Plan envisages the following key reform objectives
l Rationalizing power tariffs and making the tariff setting process ransparent;
l Reflecting cost of service in the tariffs and transferring all subsidies explicitly to State budgets;
l Improving efficiency in all the three segments viz. generation, transmission and distributioneither by creating separate profit centers with full accountability within the vertically integratedstructure, or unbundling - SEBs into generation, transmission and distribution entities orthrough other model of reform depending on the choice of the State Government;
l Encouraging competition and private participation in each element of the electricity valuechain;
l Instituting open access by separating the carriage (transmission & distribution network) fromthe content (power and energy) thereby enabling customers to source their requirementsfrom the most efficient source;
l Strengthening the transmission & distribution system to reduce losses, improve metering,instituting energy audits and improving billing & collection.
l Redesigning APDP as APDRP (Accerlated Power Development and Reform Programme)with provision for release of funds linked to achievement of certain parameters andbenchmarks;
l Integrating captive generation (especially co-generation) into the power system.
l Stepping up public funding for the sector even as steps are taken to attract private investment.
l Encouraging NTPC to take up projects through joint venture with private promoters and theState Governments.
Tenth Plan Targets
32. The Tenth Plan (2002-07) envisaged a capacity addition of 41,110 MW. Of this,22,832 MW (55.6%) in Central Sector, 11,157 MW (27.1%) in the State Sector and 7,121MW (17.3%) is expected to be added in the Private Sector as given in Table 7.1.5.

537
Table 7.1.5
Sector-wise / Mode-wise Capacity AdditionDuring the Tenth Plan (MW)
Source Central State Private Total
Hydro 8742 4481 1170 14393
Thermal 12790 6676 5951 25417
Nuclear 1300 —- —- 1300
Total 22832 11157 7121 41110
Annual Plan 2002-03
Generation of Electricity (Utilities)
33. The total electricity generation in utilities in 2002-03 is targetted at 545.552 BU (Table7.1.1). Region-wise details are given in Annexure 7.1.1.
34. The total generation envisaged for 2002-03 is 1.12 % higher than the target for thepreceding year. The overall Plant Load Factor envisaged is 70.8%. Additional Energy ofabout 1.4 BU is also expected to become available from the Chukha Hydel Project inBhutan.
Addition in Capacity
35. The target for addition to installed capacity during 2002-03 is 4109.10 MW (Table7.1.3). This includes the projects aggregating to 893.6 MW capacity slipped over from2001-02.
36. The total additional generating capacity targeted for 2002-03, a capacity of 1170 MWin the Central Sector, 1147.10 MW in the State Sector and 1792 MW in the Private Sectoris expected to be commissioned. The scheme-wise details of additions to installed capacityduring 2002-03 are indicated in Annexure 7.1.5.
Plan Outlay
37. The total expenditure in the power sector (including Rural Electrification) during 2001-02 is estimated around Rs. 26309 crore against the Approved Outlay of Rs.27993 crore, asshown in Table 7.1.6.

538
38. The utilization of other provisions excluding Rural Electrification (RE) component,available for development programme in the power sector, is given in Table 7.1.7.
Captive Power
39. The addition to installed capacity in respect of Non-Utilities during 1999-2000 wasabout 569 MW. With this addition, the total installed capacity of such plants (includingRailways) is estimated to have gone upto 14660 MW (covering captive plants of 1 MWcapacity and above) by the end of March, 2000. The generation from Non-Utilities in 1999-2000 was placed at 51.525 BU approximately.
Externally Aided Power Projects
40. The year-wise allocation and actual utilization of external assistance during the NinthPlan period for power projects under Ministry of Power through bilateral and multilateralarrangements are indicated in Table 7.1.8.
Table 7.1.6
Annual Plan Outlays (Rs. crore)
Annual Plan 2000-01 2001-2002 2001-2002 2002-2003Outlays Revised Approved Revised Approved
Estimates Outlay Estimates Outlay
States & U.Ts @ 14134.88 15146.30 13431.62 Yet to befinalized
Central Sector 7931.51 12846.37 12877.23 15491.72@ (Actual)
Total (All India) 22066.39 27992.67 26308.85
@ The details are given in Annexure 7.1.6.
Table 7.1.7
Utilization of other provisions
(Rs. crore)
Utilization of 2000-01 2001-2002 2001-2002 2002-2003other provisions Actual Approved Anticipated Approved
Expenditure Outlay Expenditure Outlay
Power component 328.62 154.31 228.89 57.50of Special AreaProgramme ofNorth EasternCouncil (NEC)

539
Some of the factors contributing to non-utilisation of external aid in the case of powerprojects are deficiency in project management and delay in construction work.
Zero Based Budgeting (ZBB)
41. The ZBB exercise for the Ministry of Power (MOP) was undertaken by the PlanningCommission in consultation with the Ministry for the Annual Plan (2002-03) with a view toachieving the objectives of convergence, retention, retention with modifications, transfer toStates and weeding out of the Central Sector Scheme and Centrally Sponsored Scheme(CSS) under MOP. A summary of the same is given in table 7.1.9. The scheme-wisedetails are given in Annexure 7.1.7.
Table 7.1.8
Year-wise Allocation and Actual UtilizationDuring 1997-98 to 2001-02
(Rs. crore)
Year Allocation Utilization (%) utilization
1997-98
Central Sector 2704.00 2309.14 85.40
State Sector 1363.58 1559.07 114.34
Total 4067.58 3868.21 95.10
1998-99
Central Sector 2538.00 2179.64 85.88
State Sector 1859.06 1832.45 98.57
Total 4397.06 4012.09 91.24
1999-00
Central Sector 1724.69 1491.92 86.50
State Sector 1948.82 1751.05 89.85
Total 3673.51 3242.94 88.28
2000-01
Central Sector 1284.64 1694.42 131.90
State Sector 2220.36 1855.84 83.58
Total 3505.00 3550.26 101.29
2001-02
Central Sector 1675.43 2336.09 139.43
State Sector 2392.14 1651.67 69.05
Total 4067.57 3987.76 98.04

540
Private Participation in Power Sector
42. The policy for private Sector participation in Power was announced in October, 1991in order to bring in additionality of resources for the capacity addition programme. TheIndian Electricity Act, 1910 and the Electricity (Supply) Act, 1948 have been amended tobring about a new legal and financial environment for private enterprises in the electricitysector. The Electricity Laws (Amendment) Act, 1998 was also enacted to treat transmissionas a distinct activity and to facilitate private sector investment in transmission sector.
43. The initial response of domestic and foreign investors to the policy of privateparticipation in the power sector had been encouraging. However, many projects haveencountered unforeseen delays in the finalization of power purchase agreements,guarantees and counter-guarantees, environmental clearances, matching transmissionnetworks and legally enforceable contracts for fuel supplies. One of the most importantimpediments to private participation was the bankruptcy of the monopoly purchaser – theSEBs. This necessitated complex payment security mechanisms for achieving financialclosure. Further, the high tariff of power from some of the commissioned independentpower projects (IPPs) due to factors such as high cost of liquid fuels, risk factors involvedand unrealistic forecast for future growth of demand etc. have prevented full utilization ofavailable capacities. With the power sector reforms already set in motion, these problemsare expected to be sorted out in due course.
l The policy of inducting private investment into the power sector, initiated in 1991, was expectedto result in the addition of 17, 588 MW of power capacity in the Ninth Plan. The actualachievement was 5,061 MW, a mere 29 per cent of the target. The achievement ratio for thecentral and state sectors comparatively were higher at 38 per cent and 88 percent respectively.The main impediments have been :
(i) The chronic financial weakness of SEBs.(ii) Unviable tariffs to IPPs, due to factors such as high cost of liquid fuels, risk factors
involved and slow growth in demand for future power below the expected levels etc.(iii) The absence of an enabling regulatory, legislative and market environment.(iv) The slow pace of reform in the power sector and related sectors such as coal, transport.(v) The inability to deliver bankable contractual frameworks.
Table 7.1.9
Summary of ZBB exercise of Ministry of Power (MOP)
Sl. No. Category No. of SchemesCentral CSS
1 Schemes to be retained 5 Nil
2 Schemes to be merged 3/8 Nil
3 Schemes to be weeded out 10 1
4 Total Ninth Plan Schemes 23 1
5 Schemes continuing in the Tenth Plan 8 Nil

541
Table 7.1.10
Status of private power projects as on 1st February, 2002
Description Number Capacity (MW)
Projects techno-economicallycleared by CEA 58 29,614.50
Private power projects fullyCommissioned 15 4,427
Private power projectsunder construction 7 3,432
45. In addition, 18 private projects not requiring techno-economic clearance of the CEA,with a total capacity of about, 2,340 MW, have been commissioned and two projects withtotal capacity of 36 MW are under construction.
Energy Conservation
46. The Government has enacted the Energy Conservation Act, 2001 which provides for :
(i) The establishment of Bureau of Energy Efficiency (BEE) by merger of existing EnergyManagement Center (EMC) under Ministry of Power.
(ii) Declaring user or class of users of energy as designated consumer.(iii) Laying down minimum energy consumption standards and labeling for identified
appliances / equipments and norms for industrial processes for energy intensiveindustries.
(iv) Formulation of energy consumption codes.(v) Establishment of Energy Conservation Fund both at the Central and state Levels(vi) Penalties and adjudication. No penalties would be effective during the first five years as
the initial period of five years would be promotional and creating infrastructure for theimplementation of the Energy Conservation Act, 2001.
(vii) The BEE would facilitate the evolution of a self-regulatory system and organizations thatwill regulate on their own because saving energy also makes good commercial sense.
47. The Bureau of Energy Efficiency (BEE) has become operational and has brought outan Action plan for implementing projects and programmes on efficient use of energy and itsconservation. This Action Plan includes the formation of task forces in Cement, Pulp andPaper, Textile, Fertilizer, Chlor-Alkali and Aluminium industry sectors. Cement, Pulp andPaper and Textile industry sectors will be notified as “designated consumers”. EnergyAudits will be conducted for these designated consumers by the accredited energy auditors.The Action Plan, in addition to the activities mentioned above will also contain medium andlong term activities. The Action Plan would also address the issues relating to other thrustareas like Demand Side Management (DSM), Standards and Labelling Programme, EnergyEfficiency in Buildings and Establishments, Energy Conservation Building Codes,Professional certification and Accreditation, Manuals and Codes, Energy Efficiency PolicyResearch Programme, School Education, Delivery Mechanism for Energy EfficiencyServices etc.
44. The status of private power projects as on 1st February, 2002 in table 7.1.10

542
Review of Annual Plan 2001-02 and Programmes for 2002-03
48. During 2001-02, budget allocation of Rs.9.60 Crore was made for promoting energyconservation activities and Rs.28.00 lakhs for grants-in-aid to Energy Management Center(EMC). A number of pilot projects / demonstration projects were taken up for loadmanagement and energy conservation through reduction of T&D losses in the system. Anamount of Rs.50.00 Crore has been given as budget estimate for Bureau of EnergyEfficiency (BEE) for 2002-03 to implement various programmes of energy conservation.
Rural Electrification Programme
49. There are 5.87 lakh villages in the country as per 1991 Census. By the end of March,2002, 5.09 lakh villages have been electrified achieving a national average of 86.7%. As apart of the Village Electrification Programme, pumpsets are also energized in the Stateshaving the potential for ground water, which help in meeting the minor irrigationrequirements. As on 31.3.2002 a total of 130.84 lakh pumpsets have been energized in thecountry against the total estimated potential of 195.94 lakhs which amounts to 66.8% of thepotential exploited. Out of the balance around 80,000 villages to be electrified, it has beenassessed that around 62,000 villages could be electrified by extending the conventionalgrid whereas the balance around 18,000 villages which are located in remote and difficultareas like hilly terrains, deserts and islands may have to be electrified by decentralizednon-conventional energy sources like solar, small hydro and biomass. Govt. of India hasalready initiated action with the concerned Central Ministries so as to electrify all theremaining villages feasible to be electrified by grid by the end of the 10th (2002-2007) Plan.The left out remote villages which are not feasible to be connected to the grid will beelectrified by decentralized energy sources like solar, small hydro and biomass and thiswork will be completed by the end of the 11th Plan i.e. 2007-2012.
50. In order to enable the States to electrify these villages by getting funds from Govt. ofIndia in suitable proportion of grants and loans, the Rural Electrification Programme hasbeen included as one of the components of the Prime Minister’s Gramodaya Yojana(PMGY) from 2001-02 onwards. While the funds from the Govt. of India for villageelectrification would flow directly to the concerned State Govts., the funds for loadintensification and system improvement in villages already electrified would be given byRural Electrification Corporation (REC) in the form of loan. In addition, from the year 2002-03 onwards the Minimum Need Programme (MNP) component of rural electrification hasbeen given adequate importance and it has been desired that the funds would be disbursedto the eligible States in the grant loan ratio of 90:10 in the case of Special Category Statesand 30:70 for Non-Special Category States. The quantum of funds provided for thisprogramme has also been increased to the level of Rs.600 crores during the current AnnualPlan (2002-03) as against the earlier level of Rs.175 crores. The funds under PMGY andthe MNP components would be utilisedfor the electrification of unelectrified villageswhereas the other R.E. works like system improvement, load intensification, householdelectrification etc. would be done by the State Govts. by availing loans out of RuralInfrastructure Development Fund (RIDF) and loans given by REC. The proposal of Ministryof Power to provide interest subsidy for the RIDF scheme has been agreed in principle andthe rate of interest subsidy is in the process of finalisation.

543
New and Renewable Sources of Energy
51. The programme of New and Renewable Sources of Energy is being implemented bythe Ministry of Non-Conventional Energy Sources (MNES). These programmes include therural energy, power generation from renewables, promotion of new technologies and alsothe programmes promoted through the Indian Renewable Energy Development Agency(IREDA) which is the only public sector financial institution under the administrative controlof MNES. The Rural Energy Programmes help in meeting the energy requirements of therural people for their basic needs like cooking, lighting and heating. The programmes forpower generation from renewables include the wind energy, small hydro, biomass powerand cogeneration, solar thermal and photovoltaic power and energy from urban andindustrial wastes. As on December 31, 2001, the contribution of power generation fromrenewables has reached 3400 MW representing 3.5% of total installed generating capacity.Of this, wind power alone accounts for a major share with 1507 MW, while biomass powerand cogeneration accounts for 400 MW and small hydro 1423 MW.
Review of Annual Plan 2001-2002
52. Under the National Project on Biogas Development (NPBD), a target to install 1.80lakh family size biogas plants was set for 2001-2002 with a budget estimate of Rs. 59.50crores. Upto December 2001, 75,000 plants had already been installed and target isexpected to be achieved. During 2001-2002 against the target of 17.55 lakh improvedchulhas to cover 10,000 villages, around 7 lakh chulhas have been installed upto the endof December, 2001 and the balance target is expected to be achieved during the year.Under the National Biomass Gasifier Programme, during 2001-02, against the targrt of 7MW (equivalent) gasifier systems 2.635 MW (equivalent) capacity has been installed invarious States including Andhra Pradesh, Gujarat, Tamil Nadu and West Bengal. Under theSolar Photovoltaic Lighting Programme, the targets set for the year 2001-02 were 85,000solar lanterns, 35,000 solar home lighting systems, 3,000 street lighting systems and solarpower plants of equivalent capacity of 220 KWp. Againt these targets, up to 31st December,2001 31,998 solar lanterns, 24,782 home lighting systems, 547 street lights and solarpower plant of 40 KWp aggregate capacity have been installed. The targets are likely to beachieved in full. Under power generation programme, 167 MW of wind power and 66 MWof biomass power (co-generation) have been installed during the year. In the case of smallhydro power during 2001-02 MNES has supported Small Hydro projects aggregating to60.15 MW have been commissioned up to December, 2001. The achievements in the otherprogrammes of MNES are also satisfactory. The physical and financial progress of theprogrammes were regularly reviewed in the Annual Plan and quarterly review meetings inthe Planning Commission with the participation of the other concerned Ministries.
53. Zero Based Budget (ZBB) exercise for the Ministry of Non-Conventional EnergySources (MNES) was undertaken during Annual Plan 2001-02. An exercise forconvergence, retention, retention with modifications, transfer to States and weeding out ofthe Central Sector / Centrally Sponsored Schemes (CSS) under MNES was carried out bythe Power & Energy Division in consultation with MNES. Accordingly, a large number ofschemes implemented by the MNES at present numbering around 35 are converged under12 major schemes. Apart from this, 2 nos. of CSS under MNES have been identified to betransferred to the States. One scheme viz. Animal Energy has now been discontinued inview of the reason that the scheme is not making any headway in a significant manner

544
while under implementation by MNES. A summary of the same is given in table 7.1.11.Scheme-wise details are given in Annexure 7.1.8
Annual Plan 2002-2003
54. The total outlay of MNES for 2002-2003 is approved for an amount of Rs. 1101.48crores (Rs.625.00 crores of Gross Budgetary Support and Rs.476.48 crores of IEBR). Thefinancial provision indicated above will cover the programmes of Rural Energy, SolarEnergy, Power Generation from Renewable Sources of Energy, Energy from Urban andIndustrial Wastes and the equity support to IREDA. The GBS of Rs.625.00 crores includesthe amount of 10% which is earmarked for being utilized in North East and Sikkim undervarious programmes of MNES. It has been proposed to install 1.70 lakh family size biogasplants, 20 lakh improved chulhas to cover 10,000 villages, 80,000 solar lanterns, 45,000home lighting systems, 1000solar generators, solar power plants equivalent to 0.45 MW,1200 SPV pumps, 300 MW of wind power, 150 MW of biomass power, 7 MW equivalentbiomass gasifier systems, 80 MW small hydro power and 20 MW equivalent capacity ofenergy from urban and industrial wastes. Approximate renewable energy potential vis-a-visachievements are indicated in Table 7.1.12.
Table 7.1.11
Summary of ZBB exercise of Ministry of Non-ConventionalEnergy Sources (MNES)
Central Sector Schemes to Centrally Sponsored Central Sectorbe continued Schemes (CSS) scheme weeded
identified for transfer outto States
1. National Project on Biogas 1. National 1. Animal EnergyDevelopment (NPBD) Programme Programme
2. Wind Power on Improved3. Small Hydro Power Chulhas (NPIC)4. Biomass Power5. Solar Power 2. Community /6. Village Electrification Programme Institutional7. Research, Design & Development Biogas Plants
(RDD)8. Awareness & Extension
(includes IREP)9. Infrastructure Development and
Capacity Building10. Institutional Support Scheme11. Indian Renewable Energy
Development Agency (IREDA)

545
(II) COAL AND LIGNITE
Review
55. Annual Plan 2001-02 was the terminal year of the Ninth Plan (1997-2002). A briefreview of the IX Plan performance is given below. The performance of the Annual Plan2001-02 is discussed along with the Annual Plan 2002-03.
56. The Ninth Plan envisaged augmenting domestic coal production with a long-termperspective keeping in view the sharply increasing demand for the power sector throughimproved productivity, capacity utilisation, technology adaptation, simplified projectclearance procedures, improved project implementation, exploration, conservation etc. Animportant area of the Plan concerns restructuring the coal sector and facilitating privatesector participation in commercial coal mining by means of necessary legislativeamendments. The Plan laid emphasis on Clean Coal Technologies (CCT), Science &Technology (S&T) in the coal industry, development of Coal Bed Methane resources,augmentation of port and rail infrastructure facilities for improved coal movement anddevelopment of lignite resources.
57. Lower than expected economic growth and non-materialisation of new coal basedpower generation capacity affected coal offtake and coal production. As against the MTA’srevised target of growth of 4.6% in coal demand the anticipated growth in the IX Plan is3.32%. Similarly, the anticipated growth in coal production is 2.4% against the MTA’srevised growth target of 2.86%. The coal production from captive blocks has also fallenshort of the envisaged targets.
58. Lignite production from Neyveli Lignite Corporation (NLC) fell short of IX Plan targetdue to delays in implementation of major ongoing projects and the lignite productionregistered a growth of 0.17% against the envisaged growth of 4.90%.
Table 7.1.12
Renewable Energy Potential & Achievements
Source/System Approximate CumulativePotential Achievements
(Upto 31.12.2001)
Biogas Plants (No.) 120 lakh 32.75 lakh
Improved Chulha (No.) 1200 lakh 338.00 lakh
Biomass 19,500 MW 400.80 MW
Solar Photovoltaic 20 MW/sq.km. 82 MWp
Solar Thermal Systems 1400 lakh sq.m. 6.0 lakh sq.m
Solar Water Heating collector area collector area
Wind power 45,000 MW 1507 MW
Small Hydro Power 15,000 MW 1423 MW
Urban and Municipal Wastes 1700 MWe 17.10 MWe

546
59. Presently, private sector is permitted in coal mining limited to captive consumption. Asthis has not yielded the desired results it was proposed in the IX Plan to allow privatesector in commercial coal mining. However, the Bill to amend the Coal Mines(Nationalisation) Act 1973 for permitting private sector in commercial coal mining has notcome through. Also, the proposed restructuring of CIL to do away with the holding companystructure and to give autonomy to the individual coal subsidiaries for bringing incompetition, has not taken place. The coal prices were decontrolled totally. VRS has beenintroduced for rationalising manpower in loss making coal companies. However, revival ofloss making coal companies has not taken place.
60. The anticipated cumulative IX Plan expenditure is about 74% of the Plan outlay. Themain reasons for shortfall in expenditure have been shortfall in IR generation and nottaking up of the envisaged new projects in view of sluggish demand and reduction incapital requirement in case of Singareni Collieries on account of offloading of OB removaland not procuring the HEMM departmentally and delay in implementation of major projectsin NLC.
Annual Plan 2002-03
61. The Annual Plan 2002-03 is the first year of X Five Year Plan covering the period2002-03 to 2006-07. Accordingly, the following emanates from the X Plan thrust areas andProgrammes.
Coal Demand
62. As against the anticipated coal offtake/consumption of 348.43 mt of raw coal(excluding 4.93 mt of washery middlings) in 2001-02 the terminal year of the IX Plan, theestimated coal demand in the terminal year 2006-07 of the X Plan is 460.50 mt (excluding5.24 mt of middlings). This implies a compound annual growth rate of 5.74% in coaldemand in the X Plan against an anticipated growth of 3.32% during the IX Plan. Of thisestimated demand, 37.21 mt (8%) is of coking coal for steel sector for a hot metalproduction programme of 25.59 mt in 2006-07 and 423.29 mt (92%) is of non-coking coal.About 69% of the total estimated demand is for power sector utilities and includes thedemand for a projected incremental coal based generation capacity addition of 18308 MWand an overall coal based generation programme of 452 billion Kwh in 2006-07. About 5%is for cement sector related to a cement production programme of 153.50 mt. About 6% forcaptive power and the remaining about 12% is for other sectors.
63. For the Annual Plan 2002-03, a coal demand of 363.30 mt (excluding 4.93 mt ofwashery middlings) has been assessed. This includes 249.50 mt (excluding 3.3 mt washerymiddlings) for the power sector for a coal based thermal generation programme of 353.52BU and an incremental coal based generation capacity of 960 MW in 2002-03. The demandfor steel sector has been assessed at 34.40 mt of raw coal corresponding to a hot metalproduction of 24.31 mt in 2002-03. For cement sector the coal demand has been assessedat 17.10 mt for a targeted cement production of 121 mt in 2002-03. The details of coaldemand/offtake are given in the Table-7.1.13.

547
Sl. Ninth Plan Tenth PlanNo 2000-01 2001-02 % ACGR 2002-03 2006-07 % ACGR
Sector Actual Target Anticip- Target Projectedated
Coking Coal
1 Steel 28.76 32.21 29.75 32.90 35.32
2 Coke Ovens 0.50 1.91 0.66 1.50 1.89
Sub-Total 29.26 34.12 30.41 -2.77 34.40 37.21 4.12
Non-Coking
3 Power Utilities 237.03 241.54 241.19 3.92 249.50 317.14 5.63
(2.49) (2.78) (3.27) (3.27) (3.74)
4 Cement 14.68 17.00 15.00 5.75 17.10 24.56 10.36
5 Steel DR 3.72 3.48 5.16 21.36 4.00 7.00 6.29
6 Railways 0.01 0.01 0.00 0.00 0.00 0.00
7 Fertilisers 3.18 3.50 3.10 -6.68 3.50 4.18 6.16
8 LTC/Soft Coke - - * - - 0.20
9 Cokeries/CokeOven (NLW) 1.40 1.40 * - - 1.50
10 Export 0.04 0.07 0.02 - 0.05 0.10
11 Captive Power 16.03 21.11 18.39 3.75 21.15 28.26 8.97
(1.28) (1.35) (1.45) (1.55) (1.40)
12 BRK & Others 33.00 29.56 33.00 5.55 31.10 37.85 2.78
(0.77) (0.70) (0.22) (0.11) (0.10)
13 Collieryconsumption 2.19 2.50 2.17 -8.54 2.50 2.50 2.87
Sub-Total
Non Coking: 311.28 320.17 318.03 4.04 328.90 423.29 5.88
(4.53) (4.83) (4.93) (4.93) (5.24)
Grand Total: 340.54 354.29 348.44 3.32 363.30 460.50 5.74
(4.53) (4.83) (4.93) (4.93) (5.24)
Note :1. Figures in brackets are washery middlings and are not included in totals.
2. * Included in BRK & Others.
Table 7.1.13
Sectoral Coal Demand/Offtake(in million tonnes)

548
Coal Production
64. The coal production target in the terminal year 2006-07 of the X Plan is set at 405 mtagainst an anticipated coal production of 325.65 mt in 2001-02 implying annual compoundgrowth of 4.46% in the X Plan against 2.4% anticipated in the IX Plan. This comprises 350mt from the coalfields of CIL, 36.13 mt from SCCL, 5.24 mt from TISCO, 2.4 mt from OtherPSUs like IISCO, DVC, BSMDCL etc., 6.73 mt from Captive Block holders and 4.5 mt fromprivate sector of Meghalaya State. The incremental coal production in the X Plan is 79.35mt against 39.56 mt in the IX Plan. This comprises of 71 mt from CIL, 5.13 mt from SCCLand 3.22 mt from others. Of the 71 mt of incremental production from CIL, the majorincremental contribution is from SECL – 21.55 mt, MCL – 21.5 mt, NCL – 8.5 mt andCCL – 10.3 mt.
65. The coal production target for Annual Plan 2002-03 has been set at 335.70 mtagainst the anticipated coal production in 2001-02 of 325.65 mt. The details of company-wise coal production are given in the Table-7.1.14 .
Ninth Plan Tenth PlanCompany 2000-01 2001-02 % ACGR 2002-03 2006-07 %
Actual Target Anticipated Target Projected ACGRTarget
ECL 28.03 28.50 28.50 -0.79 29.00 31.00 1.70
BCCL 25.97 30.00 27.50 0.27 28.00 33.00 3.71
CCL 31.75 36.00 33.00 0.50 34.25 43.30 5.58
NCL 41.40 41.50 43.50 3.28 44.00 52.00 3.63
WCL 35.20 35.00 36.50 3.17 37.00 37.50 0.54
SECL 60.33 63.00 63.00 2.64 65.25 84.55 6.06
MCL 44.80 44.50 46.50 4.47 48.00 68.00 7.90
NEC 0.66 0.50 0.50 -7.79 0.50 0.65 5.39
CIL: 268.14 279.00 279.00 2.17 286.00 350.00 4.64
SCCL 30.27 32.38 31.00 1.53 32.50 36.13 3.11
TISCO/ 7.33 7.60 7.55 2.33 7.60 7.64 0.24ISCO/DVC
Captive 3.83 3.75 4.00 - 5.50 6.73 10.97
Others 4.07 NA 4.10 5.02 4.10 4.50 1.88
Total: 313.64 322.73 325.65 2.40 335.70 405.00 4.46
Table –7.1.14
Coal Production(in million tonnes)

549
66. Only 36% of the envisaged coal capacity addition materialised during the IX Plan. Asagainst the envisaged contribution of 60 mt of coal production from new projects from CILand SCCL, projects yielding a production capacity of only 21.62 mt (CIL 17.16 mt capacityfrom 37 projects and SCCL 4.46 mt capacity from 10 projects) have been sanctionedduring the IX Plan. This slow rate of capacity addition is likely to affect the coal availabilityin the X Plan and beyond.
67. In the X Plan of the envisaged total coal production of 386.13 mt from CIL & SCCL,83.12 mt (CIL 79.11 mt; SCCL 4.01 mt) or about 22% is to come from 115 new projects(CIL - 98 projects for a total capacity of 197.40 mt and an estimated capital investment ofRs.23159.24 crore; SCCL -17 projects for a capacity of 4.13 mt and a capital investment ofRs.2116.96 crore), which are to be taken up during the X Plan. The contribution from newprojects in 2002-03 from CIL is 7.01 mt and SCCL 0.10 mt. Unless these projects come up,it will be difficult to meet the requirements from domestic sources and the preparedness ofthe coal companies in realising this production needs to be ascertained. The contributionfrom captive blocks is only 2% of the total targeted production of 405 mt in 2006-07. Thisimplies an urgent need to encourage private participation for augmenting coal productionfrom domestic sources. The category-wise coal production is given in Table-7.1.15
68. As against the anticipated washed coking coal production of 5.19 mt from CIL in2001-02, the target of washed coking coal production in 2006-07 is fixed at 5.96 mt and forAnnual Plan 2002-03 at 5.38 mt. There is dire necessity to improve the situation ofdeclining production of washed coking coal from domestic sources by undertakingmodernisation of all the coking coal washeries and converting them into multi-productwasheries suiting to the raw coal feed and specifications of the steel sector for improvedfinancial viability.
69. Similarly for complying with the requirement of MOEF’s directive a number of non-coking coal washeries would need to be set up in the X Plan.
Demand Supply
70. The estimated raw coal demand of 460.50 mt in 2006-07 is proposed to be metthrough a domestic production of 405.00 mt leaving a gap of 55.50 mt. It is proposed to
Table –7.1.15
Category-wise Coal Production(million tonnes)
Category CIL SCCL TISCO/ Captive Meghalaya TotalIISCO/DVC Blocks
Existing 25.50 3.87 7.55 4.00 4.10 45.02
Completed 200.81 19.03 - - - 219.84
Ongoing 44.59 9.22 - - - 53.81
New 79.11 4.01 0.09 2.73 0.40 86.34
TOTAL: 350.00 36.13 7.64 6.73 4.50 405.00
550
import 24.18 mt (5.4% of total demand) comprising 17.18 mt of coking coal for steel sector,3.7 mt of non-coking coal for power sector and 3.3 mt of non-coking coal for cement sectoras against a total likely import of 19.6 mt (5.6% of demand) in 2001-02 (Coking coal – 10.8mt, Non-coking coal - 8.8 mt). This would still leave a gap of 31.32 mt, which emphasizesthe need for augmenting domestic coal production with private participation.
71. Similarly the estimated raw coal demand of 363.30 mt for 2002-03 is proposed to bemet through a domestic coal production of 335.70 mt leaving a gap of 27.60 mt. Theproposed imports of coking coal for steel are 16.78 mt and non-coking coal 6.33 (Power-3.13 mt; Cement- 3.20 mt) totaling to 23.11 mt would still leave a gap of 4.49 mt.Considering a stock liquidation of 0.40 mt from CIL the gap would be about 4 mt.
Productivity
72. To improve the overall productivity of men and machinery certain steps likerationalisation of manpower through implementation of Voluntary Retirement Scheme(VRS), decommissioning of uneconomic mines, prioritizing the investment programme,improving the utilisation of capital intensive HEMM, etc have been taken up during the IXPlan. As a result the overall productivity in CIL and SCCL, which was standing at 1.86 t(UG – 0.57 t; OC – 5.12 t) and 1.34 t (UG – 0.72 t; OC – 6.25 t) at the beginning of the IXPlan has improved to 2.44 t (UG – 0.66 t; OC – 6.41 t) and 1.55 t (UG – 0.81 t; OC – 7.00t), respectively. The improvement in Out Put per Manshift (OMS) is primarily the result ofimprovements at OC mines. The UG productivity needs to be further improved. In case ofHEMM, the norms prescribed earlier by CMPDIL are under review by a Committee of DOCwhose report is awaited.
73. Against an anticipated overall OMS of 2.44 t (UG-0.66t, OC-6.41t) in CIL in 2001-02the projected OMS in 2006-07 is 3.55t (UG-0.88t, OC-9.25t). For the Annual Plan 2002-03the target of OMS is 2.58t (UG-0.69t, OC-6.86t).
74. In case of SCCL against the anticipated overall OMS of 1.55t (UG-0.81t, OC-7.0t) theprojected OMS in 2006-07 is 1.77t (UG-0.94t, OC-7.31t). For the Annual Plan 2002-03 thetarget of OMS is 1.66t (UG-0.84t, OC-7.98t).
75. Bench marking of operations with regard to productivity, capacity utilisation,investment etc. in coal companies is important for the operations. Need for independentauditing of the operations, efficiency of investment and resources was identified as therequirement for understanding the productive investment of resources for making the coalcompanies competitive.
Lignite
76. Against the initially envisaged lignite production target of 22 mt in 2001-02 for NLC,the Annual Plan 2001-02 target was set at 17.50 mt matching the requirements of downstream units. The anticipated lignite production from NLC in 2001-02 is 17.50 mt. Thegrowth in NLC’s lignite production in the IX Plan has been 0.17% only against theenvisaged growth of 4.9%. This has been mainly due to delay in commissioning of ongoingTPS-I Expansion project, Mine-I Expansion project and Mine-1A project.
551
77. The projected demand for lignite in the country in 2006-07 is 57.79 mt of which thedemand for power generation is 49.34 mt (85.4%) and other sectors 8.45 mt (14.6%). Ofthis, the demand on the part of NLC is 27 mt and the production target for NLC in 2006-07is fixed at 27 mt.
78. The target of lignite production for Annual Plan 2002-03 from NLC is 19.95 mt.
Project Implementation
79. Land acquisition, forestry clearance, rehabilitation, equipment supplies, availability offunds, inadequate geological studies, improper project formulation, etc. continue to causedelays in the implementation of coal projects, deration of capacity of some projects andsome foreclosures. The decision of DOC to only undertake projects yielding an IRR of 16%or more has also affected a number of technically viable coal projects. However, DOC hasreviewed this decision at the end of the IX Plan and lowered the hurdle IRR to 12%.
80. There appear to be repeated instances of projects, which are formulated with lowinitial specific investments only to be revised subsequently with significant cost overrunsand delays. While this in itself is cause for concern, what is even more worrisome arerepeated instances of a third level of revisions which essentially lower production estimatesfor varying technical and non-technical reasons resulting in even higher specific investmentcosts. This pattern appears consistently across projects promoted by ECL & BCCL andhinders proper assessment and utilisation of limited resources. This establishes a need forreviewing project formulation practices of the coal companies. The problems of mutation &transfer of land by the State Governments need to be addressed in the right perspective formeaningful implementation of coal projects by coal companies. Similarly, the aspects ofgrant/renewal of lease by State Governments are also equally important to reduce timedelays in case of new projects. With regard to environmental and forestry clearances, itwas opined earlier that a single window system with specific time frame was essential.However, there is no improvement in this regard and it continues to take unduly long timefor clearance of new projects. Further, charging of the “expectation value” towardsforestland by the State Governments is becoming a hurdle in project implementation andcoal companies are made to pay huge amounts in this regard adding to the cost of theprojects over and above the cost of afforestation.
Coal & Lignite Reserves
81. As against the coal reserve inventory of 204.65 bt (Proved – 72.73 bt; Indicated –89.84 bt; Inferred – 42.08 bt) at the beginning of the IX Plan, the reserves of coal as on1.1.2001 stand at 220.98 bt [Proved - 84.4 bt (38%); Indicated - 98.5 bt (45%); Inferred -38.00 bt (17%)]. Of the 84.4 bt of proved coal reserves, the estimated extractable reservesare 17.96 bt (21%) only. Similarly, the reserves of lignite in the country as on 1.1.2001 areestimated to be 34.61 bt against 27.45 bt during the beginning of the Plan. There is a needto upgrade the available coal reserves to proved and extractable reserves.
Zero Based Budgeting
82. A review of all the central schemes under DOC on a Zero based budget methodologywith a view to ascertaining whether they require continuation in the X Plan and, if so, if

552
they also require any modification and changes was carried out in the PlanningCommission in consultation with DOC. Accordingly, the schemes, namely, R&D/S&T, CoalController Organisation, Promotional Exploration, Detailed Exploration in Non-CIL blocks,VRS have been agreed to be continued in the X Plan. However, the schemes ofEnvironmental Measures and Subsidence Control (EMSC) and Rehabilitation, control of fire& subsidence in Jharia and Raniganj Coalfields have been merged under one scheme,namely, EMSC for continuation in the X Plan and the scheme of IT has been taken out ofPlan schemes.
Promotional Exploration
83. In order to accelerate the pace of Regional Exploration in coal & lignite and thesubsequent detailed exploration for projectisation of reserves to match the rapidlyincreasing demand for coal during the Seventh Five Year Plan and after, a separate fundunder a plan scheme namely “Regional/Promotional Exploration” was created by thePlanning Commission under the budget of the Department of Coal, in 1989-90.
84. Against IX Plan target of drilling for promotional exploration of 7.75 lakh meters, theanticipated cumulative achievement is 6.59 lakh meters and 24 bt of coal reserves and25.44 bt of lignite reserves have been established. The target of drilling for promotionalexploration for Annual Plan 2001-02 was 1,55,000 meters. Against this, the anticipatedachievement is 1,20,300 meters.
85. For promotional exploration during the Tenth Plan, a drilling target of 3.3 lakh metresfor coal and 2.7 lakh metres for lignite totaling to 6.0 lakh metres has been set. About 994sq. km. area will be covered for coal and a reserve of 6.68 bt of coal is planned to beestablished during the X Plan. This work will be carried out by GSI, CMPDI and MECL withfunding from DOC. In addition to the drilling programme a scheme to create coal & lignitedatabase for consolidating the data generated by various exploration agencies forfacilitating future decisions has been proposed to be taken up under PromotionalExploration. Similarly, studies for Coal Bed Methane (CBM) for collection of desorption dataon CBM from boreholes drilled under Promotional Exploration programme has also beenproposed.
86. The target of drilling for promotional exploration for Annual Plan 2002-03 is set at1,20,300 meters.
Detailed Drilling in Non-CIL Blocks
87. This scheme was taken up in IX Plan through budgetary support in order to reducetime lag between allotment of mining blocks to the private entrepreneurs and the coalmining operations and thus to make up the gap between the demand and availability ofcoal. A target of 3.63 lakh meters was set for drilling under this scheme during the IX Plan.Against this, the anticipated achievement is 2.76 lakh meters and 1.99 bt of coal reservesare likely to be established. The target of drilling for Annual Plan 2001-02 under thisscheme was 1.49 lakh meters, which is likely to be achieved.
88. For the Tenth Plan, a target of 2.13 lakh meters has been set for detailed drilling inNon-CIL blocks, which will lead to establish 3.58 bt of coal reserves. The target of drillingfor Annual Plan 2002-03 is set at 0.42 lakh meters.

553
Science & Technology (R&D)
89. The Research & Development Programme in coal sector gained importance afternationalisation of coal industry. The programme was initiated in the year 1975. TheStanding Scientific Research Committee (SSRC) was set up in DOC under thechairmanship of Secretary (Coal) and members from other Government Departments &Industry. SSRC is assisted by four Sub-Committees, namely, Production, Productivity &Safety; Coal Beneficiation; Coal Utilisation; and Environment & Ecology.
90. Though Research & Development (R&D) has been a thrust area in the Ninth Plan, notmuch of progress has taken place in coal sector S&T. As a result, the outlays providedremained un-utilised to a large extent and the cumulative utilisation is only about 26%.However, amongst others, two important projects, namely, coal bed methane extraction incollaboration with UNDP & GEF and Washing of Low Volatile Medium Coking Coal havebeen taken up for demonstration under Coal Sector S&T Grants.
91. The three pronged approach envisaged in the IX Plan i.e. (i) Coal S&T programmeunder SSRC to continue (ii) in-house R&D programme with coal companies and (iii) Inter-Sectoral Research - Technology Advisory Committee (IS-STAC), would continue in the XPlan also. The major identified issues under the thrust areas for coal S&T programme are –coal gasification, coal washing, beneficiation of low volatile coking coals (LVMC), coalliquefaction, fluidised bed combustion, sequestration of CO2 in control of green house gasand extraction of CBM, etc. DOC has to identify and formulate new schemes matching thethrust areas under S&T.
Environmental Measures and Subsidence Control (EMSC)
92. This scheme was introduced in the Eighth Plan for improvement of environmentalconditions in the mined out areas and mitigation of problems arising out of subsidence andfire in Raniganj and Jharia coalfields. However, the utilisation of the outlays provided isonly about 43%. DOC has to identify new schemes to be taken up during the X Plan underEMSC.
Rehabilitation, Control of Fire & Subsidence in Jharia and Raniganj Coalfields
93. Based on the recommendations of the High Level Committee, DOC formulated thisscheme in the IX Plan considering the urgency for shifting of population from unsafe areasin ECL (Raniganj Coalfield) and BCCL (Jharia Coalfields) and forms a part of the MasterPlan. The utilisation of the outlays provided is only about 17%. This scheme has beenmerged with EMSC scheme from 2002-03 onwards.
Information Technology
94. This scheme was introduced by MOC in 1999-2000, under the head of IT defining itssystems information needs in order to achieve its objectives and administer itsresponsibilities using IT as an enabler. The IT plan envisages procurement andmaintenance of hardware/software, connectivity within the department and amongconstituent units of DOC. The estimated cost of the scheme is Rs. 1.94 crore. This schemeis phased over five years. After ZBB Exercise this has been taken out of Plan schemeswith effect from 2002-03.

554
Voluntary Retirement Scheme (VRS)
95. This scheme was introduced in the IX Plan for improving the financial health of lossmaking coal companies by means of rationalisation of manpower by making availablerequired funds through NRF initially, which was, later supported by extending budgetarysupport. To begin with it was started in ECL and BCCL, which was extended to CCL lateron. It was planned to retire 44,400 employees (ECL – 19200; BCCL – 19200; CCL – 6000)in all. The anticipated achievement is retirement of 37,380 persons (85%) under thisscheme during the IX Plan.
96. As against the target of retiring 11,500 persons (ECL – 4500; BCCL – 4500, CCL –2500) in 2001-02, the anticipated achievement is 10850 (ECL –4350, BCCL – 3600, CCL –2900). The target for X Plan is retiring of 15,500 persons (ECL – 4000; BCCL – 9000; CCL– 2500). For Annual Plan 2002-03, a target of retiring 7,485 employees (ECL-3125, BCCL-3635, CCL-725) is fixed.
Monitoring Mechanism
97. With a view to ensuring timely and effective implementation of projects and CentralSector Schemes of Coal Sector, Quarterly Performance Review (QPR) Meetings have beenintroduced in the Planning Commission in addition to the QPR Meetings being held in theMinistry.
Policy Measures
98. During the Ninth Plan, the Government implemented the recommendations of theCommittee on ‘Integrated Coal Policy’. The coal prices have been deregulated and the Billfor permitting private sector in commercial coal mining is before the Parliament. However,implementation of the other recommendations with regard to setting up of independentbody, allocation of coal blocks for exploration and mining, establishing regulatory authorityetc. are contingent on the approval of the Bill.
99. The IX Plan laid emphasis on making the coal sector competitive by restructuring thecoal producing PSUs. It was proposed to extend more autonomy to coal producing PSUsand to do away with the holding company structure. The capital restructuring of both CILand SCCL was done at the beginning of the IX Plan and again during the IX Plan. Somecoal PSUs have started posting profits and paying taxes and dividends to the Government.However, some inherently sick coal companies like ECL and BCCL could not be revivedand are currently before BIFR. More importantly, rationalisation of manpower has beentaken up by implementing Voluntary Retirement Scheme (VRS) in these coal companies. Oflate, CCL has also started posting losses and implementation of VRS has been extended toCCL. The proposal of doing away with the holding company structure has not beenimplemented. Though the prices of all grades of coal stand decontrolled, however, in viewof the fact that coal still remains under Essential Commodities Act, selling of coal by privateparties is not permitted. The royalty rate on lignite has been revised.
100. The huge outstanding coal sale and power sale dues are adversely affecting thefinancial health of the coal companies and the envisaged securitisation of dues has nottaken place. The domestic coal is getting outpriced due to high rail freights when compared

555
to the imported coal particularly in the coastal regions. This is because of cross subsidy byRailways. There is need for rationalising rail freight rates for coal.
101. Continuation of reforms initiated earlier need to be intensified in the X Plan.Expeditious passing of the pending coal bill for permitting private sector in non-captive coalmining, restructuring of coal PSUs by doing away with CIL, the holding company andmaking subsidiary coal companies of CIL independent for promoting competition andimproving performance, setting up of an independent body for allocating coal blocks forboth exploration and exploitation, installing regulatory authority/mechanism, undertaking allthe required legislative amendments including that of labour laws, land acquisition, etc. arecritical for proper development of the coal sector.
Coal Bed Methane (CBM)
102. Coal Bed Methane is emerging as a new source of commercial energy in the country.It is estimated that there exists a potential of about 850 billion cu m of CBM in the country.The IX Plan laid emphasis on the exploration and exploitation of CBM. The Government inJuly 1997 approved the policy for exploration and exploitation of CBM. Pursuant to this,necessary steps to implement the policy were initiated and blocks for exploiting CBMpotential have been offered. The X Plan will continue to lay emphasis on development ofCBM in the country in view of its large potential as a domestic source of clean commercialenergy. Further, CO2 sequestration has been identified as an important area ofdevelopment in the coal sector.
Safety & Welfare
103. During the IX Plan certain important areas for safety in coalmines had been identifiedand the same are under implementation. The fatality rate in CIL for the year 2001 isreported as 0.27 per million tonne of coal production excluding the unfortunate Baghdigidisaster in BCCL, in which 29 persons were killed due to inundation. Similarly, the fatalityrate in SCCL is reported as 0.99 per million tonne of coal production in the year 2001.Some of the major thrust areas identified for safety in coal mines for the X Plan are – (i)installation of environmental Tele-Monitoring Systems (ETMS) in mines; (ii) digitizing miningplans at area level for identification of water danger from adjoining mines, checkingcorrelation survey and estimating thickness of barriers; (iii) replacement of timber supportby steel support; (iv) improved self-rescuers; etc.
104. The housing satisfaction has reached a level of 75% in CIL and about 50% in SCCL.A total population of 23.24 lakh has been covered under water supply scheme in CIL and6.5 lakh in SCCL till 2001-02. 87 hospitals with 5965 beds in CIL and 7 hospitals with 1070beds in SCCL are in operation. In addition to this, 436 dispensaries in CIL and 43dispensaries in SCCL are also functioning. During the X Plan, increasing the housingsatisfaction in the coalfields and water supply facility to cover additional population isenvisaged.
Externally Aided Projects
105. The major projects availing EAP component during the IX Plan have almost beencompleted and some residual amount is spilling over to X Plan. An amount of Rs.15.48

556
crore towards the Coal Sector Environment and Social Mitigation Project of CIL has beenprovided in Annual Plan 2002-03 against the RE provision of Rs. 66.52 crore in 2001-02.Similarly the residual component of World Bank loan for coal sector rehabilitation project ofCIL of Rs. 26.67 crore has been provided in Annual Plan 2002-03 against the RE provisionof Rs. 183.40 crore in 2001-02.
Plan Outlay
106. For Annual Plan 2001-02, an outlay of Rs.3977.15 crore including Rs.538.84 crore forNLC (Power) was provided to DOC. As against this, the RE provision for 2001-02 has beenRs.3127.69 crore including Rs.494.96 crore for NLC (Power). With this, the cumulativeexpenditure during the IX Plan works out to Rs.14387.72 crore and forms about 74% of theIX Plan outlay of Rs.19441.59 crore for DOC. Broadly, the Plan expenditure suffered due tonot taking up of envisaged new coal projects, reduction in capital requirements due torecourse to offloading of overburden removal by SCCL instead of doing the same byprocuring HEMM departmentally, delay in implementation of projects etc.
107. As against the RE provision of Rs.3127.69 crore for 2001-02, the outlay provided forAnnual Plan 2002-03 for DOC is Rs.3491.47 crore. This comprises an outlay of Rs.292.72crore for NLC (Power). The outlay for 2002-03 is planned to be financed through an IEBRof Rs.3164.47 crore, EAP of Rs.15.48 crore and DBS of Rs.311.52 crore. The budgetaryprovision is mainly for the Central Sector Schemes under DOC including VoluntaryRetirement Scheme (VRS). There is no DBS provision for PSUs. The company-wise/scheme-wise details are given in Table 7.1.16.
Table-7.1.16
Companywise/Schemewise Financial Outlays
(Rs. Crore)Company/Scheme 2000-01 2001-02 2002-03
Actual BE RE BECoal India Ltd. 1059.32 2309.90 1540.00 2190.00Singareni Coll. Co. Ltd. 194.10 355.00 290.00 405.00Neyveli Lignite Corp. (Mines) 591.53 449.97 401.81 292.23Science & Tech. 0.16 11.92 1.71 7.76Regional/Promotional .Expl. 30.37 32.26 35.21 49.19EMSC 10.00 12.17 5.41 34.65Detailed drilling in Non-CIL Blocks 10.00 37.27 50.00 13.92Rehab. Project 0.50 7.24 8.04 0.00Information Tech. 0.33 0.39 0.55 0.00VRS 140.03 156.99 300.00 206.00Total Coal & Lignite 2036.34 3373.11 2632.73 3198.75Neyveli Lignite Corp. (Power) 469.49 538.84 494.96 292.72NEC 57.14 65.20 * *
Total DOC 2562.97 3977.15 3127.69 3491.47
Note:- * The provision for NEC in RE 2001-02 and BE 2002-03 is included in the provision ofindividual schemes.

557
Emerging Issues/Thrust Areas
108. The following issues/thrust areas need to be addressed during Annual Plan 2002-03/Tenth Plan for proper development of Coal Sector in the Tenth Plan period and beyond.
l Continuation of reform process and facilitating private sector participation in commercialcoal mining with a view to gaining access to latest technologies for coal exploration, productionand utilisation and to encouraging competition.
l Expeditious passing of pending Coal Mines (Nationalisation) Amendment Bill for permittingprivate sector in non-captive mining.
l Restructuring the coal sector by doing away with CIL, the holding company, and providingmore autonomy to individual coal producing companies for promoting competitiveness, revivalof loss making coal companies, etc.
l Setting up of an independent Regulatory Authority to oversee the introduction of competitionin each segment of the coal production & supply chain, resolution of disputes and allocationof coal blocks both for exploration and exploitation.
l Amendments to Contract Labour (Regulation & Abolition) Act, 1970 for facilitating offloadingof certain activities in coal mining.
l Coal to be removed from the List of Essential Commodities in order to allow free sale and towithdraw Colliery Control Order 2000 along with the Coal Control Orders of the StateGovernments.
l Rationalisation of rail freight rates for coal movement.
l Need for rationalising import duty on coal for improving competitiveness of the Sector.
l Mechanism for expeditious clearance of huge coal dues from SEBs for improving financialhealth of coal sector PSUs.
l Augmentation of coal production capacity to meet the projected demand of power sector inparticular and other end use sectors in general.
l Intensification of exploration and upgradation of coal reserves to proven and recoverablecategory in the context of the energy security net of the country.
l Improvement of environmental aspects and promotion of clean coal technologies –beneficiation of non-coking coal for power generation; development of coal bed methane;CO2 sequestration; coal gasification; IGCC and FBC route of power generation, developmentof slurry transportation, etc.
l Promoting washed coking coal with adoption of better technologies and making domesticproduct competitive for steel sector with a view to reduce import dependence.
l Development of port and rail infrastructure for coal movement and to reduce dependence onroad transportation and promoting other modes of coal transportation.
l Rapid development and utilisation of lignite resources both for power generation and industrialpurposes.
l Development of in-house R&D.
l Need for improving the productivity & capacity utilisation.
l Pricing and grading of coal on Gross Calorific Value (GCV).

558
(III) PETROLEUM AND NATURAL GAS SECTOR
109. Petroleum & Natural Gas sector plays a vital role in the economic growth of thecountry. Presently, about 44.9% (36.0% for oil and 8.9% for natural gas) of the totalprimary commercial energy needs of the country are met by oil and natural gas. Naturalgas is emerging as the preferred fuel of the future in view of it being an environmentalfriendly and desirable feedstock. Against the world trend of increasing use of natural gas,the scope of increasing share of natural gas is limited in India, unless some large finds ofgas become available or there is large scale import of natural gas/liquified natural gas(LNG).
110. With the projected increase in demand of petroleum products and stagnatingindigenous production of crude oil, the import dependence has been increasing over theyears. Therefore, there is a need to increase indigenous production of oil and gas.
111. The increasing imports of crude oil, the proposed LNG imports during the Tenth Plan,high price volatility in the international markets and disruption of supplies due to war etc.raise the issue of oil security. Oil security is proposed to be ensured through strategicstorage of crude oil and petroleum products, diversification of oil imports and investing inequity oil abroad.
112. During the Ninth Plan the growth in petroleum products is lower than the targetsmainly due to slow down of the economy, improvement of roads (including construction ofbridges and by-passes), introduction of fuel efficient vehicles, increasing share of servicesector, especially Information technology (IT) and e-commerce in GDP.
Policy Initiatives and Measures Taken
113. Reforms in the petroleum sector initiated in the Ninth Plan were carried forward whichfacilitated dismantling of the APM w.e.f. 1.4.2002, and opening the way for the entry of newplayers into marketing of transportation fuels.
114. In view of the strategic importance of oil sector in the economy, there is a need torestructure the public sector undertakings in the oil sector to have the required strength tocompete with MNCs. Following restructuring, the disinvestment process will be carriedforward in selected oil and gas PSUs during the Plan period to enhance competition andmaximise shareholder value.
115. With a view to reduce vehicular emissions, a number of steps such as introduction oflead free & low benzene petrol and low sulphur diesel oil were initiated during the NinthPlan. The product quality upgradation would further be carried out to meet the emissionnorms of Bharat stage II & III norms. For this purpose, the further reduction in sulphurcontent for diesel oil and blending of petrol with ethanol would be taken up during theTenth Plan.
116. Several measures have been initiated to intensify exploration and enhancehydrocarbon reserves. These include exploration and development of new fields, additionaldevelopment of existing fields, implementation of Enhanced/Improved Oil Recovery,induction of specialised technology and encouraging participation of private and joint

559
venture companies in the exploration programme through various rounds of biddingannounced by the Government of India including the New Exploration Licensing Policy(NELP). The NELP provided attractive incentives and level playing field with the privateparties that bid for exploration blocks under international competitive bidding process.
117. Under the first round of NELP (January 1999), 48 blocks were offered. Out of these,25 blocks were awarded. The Government of India has since signed Production SharingContracts for 24 out of 25 blocks with national and private oil companies. The secondround of NELP was announced in December 2000 wherein 25 blocks were offered, out ofwhich 23 blocks were awarded to various private and public oil companies. The third roundof NELP was announced in March 2002 wherein 27 blocks – 9 in deep water, 7 in shallowwater and 11 in on land areas, have been offered for international bidding.
Objectives of the Tenth Plan
118. The Tenth Plan has the following major objectives:
l To make the industry internationally competitive so that it becomes a global player.
l Creation of competition among the oil companies with the objective to protect consumerinterests.
l Benchmarking of the petroleum sector/companies against international standards.
l To pursue extensive exploration in non-producing and frontier basins including deep seaoffshore area.
l To acquire foreign exploration acreage and discovered oil/gas fields.
l Setting up of a regulatory framework.
Thrust Areas
119. Keeping in view the above objectives, the following thrust areas have been identifiedfor the Tenth Plan.
l Oil Security
l Infrastructure development
l Efficiency Improvement
l Environment & Quality Improvement
l Restructuring/Disinvestment
ANNUAL PLAN- 2002-03
Demand and Consumption of Petroleum Products
120. The consumption of petroleum products during 2001-02 was 100.43 million tonnesagainst consumption of 100.08 million tonnes during 2000-01. The demand for petroleum

560
products in 2002-03 is estimated to be 101.72 million tonnes indicating an anticipatedgrowth in consumption of about 1.27% over the previous year.
Exploratory and Development Drilling
121. The actual achievement during 2000-01, targets and anticipated achievements for2001-02, targets for 2002-03 in respect of exploratory and developing drilling are given inAnnexure 7.1.9. The achievement in exploratory drilling for 2001-02 is anticipated to be451.95 thousand meters which is almost in line with the achievement in the previous year.The achievement for development drilling in 2001-02 is anticipated to be 384.97 thousandmeters. The targets for exploratory and development drilling for 2002-03 are kept at 476.81thousand meters and 466.46 thousand meters respectively.
Production of Crude Oil and Natural Gas
122. The production of crude oil for 2001-02 including production from joint venture/privatesector companies, was 32.03 MMT against the target of 32.50 MMT. The crude oilproduction target for 2002-03 is 33.08 MMT showing an increase of about 3.3% over theprevious year. The details of crude oil production are at Annexure 7.1.10.
123. The Natural Gas production for 2001-02 was 29.69 BCM against the target of 29.76BCM. The target for 2002-03 has been fixed at 31.37 BCM indicating a growth of 5.7%over 2001-02. The details of natural gas production are at Annexure 7.1.11.
Refining Capacity
124. Since the refinery sector has been de-licensed, it is not possible to correctly assessthe future plans of refining capacity additions. The projection of total refining capacitymaterialization during the Tenth Plan would depend upon several factors including domesticdemand, duty structure that would affect import and export possibilities and refiningmargins.
125. The refining capacity as on 1.4.2002 is 116.07 million tonnes per annum (MMTPA)against 112.54 MMTPA as on 1.4.2001 i.e. an addition of 2.13 MMTPA ( as shown inAnnexure 7.1.12). The refining capacity is likely to increase from 114.67 MMTPA (as on1.4.2002) to 117.87 MMTPA as on 1.4.2003 i.e. an addition of 3.13 million tonnes. Theincrease is projected to be on account of expansion of refining capacity at Haldia andBarauni refineries.
Regulatory Mechanism
126. An independent statutory regulator for the downstream petroleum sector will be set upto ensure fair competition that protects the consumer interest.
Environment concerns
127. Presently, the product quality requirements in India are ahead of most of the countriesin the Asia Pacific and the Middle East regions. Government of India constituted aCommittee of Experts for recommending an Auto Fuel Policy for the country including major

561
cities and other related issues. The Committee submitted its Interim Report on 1.1.2002.The Government has since accepted the recommendations contained in the Interim Reportof the Committee.
128. In order to enable adoption of Bharat Stage-II vehicular emissions standardsthroughout the country and Euro-III equivalent emission norms in seven mega cities fromApril 2005, quality of petrol and diesel would need to be further improved. For this purpose,measures such as further reduction of sulphur content need to be taken in a time boundmanner.
129. On the basis of the positive feed back from the three pilot projects – two inMaharashtra and one in U.P., it has been decided to introduce mandatorily Ethanol blendedpetrol (5% gasohol) – in the first phase in 8 sugar-producing states of Andhra Pradesh,Gujarat, Karnataka, Punjab, Haryana, Maharashtra, Tamil Nadu and U.P. by the end of theyear 2002 and in the rest of the country, in the second phase. In addition, an Inter-Ministerial Task Force has been constituted to prepare a road map to switch over toEthanol blending with diesel and also for 10% blending of Ethanol with Petrol.
Outlay
130. An outlay of Rs.17183.26 crore(BE) has been provided for 2002-03 for the Petroleumand Natural Gas Sector (Rs.11366.26 crore for Exploration and Production of Oil and Gas,and Rs.5817.00 crore for Refining and Marketing). The company-wise outlays for 2000-01(actual), 2001-02 (BE and RE) and 2002-03 (BE) are given at Annexure 7.1.13. The entirePlan outlay of the sector is proposed to be met from the internal and extra budgetaryresources of Public Sector Undertakings. In view of the low utilisation of plan funds in NinthPlan, all efforts need to be made to stick to the approved cost and time schedule for theproject through regular monitoring so as to fully utilise the outlay.

562
Annexure-7.1.1
Energy Generation in 2000-01, 2001-02 and 2002-03 (Utilities)
Year Type Region AllNorthern Western Southern Eastern N-Eastern India
1 2 3 4 5 6 7 8 9
2000-2001
Hydro 29126 7072 30283 5809 2191 74481
Thermal Actual 108515 149408 93819 53436 2961 408139
Nuclear 6616 5913 4399 - - 16928
TOTAL 144257 162393 128501 59245 5152 499548
Hydro 31598 9326 32990 6703 2624 83241
Thermal Target 112775 165848 102144 54022 3567 438356
Nuclear 8316 4842 4925 - - 17903
TOTAL 152689 180016 140059 60725 6191 539500
2001-2002
Hydro 29221 7777 27000 7840 2154 73992
Thermal Actual 113801 151024 98340 55739 3097 422001
Nuclear 8001 6050 5227 - - 19278
TOTAL 151023 164851 130567 63579 5251 515271
2002-2003
Hydro 31248 9382 31329 7197 3658 82814
Thermal Target 118127 155073 110584 58330 3444 445558
Nuclear 7280 5800 4100 - - 17180
TOTAL 156655 170255 146013 65527 7102 545552

563
Annexure 7.1.2
Plant Load Factor of Thermal Power Plants during the year 2001-2002
Sl. No. SEB/ Organisation Target AchievementState Sector
1 2 3 41 D.V.B. 51.90 45.202 H.P.G.C. 58.00 60.503 RRVUNL 82.20 84.804 P.S.E.B. 73.80 79.205 UPRVUNL 60.90 59.706 G.E.B. 68.90 66.307 GSECL 80.20 85.208 M.S.E.B. 73.40 74.509 M.P.E.B. 74.10 63.0010 C.S.E.B. 67.30 71.3011 APGENCO 83.00 86.3012 T.N.E.B. 82.70 78.0013 K.P.C.L 86.10 81.1014 B.S.E.B. 13.60 14.5015 JHARKHAND 21.50 21.0016 Tenughat V 39.40 31.5017 O.P.G.C. 76.10 70.7018 W.B.S.E.B. 38.3019 WB.P.DEV.CORP 52.40 51.7020 D.P.L. 41.60 30.4021 A.S.E.B. 23.40 16.80
Average : SEB’s 67.90 67.00* Bendal and Santadhih transfer to WBPDC w.e.f. 1.7.2001Central Sector
1. NTPC (STPS) 77.70 80.102. Badarpur 82.60 85.503. Neyveli 77.00 79.504 D.V.C. 37.80 33.60
Average: Central Sector 72.80 74.30Private Sector (Utilities)
1 A.E. Co./Sabarmati 82.30 82.302 Trombay (TATA) 66.30 72.003 CESC/Titagarh 72.60 69.004 BSES Co. 84.00 86.50
Average:Private (Utilities) 73.30 74.70Average: All India 69.90 69.90

564
Annexure 7.1.3
Generating Units Commissioned/Rolled during the year 2001-2002
Sl. Name of the Unit Type Sector State Implem Units Rolled/No. Project No. enting Commd.
AgencyCapacity Date
(MW)
1 2 3 4 5 6 7 8 9NORTHERN REGION
1. Pragati CCGT GT-I Thermal State Delhi DVB 104.60 15.03.2002
2. UpperSindh Ext. 2 Hydro State J&K JKPDC 35.00 29.03.2002
3 UpperSindh-II 2 Hydro State J&K JKPDC 35.00 11.09.2001
4 Seva-III 1 Hydro State J&K JKPDC 3.00 18.03.2002
5 Seva-III 2 Hydro State J&K JKPDC 3.00 18.03.2002
6 Seva-III 3 Hydro State J&K JKPDC 3.00 19.03.2002
7 Suratgarh TPP 3 Thermal State Raj. RRVUNL 250.00 29.10.2001St-II
8 Suratgarh TPP 4 Thermal State Raj. RRVUNL 250.00 23.03.2002St-II
9 Malana 1 Hydro Private H.P. MPCO 43.00 05.07.2001
10 Malana 2 Hydro Private H.P. MPCO 43.00 09.07.2001
Central State Private TotalHydro 0.00 79.00 86.00 165.00
Thermal 0.00 604.60 0.00 604.60
Nuclear 0.00 0.00 0.00 0.00
TOTAL(NR) 0.00 683.60 86.00 769.60
WESTERN REGION
1. Hazira CCGT 1to 3 Thermal State Gujrat GSES 156.10 1.11.01 toLtd. 31.03.02
2. Bansagar Tons 2 Hydro State M.P. MPEB 20.00 25.08.2001Ph-III
3 Bansagar Tons 1 Hydro State M.P. MPEB 15.00 18.02.2002Ph-III
Central State Private Total
Hydro 0.00 35.00 0.00 35.00
Thermal 0.00 156.10 0.00 156.10
Nuclear 0.00 0.00 0.00 0.00
TOTAL(WR) 0.00 191.10 0.00 191.10

565
Southern Region
1. Simhadri TPS 1 Thermal Central A.P. NPC 500.00 22.02.2002
2. Srisailam LBC 2 Hydro State A.P. APGENCO 150.00 29.10.20013 Srisailam LBC 3 Hydro State A.P. APGENCO 150.00 29.03.2002
4 Sharavathy tailrace 2 Hydro State Kar. KPCL 60.00 15.05.2001
5 Sharavathy tailrace 3 Hydro State Kar. KPCL 60.00 25.10.2001
6 Sharavathy tailrace 4 Hydro State Kar. KPCL 60.00 30.03.2002
7 Kolpaong 2 Hydro State A&N NHPC 2.60 24.07.2001
8 Kolpaong 3 Hydro State A&N NHPC 2.60 15.08.2001
9 LVS DGPP DG 1-2 Thermal Private A.P. LVS Power 36.80 18.10.2001
10 Peddapuram G T Thermal Private A.P. BSESAPP 142.00 26.01.2002CCGT
11 Tanir Bavi 1 to 4 Thermal Private Kar. TBPCO 220.00 08.05.2001CCGT/ST
12 Pillaiperumanallur 21.11.2002PPN CCGT ST Thermal Private T.N. PPN Power 105.50 05.04.2001
13 Samayanallur 1 to 7 Thermal Private T.N. B. Power 106.00 22.10.2001DGPP
Central State Private Total
1. Hydro 0.00 485.20 0.00 485.20
2. Thermal 500.00 0.00 610.30 1110.30
3 Nuclear 0.00 0.00 0.00 0.00
TOTAL(SR) 500.00 485.20 610.30 1595.50
Eastern Region
1 Jojobera TPS 2 Thermal Private Jhar Jam. 120.00 27.08.2001khand Power
Central State Private Total
1 Hydro 0.00 0.00 0.00 0.00
2 Thermal 0.00 0.00 120.00 120.00
3 Nuclear 0.00 0.00 0.00 0.00
TOTAL(ER) 0.00 0.00 120.00 120.00
Annexure 7.1.3 contd.
Generating Units Commissioned/Rolled during the year 2001-2002
Sl. Name of the Unit Type Sector State Implem Units Rolled/No. Project No. enting Commd.
AgencyCapacity Date
(MW)
1 2 3 4 5 6 7 8 9

566
Annexure 7.1.3 contd.
Generating Units Commissioned/Rolled during the year 2001-2002
Sl. Name of the Unit Type Sector State Implem Units Rolled/No. Project No. enting Commd.
AgencyCapacity Date
(MW)
1 2 3 4 5 6 7 8 9
North Eastern Region
1 Ranganadi 1 Hydro Central Ar.Prades NEEPCO 135.00 14.01.2002
2 Ranganadi 2 Hydro Central Ar.Prades NEEPCO 135.00 14.01.2002
3 Ranganadi 3 Hydro Central Ar.Prades NEEPCO 135.00 21.03.2002
4 Likim-ro 2 Hydro State Nagaland E.Deptt. 8.00 12.09.2001
5 Likim-ro 3 Hydro State Nagaland E.Deptt. 8.00 12.09.2001
6 Leimakhong DG 1 to 3 Thermal State Manipur E.Deptt. 18.00 23,25,
27/03.02
Central State Private Total
1. Hydro 405.00 16.00 0.00 421.00
2. Thermal 0.00 18.00 0.00 18.00
3 Nuclear 0.00 0.00 0.00 0.00TOTAL(NER) 405.00 34.00 0.00 439.00
Central State Private Total
Hydro 405.00 615.20 86.00 1106.20Thermal 500.00 778.70 730.30 2009.00Nuclear 0.00 0.00 0.00 0.00TOTAL(All India) 905.00 1393.90 816.30 3115.20

567
Annexure 7.1.4
Generating Units Slipped from the Programme of 2001-2002
Sl. Name of the Unit No. Type Sector State Imple- CapacityNo. Project menting (MW)
` Agency
1 2 3 4 5 6 7 81 Neyveli FST Ext. 1 Thermal Central T.N. NLC 210.00
2 Tehri St-I 4 Hydro Central Uttaranchal THDC 250.00
3 Pragati CCG T 2 Thermal State Delhi DVB 104.60
4 Leimakhong DG 4 to 6 Thermal State Manipur E.Deptt. 18.00
5 Rokhia GT ExtPh-II 7 Thermal State Tripura E.Deptt. 21.00
6 BansagarTonsPh-III 3 Hydro State M.P. MPEB 20.00
7 Srisailam LBPH 4 Hydro State Ar. Pradesh APGENCO 150.00
8 Chandil LBC 1 to 2 Hydro State Jharkhand JSEB 8.00
9 Potteru Ph-I 1 Hydro State Orissa OHPC 3.00
10 Potteru Ph-II 1 Hydro State Orissa OHPC 3.00
11 Likim-ro 1 Hydro State Nagaland E.Deptt. 8.00
12 Pahalgam 1 to 2 Hydro State J&K JKPDC 3.00
13 Bambooflat DG 1 to 4 Thermal Private A&N SuryaPower 20.00
14 Peddapuram CCGT ST Thermal Private Ar. Pradesh BSES APP 78.00
15 Dabhol CCGT Ph-II Block
I&II Thermal Private Maharastra DabholPowe 1444.00
Total 25 Units 2340.60

568
Annexure 7.1.5
Generating Capacity Addition Programme for the year 2002-03
Sl. Name of the Unit Type Sector State Implem- Units No. LikelyNo. Project No. enting Capacity Comm.
Agency (MW) Sch.(Mon/Yr)
1 2 3 4 5 6 7 8 9
NORTHERN REGION
1 Tehri St-I 1 Hydro Central Utaranchl THDC 250.00 March,2003
2 Pragati CCGT GT-2 Thermal State Delhi DVB 104.60 May., 2002
3 Pragati CCGT ST Thermal State Delhi DVB 121.20 Nov., 2002
4 Ramgarh CCGT St-II GT-2 Thermal State Raj. RRVUNL 37.50 June, 2002
5 Ramgarh CCGT St-II ST Thermal State Raj. RRVUNL 37.80 Dec., 2002
Central State Private Total
Hydro 250.00 0.00 0.00 250.00
Thermal 0.00 301.10 0.00 301.10
Nuclear 0.00 0.00 0.00 0.00
Total(NR) 250.00 301.10 0.00 551.10
WESTERN REGION
1 BansagarTonsPh-III 2 Hydro State M.P MPEB 20.00 Aug., 2002
2 BansagarTonsPh-III 3 Hydro State M.P MPEB 15.00 Aug., 2002
3 Dabhol CCGT Ph-II Block I-II Thermal Private Mah. Dabhol 1444.00 uncertainPCO
4 Akrimota Lignite 1 Thermal State Guj. M/S 125.00 Jan., 2003GMDCL
Central State Private Total
Hydro 0.00 35.00 0.00 35.00
Thermal 0.00 125.00 1444.00 1569.00
Nuclear 0.00 0.00 0.00 0.00
Total(WR) 0.00 160.00 1444.00 1604.00

569
Annexure 7.1.5 contd.
Generating Capacity Addition Programme for the year 2002-03
Sl. Name of the Unit Type Sector State Implem- Units No. LikelyNo. Project No. enting Capacity Comm.
Agency (MW) Sch.(Mon/Yr)
1 2 3 4 5 6 7 8 9
SOUTHERN REGION
1 Simhadri TPS 2 Thermal Central A.P. NTPC 500.00 Dec., 2002
2 Neyaveli FST Ext. 1 Thermal Central T.N. NLC 210.00 June, 2002
3 Neyaveli FST Ext. 2 Thermal Central T.N. NLC 210.00 Dec., 2002
4 Srisailam LBPH 4 Hydro State A.P. APGENCO 150.00 Oct., 2002
5 Srisailam LBPH 5 Hydro State A.P. APGENCO 150.00 Feb., 2003
6 Raichur TPP 7 Thermal State Kar. KPCL 210.00 Feb., 2003
7 Valuthur CCGT Thermal State T.N. TNEB 60.00 May, 2002
8 Valuthur CCGT ST Thermal State T.N. TNEB 34.00 Sept.,2002
9 Pddapuram CCGT ST Thermal Private A.P. BSES 78.00 June.,2002APPL
10 Neyaveli Zero Unit Thermal Private T.N. CMS 250.00 Sept.,2002EleCO
Central State Private Total
Hydro 0.00 300.00 0.00 300.00
Thermal 920.00 304.00 328.00 1552.00
Nuclear 0.00 0.00 0.00 0.00
Total (SR) 920.00 604.00 328.00 1852.00

570
Annexure 7.1.5 contd.
Generating Capacity Addition Programme for the year 2002-03
Sl. Name of the Unit Type Sector State Implem- Units No. LikelyNo. Project No. enting Capacity Comm.
Agency (MW) Sch.
(Mon/Yr)
1 2 3 4 5 6 7 8 9
EASTERN REGION
1 Chandil LBC 1 & 2 Hydro State Jhar- JSEB 8.00 Dec., 2002
khand
2 Potteru Ph-I 1 Hydro State Orissa OHPC 3.00 Sept, 2002
3 Potteru Ph-II 1 Hydro State Orissa OHPC 3.00 Sept.,2002
4 Bambooflat DG 1 & 2 Thermal Private AN Surya 10.00 May, 2002
Island Power
5 Bambooflat DG 3 & 4 Thermal Private AN Surya 10.00 Oct., 2002
Island Power
Central State Private Total
Hydro 0.00 14.00 0.00 14.00
Thermal 0.00 0.00 20.00 20.00
Nuclear 0.00 0.00 0.00 0.00
Total (ER) 0.00 14.00 20.00 34.00
NORTH EASTERN REGION
1 Likim-ro 3 Hydro State Nagaland E.Deptt. 8.00 June.,2002
2 Leimakhong DG 4 to 6 Thermal State Manipur ED / BHEL 18.00 April,2002
3 RokhiaGT Ext Ph-II 7 Thermal State Tripura E.Deptt. 21.00 June ,2002
4 Baramura GT Ext Thermal State Tripura ED / BHEL 21.00 Sept.,2002
Central State Private Total
Hydro 0.00 8.00 0.00 8.00
Thermal 0.00 60.00 0.00 60.00
Nuclear 0.00 0.00 0.00 0.00
Total 0.00 68.00 0.00 68.00
(NER)
Central State Private Total
Hydro 250.00 357.00 0.00 607.00
Thermal 920.00 790.10 1792.00 3502.10
Nuclear 0.00 0.00 0.00 0.00
Total ALL 1170.00 1147.10 1792.00 4109.10INDIA

571
Annexure 7.1.6
Outlays/Expenditure -Power
Sl. State/UTs 1997-98 1998-99 1999-2000 2000-01 2001-02 2001-02 2002-03No. Actual Actual Actual R.E. Appd. R.E. Appd.A. States1 Andhra Pradesh 858.25 797.06 986.63 2657.50 2330.32 2321.492 Arunachal Pradesh 84.04 71.43 78.41 85.28 86.39 89.96
3 Assam 113.12 83.81 64.38 92.84 126.63 126.63
4 Bihar 49.10 122.96 129.00 39.95 60.58 60.58
5 Chhatisgarh 8.57 8.576 Goa 18.16 24.01 34.07 30.00 33.00 33.00
7 Gujarat 660.39 660.39 798.49 750.00 785.40 702.42
8 Haryana 287.40 430.00 435.42 374.00 432.00 35.85
9 Himachal Pradesh 233.60 255.99 191.67 260.92 213.43 198.3210 Jammu & Kashmir 251.59 220.20 301.60 307.57 340.42 340.42
11 Jharkhand 150.00 150.00
12 Karnataka 557.43 1080.52 1046.24 924.94 936.05 768.05
13 Kerala 523.20 645.00 558.46 504.64 499.00 410.0014 Madhya Pradesh 738.99 700.85 751.39 262.71 344.52 326.91 Yet to
15 Maharashtra 1909.16 1738.19 1684.13 1767.35 1478.83 1478.83 be com-
16 Manipur 50.18 36.00 53.13 34.50 41.61 18.11 piled17 Meghalaya 7.10 20.64 12.50 30.43 60.31 65.76
18 Mizoram 28.41 25.65 47.50 48.52 41.32 41.43
19 Nagaland 15.54 15.00 14.48 15.57 39.47 44.00
20 Orissa 153.20 424.35 255.73 538.86 855.58 448.8021 Punjab 1132.13 1036.18 626.64 592.37 699.00 699.00
22 Rajasthan 1494.43 792.23 763.63 1085.60 1277.56 1206.50
23 Sikkim 31.76 32.55 37.60 31.76 38.26 36.26
24 Tamil Nadu 795.49 816.74 1033.61 1117.85 765.54 948.3725 Tripura 25.99 24.48 18.20 17.23 21.54 21.54
26 Uttar Pradesh 1114.55 1095.15 1049.02 775.38 1054.34 728.83
27 Uttranchal 88.60 88.60
28 West Bengal 1026.99 1310.55 992.39 879.33 1541.70 1232.23Sub Tota (States) 12160.20 12459.93 11964.32 13225.10 14349.97 12630.46
B. Union Territories1. A & N Islands 23.98 26.41 29.24 36.00 30.50 30.502. Chandigarh 10.32 11.00 13.26 11.03 12.55 12.55
3. Dadra & Nagar Haveli 7.19 9.17 11.00 13.15 14.94 14.94
4. Daman & Diu 4.76 8.29 13.55 13.90 14.25 14.25
5. Delhi 297.97 438.25 483.58 812.55 698.50 698.506. Lakshadweep 2.92 2.22 2.21 2.27 2.73 2.73
7. Pondicherry 44.95 46.66 21.22 20.88 22.86 27.69
Sub Total (U.T.s) 392.09 542.00 574.06 909.78 796.33 801.16Total (States & UTs) 12552.29 13001.93 12538.38 14134.88 15146.30 13431.62

572
Annexure 7.1.6-contd.
Outlays/Expenditure -Power Sector
Sl. State/UTs 1997-98 1998-99 1999-2000 2000-01 2001-02 2001-02 2002-03No. Actual Actual Actual R.E. Appd. R.E. Appd.
C. Ministry of Power
1. NTPC 1685.69 2111.15 1844.41 1921.10 3006.00 2903.94 3506.00
2 NHPC 506.47 506.45 1006.03 1176.86 1909.79 1846.12 2925.89
3. POWERGRID 1583.50 1301.09 1500.52 1576.47 2869.00 2451.00 3312.00
4. DVC 166.97 99.73 97.59 64.12 284.00 110.48 840.66
5. THDC 321.91 203.73 337.68 476.92 1228.17 498.00 1139.80
6. NJPC 770.60 878.45 753.76 681.15 894.00 1100.13 653.00
7. NEEPCO 167.18 191.57 231.23 80.13 211.72 183.05 375.76
8. PFC 716.77 1322.36 1333.00 0.47 0.00 0.00 0.00
9. REC 30.00 75.00 184.83 91.83 37.00 37.00 0.00
10 PTC 0.00 0.00 0.00 0.00 50.00 0.00 1.00
11 MOP (Misc.) 110.63 488.09 410.29 484.86 575.85 795.73 728.89
Sub Total(MOP) 6059.72 7177.62 7699.34 6553.91 11065.53 9925.45 13483.00
DAE (Power) 747.27 854.66 958.54 908.11 1242.00 1422.00 1716.00
NLC (Power) 37.00 124.80 131.16 469.49 538.84 292.85 292.72
Total Central 6843.99 8157.08 8789.04 7931.51 12846.37 11640.30 15491.72
Sector (Actual)
ALL INDIA 19396.28 21159.01 21327.42 22066.39 27992.67 25071.92 N.A.
N.E.C. 163.00 209.50 328.62 154.31 228.89 57.50

573
Annexure 7.1.7
Details of Central Sector / Centrally Sponsored Schemes (CSS) with regard toZero Based Budgeting Exercise for the Annual Plan 2002-03
Sl. Name of the Scheme Ninth Plan Externally Recommendations Decisions of PlanNo. by Commission
Outlay Anti. Expen. Ministry/ Planning(Rs. crore) (Rs. crore) (Yes Deptt. Commission
or No)
CENTRAL SECTOR SCHEMES
1 Central Power 100.00 68.52 NO Retained Retained Should beResearch Institute as such as such continued(CPRI)
2 Energy Conservation 52.00 21.66 NO Retained Retained Should be/ EMC as such as such continued
3 Kutir Jyoti Programme 200.00 262.68 NO Retained Retained Should beas such as such continued
4 National Power 38.00 17.09 NO Retained Retained Should beTraining Institute as such as such Merged with(NPTI) Schemes
at Sl. No.18 & 19
5 Powergrid Grant-in-aid 2.00 40.00 NO Retained Retained Should beas such as such continued
6 Setting up of Joint 2.84 0.50 NO To be weeded Should beElectricity Regulatory retained out weeded outCommission with modi-
fications
7 Badarpur Thermal 100.00 54.13 NO Retained Weeded Should bePower Project as such out weeded out(BTPP)
8 Flexible AC 0.00 0.00 NO Weeded Weeded Should beTransmission System out out. wedded out
9 Incentive scheme for 22.00 29.95 NO Weeded Weeded Should bebetter performance of out out wedded outTPS/ reduction inT&D losses.
10 Power FinanceCorporation Subsidy 1233.00 1284.21 NO To be No Should be
with modi- decision wedded outfications yet.
11 Sardar Sarovar 120.00 144.87 NO Retained No decision Should beas such. yet. weeded out
Central Electricity Authority
12 Procurement of 2.93 2.01 NO Retained Retained (SchemesSoftware Pachages as such as such at (Sl.No.
12 & (13should bemerged
13 Technology 6.24 2.52 NO Retained Mergedimprovement in CEA as such. with
Sr. no. 12

574
14 Strengthening up of 14.18 5.74 NO Retained Retained should beRegional as such. as such. continuedElectricity Boards
15 Accelerating Power 0.72 0.51 NO Retained Retained Schemes atGeneration-Pager as such. as such. Sl. No.Scheme 15 to 17
should bemerged
16 Project Maintenance 0.61 0.16 NO Retained MergedMonitoring of Thermal as such. withPower Stations Sr. no. 15
17 Renovation & 8.89 8.95 NO Retained MergedModernisation of as such. withThermal Power Station. Sr. no. 15
18 Power System 5.22 5.11 NO Retained Merged Scheme atTraining Institute as such. with NPTI Sl. No. 18Stag+B24e-II of MOP & 19 should
Scheme at be mergedSr. no. 4 at Sl. No. 4
19 Hot Line Training 5.66 4.12 NO Retained MergedCentre Stage-II as such. with NPTI
of MOPScheme atSr. no. 4
20 Energy Audit & Studies 0.28 0.11 NO Weeded Weeded Should befor Reduction of out out weededSecondary Fuel Oil outConsumption atSelected TPS
21 Load Despatching 0.55 0.82 Yes Weeded Weeded Should beStation - Construction out out weededof Staff quarters, outERLDC, Kolkatta
22 Transfer of Technology 16.10 22.43 Yes Weeded Weeded Should bein Hydro Development out out weeded out
23 Updating of Planning 12.83 8.98 Yes Weeded Weeded Should beModels out out weeded out
Centrally Sponsored Schemes
1 Inter-State 6.00 11.82 NO No Weeded Should beTransmission Lines comments out weeded out
Annexure 7.1.7 Contd.
Details of Central Sector / Centrally Sponsored Schemes (CSS) with regard toZero Based Budgeting Exercise for the Annual Plan 2002-03
Sl. Name of the Scheme Ninth Plan Externally Recommendations Decisions of PlanNo. by Commission
Outlay Anti. Expen. Ministry/ Planning(Rs. crore) (Rs. crore) (Yes Deptt. Commission
or No)

575
Annexure 7.1.8
Operationalisation of the results of Zero Based Budgeting exercise Convergence, Weeding out of Central / Centrally Sponsored Schemes (CS)/(CSS)
Status of Scheme-wise Break-up ofAnnual Plan 2002.03 allocations of Ministry of Non-Conventional Energy Sources (MNES)
(Rs.in Crore)S. No. Category of No. of 9th Plan 9th Plan A.P.
Schemes schemes outlay RE 2002-20039th Plan Appd. Outlay
1 2 3 4 56
1. Schemes to be 8 1108.00 715.74 238.50Continued as suchBreak-upWind power 71.00 34.20 15.00Small Hydro Power 187.00 116.00 28.00
Biomass Power 251.00 73.00 25.00Solar Power 63.00 38.80 18.00Village Electrification - 20.00 8.00SPV lighting National - - 53.50Project on Biogas 286.00 257.24 56.00IREDA 250.00 176.50 35.00
2. Should be 4 544.00 367.87 237.50Continued afterRestructuring/mergingIndicating specificProjects/facilitiesBreak-upResearch, Design Development& Demonstration 132.50Infrastructure Development And 62.50Capacity BuildingAwareness & Extension 22.75Programme (incl.IREP)MNES Institutions 19.75
3. Schemes to beweeded out 1 2.14 0.13 Nil
4. Total number ofexisting schemes 12 1654.14 1083.74 476.00
5. Total schemes remaining in 11 1652.00 1097.68 476.00the Tenth Plan

576
Annexure 7.1.9
Petroleum and Natural GasExploratory and Development Drilling (‘000 M)
Programmes 2000-01 2001-02 2002-03Actuals Targets Anticiptd. Target
Achievement
1 2 3 4 5
1. Exploratory Drilling
a) O N G Ci) Onshore 291.84 364.56 325.60 307.51ii) Offshore 67.76 137.90 85.02 111.30
b) OILi) Onshore 39.16 60.20 41.33 58.00ii) Offshore 0.00 0.00 0.00 0.00
Total (Expl.) 398.76 562.66 451.95 476.81
2. Development Drilling
a) ONGCi) Onshore 266.09 243.10 247.98 266.26ii) Offshore 47.87 52.65 78.32 140.00
b) OILi) Onshore 49.56 62.30 58.67 60.20ii) Offshore 0.00 0.00 0.00 0.00
Total (Dev.) 363.52 358.05 384.97 466.46

577
Annexure 7.1.10
Petroleum and Natural GasCrude Oil Production (MMT)
Region 2000-01 2001-02 2002-03Actuals Targets Achievement # Target
1 2 3 4 5
a) ONGC
i) Onshore 8.43 8.70 8.64 8.66ii) Offshore 16.63 16.50 16.07 17.24
Sub Total (a) 25.06 25.20 24.71 25.90
b) OIL
i) Onshore 3.29 3.45 3.18 3.50ii) Offshore 0.00 0.00 0.00 0.00
Sub Total (b) 3.29 3.45 3.18 3.50
Total (ONGC+OIL) 28.35 28.65 27.89 29.40
JVC/Pvt 4.08 3.85 4.14 3.68
Total 32.43 32.50 32.03 33.08
# provisional

578
Annexure 7.1.11
Petroleum and Natural GasNatural Gas Production (BCM)
Region 2000-01 2001-02 2002-03Actuals Targets Achievement # Target
1 2 3 4 5
a) ONGC
i) Onshore 5.56 5.38 5.61 5.68
ii) Offshore 18.47 18.62 18.43 18.01
Sub Total (a) 24.03 24.00 24.04 23.69
b) OIL
i) Onshore 1.86 1.74 1.62 2.19
ii) Offshore 0.00 0.00 0.00 0.00
Sub Total (b) 1.86 1.74 1.62 2.19
Total (ONGC+OIL) 25.89 25.74 25.66 25.88
JVC/Pvt 3.59 4.02 4.03 5.49
Total 29.48 29.76 29.69 31.37
# provisional
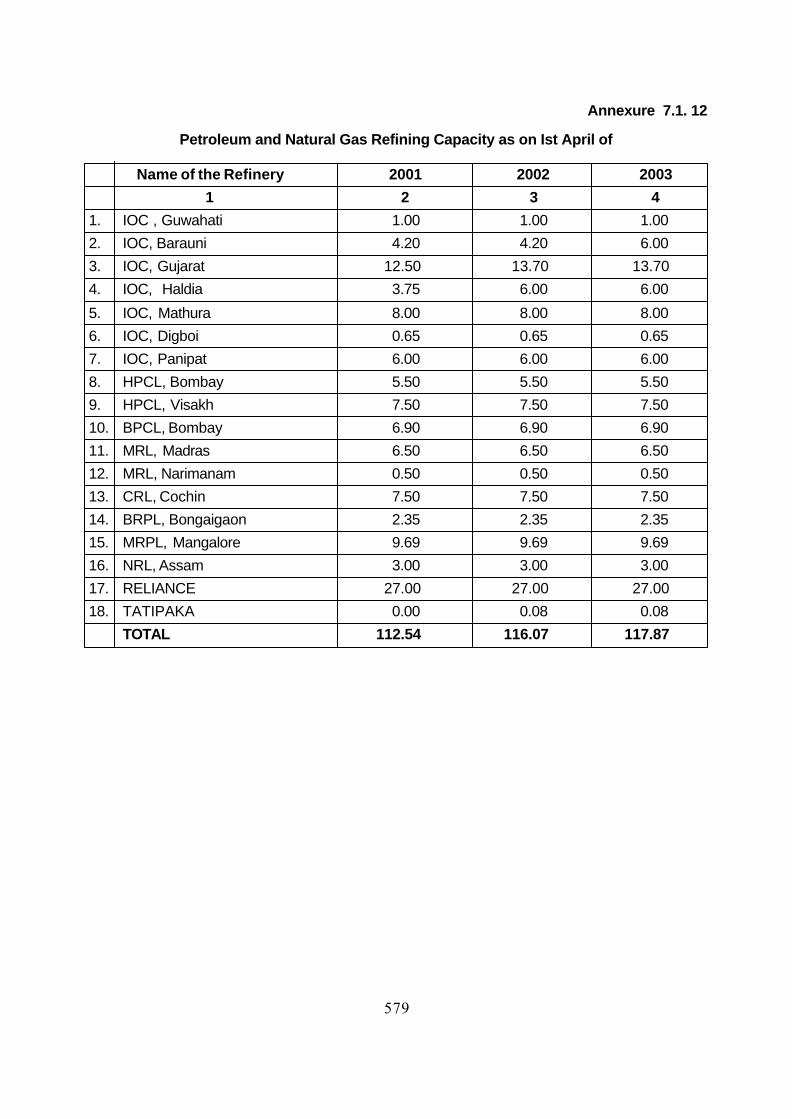
579
Annexure 7.1. 12
Petroleum and Natural Gas Refining Capacity as on Ist April of
Name of the Refinery 2001 2002 2003
1 2 3 4
1. IOC , Guwahati 1.00 1.00 1.00
2. IOC, Barauni 4.20 4.20 6.00
3. IOC, Gujarat 12.50 13.70 13.70
4. IOC, Haldia 3.75 6.00 6.00
5. IOC, Mathura 8.00 8.00 8.00
6. IOC, Digboi 0.65 0.65 0.65
7. IOC, Panipat 6.00 6.00 6.00
8. HPCL, Bombay 5.50 5.50 5.50
9. HPCL, Visakh 7.50 7.50 7.50
10. BPCL, Bombay 6.90 6.90 6.90
11. MRL, Madras 6.50 6.50 6.50
12. MRL, Narimanam 0.50 0.50 0.50
13. CRL, Cochin 7.50 7.50 7.50
14. BRPL, Bongaigaon 2.35 2.35 2.35
15. MRPL, Mangalore 9.69 9.69 9.69
16. NRL, Assam 3.00 3.00 3.00
17. RELIANCE 27.00 27.00 27.00
18. TATIPAKA 0.00 0.08 0.08
TOTAL 112.54 116.07 117.87

580
Annexure 7.1.13
Petroleum & Natural Gas Sector Outlays/ Expenditure (Rs. Crore)
Name of the Companies 2000-01 2001-02 2002-03Actuals BE RE BE
1 2 3 4 5
A. Exploration & Production
1. ONGC 3607.21 6073.75 8159.08 8973.31
2. OIL 556.23 800.01 650.00 900.00
3. GAIL 1066.93 1139.85 724.81 1492.95
Sub Total (A) 5230.37 8013.61 9533.89 11366.26
B . Refining & Marketing
1. IOC 2791.95 5844.92 2615.77 3000.00
2. HPCL 311.89 1300.00 617.00 900.00
3. BPCL 1082.52 398.70 299.90 650.00
4. CPCL 85.32 599.70 399.24 1000.00
5. KRL 59.97 525.00 68.00 75.00
6. BRPL 31.15 47.75 35.10 10.00
7. EIL 10.84 6.93 6.93 0.00
8. IBP 124.20 195.83 140.00 144.00
9. NRL 139.00 3.25 42.00 38.00
Sub Total (B) 4636.84 8922.08 4223.94 5817.00
Total Petroleum 9867.21 16935.69 13757.83 17183.26

581
7.2 IRRIGATION, FLOOD CONTROL AND COMMAND AREADEVELOPMENT
1. The Tenth Plan envisages an annual average 8% growth rate for the economy as awhole. To achieve this, it has been estimated that agriculture will have to grow at 4%.Irrigation is the most important and vital input for agriculture and to achieve the projectedgrowth rate in agriculture, irrigation will have to also grow at a commensurate pace. TheTenth Plan strategy for irrigation is proposed to focus on completion of on-going projects bytargeting Central assistance programmes like AIBP to achieve this, promotion of water useefficiency, restructuring the CAD Programme to introduce system rehabilitation and farmers’participation, reconciliation and firming up figures of irrigation statistics, stepping up ofwater-rates and working out appropriate norms for administrative costs in O&M component,surface and ground water pollution and flood management.
Major & Medium Irrigation
2. The ultimate irrigation potential from major and medium irrigation projects is 58.46m.ha. The potential achieved till end of Ninth Plan is 37.08 m.ha. Annexure 7.2.6 givesState-wise position of potential created and utilized till end of Ninth Plan. The WorkingGroup for the Tenth Plan has recommended an investment of Rs. 1,07,327 crores for theTenth Plan for major and medium sector to create 11.14 m.ha. additional potential.Expenditure on major & medium irrigation sector in the Ninth Plan is given in Table 7.2.1.
Table 7.2.1
Major & Medium Irrigation(Expenditure on major & medium irrigation sector in the Ninth Plan).
(Rs. Crore)
Period Central Sector State SectorApproved Actual Approved Actual
Outlay Amount/Exp. Outlay Amount/Exp.
Ninth Plan 225.70 211.53 42644.11 48259.08
1997-98 39.69 35.95 8362.92 7523.16
1998-99 47.56 47.72 10024.03 8144.31
1999-2000 52.51 48.24 12228.81 11234.79
2000-2001 50.60 36.91 12922.40 10370.56
2001-2002 56.14 48.25 12533.79 10986.27
Tenth Plan 337.13 - 70861.78 -
2002-2003 60.80 - 13646.07 -

582
Programme for 2002-2003
3. The Working Group for Major & Medium Irrigation for the Tenth Plan has estimatedthat 159 major, 242 medium and 89 Extension, Renovation, Modernisation Projects havespilled over to the Tenth Plan. Many of these projects were started in pre-Fifth Planperiod. With a view to complete a substantial number of on-going projects, the AcceleratedIrrigation Benefits Programme will be targeted in the Tenth Plan to complete projects in anadvanced stage. The following modifications in the programmes have been recentlyapproved.
(i) A fast track component for completion of projects in two working seasons with 100% loanassistance.
(ii) A liberalized loan assistance in ratio of 4:1 (Centre:State) against normal 2:1 for Statesagreeing to undertake reforms in the water sector directed towards recovery of full O&Mcosts from water charges in a five year time frame. For special category States, the ratio is1:0 against normal 3:1.
4. Till March 2002, an amount of Rs. 8,480 crores has been released under theprogramme to 150 major/medium projects and 2450 surface M.I. schemes including Rs.472.80 crores for 13 projects under fast track. The State Governments have reportedcompletion of 20 projects under the programme and creation of 1.09 m.ha. additionalpotential. For 2002-03 a provision of Rs. 2,800 crores has been made under AIBP.Government of Rajasthan has signed an undertaking with MoWR to carry out reforms in thewater sector. Government of Madhya Pradesh has also offered to carry out reforms whichis under examination.
Externally Aided Projects
5. 15 Irrigation projects are receiving external assistance as shown in Table 7.2.2.
Table 7.2.2
Externally Aided Projects(Name of Project, Assistance Amount and Disbursement till March 2002)
S. Name of Project Date of agreement/ Assistance Amount. DisbursementNo World Bank Aided Date of completion US $ in million Till March 2002
1. Andhra Pradesh III 3.6.1997 325.00 131.50Irrigation Project 31.1.2003
2. AP Economic restructuring 30.1.1999 142.00 63.00project 31.3.2004
3. Orissa WRCP 5.1.1996 290.90 179.6230.9.2002
4. Rajasthan Water sector 15.3.2002 143.00 5.00restructuring project 31.3.2008
5. UP water sector restructuring 8.3.2002 149.20 5.00projects 31.10.2007

583
6. Tamil Nadu WRCP 22.9.1995 289.90 150.0631.3.2003
7. Karnataka Tank Management 6.6.2002 98.90 -Project 31.3.2009
8. Hydrology Project 22.9.1995 142.00 67.6731.3.2003
EEC
9. Orissa Minor Irrigation Project 3.7.1995 10.70 1.1031.12.2004 (ECU in million)
10. Pondicherry Tank rehabilitation 21.2.1997 6.65 0.82project 21.2.2003
11. Maharashtra Saline Land 11.7.1995 15.50 1.23reclamation project phase II 31.12.2005
Bilateral
12. Modernisation of Kurnool- 25.1.1996 16049.00 5177.40Cuddapali Canal in A.P. (JBIC) 26.3.2003 million yen
13. Maharashtra Minor Irrigation 21.12.1998 DM 45.00 2.34Project (Germany) 31.12.2006 Million
14. Rengali Irrigation Orissa (JBIC) 12.12.1997 7760.00 3620.0011.12.2002 million yen
15. Rajghat Canal (MP) 25.2.1997 13222.00 4683.60(JBIC) 31.5.2006 million yen
S. Name of Project Date of agreement/ Assistance Amount. DisbursementNo World Bank Aided Date of completion US $ in million Till March 2002
Minor Irrigation
6. All ground water and surface water schemes having a culturable command area upto2000 ha individually are classified as minor irrigation schemes. Minor surface flowirrigation projects comprising storage tanks, diversion and surface lift occupy a prominentplace in the scheme of irrigated agriculture particularly in the peninsular part of the countryand the hilly areas. Minor irrigation schemes have a short gestation period, are labourintensive and are an important means for poverty alleviation.
7. The ultimate irrigation potential from Minor Irrigation projects is estimated as 81.43 m.ha of which 17.38 m.ha is from surface water minor irrigation and 64.05 m.ha. from groundwater. The Working Group for the Tenth Plan has recommended an investment of Rs.36,200 crores in the Tenth Plan to create 8 m.ha. additional potential. Till the end of theNinth Plan, a potential of 56.90 m. ha. had been created. State-wise position is atAnnexure 7.2.6.
8. Minor irrigation schemes are funded from plan funds, institutional finance and privateinvestment by the farmers. It is generally considered as a people’s programme. Theoutlays and expenditure in the Central sector and State sector for Minor Irrigation duringthe Ninth Plan are given in Table 7.2.3

584
Regulation of Ground Water Exploitation
9. As per data compiled by the Central Ground Water Board upto April 1998, out of5711 blocks/mandals/talukas/watersheds in the country, 310 are categorized as overexploited and 160 are dark. The Central Ground Water Authority is continuing itsregulatory function to see that the position of over exploitation is kept in check. The StateGovts. will continue to be persuaded to enact ground water legislation, a model bill forwhich is already circulated.
Command Area Development
10. The Command Area Development Progamme (CADP) was initiated in 1974-75 as aCentrally Sponsered Scheme with a view to bridge the gap between potential created andutilized and optimizing agricultural production through better management of land and wateruse in the command areas served by selected major & medium irrigation projects. 236projects are included now in the programme covering a CCA of 22.72 m.ha. The corecomponents of construction of field channels, field drains, warabandi and land levelingconstitute almost 70 % of the expenditure incurred on Central Sector of CADP. Thephysical achievements on these four components till end of the Ninth Plan are given inTable 7.2.4..
Table 7.2.3
Minor Irrigation
Outlays and Expenditure in the Central sector and State sector forMinor Irrigation during the Ninth Plan
(Rs. Crore)
Year Central Sector State SectorApproved Actual/Amt. Approved Actual/Amt.
Outlay Expenditure Outlay Expenditure
Ninth Plan 393.49 347.50 8984.84 8615.07
1997-1998 70.56 42.85 1799.20 1456.59
1998-1999 67.40 48.09 2057.20 1566.25
1999-2000 55.81 56.47 2117.79 1840.21
2000-2001 85.27 66.28 1907.93 1853.28
2001-2002 96.58 116.42 2121.42 1898.74
Tenth Plan 533.80 - 13872.86 -
2002-2003 109.16 - 2057.02 -

585
11. The Working Group for the Tenth Plan has recommended an outlay of Rs. 4,962.5crores for the Command Area Development (CAD Programme in the Tenth Plan. Theoutlays and expenditure in the Central Sector and State Sector for the CADP are given inTable 7.2.5.
Table 7.2.4
Command Area Development (CAD) - Physical(m.ha.)
Core component Achievement till Progress in Achievement tillend of 8th Plan 9th Plan end of 9th Plan
Field channels 13.94 1.78 15.72
Warabandi 8.99 1.58 10.57
Field Drains 0.35 0.33 0.68
Land Levelling 2.10 0.09 2.19
Table 7.2.5
Command Area Development (CAD) - FinancialOutlays and Expenditure in theCentral Sector and State Sector for the CAD
(Rs. Crore)
Year Central Sector State SectorApproved Actual/Amt. Approved Actual/Amt.
Outlay Expenditure Outlay Expenditure
Ninth Plan 797.52 720.45 2027.19 1519.17
1997-1998 140.70 129.96 371.35 303.43
1998-1999 188.00 175.32 348.48 311.37
1999-2000 178.00 163.92 315.39 310.50
2000-2001 160.88 144.95 298.07 353.48
2001-2002 187.19 148.27 245.16 232.39
Tenth Plan 1401.80 - 2846.44 -
2002-2003 202.00 - 271.44 -
Restructured Command Area Development Programme (CADP)
12. The CADP is being restructured in the Tenth Plan to include system rehabilitation,participatory management and revision in cost norms.The programme will however continuein the present form in 2002-03.

586
Flood Control
13. The Rashtriya Barh Ayog has estimated the flood prone area in the country as about40 m.ha of which 32 m.ha can be given reasonable degree of protection. So far about 19m. ha. has been protected through construction of embankments, drainage channels, townprotections works and raising of villages above flood level. The Working Group for theTenth Plan has recommended an outlay of Rs. 10,631.84 crores in the Tenth Plan tobenefit 2.78 m.ha. The Plan Outlays and Expenditure in the Flood Control Sector during IXth Plan is given in Table 7.2.6.
Table 7.2.6
Flood ControlPlan Outlays and Expenditure in the Flood Control Sector during IX th Plan
(Rs. Crore)
Year Central Sector State SectorApproved Actual/Amt. Approved Actual/Amt.
Outlay Expenditure Outlay Expenditure
Ninth Plan 623.04 409.12 2216.36 2629.23
1997-1998 72.15 48.47 365.86 351.87
1998-1999 71.65 55.87 639.94 476.77
1999-2000 61.79 68.69 662.36 486.72
2000-2001 154.87 95.13 654.25 620.10
2001-2002 148.85 124.56 801.62 693.77
Tenth Plan 1168.10 - 4562.25 -
2002-2003 151.02 - 592.06 -
14. The Working Group on Flood Management for the Tenth Plan has suggested settingup an Integrated Flood Management Commission to review the status of implementation ofthe recommendations of the Rashtriya Barh Ayog. Such a Commission could also studyother long term permanent solutions to the flood problem like raising of village, changes incrop pattern etc. The Working Group has recommended modernization and strengtheningof existing flood forecasting arrangements so as to advance the warning time.
Zero Based Budgeting
15. The Zero Based Budgeting Exercise for 2002-03 was taken up for the Ministry ofWater Resources by the Planning Commission. Out of 71 schemes in operation at end ofthe 9th Plan, 6 were recommended for weeding out. Out of the balance 65 schemes, 47were recommended for retention and 18 for merger into 6 schemes giving in effect 53schemes for operation in 2002-03. The MoWR are broadly in agreement with this exerciseexcept that there will be 59 schemes in 2002-03 due to spillover liabilities/on-goingschemes in last year. In fact, from 2003-04 onwards there will be only 49 schemes inoperation against 53 recommended by the Planning Commission.

587
National Water Policy
16. The revised National Water Policy has been adopted by the National WaterResources Council on 1/4/2002. The State Governments have been requested to bring outsimilar State Water Policies and also prepare an Action Plan for implementation of theNWP.
Achievements by the end of 9th Plan
17. The State Governments have indicated in various Working Group meetings about thecompletion of the following major, medium projects by the end of 9th Plan i.e. March 2002.
(a) Kerala - Kallada(b) M.P. - Bhander Canal, Barna, Kolar.(c) Chattisgarh - Jonk Diversion.(d) Rajasthan - Jakhom, Som Kamla Amba, Pachna(e) U.P. - Bewar feeder, Sarda Sahayak, Maudha Dam, Chambal lift,
Gyanpur pump Canal, Sone pump Canal, Revised Tonspump Canal, Chittaurgarh reservoir, Modernisation ofGhaghhar Canal, Gunta Nala Dam, Pathrai Dam
Rural Infrastructure Development Fund
18. The Indian Scheduled Commercial Banks are under an obligation to lend at least 40%of their aggregate loans to the priority sectors and within the overall target for prioritysector at 40%, these banks have to observe a target of 18% for agriculture sub-sector.The Rural Infrastructure Development Fund (RIDF) thus came into existence with theannouncement in the Union Budget for the year 1995-96.
The Funding of Rural Infrastructure Development Fund
19. The fund has been established in NABARD since April 1995. The initial corpus of thefund was Rs. 2,000 Crores (RIDF-I) for the year 1995-96 to be contributed by the IndianScheduled Commercial Banks representing the short fall in their lending to agriculture sub-sector (18%) within the priority sector target (40%), subject to a ceiling of 1.5% of the netBank credit. Since then, the scheme has been continued with the announcements in thesuccessive Union Budgets with enhanced commitments, which are as under:
Programme Year (Rs. in Crore)
RIDF I 1995-96 2000
RIDF II 1996-97 2500
RIDF III 1997-98 2500
RIDF IV 1998-99 3000
RIDF V 1999-2000 3500
RIDF VI 2000-01 4500
RIDF VII 2001-02 5000
RIDF VIII 2002-03 5500

588
20. The loan assistance under RIDF is provided for incomplete or ongoing projects inMajor, Medium and minor irrigation along with projects in flood protection, watershedmanagement, soil conservation, rural roads and bridges, rural markets, primary schoolbuildings, rural drinking water works, drainage, primary health centers, forest developmentetc. Loans under RIDF are sanctioned upto 90% of the project cost or the balance costwhichever is less.
21. Presenting the Central Government’s Budget for 1999-2000, the Minister of Financeannounced that the period of repayment has been increased from 5 to 7 years under RIDFV. It may further be mentioned that the loans to the State Governments were provided atthe rate of 12% p.a. (13% p.a. under RIDF I) and in the Central Government’s Budget for2000-2001 the interest charged on lending since RIDF VI has been reduced by half percent i.e. the rate of interest has been reduced to 11.5% p.a.
22. The disbursement and sanction of RIDF for irrigation sector has been indicated inAnnexure 7.2.5. It was noticed that there has been increasing trend for availing RIDFassistance for projects relating to strengthening of existing roads. It was therefore decidedin a meeting of the PSC and the Board of the Bank held on 15 October 1999 that henceforth greater priority should be given only for purposes such as irrigation and newconnectivity of villages and marketing centers through construction of village roads/bridges.Accordingly, the State Governments have been advised to focus on these sectors for futureassistance under RIDF. However, the nature of the fund in its present form restrictsNABARD in taking up sanctions for major and medium irrigation due to longer duration ofthese projects.

589
Annexure – 7.2.1
Actual Expenditure in respect of Major & Medium Irrigation, Minor Irrigation,CAD & Flood Control for the year 1998-99
(Rs. in crore)
Sl. Name of States & UTs Major & Minor CAD Flood TotalNo. Medium Irrigation Control1 2 3 4 5 6 71 Andhra Pradesh 709.98 175.54 8.99 36.98 931.492 Arunachal Pradesh 0.33 13.37 0.82 4.33 18.853 Assam 38.77 67.59 3.19 14.72 124.274 Bihar 327.59 40.42 11.94 48.06 428.015 Goa 20.22 5.56 1.53 1.16 28.476 Gujarat 1212.95 148.16 11.32 4 1376.437 Haryana 231.27 39.46 8.99 27.36 307.088 Himachal Pradesh 12.03 42.81 0.23 5.54 60.619 Jammu & Kashmir 27.54 28.17 3.39 16.27 75.3710 Karnataka 1431.1 92.53 20.45 14.17 1558.2511 Kerala 171.09 72.23 12 25.48 280.8012 Madhya Pradesh 462.85 153.44 3.91 12 632.2013 Maharashtra 1593.68 292.25 62.92 3.23 1952.0814 Manipur 29.02 7.43 2.05 5.1 43.6015 Meghalaya 2.49 6.5 0.22 3 12.2116 Mizoram 0.03 4.88 0.03 0 4.9417 Nagaland 0 2.04 0.1 0.09 2.2318 Orissa 526.71 83.98 6.18 16.03 632.9019 Punjab 69.72 37.43 35.76 111.14 254.0520 Rajasthan 444.65 48.3 66.3 5.73 564.9821 Sikkim 0 0.85 0.02 2.84 3.7122 Tamil Nadu 221.27 35.13 21.88 0 278.2823 Tripura 7.58 8.94 0.02 3.75 20.2924 Uttar Pradesh 448.4 108.59 25.15 26.45 608.5925 West Bengal 153.65 41.44 3.77 68.39 267.25
Total States 8142.92 1557.04 311.16 455.82 10466.94Union Territories
26 A & N Island 0 2.40 0 0 2.4027 Chandigarh 0 0.44 0 0 0.4428 D & N Haveli 1.05 1.24 0.21 0 2.5029 Daman & Diu 0.34 0.03 0 0.34 0.7130 Delhi 0 0.66 0 14.88 15.5431 Lakshadweep 0 0 0 2.55 2.5532 Pondicherry 0 4.44 0 3.18 7.62
Total U.Ts. 1.39 9.21 0.21 20.95 31.76Total States & Uts. 8144.31 1566.25 311.37 476.77 10498.70Central Sector 59.11 58.75 175.32 74.57 367.75Grand Total 8145.70 1575.46 311.58 497.72 10530.46

590
Annexure – 7.2.2
Actual Expenditure in respect of Major & Medium Irrigation, Minor Irrigation,CAD & Flood Control for the year 1999-2000
(Rs. in crore)
Sl. Name of States & UTs Major & Minor CAD Flood TotalNo. Medium Irrigation Control1 2 3 4 5 6 71 Andhra Pradesh 894.48 219 5.56 34.08 1153.122 Arunachal Pradesh 0.34 16.33 0.9 4.25 21.823 Assam 53.35 69.02 3.19 19.84 144 Bihar 530.68 51.04 11.87 78.34 671.935 Goa 17.18 8.39 2.42 1.77 29.766 Gujarat 1607.97 270.6 18.62 5.83 1903.067 Haryana 245 27.71 45.13 11.96 329.88 Himachal Pradesh 16.25 52.89 0.35 7.36 76.859 Jammu & Kashmir 18.79 24.54 3.57 12.5 59.410 Karnataka 1766.2 113.3 27.71 15.35 1922.5711 Kerala 140.8 44.61 8.81 30.43 224.6512 Madhya Pradesh 415.51 147.8 3.25 0.88 567.4513 Maharashtra 3460 379.6 50 1.92 3891.5614 Manipur 42.49 9.39 1.85 9.41 63.1415 Meghalaya 2 5.57 0.21 2.98 10.7616 Mizoram 0.05 9.97 0.05 0 10.0717 Nagaland 0 6.32 0.1 0.02 6.4418 Orissa 468.86 97.67 5.12 11.81 583.4619 Punjab 34.24 38.75 32.17 35.32 140.4820 Rajasthan 363.72 40.78 50.6 3.66 458.7621 Sikkim 0 5.9 0.02 1.64 7.5622 Tamil Nadu 373.78 43.74 0 0 417.5223 Tripura 7.96 16.35 0 7.38 31.6924 Uttar Pradesh 634.16 33.71 42.5 45.63 75625 West Bengal 139.94 96.27 4.23 116.2 356.63
Total States 11233.8 1829 318.2 458.6 13839.88Union Territories
26 A & N Island 0 2.26 0 0 2.2627 Chandigarh 0 0.25 0 0 0.2528 D & N Haveli 1 1.18 0.12 0 2.329 Daman & Diu 0.04 0.05 0.1 0.18 0.3730 Delhi 0 0.82 0 17.61 18.4331 Lakshadweep 0 0 0 3.57 3.5732 Pondicherry 0 6.29 0 6.8 13.09
Total U.Ts. 1.04 10.86 0.23 28.17 40.31Total States & Uts. 11234.8 1840 318.5 486.7 13880.19Central Sector 38.5 56.47 163.9 68.69 327.58Grand Total 11273.3 1897 482.4 555.4 14207.77

591
Annexure – 7.2.3
Actual Expenditure in respect of Major & Medium Irrigation,Minor Irrigation, CAD & Flood Control for the year 2000-01
(Rs. in crore)
Sl. Name of States & UTs Major & Minor CAD Flood TotalNo. Medium Irrigation Control1 2 3 4 5 6 71 Andhra Pradesh 938.12 241.3 12.1 88.32 12802 Arunachal Pradesh 0.34 24.88 0.9 4.05 30.173 Assam 50.48 77.57 19.16 3.41 150.64 Bihar 337.68 39.81 21.6 77.5 476.65 Goa 101.94 5.36 2.32 1.16 110.86 Gujarat 277.36 250.2 14.78 0 542.37 Haryana 207.4 29.73 66.77 8.61 312.58 Himachal Pradesh 14.89 45.62 1.36 7.9 69.779 Jammu & Kashmir 28.18 28.85 5.17 14.34 76.5410 Karnataka 1898.71 100.1 11.83 5.99 201711 Kerala 125 39 9.4 16.85 190.312 Madhya Pradesh 419.31 153.7 2.68 0.71 576.413 Maharashtra 4092.14 276.8 31.18 1.15 440114 Manipur 24.37 4.73 0.91 8.79 38.815 Meghalaya 2.49 7.2 0.09 2.59 12.3716 Mizoram 0.01 3.35 0.05 0 3.4117 Nagaland 0 8.1 0.08 0.03 8.2118 Orissa 420.84 79.56 6.2 3.97 510.619 Punjab 37.87 33.75 50.58 90.96 213.220 Rajasthan 264 46.27 42.82 2.79 355.921 Sikkim 0 7.3 0.02 1.21 8.5322 Tamil Nadu 221.06 134 16.61 0 371.723 Tripura 5.67 19.06 0 7.54 32.2724 Uttar Pradesh 742.08 59.3 28.77 31.11 861.325 Uttaranchal 13.19 5.59 0 3.52 22.326. West Bengal 146.78 121.9 8.05 212.11 488.9
UTotal States 10369.9 1843 353.4 594.61 13161Union Territories
27 A & N Island 0 2.33 0 0 2.3328 Chandigarh 0 0.2 0 029 D & N Haveli 0.52 0.57 0.05 0 1.1430 Daman & Diu 0.12 0.04 0 0.18 0.3431 Delhi 0 1.08 0 16.67 17.7532 Lakshadweep 0 0 0 3.2 3.233 Pondicherry 0 6.15 0 5.44 11.59
Total U.Ts. 0.64 10.37 0.05 25.49 36.55Total States & Uts. 10370.6 1853 353.5 620.1 13197Central Sector 39.71 77.71 145 106.01 368.4Grand Total 10410.3 1931 498.4 726.11 13566

592
Annexure – 7.2.4
Revised Approved Outlay in respect of Major & Medium Irrigation,Minor Irrgn., CAD & Flood Control for the year 2001-02
(Rs. in crore)
Sl. Name of States & UTs Major & Minor CAD Flood TotalNo. Medium Irrigation Control1 2 3 4 5 6 71 Andhra Pradesh 1004.88 215.03 14.24 1277.982 Arunachal Pradesh 0.36 46.79 1.95 3.68 52.783 Assam 55.83 83.44 2.41 18.96 160.644 Bihar 473.00 139.64 21 63.48 697.125 Goa 82.62 10.73 3.05 1.65 98.056 Chhatisgarh 240.97 2.69 1.02 0.17 244.857 Gujarat 1143.25 169.34 5.37 2.68 1320.648 Haryana 211.51 74 10 20 315.519 Himachal Pradesh 11.8 50.03 1.35 6.6 69.7810 Jammu & Kashmir 71.64 48.41 5.59 28.55 154.1911 Jharkhand12 Karnataka 2296.21 83.05 13.8 5.99 2399.0513 Kerala 95 25 10 12.5 142.5014 Madhya Pradesh 551.39 187.55 7.04 2.3 748.2815 Maharashtra 2335.21 262.05 22.91 0.73 2620.916 Manipur 46.95 5.3 2.98 2.7 57.9317 Meghalaya 2 9 0.1 2 13.1018 Mizoram 0.01 6.14 0.3 0 6.4519 Nagaland 0 8.4 0.05 0.1 8.5520 Orissa 473.84 84.1 6.5 0.6 565.0421 Punjab 323.13 42.26 14.07 95.36 474.8222 Rajasthan 275.81 83.01 35.15 4.78 398.7523 Sikkim 0 3.9 3.5 0.05 7.4524 Tamil Nadu 388.1 32.93 13.4 0 434.4325 Tripura 6.09 45 0.02 10.17 61.2826 Uttar Pradesh 730 45 28.48 23.47 826.9527 Uttaranchal 28 15.04 0.12 1.5 44.6628 West Bengal 138.07 107.75 7.81 308.63 562.26
Total States 10985.67 1885.58 232.21 660.48 13763.94Union Territories
29 A & N Island 0 2.8 0 0 2.830 Chandigarh 0 0.2 0 0 0.231 D & N Haveli 0.5 0.57 0.18 0 1.2532 Daman & Diu 0.1 0.05 0 0.22 0.3733 Delhi 0 0.68 0 24 24.6834 Lakshadweep 0 0 0 5 535 Pondicherry 0 8.86 0 4.07 12.93
Total U.Ts. 0.60 13.16 0.18 33.29 47.23Total States & Uts. 10986.27 1898.74 232.39 693.77 13811.17Central Sector 49.65 122.18 115.53 145.95 433.31Grand Total 11035.92 2020.92 347.92 839.72 14244.48

593
Annexure-7.2.5
Releases under RIDF to Irrigation Sector.
(Rs. Crore)
RIDF No. & Year Amount Amount Percentage of irrigationSanctioned disbursed w.r.t. all sectors
Sanctioned Disbursed
I (1995-96) 803.45 1658.9 90.17 82.94
II (1996-97) 1254.56 1110.54 50.18 44.2
III (1997-98) 1049.72 829.12 41.98 33.16
IV (1998-99) 900.37 418.79 30.01 13.95
V (1999-2000) 1103.18 487.07 31.51 13.91
VI (2000-2001) 1312.29 625.95 29.16 13.91
VII (2001-2002) 1353.5 300.58 27 6.01

594
Annexure –7.2.6
Statewise Position of Potential Creation
(Th. Ha.)
Sl. Name of States & UTs Ultimate Potential Potential Ultimate Potential PotentialNo. Irrgn. Pot. created till utilised Irrgn. Pot. created utilised
For Major end of till end of For Minor till end of till end of& Medium IX Plan* IX Plan Irrgn. IX Plan IX Plan
1 2 3 4 5 6 7 8
1 Andhra Pradesh 5000.00 3303.22 3051.59 6260.00 3019.46 2781.22
2 Arunachal Pradesh 0.00 0.00 0.00 168.00 98.52 77.40
3 Assam 970.00 243.92 174.37 1900.00 603.62 494.11
4 Bihar 5223.50 2680.00 1714.83 5663.50 4716.44 3759.46
5 Jharkhand 1276.50 354.47 230.45 1183.50 588.87 471.09
6 Goa 62.00 21.17 15.33 54.00 19.14 20.00
7 Gujarat 3000.00 1430.37 1300.83 3103.00 1998.92 1876.14
8 Haryana 3000.00 2099.49 1849.97 1512.00 1630.95 1578.12
9 Himachal Pradesh 50.00 13.35 7.51 303.00 161.00 138.30
10 Jammu & Kashmir 250.00 179.69 168.75 1108.00 382.45 366.77
11 Karnataka 2500.00 2121.12 1844.82 3474.00 1585.40 1541.74
12 Kerala 1000.00 609.49 558.87 1679.00 640.02 603.76
13 Madhya Pradesh 4853.07 1386.90 875.63 11361.00 2256.13 2149.48
14 Chattisgarh 1146.93 922.50 760.74 571.00 487.70 322.86
15 Maharashtra 4100.00 3239.00 2147.24 4852.00 2942.60 2557.72
16 Manipur 135.00 156.00 111.00 469.00 75.49 62.34
17 Meghalaya 20.00 — — 148.00 50.97 47.31
18 Mizoram 0.00 — — 70.00 16.69 14.08
19 Nagaland 10.00 0.00 0.00 75.00 76.56 65.63
20 Orissa 3600.00 1826.56 1794.17 5230.00 1474.12 1337.55
21 Punjab 3000.00 2542.48 2485.99 2967.00 3427.56 3367.82
22 Rajasthan 2750.00 2482.15 2313.87 2378.00 2447.10 2361.80
23 Sikkim 20.00 — — 50.00 29.67 23.61
24 Tamil Nadu 1500.00 1549.31 1549.29 4032.00 2123.38 2119.52
25 Tripura 100.00 4.90 4.50 181.00 109.65 96.09
26 Uttar Pradesh 12154.00 7910.09 6334.00 17481.00 21599.40 17279.62
27 Uttranchal 346.00 280.30 185.41 518.00 500.98 400.80
28 West Bengal 2300.00 1683.29 1527.12 4618.00 3792.52 3098.12
UTs 98.00 6.51 3.94 46.00 43.71 35.41
Total 58465.00 37076.28 31027.09 81428.00 56902.70 49047.01

595
7.3 TRANSPORT
7.3.1 RAILWAYS
INTRODUCTION
The Indian Railways is one of the largest railway systems in the world with a networkof about 63,000 route km. and is a principal mode of transportation for long haul bulkfreight movement, long distance passenger traffic and for mass rapid transit in sub-urbanareas. The Indian Railways has played a pivotal role in national integration and inpromoting trade and tourism. It has contributed very significantly to the industrial andeconomic development of the nation and has provided an essential link between productionand consumption centres of the economy. Now the major challenge before Railways is toadapt itself to a rapidly changing market environment to maintain its premier role in thetransport market.
Review of the Ninth Plan
2. For the Ninth Plan the total outlay of the Railways was projected at Rs. 45,413 crore.This was to be financed with a Gross Budgetary Support (GBS) of Rs. 11,791 crore andthe balance of Rs. 33,622 crore was to be met from the Market Borrowings and InternalResources. The GBS was expected to be only 26% of the total proposed outlay during theNinth Plan while Internal Resources and Market Borrowings were to constitute 74% of thetotal outlay. A review of financing of Railway Plan during the Ninth Plan period brings outthat the share of GBS has increased from 26% as envisaged earlier to 35%. For the lasttwo consecutive years i.e. 2000-01 and 2001-02 the dividend payable by the Railways tothe General Exchequer was deferred. Thus, financing of Railways continues to be an areaof concern. The pattern of financing during the 9th plan (1997-2002) and first year of the10th Plan (2002-03) is listed at Annexure 7.3.1.
3. While Indian Railways exceeded the targets for passenger traffic during the 9th plan(1997-2002), there is a shortfall to the extent of 36 million tonnes as regards freight trafficin the terminal year of the Ninth Plan (Table 7.3.1). The fall in freight traffic is due torecessionary trends in the economy. The 9th plan physical targets and achievements aregiven in Annexure 7.3.2. It may be seen from there that in case of new lines, gaugeconversion and track renewals the progress has been constrained by limitation ofresources. The lower level of doubling and procurement of rolling stock has been onaccount of lower materialization of freight traffic.
Sectoral Trends
4. During 2001-02 Railways carried 489 million tonnes of revenue earning originatingfreight traffic (RE) showing increase of about 3.3% over the actual freight carried of 473.5million tonnes during 2000-01. Freight tonne km. increased from 312.4 billion tonne km. in2000 –01 to 323 billion tonne Km. in 2001-02 (RE) showing an increase of about 4%. Incase of originating passenger traffic, the achievement of 5000.3 million in 2001-02 (RE)exceeded the achievement of 4839.8 million during 2000-01 revealing a growth of 3.3%over the past year. Passenger kms. also increased from 457.7 billion kms. in 2000-01 to473.4 billion kms. in 2001-02 (RE) showing an increase of 3.4%.

596
Targets for 2002-03
5. Keeping in view the objectives and thrust areas of the 10th Five Year Plan (Box) anoutlay of Rs.12330 crore comprising of Rs.5840 crore of gross budgetary support andRs.6490 crore of IEBR has been approved for the Railways during 2002-03. So far asphysical targets are concerned, a target of 510 million tonnes of revenue earning freighttraffic has been laid down as against the target of 489 million tonnes for 2001-02 (RE). Asregards passenger traffic also a higher target of 5187.8 million passengers has beenproposed for 2002-03 as against 5000.3 million passengers for 2001-02 (RE). Theprogress of freight and passenger traffic carried by the Railways over the years is given inAnnexures 7.3.3 and 7.3.4 respectively. For 2002-03 the outlays laid down for importantRailway Programmes like gauge conversion, track renewals, electrification and addition ofnew lines are Rs. 807 crore, Rs. 2703 crore, Rs. 238 crore and Rs. 911 crore respectively(Annexure 7.3.5) which will be utilized for 542 km. of gauge conversion, 4000 km. of trackrenewals, 375 km. of electrification and 214 km. of new lines construction. Besides, it isalso proposed to acquire 17,000 wagons (4 wheelers), 90 diesel locos, 69 electric locosand 1450 passenger coaches.
Table 7.3.1
Ninth Plan Growth in Freight and Passenger Traffic
Traffic Category Unit Ninth PlanTarget Achievement
Originating Freight Million Tonnes 525 489
Freight Net Tonne Kms. Billion 353 323
Originating Passengers Million 4782 5000
Passenger Kms. Billion 399 473
Thrust Areas in the 10th Plan – Railway Sector
Initiating measures for increasing freight traffic by the Railways
Rationalising tariff structure.
Augmenting capacity and improving the quality of service.
Upgrading technology such as improvement in tracks, increasing the speed of freightcars, modernizing signalling and communication system and increasing application ofinformation technology.
Prioritising Railway projects keeping in view the viability of these projects andcontribution towards augmenting the system.
Initiating steps to attract private sector investment in Railway projects.
Restructuring organization by setting up Rail Tariff Regulatory Authority, spinning off ofnon-core and peripheral activities.
Focusing on Railway safety.

597
Private Sector Participation
6. The private sector participation in various Railway projects has not been encouraging.The Railways had initiated Own Your Wagon Scheme (OYWS) and Build Own Lease andTransfer (BOLT) Scheme so as to mobilize private sector funds. However, the response ofthe private sector has been rather luke warm in most cases (OYWS) and negative in some(BOLT). The Railways are exploring various options for private/public participation in railprojects through different models. An SPV to undertake Surendernagar – Rajula city –Pipavav gauge conversion project has been formed with equity participation by the Ministryof Railways and its PSUs on the one hand and Gujarat Pipavav Port Ltd. (GPPL) andothers on 50:50 basis. The old BOLT scheme has been replaced by new BOT schemewhich envisages private participation by a consortium of construction contractors andfinanciers.
Zero Based Budgeting
7. This exercise has been carried out and all the 22 plan heads of railway budget havebeen retained. The main issue is the prioritisation of a large number of railway projectswhich needs to be carried out by the Railways.
Monitoring Mechanism
8. The Planning Commission has developed a monitoring mechanism to evaluate theprogress of the Plan schemes/projects. These are called Quarterly Performance Review(QPR), where the concerned Member, Planning Commission takes periodic meeting withofficials of the concerned Ministries to review the progress of programmes/schemes/projects in the Five Year Plan. The purpose is to identify shortcomings and take remedialsteps so that the Plan targets could be achieved.

598
Annexure7.3.1
Financing of Plan
(Rs. crore)
9th Plan 1997-98 1998-99 1999-00 2000-01 2001-02 1997-2002 10th Plan 2002-03(RE)
1 2 3 4 5 6 7 8 9
G.B.S. 11791 1992 2185 2588 3597 5641 16003 27600 5840
Market Borrowings 2795 3217 2919 2897 2753 14581 3000
33622 33000
Internal Resources 3452 3455 3550 2901 2463 15821 3490
Total 45413 8239 8857 9057 9395 10857 46405 60600 12330

599
Annexure7.3.2
9th Plan physical targets and achievements
Items Targets Expected Achievementduring 9th plan
New Lines 819 km. 702 km.
Gauge Conversion 3710 km. 1800 km.
Doubling 2500 km. 1142 km.
Track Renewals 13922 km. 12194 km.
Electrification Projects 2334 km. 2231 km.
Electric Locos 851 Nos. 705 Nos.
Diesel Locos 785 Nos. 646 Nos.
Coaches 10909 Nos. 10201 Nos.
Wagons 136000 FWUs 110315 FWUs

600
Annexure7.3.3
Freight Traffic Carried by Indian Railways
Year Originating Traffic Net Tonne Km.(in Million Tonnes) (in billions)
Rev. Non-Rev. Total Rev. Non-Rev. TotalEarning Earning Earning Earning
1 2 3 4 5 6 7
1991-92 338 22 360 250.2 6.7 256.9
1992-93 350 20.8 370.8 252.4 5.7 258.1
1993-94 358.7 18.8 377.5 252.4 4.7 257.1
1994-95 365 16.6 381.6 249.6 3.4 253
1995-96 390.6 14.3 405 271.1 2.6 273.7
1996-97 409 14.4 423.4 277.6 2.4 280
1997-98 429.4 16.1 445.5 284.3 2.5 286.8
1998-99 420.9 20.7 441.6 281.5 2.8 284.3
1999-2000 456.4 21.8 478.2 305.2 2.8 308.0
2000-2001 473.5 30.7 504.2 312.4 3.1 315.5
2001-02 (BE) 500 @ @ 326.8 @ @
2001-02(RE) 489.0 @ @ 323 @ @
2002-03(BE) 510.0 @ @ 334.2 @ @
@’ Not available

601
Annexure7.3.4
Passenger traffic carried by Indian Railways
Year No. of Passengers Passenger Km.(in Million) (in billions)
Suburban Non- Total Suburban Non- TotalSuburban Suburban
1 2 3 4 5 6 7
1991-92 2411.0 1637.1 4048.1 63.4 251.2 314.6
1992-93 2282.0 1467.0 3749.0 60.5 239.7 300.2
1993-94 2302.0 1406.0 3708.0 63.1 233.2 296.3
1994-95 2430.0 1485.0 3915.0 68.0 251.0 319.0
1995-96 2481.0 1557.0 4038.0 72.6 261.4 334.0
1996-97 2578.0 1575.0 4153.0 76.5 280.5 357.0
1997-98 2657.0 1691.0 4348.0 78.8 301.1 379.9
1998-99 2724.8 1743.7 4468.5 83.5 321.1 404.6
1999-2000 2836.4 1814.3 4650.7 85.8 345.6 431.4
2000-2001 2867.9 1971.9 4839.8 89.5 368.2 457.7
2001-02 (BE) 2963.4 1963.6 4927 90 390.6 480.6
2001-02(RE) 2935.7 2064.6 5000.3 85.9 387.5 473.4
2002-03(BE) 3012.8 2175 5187.8 88.1 410.3 498.4
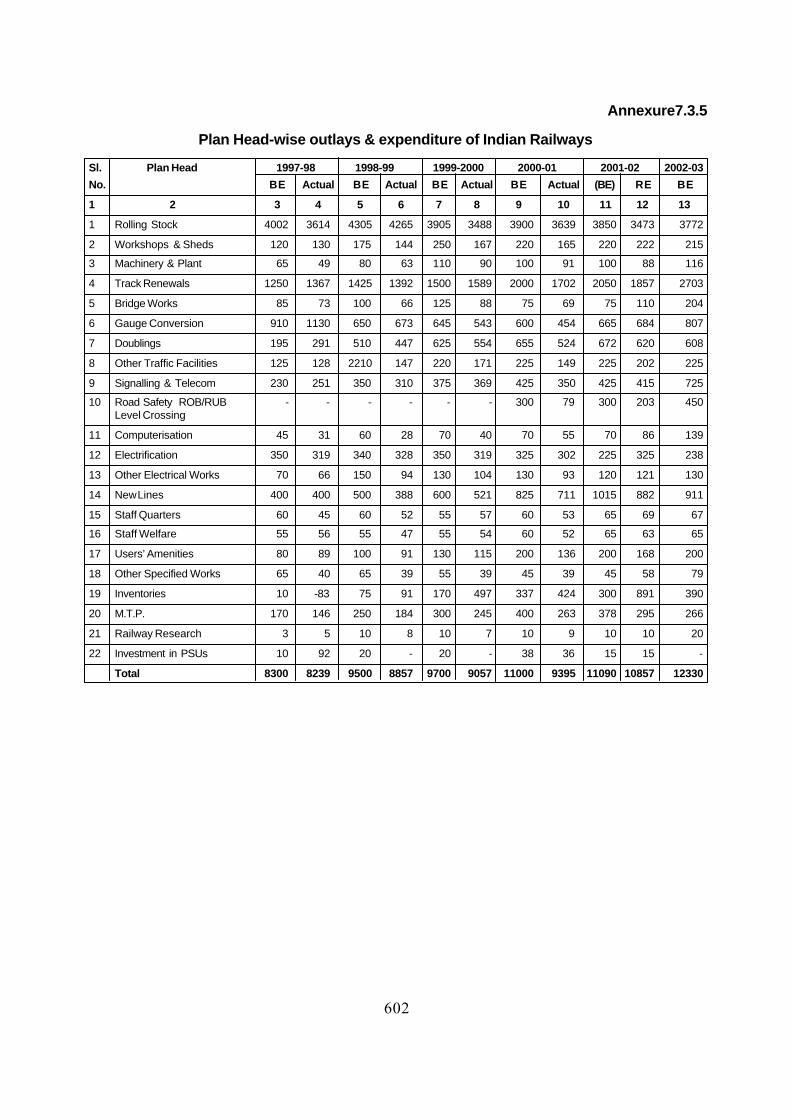
602
Annexure7.3.5
Plan Head-wise outlays & expenditure of Indian Railways
Sl. Plan Head 1997-98 1998-99 1999-2000 2000-01 2001-02 2002-03
No. BE Actual BE Actual BE Actual BE Actual (BE) RE BE
1 2 3 4 5 6 7 8 9 10 11 12 13
1 Rolling Stock 4002 3614 4305 4265 3905 3488 3900 3639 3850 3473 3772
2 Workshops & Sheds 120 130 175 144 250 167 220 165 220 222 215
3 Machinery & Plant 65 49 80 63 110 90 100 91 100 88 116
4 Track Renewals 1250 1367 1425 1392 1500 1589 2000 1702 2050 1857 2703
5 Bridge Works 85 73 100 66 125 88 75 69 75 110 204
6 Gauge Conversion 910 1130 650 673 645 543 600 454 665 684 807
7 Doublings 195 291 510 447 625 554 655 524 672 620 608
8 Other Traffic Facilities 125 128 2210 147 220 171 225 149 225 202 225
9 Signalling & Telecom 230 251 350 310 375 369 425 350 425 415 725
10 Road Safety ROB/RUB - - - - - - 300 79 300 203 450Level Crossing
11 Computerisation 45 31 60 28 70 40 70 55 70 86 139
12 Electrification 350 319 340 328 350 319 325 302 225 325 238
13 Other Electrical Works 70 66 150 94 130 104 130 93 120 121 130
14 New Lines 400 400 500 388 600 521 825 711 1015 882 911
15 Staff Quarters 60 45 60 52 55 57 60 53 65 69 67
16 Staff Welfare 55 56 55 47 55 54 60 52 65 63 65
17 Users’ Amenities 80 89 100 91 130 115 200 136 200 168 200
18 Other Specified Works 65 40 65 39 55 39 45 39 45 58 79
19 Inventories 10 -83 75 91 170 497 337 424 300 891 390
20 M.T.P. 170 146 250 184 300 245 400 263 378 295 266
21 Railway Research 3 5 10 8 10 7 10 9 10 10 20
22 Investment in PSUs 10 92 20 - 20 - 38 36 15 15 -
Total 8300 8239 9500 8857 9700 9057 11000 9395 11090 10857 12330

603
7.3.2 ROADS
Background
A good road network is the basic infrastructure input for socio-economic developmentof an emerging economy. It plays the key role in opening up backward and remote regionsto trade and investment and in promoting national integration. Roads, in addition, have animportant role in inter-modal transport development providing linkages to hubs like airports,railway stations and ports and also connect these centers with the hinterland providingdoor-to-door connectivity.
2. The present road policy in India has two basic tenets viz. accessibility and mobility.The accessibility objective is to be achieved through improved rural roads network.Pradhan Mantri Gram Sadak Yojana (PMGSY) has been launched for the purpose toprovide all-weather road connectivity in rural areas by the end of the Tenth Plan. Themobility is to be facilitated through strengthening high-density corridors. The NationalHighway Development Project is the main initiative in this regard and aims at 4/6-laning ofGolden Quadrilateral and North-South, East-West corridors. The maintenance of existingnetwork is simultaneously being emphasized so that the road assets already created do notwear out.
Review of the Ninth Plan
3. The physical progress of work on the National Highway system during the Ninth Plan(1997-2002) is given in Annexure 7.3.6. This includes Scheme-wise targets andachievements. It would be seen that the Scheme-wise achievements have, in general, beengood. In the case of widening to two lanes and strengthening weak two lanes, the targetshave been exceeded by a sizeable margin. This is mainly because of the availability ofadditional funds provided to the sector during the Plan period. Shortfalls have been inconstruction of bypasses and bridges. Scheme-wise Outlay and Expenditure in the NinthPlan is at Annexure 7.3.7.
Annual Plan 2002-03
4. The year 2002-03 is the first year of the Tenth Plan. During the year, steps are beingtaken to expand and strengthen road system through emphasis on rural connectivity andexpediting completion of Golden Quadrilateral work. In addition, strengthening NationalHighway network through removal of deficiencies like poor riding quality and consolidationof State Highway network are also a priority. Attention is also being accorded to themaintenance of road network so that the existing road assets do not deteriorate over time.
5. The Scheme-wise physical targets (non NHDP segments) for Annual Plan 2002-03 isat Annexure 7.3.6. It would be seen that the Target for widening to four lanes is 443 km.,widening to two lanes 633 km., and strengthening weak two lanes 755 km. The Annexurealso includes corresponding physical target for the Tenth Plan (2002-07) period. TheScheme-wise outlay for the Annual Plan 2002-03 and for the Tenth Plan (2002-07) is atAnnexure 7.3.7. An outlay of Rs.5870 crore has been provided for the development ofroads in the Central Sector in the Annual Plan 2002-03.

604
ANNUAL PLAN 2002-03 - THRUST AREAS
National Highways
6. With more than 58,000 kilometers of length, National Highways constitute the mostimportant component of the arterial transport network of the country. The Annual Plan2002-03 would continue its focus on the removal of deficiencies, namely, construction ofmissing links, improvement of low grade sections, rehabilitation and reconstruction of weakbridges, construction of bypasses, 4-laning and 2-laning of single lane stretches. Emphasiswill also be on improving the riding quality of the existing National Highways. Backwardand remote areas such as North Eastern region will continue to receive greater attentionduring the year.
National Highway Development Project
7. National Highway Development Project comprising Golden Quadrilateral (GQ) andNorth-South, East-West corridor (N-S, E-W) projects are being executed by the NationalHighway Authority of India (NHAI) and envisage four /six-laning of the existing network. GQwith a total length of 5,846 kms would connect Delhi, Mumbai, Chennai and Kolkata and istargeted for completion by the end of 2003. N-S, E-W Corridors would have a length of7,300 kms and would connect Kashmir to Kanyakumari and Silchar to Porbandar. Thetarget for completing N-S, E-W corridor projects is 2007.
8. There have been some slippages in the completion of GQ. The total length completedby 31st July 2002 was 1159 km. and under implementation was 4551 km. Contracts for alength of 136 km are still to be awarded. As regards N-S, E-W corridor projects, thecompleted segment is 773 km. (including a common stretch of 210 km with GQ). Another715 km is under implementation.
TENTH PLAN THRUST AREAS – ROAD SECTOR
Following would be the main areas of focus in the Tenth Plan
Improving riding quality and capacity of existing road network - National HighwayDevelopment project (NHDP) to be largely completed.
Riding quality of other National Highways is to be improved. However, the resourcerequirement for improving various deficiencies is immense – need therefore forprioritizing projects.
Emphasis on revamping road maintenance. The present system has weak accountabilityand poor monitoring. There is need to contract out maintenance to the private sector.The civil construction contracts could include a 5-year maintenance requirements.
Initiating preliminary work for constructing expressways for select high-density corridors.The role of the Government is to be restricted to that of a facilitator.
Create more conducive climate for associating private sector with road projects. MakingBOT Scheme more attractive -sharing downside traffic risk.

605
State Roads
9. In the State Roads Sector, the emphasis would be on consolidation of existing roadnetwork rather than expansion. This is necessary because existing State Highway networkis often in a bad shape because of poor maintenance. Funds have been a major constraintin this regard and associating private sector in upkeep and maintenance of roads thereforeneeds to be explored by the State Governments. There is also need to prepare long-termplans for development of State road network. This is necessary to address variousshortcomings in the network and to prioritize them according to the availability of resources.
Rural Roads
10. Rural connectivity is the key component of rural development in India. In order to givea boast to rural connectivity, a rural roads programme Pradhan Mantri Gram Sadak Yojana(PMGSY) has been launched. The primary objective of PMGSY is to provide connectivity,by way of all-weather roads, to the unconnected habitations in the rural areas, such thathabitations with a population of 1000 persons and above are covered in three years (2000-2003) and all unconnected habitations with a population of 500 persons and above by theend of the Tenth Plan Period (2007). In respect of the hill States (North-East, Sikkim,Himachal Pradesh, Jammu & Kashmir, Uttaranchal) and the desert areas, the objective isto connect habitations with a population of 250 persons and above. The Programme, as arelated objective, also aims to achieve an equitable development of the rural roads networkin different States/Districts so as to fully exploit the latent potential for rural growth. PMGSYis being implemented as a Centrally Sponsored Scheme.
11. As on 1.4.2000, 1.60 lakh habitations were to be covered under PMGSY. States thatare expected to achieve 100% connectivity for 1000+ habitation by 2002 are Tamil Nadu,Andhra Pradesh, Karnataka, Maharashtra, Gujarat, Goa, Punjab, Haryana, Meghalaya andManipur.
Road Maintenance
12. Maintenance of roads is emerging as a high priority area, especially because ofdeterioration in the network condition due to poor maintenance. Studies reveal that it is farmore expensive to develop new network than to maintain an existing one. The presentsystem of maintenance has weak accountability and poor monitoring. In order to raiseefficiency, there is need to contract out maintenance to the private sector. The activeprivate sector participation in road maintenance would also be an answer to the problem ofresources, which have been a major constraint in upkeep of roads.
13. Further, to emphasize the importance of maintenance, civil construction contracts,which account for bulk of the road sector contracts, could include a 5-year maintenancerequirement, beginning for which could be made with National Highway contracts. Aframework for long-term maintenance of roads also has to be included in the PMGSY, sothat rural assets created do not wear out over time.

606
Private Sector Participation
14. With a view to improve private investment in road sector, the concept of private sectorparticipation in the development, maintenance and operations of National Highwaysincluding expressways was approved in 1995. Since then, various measures have beentaken to facilitate the involvement of private sector in road construction activity. However,despite steps to facilitate participation, the response of private investors has not been veryencouraging and the participation of private sector has been restricted mainly toconstruction of by-passes and bridges. Efforts are therefore being made to make Build-Operative-Transfer (BOT) schemes more attractive. A useful suggestion in this regard issharing of downside traffic risk to instill more confidence among investors. The fact thatBOT (annuity) that involves contractual annuity payment has been a success and BOT hasfailed to receive encouraging response is a pointer to this fact.
15. States have also taken a number of initiatives to encourage private sectorparticipation. Notable among the States are Maharastra, Madhya Pradesh, Andhra Pradeshand Gujarat. Many others have also formulated private sector participation policy.
Externally Aided Projects
16. Details of externally aided National Highway projects (non-NHDP segments) fundedby different international donor agencies are shown in Annexure 7.3.8. There are, in alleleven projects. Ten of these have been completed. Particulars of these projects includingexpenditure are at Annexure 7.3.8.
Monitoring Mechanism
17. The Planning Commission has developed a monitoring mechanism to evaluate theprogress of the Plan schemes/projects. These are called Quarterly Performance Review(QPR), where the concerned Member, Planning Commission takes periodic meetings withofficials of the concerned Ministries to review the progress of programmes/schemes/projects in the Five Year Plans. The purpose is to identify shortcomings and take remedialsteps so that the Plan targets could be achieved. These are in addition to the regularmonitoring of the progress of NHDP.
18. Another important initiative is Zero Based Budgeting exercise. The purpose is toreview the Plan Schemes to make them more consistent with the Plan targets. A number ofRoad Sector Schemes have been merged and weeded out to make them more targetoriented.

607
Annexure 7.3.6
Physical Targets/Achievements – Roads & Bridges
Sr. Scheme Unit Ninth Plan Achievements 10th Plan Annual PlanNo. Target Ninth Plan (2002-2007) (2002-03)
(1997-2002) (1997-2002) Targets Targets
1 2 3 4 5 6 7
1. Widening to four lanes Kms. 944 797 800 443
2. Widening to two lanes Kms. 1791 1955 4000 633
3. Strengthening weak 2 lanes Kms. 3042 3511 2000 755
(10,000)
IRQP
4. Bypasses No. 59 30 25 17
5. Major bridges No. 633 442 100 202
6. Major Bridges includingROBs

608
Annexure 7.3.7
CENTRAL ROAL SECTOR OUTLAY /EXPENDITURE
S. Schemes Ninth Plan 1997-2002 Tenth Plan Annual PlanNo. Outlay Expenditure Outlay (2002-07) (2002-03)
1 2 3 4 5 6
1 Externally Aided projects 3607.16 4178.22 13990.50 2158.00
2 Other schemes N.H.(O) 3983.43 4786.12 8664.00 1440.00
3 Works under BRDB 468.00 524.80 950.00 145.00
4 Travel Expenses (Domestic) 0.59 1.00
5 Other Charges 0.20 20.00 1.00
6 Development of Information 4.15 20.00 4.00Technology
7. E&I for States from CRF}109.00 71.38 500.00
95.008. E&I for UTs from CRF} 5.00
9 Development of Planning 0.30 - * *
10 Strategic Roads under Roads 17.49 13.53 1.00Wing
11. Strategic Roads under BRDB 28.60 30.9850.00
8.50
12 SBA Roads 0.64 0.64 * *
13 Special Repair Programme 501.49 * *
14 R&D Planning Studies 28.64 14.41 20.00 3.00
16 Training 5.35 0.89 10.50 1.50
17 Machinery & Equipment 25.00 25.37 15.00 2.00
18 NHAI (Investment) 551.00 5483.00 10500.00 2000.00
19 Charged Expenditure 37.41 34.45 50.00 5.00
Total 8862.02 15670.22 34790.00 5870.00
* Weeded out

609
Annexure 7.3.8
Financing of Externally Aided Roads/Bridge Projects
(Rs.Crore)
No. Schemes Likely Likely Total Balance Budgetcost of date of Expenditure Amount Alloca
Completion Completion upto as on Completion31.3.2002 12.4.2002 2002-03
1 4-laning between Karnal & 371.99 Completed 369.99 2.0 2.00Ambala Km. 132.67-212.16 NH-1in Haryana
2 4-laning between Sirhind and 241.74 -do- 241.74 0.0 2.00Punjab/Haryana Km. 212.16-252.55NH-1 in Punjab
3 4-laning of Cuttack-Bhubaneswar 275.13 -do- 268.13 7.0 7.00Section of NH-5 (Km.0.0 to 27.8)in Orissa
4 4-laning of Indoare-Dewas Section of 264.85 -do- 243.70 21.15 10.00
NH-3 (Km.573 to 590.6) includingconstruction of Indore bypass(32.6 Kms.) in Madhya Pradesh
5 4-laning between Bassein Creek and 307.00 -do- 300.06 6.94 5.00Manor Km. 439 to 497 (NH-2 inMaharashtra
6 4-laning between Raniganj and West 141.09 -do- 140.00 1.09 2.50Bengal/Bihar border Km.438 to 474.0of NH-2 in West Bengal
7 4-laning of Mathura-Agra Section of 154.30 -do- 142.94 11.36 10.00NH-2 in Uttar Pradesh
8 4-laning of NH-47 from Km.8 to Km. 71.15 -do- 68.43 2.72 0.1033.0 in Karnataka
9 4-laning of NH-47 between Alwaye- 145.04 -do- 141.20 3.84 0.10Sherthalai in Kerala
10 4-laning of NH-8 between Achrol- 106.23 -do- 104.52 1.71 0.10Kotputli in Rajasthan
11 West Bengal Corridor Development 1085.70 June,2006 - 1085.70 122.82Project

610
Road Transport
The Road Transport is the dominant mode of transport for moving goods andpassenger traffic in the country. The sector has grown significantly during the last fiftyyears with the number of vehicles registered a compounded growth rate of 12.61 per centduring this period. Being the sole mechanized means of surface transport for hilly, rural andbackward terrain not connected by railways, its share of passenger and freight traffic hasalso increased vis-a-vis railways.
Review of 9 th Five Year Plan (1997-02)
2. Against an approved outlay of Rs.60 crore under Central Sector for the 9th Five YearPlan, the expenditure is likely to be Rs.43.34 crore (72.2%). The shortfall in theachievement is reported to be due to non-receipt of adequate proposals. Under Statesector, an outlay of Rs.7355.26 crore had been approved for the 9th Five Year Plan.Against this, Rs.5894.30 crore (80%) is likely to be spent as shown in Annexure 7.3.9.
3. The physical performance of the State Road Transport Undertakings has beensatisfactory. The fleet utilization, vehicle productivity, staff productivity, fuel efficiency etc.have improved considerably. However, despite improvement in physical performance, theState Road Transport Undertakings continued to incur financial losses. The net loss in the9th Five Year Plan was Rs.8731 crore. The main reasons for such losses were increasein the input cost, operation of services on uneconomic routes, free and concessional travel,high motor vehicles tax and uneconomic fare structure.
TENTH PLAN THRUST AREAS - ROAD TRANSPORT SECTOR
The focus of the 10th Plan would be on the following:
Efforts to encourage public transport services. Private sector participation to be promotedthrough decontrol and removal of restrictive practices. The role of Government to berestricted to regulating transport services with an aim to providing efficient and safeservices to the public.
Measures to reduce accidents and fatalities on roads.
Measures to encourage higher capacity and better technology vehicles, so that the changesin road transport could keep pace with revolution in the road sector.
Projections for the 10th Five Year plan (2002-07)
4. An amount of Rs.210 crore has been allocated for Road Sector in the 10th Five YearPlan (2002-07). The major schemes proposed to be taken up are National Highwaypatrolling scheme, publicity measures on road safety, pollution controls from motor vehiclesand training programmes. Under the State sector, improving operation of State RoadTransport Undertakings would be the major scheme.

611
Annual Plan 2002-03
5. An outlay of Rs. 30.00 crore has been allocated for the Annual Plan 2002-03 for theroad transport sector for four schemes; viz., (i) National Data Network & ComputerSystem, (ii) Road Safety, (iii) Pollution Control, and (iv) Model Training Institute on Drivingand Research.
Private Sector participation
6. Involvement of the private sector in providing passenger transport services has easedthe pressure on the SRTUs. However, there is need for further decontrol in the roadtransport service sector. The private sector could also be encouraged to operate serviceson unprofitable routes through tax incentives. The long term objective should be the pre-eminent role of private sector in providing all passenger public transport services. There ishowever need to check rash driving, overtaking, unscheduled operations and tax evasion.
Zero Based Budgeting
7. During zero based budgeting exercise conducted by the Planning Commission inconsultation with the Ministry of Road Transport & Highways two road transport sectorschemes have been weeded out and 14 others have been merged into three schemes.One scheme – Model Training Institute of Driving and Research has been converted intocentrally sponsored scheme.
Monitoring mechanism
8. For the review and monitoring of physical as well as financial progress of projects/schemes, a system of Quarterly Progress Review (QPR) meetings has been started.

612
Ann
exur
e 7.
3.9
Ou
tlay
& E
xpen
ditu
re -
Ro
ad T
ran
spo
rt
Sch
eme
9th
pla
n
199
7-98
1998
-99
199
9-20
00
2
000-
01
2
001-
02
Exp
.O
utl
ayO
utl
ayE
xp.
Ou
tlay
Exp
.O
utl
ayE
xp.
Ou
tlay
Exp
.O
utl
ayE
xp.
9th
Pla
n
12
34
56
78
910
1112
13
1.
Ca
pita
l con
trib
utio
n to
8.63
5.63
5.63
3.00
1.52
1.00
0.00
0.00
0.00
0.00
0.00
7.15
SR
TC
s
2.
Rro
ad S
afet
y37
.42
2.57
1.89
8.40
4.40
5.66
4.95
9.45
7.95
10.1
211
.52
30.7
1P
rogr
amm
es
Roa
d S
afet
y C
ell
0.75
0.12
0.10
0.20
0.09
0.15
0.15
0.20
0.17
0.22
0.19
0.70
Pub
licity
mea
sure
s8.
671.
000.
792.
501.
681.
001.
003.
002.
703.
003.
129.
29
Gra
nn
t in
aid
3.00
0.20
0.20
1.00
0.08
0.50
0.40
0.50
0.49
0.50
0.49
1.66
Pol
lutio
n te
stin
g6.
000.
500.
301.
500.
641.
000.
500.
751.
001.
250.
202.
64eq
uipm
ent
Ro
ad
Sa
fety
eq
uip
me
nt
4.00
0.25
0.02
0.70
0.00
0.01
0.15
4.00
0.65
0.15
1.14
1.96
Na
tion
al H
igh
wa
ys/
15.0
00.
500.
502.
501.
913.
002.
751.
002.
935.
006.
3714
.46
Pat
rolli
ng s
chem
e
3.
Tra
inin
g &
Com
pute
r4.
450.
260.
502.
100.
260.
680.
640.
750.
970.
570.
342.
71
Nat
iona
l ins
titut
e2.
000.
000.
401.
500.
000.
330.
300.
400.
400
0.04
1.14
of r
oa
d s
afe
ty
Tra
inin
g o
f dri
vers
in0.
750.
150
0.25
0.08
0.15
0.15
0.30
0.32
0.3
0.22
0.77
unor
gani
zed
sect
or
Tra
inin
g p
rog
ram
me
0.50
0.01
00.
150.
050.
050.
040.
050.
050.
050.
050.
19(H
RD
)
Com
pute
r sys
tem
1.20
0.10
0.10
0.20
0.13
0.15
0.15
0.20
0.20
0.22
0.03
0.61
4.
Res
earc
h &
1.15
0.20
0.10
0.20
0.00
0.15
0.00
0.10
00
00.
10D
evel
opm
nent
5.
Str
en
gth
en
ing
of
4.65
0.20
01.
000.
401.
001.
000.
200
00
1.40
CIR
T, P
une
6.
Mis
c. in
clud
ing
Stu
dies
3.70
0.36
0.33
1.30
0.24
0.51
0.35
0.65
0.16
0.80
0.19
1.27
Tra
nspo
rt s
tudi
es1.
500.
200.
200.
500.
070.
250.
190.
100.
000.
400.
060.
52
Dat
a co
llect
ion
0.50
0.05
0.05
0.10
0.06
0.10
0.05
0.20
0.03
0.10
0.04
0.23

613
Na
tion
al d
ata
ba
se0.
950.
000.
000.
500.
000.
010.
000.
100.
000.
100.
010.
01ne
twor
k
Co
ntr
ol o
f po
llutio
n o
f0.
750.
100.
080.
200.
110.
150.
110.
150.
130.
200.
080.
51m
oto
r ve
hic
le
Ene
rgy
Con
serv
atio
n0
0.01
00.
000.
000
0.00
0.10
0.00
00
0.00
TO
TA
L60
.00
9.22
8.45
16.0
06.
829.
006.
9411
.35
9.08
11.4
912
.05
43.3
4
STA
TE P
LAN
7355
.26
1227
.10
1442
.32
1229
.64
968.
3812
26.3
793
4.96
1265
.30
1274
.32
1200
.00
1274
.32
5894
.30
GR
AN
D T
OTA
L74
15.2
612
36.3
214
50.7
712
45.6
497
5.20
1235
.37
941.
9012
76.6
512
83.4
1211
.49
1286
.37
5937
.64
GR
AN
D T
OTA
L74
15.2
612
36.3
214
50.7
712
45.6
497
5.20
1235
.37
941.
9012
76.6
512
83.4
1211
.49
1286
.37
5937
.64
Sch
eme
9th
pla
n
199
7-98
1998
-99
199
9-20
00
2
000-
01
2
001-
02
Exp
.O
utl
ayO
utl
ayE
xp.
Ou
tlay
Exp
.O
utl
ayE
xp.
Ou
tlay
Exp
.O
utl
ayE
xp.
9th
Pla
n
12
34
56
78
910
1112
13

614
7.3.3 PORTS
Twelve major ports along the coastline of India handle about 75% of the port traffic ofthe country and remaining 25% is handled by minor / state ports.
Review of Ninth Plan
2. Against the outlay of Rs. 9428 crore, an amount of Rs. 4838.92 crore was spent.The main reasons for shortfall included – delays in sanctioning the schemes, slow progressof work by contractors, contractual disputes / litigation, delays in tender finalisation andweeding out of some schemes.
3. The traffic handled by major ports increased from 227.26 million tonne (MT) as on31st March, 1997 to 291.10 MT as on 31st March, 2002 against the target of 429 MTincluding throughput by minor ports. Traffic handled by minor ports increased from 37.83MT at the end of Eighth Plan to 71.10 MT by the end of Ninth Plan. The growth of trafficat major ports and minor ports was 4.9% and 27.9% respectively. Thus, the share of minorports in the total traffic went up during Ninth Plan. The capacity of major ports at the endof Ninth Plan was 343.95 MT showing an increase of 124.85 MT during the plan period.
4. Port productivity, in terms of average output per ship berth day output, average pre-berthing waiting time and average turn round time has registered an improvement duringthe Ninth Plan. Average pre berthing waiting time came down from 1.7 days in 1996-97 to0.50 days in 2000-01. Average turn around time improved from 7.5 days in 1996-97 to 4.7days in 2000-01. Output per ship berth day increased from 4497 tonnes in 1996-97 to6469 tonnes in 2000-01. The labour productivity increased from 307 tonnes in 1997-98 to413 tonnes in 2000-01 in terms of output per gang shift.
Annual Plan 2002-03
5. Annual Plan 2002-03 being the first year of the Tenth Five Year Plan, has beenformulated keeping in view the objectives and thrust areas of Tenth Five Year Plan
Thrust Areas of Tenth Five Year Plan
l Encourage private sector participation
l Affect organisational changes – corporatisation for management efficiency,institutional funding and attracting private investment.
l Establish major gateway ports and provision of inter modal linkages through efficientrail and road services.
l Rationalise manning scales.
l Make tariff authority for major ports (TAMP) an Appellate body and extend itsjurisdiction on all ports

615
Financial Allocations
6. During Annual Plan 2002-03, an outlay of Rs. 1162.00 crore has been approved forthe port sector. This includes Rs. 256.89 crore as budgetary support and Rs. 905.11 croreas Internal and Extra Budgetary Resources (IEBR).
PHYSICAL TARGETS
Cargo Traffic Target
7. The traffic at major ports is projected to increase from 291.10 MT as on 31st March,2002 to 295.84 MT as on 31s t March, 2003. The target for Tenth Plan is 415 MT.Commodity-wise break-up of traffic targets for 2002-03 in major ports is as follows:
Commodity-wise break-up of traffic targets for 10th Plan and Annual Plan 2002-03
(In Million Tonne)
Commodity 10th Plan Annual Plan 2002-03
POL 154.30 104.280
Iron Ore 52.50 46.00
Fertilizer} 13.45 3.675
FRM dry} 6.885
Thermal Coal} 71.30 31.100
Coking Coal } 15.130
Containerised Cargo 61.10 40.710
Other Cargo 62.35 48.38
Total 415.00 295.84
Capacity Creation
8. The capacity of major ports as on 31st March, 2002 was 343.95 MTPA. Consideringthe present status of capacity yielding projects in the major ports, capacity addition of 18.60MT is expected to be achieved during 2002-03. Thus the capacity of major ports as on 31s t
March, 2003 is expected to be about 362.55 MT against the target of 470.15 MT as on 31s t
March, 2007. Port-wise details are given in Annexure7.3.10. A number of projects areexpected to be completed in 2002-03. A list of such projects is given in Annexure 7.3.11.
Private Sector Participation
9. The Ninth Plan envisaged private sector/captive users investment of Rs. 8,000 crorewith capacity addition to the tune of 76 mt. Seventeen private sector/captive port projectsof 60.05 mt capacity with an investment of Rs. 3,480.20 crore have already been approvedand they are at different stages of construction.

616
10. Nine more private sector/captive user port projects with 32.86 mt plus 9 lakh twentyequivalent units (TEUs) and an investment of Rs. 3,608.20 crore are in the pipeline.
11. During the Tenth Plan, an ambitious investment plan for private sector participationwill be initiated. In addition to Plan allocations for major ports, investment to the tune ofRs. 11,256.00 crore will be made by the private sector.
Introduction of Zero Based Budgeting
12. Another important initiative is Zero Based Budgeting exercise. The purpose is toreview the Plan schemes to make them more consistent with the Plan targets. A numberof Ports Sector schemes have been merged and weeded out to make them more targetoriented.
Monitoring mechanism
13. The Planning Commission has developed a monitoring mechanism to evaluate theprogress of the Plan schemes / projects. These are called Quarterly Performance Review(QPR), where the concerned Member, Planning Commission takes periodic meetings withofficials of the concerned Ministries to review the progress of programmes / schemes /projects in the Five Year Plans. The purpose is to identify shortcomings and take remedialsteps so that the Plan targets could be achieved.

617
Annexure 7.3.10
Projections of Capacity Addition by Major Portsduring Tenth Plan and Annual Plan 2002-03
(In Million Tonne)
Sl. Name of Port Capacity as Projected capacity Projected capacityNo. on 31-3-02 as on 31.3.2003 addition as on 31.3.07
1 2 3 4 5
1 Kolkata Port 9.80 09.80 —-
2 Haldia Port 32.40 32.40 2.00
3 Paradeep Port 32.10 38.10 0.60
4 Vizag Port 41.15 41.15 10.50
5 Chennai 38.75 40.95 4.20
6 Ennore 12.00 12.00 13.00
7 Tuticorin Port 13.95 14.95 3.35
8 Cochin Port 15.50 15.50 13.50
9 New Mangalore Port 21.30 29.50 12.00
10 Mormugao Port 20.50 20.50 7.00
11 Mumbai Port 38.50 38.50 11.50
12 JN Port 28.00 29.20 14.00
13 Kandla Port 40.00 40.00 19.55
Grand Total 343.95 362.55 111.20
## + 15.00
* 126.20
## From improvement in productivity at various ports* Total capacity as on 31.3.2007 will be 470.15 MT (343.95 + 126.20

618
Annexure 7.3.11
Details of Capacity Yielding Projects expectedto be completed by 31.3.2003 – Major Ports
Sr. Name of the Project Capacity (in MTPA)No.
1. Construction of Oil Berth at Paradip 6.00
2. Further extension of Container Terminal at Chennai Port 0.50
3. Modernisation of West Quay Berth at Chennai Port 1.00
4. Modernization of South Quay 3 and East Quay Berths at
Chennai Port 0.70
5. Dredging on front of Berth No. 8 at Tuticorin Port 1.00
6. Port facilities for MRPL expansion at New Mangalore Port
(balance capacity) 5.20
7. Construction of Multi-user Oil Berth at New Mangalore Port 3.00
8. Construction of shallow water berth at JN Port 1.20
Total 18.60

619
7.3.4 SHIPPING
In India, with a coastline of 5560 km. studded with 12 major and 184 minor / intermediateports, shipping sector assumes special significance. Over 90% of India’s oversea trade interms of volume and 68% in terms of value is sea born. Share of Indian flag ships in theoversea trade of the country has been hovering around 30% during the last few years.
Review of Ninth Plan
Against the outlay of Rs. 5005.45 crore the expenditure was only Rs. 2475.02 crore. Itcomes to about 48.40% of the approved outlay against the target of 9 million GrossTonnage (GT) for Ninth Plan, the achievement as on 31 st March, 2002 was only 6.91million GT which was at the level of Eighth Plan. A slow progress in tonnage acquisitionwas mainly due to – i) lack of fiscal incentives to remain internationally competitive, ii)difficulty in raising external commercial borrowings, iii) prevailing market condition isdepressed and charter/freight rates have fallen considerably, especially in the dry-bulk andliner sector, iv) considerable changes in the trade pattern, which had compelled the SCI toabandon many of its projects.
Annual Plan 2002-03
2. Annual Plan 2002-03 being the first year of the Tenth Five Year Plan, has beenformulated keeping in view the objectives and thrust areas of Tenth Five Year Plan.
Thrust Areas of Tenth Five Year Plan
l Adoption of tonnage tax regime to ensure level playing field for Indian Shipping.
l Continuation of the present policy of cargo support and its extension to LNG.
l Laying down less stringent construction, survey, loadlines and safety requirements forcoastal vessels.
l Revise manning scales for coastal vessels
Financial allocations
3. During Annual Plan 2002-03, an outlay of Rs. 1342.26 crore has been provided forthe shipping sector. Of it, Rs. 10.01 crore will be provided as budgetary support to DirectorGeneral (Shipping) and Rs. 1332.25 crore is expected to be raised through IEBR byShipping Corporation of India (SCI).
Physical targets
4. The Tenth Plan target of fleet acquisition is 7.71 MT. In 2002-03 SCI propose toacquire the following ships:
2 Capsize Bulk Carrier1 Afframax Tanker2 VLCCs

620
2 Aframax Tanker (Second Hand)2 LR-I Product Carriers
Director General (Shipping)
5. During Annual Plan 2002-03 the allocated amount of Rs. 10.01 crore is proposed tobe spent on training and welfare scheme for benefit of seamen, e-Governance project forDG (Shipping) headquarters and allied offices including Mercantile and MarineDepartments, Shipping offices, etc and construction of buildings by CPWD and otheragencies.
Director General (Light Houses and Light Ships)
6. Department of Light Houses and Light Ships is a revenue earning Department andderives its income from light dues and light charges from ships entering and leaving Indianports. During Ninth Plan, the anticipated revenue earning was Rs. 408 crore. Against theNinth Plan outlay of Rs. 123 crore, the expenditure in this sector was about Rs. 62 crore.
7. During Tenth Plan and Annual Plan 2002-03, an outlay of Rs. 185.00 crore and Rs.20.00 crore respectively has been provided as budgetary support. Emphasis will be laid onautomation of existing light houses, improvement in visual aids, replacement of existinglight house tenders, improvement of training facilities and establishment of a CoastalVessel Traffic Service (CVTS).
Introduction of Zero Based Budgeting
8. Another important initiative is Zero Based Budgeting exercise. The purpose is toreview the Plan schemes to make them more consistent with the Plan targets. A number ofShipping Sector schemes have been merged and weeded out to make them more targetoriented.
Monitoring mechanism
9. The Planning Commission has developed a monitoring mechanism to evaluate theprogress of the Plan schemes / projects. These are called Quarterly Performance Review(QPR), where the concerned Member, Planning Commission takes periodic meetings withofficials of the concerned Ministries to review the progress of programmes / schemes /projects in the Five Year Plans. The purpose is to identify shortcomings and take remedialsteps so that the Plan targets could be achieved.
7.3.5 INLAND WATER TRANSPORT (IWT)
IWT being an energy efficient, environmentally clean and economical mode oftransport could play an important role in passenger and cargo movement, establishing inter-modal connectivity. India is richly endowed with waterways comprising river systems andcanals. It is estimated that a total of 14,544 kms of waterways could be used for passengerand cargo movement. However, capacity of the sector is grossly under utilised as mostnavigable waterways suffer from hazards like shallow water and narrow width of channel

621
during dry weather, silting or river bed and erosion of banks, absence of adequateinfrastructural facilities like terminals for loading and berthing and surface road links.
Review of Ninth Plan
2. Against the outlay of Rs. 408 crore, an amount of Rs. 201.56 crore could be spent onthe provision / maintenance of fairway terminals and navigational aids on the three NationalWaterways, assistance to the States under Centrally Sponsored Schemes, loan interestsubsidy for acquisition of inland vessels, acquisition of capital dredging vessels andmodernization of handling facilities.
Annual Plan 2002-03
3. Annual Plan 2002-03 being the first year of the Tenth Five Year Plan, has beenformulated keeping in view the objectives and thrust areas of Tenth Five Year Plan.
Thrust Areas of Tenth Five Year Plan
l Emphasis would be on the development of infrastructure facilities.
l Encourage Private sector participation in IWT
l Focus on North East Region for development of IWT.
Financial allocations
4. During Annual Plan 2002-03, an outlay of Rs. 80 crore has been provided for IWTincluding a sum of Rs. 20 crore for National Waterway 2. The expenditure will be incurredmainly on the provision / maintenance of fairway, terminal and navigational aids on thethree National Waterways, techno-economic feasibility studies on several other waterwayssystems, assistance to States under Centrally Sponsored Schemes (CSS) and to meet thepast liabilities of Loan Interest Subsidy Scheme (LISS) for acquisition of inland vessels.
Physical targets
5. The physical targets fixed for traffic movement by IWT during the year 2002-03 are2,03,100 MT.
Private Sector Participation
6. In the Inland Water Transport Policy, a number of incentives for encouraging privatesector participation have been provided in the Tenth Plan and Annual Plan 2002-03. Theprivate sector would be involved in the whole range of inland water activities through jointventures, BOT projects etc.
Introduction of Zero Based Budgeting
7. Another important initiative is Zero Based Budgeting exercise. The purpose is toreview the Plan schemes to make them more consistent with the Plan targets. A number ofIWT Sector schemes have been merged and weeded out to make them more targetoriented.

622
Monitoring mechanism
8. The Planning Commission has developed a monitoring mechanism to evaluate theprogress of the Plan schemes / projects. These are called Quarterly Performance Review(QPR), where the concerned Member, Planning Commission takes periodic meetings withofficials of the concerned Ministries to review the progress of programmes / schemes /projects in the Five Year Plans. The purpose is to identify shortcomings and take remedialsteps so that the Plan targets could be achieved.
7.3.6 CIVIL AVIATION
INTRODUCTION AND OVERVIEW
Civil aviation is the fastest mode of transport for movement of passenger and cargo traffic.At present there are 94 civil airports including 11 international airports and 28 civil enclavesat Defence Air Fields. The sector is broadly divided into 3 distinct functional entities vizregulatory cum development, operational and infrastructure. The regulatory functions arethe responsibility of Directorate General of Civil Aviation (DGCA) and Bureau of CivilAviation Security (BCAS). The operational functions are performed by Air India Ltd., IndianAirlines Ltd., Alliance Air Ltd., Pawan Hans Helicopter Ltd. under public sector and otherprivate airlines operators. The infrastructural facilities are provided by Airport Authority ofIndia (AAI).
Review of the Ninth Plan
2. During the 9th Plan, under Central Sector likely expenditure was Rs. 6599.51 crore(59.4%) against the approved outlay of Rs.11112.37 crores. The utilisation of GrossBudgetary Support was 37.1% (Rs.183.77 crore). The details are at Annexure 7.3.12. Thelower utilization of outlay is because of the decision of the Government to disinvest equityin Indian Airlines, Air India and restructure metro airports through private sectorparticipation and lower utilization by BCAS. Physical performance organization-wise hasbeen discussed in the ensuing paragraphs.
3. The Civil Aviation sector in India has undergone some significant development/transformation during the 9th Five Year Plan period such as - a) the Governmentconsiderably disengaged itself from commercial operations of airlines; b) the Governmentencouraged increase in the role of private sector in the civil aviation sector in order tobridge the resource gap as well as bring greater efficiency in the management; c) theprocess of disinvestment of Air India and Indian Airlines was initiated, d) the decision to re-structure existing airports at Delhi, Mumbai, Chennai and Kolkata.
Objectives and Thrust Areas during 10th Five Year Plan
4. The main objective of the development of the civil aviation sector in the 10th Five YearPlan is to provide world class infrastructure facilities and efficient, safe and reliable airservices to meet the requirements of domestic and foreign trade and tourism. Theobjectives of the plan would be pursued in the subsequent Annual Plans including 2002-03.The details of the projections during the 10th are given at Annexure 7.3.13 and Annexure7.3.14.

623
Physical Targets/Financial Allocations during the Annual Plan 2002-03
5. An outlay of Rs.2521.19 crore has been approved during Annual Plan 2002-03, whichincludes Rs.69 crores as budgetary support. The Organisaiton-wise details are at Annexure7.3.15.
DISINVESTMENT OF AIR INDIA AND INDIAN AIRLINES
Air India
6. Air India (AI) provides international air services. The Government of India is in theprocess of disinvestment of its stakes in Air India. 40% of its equity is proposed to be givento the strategic partner of which 26% would be held by foreign investor/airline. Thestrategic partner is expected to bring management expertise, finance and support theaircraft acquisition process. However, due to September 11, 2001 incident the process ofdisinvestment is likely to be delayed.
Indian Airlines Ltd.
7. Indian Airlines (IA) along with its wholly owned subsidiary Alliance Air India Ltd.,primarily provides domestic air services in the country. Indian Airlines, however, alsoprovides international air services to some of the neighbouring countries.
8. Like AI, Government has decided to disinvest 51% equity of IA within the parametersof “Domestic Air Transport Policy” of which 26% equity could be given to a group or anindividual who may be called joint venture/strategic partner. The remaining 25% would beoffered to employees, financial institutions and the public. The disinvestment process isbeing undertaken by the Ministry of Disinvestment.
Tenth Plan Thrust Areas: Civil Aviation
The objectives of development of the civil aviation sector is to provide world classinfrastructure facilities and efficient, safe and reliable air services.
Disinvesting Government equity in Indian Airlines and Air India.
Restructuring of the metro airports through private sector participation.
Providing a suitable regulatory framework for the air services.
Ensuring adequate security arrangements in view of the increased threat perception.
Consider increasing the share of foreign equity in both domestic and internationalcarries with a view to attracting new technology and management expertise.
Re-consider bar on equity participation by foreign airlines in companies formed fordomestic air transportation.
Review Route Dispersal guidelines to streamline provision of air services in remote andisolated areas

624
9. The physical as well as financial performance of AI & IA are at Annexure 7.3.16,7.3.17 & 7.3.18.
Airport Authority of India
10. The Airport Authority of India (AAI) is responsible for management and developmentof 94 civil airports including 11 international airports and 28 civil enclaves at Defence AirFields. It is also responsible for providing navigational facilities to the aircraft operating inIndia. The profitability of AAI is given at Annexure 7.3.18.
11. The approved Annual Plan outlay during 2002-03 is Rs.996.05 crores which includesa provision of Rs.53.12 crores towards budgetary support. The provisions earmarked forInternational Airports Division (IAD) is Rs. 286.45 crores and that for National AirportsDivision (NAD) is Rs.709.60 crores. The break-up of Rs. 709.60 crores for NAD is asfollows:
Scheme-wise Approved Annual Plan Outlay During 2002-03
(Rs. Crores)
S. Schemes Approved outlayNo.
1. Aerodrome works 352.98
2. Aeronautical Communication Services 248.60
3. Ground Safety Services 101.75
4. Modernization of Air Traffic Services (MATS-BD) 3.00
5. Modernization of CATC, Allahabad 3.27
Total 709.60(53.12)
Note: Figure in bracket indicates Budgetary Support from Government of India.
12. During the Tenth Five Year Plan, the emphasis would be on up-gradation, expansionof airport infrastructure and strengthening of the security arrangements at the airports.These would be followed in the subsequent Annual Plans including 2002-03.
Others
13. Pawan Hans Helicopter Ltd. (PHHL) was incorporated on 15 t h October, 1985 toprovide helicopter support services to the public sector undertakings like ONGC andoperate helicopter services in inaccessible areas. An outlay of Rs.133.80 crore has beenapproved during 2002-03 mainly for acquisition of new fleet.
14. Bureau of Civil Aviation Security (BCAS) is responsible for ensuring adequate securityarrangement at the airports. During the Annual Plan 2002-03, an amount of Rs.7.69 croreshas been approved. Out of this, Rs. 5 crores has been allocated for setting up of CivilAviation Security Academy.
625
15. Directorate General of Civil Aviation (DGCA) is responsible for ensuring quality andsafety in aircraft operations in the country. An outlay of Rs. 3.10 crore has been approvedduring 2002-03. The thrust will be on purchase of machinery and equipment for training tostrengthen the capacity of Directorate to carry out its regulatory function.
16. Indira Gandhi Rashtriya Uran Academy (IGRUA) is the premier flying institute of thecountry responsible for imparting flying training for award of commercial pilots license andcommercial helicopter pilots license. During Annual Plan 2002-03, an outlay of Rs. 2.09crores has been approved.
17. Hotel Corporation of India (HCI) is a subsidiary of Air India. During Annual Plan 2002-03 an amount of Rs. 8.76 crores has been approved. The Board of Directors of Air Indiahas approved the disinvestment proposal in principle. The process of disinvestment isbeing undertaken by the Ministry of Disinvestment. In case of Centeur Hotel, Delhi, CabinetCommittee on Disinvestment has directed for re-bidding by exploring ways and means tosecure better response.
Private Sector Participation
18. The services and facilities available at Indian International Airports are not up to themark. The Government of India, therefore, has decided to restructure the four metroairports of the AAI. The restructuring process will facilitate participation of the private sectorin the development of metro airports.
19. The new Bangalore International Greenfield airport at Devanahalli, near Bangalore ispromoted by the Government of Karnataka (GoK). The selected bidder who would becomeequity contributors to the extent of 74% is a consortium lead by Siemens, Germany withthe other partners being Unique Zurich, Switzerland and Larsen & Toubro Ltd., India. In theproject GoK along with AAI will together hold 26% equity with AAI’s equity being capped atRs.50 crore. The shareholders agreement of the project company (BIAL) was signed on the23rd January 2002. The estimated project cost is Rs.1150 crore. The financial close isexpected sometime in September 2002.
Progress of Externally Aided Projects:
20. The development of Aurangabad Airport has been taken up in phases with financialassistance of JBIC, Japan. As per agreement with JBIC, Japan, 82% of the expenditureincurred by Airports Authority of India is to be reimbursed to Airports Authority of India byJBIC. The total expenditure on the work done in Phase-I is Rs.15.13 crore. The works ofPhase-I of the project, inter alia, extension of runway to 7500 ft have already beencompleted. It has also proposed to include some of the Phase-II works like strengthening ofexisting runway ( Rs. 4.82 crore, work already completed), Construction of New DomesticTerminal Building(Rs.18.00 crore) and New Apron and other facilities (Rs. 09.34 crore) inPhase-I.
Zero Based Budgeting
21. Exercise of Zero-Based Budgeting : Convergence and Weeding out of the CentralSector Schemes relating to Civil Aviation Sector have been carried out as per the

626
guidelines. It was decided that out of 13 schemes, 3 schemes to be weeded out, 2schemes to merged into one, 2 more schemes to be merged into one with modificationsand to retain 6 schemes as such. The details are at Annexure 7.3.19.
Monitoring Mechanism
22. Through the system of Quarterly Performance Review, mechanism has been evolvedto monitor central sector schemes including civil aviation.

627
Annexure 7.3.12
Outlay and Expenditure - Ninth Plan- Civil Aviation(Rs. Crore)
Sl. Organisation Ninth Plan 1997-98 1998-99 1999-2000 2000-01 2001-02 9th plan Anti. Exp.
No. Appr. Outlay Act. Act. Act. Act. Anti. Exp. Amount % age
1 2 3 4 5 6 7 8 9 10
1 AI 3664.00 517.75 550.01 383.09 641.60 345.46 2437.91 66.5
Of Which BS 0.00
2 IA 3640.75 441.90 522.03 492.27 421.26 431.80 2309.26 63.4
Of Which BS 125.00 0.00
3 AAI
I) NAD 1899.35 220.53 210.37 201.02 237.15 191.60 1060.67 55.8
ii) IAD 1522.52 118.05 109.50 159.61 111.53 93.17 591.86 38.9
Total 3421.87 338.58 319.87 360.63 348.68 284.77 1652.53 48.3
Of Which BS 283.37 10.00 25.00 25.00 25.20 40.25 125.45 44.3
4 PHHL 209.20 26.85 5.55 1.21 2.31 32.90 68.82 32.9
5 HCI 89.55 8.52 10.19 13.37 17.34 23.25 72.67 81.2
6 BCAS 25.00 0.01 2.35 1.37 2.57 1.25 7.55 30.2
Of Which BS 25.00 0.01 2.35 1.37 2.57 1.25 7.55 30.2
7 DGCA 27.00 1.07 3.38 3.47 4.36 4.60 16.88 62.5
Of Which BS 27.00 1.07 3.38 3.47 4.36 4.60 16.88 62.5
8 IGRUA 35.00 10.00 11.00 6.00 5.89 1.00 33.89 96.8
Of Which BS 35.00 10.00 11.00 6.00 5.89 1.00 33.89 96.8
Total 11112.37 1344.68 1424.38 1261.41 1444.01 1125.03 6599.51 59.4
Of Which BS 495.37 21.08 41.73 35.84 38.02 47.10 183.77 37.1

628
Annexure 7.3.13
Airports Authority Of IndiaCapacity, Demand And Augmentation For Passenger Terminals At Major Airports
During Ninth Plan And Projection For Tenth Plan Period (2002-07)
(Annual in million)
Airports Ninth Plan Targets (1997-02) Ninth Plan Achievements Tenth PlanCapacity Demand Capacity Demand Capacity Projected(2001-02) (2001-02) (2000-01) planned in demand
2006-07 2006-07
1 2 3 4 5 6 7
Mumbai
International Terminal 7.50 6.22 7.50 5.18 8.50 6.55
Domestic Terminal 6.45 10.39 6.45 7.00 7.60 9.93
Delhi
International Terminal 3.40 5.18 3.40 3.95 9.90 5.60
Domestic Terminal 7.20 7.04 7.20 4.98 7.20 7.03
Chennai
International Terminal 1.80 2.20 1.55 1.83 2.12 2.91
Domestic Terminal 2.67 3.01 3.30 2.23 3.30 3.17
Kolkota
International Terminal 1.65 0.86 0.82 0.63 1.08 0.85
Domestic Terminal 3.70 3.23 3.70 2.06 3.70 2.60
Trivandrum
International Terminal 0.42 1.22 0.42 0.76 0.42 0.91
Domestic Terminal 0.80 0.42 0.80 0.25 0.80 0.32
TOTAL 35.59 39.77 35.14 28.87 44.62 39.87

629
Annexure 7.3.14
Airports Authority Of IndiaCapacity, Demand And Augmentation For International Cargo Terminals
At Major Airports During Ninth Plan And Projection For Tenth Plan Period (2002-07)
(Annual in ‘000 Tonnes)
Airports Ninth Plan Targets (1997-02) Ninth Plan Achievements Tenth PlanCapacity Demand Capacity Demand Capacity Projected(2001-02) (2001-02) (2000-01) planned in demand
2006-07 2006-07
1 2 3 4 5 6 7
Mumbai 219.80 352.82 296.03 211.01 296.03 313.13
Delhi 219.50 272.90 219.50 173.60 268.50 260.53
Chennai 93.44 101.16 59.53 82.03 93.44 130.17
Kolkota 28.00 34.98 28.00 25.07 41.09 39.78
Total 560.74 761.86 603.06 491.71 699.06 743.61

630
Annexure 7.3.15
Organization- Wise Break-up of the Annual Plan (2002-03)Approved Outlay - Ministry of Civil Aviation
S. Organisation Approved Budgetary IEBRNo. Outlay Support
1 2 3 4 5
1. Air India 858.70 1.00 * 857.70
2. Indian Airlines 510.00 1.00 * 509.00
3. AAI 996.05 53.12@ 942.93
4. PHHL 133.80 - 133.80
5. Hotel Corp. of India 8.76 - 8.76
6. Indira Gandhi Rashtriya Uran Akademi 2.09 2.09 -
7. (a) Directorate General of Civil Aviation 3.10 3.10 -
7. (b) Aero Club of India 1.00 1.00 -
8. Bureau of Civil Aviation Security 7.69 7.69 # -
Total 2521.19 69.00 2452.19
* Token provision towards equity contribution linked to aircraft acquisition for which appropriateapproval will be sought.
@ As per details as under :-
i) For investment in NE Region & Sikkim Rs. 15.64 croresii) For investment in other crucial areas like
J&K, Leh and Lakshadweep Rs. 15.98 croresiii) Development of Amritsar Airport Rs. 21.50 crores
Total Rs. 53.12 crores
# Incudes a token provision of Rs. 1.00 crore for new schemes for which appropriate approvalswill be sought.

631
Annexure 7.3.16
Indian Airlines
Physical Performance
S. Particulars 1997-98 1998-99 1999-2000 2000-01 2001-02 2002-03No (RE) (BE)
1 2 3 4 5 6 7 8
1 Available Tonne Kms. 1094.1 1122.92 1120.9 1153.68 1148.0 1186.0(Million)
2 Revenue Tonne Kms. 700.9 709.1 740.3 777.34 754.0 783.0(Million)
3 Available Passenger Kms. 10408 10803 10911 11185 11278 11724(Million)
4 Revenue Passenger Kms. 7015.5 6846.8 6982.5 7307.0 7218.0 7562.0(Million)
5 Overall Load Factors (%) 64.1 63.1 66.0 66.4 65.7 66.0
6 Seat Factor (%) 67.4 63.4 64.0 65.3 64.0 64.5
7 Aircraft Utilisation per aircraft per annum on Total Hours
(a) A-300 2727 2528 2274 2400 2468 2500
(b) A-320 2770 2834 2954 3048 3062 3100
8 Aircraft Fleet
(a) A-300 10 11 11 9 8 5
(b) A-320 30 30 30 30 36 36
(c) A-737 12 12 12 11 11 11
Total 52 53 53 50 55 52
All B-737 aircraft have been transferred to M/s Airlines Allied Services Ltd

632
Annexure 7.3.17
Air India
Physical Performance
Particulars 1997-98 1998-99 1999-00 2000-01 2001-02 2002-03(Actual) (Actual) (Actual) (Actual) (RE) (BE)
1 2 3 4 5 6 7
Available Tonne Kms. (Million) 2293.7 2394.3 2238.3 2226.9 2436.8 2350.8
Revenue Tonne Kms. (Million) 1453.8 1473.6 1456.5 1501.4 1617.8 1529.3
Overall Load Factor (%) 63.4 61.5 65.1 67.4 66.4 65.1
Available Seat Kms. (Million) 16933.3 17496.6 16485.8 16478.0 17825.1 17202.1
Revenue Passengers Kms. (Million) 11422.4 11709.0 11587.0 12047.7 13012.3 12418.1
Passenger Load Factor (%) 67.5 66.9 70.3 73.1 73.0 72.2
Aircraft Utilisation Per annum 2717.0 3092.0 2913 3270 3168 3164(hours/per annum)

633
Annexure 7.3.18
Financial Performance of Indian Airlines, Air India and AAI
(Rs. Crore)
S. Particulars 1997-98 1998-99 1999-2000 2000-01 2001-02 2002-03No. (RE) (BE)
1 2 3 4 5 6 7 8
Indian Airlines Limited
1 Operating Revenue 3243 3424 3549 3793 3849 4528
2 Operating Expenses 2985 3129 3349 3879 4074 4515
3 Operating Profit/Loss 259 294 200 -85 -225 13
4 Total Rev. 3268 3446 3566 3854 3952 4534
5 Total Exp. 3221 3431 3514 4013 4202 4633
6 Profit/(Loss) 47.27 14.17 51.42 -159.17 -250.65 -98.9
Before Tax
7 Provision for Tax 1.05 6.15
8 Net Profit/Loss 47.27 13.12 45.27 -159.17 -250.65 -98.9
After Tax
AIR INDIA LIMITED
1 Operating Revenue 3837 4135 4448 4873 4751 4833
2 Operating Expenses 4030 4140 4372 4870 4806 4960
3 Operating Profit/Loss -192.63 -4.58 76.05 3.1 -54.53 -127
4 Total Rev. 4174 4237 4717 5224 5033 5146
5 Total Exp. 4355 4411 4755 5269 5016 5122
6 Profit/(Loss) -181 -174 -38 -44 17 25
Before Tax
7 Provision for Tax 1.28
8 Net Profit/(Loss) -181.01 -174.48 -37.63 -44.4 15.44 24.5
After Tax
AIRPORTS AUTHORITY OF INDIA
1 Revenue 1280 1591 1691 1873 2245 2303
2 Expenses 963 1255 1347 1514 1768 1891
3 Net 316.19 335.78 344.73 359.08 476.98 412.5
Profit/(Loss)
Before Tax
4 Provision for Tax 120.05 127.37 133.35 145 210 147.26
5 Net Profit/(Loss) 196.14 208.41 211.38 214.08 266.98 265.24After Tax

634
Annexure 7.3.19
Summary of Outcome of Central Schemes underM/o Civil Aviation - Zero Based Budgeting
S. Name of the Scheme Decision of the PlanningNo. Commission1 2 3
1. Establishment Exp. On plan posts in DGCA Weeded out
2. Establishment Exp. Of Directorate of R&D Weeded out
3. Exp. on salary of plan posts in Controller ofAeronautical Inspection Weeded out
4. European Union India Training Project Retained
5. Grants-in-aid to IGRUA Retained
6. Capital equity for AAI Merged with modifications *7. Loan for AAI
8. Contribution to International Civil Aviation Organization Retained.
9. Capital Exp. for R&D(DGCA)Merged into one.10. Capital exp. on Mech. & Equip. in training and Edu.
(DGCA)
11 Capital exp. Of BCAS Retained as such
12. Investment in Air IndiaRetained **
13. Investment in Indian Airlines
* The budgetary support would only be available to the projects in the North Eastern region andprojects for which decision is taken by the Govt..
** The schemes may be retained with the token provision in the Tenth Plan. The position canbe reviewed at the time of finalization of Annual Plan 2003-04.

635
7.4 COMMUNICATION INFORMATION
7.4 (I) POSTAL SECTOR
1. Indian Postal system is the largest in the world in terms of number of post offices/outlets (numbering 154919 as on 31.3.2001). Out of these, 26037 are permanent postoffices. The remaining 128882 i.e. about 83% of the total post offices outlets in the countryare in the rural areas. These are called Extra Departmental Branch Offices (EDBOs). Thetotal manpower engaged in running postal services under the Department is about 6 lakhequally divided between permanent employees (294301) and extra departmental (309649).Total revenue expenditure of the Department is Rs. 5210.83 crore (2001-02) with a revenuedeficit of Rs.1458.37 crore. Plan outlay constitutes a very small fraction of the totalexpenditure and was Rs.135 crore for 2001-02 i.e. 2.59% of the revenue expenditure. Theentire plan outlay of the postal sector is funded through budgetary support.
2. Postal services duly supported by a technology-based network are an importantcomponent of the modern and efficient information and communication system. Therevolution in the information technology has vast potential for the development of postalsector both in terms of coverage of area as well as quality of services. It may alsocontribute in a big way in minimizing the deficit by reducing operational costs andincreasing revenue generation.
TENTH FIVE YEAR PLAN
Major Objectives
3. The Tenth Plan aims at making the postal services self-financing by the Tenth Planend. To achieve this, necessary policy measures shall have to be initiated. Upgradationof technology and modernization of postal operations is envisaged to be continued as athrust area. The major objectives envisaged for the Postal sector for the Tenth Plan are :
l Provision of universal postal services at affordable prices.
l Ensuring quality of services at international level.
l Modernisation and process re-engineering with a view to achieve better administrativeefficiency and financial management.
l Upgradation of existing infrastructure with a view to ensure minimization of cost ofoperation and enhancing customer satisfaction.
l Making the postal operations of the Department self-financing by the end of TenthPlan.
Thrust Areas / Policy Initiatives
4. To achieve these objectives, a comprehensive reforms programme has to beimplemented during Tenth Plan. Connectivity, networking and computerization wouldcontribute the core thrust area of the Plan. Post offices are envisaged to be given a freshlook by converting these into multi-product and multi-service outlets. Information
636
Technology is envisaged to play a major role in transforming and modernizing the sector byimproving efficiency and quality of services and introduction of a whole spectrum of ITbased products and services. The strategy and major policy initiatives envisaged for thePlan are :
l Identification and adoption of Universal Postal Service Obligation and delivering the same ataffordable prices.
l Pricing of non-UPSO items to be determined on commercial basis.
l Setting up of an independent regulatory body which beside other things would look after thefunction of tariff fixation.
l Fresh post offices to be opened only through redeployment of staff; no additional posts to becreated for this purpose.
l A comprehensive review of all existing post offices to be carried out in a time bound manner.
l Post offices to act as multi-product / multi-service centers and convergence of services to bethe governing criterion.
l Computerization, connectivity and networking of the Postal network to be the cornerstone ofPlan activity.
l Indian Post Office Act, 1898 to be replaced by a forward looking Act to take care of the needsof competition, convergence and other new developments.
Review of Annual Plan 2001-02
5. The two new initiatives undertaken during the Annual Plan (2001-02) were thelaunching of pilot projects for provision of new services of E-post and E-Bill post. TheDeptt. successfully implemented the pilot project on E-post at more than 200 post officesin the five States of Andhra Pradesh, Kerala, Gujarat, Maharasthra and Goa. The objectiveof the project is to provide delivery of hard copy of e-mail messages received over theInternet through designated post offices and also enable the post office customers to sendan e-post e-mail. The service has the potential to bridge the digital divide in the country.
6. Under the second initiative, a pilot project on e-bill post was commissioned inBangalore and Kolkata during 2001-02. The service involves payment of bills in respect ofvarious service providers through post offices. It may include utilities / organizations likeelectricity authorities, telephone companies, municipal bodies etc. Under the pilot project, apublic sector telecom service provider i.e. Bharat Sanchar Nigam Ltd. (BSNL) was involvedin Bangalore and another private sector telecom company i.e. Spice Telecom was involvedin Kolkata. The results of this project have been encouraging and the service is envisagedto be expanded to other areas.
7. The performance in respect of the core programme of modernization and technologyupgradation has been very encouraging. All the major targets have been fully achieved.Under the programme of expansion of postal network, the performance in respect ofachieving the targets has been a mixed one. While 51 DSOs have been opened againstthe target of 50, the performance in respect of rural post offices has been less

637
encouraging. Against the target of opening 2500 outlets / offices under the schemes ofEDBOs and PSSKs, the actual achievement was 2447. The details of physical targetsand achievements may be seen in Annexure-7.4.I.
8. For the Annual Plan (2001 – 02), an outlay of Rs.135 crore was approved. The actualexpenditure is estimated to be much lower at Rs.99.05 crore, i.e. a utilization of 73.37% ofthe approved outlay. The low utilization is basically due to reduced allocations at the REstage. The details of scheme-wise utilization regarding the approved outlay and itsutilization during Annual Plan(2001-02) may be seen in Annexure-7.4.2.
ANNUAL PLAN 2002-03
Thrust Areas / Major Programmes
9. A comprehensive programme of reforms is envisaged for the Tenth Plan. During theAnnual Plan 2002-03, the Deptt. is expected to initiate necessary action towards putting inplace the various inputs required for implementing the reforms programme. Keeping in linewith the policy and objectives for the Tenth Plan, modernization of postal operationsincluding networking and computerization would be accorded the highest priority in theprogrammes for the Annual Plan (2002-03).For implementing the various programmesduring 2002-03, an outlay of Rs.150 crore has been approved. The core area ofmodernization would account for Rs.101.36 crore i.e. 68% of total outlay. The schematicbreak-up may be seen in Annexure-7.4.2. Some of the thrust areas / programmes of theDeptt. of Posts during the Annual Plan (2002-03) are given below :
Networking and Connectivity
10. The various scheme proposed under this programme are for creating the basicinfrastructure for improving the quality of existing services and providing the technologicalbase for launch of new value added and financial services. Networking of various postoffices, record offices, back offices, customer care centers, etc. forms an integral part ofthe entire programme. IT based services are an important part of the product-mixenvisaged to be delivered by the post offices during the Plan. In the absence of thistechnological back up, the introduction of new services proposed may not be feasible. Newservices are to be launched with a view to securing more revenue from operations in orderto achieve the goal of financial self-sufficiency.
Mail Processing
11. Modernization of operations including the ergonomics of work environment holds thekey to better productivity.Mail processing is the central activity in the entire set up of postaloperations and its modernisation is very crucial for both improving efficiency of the staffand speedy delivery of postal services. Modernization of mail motor services and RMSvans and mechanized delivery are the important activities under this scheme. It is targetedto improve ergonomics in 200 offices providing infrastructural equipment at 1818 rural postoffices and modernizing 100 speed post centres. The setting up of the two AutomaticIntegrated Mail Processing Systems which could not be completed in the Ninth Five YearPlan would continue as a Plan scheme during the Tenth Plan.

638
Human Resource Development & Training
12. Manpower development, perhaps, is the crucial input in the entire process ofmodernization underway in the sector. Changing the mindset for accepting and usingtechnology and imparting appropriate skills at all levels are two important elements ofstrategy of human resource development during Tenth Plan. In-service training andrefresher courses need to be re-oriented keeping in view the changing requirements. Acomprehensive training programme in computers etc. have been drawn out and is to beimplemented to ensure maximum possible returns on investment being made oncomputerization and modernization. Distant learning have been introduced from the currentyear so as to get maximum spread of skill upgrading of the willing staff. Towards this end,a target of training about 69,000 employees has been envisaged. Distant learning would bethe single largest trainer ( 53,000 ) during the Plan period. Necessary beginning would bemade during 2002-03.
New Schemes
13. It is envisaged to take up a number of new schemes to implement the programmesenvisaged for the Tenth Plan. The schemes identified include :
l Modernisation of Circle Stamp Depots;
l Computerisation of International Mail Processing;
l National Data Centre;
l Establishment of Express parcel post centres;
l Research and Development /studies/surveys;
l e-Post;
l e-BillPost;
l New Products and Services including Development of Financial Products andServices.
14. The scheme of E-post, taken up on pilot basis during 2001-02, is envisaged to beextended to all the district headquarters in the country during 2002–03. The products /services envisaged under the scheme of “New Products and Services” includedistribution of social security benefits; distribution of Mutual Funds & securities; ElectronicFund Transfer (EFT); Smart Cards, Debit Cards; Electronic Banking; E-commercetransactions etc. The Deptt. would explore possibilities of providing the various servicesthrough joint ventures in collaboration with the private sector.
Monitorable Targets(2002-03)
15. Keeping in line with the goals, objectives and policy initiatives for the Tenth Plan, themajor targets envisaged for the Annual Plan (2002-03) are given below. The details ofphysical targets envisaged for the Annual Plan may be seen in Annexure-7.4.2.

639
l Opening of 25 Departmental Sub-Offices (DSOs) and 250 Extra Departmental Branch Offices;
l Opening of 1500 Panchayat Sanchar Sewa Kendras (PSSKs);
l Computerization of 150 major post offices in the country in addition to computerization of 10Head Record Offices;
l Upgradatinon of 62 Customer Care Centres;
l Networking of 15 transit Mail Offices;
l Setting up of National Data Centre for country-wise connectivity;
l Improving ergonomics of 200 post offices including mail offices;
l Provision of Infrastructure Equipment to 1818 rural post offices.
Major Policy Issues
16. The postal deficit is an open-ended subsidy from the General budget. The deficit hasbeen persistently increasing over the years. This is an explosive situation which cannot besustained for a long period except at a very high cost to the nation in the shape of retardeddevelopment due to reduced flow of funds to the more needy sectors like infrastructureand social development. Keeping this in view the Tenth Plan aims to make the Deptt. self-financing by Plan end through a series of reforms and policy initiatives. To ensure that thisgoal is achieved in a time bound manner the progress of reforms needs to be monitoredvery tightly. An appropriate monitoring mechanism would have to be put in place at theearliest.
7.4 (II) TELECOMMUNICATIONS
1. Telecommunications is one of the prime movers of modern economies. It is one of thefastest growing sectors of the Indian economy and has immense potential of growth in thefuture. Starting with about one lakh lines at the time of Independence (March, 1948), theIndian telecom network has increased to about 450.26 lakh lines including Cellularconnections by the end of March,2002. Of the 6.04 lakh villages in the country about4.68 lakh villages have been covered ( as on 31st March,2002 ). In spite of rapid expansionof the network during the last decade, there is large unmet demand for telecom services.Giving India’s large size and population the present density of 4.1 persons per hundred isquite low viewed in the context of world average of 32.78 and that of developingcountries viz. 49.86 in Malaysia, 38.52 in Brazil and 24.98 in China.
2. The Telecom sector in India has been witnessing a continuous process of reformssince 1991. A major milestone in this area was the announcement of new policy calledNew Telecom Policy (NTP) 1999 replacing the 1994 policy to take care of the developmentarising out the rapid technological changes like convergence of technologies, liberalizationand opening of the economy. This process of reform was carried further since thenthrough a number of new policy initiatives undertaken by the Government. The majoramong these include:

640
l Resolution of subsisting problems arising out of migration of existing licences from fixedlicence regime to revenue sharing.
l Permitting ISPs to set up sub-marine cable landing stations for international gateways forInternet.
l Opening of National Long Distance Service for competition in August 2000.
l Corporatization of Deptt. of Telecom into public limited company called Bharat SancharNigam Ltd. (BSNL) from 1.10.2000.
l Opening of International Long Distance Service for competition from 1.4.2002.
3. As a result of record growth of telecom services during the Ninth Plan, the telecomnetwork in the country has grown to 450.26 lakh lines. The status of the network, as on31.03.2002, is given below :
l Total number of telephone exchanges - 35023
l Number of rural exchanges – 26953
l Total Fixed Telephone connections – 385.95 lakh
l Number of Cellular mobile phones – 64.31 lakh
l Trunk Auto Exchange Lines (TAX) – 34.27 lakh
l Tele Density - All India - 4.4
l Number of Village Public Telephones – 4.68 lakh
l Internet Connections – 38 lakh(as on January 31, 2002).
TENTH FIVE YEAR PLAN
Major Objectives and Targets
4. The Tenth plan policies and programmes are guided by the basic goal of creating aworld-class telecom infrastructure in order to meet the requirements of informationtechnology based sector and needs of a modernizing economy on the least cost basis.Ensuring value for money to the consumers and easy and affordable access to basictelecom services to everyone and everywhere would be the other goal of policies to bepursued in 10th Plan. The major objectives envisaged for the Tenth Plan are:
l Affordable and effective communication facilities to all citizens.
l Provision of universal service to all uncovered areas, including rural areas.
l Building a modern and efficient telecommunications infrastructure to meet the convergenceof telecom, IT and the media.
l Transformation of the telecommunications sector to a greater competitive environmentproviding equal opportunities and level playing field for all the players.

641
l Strengthening research and development efforts in the country.
l Achieving efficiency and transparency in spectrum management,
l Protecting the defence and security interests of the country.
l Enabling Indian telecom companies to become truly global players.
5. Following complete opening of the sector, private sector is expected to play a majorrole in achieving the objectives along with the public sector. Semi-urban, rural and otheruncovered areas are expected to provide bulk of the fresh demand for primary telecomservices i.e fixed and cellular mobiles in the near future. Private sector need to deviseappropriate strategy to meet demand in these areas as they are perceived as lessremunerative. The major targets envisaged for the Tenth Plan for the telecom sector are:
l To endeavour to make available telephones by and large on demand by end of 2002-03 andsustain it thereafter.
l To achieve an overall teledensity of 9.91 by 31st March 2007.
l Achieve telecom coverage of all villages in the country by December 2002 and providereliable transmission media in all rural areas.
l Provide reliable media to all exchanges by the end of March, 2003.
l Provide high-speed data and multimedia capability using technologies including ISDN to alltowns with a population greater than two lakhs by the end of March, 2003.
Review of Annual Plan 2001-02
6. Automation of the process of radio frequency (RF) spectrum management includingFrequency Assignments, Wireless Licenses etc. and Upgrading the Radio MonitoringFacilities is essential to meet the massive growth in the usage of RF Spectrum in thecountry. RF Spectrum being a scarce natural resource its effective and efficient use bymassive computerization is a necessity keeping in view the requirements of moderntelecommunication technologies that heavily depend upon the RF spectrum. Keeping theimportance of this area in mind, a project called “ Telecommunications sector ReformTechnical Assistance Project” has been taken up with the assistance of World Bank. Thetotal outlay of the project is US $ 65.11 million consisting of World Bank Component of US$ 55.73 million and Government of India component of US $ 9.38 million. The project isbeing implemented by Wireless Planning and Coordination Wing ( WPC), WirelessMonitoring Organization ( WMO ), Telecom Engineering Centre (TEC), Telecom RegulatoryAuthority of India (TRAI ), Telecom Dispute Settlement and Applate Tribunal ( TDSAT ) andDOT ( HQs) and will be completed by the end of 2004.
7. The progress with regard to the achievement of physical targets has not beensatisfactory. About 55.46 lakh new connections(77%), 9.97 lakh Tax Lines, 99020 routekms. of optical fibre cables ( 78.57% ) and 70750 VPTs ( 49.13% ) could be provided bythe PSUs. However, the target for provision of microwave systems was over achieved by97%. The details may be seen in Annexure -7.4.4.

642
8. The utilization of funds for the telecom sector as a whole is expected to fall short ofthe target by about 6.75%. This is reflected by the Revised Estimates of expenditure ofRs.18932.40 crore as against the outlay of Rs.20298.84 crore approved for the AnnualPlan 2001-02. This is basically due to a substantial decrease in internal resourcesgeneration by telecom service providing PSUs i.e. BSNL, MTNL and VSNL. BSNL’sinternal resources fell short by 27%. Extra-budgetary sources were resorted to; an outlayof Rs 8290 crore was raised. A small fall in RE may be attributed to privatisation of HTLlimited. A shortfall in utilization of funds is likely in Wireless Planning Cell of the Deptt. ofTelecom, WMO etc. as some of the major projects failed to take off as envisaged. Thedetails of financial performance may be seen at Annexure-7.4.3.
Annual Plan 2002-03
MAJOR THRUST AREAS
Universal Service Obligation (USO)
9. Government’s broad policy of taxes and regulation for the telecom sector has to bepromotional in nature with a view to ensuring optimum growth in the coming years.Revenue generation should not be a major determinant of the macro policy governing thesector. Guided by this principle and keeping in line with the policy adopted by most of theprogressive administrations in the world, the licence fee need to be aligned to the cost ofregulation and administration of Universal Service Obligation (USO). Adequacy of fundshas to be ensured for effective implementation of the Universal Service Obligation (USO).If need arises, the rates of USO levy may have to be increased suitably.
Village Public Telephones (VPTs)
10. New Telecom Policy (NTP), 1999 envisages to cover all villages with the facility ofVillage Public Telephones(VPTs) by 2002. About 4.68 lakh villages have been providedwith a VPT as on March 2002. Necessary action needs to be taken up, both in the publicand private sector to meet this target.
Spectrum Policy
11. The policy governing spectrum allocation and licencing has to be so designed thatthis scarce resource is used optimally and does not become a constraint for growth.Spectrum pricing need to be based on relative demand and supply in a dynamic mannerand should promote introduction of spectrum efficient technology. A significant chunk ofavailable spectrum is being used by defence, police and para-military forces. A concreteaction plan needs to be put in place to upgrade and modernize the technology being usedby these forces so as to ensure efficient and optimal utilization of spectrum allotted andreleasing the surplus spectrum for use by civilian purposes. Necessary funds would haveto made available for this purpose.
Monitorable Targets
12. Keeping in view the above objectives and targets, the major physical targetsenvisaged for the Annual Plan 2002-03 for the Public sector are:

643
l Provision of 69.83 lakh new connections including 13.43 lakh WLL lines and 31.37 lakhGSM lines ;
l 5.34 lakh new connections would be provided in the rural areas;
l Addition of 11.47 lakh TAX Lines;
l Provision of 2.18 lakh VPTs;
l Laying of 77,060 route kms. of optical fibre cables; and
l Installation of 5000 route kms. of microwave systems.
13. To implement these programmes an outlay of Rs.19,462.79 crore including a budgetsupport of Rs.185 crore has been provided. The outlay for BSNL and MTNL amounts toRs.18070 crore i.e. about 93% of the total outlay. The budget support earmarked is mainlyfor the regulatory bodies and research organizations. The privatization of the VSNL wouldentail upon improving the share of MTNL and BSNL increasing in the over all share of thetotal outlay / expenditure of the current year. The organisation-wise outlay may be seen inAnnexure-7.4.3.
PSUS AND OTHER ORGANIZATIONS UNDER THE DEPTT.
Bharat Sanchar Niagam Limited (BSNL)
14. The operational network of the erstwhile Department of Telecom has been convertedinto a fully owned PSU called Bharat Sanchar Nigam Limited (BSNL). The company hasbecome operational from 1.10.2000. Keeping in line with the Tenth Plan objective ofproviding telephones, by and large, on demand by 2002 and sustain it thereafter, theCorporation plans to continue with the established policy of rapid expansion of basicservices. The Company envisages to provide 64.34 new connections during 2002-03 –about 89% of last year’s target. With a view to improving the long distance connectivityfurther, an enhanced target of installing 10.05 lakh additional TAX lines is envisaged forthe Annual Plan 2002-03. In order to implement these and other targets / programmes, anoutlay of Rs.14,076 crore comprising of an extrabudgetary resource of Rs.6383 crore hasbeen approved for BSNL. A token budget support of Rs.1 crore has been approved forthe Company. Details of physical targets may be seen in Annexure-7.4.4.
Mahanagar Telephone Nigam Limited (MTNL)
15. MTNL is providing telecom services in the two metros of Delhi and Mumbai.Telephones are virtually available on demand in the two cities. Keeping the slow growth indemand, a target of providing 5.49 lakh new connections has been fixed for the year 2002-03 keeping in view a trend in the last two years and saturation of the market. To take careof the increased long distance transmission requirements, additional 1.42 TAX lines areexpected to be added to the network during 2002-03. Modernization of equipment andimplementation of schemes aimed at providing new and value added services is expectedto be the new focus area of the company during the year. The major steps in this directionincludes digitalization of the entire network, introduction of new services like VPN, ChatService, Shopping Mails on Internet, provision of WILL equipments etc. To finance thevarious programmes of the Corporation, an outlay of Rs.3994 crore has been approved for

644
the Annual Plan 2002-03. Rs.1250 crore of this ambitious outlay is to be financed out ofextra budgetary resources.
ITI Limited
16. ITI Ltd. is the largest telecom equipment manufacturing company in the country. Thecompany has been able to achieve a turn-around in recent past. As per the Plans drawnout by the Company, completion of the on-going technology upgradation schemes would bea priority area. The new projects envisaged to be taken up during the year include CSN-MM projects, Wireless in Local Loop (WILL) etc. For implementing the various projects /schemes of the Company, an outlay of Rs.73.00 has been approved for the Annual Plan2002-03. This is to be financed entirely through extra budgetary resources of Rs.150 crore.
Regulatory Bodies
17. “Telecommunications sector Reform Technical Assistance Project” taken up with theassistance of World Bank with an outlay of US $ 65.11 million consisting of World BankComponent of US $ 55.73 million and Government of India component of US $ 9.38 millionwould continue in the Annual Plan (2002-03). An outlay of Rs 109 crore fully funded byBudget support has been provided to Wireless Planning and Coordination Wing ( WPC),Wireless Monitoring Organization (WMO), Telecom Engineering Centre (TEC), TelecomRegulatory Authority of India (TRAI), Telecom Dispute Settlement and Appellate Tribunal(TD-SAT) and DOT (HQs) for implementation of the project. During 2002-03.
C-DOT
18. C-DoT is the main public sector agency engaged in research and developmentactivity in the Telecom sector. Its technology constitutes more than 40% of the total linesoperative in Indian telecommunications network. C-Dot Switches are being exported toother countries having conditions similar to those in Indian rural areas. During Tenth Planthe thrust of C-DoT’s research plan would be the development of cost effectivetechnologies providing services and features at par with those being offered by other globalplayers. Development of products to cater to the needs to broad band fixed and mobilesubscribers access system as well as high band with backbone systems would be animportant part of the strategy for the Plan. Some of the major areas of thrust to beinitiated in the Annual Plan(2002-03) are :
l Intelligent Network Services;
l GSM Personal Communication Services;
l Third Generation Mobile Communication System;
l Ka Band Satellite Communications;
l Cell and Packet Switching Technologies for Voice and Data Convergence;
l Ultra High Bit Rate Network Backbone;
l Expansion Planning of Existing Wire-line Network.

645
19. With the carving out of BSNL as a separate corporate entity in September, 2000 planoutlay for C-DOT is required to be funded through budgetary support. An outlay of Rs.75crore fully funded by budgetary support is earmarked for the organization for the AnnualPlan 2002-03.
Policy Issues
20. Annual Plan 2002-03 would endeavour to build a modern and efficient telecominfrastructure with a view to providing world class telecommunications facilities ataffordable rates, meet the needs of convergence of telecom, IT and media and universalservice to all uncovered areas. To achieve the above goals, the major policy issues andaction points envisaged for the Plan are :
(a) The telecom sector needs to be treated as an infrastructure sector for the nextdecade or so in order to achieve the targets of teledensity in line with the objectives laidout in the New Telecom Policy, 1999. This is envisaged also to help achievingsubstantially higher rate of growth of broad-band to meet the requirements of other sectorsof the economy especially Information Technology and Entertainment. The policygoverning development of rural telecom services also need to be promotional in naturewith a view to boost teledensity in these areas in line with the objectives of NTP, 1999
(b) Government’s broad policy of taxes and regulation for the telecom sector has to bepromotional in nature with a view to ensuring optimum growth in the coming years.Revenue generation should not be a major determinant of the macro policy governing thesector. Guided by this principle and keeping in line with the policy adopted by most of theprogressive administrations in the world, the licence fee need to be aligned to the cost ofregulation and administration of Universal Service Obligation.
(c) Ensuring fair and timely interconnection in the multi-operator scenario is one of themajor inputs for sustaining high growth. Government’s intervention may be required in theform of establishing a fund to finance the requirements of capacity creation especially ofincumbent operator to meet increased requirement in this regard.
7.4 (III) INFORMATION AND BROADCASTING
Overview
1. Major advances in the fields of Broadcasting, Communication and InformationTechnology during the last decade have had a great impact on the Information andBroadcasting sector. Many means of communication deployed in the past to reach thelarge segment of the population either became outdated or underwent radical technologicalchanges, and yet goals like providing the people with development information andwholesome entertainment at a minimal cost, facilitating healthy growth and competitionwithin the sector remained as valid as ever. This has necessitated a review of thechallenges facing the sector and reworking of priorities for the Tenth Five Year Plan.
2. The activities of Information and Broadcasting (I&B) Sector cover three areas, viz.,Broadcasting (DD and AIR), Information and Films with the functions of eachcomplementing the other. Specialized media units in each of these sectors cater to the

646
information, education and entertainment needs of all sections of the society through Radio,Television, Films, Publication, Advertisement and traditional media like Dance and Drama.Among these, Broadcasting, i.e. All India Radio and Doordarshan, which account for over90 percent of the Plan Outlay of the Sector, was the most affected by the technologicaladvances. The position of Doordarshan as a monopoly broadcaster eroded with theemergence of more than 80 private channels now available in the country through cablenetworks. This resulted in some shift in viewership as the viewer was presented with amultiple choice of various genres of programmes such as film-based programmes, soapserials and hardcore news presentation, etc..
3. It is, however, noteworthy that both DD and AIR have made substantial progress interms of geographical and population coverage. In case of Doordarshan, signalsemanating from over 1200 terrestrial transmitters reach about 89% of the population. It hasemerged as one of the largest terrestrial network in the world with nearly 400 millionviewers and 3-tier primary programme service – National, Regional and Local.Doordarshan has also added a number of new Satellite TV Channels which include DDsports, DD Bharati (replacing DD News), Gyan Darshan (the educational channel) and twoRegional Channels in Jammu & Kashmir and Himachal Pradesh. Further, the duration oftransmission on 10 existing Regional Language Satellite Channels has been extended to24 hours a day. AIR has emerged as one of the largest radio organizations with 208broadcasting centres covering nearly 99% of the population spread around 90% of thegeographical area. It provides news, music, spoken word and other programmes in 24languages and 146 dialects. In the private sector also a number of FM radio channelshave come up in cities like Mumbai and Kolkata and more are likely to come up during theyear in other cities including Delhi.
4. The role of AIR and DD as Public Service Broadcaster makes extra demands on theirfinancial and human resources which are not encountered by private channels. Forexample, the extension and improving of broadcasting services in hilly terrain and borderareas where private broadcasters are not likely to operate on financial considerations,Prasar Bharati as Public Service Broadcaster has to operate the services. Besides, thepast Plan expenditure on Broadcasting Sector was mainly characterized by creation ofcarriage infrastructure with little or no provision of funds to promote quality in the content oftelecast. By very nature, the programmes of Prasar Bharati aim largely at informing andeducating; even while being entertaining, they hold viewers’ attention and cannot besolely revenue generating. This has necessitated appropriate strategy and fixing prioritiesfor the Annual Plan 2002-03, the first year of the Tenth Plan.
The various policy initiatives taken by the Government are as under:
l To encourage adoption of alternative technologies that enable increased and improvedaccess to public and private broadcasters affordable for the common man.
l To allow setting up of Low Power Community Radio Stations in FM mode by local communitiesand non-profit organizations such as Universities, NGOs, etc for educational, cultural andeconomic development of the respective communities.
l To review the DTH policy at an appropriate time, as per the requirements of the emergingscenario in the Broadcasting sector.

647
Review of Annual Plan 2001-02
5. An outlay of Rs. 811.40 crore was approved for the information and broadcastingsector for the Annual Plan 2001-02 comprising a Direct Budgetary Support of Rs. 340.00crore and IEBR component of Rs. 471.40 crore. The revised estimates of 2001-02 showan outlay of Rs. 741.06 crore with a Budgetary Support of Rs. 309.64 crore and IEBR ofRs. 431.42 crore. The increase in the budgetary support from the previous year wasmainly because of implementation of the special package for improving AIR andDoordarshan services in Jammu and Kashmir and special thrust for completion of ongoingschemes in the penultimate year of the Ninth Plan. Like earlier years, this year too, ashortfall is anticipated in the IEBR component of the Annual Plan. Sector-wise outlays andexpenditure for the Ninth Plan can be seen at Annexure7.4.5. The physical targets andachievements of Prasar Bharati during the Annual Plan 2001-02 are shown at Annexure-7.4.7. The reason for shortfall was mainly due to delay in construction of buildings andtowers, non-availability of suitable site, court cases, law and order problems, etc..
Annual Plan 2002-03
6. The approved outlay for this sector in the Annual Plan 2002-03 is Rs. 878crore, comprising budgetary support of Rs. 415.00 crore and IEBR of Rs. 463 crore.The budgetary support includes special package for J&K to complete the spill-overschemes under the package within this financial year. Besides, consolidation ofexisting facilities to make them more effective, stress has also been given onimprovement of TV and Radio services in the North-East States (including Sikkim) andIsland territories. The sector-wise approved outlay for information & broadcasting sector forthe Annual Plan 2002-03 is enclosed at Annexure7.4.6.
Thrust Areas for Annual Plan 2002-03
BROADCASTING SECTOR
Doordarshan
7. With wide ranging technological changes taking place in the sector, a need hasbeen felt for making adequate investments to ensure TV coverage of the remaining partsof the country, quality content creation, enhancing technological upgradation andmodernization through digitalization of production facilities and automation of major kendrasof Prasar Bharati, to enable the public service broadcaster compete effectively with theprivate channels.
All India Radio
8. Medium wave transmission has reached about 99% of the population. However, dueto its high quality stereophonic sound, FM broadcasting is the preferred mode of radiotransmission all over the world. Therefore, emphasis has been given to encourage FMradio services for better quality of transmission and reception in metros and small cities.Thrust has also been given on strengthening and expanding reach of radio in the North-Eastern States (including Sikkim).

648
9. The outlay for the Broadcasting sector for 2002-03 is Rs. 823.00 crore withRs 360 crore as budgetary support and Rs. 463.00 crore as IEBR. Thisincludes Rs. 160.20 crore as budgetary support for the Special Packages for Jammu &Kashmir and North-Eastern States. The approved outlays for Doordarshan and All IndiaRadio are Rs. 626.00 crore (DBS+IEBR) and Rs. 197.00 crore (DBS+IEBR)respectively. The broadcasting sector accounts for more than 90% of the total for the I&Bsector.
Film Sector
10. For the Annual Plan 2002-03, the approved outlay for the Film Sector is Rs.26.00crore. The major programmes/schemes to be undertaken during the year includeproduction of documentary films; construction/renovation of buildings, modernization of filmequipment, promoting film archival activities, development training facilities, promotion ofIndian films export through festivals, modernization of regional offices under Central Boardof Film Certification and creation of facilities for Childrens’ Film Society in India etc.
Information Sector
11. The approved outlay for the Information Sector for 2002-03 is Rs. 29.00 crore.The thrust areas for the Annual Plan include providing facilities to PIB offices in the newlycreated states, construction of Soochana Bhavan and National Press Centre, modernizationof Registrar of Newspapers for India offices, purchase of equipment, film/cassettes forDirectorate of Field Publicity, training of manpower for developing media skill, etc..
Zero-based Budgeting
12. The Ministry of Information and Broadcasting undertook a comprehensive review of allPlan schemes based on Zero Based Budget (ZBB) methodology. The objective of thisreview is to ensure rationalization of programmes, convergence of similar schemes to avoidduplication and weeding out old and irrelevant schemes. As a result of ZBB exercise, 94Ninth Plan schemes of Ministry of Information and Broadcasting have been reduced to 42schemes in the Annual Plan 2002-03 as continuing schemes.
Issues and Strategies
13. The following strategy has been adopted with respect to broadcasting sector duringthe Annual Plan 2002-03:
l Completion of special package of J&K.
l Strengthening and expanding the reach of Radio & TV in North-East States (includingSikkim) and island territories.
l FM radio to be encouraged for its better sound and local network.
l Digitalization of programme production facilities and automation of major Kendras forimproved performance of TV and Radio services and
l TV population to be covered preferably with multi-channel television services with qualitycontent.

649
14. Though many of the media units in the Information sector were started in the earlyperiod of planning process, their role for spreading information on development policiesremains as valid as ever, particularly, for the rural masses. The policy strategy for theprint media has been reviewed during the Annual Plan 2002-03 and private sector is beingencouraged, especially, for foreign investment in publishing newspapers and currentaffairs/periodicals. Besides, foreign equity in the advertisement and to facilitate publicationof Indian edition of foreign technical/scientific journals, etc. have also been permitted.
15. Similarly , in the film sector, a fresh look into the role and structure of variousmedia units is needed. However, the sector is primarily dominated by the private playersand film has occupied a special place in the lives of the Indians. The sector haswitnessed a phenomenal growth and it has received industry status in the NinthPlan. It is also one of the largest employers providing directly and indirectly aboutfive million people. Besides, film export has enhanced substantially during the last coupleof years. To achieve its full potential, the following strategies have been adopted:
l To tap formal sources of finance for film making and to discourage illegal money flow formthe underworld sources.
l To encourage export of Indian films in foreign markets through organizing festivals andmarketing strategies.
l To develop skill through HRD Training both in public and private institutions.
l To curb on film piracy to encourage revenue
l Augment infrastructural facilities at CBFC for better monitoring and film regulations.
l The Childrens’ Film Society (CFSI) should endeavour to increase production of highquality films for wider reach to the targetted audience.

650
Annexure 7.4.1
Annual Plan (2002-03)Physical Performance in Postal Sector
Scheme 2000-01 2001-02 2002-03Achievement Targets Achievement Targets
1 2 3 4 5Expansion of Network(i) PSSK 9555 2000 2402 1500(ii) EDBOs 363 500 45 250(iii) DSOs 52 50 51 25Computerisation of OfficesPos 150PAOs 3Circle Offices 7Networking HROsHROs 10TMOs 15CRCs 20V-SAT SystemCustomer Care Centres 62Improving ErgonomicsModernization 161 125 125 100SPCC 100Mail Offices 100Infrastructure for EDBOs 2005 2000 2000 1818AMPCs 2 2 2 1Mail Movement Vehicles 7Premium ProductsSpeed Post Booking 100PhilatelyExhibition 25Tools and Eqpts. 40TrainingGroup A 156 140 140 100Inservice 2424 2500 2500 6000Distance learning 35000Computer Training 28000Circle stamp Depots 2International Mail Processing 8National Data Centre 1Express Parcel Centres 6

651
Annexure 7.4.2
Annual Plan (2002-03)Financing of Postal Sector
(Rs. Crore)
Scheme 2000-01 2001-02 2002-03Actual BE RE BE
1 2 3 4 5Expansion of Network 8.47 15.00 16.44 3.41
Computerisation & Connectivity 26.63 21.01 32.11 38.86
Networking HROs 13.32
V-SAT System 0.75
Customer Care Centres 0.82 4.35 3.74 11.57
Improving Ergonomics 5.54
AMPCs 24.00
Mail Movement 3.97 61.77 14.82 0.30
Premium Products 4.98 4.00 3.49 2.74
Philately 1.71 1.20 1.20 0.84
Training 3.26 3.67 3.67 6.65
Buildings 25.78 24.00 23.58 28.00
Circle stamp Depots 0.26
International Mail Processing 1.26
Nastional Data Centre 5.00
R&D and Surveys 1.00
Express Parcel 0.50
E-post 0.50
E-bill Post 0.50
New products etc. 5.00
Total 75.62 135.00 99.05 150.00

652
Annexure 7.4.3
Annual Plan(2002-03)Financing of Telecom Sector
(Rs. Crore)
Scheme 2000-01 2001-02 2002-03Actuals BE RE BE
1 2 3 4 5
BSNL 12203.96 16574.00 16573.00 14076.00
IR 11643.96 11341.00 8283.00 7692.00
Bonds 560.00 5233.00 3083.00 3502.00
Others 5207.00 2881.00
GBS 1.00
MTNL 967.36 1600.00 1150.00 3994.06
IR 967.36 1600.00 1150.00 2744.06
Bonds 1250.00
VSNL 347.18 1814.66 945.97
IR 347.18 1814.66 945.97
ITI 24.00 125.00 125.00 73.00
IR 24.00 125.00 103.00 -77.00
Bonds 22.00 150.00
HTL 16.33 20.18
IR 14.39 12.92
Others 1.94 7.26
WMO 5.27 10.00 1.35 2.25
WPC 0.83 95.00 27.33 101.05
TRAI 2.00 4.00 4.00 1.50
TDSAT 0.20
TEC 1.36 4.00 4.75 4.00
C-DOT 110.66 52.00 101.00 75.00
Total 13678.95 20298.84 18932.40 18327.06
IR 12996.89 14893.58 10481.97 10359.06
Bonds 560.00 5233.00 3105.00 4902.00
Others 1.94 7.26 5207.00 2881.00
BS 120.12 165.00 138.43 185.00

653
Annexure 7.4.4
Annual Plan(2002-03)Physical Performance in Telecom Sector
Scheme Units 2000-01 2001-02 2002-03Achievement Targets Achievement Targets
1 2 3 4 5 6
New Con. Lakh lines 59.25 72.3 55.46 69.83
Fixed Lakh lines 25.03
WLL Lakh lines 13.43
GSM Lakh lines 31.37
BSNL Lakh lines 56.29 68.3 53.21 64.34
Fixed Lakh lines 22.9
WLL Lakh lines 11.94
GSM Lakh lines 29.50
MTNL Lakh lines 2.96 4 2.25 5.49
Fixed Lakh lines 2.13
WLL Lakh lines 1.49
GSM Lakh lines 1.87
TAX Lakh lines 5.12 10.1 9.97 11.47
BSNL Lakh lines 10.05
MTNL Lakh lines 1.42
Microwave 000 Rms 21.03 7.5 14.45 5.00
Optical Fib 000 Kms 55.35 126 99.02 77.06
VPT 000 Nos 34.22 144 70.75 218.00

654
Ann
exur
e 7.
4.5
Min
istr
y O
f Inf
orm
atio
n &
Bro
adca
stin
gN
inth
Pla
n A
nd A
nnua
l Pla
ns E
xpen
ditu
re
S.
Med
ia U
nits
9th
Pla
nA
ppro
ved
App
rove
dA
ppro
ved
App
rove
dA
ppro
ved
Tota
lA
ctua
lsA
ctua
lsA
ctua
lsA
ctua
lsA
ntic
i-To
tal
No.
Out
lay
Out
lay
Out
lay
Out
lay
Out
lay
outla
you
tlay
1997
-98
1998
-99
1999
-200
020
00-0
1pa
ted
Exp
r.(9
7-20
02)
1997
-989
919
98-9
999
-200
020
00-0
120
01-0
2fo
rE
xpr
durin
g5
yrs.
of
2001
-02
9th
Pla
n9t
h P
lan
(Col
.10
(co
l 4-8
)to
14)
12
34
56
78
910
1112
1314
15
IIn
form
atio
n S
ecto
r
DB
S93
.30
19.0
018
.52
17.5
017
.21
14.4
687
.69
12.5
114
.20
16.4
512
.76
12.7
168
.63
IEB
R0
0.00
1.03
1.76
1.51
2.62
6.92
0.00
0.94
1.50
1.90
2.59
6.93
To
tal
I93
.30
19.0
019
.55
19.2
619
.72
17.0
894
.61
12.5
115
.14
17.9
514
.66
15.3
075
.56
IIF
ilm S
ecto
r
DB
S13
7.20
33.8
034
.28
30.5
038
.49
32.7
716
9.84
28.9
921
.97
26.9
530
.68
21.9
313
0.52
IEB
R45
.50
8.20
8.70
6.10
10.7
08.
6242
.32
8.23
4.71
3.48
3.50
6.50
26.4
2
To
tal I
I18
2.7
42.0
042
.98
36.6
049
.19
41.3
921
2.16
37.2
226
.68
30.4
334
.18
28.4
315
6.94
III
Bro
adca
s-tin
g S
ecto
r
DB
S44
9.55
74.8
074
.80
97.0
021
3.30
292.
7775
2.67
42.6
442
.60
97.0
020
7.13
275.
0066
4.37
IEB
R21
17.5
048
4.00
524.
6041
6.52
427.
1446
0.16
2312
.42
391.
9934
6.14
381.
8932
8.62
422.
3318
70.9
7
To
tal I
II25
67.0
555
8.80
599.
4051
3.52
640.
4475
2.93
3065
.09
434.
6338
8.74
478.
8953
5.75
697.
3325
35.3
4
IVG
ran
d T
ota
l
DB
S68
0.05
127.
6012
7.60
145.
0027
0.00
340.
0010
10.2
084
.14
78.7
714
0.40
250.
5730
9.64
863.
52
IEB
R21
63.0
049
2.20
534.
3342
4.38
439.
3547
1.40
2361
.66
400.
2235
1.79
386.
8733
4.02
431.
4219
04.3
2
Tota
l I+I
I+III
2843
.05
619.
8066
1.93
569.
3870
9.35
811.
4033
71.8
648
4.36
430.
5652
7.27
584.
5974
1.06
2767
.84
DB
S:
Dire
ct B
udge
tary
Sup
port
IEB
R:In
tern
al &
Ext
ra B
udge
tary
Res
ourc
es

655
Annexure 7.4.6
Ministry Of Information & BroadcastingAnnual Plan 2002-03 Outlay
(Rs. In lakh)
Sl. No. Media Unit Approved Outlay
1 2 3
I INFORMATION SECTOR
1 PIB 1150.00
2 Publications Division 60.00
3 DAVP 300.00
4 IIMC 390.00
5 Photo Division 50.00
6 DFP 220.00
7 Song & Drama Division 200.00
8 RR&TD 10.00
9 RNI 60.00
10 PCI 20.00
Main Sectt. Schemes
11 Soochna Bhavan 400.00
12 Training for Human Resource Development 40.00
Total (I) 2900.00
II FILM SECTOR
1 Films Division 565.00
2 NFAI 272.00
3 FTII, Pune 242.00
4 SRFTI, Kolkata 22.00
5 DFF 469.00
6 CFSI 600.00
7 CBFC 310.00
Main Sectt. (Film Wing) Schemes
8 Grant-in-aid to FFSI 4.00
9 Grant-in-aid to NGOs engaged in anti-piracy 16.00work/Festivals
10 Participation in Film Market in India & abroad 100.00
Total (II) 2600.00

656
III BROADCASTING SECTOR (Prasar Bharati)
1 All India Radio 19700.00
DBS 8500.00
IEBR 11200.00
2 Doordarshan 62600.00
DBS 27500.00
IEBR 35100.00
Total (III) 82300.00
DBS 36000.00
IEBR 46300.00
GRAND TOTAL (I+II+III) 87800.00
DBS 41500.00
IEBR 46300.00
(Rs. In lakh)
Sl. No. Media Unit Approved Outlay
1 2 3

657
Annexure 7.4.7
Media-wise Physical targets and achievementsfor Annual Plan 2001-02 and targets for 2002-03
Sl. Media Unit Scheme 2001-02 2002-03No. Targets Targets Achievements
1 2 3 4 5 6
1 Doordarshan
Studios 3 2 4
HPT-DD1 18 5 14
HPT-DD2 8 2 11
LPT/VLPTs 65 31 50
Doordarshan
(J&K Package)
Studios — — 1
HPTs (DD1+DD2) 9 2 6
LPTs/VLPTs 58 37 22
DOORDARSHAN TOTAL 161 79 108
2 All India Radio
Broadcasting Stations — — 1
MW Transmitter *33 *31 2
SW Transmitter — — 1
Studios — — 1
AIR (J&K Package)
Broadcasting Stations — — 2
MW Transmitter 10 8 2
FM Transmitter — — 1
3 All India Radio TOTAL 43 39 10
4 Prasar Bharati TOTAL 204 118 118
* Continuing Scheme – 10 + Modernisation Scheme – 22 + New Scheme - 1

658
7.5 Information Technology
The Information Technology (IT) is one of the fastest growing segments of Indianindustry, growing from Rs. 32,070 crore in 1997-98 to Rs. 80,884 crore in 2001-02. Interms of value of production about 92 per cent of the industry is in private sector and shareof the public sector undertakings is limited to about 8 per cent. Sixty per cent (Rs. 48,134crore in 2001-02) of the industry is accounted for by software sector and the remaining 40per cent (Rs. 32,750 crore) by IT hardware. Since software comprises the bulk of theexports, the sector has performed exceedingly well on export’s front which grew from Rs.9,500 crore in 1997-98 to Rs. 42,371 crore in 2001-02. Performance of the industry duringNinth Plan period and targets for Annual Plan 2002-03 are given in table 7.5.1
Table 7.5.1
Production of the IT industry
(Rs. crore)
Item 1997-98 1998-99 1999-2000 2000-01 2001-02 2002-03Target
IT Hardware 22,100 25,250 28,100 30,700 32,750 39,500
Software Exports 6,500 10,940 17,150 28,350 36,500 54,000
Domestic Software 3,470 4,950 7,200 9,400 11,634 17,000
Total 32,070 41,140 52,450 68,450 80,884 1,10,500
2. The sector has been playing a catalytic role in improving productivity of other sectorsof the economy. Some of the major achievements of the sector include the developmentand tremendous success of the Indian software industry, development of supercomputertechnologies, large-scale computerization, e-governance, modernization of communicationsservices, increasing Internet usage, IT-based automation in various sectors like health,industry, transport, energy, etc.
Major Objectives of Tenth Five Year Plan:
3. The major objectives envisaged for the IT sector in the Tenth Five Year Plan are to:
l Ensure the sustained growth of software sector and increase India’s share in the global ITmarket to a level of 6% against 2% at present.
l Put in place the basic policy framework for development of the hardware manufacturingindustry.
l Devise appropriate policy interventions for the greater use of IT for promoting more efficient,transparent and responsive governance.
l Promote development and use of software in Indian languages.
l Take necessary steps for taking IT to the masses by making it affordable, easy to use anduseful in day-to-day life.
l Put in place the required policy framework to improve the quality of manpower, skills andR&D.

659
Major Initiatives and Thrust Areas:
4. The major initiatives proposed to be taken in the Tenth Plan include formulation of anational hardware development policy, improving quality and productivity in softwaredevelopment, aggressive marketing for software export including expanding the focus tonewly emerging markets in Europe, U.K., Asia Pacific, Japan etc., apart from giving priorityto USA, Development and Promotion of software in Indian languages with a view to take ITto common man and increase domestic market, upgrading facilities in engineering collegesfor improving quality of manpower, implement e-governance in the country in acomprehensive manner, providing Internet connectivity and e-learning tools in schools andcolleges through Vidya Vahini and Gyan Vahini programmes and promoting research /innovations for rural needs through Media Lab Asia Programme.
5. The IT enabled services like Customer Interaction Services, Business ProcessOutsourcing (BPO), Insurance Claim Processing, Digital Content Development, OnlineEducation, Web Services have been identified as a sources of wealth creation andemployment generation. These services are estimated to provide employment to about 11Lakh people and generate revenue of Rs.81,000 crore in the next eight years. The marketfor these services in 2001-02 grew to Rs.7,100 crore accounting for over 1,07,000 newjobs. Call centers alone generated about 80% of the revenue. The country offers manyfavorable factors like availability of talent, maximum number of ISO and CMM IV and Vcertified IT companies, adequate communication infrastructure, goodwill of internationalcustomers etc., for development of IT enabled services. However, their full potential canbe tapped by setting up training infrastructure specially designed for these services andhassle free support by state governments and local bodies.
6. Presently there are about 300 units in electronics and Information Technology fieldregistered with the Department of Scientific & Industrial Research. Some good institutionslike Central Electronics Engineering Research Institute Pilani, Electronics Research &Development Centres, Centre for Development of Advanced Computing, Pune, Society forApplied Microwave Electronics Engineering and Research, IITs/ IISc, Optel, NationalPhysical Laboratory, Electronics Corporation of India Ltd., etc., have made significantcontribution in research the electronics and IT to their credit.
7. As per Information Technology Agreement (ITA1-WTO), the IT sector would bebrought to a zero duty regime by 2005. Therefore, it has become imperative for Indian ITindustry to develop technologies, products and services of international cost and qualityand become global leader at least in some selected fields like software & IT services, bio-informatics, micro-electronics, cyber security, wireless technologies, high-end computingetc., The R&D model devised for pursuing R&D in the Tenth Plan is based on theirstrategic value and classification as Long, Medium and Short term R&D. Under thiscategorization the gestation periods of Long, Medium and Short term R&D Projects are 10years, 3-6 years and 1-3 years respectively. While focus of long term R&D would be in thearea of basic research like nano-technologies, bio-informatics etc., with government fundsto a major extent, medium and short term R&D are envisaged to be largely funded byindustry itself with the prime objective of improving product quality, reducing costs andcreate innovations. The Tenth Plan Working Group on IT has estimated a fund requirementof Rs.3,400 crore per year for R&D in IT during the Tenth Plan which has been proposedto be financed by the government and industry in the ratio of 80: 20.

660
Review of Annual Plan 2001-02
8. The year 2001-02 has been a year of turbulence, tragedy, terrorism and slow-down inthe World economy. This has affected the Indian software export industry also whichregistered a growth of about 29 per cent in the year 2001-02 against 65 per cent in theprevious year. However, with the phenomenal growth in IT Enabled services sector and byexpanding markets for software exports, the industry is optimistic to grow very rapidly ondomestic and international fronts in future. The software & services industry accounted forabout 1.7 per cent of India’s GDP during 2001-02. The Indian IT software & servicesexports have been over 16 per cent of total National exports in 2001-02.
9. During 2001-02, with a view to facilitate invention, refinements and extend thebenefits of Information & Communication Technology (ICT) to masses, the Department ofInformation Technology initiated Media Lab Asia Project. Other major achievements of theyear were development of 15 million electron volt linear accelerator for cancer treatment,completion of ten important R&D projects in the field of broadcasting, languageengineering, railway freight information system, industrial automation, distance learningtechnologies, etc. under various programmes. The Standardization Testing Quality Control(STQC) Directorate of DIT certified 110 industries under various certification schemes.
10. Under disinvestments programme of Government of India, the CMC Limited a PSUwas disinvested during the year.
Major Programmes in Annual Plan 2002-03
11. The Department of Information Technology (DIT) is acting as a nodal institution forthe promotion of the sector, facilitating and coordinating the various initiatives of thecentral and state governments and the private sector. An outlay of Rs.593.58 crore with abudgetary support of Rs.470 crore has been approved for various schemes of DIT forAnnual Plan 2002-03. The actual expenditures of the Department in Annual Plans 2000-01and 2001-02 have been to the tune of Rs.305.12 crore and Rs.490 crore (Net B.S.)respectively. A list of Plan schemes of the DIT indicating approved outlays for Annual Plan2002-03 is given in the Annexure. Some major programmes of DIT are given below:
Community Information Centres (CICs)
12. Under this project Community Information Centres (CICs) at 487 Blocks in the sevenNorth East States and Sikkim are being set up for socio-economic development of theregion. Each CIC is equipped with one server, five computers, three printers, UPS, DG setetc. The Internet connectivity is being provided through VSAT. The project has beencommissioned on 15th August, 2002. These centers are envisaged to play an importantrole in government interface with the public, Internet access and promote IT enabledservices for benefit of the community at large, besides establishing digital unite.
E-governance
13 The delivery of government services has become very user unfriendly because of toomuch discretion at every level, lack of transparency and cumbersome record management.E-governance denotes the application of IT to government processes in order to bringabout Simple, Moral, Accountable, Responsive and Transparent (SMART) governance.

661
14. Though the Central and several state governments have taken some initiatives in e-governance during the Ninth Plan, these efforts have been driven primarily by individualinitiatives rather than institutional thrusts and e-governance is yet to take the shape of asystematic national programme. Different levels of development, computerisation andpolitical will necessitate the adoption of some standardized, uniform pattern in order toavoid the emergence of a digital divide between progressive states and states having lessdevelopment due to various reasons.
15. So far, the programme of e-governance has largely been restricted to the efforts ofthe National Informatics Centre (NIC) and a few organisations. The emphasis has been onproviding connectivity, networking, technology upgradation, selective delivery systems forinformation and services and a package of software solutions. It is now necessary to lookseriously at the re-engineering of procedures and rules which form the core of any effectiveprogramme of e-governance. A comprehensive scheme to implement e-governance in thecountry is being formulated by Department of Information Technology and Department ofAdministrative Reforms.
Technology Development for Indian Languages
16. This programmes aims at development of IT tools and content in Indian languages tofacilitate use of computers and other IT systems in various Indian languages. The DIT hastaken up development work in this area at 13 Resource Centers at leading R&Dorganizations and educational institutes. Major achievement under the programme aredevelopment of multi-lingual digital libraries / dictionaries, translation support system,optical character recognition system, Text to Speech Systems and Standardization(UNICODE, XML, Lexware format, Fonts). Some of the new R&D projects initiated in thefield of language engineering include localization of Linux Operating System, IndianLanguage Content Creation, Development of IT Terminology in Hindi, Translation SupportSystem from English to Hindi.
Software Technology Parks in India (STPI)
17. The STPI is serving software export industry countrywide with over 30 SoftwareTechnology Parks equipped with high speed data communication and other infrastructurefacilities. Software exports from member units of STPI is showing consistent growth duringthe last 5 years. These units exported software worth Rs.28,000 crore against totalnational software exports of Rs.36,500 crore in 2001-02. More than 6,900 units have beenapproved under the STPI scheme out of which about 3,000 units are exporting software.
Media Lab Asia
18. The Media Lab Asia project has been taken up by DIT in collaboration with theMassachusetts Institute of Technology. The objective of the project is to bridge the digitaldivide through development of state-of-the-art Information and communication technologiesand deploying these technologies for the benefit of the citizens, especially those in the ruralareas, and empowering them by creating business opportunities. The thrust areas to betaken up in the project are health, education/learning, employment and micro-entrepreneurship. During 2002-03, under exploratory phase of MLA project Research Labsat five IITs have been established and made operational. About 32 projects initiated at

662
these labs relates to technology development in the areas of Bits for All, World Computer,Tools for tomorrow and Digital Village.
Vidya Vahini and Gyan Vahini Programmes
19. These two programmes would be initiated on a pilot basis for providing connectivity toGovernment Senior Secondary Schools (Vidya Vahini) and upgradation of IT infrastructurein the higher learning institutions (Gyan Vahini) during the Tenth Plan.
Monitorable Targets / Anticipated Achievements in Annual Plan 2002-03
20. The schemes of the Department of Information Technology are broadly classified intoR&D, Infrastructure, Human Resource Development and policy formulation. Among variousprogrammes which are of continuing in nature, notable programmes likely to be completedduring the year are;
l Commissioning of CICs project in North Eastern states,
l Implementing Vidya Vahini and Gyan Vahini programmes on pilot basis,
l Issuing of digital signatures,
l Setting up of Atal Bihari Vajpayee Centre for Excellence in Information and CommunicationTechnology in Mangolia,
l Development of laser welding technology,
l Completion of exploratory phase of the Media Lab Asia project,
l Preparing action plan for implementing e-governance in the country,
21. The existing infrastructure of National Informatics Centre (NIC), Software TechnologyParks, Education & Research Network (ERNET), Standardization Testing & Quality Control(STQC), etc., would be suitably augmented.
22. The Semiconductor Complex Limited, Mohali has projected to achieve a salesturnover of Rs.78.34 crore in A.P. 2002-03 against an anticipated sales of Rs.72.69 crore in2001-02. The Company is likely to produce 8000 units of Very Large Scale Integrated(VLSI) wafers in 2002-03 against 1000 produced in 2001-02.
Zero Based Budgeting
23. The Department of Information Technology undertook a comprehensive review of allplan schemes based on Zero Based Budget (ZBB) methodology. The objective of thisreview is to ensure rationalization of programmes, convergence of similar schemes toavoid duplication and weeding out old and irrelevant schemes. As a result of ZBBexercise 55 Ninth Plan schemes of the DIT, have been reduced to 40 schemes in AnnualPlan 2002-03.

663
Issues
24. A number of plans and policy measures have been implemented by the Governmentand private sector to boost this sector in the Ninth Plan. However, some issues givenbelow are yet to be addressed for further development of the sector:
l Formulate a national hardware development policy and encourage global hardware majorsto set up manufacturing units in India.
l A comprehensive rationalisation of tariff structure to cope with the zero duty regime onfinished products that will come into place after 2005 as per ITA1-WTO agreement.
l Encourage setting up Software Technology Parks in the private sector.
l The software industry needs to move up in the value chain by developing high value productsand focus of Indian industry needs to shift from providing software solutions to becomingmanufacturers of packaged products.
l Make large investments in building brand equity and positioning the India brand abroad.Industry associations like NASSCOM, MAIT, ESC etc. must help SMEs in their export effortsthrough effective networking and meetings with potential customers.
l Promotion of software in Indian languages to increase IT penetration in the domestic market.
l Updating the syllabus of computer engineering, electronics and IT in various technicalinstitutions in keeping with the industry’s requirements. The curriculum in other branches ofengineering should also be expanded to include IT subjects. Emphasis must be laid onpostgraduate engineering education.
l Facilities in existing RECs and engineering colleges under deemed universities mustbe upgraded to IIT level so that there are at least 100 such institutions by the end ofthe Tenth Plan.
l ‘C’-level course of DOEACC must be recognised as equivalent to M.Tech in computerengineering for all purposes.
l State governments and local bodies should support IT-enabled services industries inorder to create employment opportunities.
l E-governance has been identified as priority area in the Tenth Plan and a clearroadmap to make it a national programme must be formulated without any delay.
l An action plan needs to be formulated to take up R&D in the emerging areas like bio-informatics and nano-technologies.
l Issuing digital signatures to citizens is already delayed, it must be implementedearliest as per requirement of the Information Technology Act, 2000.
l Enforcement of the IT Act to deal with cyber crimes and training law enforcingagencies to handle such crimes.
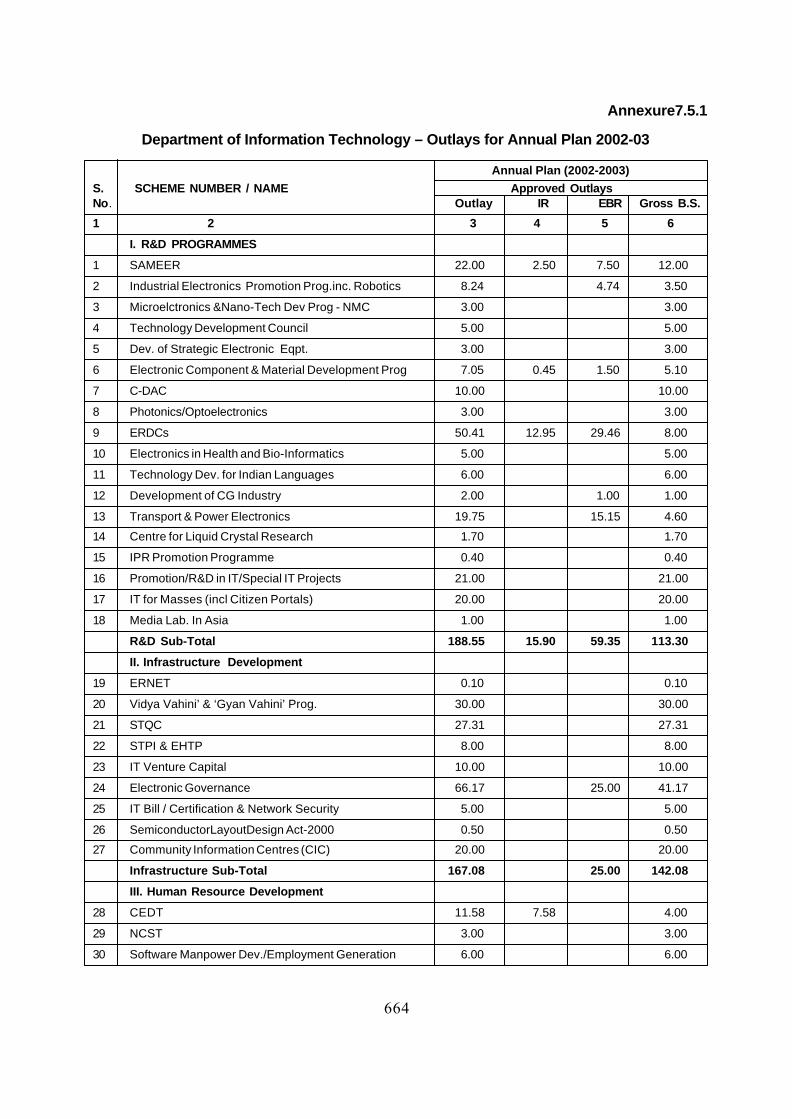
664
Annexure7.5.1
Department of Information Technology – Outlays for Annual Plan 2002-03
Annual Plan (2002-2003)S. SCHEME NUMBER / NAME Approved OutlaysNo. Outlay IR EBR Gross B.S.
1 2 3 4 5 6
I. R&D PROGRAMMES
1 SAMEER 22.00 2.50 7.50 12.00
2 Industrial Electronics Promotion Prog.inc. Robotics 8.24 4.74 3.50
3 Microelctronics &Nano-Tech Dev Prog - NMC 3.00 3.00
4 Technology Development Council 5.00 5.00
5 Dev. of Strategic Electronic Eqpt. 3.00 3.00
6 Electronic Component & Material Development Prog 7.05 0.45 1.50 5.10
7 C-DAC 10.00 10.00
8 Photonics/Optoelectronics 3.00 3.00
9 ERDCs 50.41 12.95 29.46 8.00
10 Electronics in Health and Bio-Informatics 5.00 5.00
11 Technology Dev. for Indian Languages 6.00 6.00
12 Development of CG Industry 2.00 1.00 1.00
13 Transport & Power Electronics 19.75 15.15 4.60
14 Centre for Liquid Crystal Research 1.70 1.70
15 IPR Promotion Programme 0.40 0.40
16 Promotion/R&D in IT/Special IT Projects 21.00 21.00
17 IT for Masses (incl Citizen Portals) 20.00 20.00
18 Media Lab. In Asia 1.00 1.00
R&D Sub-Total 188.55 15.90 59.35 113.30
II. Infrastructure Development
19 ERNET 0.10 0.10
20 Vidya Vahini’ & ‘Gyan Vahini’ Prog. 30.00 30.00
21 STQC 27.31 27.31
22 STPI & EHTP 8.00 8.00
23 IT Venture Capital 10.00 10.00
24 Electronic Governance 66.17 25.00 41.17
25 IT Bill / Certification & Network Security 5.00 5.00
26 SemiconductorLayoutDesign Act-2000 0.50 0.50
27 Community Information Centres (CIC) 20.00 20.00
Infrastructure Sub-Total 167.08 25.00 142.08
III. Human Resource Development
28 CEDT 11.58 7.58 4.00
29 NCST 3.00 3.00
30 Software Manpower Dev./Employment Generation 6.00 6.00

665
31 Special Manpower for ASIC Design 2.00 2.00
HRD Sub-Total 22.58 7.58 15.00
IV. MISCELLANEOUS
32 Headquarter (Secretariat & Bldg.) 10.24 10.24
33 El. for Rural/Social /Agri/Water Sector 14.00 10.00 4.00
34 Tech. Information and Forecasting 0.50 0.50
35 Electronics Industry Information Prog. 0.25 0.25
36 E-Commerce & Info-Security (incl. Smart Cards) 5.00 5.00
37 Policy Formulation & Eco Analysis in IT Sector 0.60 0.60
Miscellaneous Total 30.59 10.00 20.59
SUB-Total (I to V) 408.80 23.48 94.35 290.97
V. PSUs
38 Semiconductor Complex Ltd. 3.51 3.50 0.01
39 VI. NIC 175.02 175.02
40 VII. ESC & Export Market Development Prog 6.25 2.25 4.00
Grand Total 593.58 29.23 94.35 470.00
Annual Plan (2002-2003)S. SCHEME NUMBER / NAME Approved OutlaysNo. Outlay IR EBR Gross B.S.
1 2 3 4 5 6