Application of the integrated safety assessment methodology to the protection of electric systems
12
1 Application of the Integrated Safety Assessment Methodology to Sequences with Loss of Component Cooling Water System. C. Queral, L. Ibáñez Universidad Politécnica de Madrid, Madrid, Spain J. Hortal, J.M. Izquierdo, M. Sánchez-Perea, E. Meléndez Consejo de Seguridad Nuclear, Madrid, Spain J. Gil, I. Fernández, J. Gómez, H. Marrao Indizen Technologies S.L., Madrid, Spain Abstract The Integrated Safety Assessment (ISA) methodology, developed by the Consejo de Seguridad Nuclear (CSN), Spanish Nuclear Regulatory Body, has been applied to a thermo-hydraulic analysis of Zion NPP for sequences with loss of the Component Cooling Water System (CCWS). The ISA methodology allows obtaining the damage domain (the region where the PCT limit is exceeded) for each sequence of the dynamic event tree as a function of the operator actuations times (secondary side cooling and recovery of CCWS) and the time of occurrence of stochastic phenomena (seal LOCA), and computing from it the exceedance frequency by integrating the dynamic reliability equations proposed by ISA 12 . For every sequence, several data are necessary in order to obtain its contribution to the global exceedance damage frequency. These data consist of the results of the simulations performed with MAAP and TRACE codes that are inside of the damage domain and the time-density probability distributions of the manual actions and the time of seal LOCA occurrence. Reported results show an slight increment of the exceedance damage frequency for this kind of sequences in a power uprate from 100% to 110%. 1. Introduction As a part of the collaboration between Consejo de Seguridad Nuclear (CSN), Universidad Politécnica de Madrid (UPM) and Indizen Technologies an analysis of sequences with loss of Component Cooling 1 Izquierdo, J. M., Cañamón I., (2008). TSD, a SCAIS suitable variant of the SDTPD. Safety, Reliability and Risk Analysis. Proceedings of the ESREL, (pp. 163-171), Valencia, Spain. 2 Hortal, J., & Izquierdo, J. M. (2008). Exceedance Frequency Calculation Process in safety Margins Studies. Spain, Madrid: Nuclear Safety Council (CSN).
-
Upload
independent -
Category
Documents
-
view
0 -
download
0
Transcript of Application of the integrated safety assessment methodology to the protection of electric systems

1
Application of the Integrated Safety Assessment Methodology to Sequences with Loss of Component Cooling Water System.
C. Queral, L. Ibáñez
Universidad Politécnica de Madrid, Madrid, Spain
J. Hortal, J.M. Izquierdo, M. Sánchez-Perea, E. Meléndez
Consejo de Seguridad Nuclear, Madrid, Spain
J. Gil, I. Fernández, J. Gómez, H. Marrao
Indizen Technologies S.L., Madrid, Spain
Abstract
The Integrated Safety Assessment (ISA) methodology, developed by the Consejo de Seguridad Nuclear (CSN), Spanish Nuclear Regulatory Body, has been applied to a thermo-hydraulic analysis of Zion NPP for sequences with loss of the Component Cooling Water System (CCWS). The ISA methodology allows obtaining the damage domain (the region where the PCT limit is exceeded) for each sequence of the dynamic event tree as a function of the operator actuations times (secondary side cooling and recovery of CCWS) and the time of occurrence of stochastic phenomena (seal LOCA), and computing from it the exceedance frequency by integrating the dynamic reliability equations proposed by ISA12
. For every sequence, several data are necessary in order to obtain its contribution to the global exceedance damage frequency. These data consist of the results of the simulations performed with MAAP and TRACE codes that are inside of the damage domain and the time-density probability distributions of the manual actions and the time of seal LOCA occurrence. Reported results show an slight increment of the exceedance damage frequency for this kind of sequences in a power uprate from 100% to 110%.
1. Introduction
As a part of the collaboration between Consejo de Seguridad Nuclear (CSN), Universidad Politécnica de Madrid (UPM) and Indizen Technologies an analysis of sequences with loss of Component Cooling
1 Izquierdo, J. M., Cañamón I., (2008). TSD, a SCAIS suitable variant of the SDTPD. Safety, Reliability and Risk Analysis. Proceedings of the ESREL, (pp. 163-171), Valencia, Spain. 2 Hortal, J., & Izquierdo, J. M. (2008). Exceedance Frequency Calculation Process in safety Margins Studies. Spain, Madrid: Nuclear Safety Council (CSN).

2
Water System (CCWS) has been performed with MAAP3 and TRACE4 codes in the context of the NEA application exercise SM2A (Safety Margin Application and Assessment). Integrated Safety Assessment (ISA) methodology intends to consider all the relevant uncertainties (occurrence times and physical parameters) that could impact the considered safety or damage limit. Nevertheless for the sake of demonstrating the method within the SM2A project, the analysis has focused on the treatment of uncertain times since they were expected to be dominant and traditional uncertainty analysis methods could not be applicable. This analysis aimed at understanding the impact of the time of occurrence of the SLOCA, the time needed to recover the CCW system, the time to begin the secondary side depressurization as well as the availability of the accumulators in this kind of sequences. Results shown in this paper are focused on those obtained with TRACE code5
ISA methodology has been developed by the Modeling and Simulation (MOSI) branch of CSN, aiming to provide with an adequate method to perform a general uncertainty analysis, making emphasis in those sequences where some events occur at uncertain times or randomly. For a given safety limit or damage limit (PCT within this paper), the numerical result of this methodology consists of the damage exceedance frequency (DEF) for the sequences stemmed from an initiating event. This is done along with the delineation of the dynamic event tree (DET) and the identification of the damage domain (DD) of the sequences that contribute to the total DEF. The damage domain is defined as the region of the space of uncertain parameters of interest where the limit is exceeded. DDs have as many dimensions as the number of uncertainties involved in each sequence. In the case being analysed, DD are up to three-dimensional. In principle, DD dimensions are not limited (i.e., being n-dimensional in general; other examples of three-dimensional DD can be found in Izquierdo (2008)
.
6. The UPM group has applied extensively this methodology in several projects78910
• Event tree headers in PSA are usually defined at safety function level, i.e., each header represents the successful achievement of a safety function. System success criteria are therefore needed to develop the header fault trees. In the ISA context, however, event tree headers represent hardware states (system trains working or not) or operator actions. ISA fault trees are used to calculate the probability of each system configuration, not to quantify failure probabilities.
. ISA methodology introduces some differences with respect the classical Probabilistic Safety Analysis (PSA):
11
• In PSA event trees, header intervention (i.e., demand of a safety function) is decided on the basis of generic analyses. On the contrary, demand for header intervention in ISA is a simulation result. As a result the number of possible branches in a header is different in PSA
3 MAAP User’s group, 1994. “MAAP4, Modular Accident Analysis program for LWR Power plants”. Computer Code User’s Manual. 4 NRC, 2008. Division of Risk Assessment and Special Projects “TRACE V5.0 USER’S MANUAL”. NRC. 5 Equivalent results obtained with MAAP code will be published in an extended paper, and have been also reported in the SM2A final report. 6 Izquierdo, J.M., Cañamón, I., 2008 “Status report on dynamic reliability: Conclusions of the SDTDP/TDS methods development: Results of its application to the H2 combustion”. Severe Accident Research Network (SARNET). 7 Izquierdo, J.M. et al., 2008. “SCAIS (Simulation Code System for Integrated Safety Assessment): Current status and applications”. Proc. ESREL 08, Valencia, Spain. 8 Hortal, F.J., et al, 2010 “Application of the Damage Domain approach to the calculation of exceedance frequencies” 10th International Probabilistic Safety Assessment & Management Conference (PSAM10). 9 Ibáñez, L., et al, 2010 “Damage Domain Approach as a Strategy of Damage Exceedance Computation”, Proc. Int. Conf. Nuclear Energy for New Europe 2010, Portoroz, Slovenia. 10 Queral, C. et al, 2010 “Application of the Integrated Safety Assessment Methodology to MBLOCA Sequences” The 8thInternational Topical Meeting on Nuclear Thermal-Hydraulics, Operation and Safety (NUTHOS-8) Shanghai, 2010. 11 Due to limitations in the available information for the SM2A exercise about the PSA model, the only hardware configurations considered in this analysis are total failure and minimal configuration for PSA success. In a general case, however, there would be a separate header for each redundant train of safety systems or, alternatively, multi decision branching points with a branch for each system configuration.

3
and ISA. In PSA there are two branches for a header: failure or success, but ISA considers three possible branches for a header: demanded with failure, demanded with success and not demanded.
• The end state of a sequence is a discrete variable with two possible values: success or failure. In PSA event trees the end state of a particular sequence takes only one of these values. The end state of ISA sequences, however, is a random variable where each value has an associated probability. Success and failure probabilities are obtained from the sequence uncertainty analysis. PSA end states can be seen as a particular case of ISA end states where the only possible probability values are 0 or 1.
• In PSA a human action is failed if it is not performed within a pre-specified time interval (available time). An action delayed beyond the available time is treated as a non performed action. In ISA methodology, human actions are events occurring at uncertain times. A delayed action is still a performed action even if it is not able to avoid a damage condition (limit exceedance). As a consequence, a PSA success sequence, when analysed in the ISA context, may contain a non-empty damage domain resulting from excessive delays of protective actions.
A high level description of the methodology is given by the flow diagram of Figure 1 which shows the main methodology modules (blocks) and the overall interactions among modules; see also Izquierdo (2008)7 for further more details:
Block A. The Sequence Generation module performs the simulation of reference DET, allowing to identify the candidate sequences with non trivial DD (success or damage for all conditions) to be analyzed in detail in the Path Analysis module (Block B). Block B. The Path Analysis module takes each sequence of interest from block A (Sequence Generation), performing multiple simulations with different values of uncertain parameters and/or time delays (human actions or stochastic phenomena). Each such simulation, called a path, can end either in a success or damage state. Those paths ending in damage state are said to belong to the DD of the sequence. Block C. The probability and delay times quantification module provides the necessary information to calculate in Block D (Risk Assessment) the probabilities and the contribution to DEF of each sequence of interest. Block D. The Risk Assessment module calculates the DEF by integrating on the DD region, obtained from Block B (Path Analysis module), the frequency density function obtained from the probability distributions evaluated in Block C (Probability module).
Figure 1. ISA methodology general diagram.

4
The analyses can be iterated to precisely define the DD border, also taking the complexity of the TH code into account to limit computing time. 2. Sequence generation module. DET simulation. The objective of Block A of ISA is to simulate the reference DET stemming from an initiating event. At present, the simulations of DET performed by coupling MAAP and DENDROS are performed in an automatic way12
. However, in the case of simulations with TRACE code the sequences are still simulated one by one. Coupling TRACE to SCAIS system, in order to be able to an automatic simulation of DET, is currently being developed by Indizen in collaboration with CSN.
2.1. Application to loss of CCWS sequences with SLOCA. In a first step, several loss of CCWS event trees corresponding to PSA studies of similar nuclear power plants (Westinghouse design with 3 loops) have been analyzed to build a generic loss of CCWS event tree in order to obtain the candidate headers for the DET analysis that is described in the next step of ISA methodology, see Figure 2. These headers could be modified depending on the results obtained from the DET simulations. From the results of this analysis the following sequence headers have been considered: SLOCA (Seal LOCA); H (High Pressure Safety Injection – HPSI with 1/2 trains available); A (Accumulator Safety Injection – ACCUM, 3/4 ACC available); L (Low Pressure Safety Injection – LPSI, 1/2 trains available) which includes the recirculation phase; and S (Primary cooling, at a rate of 55 Kelvin per hour, and depressurization by means of Steam Generators - SG). Additionally, one must be aware that effective intervention of headers H and L depends on the recovery of the CCW system. That is done by adding a recovery condition (R) to the headers H and L, being now HR and LR. All the simulations performed in this analysis include the hypothesis of reactor coolant pumps trip coincident with the loss of CCWS event and manual control of auxiliary feedwater system.
Figure 2. Generic event tree for loss of CCWS sequences
Sequences of the reference DET have been simulated with TRACE assuming that the CCW system is recovered right after the occurrence of the seal LOCA (which occurs at a fixed time, t=2500 s) and 12 Fernández, I. et al., 2010 “A Code for Simulation of Human Failure Events in Nuclear Power Plants: SIMPROC". Nuclear Engineering and Design (available online 30 April 2010).

5
that all the subsequent actions represented by event tree headers occur (if not failed) without delay from the time they are required. A set of 11 sequences (sequences DT) was generated, see Figure 3. A sample of simulation results is shown in Figure 4 and a summary of significant results for each sequence is given in Table 1, where the identification of each sequence is done by the concatenation of header status: a header in upper case means success when demanded and in lower case means failed when demanded. Results shown in Table 1 (TRACE simulations) indicate that headers have been always demanded at the same order. However, in previous simulations performed with MAAP some headers appeared in different orders, depending on the sequence.
Figure 3. Reference DET of Loss of CCWS with SLOCA (TRACE code).
The information obtained from the reference DET (DT sequences, without time uncertainty) allows to identify in which sequences with time/parameter uncertainty (U sequences in Figure 5) the final state is not always success or damage. Introducing time uncertainties an U sequence could be similar to different DT sequences depending on the values of the action delays. For example, delaying the CCWS recovery would make sequence U0 to change from DT0 to DT5 due to the recovery dependence of H and L. Table 2 shows how each U sequence is related with D sequences. From this comparison, it can be concluded that for five U sequences (U0, U1, U2, U3 and U4) the end state is not always success or damage. These sequences are identified in the generic dynamic event tree with uncertainty (GETU), see Figure 5, as sequences with “Damage Domain”. For those sequences, it is necessary to obtain their DD, i.e. the time/parameter region where the paths reach the damage condition. In these sequences the damage/success end state depends on:
• The starting time of the S header, which is a human action with a probability distribution given by the density function hS
• the CCWS-recovery time, which also has a probability density function h(t), t being time from the demand,
R
• the SLOCA time, which also has a probability density function h
(t), t being time from the initiating event (which is also the demand for recovery).
SLOCA
Each probability distribution is described further below. The damage domains are obtained in the Path Analysis Module (Block B).
(t), t being time from the initiating event .

6
Figure 4 PCT. Reference DET of Loss of CCWS with SLOCA (TRACE code).
Table 1. Sequence information obtained from the reference DET (TRACE code)
DET Sequence
Time of H header
Time of S header
Time of A header
Time of L header
Time of PCT PCT
DT0 (HSAL) 2619 3100 5773 7400, R 0 622 K
DT1 (HSAl) 2619 3100 5773 (7400, R) 99386 DAMAGE
DT2 (HSaL) 2619 3100 (5773) 7400, R 0 622 K
DT3 (HSal) 2619 3100 (5773) (7400, R) 94496 DAMAGE
DT4 (hSAL) (2619) 3100 5395 11152 0 622 K
DT5 (hSAl) (2619) 3100 5395 (11152) 86748 DAMAGE
DT6 (hSaL) (2619) 3100 (5395) 10450 0 622 K
DT7 (hSal) (2619) 3100 (5395) (10450) 61787 DAMAGE
DT8 (HsL) 2619 (3100) - 7400, R 0 622 K
DT9 (Hsl) 2619 (3100) - (7400, R) 21934 DAMAGE
DT10 (hs) (2619) (3100) - - 16631 DAMAGE R means “demanded in recirculation phase”, time value between brackets means demanded but failed
Table 2. Connection of sequences with time uncertainty and the sequences obtained in the DET
Sequence of GETU (with time uncertainty)
Reference sequences of the DET (without time uncertainty)
Final status of uncertain sequence
U0 (HRSALR) DT0/DT5/DT8/DT10 S/D/S/D ⇒ DD
U1 (HRSaLR) DT2/DT7/DT8/DT10 S/D/S/D ⇒ DD
U2 (HRsLR) DT8/DT10 S/D ⇒ DD
U3 (hSALR) DT4/DT5/DT10 S/D/D ⇒ DD
U4 (hSaLR) DT6/DT7/DT10 S/D/D ⇒ DD
U5 (hs) DT10 D ⇒ D
U6 (l) DT1/DT3/DT5/DT7/DT9 D/D/D/D/D⇒ D

7
Figure 5. Simplified GETU for loss of CCWS sequences
3. Path analysis module
The Path Analysis Module (Block B) receives the sequence and parameter information of all branches of DET from the Sequence Generation Module (Block A) and determines the DD of the candidate sequences. At present, the simulations performed by coupling MAAP and PATH-ANALYSIS are performed in an automatic way, whereas in the case of simulations with TRACE code the sequences are still simulated one by one.
Headers that could occur at uncertain times (mainly operator actions but also events with stochastic phenomenology) are defined as Non Deterministic Headers (NDH). In order to take into account this uncertainty a time sampling between the minimum time when the header event becomes possible and a maximum time (or the mission time, 24 hours) is performed for each NDH, see Figure 6. An example of how to obtain the DD of a sequence is shown in next section. If there are several non-deterministic headers and/or uncertain parameters, a multidimensional time/parameter sampling will be needed. Each sample gives rise to a path belonging to the sequence and the set of paths leading to a damage condition (i.e., limit exceedance) define the DD of the sequence.
Figure 6. Path analysis in a sequence with two NDH (headers A and B).
3.1 Application to loss of CCWS with SLOCA. Simulations performed with TRACE code
The objective of this analysis is to obtain the DD of each sequence. With the DD information it is possible to obtain the DEF of each sequence, which is carried out in the last stage of the ISA

8
methodology (Block D: Risk Assessment) and described in the next section. As an example, the results obtained for sequence U1 (HRSaLR) with TRACE code are shown in detail in Figure 7. The calculation process performed in sequence U1 is the following:
1. Failure of S header is assumed, with the result of no manual depressurization in secondary side. A transient (path) is simulated for each CCWS-recovery time considered. In these sequences, damage will arrive at a certain time t0, which sets the maximum time for the (manual) start of depressurization. Starting depressurization later than t0 time is not useful to avoid damage and no more analysis is required. This region corresponds to time points from the line of Previous Damage (PD) above the diagonal that is shown in Figure 7.
2. Failure of recovery event R is assumed, with the result of no SIS injection due to loss of equipment cooling. A path is simulated for each time of initiation of manual depressurization in secondary side. In these sequences, damage will arrive at certain time t1, which sets the maximum time for the recovery of CCWS. Recovering of CCWS later than time t1 is not useful to avoid damage and no more analysis is required. These time points lead to the line of PD below the diagonal.
3. A set of paths are simulated with different times for the beginning of depressurization and CCWS-recovery times, always below the PD line. Some of the paths exceed the damage condition (red diamond) while other paths do not reach it (blue circle).
4. The same process has to be done for different times of SLOCA occurrence. For the sake of clarification, this step has not been included in Figure 7.
Figure 7. Path analysis of sequence HRSaLR. Loss of CCWS with SLOCA. TRACE code

9
The analysis has been also applied subsequently to sequence U0 (HRSALR). The comparison of both analysis for U1 and U0 (HRSALR and HRSaLR) sequences shows that the availability of accumulators is quite important because it avoids the core damage in a large area, see Figure 8. In addition, Figure 8 also shows the damage domains for sequences U1 and U0 with a 10% of power uprate. It can be seen how the increase of power has modified slightly the shape of the DDs (indicated by the arrows) causing an increase in the area of the DDs.
Figure 8. DD of sequences HRSALR and HRSaLR. Loss of CCW (100% and 110%)
These results also illustrate other important difference between classical PSA and ISA methods: as long as several actions with uncertain time are present in a sequence, the available time for each action becomes a function of the previous occurrence times. This effect can be efficiently afforded in ISA while only fixed sequence specific available times are used in PSA. For example, in this analysis the available time for recovery of the CCW system is a function of the sequence (with/without ACC) but also of the starting time of depressurization action and the initial reactor power. 4. Probability calculation and risk assessment The DEF is obtained by integrating the equations of the Theory of Stimulated Dynamics (TSD) inside the DD of each sequence (further explanation on the equations involved in this module can be found in Izquierdo (2008)1. This integration module constitutes the Risk Assessment module (Block D). The equations of the TSD evaluate the frequency density of each path of a sequence and need several probabilistic data that can be obtained from several sources like pre-existing PSA’s and stochastic phenomena models (Block C). In the application of the TSD the concept of “stimulus” of a dynamic event plays a fundamental role. The stimulus of an event is a condition that makes the event possible. In the simple case of a protective action the stimulus is the demand of that action. In this analysis the TSD equations the stimuli of all the dynamic events are assumed deterministic, i.e., they can be directly derived from the simulation results. In addition, the probability distributions of NDH do not show mutual dependences and they do not depend on physical variables either. In other words, these probability distributions are known functions of the delay between the activation of the stimulus and the actual occurrence of the event.
10
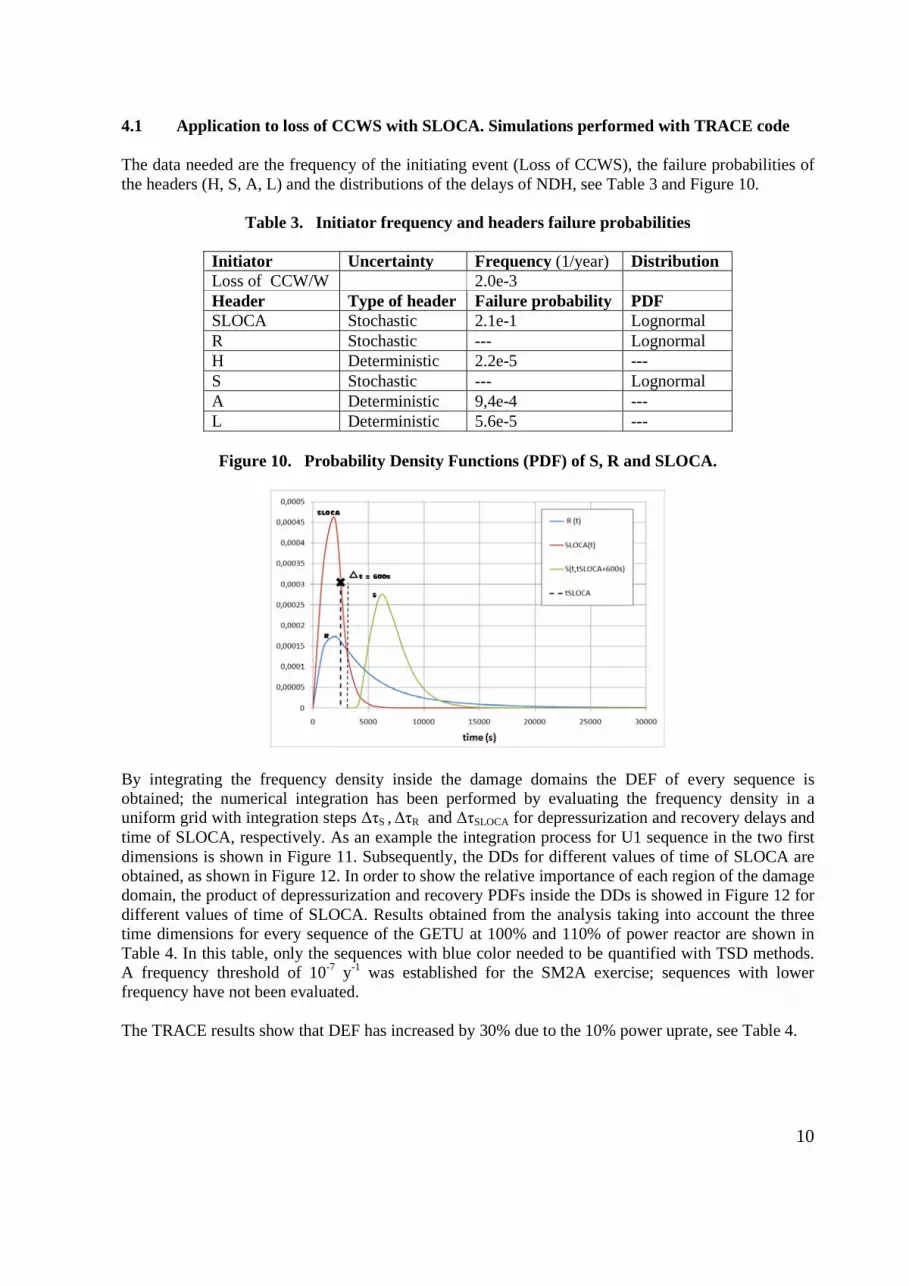
4.1 Application to loss of CCWS with SLOCA. Simulations performed with TRACE code The data needed are the frequency of the initiating event (Loss of CCWS), the failure probabilities of the headers (H, S, A, L) and the distributions of the delays of NDH, see Table 3 and Figure 10.
Table 3. Initiator frequency and headers failure probabilities
Initiator Uncertainty Frequency (1/year) Distribution Loss of CCW/W 2.0e-3 Header Type of header Failure probability PDF SLOCA Stochastic 2.1e-1 Lognormal R Stochastic --- Lognormal H Deterministic 2.2e-5 --- S Stochastic --- Lognormal A Deterministic 9,4e-4 --- L Deterministic 5.6e-5 ---
Figure 10. Probability Density Functions (PDF) of S, R and SLOCA.
By integrating the frequency density inside the damage domains the DEF of every sequence is obtained; the numerical integration has been performed by evaluating the frequency density in a uniform grid with integration steps ΔτS , ΔτR and ΔτSLOCA for depressurization and recovery delays and time of SLOCA, respectively. As an example the integration process for U1 sequence in the two first dimensions is shown in Figure 11. Subsequently, the DDs for different values of time of SLOCA are obtained, as shown in Figure 12. In order to show the relative importance of each region of the damage domain, the product of depressurization and recovery PDFs inside the DDs is showed in Figure 12 for different values of time of SLOCA. Results obtained from the analysis taking into account the three time dimensions for every sequence of the GETU at 100% and 110% of power reactor are shown in Table 4. In this table, only the sequences with blue color needed to be quantified with TSD methods. A frequency threshold of 10-7 y-1 was established for the SM2A exercise; sequences with lower frequency have not been evaluated. The TRACE results show that DEF has increased by 30% due to the 10% power uprate, see Table 4.

11
Figure 11. Example of the integration of PDF inside the DD of sequence S1: HRSaLR..
Figure 12. PDF inside the DD of sequences HRSALR and HRSaLR for different values of τSLOCA
Table 4. DEF of Loss of CCWS event tree (from the simulations performed with TRACE code).

12
Sequence of
GETU Sequence Frequency (1/year) 100%/110%
TRACE
DEF(1/year) 100%/110%
TRACE
Conditional exceedance probability 100%/110% TRACE
DEF (1/year) 100%/110%
MAAP UW (R and no SLOCA) 1.58e-03 0 0 0
U0 (HRSALR) 3.94e-04 7.83e-07 /10.03e-07 0.0020/0.0026 3.94e-07
/5.22e-07
U0/U1 (HRSLR) 0.89e-07 /0.93e-7 0.93e-07 /0.97e-07 1 15.39e-07
/15.03e-07
U1 (HRSaLR) 3.71e-07 0.04e-07 /0.06e-07 0.0108/0.0162 0.08e-07
/0.08e-07 U2 (HRsLR) 0 0 N/A 0 U3 (hSALR) 9.24e-9 < 1.0e-7 -- -- -- U4 (hSaLR) 9.24e-12 < 1.0e-7 -- -- -- U5 (hs) 0 0 N/A 0 U6 (l) 0.22e-7 0.22e-7 1 0.22E-7
Total 2.0e-3 9.02e-7 /11.82e-7 0.00045/0.00059 19.63e-7
/20.55e-7 ∆DEF 2.80e-7 (31%) 0.92-7 (5%) Results included in table 4 show how the sequence frequency is distributed between success and damage so that almost any sequence can contribute to the DEF. There is also a non-null probability of sequences with non demanded accumulators; this emphasizes the need to distinguish among the lack of actuation of a safety system due to lack of demand or due to system failure. Table 4 introduces also a comparison between results from MAAP and TRACE codes, suggesting that MAAP leads to a more conservative results (DEFMAAP>DEFTRACE). 5. Conclusions The ISA application presented in this paper has showed the importance of Path Analysis and Risk Assessment. In PSA each sequence has a well defined final state, success or damage. However, this analysis has pointed out that it is possible to have for the same sequence a damage probability (PD) and a success probability (PS).
This paper shows an application of the ISA methodology for the analysis of Loss of Component Cooling Water System with SLOCA sequences using two different codes, MAAP and TRACE. Although it cannot be stated as a general conclusion, comparison of both analyses suggests that the results from MAAP code tend to be more conservative than those from TRACE code.
In general, the results have shown the capability and necessity of the ISA-like methodology in order to properly accounting for uncertainties in the time delay of operator response and other stochastic events along with usual parametric uncertainties in the evaluation of the safety in a NPP.
ACKNOWLEDGMENTS This work is funded by Consejo de Seguridad Nuclear (SM2A project)