SYNERGY - Lovato Electric
51
SYNERGY Supervision and energy management software INSTRUCTION MANUAL I387GB03_20 31100251
-
Upload
khangminh22 -
Category
Documents
-
view
0 -
download
0
Transcript of SYNERGY - Lovato Electric

SYNERGY Supervision and energy management software
INSTRUCTION MANUAL
I387
GB
03_2
0
311
0025
1

2 I387GB03_20.docx
INDEX 1 INTRODUCTION ....................................................................................................................... 4
2 HARDWARE AND SOFTWARE REQUIREMENTS ................................................................. 4
3 SETUP ....................................................................................................................................... 4
4 SYNERGY LOGIN AND USERS ............................................................................................... 6
4.1 Users .................................................................................................................................. 6 4.2 Browsing the software and menu bar ................................................................................. 7 4.3 Users management ............................................................................................................ 7
5 HOME PAGE ............................................................................................................................. 8
6 CHANNEL ................................................................................................................................. 9
6.1 Channel creation ( Channel→New) .............................................................................. 10 6.1.1 Creation of a client type ethernet channel ............................................................................... 11 6.1.2 Creation of a server type ethernet channel .............................................................................. 11 6.1.3 Creation of a serial channel .................................................................................................... 12 6.1.4 Creation of a modem channel .................................................................................................. 12
6.2 Showing and modifying channels ( Channel→Show) ................................................... 13 6.3 Modem status panel ( Channel→Modem status) ......................................................... 14
7 DEVICE ................................................................................................................................... 15
7.1 Creation of a device ( Device→New) ............................................................................ 15 7.2 Showing and modifying devices ( Device→Show) ....................................................... 15
8 PAGE ....................................................................................................................................... 17
8.1 Creation of a page ( Page→New) ................................................................................. 17 8.2 Showing and modifying pages ( Page→Show) ............................................................. 17
8.3 Configuring the indicators in the page ( Page→Show→ ) ........................................ 18
9 DATA LOG .............................................................................................................................. 20
9.1 Creation of a data log ( Data log→New) ....................................................................... 20 9.2 Showing and modifying a data log ( Datalog→Show) ................................................... 22 9.3 Live data visualisation ...................................................................................................... 22 9.4 Historic data visualisation ................................................................................................. 23 9.5 Calculated field ................................................................................................................. 23
10 CHART ................................................................................................................................. 24
10.1 Creation of a chart ( Chart→New) ................................................................................ 24 10.2 Showing and modifying a chart ( Chart→Show) ........................................................... 24 10.3 Live data visualisation ...................................................................................................... 25 10.4 Historic data visualisation ................................................................................................. 26
11 ALARM ................................................................................................................................ 27
11.1 Creation of an alarm ( Alarm→New) ............................................................................. 27 11.2 Showing and modifying an alarm ( Alarm→Show) ....................................................... 28 11.3 Alarm event visualisation ( Alarm→Measures alarm list) .............................................. 28 11.4 Communication alarm visualisation ( Alarm→Communication alarm list) .................... 29
12 REPORT .............................................................................................................................. 30
12.1 Introduction ....................................................................................................................... 30 12.2 Creation of ranges ( Report→New range) .................................................................... 30

3 I387GB03_20.docx
12.3 Showing and modifying ranges ( Report→Show range) ............................................... 33 12.4 Calendar of ranges ( Report→Range calendar) ........................................................... 33 12.5 Creation of tables ( Report→New table) ....................................................................... 34 12.6 Showing and modifying tables ( Report→Show table) .................................................. 36
13 UTILITIES ............................................................................................................................ 40
13.1 Licence ............................................................................................................................. 40 13.2 Server ............................................................................................................................... 41
13.2.1 Server ....................................................................................................................................... 41 13.2.2 Server settings ......................................................................................................................... 42 13.2.3 Mail client settings (SMTP server settings) ............................................................................. 42 13.2.4 FTP server settings .................................................................................................................. 42
13.3 Export definitions .............................................................................................................. 43 13.4 Import definitions .............................................................................................................. 43 13.5 Import drivers .................................................................................................................... 43 13.6 Import scenarios ............................................................................................................... 43 13.7 Import language ................................................................................................................ 43 13.8 Import theme .................................................................................................................... 44 13.9 Import logo ........................................................................................................................ 44 13.10 System log .................................................................................................................... 44 13.11 System diagnostic ......................................................................................................... 44 13.12 Web api ......................................................................................................................... 44 13.13 Third party devices ........................................................................................................ 49
13.13.1 Device model creation ......................................................................................................... 50 13.13.2 Management of the measure associated with the model ...................................................... 50 13.13.3 Export/Import of models ...................................................................................................... 51
14 USAGE WITH EXC GL A01 ................................................................................................ 51
14.1 Channels, devices, scenarios ........................................................................................... 51 14.2 Charts, alarms, reports, pages ......................................................................................... 51

4 I387GB03_20.docx
1 Introduction Synergy is a software for control and supervision of Lovato Electric products equipped with communication capabilities via serial ports, ethernet or modem. Supported protocols are Modbus RTU, Modbus ASCII and Modbus TCP. For the updated list of Lovato Electric products supported by Synergy please visit www.lovatoelectric.com at the section dedicated to the software. Starting from V9, Synergy is able to receive the data collections from the gateway data logger EXC GL A01. The software is able to:
manage multiple communication channels at the same time; pair the devices to the various channels; collect data from all devices and store them in a database; display the collected data in graphical pages or tables; generate graphs and alarms from the contents of the data tables; allow access to the devices and their data according to the rights of the different users.
Synergy is a client-server application based on MS SQL Express. It runs the web server MS IIS Express to manage the user interface. This manual describes the functionalities available for the users updated to version 9. If some features mentioned in this manual is not present in the software, proceed with the upgrade to the latest version.
2 Hardware and software requirements PC/SERVER HARDWARE REQUIREMENTS
Dual core CPU, 2GHz; 4GB RAM; hard disk 60GB; SVGA 1024x768, 16bit colours; ethernet RJ45 LAN board; communication port number and type according to the application: ethernet, serial RS485, serial RS232 or
modem types. Synergy is an application based on services (SQL and web) for which we do not recommend the use of laptops due to the limited hardware and software performance. SUPPORTED OPERATING SYSTEMS AND BROWSERS
Windows 7, Windows 8.1 Pro, Windows 10 Pro, Windows Server 2012, Windows Server 2012(R2) std, Windows Server 2016, Windows Server 2019. Both the 32bit and 64bit versions are supported. Server systems must have framework .NET 3.5 activated. Update to latest official Microsoft release of the installed operating system. Note: according to system configuration, the setup procedure could require the connection to internet and access to Windows Update services.
MS IExplorer, Google Chrome, Mozilla FireFox (latest versions recommended for each browser).
3 Setup It is recommended to faithfully follow the steps below. In case assistance is needed during the installation, please contact our Technical Support. In order to install the software properly, an account with the privileges of the "true" administrator of the system (users of user or poweruser type are not allowed) is required. During installation of the software, anti-virus and firewall should be temporarily disabled.

5 I387GB03_20.docx
If the wireless network is supposed to be used while Synergy runs, please enable the wireless lan board and connect it to an available access point before installing. To run the setup for Synergy installation, log in the PC/Server as an administrator user and click with the mouse right button on the setup.exe file and choose "Run as administrator". The setup procedure starts to collect the system information about the machine on which the installation is being run (follow the instructions shown on screen). Only if the minimum system requirements are satisfied the setup procedure proceeds with the activation code generation.
Not satisfied minimum system requirements Satisfied minimum system requirements
If a licence file is already available, then the process can go on; if not, click on “Create summary file” push button to get the “summary.txt” file to be sent to LOVATO Electric in order to get a valid licence.xml file. With a valid licence file, the installation can be performed by loading the file when required by the procedure. The setup proceeds automatically to install Synergy and all the necessary prerequisites that vary according to the operating system and the components already installed on the machine. The whole process may take several minutes. A window lists the operations which are carried out. During the installation process, you may be asked for rebooting the machine. Failure to reboot during the setup could cause an improper installation. The onscreen instructions should also be followed to complete the job successfully. After installation, Synergy can be accessed opening a browser and typing in the address bar:
http://localhost:9876/ if opening the browser on the same machine where the installation took place; http://<HOST>:9876/ if opening the browser on another PC on the same network, where <host> means the IP
address assigned to the machine on which Synergy is located.
If a certification of authority is available for the server, the secured version of http protocol can be used by accessing the server at port 9875:

6 I387GB03_20.docx
https://localhost:9875/ if opening the browser on the same machine where the installation took place; https://<HOST>:9875/ if opening the browser on another PC on the same network, where <host> means the IP
address assigned to the machine on which Synergy is located.
The access ports can be changed by the “Configurator” tool installed together with Synergy. In case of need to remove Synergy, go through Windows Control Panel.
4 Synergy login and users Synergy access requires authentication.
4.1 Users 3 types of users are defined.
Administrator. One of these users is already predefined after setup: user: admin password: admin
After the first login, it is recommended to change the password. The "Administrator" type user has no limit of action. It defines all other users and for each of them decides on which devices, pages and datalogs it can operate. For example, it is the company IT manager.
Poweruser. The "Poweruser" type user can not perform operations on the channels of communication, but it can act without restrictions on all devices assigned to it by the administrator. Typically it is the manager of energy services in the company.
User. The "User" type user can access information about the devices assigned to it by the administrator, but it is not allowed to make changes to the pages, data tables, graphs and alarms. On the other side, it can create, read, update and delete the alarms based on data logs. For example, it is the manager of a department in the company.

7 I387GB03_20.docx
4.2 Browsing the software and menu bar Once logged in Synergy with one of the credentials, the upper part of the page is always available to the user and contains everything needed to navigate through the functions of the software.
There are three graphical icons to click on:
to get to Synergy home page (see section 5); to get to the page identified as main (see section 8);
to open the contextual help; to log out Synergy to end the session or to change the user (closing the browser will carry to the same result).
Below the graphical icons the message area is available to show information for the user (open alarms, elapsed license, …). The menu bar contains links to all the functions to which the current user has the rights. Along the manual the symbol
will appear followed by a text of the menu bar to be clicked to access a function.
4.3 Users management “Administrator” type user can create ( User→New), manage and modify ( User→Show) all the other users of different type, selecting the role. The creation of a user involves the filling of the following fields.
User name and password are used to log in, while the name and e-mail fields are identifiers within Synergy. A language among those available can be assigned to the user. The Web Api option enables the user to access the data logs in the database by calling the web service (see the dedicated section in this manual).

8 I387GB03_20.docx
If the user is not an "administrator" it should be given the devices, pages and tables which it can access to. Thus, after saving the new user, enter the modification option by clicking next to the user to be modified, accessing the following screen.
Opening the User - Devices tab, select the devices for which the user is given access rights from the list on left. The same procedure must be followed for data logs, pages and reports. Logging in with his credentials, the user sees only the items selected by the administrator at this stage. References to unauthorized items are not displayed.
5 Home page The home page of the web application is a great starting point to monitor the status of the network and to begin the usage of the basic functions, thanks to the buttons that lead quickly to the required function.
In the orange panel, the channel, the device and the software and driver release status can be checked:

9 I387GB03_20.docx
devices: the number of set devices is indicated, together with how many of them are disabled or in communication error (the number indicates how many devices have the “red light”, the meaning of which is explained below);
channels: the number of set channels is indicated, together with how many of them are disabled or in communication error, that is with all the connected devices with communication error (the number indicates how many channels have the “red light”, the meaning of which is explained below);
gateway – datalogger: the number of configured EXCGLA01 is indicated together with how many of them have not been in contact with the software from at least 24 hours; by clicking on the link, details are shown and the the mailing list to which communicate the gateway data logger status can be set;
software version - latest version of the software - URL of the page to download the latest version available; driver version - latest version of the driver - URL of the page to download the latest version of the drivers.
The latest version available for download and URL are displayed only in case the software and drivers are not updated and Synergy has available an internet connection. In the alarm box the list of the last 10 open alarm events is presented.
Finally, at the bottom of the page there are buttons for quick access to pages and graphics identified as favourites (see below how to create pages and graphics).
6 Channel A channel identifies the means by which the server communicates with the devices in the field, such as a serial or ethernet connection. Synergy manages multiple channels, whether they are of the same type or different. The communication channel can be of 3 types:
ethernet outgoing (Synergy is TCP client, so it opens the initial connection with the channel which must be
assigned with static IP address);

10 I387GB03_20.docx
incoming (Synergy is TCP server, assigned with static IP, and therefore the devices of the channel will open the initial connection);
Which opens the connection (TCP client) can have static or dynamic IP. Serial (RS232, RS485, virtual COM); Modem (dial-up).
The channel management is reserved to “administrator” type users.
6.1 Channel creation ( Channel→New) At the creation of a new channel the administrator is prompted to select the type, thus determining the necessary parameters to be included in following steps.
11 I387GB03_20.docx
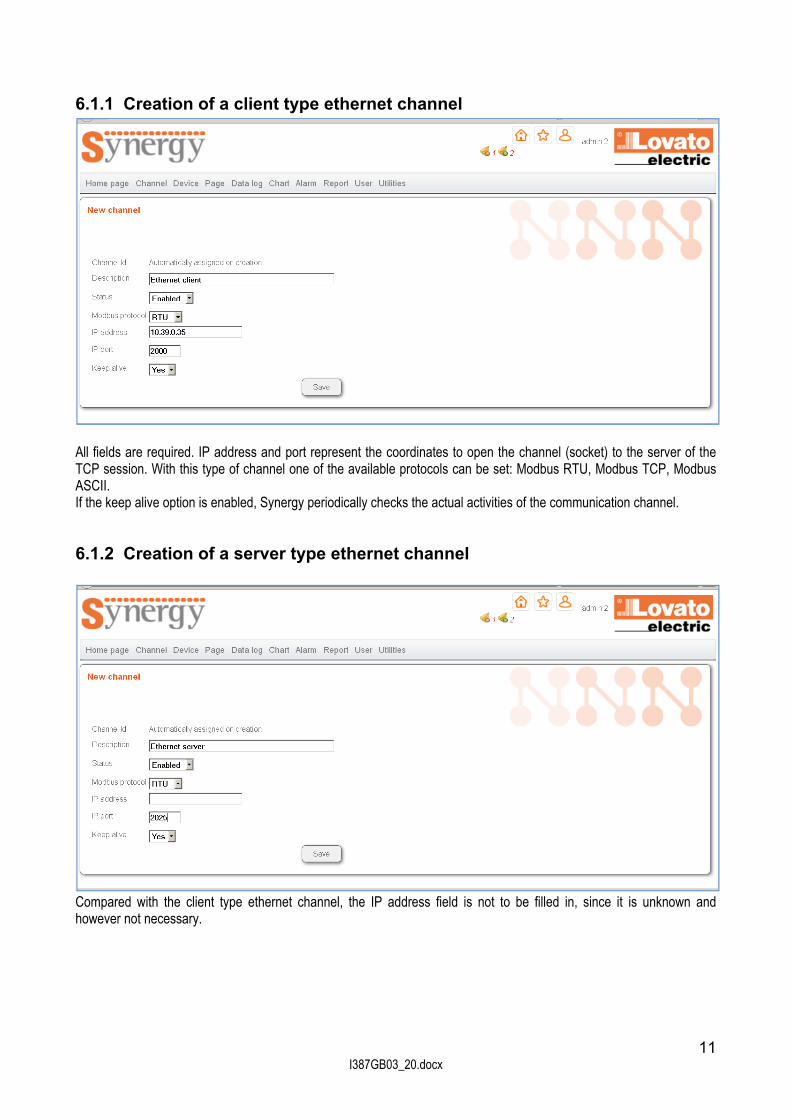
6.1.1 Creation of a client type ethernet channel
All fields are required. IP address and port represent the coordinates to open the channel (socket) to the server of the TCP session. With this type of channel one of the available protocols can be set: Modbus RTU, Modbus TCP, Modbus ASCII. If the keep alive option is enabled, Synergy periodically checks the actual activities of the communication channel.
6.1.2 Creation of a server type ethernet channel
Compared with the client type ethernet channel, the IP address field is not to be filled in, since it is unknown and however not necessary.

12 I387GB03_20.docx
6.1.3 Creation of a serial channel
All fields are required. With this type of channel Modbus TCP is not supported. If the keep alive option is enabled, Synergy periodically checks the actual activities of the communication channel.
6.1.4 Creation of a modem channel
The phone number field contains the phone number of the modem connected to the device to call. The serial parameters refer to the connection between the PC on which Synergy is installed and the modem connected to the PC. An initialisation string with AT commands (default ATE0;AT&D0) can be entered in order to enable the modem to work properly. The only selectable communication protocol is Modbus ASCII. The keep-alive function can be activated, paying attention because every modem call is subject to costs related to the telephone operator. For this reason, the keep alive message is sent to the channel with a frequency lower than the other channel types.

13 I387GB03_20.docx
6.2 Showing and modifying channels ( Channel→Show) The channels are listed along with the relevant parameters in order to get a quick summary of the network architecture.
The channel settings can be modified by selecting it through the check-box on the left side and by clicking on . The selection can identify on which channels the enable, disable, delete and copy operations can be performed by clicking on the dedicated push button. The delete operation of a channel is allowed only if all the devices linked to it have been previously deleted. If the operation fails, a window appears and shows all the dependencies which are blocking it. Sort all the dependencies out by deleting them before going on. A traffic lights for each channel indicates the communication status. For ethernet or serial type channels:
the channel is disabled; all devices on the channel are on line or disabled; the light is green in case all devices on the channel are
disable as well; all devices on the channel are off line or disabled; some of the devices on the channel are off line.
For modem type channels:
outgoing call not active; outgoing call active.
If the keep alive function is enabled, the quantity of exchanged data per second (kB/s) is calculated. The information can be used to estimate the necessary bandwidth to avoid bottle necks during the communication between Synergy and the devices on the channel or to correctly make the dimensioning of a data transmission agreement based on exchanged data (as for GPRS connection, for example). By clicking on icon, all the devices assigned to the channel are listed. The channels are monitored during the operations in order to keep under control the global performance. The statistics
are available by clicking on :

14 I387GB03_20.docx
Token per second: indication of how many activities are open in Synergy for that channel; Channel usage: indication of channel saturation; Queue execution time: indication of how much time Synergy takes to execute all the cyclic activities for that
channel. If the channel usage approaches to 100% or the queue execution time is close to 5 seconds, modification of the configuration should be done in order to reduce the number of the device associated to the channel or to increase the sampling time for the data required to the devices.
6.3 Modem status panel ( Channel→Modem status) In case modem type channels are present, Synergy logs the phone calls identifying the beginning and the end of them, distinguishing when the phone call is regularly closed because no longer necessary (connection closed by Synergy) and when the phone call is interrupted because of communication problems.

15 I387GB03_20.docx
7 Device The devices are the products in the field which Synergy makes data exchange with, using the modbus protocol. For the updated list of supported Lovato Electric products consult the website www.lovatoelectric.com at the section dedicated to software.
7.1 Creation of a device ( Device→New) In order to create a device, all the information required must be filled in.
Description: free text that lets the users recognize the device in Synergy; model: type of device selection; channel: channel name on which the device is located; status: the device must be enabled to work; licensed: option to assign one of the available licenses to the device; modbus node address: modbus node by which the device is identified during the communication; on the same
channel the node number must be unique, while it can be repeated among different channels; communication alarm: if this function is enabled, in case of communication problems an alarm is generated; to send: option to send the communication alarm via mail or to FTP server; mail receivers: list of mail address receiving the communication alarm notification; the addresses must be
separated by comma. Synergy will access the device data only if the device is enabled and licensed. It means it is selected as one of the devices using the available licences by “licensed” property (see the section about licences).
The ratings and the full-scale values for some measurements can be entered as attributes of the device, so that graphical indicators are automatically sized in the most appropriate way when showing these quantities. The rated and full-scale values included in the creation mask of the device can be overridden if necessary at the time of the creation of an indicator or a chart.
7.2 Showing and modifying devices ( Device→Show) In the list of devices, in addition to the summary of the main configuration parameters, there is an indicator associated with each device to indicate the status of communication with Synergy:

16 I387GB03_20.docx
device on line; communication problem; unknown status because EXCGLA01 gateway to which the device is connected is not communicating; disabled communication (i.e.the device or the channel is not enabled).
The characteristics of the device can be changed by selecting it and accessing the configuration via the icon . A selection box is present for each device, identifying for which devices the enable, disable, delete and copy operations can be performed by clicking on the dedicated push button. The delete operation of a device is allowed only if all the objects (pages, data logs, etc) linked to it have been previously deleted. If the operation fails, a window appears and shows all the dependencies which are blocking it. Sort all the dependencies out by deleting them before going on. Starting from this page setup menu icons and event (stored in the device memory) reading are available.
Parameter menu access: the menu list looks like the one of the device.
Clicking on the menu title, if there are submenus, they are shown. When the last level of submenus is expanded, clicking on them the relevant parameters of the selected submenu are read from the device and shown on screen. Click on icon to modify one of the parameter, change the value to desired and confirm it with icon or cancel the operation with icon .
The parameters with value different from default have the value highlighted with orange color (as P01.02 in figure); the modified parameters, but not yet sent to device, have both description and value highlighted in orange color (as P01.01 in figure). The following functions are available as well: send parameters to the device: all the parameters belonging to the current menu are sent; execute the
function before leaving the menu if some of the parameters have been changed; save parameters’ file on HD: a file with a copy of the parameters programmed on the device is created; upload parameters’ from HD: load to the device the parameters saved in a file saved before.

17 I387GB03_20.docx
Access to parameters relevant to EXP1015: only for devices supporting GSM/GPRS EXP1015 module, specific parameters are available to set up the modem communication.
Event list: only for devices with built-in memory for event recording, a copy of event memory can be retrieved on
the screen through this function.
If the device and the channel on which it is are not both enabled, some icons could not be present. If Synergy recognises a device model different from the one set, in the “Model” field both the configured and the detected device models are indicated. Due to this discrepancy, Synergy does not let parameter menu access hiding the relevant icons and the supervision is stopped, in order to avoid to work with data which are not consistent. The devices are cyclically polled by Synergy. If a device does not answer to the query, the software repeats twice the same message. If the device does not answer for three times, Synergy considers the behaviour as inability to exchange data, caused by network problems or by a switched off device. As a consequence, in order to optimise the time division on channels, the device is temporarily suspended for three minutes, after which it is again included in the polling sequence. During the suspension period of time, a further icon is available:
click on this icon to force the re-introduction of the device before three minutes are elapsed. In addition, it is always possible to run a communication test with the device by clicking on .
8 Page The graphic page is the most intuitive way to read the measurements from Lovato Electric devices in the field connected with Synergy. The pages are fully configurable and can therefore be constructed by the user and adapted to its needs.
8.1 Creation of a page ( Page→New) At this step, a new page is added to the list of those available. The user simply needs to provide a description that identifies it and decides on the visibility through the "page type" property:
home page link: in the home page, a button with the name of the page is created, being a direct link to the page itself;
home page link - main: it is a favourite page, but the button is better highlighted with orange colour; the icon in the upper right corner is a direct link as well; the main page is only one, if there is already one it loses its
role as the main and becomes favourite. standard: links are not created, the only way to access this type of page is to go through the list (
Page→Show).
8.2 Showing and modifying pages ( Page→Show) In the list of existing pages the following functions are available:
selection of the page;
page modification: change the page properties set during the creation;
indicator (in the page) configuration (see next section);
visualisation of indicators and measurements collected from the devices;
the page is cloned;
the page is deleted.

18 I387GB03_20.docx
8.3 Configuring the indicators in the page ( Page→Show→ ) A new page is completely blank. The indicators must be added by selecting them from the available list. Open the selection panel by clicking on ; the panel groups the indicators, so select the group of interest and then the desired indicator.
Once the type of indicator has been selected the following functions can be performed:
configuration of the indicator: select the indicator on the page and press the button to modify its properties; copy of the indicator: select the indicator on the page and press the button to copy; elimination of the indicator: select the indicator on the page and press the button to delete it;
The three functions just described are available by clicking on the indicator with the mouse right button as well, together with resizing and alignament function, For the alignament functions, select at least two indicators.
cancel: abort the last modification; access to the page just edited to verify the functionality. In the live page, if the logged-in user is administrator or
poweruser, the icon is available to quickly go back to the editor.
activate a grid to help the indicators alignment. To select an indicator, click on it with the mouse left button: the indicator becomes yellow. To move an indicator, select it and hold down the mouse left button, then move it to the desired position. Indicators showing the symbol in the lower right corner can be resized by directly using the mouse. When an indicator is to be configured, clicking on the icon , a window appears which is valid for all indicators: not all properties are available for all indicators. If a property is not available, the relative modifying area is grey.

19 I387GB03_20.docx
The live pages publish data which are not older than 2.5 minutes and cancel the value when the time is elapsed to show that it has not been updated. In any case if the value is to be kept despite on the effective time of reading, the property “Indicator without expiration” should be enabled. An example of page follows to show the set of available indicators.
20 I387GB03_20.docx
9 Data log A data log is a data table consisting of a set of measurements associated with the devices in the field, collected at regular time intervals. Synergy can manage multiple data log simultaneously.
9.1 Creation of a data log ( Data log→New) The creation of a new data log requires the user to fill in the following fields:
description: free text that identifies the data log; status: to enable and disable data collection; in case the “triggered” option is selected, the data log will be
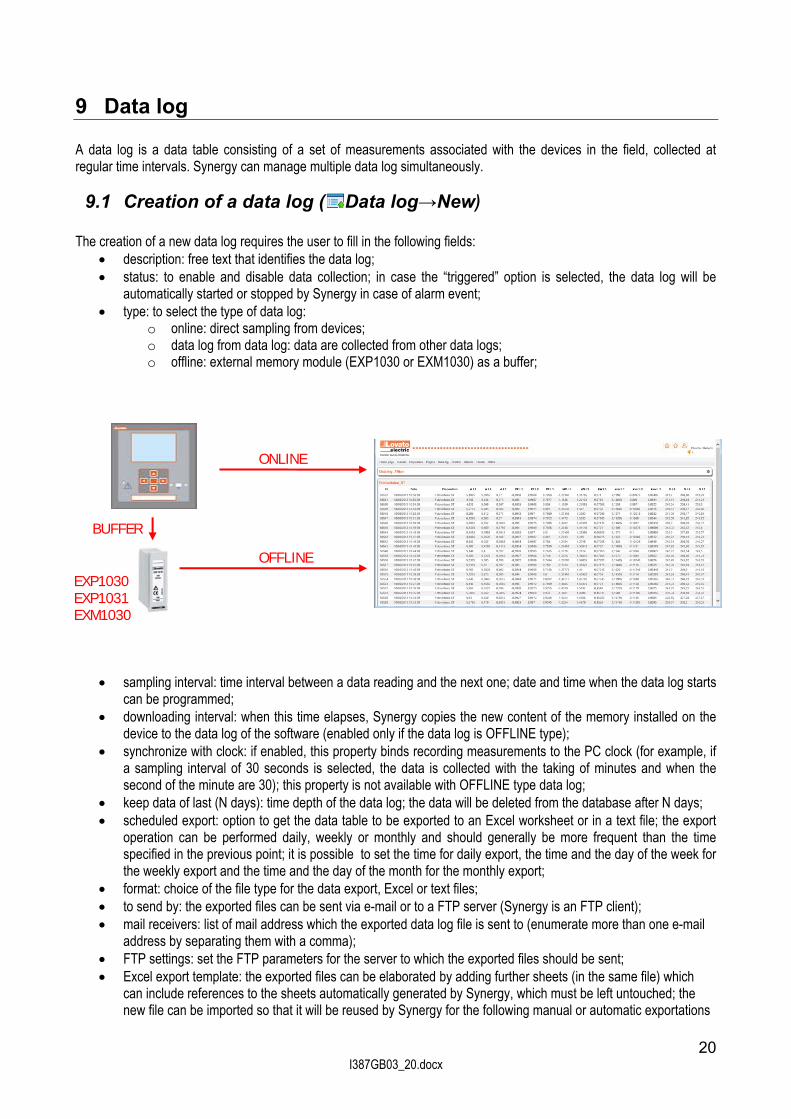
automatically started or stopped by Synergy in case of alarm event; type: to select the type of data log:
o online: direct sampling from devices; o data log from data log: data are collected from other data logs; o offline: external memory module (EXP1030 or EXM1030) as a buffer;
sampling interval: time interval between a data reading and the next one; date and time when the data log starts can be programmed;
downloading interval: when this time elapses, Synergy copies the new content of the memory installed on the device to the data log of the software (enabled only if the data log is OFFLINE type);
synchronize with clock: if enabled, this property binds recording measurements to the PC clock (for example, if a sampling interval of 30 seconds is selected, the data is collected with the taking of minutes and when the second of the minute are 30); this property is not available with OFFLINE type data log;
keep data of last (N days): time depth of the data log; the data will be deleted from the database after N days; scheduled export: option to get the data table to be exported to an Excel worksheet or in a text file; the export
operation can be performed daily, weekly or monthly and should generally be more frequent than the time specified in the previous point; it is possible to set the time for daily export, the time and the day of the week for the weekly export and the time and the day of the month for the monthly export;
format: choice of the file type for the data export, Excel or text files; to send by: the exported files can be sent via e-mail or to a FTP server (Synergy is an FTP client); mail receivers: list of mail address which the exported data log file is sent to (enumerate more than one e-mail
address by separating them with a comma); FTP settings: set the FTP parameters for the server to which the exported files should be sent; Excel export template: the exported files can be elaborated by adding further sheets (in the same file) which
can include references to the sheets automatically generated by Synergy, which must be left untouched; the new file can be imported so that it will be reused by Synergy for the following manual or automatic exportations
ONLINE
OFFLINE
BUFFER
EXP1030 EXP1031 EXM1030

21 I387GB03_20.docx
with fresh data in the sheets managed by Synergy and with the information kept in the added sheets created by the user (references and all the other elements like titles, images, etc...).
Once the datalog is defined and saved, devices and measurements are to be added. Start to show the datalog ( Datalog→Show), then press the button . The page that appears lets the user define the devices and measurements included in the data collection.
The list of measures contains only the quantities relevant to the selected devices and it can be furthermore filtered according to the units to simplify the searching operation. Select the measures of interest before adding them by clicking on “Add” push button. Every measures in the data log, clicking on icon, can have the “delta” calculation activated as difference between the current value and the previous one. Finally, a dedicated description can be associated to each measure to be used as name. Furthermore new data which are not read from devices can be added to the data collection. This kind of data is controlled by the “data log in” indicator placed in a live web page. For each record inserted into the data log, the current value of that indicator is stored. In order to program this data type, access the “Data log – Live data in” panel.
The new quantity can be characterised by a unit of measure and by the scalable property which causes the use of “k”, “M”, “G” scale

22 I387GB03_20.docx
factor for the unit of measure when the quantity is visualized. Once created, the new quantity can be added and managed in Synergy as done with all the other measures in a data log.
9.2 Showing and modifying a data log ( Datalog→Show) Opening the datalog list, the following functions are available:
selection of data logs;
datalog modification (to define the devices and the measurements included in the data collection);
selection of device-measures pairs which are visible in the data log;
live data visualisation (last readings);
search and visualisation of historic data;
addition of a calculated field to the datalog (data log “on line” type only);
showing and modifying a calculated field in the datalog (data log “on line” type only).
the data log is cloned;
the data log is deleted; the delete operation of a data log is allowed only if all the objects (alarms, reports, etc) linked to it have been previously deleted; if the operation fails, a window appears and shows all the dependencies which are blocking it; sort all the dependencies out by deleting them before going on.
9.3 Live data visualisation This page displays the last reading defined for this datalog. The page reloads the data automatically and periodically. The data can be displayed grouped by the device or timestamp (default). It is also possible to select of which devices belonging to the datalog the user wants to read data.

23 I387GB03_20.docx
9.4 Historic data visualisation On this page the data collected so far with this datalog can be searched and viewed, setting the search criteria to filter the result. The data can be displayed grouped by the device or timestamp (default). It is also possible to select of which devices belonging to the datalog the user wants to read data. Data can be exported to Excel (.xlsx) by pressing the button "Export to XLS".
9.5 Calculated field The readings present in the datalog can be used to generate others, introducing a calculated field. To add a measurements in the formula of the calculated field, select the device, the measurement and press the "Add to the formula" button. To add the available operations, boolean operators or aggregation (MAX, MIN) and parentheses simply click on the corresponding button. To add numeric constants the keyboard can be directly used. Once the formula is ready, it is possible to verify the syntax by pressing the "Verify Formula" button.
The aggregation formula are according to the following structure: MAX([DeviceN].[MeasurementJ],[DeviceN].[MeasurementK],[DeviceM].[MeasurementJ]) MIN([DeviceN].[MeasurementJ],[DeviceN].[MeasurementK],[DeviceM].[MeasurementJ])

24 I387GB03_20.docx
To divide the fields in the aggregation formula, add a separator clicking on “Field separator” button. The aggregation function must terminate with the close bracket “)”.
10 Chart
10.1 Creation of a chart ( Chart→New)
The source data of a chart are the data collected from a specific datalog to be selected when creating the chart. The user needs to decide on the visibility through the "chart type" property:
Home page link: in the home page, a button with the name of the chart is created, being a direct link to the chart itself;
Home page link - Main: it is a favourite chart, but the button is better highlighted with orange colour; the main chart is only one, if there is already one it loses its role as the main and becomes favourite.
Standard: links are not created, the only way to access this type of chart is to go through the list ( Chart→Show).
Once the chart is defined and saved, it is possible to add the measurements to display. Show the chart (Chart→Show) and press the button . The page that appears lets the user define the measurements included in the chart and configure the appearance.
10.2 Showing and modifying a chart ( Chart→Show) In the chart list the following functions are available:
chart selection;
chart modification;
live data visualisation;
historic data search and visualisation;
the chart is cloned;
the chart is deleted.
Chart type (column, point, line)
ColourZ-order with respect to
the others
Visibility in the indicators of graphical pages
Full scale

25 I387GB03_20.docx
10.3 Live data visualisation What follows refers to Synergy from release 5. This page displays the chart based on the latest readings. The page reloads the data automatically and periodically. The chart can be exported as an image by pressing the "Export chart as image" button. The image is prepared: right-click the mouse pushbutton and select “save image as” to create the image file on your PC, or left-click to cancel the operation.
The chart can show more than one vertical scale. A new vertical scale is generated for each different vertical range (that is when at least one of MIN or MAX fullscale values are different) and for each unit of measure. For example, if on a chart the following must be plotted:
1. Equivalent active power – plant 1, scale 0…100 kW 2. Equivalent active power – plant 2, scale 0…100 kW 3. Equivalent reactive power – plant 1, scale 0…100 kvar 4. Equivalent reactive power – plant 2, scale 0…50 kvar
three scales are generated: scale 1, 0…100kW, reference for track 1 and 2 which share the unit of measure (kW) and range (0…100); scale 2, 0…100kvar, reference for track 3, which shares the range (0…100) with track 1 and 2, but the unit of
measure is different (kvar); scale 3, 0…50kvar, reference for track 4, which shares the unit (kvar) with track 3, but the range is different
(0…50). Every scale is represented with the color of the track. If the scale is shared, the scale color is inherited by the track with the highest value for the “Z-order” property (it means foreground level). Some more options are available:
Last hours/minutes/seconds: field where the user can set how much time in the past must be shown starting from the moment of visualisation.
Fixed scale: with the option selected, the chart is shown with the vertical ranges indicated during the set of tracks, otherwise the scales are dimensioned according to the track values to better use the chart height.
Passing with the mouse pointer on a track, a tooltip is shown with value, track name and date-time of reference.

26 I387GB03_20.docx
10.4 Historic data visualisation On this page a chart displaying data referred to a time window can be viewed. The graph can be exported as an image by pressing the "Export chart as image" button. All the other functions are the same described for live data visualisation. Moreover, it is possible to zoom in along the time axis, going to the beginning of the time range of interest with the mouse pointer and then keeping down the left button up to the end of the time range itself. The chart can be made by a single line or by more than one. In the latter case, together with the global chart, a graph dedicated to each single line is created. On this charts, comparisons among lines referred to different time slots are permitted by adding the time slot of interest through the preselection function.
Example:
Global chart with two lines
Add a new time slot for the comparison with the main time slot.
Main time slot selection

27 I387GB03_20.docx
Comparison for the first line (black in the global chart) on two different days (red for May 6th, orange for May 7th)
Comparison for the second line (purple in the global chart) on two different days (yellow for May 6th, green for May 7th)
11 Alarm
11.1 Creation of an alarm ( Alarm→New) On data collected from a datalog an alarm can be activated by setting the limit values of a measurement with MIN and MAX fields. If the measurement sample is below the minimum or above the maximum limit, an alarm is generated and notified:
with the symbol in the upper right corner of every page; close to the symbol the number of open alarms is indicated;
in the last 10 alarm list in the home page ; in the complete list of alarms (( Alarm→Measures alarm list); by e-mail or to an FTP server (Synergy is an FTP client).
28 I387GB03_20.docx
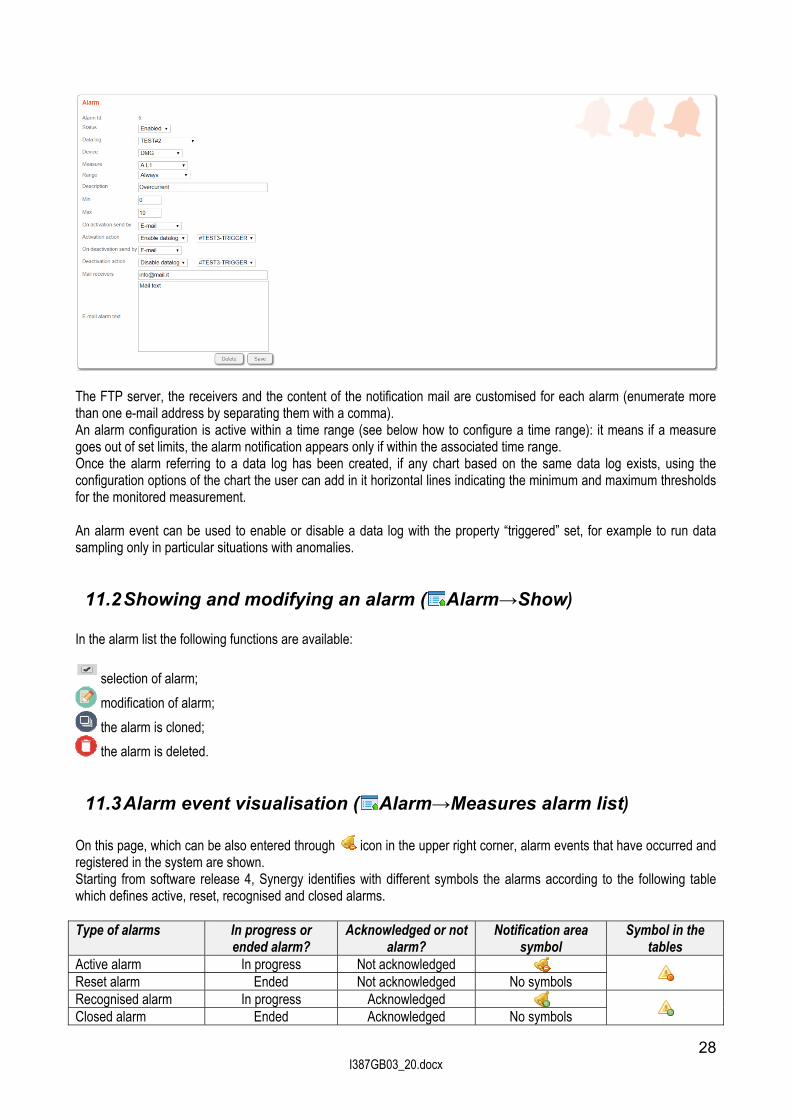
The FTP server, the receivers and the content of the notification mail are customised for each alarm (enumerate more than one e-mail address by separating them with a comma). An alarm configuration is active within a time range (see below how to configure a time range): it means if a measure goes out of set limits, the alarm notification appears only if within the associated time range. Once the alarm referring to a data log has been created, if any chart based on the same data log exists, using the configuration options of the chart the user can add in it horizontal lines indicating the minimum and maximum thresholds for the monitored measurement. An alarm event can be used to enable or disable a data log with the property “triggered” set, for example to run data sampling only in particular situations with anomalies.
11.2 Showing and modifying an alarm ( Alarm→Show) In the alarm list the following functions are available:
selection of alarm;
modification of alarm;
the alarm is cloned;
the alarm is deleted.
11.3 Alarm event visualisation ( Alarm→Measures alarm list) On this page, which can be also entered through icon in the upper right corner, alarm events that have occurred and registered in the system are shown. Starting from software release 4, Synergy identifies with different symbols the alarms according to the following table which defines active, reset, recognised and closed alarms. Type of alarms In progress or
ended alarm? Acknowledged or not
alarm? Notification area
symbol Symbol in the
tables Active alarm In progress Not acknowledged
Reset alarm Ended Not acknowledged No symbols Recognised alarm In progress Acknowledged
Closed alarm Ended Acknowledged No symbols

29 I387GB03_20.docx
By default, only the open (active, reset and recognised) alarms are shown. The search filter can be modified to select events to be displayed. For each alarm, the time stamp and relevant values of the measurement for the begin and end of the alarm are recorded. Clicking on symbol, the alarm is acknowledged and the symbol shown becomes , while the name of the user who made the action is noted. It is possible to cancel the acknowledgement clicking on : the symbol comes back to , but the last user acting on the alarm is recorded.
The list of alarm events can be exported in Excel format (.xlsx) by pressing the "Export to XLS" button. In the home page the last 10 active, reset and recognised alarms are listed.
11.4 Communication alarm visualisation ( Alarm→Communication alarm list)
Starting from Synergy V4, entering this page, a system log is available with all the events relevant to device communication errors, leading to the network diagnostic.
30 I387GB03_20.docx
12 Report
12.1 Introduction The report are post-processed data starting from the data collected through the data log set in Synergy. Therefore, they are not a further data collection from devices which increases the network traffic, but they take advantage from the contents of the database. The immediate advantage is that a report can be created, modified and deleted without the risk of losing or affecting the data collected by Synergy. The starting point for the management of reports are the time range (simply called “range” in Synergy), that is periods of time which serve as a filter for the collected data. The ranges are also properties used by the alarm functions as described above. Reports are available starting from Synergy release 4.
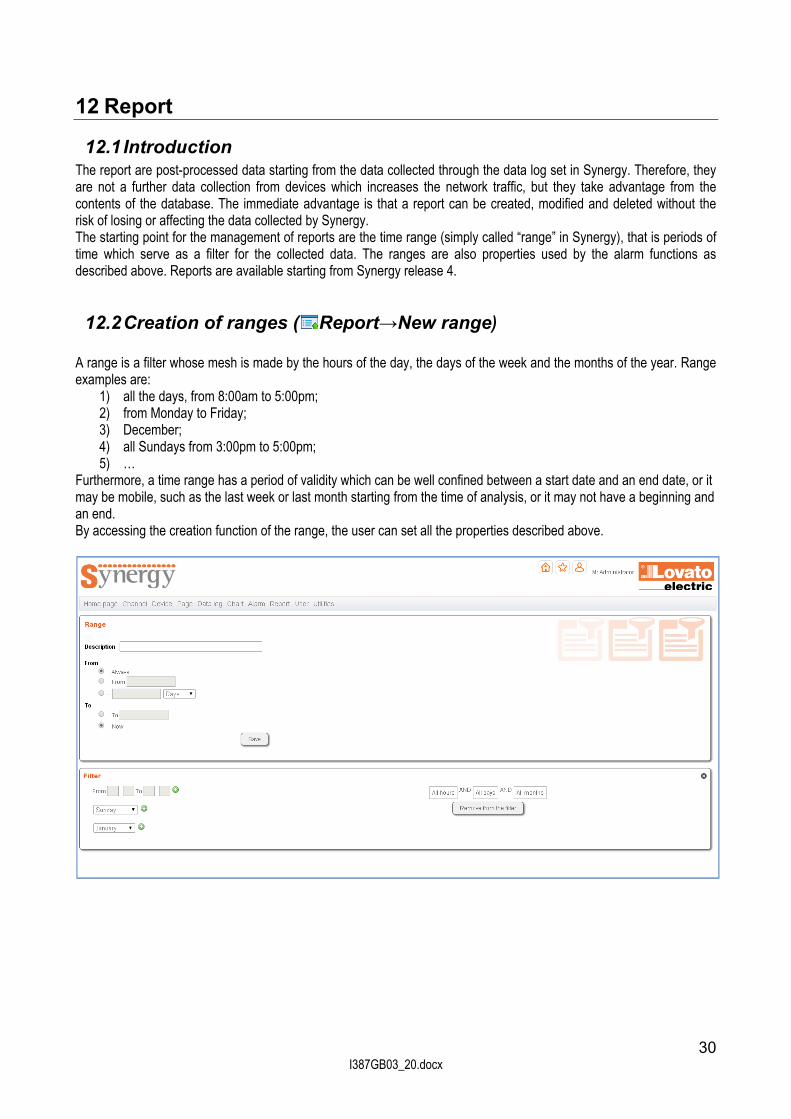
12.2 Creation of ranges ( Report→New range) A range is a filter whose mesh is made by the hours of the day, the days of the week and the months of the year. Range examples are:
1) all the days, from 8:00am to 5:00pm; 2) from Monday to Friday; 3) December; 4) all Sundays from 3:00pm to 5:00pm; 5) …
Furthermore, a time range has a period of validity which can be well confined between a start date and an end date, or it may be mobile, such as the last week or last month starting from the time of analysis, or it may not have a beginning and an end. By accessing the creation function of the range, the user can set all the properties described above.

31 I387GB03_20.docx
The first operations to be performed are the typing of a description which will identify the range in the software when used in other functions, and the definition of the validity period, which by default is set to:
“from”: always “to”: now
which is the typical case with the range always valid (active). If the other fields are selected, that is one of the options available for property "from" and one of the options of the property "to", because all combinations are valid, the user can create different types of validity periods:
1) from 2014 January 30th to now; 2) from 2014 April 1st to 2014 April 30th; 3) from “last 7 days” to now; 4) from “last 15 days” to 2014 March 25 th; 5) …
After the determination of the validity period, the user is required to save the information by clicking on the button
The next step is the application of the filter made by the hours of the day, the days of the week, the months of the year or any combination of these. If there is no selection, the filter has no effect.
The filter logic makes the homogeneous selections valid at the same time (logic OR), while the created groups are intersected among them (logic AND). In other words:
1) all selections of hours of the day are valid at the same time; 2) all selections of the days of the week are valid at the same time; 3) all selections of the months of the year are valid at the same time; 4) hours of the day, the days of the week, the months of the year are crossed among them.
Examples.
1) (8:00 – 11:59, 15:00 – 16:59) AND (Monday) AND (All months). The involved data are the ones collected on Monday, from 8:00am to 12:00am (11:59:59” p.m.) or from 3:00pm to 5:00pm (4:59:59” p.m.).
2) (8:00 - 16:59) AND (All days) AND (All months). The involved data are the ones collected all the days from 8:00am to 5:00pm (4:59:59” p.m.).
3) (15:00 – 19:29) AND (Monday, Tuesday, Wednesday) AND (January, February). The involved data are the ones collected all Mondays, Tuesdays and Wednesdays of January and February, from 3:00pm to 7:30pm (7:29:59” p.m.). Note the use of 0-24 hour format for hours. The ranges are typically used to determine the energy consumption within different energy tariffs. ENERGY TARIFF DAYS HOURS F1 From Monday to Friday 8:00am – 7:00pm
F2 From Monday to Friday 0:00am – 8:00am and 7:00pm – 12:00pm Saturday and Sunday 0:00am – 12:00pm
In Synergy a range for each of the three combinations in the table must be created (F2 consists of two "sub ranges"). Energy tariff F1.
1) Report→New range.

32 I387GB03_20.docx
2) Click on , then on
3) Select hours from 8:00 to 18:59, click on to add the hours of the day; 4) Select days Monday, Tuesday, …, Friday adding each of them by clicking on
5) Click on
Energy tariff F2. F2 is made of two ranges, the former for days from Monday to Friday during the night, the latter for weekends.
If desired, the F2 ranges can be aggregated in a table as described below.

33 I387GB03_20.docx
Exceptions which are based on hours of the day, days of the week, days of the month and months of the year can be created in a time range. They can be classified as “inclusive” when an external (even partially) time segment is added to the range and as “exclusive” when the time segment is subtracted. For each time range, exclusions are applied before the inclusions are. For example, if the following exceptions are created:
1) Include: from 10:00a.m. to 12:00a.m. 2) Exclude: from 11:00a.m. to 11:30a.m.
the exception comes to be “include from 10:00a.m. to 12:00a.m.”. If the following exceptions are created: 3) Include: from 10:00a.m. to 12:00a.m. 1) Exclude: from 11:30a.m. to 1:00p.m.
the exception comes to be “include from 10:00a.m. to 12:00a.m. and exclude from 12:01a.m. to 1:00p.m. In order to create exceptions, a dedicated panel is available to select the exception type and the time segment of interest (i.e. December 25th from 10:00a.m. to 12:00a.m.).
12.3 Showing and modifying ranges ( Report→Show range) Access this section to search and modify the ranges clicking on . In case of modification of a range, the collected data are not cancelled. The “visibility” is what changes. By clicking on icon, the range is cloned.
12.4 Calendar of ranges ( Report→Range calendar) Through the calendar function, a visual representation of the time range coverage is shown. After the selection of the month of interest, for each hour a colored box is drawn according to the following meaning:
(grey): the considered hour is not covered by any of the time ranges;
(red): more than one time range is covering the considered hour; by clicking on the box the overlap details are described;
or (“other colors” with or without transparency): the considered hour is covered by the time range identified by the color; if the box is transparent; the coverage is not full.

34 I387GB03_20.docx
12.5 Creation of tables ( Report→New table) The tables are different “views” of data collected in the data logs. In the same table it is possible to:
join data belonging to different data logs; filter data with the time ranges; aggregate values to get the minimum, average, maximum and delta (that is the variation of the value) of each
measures within each time range; sum the aggregate values (for example all the average values) of each device along all the time ranges; sum the aggregate values (for example the energy delta, that is the energy consumption) of each time range
along all the devices.
35 I387GB03_20.docx
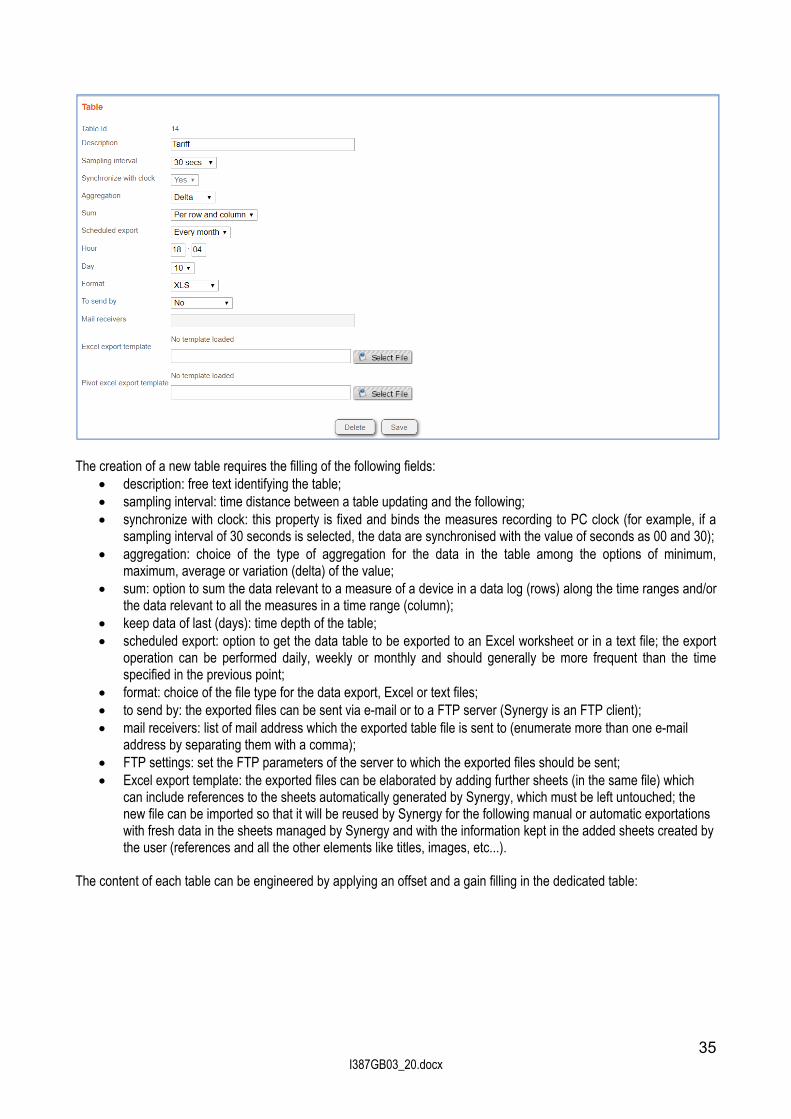
The creation of a new table requires the filling of the following fields:
description: free text identifying the table; sampling interval: time distance between a table updating and the following; synchronize with clock: this property is fixed and binds the measures recording to PC clock (for example, if a
sampling interval of 30 seconds is selected, the data are synchronised with the value of seconds as 00 and 30); aggregation: choice of the type of aggregation for the data in the table among the options of minimum,
maximum, average or variation (delta) of the value; sum: option to sum the data relevant to a measure of a device in a data log (rows) along the time ranges and/or
the data relevant to all the measures in a time range (column); keep data of last (days): time depth of the table; scheduled export: option to get the data table to be exported to an Excel worksheet or in a text file; the export
operation can be performed daily, weekly or monthly and should generally be more frequent than the time specified in the previous point;
format: choice of the file type for the data export, Excel or text files; to send by: the exported files can be sent via e-mail or to a FTP server (Synergy is an FTP client); mail receivers: list of mail address which the exported table file is sent to (enumerate more than one e-mail
address by separating them with a comma); FTP settings: set the FTP parameters of the server to which the exported files should be sent; Excel export template: the exported files can be elaborated by adding further sheets (in the same file) which
can include references to the sheets automatically generated by Synergy, which must be left untouched; the new file can be imported so that it will be reused by Synergy for the following manual or automatic exportations with fresh data in the sheets managed by Synergy and with the information kept in the added sheets created by the user (references and all the other elements like titles, images, etc...).
The content of each table can be engineered by applying an offset and a gain filling in the dedicated table:
36 I387GB03_20.docx
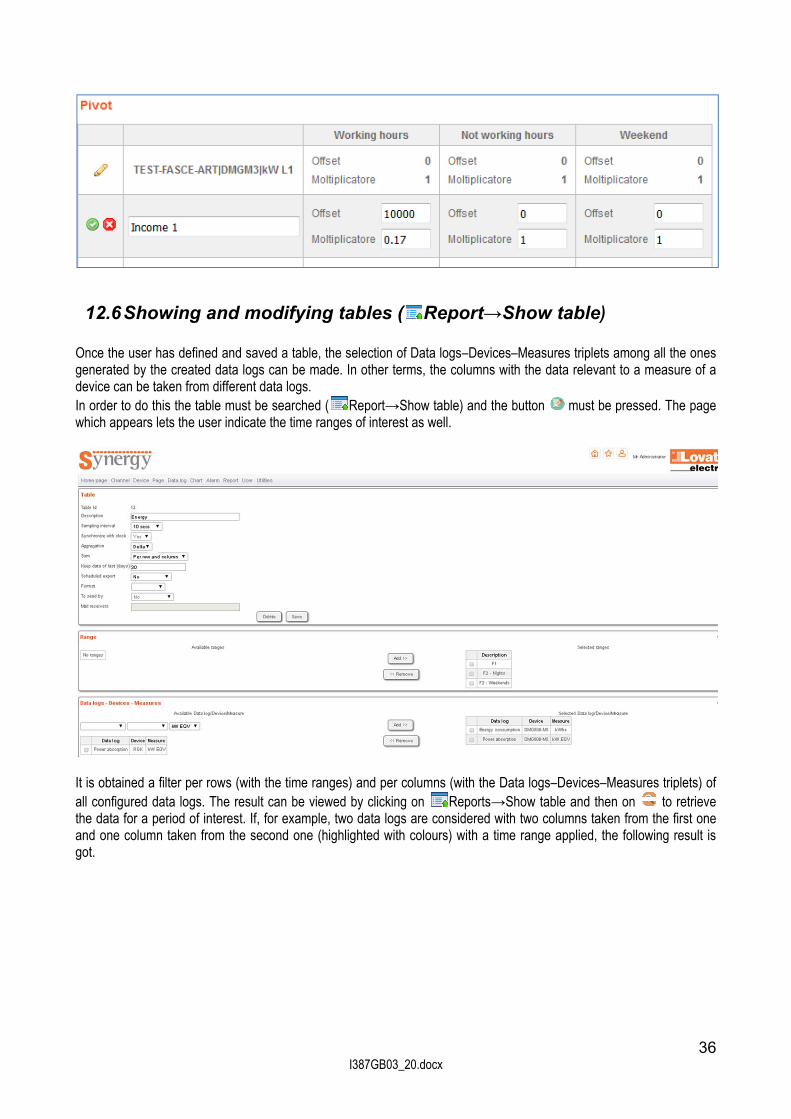
12.6 Showing and modifying tables ( Report→Show table) Once the user has defined and saved a table, the selection of Data logs–Devices–Measures triplets among all the ones generated by the created data logs can be made. In other terms, the columns with the data relevant to a measure of a device can be taken from different data logs. In order to do this the table must be searched ( Report→Show table) and the button must be pressed. The page which appears lets the user indicate the time ranges of interest as well.
It is obtained a filter per rows (with the time ranges) and per columns (with the Data logs–Devices–Measures triplets) of all configured data logs. The result can be viewed by clicking on Reports→Show table and then on to retrieve the data for a period of interest. If, for example, two data logs are considered with two columns taken from the first one and one column taken from the second one (highlighted with colours) with a time range applied, the following result is got.

37 I387GB03_20.docx
For each time range, a table with the same measures is automatically generated. By accessing the aggregated data ( Report→Show table + ), for all time ranges and all the measures maximum, minimum, average or delta values are available according to what selected in the "aggregation" property of the table. It could be useful to have multiple tables which differ from each other only for the type of aggregation. Each table can be exported by clicking on
.
Energy
Average power

38 I387GB03_20.docx
Minimum power
Maximum power
Moreover, starting from Synergy release 5, the same tables can be represented with pie and column charts. All charts can be exported as an image. To see the charts, it is necessary to enable the selection closed to the chart of interest. The selections are available for columns if the sum by columns is enabled, while the selections for row are available if the sum by rows is enabled.
In the example above, The column chart for the whole table Data log-Device-Measure and the pie charts for General LV – DMG900 and F1 range (From Monday to Friday, from 8a.m to 8p.m.) have been selected. Automatically the following three charts are generated. Column chart for the whole table Data log-Device-Measure: for both the devices in the table and for the sum of them the aggregate values are represented for each range and total in different colors. In case of energy consumption, the distribution of the consumption along the ranges can be analysed for all the loads monitored by the devices.
Pie chart for device General LV – DMG900: for this device, the aggregate values are represented with different colors in absolute and percentage values in the pie. In case of energy consumption, it is possible to have a picture of the energy consumption distribution in the different time ranges for the loads monitored by the device.

39 I387GB03_20.docx
Pie chart for time range F1: the aggregate values for this time range are represented with different colors in absolute and percentage values in the pie. In case of energy consumption, it is possible to understand how the energy consumed in a time range is divided among the loads monitored by the devices.
Lastly, if the automatic reports are enabled, more table are available for analysis. Daily report: for each device in the table, a new table is generated with the values calculated for all days of the week, with the possibility to draw a column chart with the days of the week on the horizontal axis and the values on a stack of the time ranges for each day.
Monthy report: for each device in the table, a new table is generated with the values calculated for all months of the year, with the possibility to draw a column chart with the months of the year on the horizontal axis and the values on a stack of the time ranges for each month.

40 I387GB03_20.docx
The new tables, which can exported in the same Excel file of the main table, are useful to make comparisons between different periods, for example to verify the effects of an intervention on the system to improve the energy consumption.
13 Utilities
13.1 Licence At the first run the application creates a temporary license file directly in the installation folder. For example, if the software has been installed in the default directory suggested by the setup, the file is: c:\Lovato Electric\Synergy\Licence.xml A temporary license lets the user work with all the Synergy functions available for a period of 60 days from installation. After this period, the software remains active only for the configuration of device parameters. To re-enable the functions, a new license is to be asked to the supplier by sending the activation code ( Utilities→Licence). The page shows the licence status as well:
Group: go to www.lovatoelectric.com web page at the section dedicated to the software to verify which group the involved devices belong to;
N. devices: number of devices set in Synergy; the license do not limit the number of devices which can be created, but their use determined by the “Licenced” property of the devices;
N. activated device: number of devices selected by the administrator as licence owners; Licences: maximum number of devices which can be activated at the same time; Expiry date: date on which the licences are no longer valid; Export licence: verification of e-mail sending and FTP client usage licence activation; Activation code: licence code which must be used to get new licences.
The activation code must be communicated taking care to report it faithfully (pay attention to upper/lower case). For that reason it is recommended to proceed sending directly the current copy of the file Licence.xml in the directory indicated above. Once the new license file Licence.xml with the new permissions is received, overwrite the previous version.

41 I387GB03_20.docx
13.2 Server This page lets the user start and stop the server and set some parameters to configure the application.
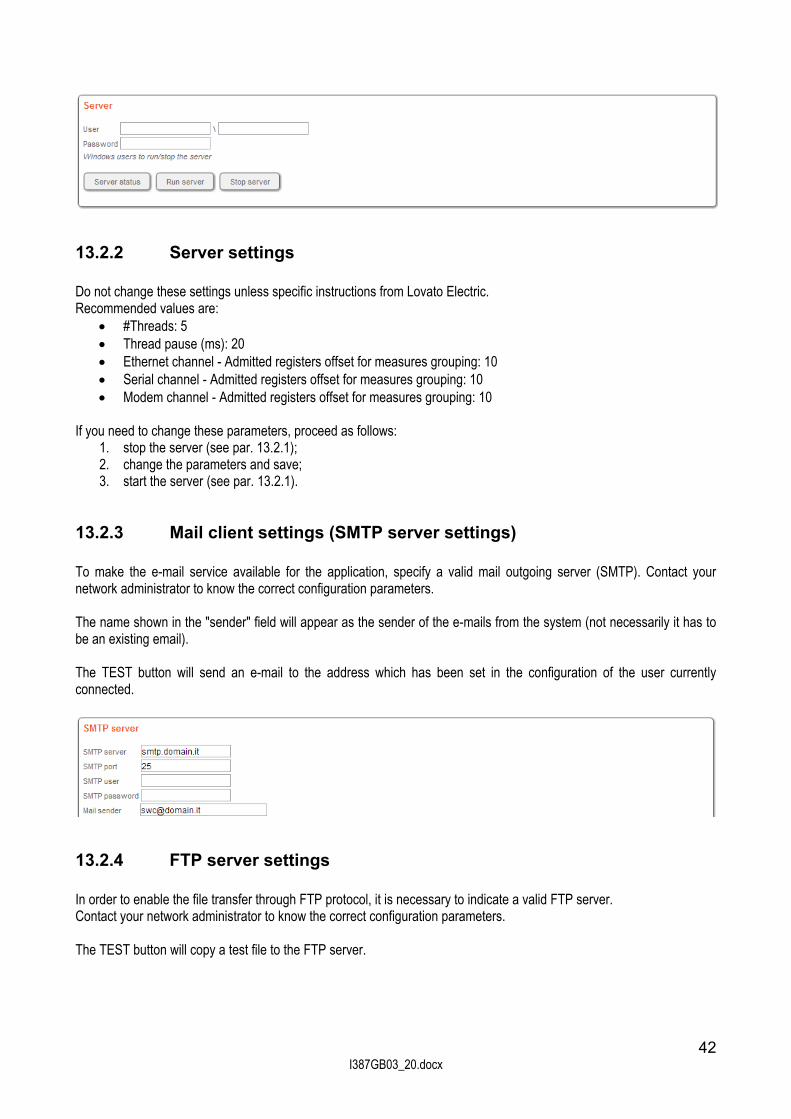
13.2.1 Server To start and stop the server or check the status, enter the username and password of an administrator of the PC on which Synergy is installed and then press the button for the function required. In case a restart of the server is needed, first stop it, then wait 10 seconds to allow an orderly shutdown and then start it.
42 I387GB03_20.docx
13.2.2 Server settings Do not change these settings unless specific instructions from Lovato Electric. Recommended values are:
#Threads: 5 Thread pause (ms): 20 Ethernet channel - Admitted registers offset for measures grouping: 10 Serial channel - Admitted registers offset for measures grouping: 10 Modem channel - Admitted registers offset for measures grouping: 10
If you need to change these parameters, proceed as follows:
1. stop the server (see par. 13.2.1); 2. change the parameters and save; 3. start the server (see par. 13.2.1).
13.2.3 Mail client settings (SMTP server settings) To make the e-mail service available for the application, specify a valid mail outgoing server (SMTP). Contact your network administrator to know the correct configuration parameters. The name shown in the "sender" field will appear as the sender of the e-mails from the system (not necessarily it has to be an existing email). The TEST button will send an e-mail to the address which has been set in the configuration of the user currently connected.
13.2.4 FTP server settings In order to enable the file transfer through FTP protocol, it is necessary to indicate a valid FTP server. Contact your network administrator to know the correct configuration parameters. The TEST button will copy a test file to the FTP server.

43 I387GB03_20.docx
13.3 Export definitions The export definition function produces a *.zip file with complete definitions and images used in Synergy. The user can select the objects which should be exported. The system automatically propose to export all their dependencies as well. For example, if a chart is selected, the data log on which the chart is built is selected too.
13.4 Import definitions A *.zip file produced by the export function can be imported into other instances of Synergy through the import function. To import the file, press the "Select file" button and wait for loading (loading is finished when the file name appears on a green background). Press the "Import" button and wait for the import message occurred. Find on website www.lovatoelectric.com (section dedicated to the software) some "scenarios", which are sets of definitions for typical configurations. The imported scenarios must be "fitted" to the specific application. Step by step guides are also available on the website to help the user in the configuration.
13.5 Import drivers To import the drivers, press the "Select File" button to select the XLS file downloaded from www.lovatoelectric.com website (section dedicated to software) and wait for the file upload (the upload is finished when the file name appears on a green background). Press the "Import" button and wait for the import message occurred.
13.6 Import scenarios To import new scenarios, download the file and then press "Select File" button to select the file. Wait for the file upload (the upload is finished when the file name appears on a green background). Press the "Import" button and wait for the import message occurred.
13.7 Import language In the standard installation of Synergy the user interface is available in 6 languages:
Italian; English; French; Spanish; Russian; Polish.

44 I387GB03_20.docx
On website www.lovatoelectric.com (section dedicated to the software) other languages are available. Use "Import language” function to import the file downloaded from the website. If the language already exists, it is overwritten, otherwise it is added to the other ones available for the users.
13.8 Import theme Some of the features of the theme of the web pages of Synergy can be changed by modifying the style sheet. On the website www.lovatoelectric.com in the section dedicated to the software some style sheets (*.css file) which can be imported using the "Import theme" function are available.
13.9 Import logo If the system administrator wants to introduce its own logo always present in every page of the web application, using the "Import logo" function the Synergy logo in the upper left corner can be replaced. The size of the file, *. png type, must be 215x70 pixels. The Lovato Electric logo cannot be changed.
13.10 System log The system log lists all important events, in order to monitor the use of the application.
13.11 System diagnostic This page contains some useful diagnostic information in the event of malfunction. If requested by Lovato Electric, copy the contents of the page and paste them into the body of an e-mail to be sent to the referring person in Lovato Electric
13.12 Web api Synergy offers a RESTful web service by which third party applications can call APIs (Application Program Interface) in order to retrieve the collected data of a data log directly from Synergy database. The Web APIs should be used just for data reading. The data log configuration must be performed through Synergy web interface as described in the above sections. The API access is ruled by the system administrator who can enable the created users to consume the service, which will ask the application to authenticate itself with the same credentials of the user. Username and password are encrypted with BASE64 algorithm. The API call has the following general structure: http://{RemoteServer}:{port}/api/DataLog/DL_x/D_y/M_z/{date_start}/{date_end} RemoteServer: remote server IP address where the service is active; port: remote access port; DL_x, D_y and M_z are the coordinates to identify a measure of a device in a data log; date_start and date_end are respectively the start date and the end date of the time window which the data of
interest are included in; format yyyymmggThhmm (year, month, day, hour, minute). Synergy web interface helps to compile the API call in the proper way by giving:

45 I387GB03_20.docx
the selection of the target measure among all the ones available through the data log – device – measure filter; the selection of the data log is mandatory, while it is not necessary to select the device if a measure is targeted for all the devices, or the measure if all the measures of a device are targeted, or all the measures of all the devices are desired;
the server information; choice between http and https protocols; information about the time window of interest, by defining the start and the end dates and times or by calling for the
last (from 1 to 1000) samples despite of the time stamp.
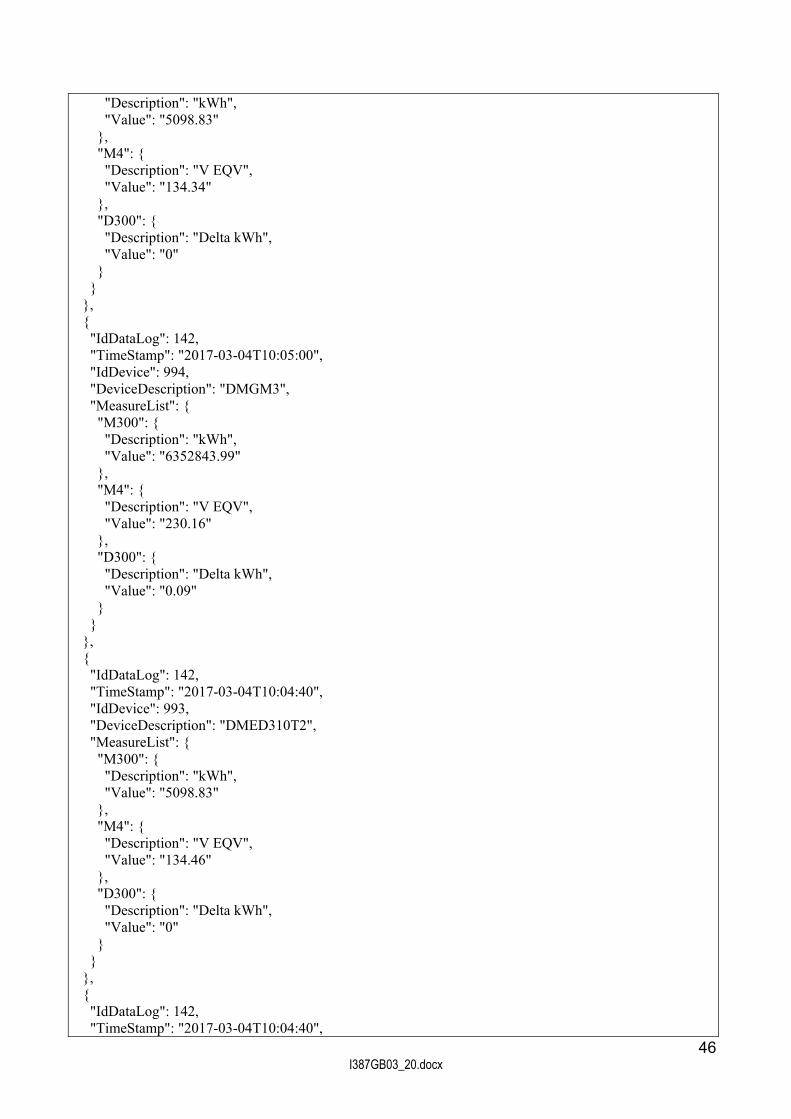
The user can copy the result of the selection which is published in the “Web Api URL” column and use it in the application. The API call must include in the header: username and password with BASE64 algorithm coding; selection of the data file among JSON, TXT and XML. Example of Web Api use in VBA for Excel. WebApiURL contains the API call as compiled by Synergy and published in “Web Api URL” column. xmlhttp.Open "GET", WebApiURL, False xmlhttp.setRequestHeader "Authorization", “Basic " + Base64Encode(username + ":" + password) xmlhttp.setRequestHeader "Accept", "application/json" xmlhttp.send xmlhttp.responseText contains the file with data. In the example the selected format is JSON, but calls with header with “text/csv” and “application/xml” options are accepted. If the format is not specified, JSON is the default. For example, if in Synergy a data log (assigned with ID = 142) has been created for two devices:
1) DMGM3, assigned with ID = 994; 2) DMED310T2, assigned with ID = 993;
from which two measures are read every 20 seconds: 1) equivalent voltage V EQV; 2) active energy kWh, recorded along with the delta value;
if the last two samples are called, one of the three following file is returned. JSON [ { "IdDataLog": 142, "TimeStamp": "2017-03-04T10:05:00", "IdDevice": 993, "DeviceDescription": "DMED310T2", "MeasureList": { "M300": {
46 I387GB03_20.docx
"Description": "kWh", "Value": "5098.83" }, "M4": { "Description": "V EQV", "Value": "134.34" }, "D300": { "Description": "Delta kWh", "Value": "0" } } }, { "IdDataLog": 142, "TimeStamp": "2017-03-04T10:05:00", "IdDevice": 994, "DeviceDescription": "DMGM3", "MeasureList": { "M300": { "Description": "kWh", "Value": "6352843.99" }, "M4": { "Description": "V EQV", "Value": "230.16" }, "D300": { "Description": "Delta kWh", "Value": "0.09" } } }, { "IdDataLog": 142, "TimeStamp": "2017-03-04T10:04:40", "IdDevice": 993, "DeviceDescription": "DMED310T2", "MeasureList": { "M300": { "Description": "kWh", "Value": "5098.83" }, "M4": { "Description": "V EQV", "Value": "134.46" }, "D300": { "Description": "Delta kWh", "Value": "0" } } }, { "IdDataLog": 142, "TimeStamp": "2017-03-04T10:04:40",

47 I387GB03_20.docx
"IdDevice": 994, "DeviceDescription": "DMGM3", "MeasureList": { "M300": { "Description": "kWh", "Value": "6352843.9" }, "M4": { "Description": "V EQV", "Value": "230.15" }, "D300": { "Description": "Delta kWh", "Value": "0.11" } } } ] XML ArrayOfDataLogItem xmlns:i="http://www.w3.org/2001/XMLSchema-instance" xmlns="http://schemas.datacontract.org/2004/07/SWC_WebApi.Models"> <DataLogItem> <DeviceDescription>DMED310T2</DeviceDescription> <IdDataLog>142</IdDataLog> <IdDevice>993</IdDevice> <MeasureList xmlns:d3p1="http://schemas.microsoft.com/2003/10/Serialization/Arrays"> <d3p1:KeyValueOfstringMeasureItemo9wfxNGb> <d3p1:Key>M300</d3p1:Key> <d3p1:Value> <Description>kWh</Description> <Value>5098.83</Value> </d3p1:Value> </d3p1:KeyValueOfstringMeasureItemo9wfxNGb> <d3p1:KeyValueOfstringMeasureItemo9wfxNGb> <d3p1:Key>M4</d3p1:Key> <d3p1:Value> <Description>V EQV</Description> <Value>134.34</Value> </d3p1:Value> </d3p1:KeyValueOfstringMeasureItemo9wfxNGb> <d3p1:KeyValueOfstringMeasureItemo9wfxNGb> <d3p1:Key>D300</d3p1:Key> <d3p1:Value> <Description>Delta kWh</Description> <Value>0</Value> </d3p1:Value> </d3p1:KeyValueOfstringMeasureItemo9wfxNGb> </MeasureList> <TimeStamp>2017-03-04T10:05:00</TimeStamp> </DataLogItem> <DataLogItem> <DeviceDescription>DMGM3</DeviceDescription> <IdDataLog>142</IdDataLog>

48 I387GB03_20.docx
<IdDevice>994</IdDevice> <MeasureList xmlns:d3p1="http://schemas.microsoft.com/2003/10/Serialization/Arrays"> <d3p1:KeyValueOfstringMeasureItemo9wfxNGb> <d3p1:Key>M300</d3p1:Key> <d3p1:Value> <Description>kWh</Description> <Value>6352843.99</Value> </d3p1:Value> </d3p1:KeyValueOfstringMeasureItemo9wfxNGb> <d3p1:KeyValueOfstringMeasureItemo9wfxNGb> <d3p1:Key>M4</d3p1:Key> <d3p1:Value> <Description>V EQV</Description> <Value>230.16</Value> </d3p1:Value> </d3p1:KeyValueOfstringMeasureItemo9wfxNGb> <d3p1:KeyValueOfstringMeasureItemo9wfxNGb> <d3p1:Key>D300</d3p1:Key> <d3p1:Value> <Description>Delta kWh</Description> <Value>0.09</Value> </d3p1:Value> </d3p1:KeyValueOfstringMeasureItemo9wfxNGb> </MeasureList> <TimeStamp>2017-03-04T10:05:00</TimeStamp> </DataLogItem> <DataLogItem> <DeviceDescription>DMED310T2</DeviceDescription> <IdDataLog>142</IdDataLog> <IdDevice>993</IdDevice> <MeasureList xmlns:d3p1="http://schemas.microsoft.com/2003/10/Serialization/Arrays"> <d3p1:KeyValueOfstringMeasureItemo9wfxNGb> <d3p1:Key>M300</d3p1:Key> <d3p1:Value> <Description>kWh</Description> <Value>5098.83</Value> </d3p1:Value> </d3p1:KeyValueOfstringMeasureItemo9wfxNGb> <d3p1:KeyValueOfstringMeasureItemo9wfxNGb> <d3p1:Key>M4</d3p1:Key> <d3p1:Value> <Description>V EQV</Description> <Value>134.46</Value> </d3p1:Value> </d3p1:KeyValueOfstringMeasureItemo9wfxNGb> <d3p1:KeyValueOfstringMeasureItemo9wfxNGb> <d3p1:Key>D300</d3p1:Key> <d3p1:Value> <Description>Delta kWh</Description> <Value>0</Value> </d3p1:Value> </d3p1:KeyValueOfstringMeasureItemo9wfxNGb> </MeasureList> <TimeStamp>2017-03-04T10:04:40</TimeStamp> </DataLogItem> <DataLogItem>

49 I387GB03_20.docx
<DeviceDescription>DMGM3</DeviceDescription> <IdDataLog>142</IdDataLog> <IdDevice>994</IdDevice> <MeasureList xmlns:d3p1="http://schemas.microsoft.com/2003/10/Serialization/Arrays"> <d3p1:KeyValueOfstringMeasureItemo9wfxNGb> <d3p1:Key>M300</d3p1:Key> <d3p1:Value> <Description>kWh</Description> <Value>6352843.9</Value> </d3p1:Value> </d3p1:KeyValueOfstringMeasureItemo9wfxNGb> <d3p1:KeyValueOfstringMeasureItemo9wfxNGb> <d3p1:Key>M4</d3p1:Key> <d3p1:Value> <Description>V EQV</Description> <Value>230.15</Value> </d3p1:Value> </d3p1:KeyValueOfstringMeasureItemo9wfxNGb> <d3p1:KeyValueOfstringMeasureItemo9wfxNGb> <d3p1:Key>D300</d3p1:Key> <d3p1:Value> <Description>Delta kWh</Description> <Value>0.11</Value> </d3p1:Value> </d3p1:KeyValueOfstringMeasureItemo9wfxNGb> </MeasureList> <TimeStamp>2017-03-04T10:04:40</TimeStamp> </DataLogItem> </ArrayOfDataLogItem> CSV (TAB separated) 142 2017-03-04T10:05:00 993 DMED310T2 M300 kWh 5098.83 M4 V EQV 134.34 D300 Delta kWh 0
142 2017-03-04T10:05:00 994 DMGM3 M300 kWh 6352843.99 M4 V EQV 230.16 D300 Delta kWh 0.09
142 2017-03-04T10:04:40 993 DMED310T2 M300 kWh 5098.83 M4 V EQV 134.46 D300 Delta kWh 0
142 2017-03-04T10:04:40 994 DMGM3 M300 kWh 6352843.9 M4 V EQV 230.15 D300 Delta kWh 0.11
13.13 Third party devices Synergy can add to the monitoring third party devices which support MODBUS RTU, MODBUS ASCII or MODBUS TCP protocols. A device model must be created by inserting all the necessary information for the communication protocol management in the dedicated web interface. After the model has been created, it appears in the model list during the device creation in Device→New and inherits all the monitoring functions already available for LOVATO Electric devices (Data logs, live pages, alarms, etc…). Parameter setting and commands are not allowed.

50 I387GB03_20.docx
13.13.1 Device model creation
Model: model name by which the third party device is identified. SW revision: each model can be assigned with a range of firmware revisions which are compatible from modbus
protocol point of view. Modbus read function: select if the device supports 0x03 or 0x04 function for data reading; if both the options are
supported, select your preferred option. Byte Word ordering: indicate the order followed by the device to return the words and the bytes of the word.
13.13.2 Management of the measure associated with the model Once the model has been designed, the associated measures can be created, modified or deleted. In order to add a new measure, the following data are required.
51 I387GB03_20.docx
Modbus functions 0x01, 0x03, 0x04, 0x05, 0x06, 0x10 are supported. Data type can be:
integer 16bit with or without sign; integer 32bit with or without sign; integer 64bit with or without sign; floating point; double; enumerator.
13.13.3 Export/Import of models The designed models can be exported and imported in a different Synergy instance. If more than one model has been created, the selection of the model to be exported is required. If an archive file contains more than one model, when the import function is run the user is asked for selection of the model to be imported. .
14 Usage with EXC GL A01
14.1 Channels, devices, scenarios When Synergy is used together with EXC GL A01 gateway data logger, the user is not requested to manage the communication channels and the connected devices, because the information exchange is automatically performed (see I600 user’s manual for EXC GL A01). The connection between Synergy and EXC GL A01 is periodic (every 15 minutes) causing:
1) the device list updating, included the device description which in case should be modified at EXC GL A01 web interface;
2) the creation of data logs and charts described by the scenario for each model of connected device and the consequent updating with the most recent data.
14.2 Charts, alarms, reports, pages The user can add further elements to Synergy based on the data log which are automatically created and updated by EXC GL A01.
Charts: it is possible to modify the charts automatically created and belonging to a scenario or to create some new ones.
Alarms: they operate by considering the data stored in the data logs as they do when the data logs are directly live-compiled by Synergy; pay attention to consider the possibility that an alarm could be generated and deleted in a time fully included in the latest data log update (for example, a measure out of limits causes an alarm which ends 5 minutes later before EXC GL A01 sends the new data to Synergy); in such a case the alarm remains traced in Synergy, without the alarm bell at the top of the screen, but being included in the historic list.
Report: the user can take advantage of both live data logs and data logs filled by EXC GL A01 to create its own reports.
Pages: pages with live indicators and commands can be associates to the devices connected to EXCGLA01 as they were directly connected to Synergy.