Innovative Methodology to Identify Errors in Electric Energy ...
23
energies Article Innovative Methodology to Identify Errors in Electric Energy Measurement Systems in Power Utilities Marco Toledo-Orozco 1,2, * , Carlos Arias-Marin 3 , Carlos Álvarez-Bel 1 , Diego Morales-Jadan 4 , Javier Rodríguez-García 1 and Eddy Bravo-Padilla 2 Citation: Toledo-Orozco, M.; Arias-Marin, C.; Álvarez-Bel, C.; Morales-Jadan, D.; Rodríguez-García, J.; Bravo-Padilla, E. Innovative Methodology to Identify Errors in Electric Energy Measurement Systems in Power Utilities. Energies 2021, 14, 958. https://doi.org/ 10.3390/en14040958 Academic Editors: Andrea Mariscotti and Ferdinanda Ponci Received: 2 December 2020 Accepted: 3 February 2021 Published: 11 February 2021 Publisher’s Note: MDPI stays neutral with regard to jurisdictional claims in published maps and institutional affil- iations. Copyright: © 2021 by the authors. Licensee MDPI, Basel, Switzerland. This article is an open access article distributed under the terms and conditions of the Creative Commons Attribution (CC BY) license (https:// creativecommons.org/licenses/by/ 4.0/). 1 Institute for Energy Engineering, Universitat Politècnica de València, Camino de Vera, 46022 Valencia, Spain; [email protected] (C.Á.-B.); [email protected] (J.R.-G.) 2 School of Electrical Engineering, Faculty of Engineering, Universidad de Cuenca, Cuenca 010109, Ecuador; [email protected] 3 Electrical Engineering Career, Universidad Politécnica Salesiana, Sede Cuenca 010103, Ecuador; [email protected] 4 Electrical Engineering Career, Circular Economy Laboratory-CIITT, Universidad Católica de Cuenca, Sede Cuenca 010107, Ecuador; [email protected] * Correspondence: [email protected]; Tel.: +593-984-364-210 Abstract: Many electric utilities currently have a low level of smart meter implementation on traditional distribution grids. These utilities commonly have a problem associated with non-technical energy losses (NTLs) to unidentified energy flows consumed, but not billed in power distribution grids. They are usually due to either the electricity theft carried out by their own customers or failures in the utilities’ energy measurement systems. Non-technical energy losses lead to significant economic losses for electric utilities around the world. For instance, in Latin America and the Caribbean countries, NTLs represent around 15% of total energy generated in 2018, varying between 5 and 30% depending on the country because of the strong correlation with social, economic, political, and technical variables. According to this, electric utilities have a strong interest in finding new techniques and methods to mitigate this problem as much as possible. This research presents the results of determining with the precision of the existing data-oriented methods for detecting NTL through a methodology based on data analytics, machine learning, and artificial intelligence (multivariate data, analysis methods, classification, grouping algorithms, i.e., k-means and neural networks). The proposed methodology was implemented using the MATLAB computational tool, demonstrating improvements in the probability to identify the suspected customer’s measurement systems with error in their records that should be revised to reduce the NTLs in the distribution system and using the information from utilities’ databases associated with customer information (customer information system), the distribution grid (geographic information system), and socio- economic data. The proposed methodology was tested and validated in a real situation as a part of a recent Ecuadorian electric project. Keywords: electrical energy losses; outlier detection; data analytics; consumption patterns; machine learning; artificial intelligence 1. Introduction Most power utilities in Latin America and Caribean (LAC) make investments to reduce the non-technical losses of energy (NTLs), with scarce success, as they do not properly consider all the external macroeconomic variables, such as the local employment rate and the level of income per family. These variables are difficult to mitigate in our countries because of the lack of policies, laws, and regulations for power distribution systems. This social and cultural inequality becomes a severe issue for power utilities because consumers cannot pay for the electricity service due to lack of financial liquidity, which encourages cheating the measurement systems to reduce the electricity bill. Energies 2021, 14, 958. https://doi.org/10.3390/en14040958 https://www.mdpi.com/journal/energies
-
Upload
khangminh22 -
Category
Documents
-
view
2 -
download
0
Transcript of Innovative Methodology to Identify Errors in Electric Energy ...

energies
Article
Innovative Methodology to Identify Errors in Electric EnergyMeasurement Systems in Power Utilities
Marco Toledo-Orozco 1,2,* , Carlos Arias-Marin 3, Carlos Álvarez-Bel 1, Diego Morales-Jadan 4 ,Javier Rodríguez-García 1 and Eddy Bravo-Padilla 2
�����������������
Citation: Toledo-Orozco, M.;
Arias-Marin, C.; Álvarez-Bel, C.;
Morales-Jadan, D.; Rodríguez-García,
J.; Bravo-Padilla, E. Innovative
Methodology to Identify Errors in
Electric Energy Measurement
Systems in Power Utilities. Energies
2021, 14, 958. https://doi.org/
10.3390/en14040958
Academic Editors: Andrea Mariscotti
and Ferdinanda Ponci
Received: 2 December 2020
Accepted: 3 February 2021
Published: 11 February 2021
Publisher’s Note: MDPI stays neutral
with regard to jurisdictional claims in
published maps and institutional affil-
iations.
Copyright: © 2021 by the authors.
Licensee MDPI, Basel, Switzerland.
This article is an open access article
distributed under the terms and
conditions of the Creative Commons
Attribution (CC BY) license (https://
creativecommons.org/licenses/by/
4.0/).
1 Institute for Energy Engineering, Universitat Politècnica de València, Camino de Vera, 46022 Valencia, Spain;[email protected] (C.Á.-B.); [email protected] (J.R.-G.)
2 School of Electrical Engineering, Faculty of Engineering, Universidad de Cuenca, Cuenca 010109, Ecuador;[email protected]
3 Electrical Engineering Career, Universidad Politécnica Salesiana, Sede Cuenca 010103, Ecuador;[email protected]
4 Electrical Engineering Career, Circular Economy Laboratory-CIITT, Universidad Católica de Cuenca,Sede Cuenca 010107, Ecuador; [email protected]
* Correspondence: [email protected]; Tel.: +593-984-364-210
Abstract: Many electric utilities currently have a low level of smart meter implementation ontraditional distribution grids. These utilities commonly have a problem associated with non-technicalenergy losses (NTLs) to unidentified energy flows consumed, but not billed in power distributiongrids. They are usually due to either the electricity theft carried out by their own customers orfailures in the utilities’ energy measurement systems. Non-technical energy losses lead to significanteconomic losses for electric utilities around the world. For instance, in Latin America and theCaribbean countries, NTLs represent around 15% of total energy generated in 2018, varying between5 and 30% depending on the country because of the strong correlation with social, economic, political,and technical variables. According to this, electric utilities have a strong interest in finding newtechniques and methods to mitigate this problem as much as possible. This research presentsthe results of determining with the precision of the existing data-oriented methods for detectingNTL through a methodology based on data analytics, machine learning, and artificial intelligence(multivariate data, analysis methods, classification, grouping algorithms, i.e., k-means and neuralnetworks). The proposed methodology was implemented using the MATLAB computational tool,demonstrating improvements in the probability to identify the suspected customer’s measurementsystems with error in their records that should be revised to reduce the NTLs in the distributionsystem and using the information from utilities’ databases associated with customer information(customer information system), the distribution grid (geographic information system), and socio-economic data. The proposed methodology was tested and validated in a real situation as a part of arecent Ecuadorian electric project.
Keywords: electrical energy losses; outlier detection; data analytics; consumption patterns; machinelearning; artificial intelligence
1. Introduction
Most power utilities in Latin America and Caribean (LAC) make investments to reducethe non-technical losses of energy (NTLs), with scarce success, as they do not properlyconsider all the external macroeconomic variables, such as the local employment rate andthe level of income per family. These variables are difficult to mitigate in our countriesbecause of the lack of policies, laws, and regulations for power distribution systems. Thissocial and cultural inequality becomes a severe issue for power utilities because consumerscannot pay for the electricity service due to lack of financial liquidity, which encouragescheating the measurement systems to reduce the electricity bill.
Energies 2021, 14, 958. https://doi.org/10.3390/en14040958 https://www.mdpi.com/journal/energies

Energies 2021, 14, 958 2 of 23
As shown in Table 1, the average rate of energy losses in LAC is 15.65% [1] concerningthe energy available in each power utility system; countries such as Honduras, Jamaica,Paraguay, and Venezuela exceed this average. Nevertheless, Ecuador has presented aconsiderable reduction from 25.04% in 2008 to 13.03% in 2018, due to public investmentsof a technical nature, digitization of electrical power systems [2], and the initiative ofacademia through the generation of new data analytics models. In contrast, countries likeChile, Peru, Bolivia, and Costa Rica have the lowest energy losses in the region.
Table 1. Non-technical energy losses in LAC.
Country 2008 2009 2010 2011 2012 2013 2014 2015 2016 2017 2018 Average
Argentina 14.3 14.8 14.8 13.6 14.4 15.1 12.0 13.2 13.0 14.7 15.1 14.1Bolivia 10.1 10.1 11.2 11.0 9.9 9.0 9.4 8.9 9.9 10.7 11.0 10.1Brazil 15.3 15.8 15.6 15.4 15.9 15.4 14.9 15.1 15.9 15.6 15.9 15.5Chile 8.3 8.2 5.8 6.1 2.3 6.7 6.7 5.0 3.6 5.2 5.2 5.7Colombia 13.4 12.3 12.0 11.3 11.7 10.1 10.6 12.4 9.4 7.4 10.4 11.0Costa Rica 10.3 10.6 10.1 10.8 10.6 10.5 10.6 12.1 10.2 9.9 9.8 10.5Cuba 15.9 14.3 15.9 15.8 15.7 15.3 15.3 15.5 15.2 15.5 15.8 15.5Ecuador 25.0 21.3 18.6 17.8 15.3 14.2 12.6 12.7 13.0 12.6 13.0 16.0El Salvador 9.6 10.9 11.7 12.1 9.8 7.0 9.8 9.4 11.6 11.4 11.6 10.4Guatemala 14.1 14.4 9.8 13.2 12.5 11.8 12.4 12.0 12.1 12.6 11.7 11.5Honduras 20.6 21.5 27.5 26.1 28.6 28.2 16.2 14.2 14.7 31.9 30.2 23.6Jamaica 23.3 23.2 22.5 24.5 27.2 28.0 28.5 28.5 26.6 26.3 26.0 25.9Mexico 15.8 16.3 16.4 15.9 15.1 14.6 13.9 13.4 12.8 15.8 17.5 15.2
Panama 14.0 13.1 14.5 13.6 13.7 13.5 14.0 13.6 14.4 13.5 13.0 13.7Paraguay 31.8 31.6 31.5 29.8 30.6 25.9 24.5 24.6 24.9 24.9 23.6 27.6Peru 8.2 8.1 10.2 9.6 8.2 10.5 11.0 11.0 10.6 10.5 10.9 9.9DominicanRepublic 11.9 12.7 13.2 12.8 12.8 12.7 12.7 12.8 12.9 13.0 13.0 12.8
Suriname 9.0 9.0 8.5 9.0 9.0 10.2 8.7 10.5 17.0 17.9 18.6 11.6
Uruguay 11.1 11.5 11.6 11.9 11.6 11.2 10.7 12.0 12.2 13.1 11.5 11.7Venezuela 26.7 27.8 27.9 29.6 31.0 32.0 32.8 32.2 29.2 29.2 29.2 29.8
The research is based on applying the concepts and algorithms of data analytics,machine learning, and neural networks to build a systematic methodology to determinechanges in consumption patterns and efficiently locating energy thefts to mitigate lossesfor energy distribution companies.
The review of state-of-the-art shows in general that the techniques used in the analysisof NTLs consider the use of a reduced amount of data with theoretical results; that is, theydo not use a combination of techniques to minimize the error in data processing [3,4].
Five different algorithms for NTL detection using Pearson’s coefficient, Bayesiannetworks, and decision trees were developed and tested in [5]. They used a real databaseprovided by Endesa to test the models.
Nizar, A.H. et al. [6] presented a method to determine what type of data providesthe highest precision concerning NTL analysis in the electricity distribution sector. Themethod identifies two popular classification algorithms, naive Bayesian and decision tree,to detect any significant energy consumption behavior abnormality.
Leite, D. et al. [7] took the case of Brazil in their research and defined the efficientfrontier model, SFA (stochastic frontier analysis), from stochastic economic, social, andpolitical variables for electric power distribution utilities to provide tolerable limits onthe percentage of non-technical losses to mitigate the total cost of the transmission anddistribution infrastructure associated with these utilities as an alternative to the econometricapproach used in the rate review cycle.
Arthur, D. et al. [8] used only k-means to perform tests in different scenarios, lookingfor the comparable asymptote or the best result in the evaluation.

Energies 2021, 14, 958 3 of 23
Sun, S et al. [9] transformed and adapted the traditional nearest neighbor algorithm(kNN) to k (AdaNN); the value of k has a crucial influence on the performance of theproposed algorithm; the optimal k detects the correct class label; and the experimentalresults indicate that the algorithm performs better than traditional kNN.
On the other hand, Ramos, C.C.O. et al. [10] approached NTL by using artificialintelligence techniques. However, their use can result in a high computational load in thetraining and parameter optimization procedures. They showed that the pattern recognitiontechnique called optimal path forest (OPF) is superior to the latest artificial intelligencetechniques. Comparisons with neural networks and other methods demonstrated therobustness of the OPF concerning the automatic identification of commercial losses.
Nagi, J. et al. [11] presented the inclusion of human knowledge and experience in thefraud detection model based on SVM with the introduction of a fuzzy inference system, inthe form of fuzzy IF-THEN rules. It acts as a post-processing scheme to show the suspectswith a probability of fraud; the detection rate was between 60% and 72%.
Likewise, León, C. et al. [12] used an integrated experts system to analyze usefulcustomer information to identify the NTLs and their type. It included text mining modules,data mining modules, and the rule-based expert system module. It was applied to real datafrom the Endesa company power utility in the testing phase by human experts, providinga tool for the inspectors to make the best decision.
Additionally, Galván, Elices, Muñoz, Czernichow, and Sanz-Bobi [12] proposed ageneral methodology based on the use of radial basis function networks, with the followingsteps: (1) selection of variables, (2) data filtering, (3) model fit, (4) model analysis, and (5)model evaluation. The third step takes variables from monthly periods of each patternof annual consumption and active consumption. The methodology was applied to twosectors: the low voltage residential and high-voltage irrigation sectors.
Similarly, Reference [4] presented a set of rules with a high rate of correct NTL iden-tification based on the most relevant customer attributes available in the distributioncompanies’ database. It allowed a reduction of the number of inspected clients with a fraudidentification rate between 7% and 20%.
The research presented in this paper focuses on NTLs in Ecuador since it is one of thecountries in the region with success in reducing and mitigating NTLs, with an investmentabove 50 million dollars in related projects [13,14].
Electric energy supply from generation to final users implies losses in different pro-cesses where the main component is in the distribution stage [15–17]; the losses are thedifference between the energy delivered by the generator and the energy measured andbilled by the company. They are classified into technical and non-technical losses [18,19].
Non-technical losses, also known in the specialized literature as “black losses” or“commercial losses”, are produced by administrative errors generated by the CIS, incorrectreadings, errors in the computation of consumption, incorrect energy in end-use, andtheft or manipulation of the metering system, among others. Generally, their forecast isuncertain (stochastic nature), since it is not known where, how, and when they occur. Theyare computed as the difference between the total losses and the technical losses of thedistribution system [18,20,21].
NTLs are classified according to their cause [16,18]:
• Theft of energy: Any type of illegal connection that is made before the energy me-ter so that the connected load consumptions are not recorded by the measurementequipment.
• Handling of the measuring equipment: Voluntary alterations to the measuring equip-ment resulting in the registration of less consumption than the real one.
• Measurement errors: Involuntary technical failures of measurement devices thatproduce the wrong recordings, such as:
– Damage to the components of the measurement system in direct and indirectconnection,the meter, current transformers, potential transformers, terminalblocks, and connection cables.

Energies 2021, 14, 958 4 of 23
– Human error in taking the reading or failure of the telemetry equipment.– Incorrect configuration of the energy meter.– Unintentional errors in the connection of the measurement system installation.
• Billing errors: They occur when the energy consumed is not recorded in the billingsystem of the distribution company due to damage to the components of the meter-ing system.
The traditional method used by distribution companies to mitigate this problem isperiodic random inspections on-site, a method that requires a high amount of financial andtechnical resources [21–23].
The research presented here aims to ease and reduce the costs associated with thisprocedure, with the following contributions:
• Development of a methodological study based on suitable indicators that integrateand take advantage of the different technologies for data analytics, machine learning,and neural networks. These results of the study were tested with real utility datarelated to customers’ consumption patterns. This study yields a list of potentiallymanipulated measurement equipment to be reviewed under the planning of thepower utility.
• The study allows identifying which technique gives the best result, denoting theprecision of each of these, with the support of data science, processed through theuse of the computational tool MATLAB® for the construction of algorithms, in such away that contributes to the objective of reducing non-technical losses and maximizingeconomic utility incomes.This document is structured as follows: Section 2 considers the current state-of-the-art,providing a deep insight into the theoretical concept of the evaluated methods forthe determination of NTLs. Section 3 shows the process of data analytics and theapplication of the algorithms. Section 4 presents the results of the methodology for theproposed analytic methods’ evaluation and comparison. Section 5 shows the resultsof the implementation of the methodology in a real system. Finally, in Section 6, thetechnical and economic effects are discussed and concluded.
2. Techniques Applied in Data Mining
The research is based on the concept of maximizing the probability of finding in thelocation of measurement systems errors in the recorded data, in such a way that the resultof the execution of the algorithm allows reviewing only suspected cases, applying variousmethodologies as shown in the specialized literature in Table 2. This literature addressesthe current issues of supervised and unsupervised data analytics techniques applied toelectricity consumption variables. The new data concepts guide methods with algorithmsthat yield responses with metrics whose errors allow decision-making in the proposedapproach.
The methodologies combined in the research are:
1. Theoretical study: This focuses on analyzing aspects related to energy theft throughthe use of statistical techniques with socio-demographic and socio-economic variablesto build potential lists of suspected infractions for the reviewed measurement systems;The disadvantage of theoretical studies is that they do not present specific cases oftheft or the failure of the measuring equipment [20].
2. Data-oriented methods: These methods focus on data analytics, for example thepattern of energy consumption and demand. By applying data mining techniques,the consumers with high error probability are identified [20,22].Learning with data mining techniques is classified into:
(a) Supervised learning: These are algorithms that learn by example, require inputdata, and provide output data with the variables that the data scientist needs;that is, he/she must give instances on properly labeled data (positive/fraud andnegative/no fraud). This method requires a large amount of quality information

Energies 2021, 14, 958 5 of 23
to apply the model; the electricity distribution company must have data labeledwith the variables of fraud and not fraud [20,22].
(b) Unsupervised learning: The function of these algorithms is to determine pat-terns to acquire training according to the available variables; generally, thesealgorithms use databases whose variables do not have labels or when the sampledoes not have a sufficient amount of data [20–22].
3. Network-oriented methods: These methods are based the acquisition of data throughthe management of proprietary software and hardware installed in the electricalnetwork, in such a way as to facilitate the identification or estimation of non-technicallosses after a data analytics process through an algorithm that minimizes error andloss of information.
4. Hybrid method: This is a combination of the two classifications mentioned above tomaximize the precision in detecting NTLs [20,22].
Table 2. Literature review of the methods used for NTL detection.
Methodology Concept Algorithm-Method Reference
Theoretical study [17,24–26]
Data-oriented methods
Supervised learning
Nearest neighbor (k-NN) [27,28]
Decision trees [4–6,27–31]
Artificial neural network (ANN) [3,31–36]
Support vector machine (SVM) [29,32,35]
Optimum path forest (OPF) [10,27,37]
Bayesian classifiers [5,6,27]
Rule induction [4,5,11,12,33,38]
Unsupervised learning
Self organizing map (SOM) [31,38]
Cluster K-means [21,38,39]
Cluster K-menoids [21]
Regression models [27,35]
Fuzzy c-means [38,40,41]
Outlier detection [38,42]
Network-orientedmethods [16,19,43–45]
Hybrid methods
Observer meter-SVM [46,47]
Smart meter-SVM [48]
Smart meter-observer meter-maximum informationcoefficient (MIC)-clustering technique
[49]
They are also known as supervised and unsupervised techniques, which will be usedlater for comparison purposes.
2.1. Unsupervised Techniques
K-means is a clustering technique that has the purpose of dividing n number ofsamples into K number of groups; it is based on the entry of n number of instances, eachone defined by a vector (a group of variables) and a number K integer that indicates thenumber of groups to be developed [8,50,51]. It is a technique that groups samples accordingto set similarity proximity, defined by “K” or “centroid” points. The advantage of this
Energies 2021, 14, 958 6 of 23
technique is efficiency when handling large data sets, and as a disadvantage, it is essentialto know the number of formed groups. Another disadvantage is the sensitivity to noisein calculating the groups referring to a center; any atypical data could alter this centroid;therefore, low group formation can impair the response [21].
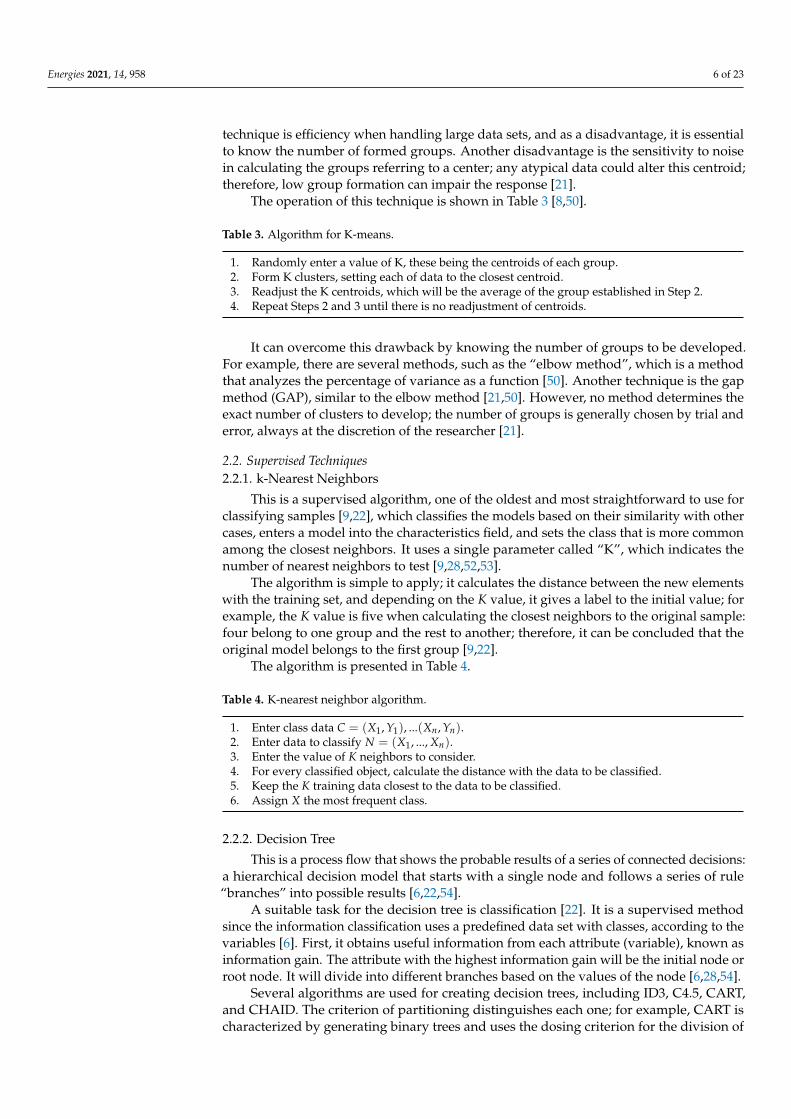
The operation of this technique is shown in Table 3 [8,50].
Table 3. Algorithm for K-means.
1. Randomly enter a value of K, these being the centroids of each group.2. Form K clusters, setting each of data to the closest centroid.3. Readjust the K centroids, which will be the average of the group established in Step 2.4. Repeat Steps 2 and 3 until there is no readjustment of centroids.
It can overcome this drawback by knowing the number of groups to be developed.For example, there are several methods, such as the “elbow method”, which is a methodthat analyzes the percentage of variance as a function [50]. Another technique is the gapmethod (GAP), similar to the elbow method [21,50]. However, no method determines theexact number of clusters to develop; the number of groups is generally chosen by trial anderror, always at the discretion of the researcher [21].
2.2. Supervised Techniques2.2.1. k-Nearest Neighbors
This is a supervised algorithm, one of the oldest and most straightforward to use forclassifying samples [9,22], which classifies the models based on their similarity with othercases, enters a model into the characteristics field, and sets the class that is more commonamong the closest neighbors. It uses a single parameter called “K”, which indicates thenumber of nearest neighbors to test [9,28,52,53].
The algorithm is simple to apply; it calculates the distance between the new elementswith the training set, and depending on the K value, it gives a label to the initial value; forexample, the K value is five when calculating the closest neighbors to the original sample:four belong to one group and the rest to another; therefore, it can be concluded that theoriginal model belongs to the first group [9,22].
The algorithm is presented in Table 4.
Table 4. K-nearest neighbor algorithm.
1. Enter class data C = (X1, Y1), ...(Xn, Yn).2. Enter data to classify N = (X1, ..., Xn).3. Enter the value of K neighbors to consider.4. For every classified object, calculate the distance with the data to be classified.5. Keep the K training data closest to the data to be classified.6. Assign X the most frequent class.
2.2.2. Decision Tree
This is a process flow that shows the probable results of a series of connected decisions:a hierarchical decision model that starts with a single node and follows a series of rule“branches” into possible results [6,22,54].
A suitable task for the decision tree is classification [22]. It is a supervised methodsince the information classification uses a predefined data set with classes, according to thevariables [6]. First, it obtains useful information from each attribute (variable), known asinformation gain. The attribute with the highest information gain will be the initial node orroot node. It will divide into different branches based on the values of the node [6,28,54].
Several algorithms are used for creating decision trees, including ID3, C4.5, CART,and CHAID. The criterion of partitioning distinguishes each one; for example, CART ischaracterized by generating binary trees and uses the dosing criterion for the division of

Energies 2021, 14, 958 7 of 23
its nodes; ID3 uses the information gain as a division criterion; C4.5 uses the gain ratio asthe division criterion. The division stops when the number of instances divided is below acertain threshold [54].
2.2.3. Artificial Neural Network
Inspired by the neurons in the human brain, this deals with linked layers that take theshape of a neuron, relating input data with output data, learning from the data, looking forpatterns, classifying data, and predicting future events [22,36,55].
It is a supervised method that receives training through examples. There are manytypes of neural networks, but for classification cases, multilayer perceptron is usually used,which uses a supervised technique called backpropagation [36]. Figure 1 shows the basicstructure of this neural network, and as we can see, it consists of three layers: input layer,hidden layer, and output layer. The connections between neurons transmit the signals.In the input layer, it receives the signals and distributes the information to the next layer(hidden layer). The number of neurons in the input layer will be equal to the input vector(number of attributes). The hidden and output layers process the signals by amplifying,attenuating, or inhibiting the signals. The number of neurons in the output layer will beequal to the number of classes in the investigation; the number of neurons in the hiddenlayer will depend on the application for which the neural network is established [32,34,36].
Input
Layer
Hidden
Layer
Output
Layer
Input 1
... ... ...
Input 2
Input n
Output 1
Output 2
Output n
Figure 1. ANN structure.
Except for the input nodes, each node in the hidden and output layers is a neuron thatuses an [34,36] activation function.
The establishment of a neural network consists of three stages [36]:
1. Training stage: This is the learning stage where the input attributes (network input)can be added and compared with the target set (label or target).
2. Validation stage: This stage is executed in conjunction with the training stage and iscarried out to avoid over-training the network.
3. Testing stage: This stage is carried out after the training stage and consists of usinga set of data other than those of the training and validation stage to investigate howwell the network learned at the end of the process.
The exposed techniques were used in the comparative analysis carried out in thisresearch to determine the consumption patterns and energy losses.
3. Methodological Construction of the Matrix and Data Analysis
The methodology’s objective allows establishing a comparison of the different dataanalytics techniques in a systematic way to evaluate the non-technical energy losses of a

Energies 2021, 14, 958 8 of 23
distribution company through the recognition of the consumption patterns and to ascertainpotential thefts of energy.
The input variables used in the model come from different databases, both from theCIS, GIS, and distribution companies. Besides, the external information corresponds to theNational Institute of Statistics and Census of Ecuador.
3.1. Data Collection and Integration
The information required for integration came from the company’s reports; thesecorrespond to energy losses in a period of 18 months, financial indicators, final energyuse profiles, date of the last review of the measurement systems, year of manufactureof the energy meter, outstanding debt, outage status, and consumption range. A largepart of these variables came from the system application product (SAP). Furthermore,related information was taken from the GIS, such as location, load density per square meter,consumption stratum, type of electrical networks, social stratum, among other variables.
Figure 2 describes how the data matrix called the “base matrix” was obtained fromthe variables used in this research.
Variable
cleaning
Matrix [1xp]
Variable coding
Data source
Report 1Variable analysis
Report 2Variable analysis
Report nVariable analysis
.
.
.
DATABASE
UTILITY
COMPANY
Variable
analysis
Data reporting Analysis process
Variable
classification
Base matrix
[nxp]
Combination
of variables
Figure 2. Data collection and integration process.
1. Integration of the data set: In this step, this is the most important or relevant datain the search; allows determining the NTL according to the history of consumption,demands, consumer characteristics, and type of meter.
2. Variable analysis: The variables of each report are analyzed, understanding that theydescribe the type of information each variable contains.
3. Combination of variables: All the reports are joined, obtaining 424 variables in thisinvestigation.
4. Variable cleaning: Variables with the same name and with different names, but withthe same information content are eliminated because they do not contribute to themodel and increase the computation time of the algorithm and the error in the result.Once completed, these steps have 318 variables.
5. Classification of the variables: The variables are classified as follows:
• Information: Those variables that provide consumer information, such as: “con-tracted account”, “account”, “name”, and “ID.”
• Geographic: Variables that indicate the geographic location of the customer’smeters, such as: “Codparr”, “province”, and “canton.”

Energies 2021, 14, 958 9 of 23
• Economic: Variables that show the economic relationship between the customerand the distribution company, such as: “date last paid”, “months due”, and“debt.”
• Social: Variables that indicate a social aspect concerning the client, such as“population.”
• Techniques: Technical variables, such as: “type consumption”, “voltage”, “con-sumption kWh/month.”
With the classified variables, the next step corresponds to the careful review of eachvariable to determine those that provide relevant information in the NTL detectionand control algorithm. Subsequently, with the correlation analysis of the variablesand the “expert’s criteria”, each variable is meticulously analyzed to establish thenumber and magnitude of the variables that will provide information to this researchmethodology. After completing this step, we have 68 variables: a matrix [1 × 68] thateliminates approximately 84% of the variables that do not contribute, repeat, or havea high variation coefficient. Steps 2, 3, 4, and 5 are developed under the supervisionof an expert.
6. Data coding: As the variables that make up the [1 × 68] matrix were obtained fromdifferent reports, they do not have the same format; therefore, in this step, somevariables are coded for the analysis.
7. Base matrix: With the previously performed analysis, the n subscribers can be added,and the base matrix of size [n × p] is obtained; where n represents the number ofcustomers; in a first approximation, a universe of 5615 consumers is taken (only foranalysis); concluding with a base data matrix of [5615 × 68].
3.2. Data Pre-Processing
This step is essential for applying any data mining technique. It allows eliminating orseparating anomalous data so that the matrix remains in optimal conditions for trainingthrough any method, whether supervised learning or not. For the pre-processing of thedata, Variables 1 to 26 are omitted since these variables provide customer information(name, contract, telephone). The analysis is carried out from Variable 27 onwards becausetechnical data refer to the consumer (consumption, demands, invoiced values).
3.2.1. Recognition of Data
The CIS tries to minimize the entry of wrong information; however, it is inevitableto have this information in the data matrix, causing the variables to move away from themean and lose their nearness to reality, distorting the analysis context. The research placednull and white values in the data matrix; these are considered in the analysis as outliers;these are discarded in the execution of the data analytics techniques. Additionally, therecognition of technical variables is carried out through exploratory analysis to identifypatterns that allow future actions to make decisions.
The statistical indices of the different variables are in Table 5. The Null data columnpresents values with 255 errors observed in the records of a universe of 2462 consumers;This effect begins with the migration of information from the previous AS400 (ServersStorage Systems)system to the new SAP CIS-CRM. As indicated in the last paragraph,outliers remain in the analysis of this investigation as they could be false positives.
From the analysis using descriptive statistics, the following are determined:
• All variables presented blank or null data.• There exist large differences between the maximum and minimum values; there are
even high percentages of the variation coefficients, generally occurring when thebase matrix analyzed contains measurement systems with information of residential,commercial, and industrial consumers; therefore, consumption varies considerably.The data must be linearized and normalized to reduce these differences in values andavoid possible errors in training and executing the algorithms; this procedure is givenin Section 3.2.3.

Energies 2021, 14, 958 10 of 23
• Some variables have negative values; the distribution company states that they corre-spond to re-invoicing of the consumer due to reading errors or low application rates.
• The zero value for the mode in the consumption variables determines that there aremeasurement systems with zero consumption; it is essential to physically review thisin field planning.
• There is a high difference between the maximum and minimum values; this must beconsidered when applying data mining techniques.
In Figure 3a, the data dispersion of the variable “consumption” and, in Figure 3b, thevariable “debt” respectively, are given; The negative values (enclosed in red) are due to thedispersion of the variables of the database considered in this investigation.
Table 5. Data analysis using descriptive statistics.
# Variable Null Media Median Mode Maximum Minimum Stand.Dev.
CoeffVariant.
V27 Third Age 255 0.05 0 0 1 0 0.22 430%V28 HDB 255 0.02 0 0 1 0 0.33 500%
.
.
.
.
.
.
.
.
.
.
.
.
.
.
.
.
.
.
.
.
.
.
.
.
.
.
.
.
.
.V67 GeographStrat 255 3.94 5 5 10 0 3.03 41%V68 Year Product 19 1998.09 2013 2015 2017 0 165.2 6%
(a) (b)
Figure 3. (a) Data dispersion of the energy consumption variable; (b) Data dispersion of the debt variable.
3.2.2. Data Cleaning
One of the main points of this research is the cleanliness of the data since the infor-mation comes from different bases and may suffer alterations in the handling and transferfrom the source, so it is suggested to maintain greater care, or failing that, to use tools likebusiness intelligence (BI) for information management. The tools used for cleaning thedata were Microsoft EXCEL and MATLAB®, according to the following process:
• Null or non-existent data are verified:
– EXCEL recognizes the missing data as N/A.– MATLAB® recognizes non-existent data as NaN (not a number).

Energies 2021, 14, 958 11 of 23
Those consumers that have null data in the technical variables are eliminated fromthe list.
• Atypical data: Through exploratory data analysis, it is determined that the data thatshould have been considered inconsistent are the negative values in the technicalvariables; therefore, any consumer that has a negative value is eliminated from the list.
3.2.3. Data Normalization
The variables studied in the research present coefficients of variation with high ranges,so it is necessary to center, scale, or linearize the data to be in the same range.
The normalizations used are:
• Maximum-minimum normalization: This is done by Equation (1).
v′ =v−min
max−min(1)
where:
– v′ is the new value– v is the value to normalize– max is the maximum value of the data– min is the minimum data value
• Z-score normalization: This is done by Equation (2)
v′ =v−mean
std(2)
where:
– v′ is the new value– v is the value to normalize– mean is the data average– std is the standard deviation of the data
3.3. Data Processing
In this section, the data mining techniques depend on the information available inthe matrix created in the utility database. The research objective is to identify whichtechniques best respond to the data analysis, for which supervised and unsupervisedlearning techniques are used.
3.3.1. Supervised Learning
For the application of supervised methods, examples require training; for this, adatabase of 2462 samples was obtained, which was reviewed in situ, including 1231 proveninstances of fraud and 1231 of non-fraud. Based on the above, the variables used fortraining are those shown in the following Table 6.
Table 6. Description of the variables.
# Variable Description
x1 Average 13 month average energy consumptionx2 Standard deviation Standard deviation corresponding to monthly energy datax3 Coefficient of variation Expresses the standard deviation as a percentage of the averagex4 Minimum Minimum consumption value of the 13 valuesx5 Maximum Maximum consumption value of the 13 valuesx6 Range Difference between the maximum and minimum value

Energies 2021, 14, 958 12 of 23
Examples of fraud are labeled “1”, and non-fraud examples are labeled “0”. Of the2461 examples, two-thousand sixty-one examples are use for training, and four-hundredare used in the evaluation to identify which provides the best results.
The monitored methods implemented are:
1. Nearest neighbor (K-NN):The algorithm uses the MATLAB® tool; in Figure 4, the algorithm execution responseis given. The training data represent a circular form, and the new data are in a gridform; in red color, data classified as “fraud” and in blue color “no fraud.” The K valueis five, and the operation of this algorithm is simple; it calculates the distance of themost frequent nearest neighbors (in this case, five) and chooses the class.Before training this algorithm, the data are normalized with Equation (1).
Figure 4. K-nearest-neighbor (K-NN).
2. Decision tree:The algorithm is executed with MATLAB®, generating CART-type decision trees; thatis, each node is divided into two. The data are normalized using Equation (1) beforetraining, and the decision tree generated is given in Figure 5.
X3 < 5.36e-05 x1 >= 5.36e-05
X1 < 0.00034 x1 >= 0.00034
1
X2 < 0.025 x2 >= 0.025
0
X3 < 4.69e-05 x3 >= 4.69e-05
1
X1 < 0.53 x1 >= 0.53
10
X3 < 8.60e-05 x3 >= 8.60e-05
X2 < 0.021 x2 >= 0.021
X3 < 8.42e-05 x3 >= 8.42e-05
0
X4 < 0.003 x4 >= 0.003
0
0
X1 < 0.006 x1 >= 0.006
X1 < 0.018 x1 >= 0.018
X1 < 0.017 x1 >= 0.017
X3 < 5.59e-05 x3 >= 5.59e-05
0 1
0 1
0
X3 < 5.53e-05 x3 >= 5.53e-05
X2 < 0.024 x2 >= 0.024
0 1
X3 < 7.04e-05 x3 >= 7.04e-05
X4 < 0.019 x4 >= 0.019
0
X2 < 0.027 x2 >= 0.027
1
X2 < 0.026 x2 >= 0.026
01
Figure 5. Decision tree.

Energies 2021, 14, 958 13 of 23
3. Neural network (ANN):The creation and training of the artificial neural network occur using the Toolboxtool of MATLAB®, in which the perceptron multilayer neural network is used. Theimplemented neural network in Figure 6 shows an input layer with six variables;a hidden layer made up of 10 neurons and an output layer with one neuron forclassification. The training algorithm is the Levenberg–Marquardt backpropagation,and the activation function is the sigmoidal one.The data are normalized with Equation (1) and randomly divided into three parts:70% for training, 15% for validation, and 15% for testing.
W
b
+
Ouput
1
Input
6
W
b
+
10 1
Hidden Layer Ouput Layer
Figure 6. Artificial neural network (ANN).
3.3.2. Unsupervised Learning
Unlike previous techniques, “unsupervised methods” do not need examples fortraining. The technique applied is the following:
1. K-means:The algorithm does not require following the traceability of previous occurrences;the variables of the base matrix is used; however, only the variables mentioned inTable 6 are used compared with other techniques. The K-means technique is basedon grouping by similarities. The algorithm performs a pre-grouping before perform-ing the K-means groupings to avoid bad group formation since the magnitudes ofconsumption between these rates vary significantly. The data are normalized withEquation (2).In Figure 7, an example of the algorithm execution is given; the value of K is two,representing the formation of two groups within the residential rate, the group offraudulent consumption, and the group of consumers that reflect consumption pat-terns without alterations. In this sense, it is necessary to plan the on-site review of themeasurement systems since something is happening with these measurement systems.An example is presented in Figure 7b. The group is selected as Fraudulent Number 2(blue color).
(a)Data (b)Cluster K-means
Figure 7. Residential ratefor cluster K-means.

Energies 2021, 14, 958 14 of 23
4. Results of the Application of the Data Analytics Techniques
Data analytics techniques’ performance is analyzed with the data matrix with 400examples of proven fraud and non-fraud measurement systems, including 200 labeled 1(fraud) and 200 as 0 (no fraud). From this information, the metrics from the confusionmatrix shown in Table 7 are used [5].
Table 7. Confusion matrix.
Actual Values
Fraud (1) No Fraud (0)
Predicted Values Fraud (1) TP FP
No Fraud (0) FN TN
Where [20–22]:
• True positive (TP): when a consumer commits fraud and the technique classifies itas such;
• True negatives (TN): cases correctly cited as non-fraud;• False positive (FP): when a consumer does not commit fraud and the technique
classifies it as fraud;• False negatives (FN): when a consumer commits fraud and the technique classifies it
as non-fraud.
From the confusion matrix presented in Table 7, the concepts of specificity and relia-bility are derived [21,22]:
• Specificity or true positive ratio (TPR): This indicates whether a classification tech-nique performs correctly, stating the proportion of samples cataloged as non-technicalenergy losses corresponding to the total number of non-technical losses within a datagroup, shown in Equation (3).
TPR =TP
TP + FN(3)
• Reliability or a false positive ratio (FPR): This indicates the relationship between falsealarms (consumers falsely classified as committing fraud) and the total number oftrue negatives, shown in Equation (4).
FPR =FP
TN + FP(4)
Compliance with data analytics techniques is compared based on specificity andreliability metrics. Table 8 shows the result of the evaluation of the K-means technique.Intuitively, two groups should exist, that is K = 2 (fraud and not fraud); however, the resultscannot be right; that is why the technique evaluates different values of K.
Good results are obtained when forming 2, 3, 5, and 7 groups, getting high numbersof TP and TN and low numbers of FP and FN; with this, a high percentage of the TPR anda low percentage of FPR are obtained; while with nine groups, the result was in the middle.The results were right, it could happen that in other cases with fewer or more groups, goodor bad results are achieved; that is, there is no precise method that determines the rightnumber of groups and which of them to choose as fraudulent; these depend on the amountof data and the number of groups available. In this case, the expert, based on his/herexperience, must locate the best group.
Table 9 presents the results of evaluating the K-nearest neighbors technique withdifferent K values; the good results during the application of this technique are from thegroup K = 10; this value applies to the corresponding analysis.

Energies 2021, 14, 958 15 of 23
Table 8. Evaluation with metrics of the K-means method.
N◦ of Groups TPR(%)
FPR(%)
2 80 173 80 245 79 247 79 249 49 24
Table 9. Evaluation with metrics of the K-nearest neighbors method.
K TPR(%)
FPR(%)
2 13 623 16 625 24 5610 33 5320 25 82
Table 10 presents the results of the evaluation with the metrics of the supervisedtechniques. It shows that the technique that presented the best results in the three methodswas the neural network. The neural network obtained considerable percentages of the TPR;however, it presented high values of the FPR (43%), indicating that there is a high numberof false positives.
Table 10. Metric evaluation of the supervised methods.
Methods TPR(%)
FPR(%)
K-nearest neighbors (K = 10) 40 39Decision tree 40 63
Neural network 60 43
Comparing the results of data analytics techniques, the K-meansgrouping is the onethat delivered the best results; however, it must be taken into account that the training ofsupervised techniques requires having a database with at least 30% examples.
An evaluation was performed by applying in the same analysis process an unsuper-vised technique (K-means) and a supervised technique to determine the measurementsystems considered as fraudulent. The result of the evaluation is presented in Table 11.
Table 11. Results of combining K-means with a supervised method.
Methods TPR(%)
FPR(%)
K-means +K-neighbors (K = 10)
53 34
K-means +decision tree
55 39
K-means +neural network
87 16
For the evaluation of the different techniques applied in this research, two groupswere used for K-means, as shown in Table 11; when combining the techniques, a betterresult was obtained, where the TPR percentages increased, although the FPR decreased
Energies 2021, 14, 958 16 of 23
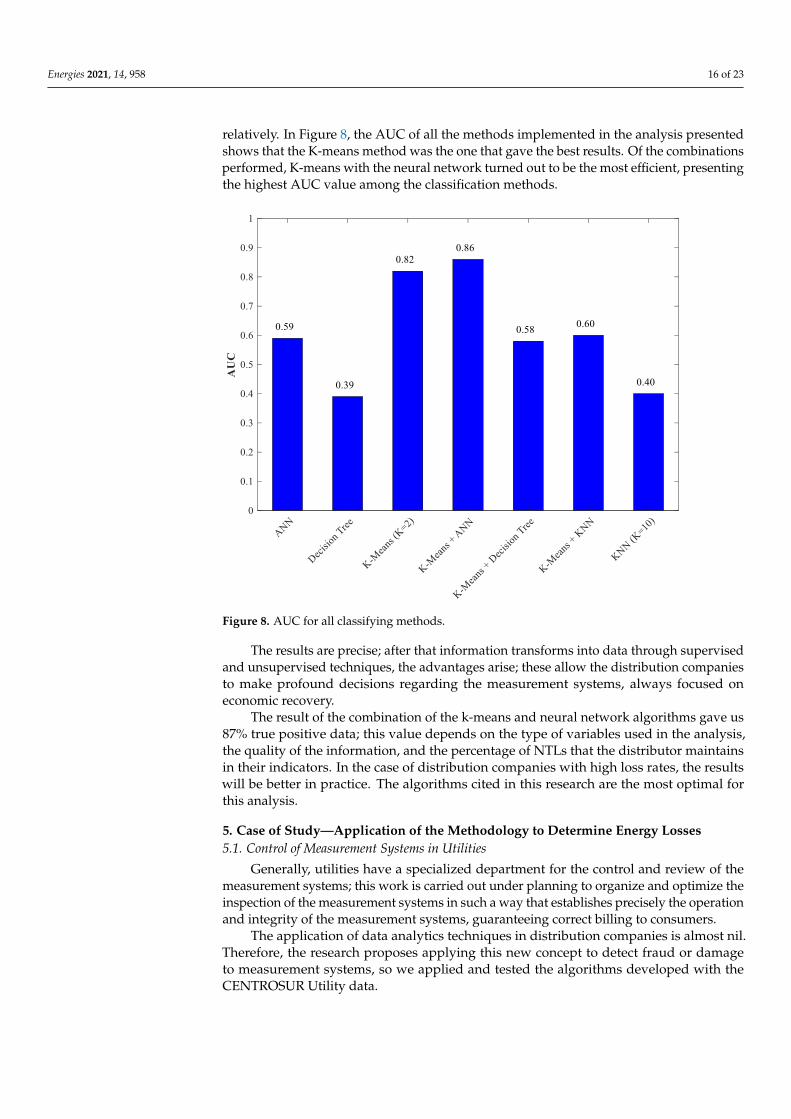
relatively. In Figure 8, the AUC of all the methods implemented in the analysis presentedshows that the K-means method was the one that gave the best results. Of the combinationsperformed, K-means with the neural network turned out to be the most efficient, presentingthe highest AUC value among the classification methods.
Figure 8. AUC for all classifying methods.
The results are precise; after that information transforms into data through supervisedand unsupervised techniques, the advantages arise; these allow the distribution companiesto make profound decisions regarding the measurement systems, always focused oneconomic recovery.
The result of the combination of the k-means and neural network algorithms gave us87% true positive data; this value depends on the type of variables used in the analysis,the quality of the information, and the percentage of NTLs that the distributor maintainsin their indicators. In the case of distribution companies with high loss rates, the resultswill be better in practice. The algorithms cited in this research are the most optimal forthis analysis.
5. Case of Study—Application of the Methodology to Determine Energy Losses5.1. Control of Measurement Systems in Utilities
Generally, utilities have a specialized department for the control and review of themeasurement systems; this work is carried out under planning to organize and optimize theinspection of the measurement systems in such a way that establishes precisely the operationand integrity of the measurement systems, guaranteeing correct billing to consumers.
The application of data analytics techniques in distribution companies is almost nil.Therefore, the research proposes applying this new concept to detect fraud or damageto measurement systems, so we applied and tested the algorithms developed with theCENTROSUR Utility data.

Energies 2021, 14, 958 17 of 23
5.2. Management in the Recovery of Energy Consumed and Not Invoiced
The methodology results are evaluated based on on-site reviews to determine potentialconsumers with energy theft during the trial period. In a universe of 15,000 measurementsystems, the first results obtained were 1816 reviews; of these, we detected 78 measurementsystems with damage and alterations. Under these test conditions, the efficiency of thealgorithm was 4.29%, a relatively optimistic value since the non-technical losses in thedistribution company did not exceed 0.85% of the total losses (6.25%).
While the economic incorporation with the monthly billing for the energy consumedand not invoiced represented a total value of USD 80,869, this value is due to re-billingprocesses duly protected by the Organic Law of the Public Electricity Service. In this way,the economic flow of the specialized department can be cover by the management carriedout through the recovery of the energy consumed and not invoiced.
5.3. Examples of the Application of the Methodology for the Reduction of Non-Technical Losses
The technique’s success goes hand-in-hand with the timely revision executed in themeasurement system; we will explain some application cases that the execution of thealgorithm presents as a result.
With the support of the geographic information system tool, the analysis area wasdetermined using the polygon method to obtain the model’s input variables, as indicatedin Figure 9.
Figure 9. Polygon method of consumers in the group that need to be reviewed.
The measurement systems that presented anomalies in the monthly records are shownin Figure 10. The patterns of electric energy consumption show before and after theanomalous detection resulting from this investigation to recover the energy consumed andnot billed. Figure 10a represents the regularization of the indirect measurement system, CL20, FM 4S, installed with medium voltage (22 kV) with a particular transformation stationof 25 kVA, which maintained a consumption pattern of close to zero since the energy meterhad not appropriately configured the current transformer transformation ratio.
In the polygon of Figure 9, there are 1809 measurement systems among residential,commercial, and industrial rates. In this database, it was found that 11% correspond to atypicaldata (erroneous and NaN), resulting in a list of 1610. The K-means grouping algorithm wasexecuted in this database, and then, the classification was performed using the neural network,determining that 27 measurement systems qualified for an on-site review.

Energies 2021, 14, 958 18 of 23
Figure 10b refers to installing a connection without metering from of public mediumvoltage network in a particular transformer station of 50 kVA. In this case, the meter wasremoved for non-payment in the last few years. When starting a new project, consumersconnected directly so that once executed, the algorithm detected the violation, a measure-ment system was installed, and energy consumption was re-invoiced. The utility recoveredaround 750 kWh/month on average.
The example shown in Figure 10c represents the decrease of a consumer in a timewindow (March 2017 until December 2017); the evidence is in the drop in consumption tozero due to the installation of direct lines; this clandestine connection prevents the energymeter from correctly registering consumption. It detected that around 750 kWh/monthwere lost for 10 months.
In the execution and test of the algorithms, through the k-means cluster, we obtaineddifferent groups of consumers; one of these is the industrial consumers, significant for theutilities due to the consumption. For this example, Figure 10d shows industrial consumerswho kept a fault in a voltage transformer of the three existing ones in the measurementsystem. This decompensation of the magnitude of the voltage in the transformer’s deltaconnection caused the error computed to be more than 47%. Therefore, the window oftime to re-bill was wide, more than seven years. However, the law allows only computingone year. In this manner, it recovered around 1950 MWh/year; in economic terms, thiscorresponded to USD 156,000. In this case, these are important amounts to a utility.
The algorithm no only identifies the fault or the meter being altered, it recognizesthe variation of consumption as the function of an in-depth analysis of different variables.Moreover, the algorithm operation allows separating the clusters not identified as altered.The next example shows a load profile with a decrease of consumption, but without faultor alterations; the event is produced for the season of the service zone; generally, thecommercial consumer does not use the air conditioning during these seasons, as shown inFigure 10e.
The last Figure 10f explains another form of consumption variation. It shows aresidential consumer’s sporadic consumption; generally, his/her home is on the beach orfar from the city, and he/she visits it occasionally.
In summary, with the application of the algorithm, the recovery of energy was con-sumed and but not invoiced was 2,021,800 kWh/year; an USD 161,744 recovery. Thisinformation was taken from the marketing system of the energy distribution company.
Distribution companies in LAC do not have remote, real-time measurement systemsor advanced measurement infrastructure. Generally, the readings, review, and control ofthe measurement systems are managed by humans, requiring considerable investments,prolonged times in periodic reviews, and for some, even the change from conventionalconductors to pre-assembled, with low success rates.
The percentages of non-technical losses may vary from one country to another, evenbetween regions; for this reason, it is important to treat the information of each of thedistributors in a personalized way. This document contributes significantly to the littleexploited topic of the automatic analysis of available customer information for NTL detec-tion. The proposed approach presents advantages in the methodology; it uses 68 variablesamong technical, economic, social, linearized, and correlated data. The information ishomogeneous, to later apply supervised and unsupervised methods in the grouping ac-cording to the similarity of the data. The different techniques applied were evaluatedthrough metrics to obtain the highest probability of potential energy theft events.
On the other hand, it does not require significant investments; since the data are storedand available, the post-analysis management will use the same infrastructure resourcesand existing distributor personnel. The methodology carries out continuous learning eachtime the algorithm is executed; it learns from the real expert data and stores them for futureruns of the algorithm to increase certainty in detecting anomalies. Moreover, a set of rulesthat are executed one-by-one is not required; the expert’s criteria are internalized in thealgorithm’s learning, separating consumers with NTLs from those with true zero or false

Energies 2021, 14, 958 19 of 23
intakes (typical cases). The advantage of applying this methodology is for the distributorswith very low percentages of losses 1% or 2%; therefore, detection will considerably reduceoperating costs, achieving technical efficiency.
(a) Poultry farm consumer (b) Consumer of cocoa processing plant
(c) Bar-restaurant consumer (d) Demand curve for metal industry
(e) Commercial customer (f) Residential customer
Figure 10. Errors in measurement.

Energies 2021, 14, 958 20 of 23
6. Conclusions
This research provides a data processing methodology that improves the detection andidentification of fraud in electricity consumption by a comprehensive analysis of consump-tion patterns using data analytics techniques and artificial neural networks. Combining thek-means clustering and forecasting methods with neural networks gives the smallest errorin the algorithm of 14% for the true positive data. The second method presents an errorof 18%; it uses the k-means grouping method with two groups (k = 2); the third methodthat best adjusts to the detection of true positives is the combination between the k-meansalgorithm and k-nearest neighbors with 40%.
Data mining techniques, accompanied by algorithms with supervised and unsuper-vised methods and artificial intelligence models, have gained particular interest in theelectricity sector since their application depends on the efficiency and effectiveness ofthe processes.
The computation time used to run the methodology was around 25 min, with approxi-mately 15,225 clients and 64 variables, to deliver 1816 reviews. This time can be decreasedconsiderably with the use of supercomputers. On the other hand, it is important to stratifythe planning of potential revisions by zones to keep the revision records updated.
The analysis window in this methodology is monthly; however, it can be narrowereven in real time with advanced measurement infrastructure; the amount of data will growexponentially, requiring the use of servers and big data.
The methodology uses 30% of the knowledge to forecast 70% of the unsupervisedmethods; the function of these algorithms is to determine patterns to acquire trainingaccording to the available variables for a label in the analysis. However, when the sampledoes not have sufficient data, numerous errors are generated in the forecast.
The methodology used to reduce NTLs is beneficial for the energy distribution sector.It can be extended to many utilities in LAC and the rest of the world that present similarsituations; moreover, from the social point of view, a culture of efficient use of electricitycan be developed.
Using the information from CIS, GIS, and socio-economic data, multivariate dataanalysis methods, classification, grouping algorithms (k-means), and neural networks canbe applied to obtain a list of possible revisions of the measurement systems, to optimizethe revisions and their routes, and to recover the most unbilled energy.
The projects that originate through this methodology will allow obtaining an economicreturn in the short term. The rapid change that technological advances promote daily allowsvarious investigations such that more in-depth studies can be performed on distributionsystems, especially for mitigating non-technical energy losses.
This research recommends investing in electrical projects that consider applying thesetechniques since financial indicators will always be positive and recovery will be obtainedin the short term.
Author Contributions: Conceptualization, M.T.-O. and C.A.-M.; methodology, M.T.-O.; software,C.A.-M. and M.T.-O.; investigation M.T.-O., C.A.-M., C.Á.-B., and J.R.-G.; validation, C.Á.-B., D.M.-J., J.R.-G., and E.B.-P.; formal analysis, M.T.-O. and C.Á.-B.; resources, M.T.-O. and C.A.-M.; datacuration, M.T.-O., C.A.-M., J.R.-G., and E.B.-P.; writing—original draft preparation, M.T.-O.; writing—review, and editing, C.A.-M. and C.Á.-B.; supervision, C.Á.-B. and D.M.-J.; project administration,M.T.-O. All authors read and agreed to the published version of the manuscript.
Funding: This research received funding from the project Smart GrI+D+i from the UniversidadCatólica de Cuenca in Ecuador.
Data Availability Statement: Not applicable.
Acknowledgments: The authors thank the “CENTROSUR” utility for their valuable input with dataand evidence for the success of this research.
Conflicts of Interest: The authors declare no conflict of interest.
Energies 2021, 14, 958 21 of 23
AbbreviationsThe following abbreviations are used in this manuscript:
NTL Non-technical lossesGIS Geographic information systemCIS Customer information systemsSAP System application productsCENTROSUR Empresa Eléctrica Regional Centro Sur C.A.TPR True positive rateFPR False positive rateTP True positivesTN True negativesFP False positivesFN False negativesk-NN k-nearest neighborANN Artificial neural networkSVM Support vector machineOPF Optimum path forestAUC Area under the curve
References1. Organización Latinoamericana de Energía—OLADE. Panorama Energético de Latinoamérica y el Caribe; OLADE:Quito, Ecuador,
2019; Volume I.2. Alvarez, C.M.; Rodriguez, J.; Alcazar, M.; Carbonell, J. Análisis para la Implementación de Redes Inteligentes en Ecuador; Editorial
Institucional UPV: Valencia, Spain, 2016; Volume I, pp. 1–287, ISBN 978-84-608-5432-6.3. Costa, B.; Alberto, B.; Portela, A.; Maduro, M.; Eler, E. Fraud Detection in Electric Power Distribution Networks using an
Ann-Based Knowledge-Discovery Process. Int. J. Artif. Intell. Appl. 2013, 4, 17–23. [CrossRef]4. Leon, C.; Biscarri, F.; Monedero, I.; Guerrero, J.I.; Biscarri, J.; Millan, R. Variability and Trend-Based Generalized Rule Induction
Model to NTL Detection in Power Companies. IEEE Trans. Power Syst. 2011, 26, 1798–1807. [CrossRef]5. Monedero, I.; Biscarri, F.; León, C.; Guerrero, J.; Biscarri, J.; Millán, R. Detection of frauds and other non-technical losses in a
power utility using Pearson coefficient, Bayesian networks and decision trees. Int. J. Electr. Power Energy Syst. 2011, 34, 90–98.[CrossRef]
6. Nizar, A.H.; Dong, Z.Y.; Zhao, J.H.; Zhang, P. A Data Mining Based NTL Analysis Method. In Proceedings of the 2007 IEEEPower Engineering Society General Meeting, Tampa, FL, USA, 24–28 June 2007; pp. 1–8. [CrossRef]
7. Leite, D.; Pessanha, J.; Simões, P.; Calili, R.; Souza, R. A Stochastic Frontier Model for Definition of Non-Technical Loss Targets.Energies 2020, 13, 3227. [CrossRef]
8. Arthur, D.; Vassilvitskii, S. K-Means++: The Advantages of Careful Seeding. In Proceedings of the Eighteenth Annual ACM-SIAMSymposium on Discrete Algorithms, New Orleans, LA, USA, 7–9 January 2007; pp. 1027–1035.
9. Sun, S.; Huang, R. An adaptive k-nearest neighbor algorithm. In Proceedings of the 2010 Seventh International Conference onFuzzy Systems and Knowledge Discovery, Yantai, China, 10–12 August 2010; Volume 1, pp. 91–94. [CrossRef]
10. Ramos, C.C.O.; de Sousa, A.N.; Papa, J.P.; Falcão, A.X. A New Approach for Nontechnical Losses Detection Based on Optimum-Path Forest. IEEE Trans. Power Syst. 2011, 26, 181–189. [CrossRef]
11. Nagi, J.; Yap, K.S.; Tiong, S.K.; Ahmed, S.K.; Nagi, F. Improving SVM-Based Nontechnical Loss Detection in Power Utility Usingthe Fuzzy Inference System. IEEE Trans. Power Deliv. 2011, 26, 1284–1285. [CrossRef]
12. León, C.; Biscarri, F.; Monedero, I.; Guerrero, J.; Biscarri, J.; Millán, R. Integrated Expert System Applied to the Analysis of NonTechnical Losses In Power Utilities. Expert Syst. Appl. 2011, 38, 10274–10285. [CrossRef]
13. Toledo, M.; Morales, D.; Vintimilla, J.; Medina, R. Smart multivariate techniques applied in the budget assignment for lossreduction in ecuador. In Proceedings of the 2016 IEEE PES Innovative Smart Grid Technologies Conference Europe (ISGT-Europe),Ljubljana, Slovenia, 9–12 October 2016; Volume I, pp. 1–6. [CrossRef]
14. Ministerio de Energía y Recursos Naturales no Renovables. Plan Maestro de Electricidad of—Ecuador; Ministry of Electricity andRenewable Energy: Quito, Ecuador, 2018; Volume I, pp. 1–390.
15. Zhang, T.; Gao, R.; Sun, S. Theories, Applications and Trends of Non-Technical Losses in Power Utilities Using Machine Learning.In Proceedings of the 2018 2nd IEEE Advanced Information Management, Communicates, Electronic and Automation ControlConference (IMCEC), Xi’an, China, 25–27 May 2018; pp. 2324–2329. [CrossRef]
16. Pózna, A.; Fodor, A.; Hangos, K. Model-based fault detection and isolation of non-technical losses in electrical networks. Math.Comput. Model. Dyn. Syst. 2019, 25, 397–428. [CrossRef]
17. Jamil, F.; Ahmad, E. Policy considerations for limiting electricity theft in the developing countries. Energy Policy 2019, 129, 452–458.[CrossRef]
Energies 2021, 14, 958 22 of 23
18. CIRED. Reduction of Technical and Non-Technical Losses in Distribution Networks. In Proceedings of the InternationalConference on Electricity Distribution, Lyon, France, 15–18 June 2015.
19. Romero Agüero, J. Improving the efficiency of power distribution systems through technical and non-technical losses reduction.In Proceedings of the PES T & D 2012, Orlando, FL, USA, 7–10 May 2012; pp. 1–8. [CrossRef]
20. Viegas, J.L.; Esteves, P.R.; Melício, R.; Mendes, V.M.F.; Vieira, S.M. Solutions for detection of non-technical losses in the electricitygrid: A review. Renew. Sustain. Energy Rev. 2017, 80, 1256–1268. [CrossRef]
21. Monteiro, M.D.; Maciel, R.S. Detection of commercial losses in electric power distribution systems using data mining techniques.In Proceedings of the 2018 Simposio Brasileiro de Sistemas Eletricos (SBSE), Niteroi, Brazil, 12–16 May 2018; pp. 1–6. [CrossRef]
22. Messinis, G.; Hatziargyriou, N. Review of non-technical loss detection methods. Electr. Power Syst. Res. 2018, 158, 250–266.[CrossRef]
23. Ahmad, T.; Chen, H.; Wang, J.; Guo, Y. Review of various modeling techniques for the detection of electricity theft in smart gridenvironment. Renew. Sustain. Energy Rev. 2018, 82. [CrossRef]
24. Gonzalez-Urdaneta, G. A venezuelan experience in the reduction of non-technical power losses. In Proceedings of the CICED2010 Proceedings, Nanjing, China, 13–16 September 2010; pp. 1–6.
25. Yakubu, O.; Babu, C.N.; Adjei, O. Electricity theft: Analysis of the underlying contributory factors in Ghana. Energy Policy 2018,123, 611–618. [CrossRef]
26. Glauner, P.; Glaeser, C.; Dahringer, N.; Valtchev, P.; State, R.; Duarte, D. Non-Technical Losses in the 21st Century: Causes,Economic Effects, Detection and Perspectives; Interdisciplinary Centre for Security, Reliability and Trust, University of Luxembourg:Luxembourg, 2018.
27. Aydin, Z.; Gungor, V.C. A Novel Feature Design and Stacking Approach for Non-Technical Electricity Loss Detection. InProceedings of the 2018 IEEE Innovative Smart Grid Technologies (ISGT), Singapore, 22–25 May 2018; pp. 867–872. [CrossRef]
28. Ghori, K.M.; Rabeeh Ayaz, A.; Awais, M.; Imran, M.; Ullah, A.; Szathmary, L. Impact of Feature Selection on Non-technical LossDetection. In Proceedings of the 2020 6th Conference on Data Science and Machine Learning Applications (CDMA), Riyadh,Saudi Arabia, 21–22 March 2020; pp. 19–24. [CrossRef]
29. Kosut, J.P.; Santomauro, F.; Jorysz, A.; Fernández, A.; Lecumberry, F.; Rodríguez, F. Abnormal consumption analysis for frauddetection: UTE-UDELAR joint efforts. In Proceedings of the 2015 IEEE PES Innovative Smart Grid Technologies Latin America(ISGT LATAM), Montevideo, Uruguay, 5–7 October 2015; pp. 887–892. [CrossRef]
30. wang, D.-G.; Dong, J.-C.; Huang, L.; Gong, Y. Anomaly Behavior Detection Based on Ensemble Decision Tree in PowerDistribution Network. In Proceedings of the 2018 4th Annual International Conference on Network and Information Systems forComputers (ICNISC), Wuhan, China, 19–21 April 2018; pp. 312–316. [CrossRef]
31. Guerrero, J.I.; Monedero, I.; Biscarri, F.; Biscarri, J.; Millán, R.; León, C. Non-Technical Losses Reduction by Improving theInspections Accuracy in a Power Utility. IEEE Trans. Power Syst. 2018, 33, 1209–1218. [CrossRef]
32. Yap, K.S.; Tiong, S.K.; Nagi, J.; Koh, J.S.; Nagi, F. Comparison of supervised learning techniques for non-technical loss detectionin power utility. Int. Rev. Comput. Softw. 2012, 7, 626–636.
33. Guerrero, J.; León, C.; Monedero, I.; Biscarri, F.; Biscarri, J. Improving Knowledge-Based Systems with statistical techniques, textmining, and neural networks for non-technical loss detection. Knowl.-Based Syst. 2014, 71, 376–388. [CrossRef]
34. Ford, V.; Siraj, A.; Eberle, W. Smart grid energy fraud detection using artificial neural networks. In Proceedings of the 2014 IEEESymposium on Computational Intelligence Applications in Smart Grid (CIASG), Orlando, FL, USA, 9–12 December 2014; pp. 1–6.[CrossRef]
35. Micheli, G.; Soda, E.; Vespucci, M.; Gobbi, M.; Bertani, A. Big data analytics: an aid to detection of non-technical losses in powerutilities. Comput. Manag. Sci. 2018, 16, 1–15. [CrossRef]
36. Barros, R.; Costa, E.; Araujo, J. Use of ANN for identification of consumers with irregular electrical installations. In Proceedingsof the 2018 Simposio Brasileiro de Sistemas Eletricos (SBSE), Niteroi, Brazil, 12–16 May 2018; pp. 1–6. [CrossRef]
37. Ramos, C.; Rodrigues, D.; Souza, A.; Papa, J. On the Study of Commercial Losses in Brazil: A Binary Black Hole Algorithm forTheft Characterization. IEEE Trans. Smart Grid 2016, 9, 1–1. [CrossRef]
38. Messinis, G.M.; Hatziargyriou, N.D. Unsupervised Classification for Non-Technical Loss Detection. In Proceedings of the 2018Power Systems Computation Conference (PSCC), Dublin, Ireland, 11–15 June 2018; pp. 1–7. [CrossRef]
39. Umar, H.A.; Prasad, R.; Fonkam, M. Assessing Severity of Non-technical Losses in Power using Clustering Algorithms. InProceedings of the 2019 15th International Conference on Electronics, Computer and Computation (ICECCO), Abuja, Nigeria,10–12 December 2019; pp. 1–6. [CrossRef]
40. Terciyanli, E.; Eryigit, E.; Emre, T.; Caliskan, S. Score based non-technical loss detection algorithm for electricity distributionnetworks. In Proceedings of the 2017 5th International Istanbul Smart Grid and Cities Congress and Fair (ICSG), Istanbul, Turkey,19–21 April 2017; pp. 180–184. [CrossRef]
41. Babu, T.V.; Murthy, T.S.; Sivaiah, B. Detecting unusual customer consumption profiles in power distribution systems — APSPDCL.In Proceedings of the 2013 IEEE International Conference on Computational Intelligence and Computing Research, Enathi, India,26–28 December 2013; pp. 1–5. [CrossRef]
42. Yeckle, J.; Tang, B. Detection of Electricity Theft in Customer Consumption Using Outlier Detection Algorithms. In Proceedingsof the 2018 1st International Conference on Data Intelligence and Security (ICDIS), South Padre Island, TX, USA, 8–10 April 2018;pp. 135–140. [CrossRef]

Energies 2021, 14, 958 23 of 23
43. Moghaddass, R.; Wang, J. A Hierarchical Framework for Smart Grid Anomaly Detection Using Large-Scale Smart Meter Data.IEEE Trans. Smart Grid 2018, 9, 5820–5830. [CrossRef]
44. Zanetti, M.; Jamhour, E.; Pellenz, M.; Penna, M.; Zambenedetti, V.; Chueiri, I. A Tunable Fraud Detection System for AdvancedMetering Infrastructure Using Short-Lived Patterns. IEEE Trans. Smart Grid 2019, 10, 830–840. [CrossRef]
45. Kazymov, I.; Kompaneets, B. Definition of Fact and Place of Losses in Low Voltage Electric Networks. In Proceedings of the 2019International Conference on Industrial Engineering, Applications and Manufacturing (ICIEAM), Sochi, Russia, 25–29 March 2019;pp. 1–5. [CrossRef]
46. Jindal, A.; Dua, A.; Kaur, K.; Singh, M.; Kumar, N.; Mishra, S. Decision Tree and SVM-Based Data Analytics for Theft Detectionin Smart Grid. IEEE Trans. Ind. Inform. 2016, 12, 1005–1016. [CrossRef]
47. Pulz, J.; Muller, R.B.; Romero, F.; Meffe, A.; Neto, A.F.G.; Jesus, A.S. Fraud detection in low-voltage electricity consumers usingsocio-economic indicators and billing profile in smart grids. CIRED-Open Access Proc. J. 2017, 2017, 2300–2303. [CrossRef]
48. Messinis, G.M.; Rigas, A.E.; Hatziargyriou, N.D. A Hybrid Method for Non-Technical Loss Detection in Smart Distribution Grids.IEEE Trans. Smart Grid 2019, 10, 6080–6091. [CrossRef]
49. Zheng, K.; Chen, Q.; Wang, Y.; Kang, C.; Xia, Q. A Novel Combined Data-Driven Approach for Electricity Theft Detection. IEEETrans. Ind. Inform. 2019, 15, 1809–1819. [CrossRef]
50. Bholowalia, P.; Kumar, A. EBK-Means: A Clustering Technique based on Elbow Method and K-Means in WSN. Int. J. Comput.Appl. 2014, 105, 17–24.
51. Passos Júnior, L.; Ramos, C.; Rodrigues, D.; Pereira, D.; Souza, A.; Costa, K.; Papa, J. Unsupervised non-technical lossesidentification through optimum-path forest. Electr. Power Syst. Res. 2016, 140. [CrossRef]
52. Al-Radaideh, Q.A.; Al-Zoubi, M.M. A data mining based model for detection of fraudulent behaviour in water consumption. InProceedings of the 2018 9th International Conference on Information and Communication Systems (ICICS), Irbid, Jordan, 3–5April 2018; pp. 48–54. [CrossRef]
53. Glauner, P.; Meira, J.A.; Dolberg, L.; State, R.; Bettinger, F.; Rangoni, Y. Neighborhood Features Help Detecting Non-TechnicalLosses in Big Data Sets. In Proceedings of the 2016 IEEE/ACM 3rd International Conference on Big Data Computing Applicationsand Technologies (BDCAT), Shanghai, China, 6–9 December 2016; pp. 253–261.
54. Rokach, L.; Maimon, O. Data Mining with Decision Trees: Theory and Applications; Series in Machine Perception and ArtificialIntelligence; World Scientific: Singapore, 2015.
55. Glauner, P.; Meira, J.; Valtchev, P.; State, R.; Bettinger, F. The Challenge of Non-Technical Loss Detection Using ArtificialIntelligence: A Survey. Int. J. Comput. Intell. Syst. 2017, 10, 760–775. [CrossRef]