Integrated Algebra
58
1 THE STATE EDUCATION DEPARTMENT / THE UNIVERSITY OF THE STATE OF NEW YORK / ALBANY, NY 12234 Curriculum, Instruction, and Instructional Technology Team - Room 320 EB www.emsc.nysed.gov/ciai email: [email protected] Integrated Algebra Sample Tasks for Integrated Algebra, developed by New York State teachers, are clarifications, further explaining the language and intent of the associated Performance Indicators. These tasks are not test items, nor are they meant for students' use. Strands Process Content Problem Solving Reasoning and Proof Communication Connections Representation Number Sense and Operations Algebra Geometry Measurement Statistics and Probability Problem Solving Strand Students willbuild new mathematical knowledge through problem solving. A.PS.1 Use a variety of problem solving strategies to understand new mathematical content A.PS.1a Using one inch grid paper, draw a rectangle with a length of 3 inches and a width of 5 inches and find the area of the rectangle. Next, using cubes or stackable blocks, build a tower or rectangular prism with a height of 4 inches on the rectangle that you drew. How can you use the area of a rectangle to help find the volume of the rectangular prism? On the one inch grid paper draw a circle with a diameter of 4 inches and find the area of the circle. How can you use the area of a circle to determine the volume of a cylinder with diameter of 4 inches and height of 5 inches?
-
Upload
khangminh22 -
Category
Documents
-
view
1 -
download
0
Transcript of Integrated Algebra

1
THE STATE EDUCATION DEPARTMENT / THE UNIVERSITY OF THE STATE OF NEW YORK / ALBANY, NY 12234
Curriculum, Instruction, and Instructional Technology Team - Room 320 EB www.emsc.nysed.gov/ciai
email: [email protected]
Integrated Algebra Sample Tasks for Integrated Algebra, developed by New York State teachers, are clarifications, further explaining the language and intent of the associated Performance Indicators. These tasks are not test items, nor are they meant for students' use.
Strands Process Content
Problem Solving
Reasoning and Proof
Communication
Connections
Representation
Number Sense and Operations
Algebra
Geometry
Measurement
Statistics and Probability
Problem Solving Strand Students willbuild new mathematical knowledge through problem solving. A.PS.1 Use a variety of problem solving strategies to understand new mathematical content A.PS.1a Using one inch grid paper, draw a rectangle with a length of 3 inches and a width of 5 inches and find the area of the rectangle. Next, using cubes or stackable blocks, build a tower or rectangular prism with a height of 4 inches on the rectangle that you drew. How can you use the area of a rectangle to help find the volume of the rectangular prism?
On the one inch grid paper draw a circle with a diameter of 4 inches and find the area of the circle. How can you use the area of a circle to determine the volume of a cylinder with diameter of 4 inches and height of 5 inches?
2
A.PS.2 Recognize and understand equivalent representations of a problem situation or a mathematical concept
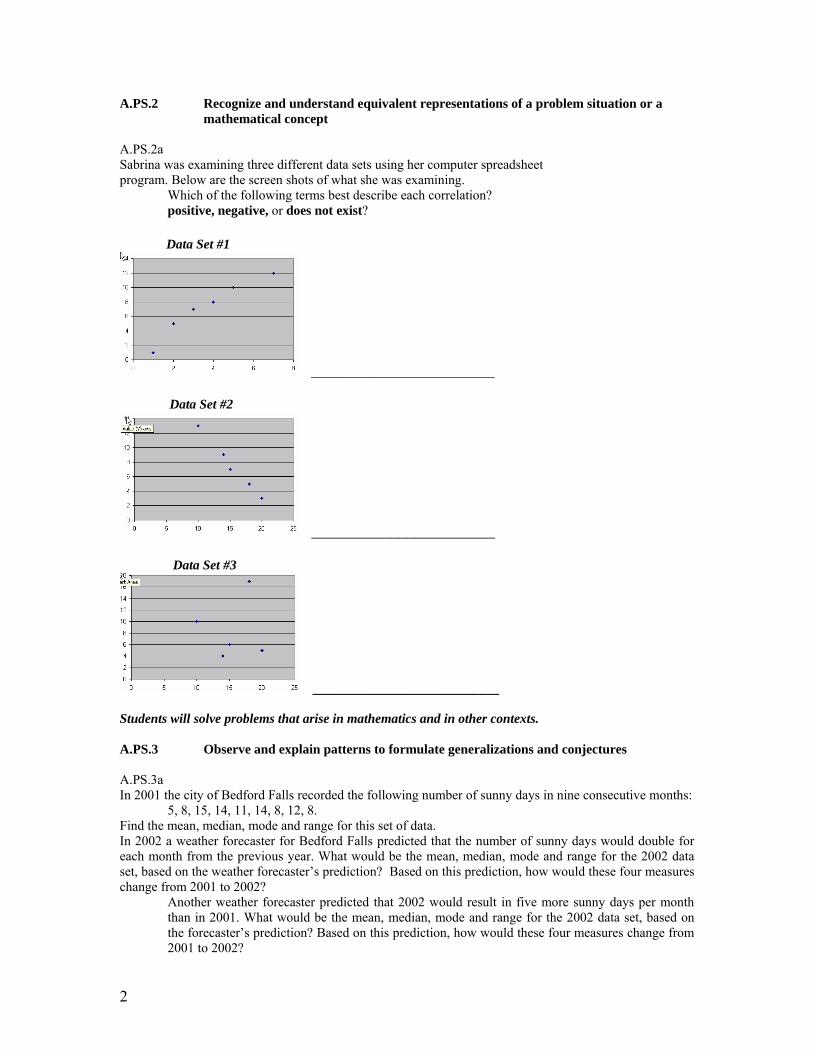
A.PS.2a Sabrina was examining three different data sets using her computer spreadsheet program. Below are the screen shots of what she was examining.
Which of the following terms best describe each correlation? positive, negative, or does not exist?
Data Set #1
_______________________ Data Set #2
_______________________ Data Set #3
_____________________ Students will solve problems that arise in mathematics and in other contexts. A.PS.3 Observe and explain patterns to formulate generalizations and conjectures A.PS.3a In 2001 the city of Bedford Falls recorded the following number of sunny days in nine consecutive months:
5, 8, 15, 14, 11, 14, 8, 12, 8. Find the mean, median, mode and range for this set of data. In 2002 a weather forecaster for Bedford Falls predicted that the number of sunny days would double for each month from the previous year. What would be the mean, median, mode and range for the 2002 data set, based on the weather forecaster’s prediction? Based on this prediction, how would these four measures change from 2001 to 2002?
Another weather forecaster predicted that 2002 would result in five more sunny days per month than in 2001. What would be the mean, median, mode and range for the 2002 data set, based on the forecaster’s prediction? Based on this prediction, how would these four measures change from 2001 to 2002?
3
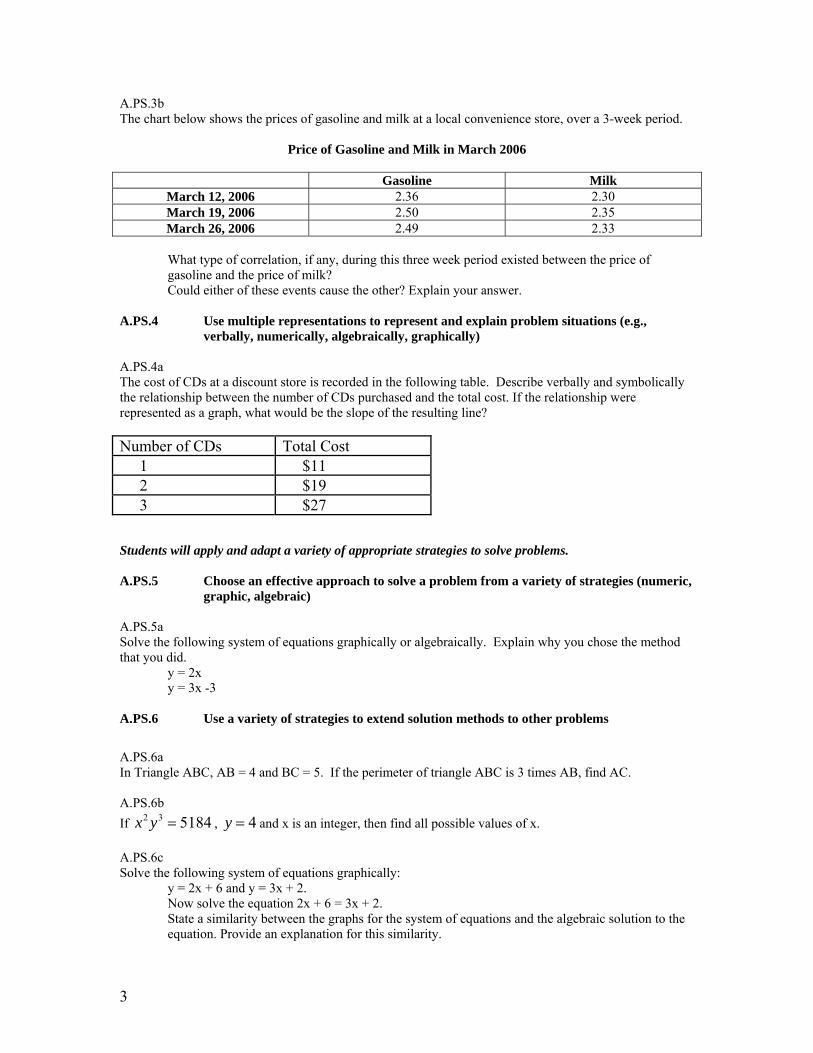
A.PS.3b The chart below shows the prices of gasoline and milk at a local convenience store, over a 3-week period.
Price of Gasoline and Milk in March 2006 Gasoline Milk
March 12, 2006 2.36 2.30 March 19, 2006 2.50 2.35 March 26, 2006 2.49 2.33
What type of correlation, if any, during this three week period existed between the price of gasoline and the price of milk? Could either of these events cause the other? Explain your answer.
A.PS.4 Use multiple representations to represent and explain problem situations (e.g.,
verbally, numerically, algebraically, graphically) A.PS.4a The cost of CDs at a discount store is recorded in the following table. Describe verbally and symbolically the relationship between the number of CDs purchased and the total cost. If the relationship were represented as a graph, what would be the slope of the resulting line?
Students will apply and adapt a variety of appropriate strategies to solve problems.
A.PS.5 Choose an effective approach to solve a problem from a variety of strategies (numeric,
graphic, algebraic) A.PS.5a Solve the following system of equations graphically or algebraically. Explain why you chose the method that you did.
y = 2x y = 3x -3
A.PS.6 Use a variety of strategies to extend solution methods to other problems
A.PS.6a In Triangle ABC, AB = 4 and BC = 5. If the perimeter of triangle ABC is 3 times AB, find AC. A.PS.6b If 518432 =yx , 4=y and x is an integer, then find all possible values of x. A.PS.6c Solve the following system of equations graphically:
y = 2x + 6 and y = 3x + 2. Now solve the equation 2x + 6 = 3x + 2. State a similarity between the graphs for the system of equations and the algebraic solution to the equation. Provide an explanation for this similarity.
Number of CDs Total Cost 1 $11 2 $19 3 $27
4
A.PS.6d A rectangle, ABCD, has the length, AB, of 12 and width, BC, of 4. Draw a rectangle, KLMN, so that rectangle KLMN is similar to rectangle ABCD. If AB:KL = 3:2, find the dimensions of the new rectangle. A.PS.7 Work in collaboration with others to propose, critique, evaluate, and value alternative
approaches to problem solving A.PS.7a Work with two other students to solve the following problem:
Cameron received a set of four grades. If the average of the first two grades is 50, the average of the second and third grades is 75, and the average of the third and fourth grades is 70, then what is the average of the first and fourth grades?
Be prepared to present your solution to the class. The other groups in the class will also present their solutions. You will evaluate each other’s solutions according to the following criteria: accuracy of the solution, clarity of the explanation, efficiency of the solution method, and creativity. Students will monitor and reflect on the process of mathematical problem solving. A.PS.8 Determine information required to solve a problem, choose methods for obtaining the
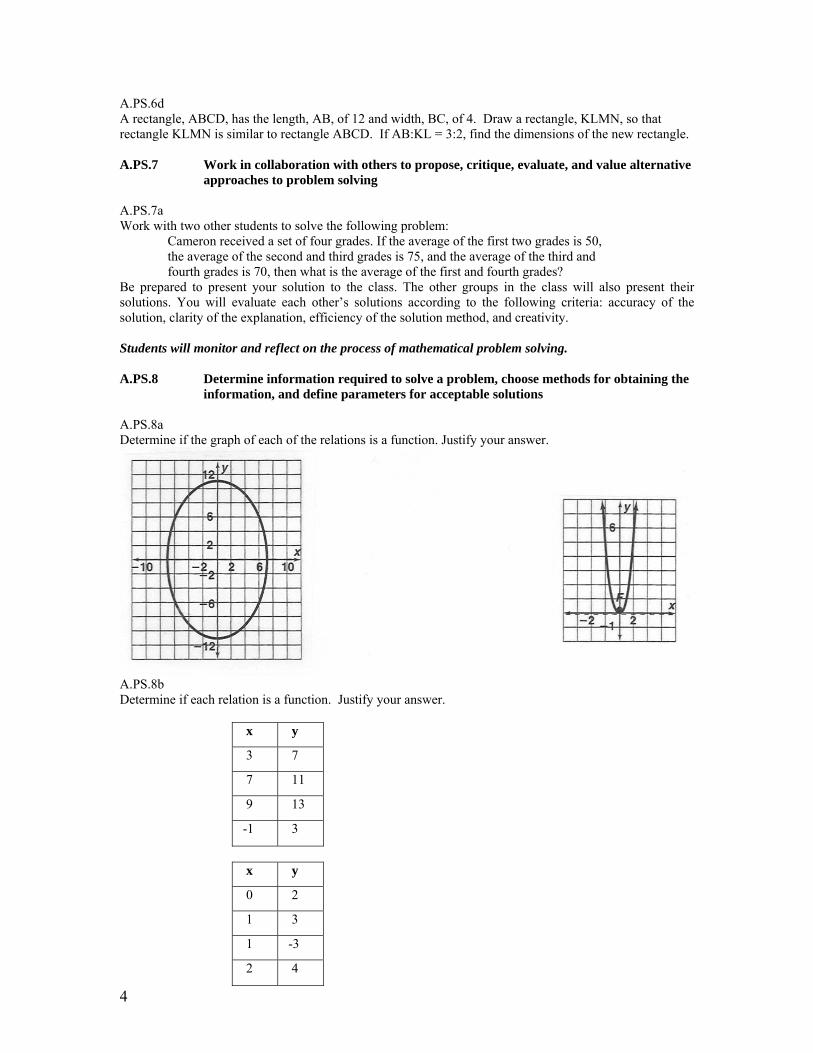
information, and define parameters for acceptable solutions A.PS.8a Determine if the graph of each of the relations is a function. Justify your answer.
A.PS.8b Determine if each relation is a function. Justify your answer.
x y
3 7
7 11
9 13
-1 3
x y
0 2
1 3
1 -3
2 4
5
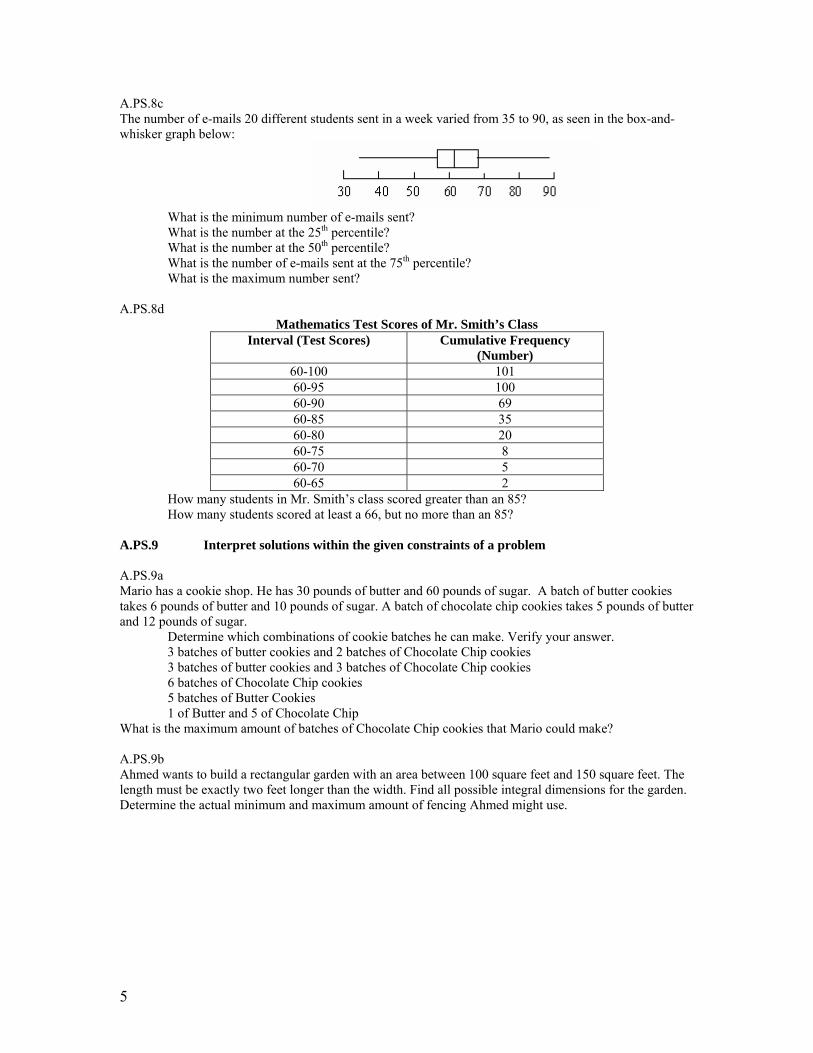
A.PS.8c The number of e-mails 20 different students sent in a week varied from 35 to 90, as seen in the box-and-whisker graph below:
What is the minimum number of e-mails sent? What is the number at the 25th percentile? What is the number at the 50th percentile? What is the number of e-mails sent at the 75th percentile? What is the maximum number sent?
A.PS.8d
Mathematics Test Scores of Mr. Smith’s Class Interval (Test Scores) Cumulative Frequency
(Number) 60-100 101 60-95 100 60-90 69 60-85 35 60-80 20 60-75 8 60-70 5 60-65 2
How many students in Mr. Smith’s class scored greater than an 85? How many students scored at least a 66, but no more than an 85?
A.PS.9 Interpret solutions within the given constraints of a problem A.PS.9a Mario has a cookie shop. He has 30 pounds of butter and 60 pounds of sugar. A batch of butter cookies takes 6 pounds of butter and 10 pounds of sugar. A batch of chocolate chip cookies takes 5 pounds of butter and 12 pounds of sugar.
Determine which combinations of cookie batches he can make. Verify your answer. 3 batches of butter cookies and 2 batches of Chocolate Chip cookies 3 batches of butter cookies and 3 batches of Chocolate Chip cookies 6 batches of Chocolate Chip cookies 5 batches of Butter Cookies 1 of Butter and 5 of Chocolate Chip
What is the maximum amount of batches of Chocolate Chip cookies that Mario could make? A.PS.9b Ahmed wants to build a rectangular garden with an area between 100 square feet and 150 square feet. The length must be exactly two feet longer than the width. Find all possible integral dimensions for the garden. Determine the actual minimum and maximum amount of fencing Ahmed might use.

6
A.PS.10 Evaluate the relative efficiency of different representations and solution methods of a problem
A.PS.10a Three different students were presented with the following problem:
Find the values of y for the equation y = 3x +13 when x = 3, 10, 18, 23, and 31. Student 1 solved the equation by substituting the given values for x in the equation and then solving for y each time. Student 2 correctly keyed this equation into a graphing calculator and used the “table” function for finding what the value of y would be for each of the values of x given in the problem. Student 3 solved the equation by graphing it on graph paper and using knowledge of y=mx+b.
Which solution method will lead to finding the answers more efficiently? Justify your answer. Back to top
Reasoning and Proof Strand Students will recognize reasoning and proof as fundamental aspects of mathematics. A.RP.1 Recognize that mathematical ideas can be supported by a variety of strategies A.RP.1a Sabrina was examining three different data sets using her computer spreadsheet program. Below are the screen shots of what she was examining. Which of the following terms best describe each correlation? positive, negative or does not exist? Data Set #1
_______________________ Data Set #2
_______________________ Data Set #3
_____________________
7
Students will make and investigate mathematical conjectures. A.RP.2 Use mathematical strategies to reach a conclusion and provide supportive arguments
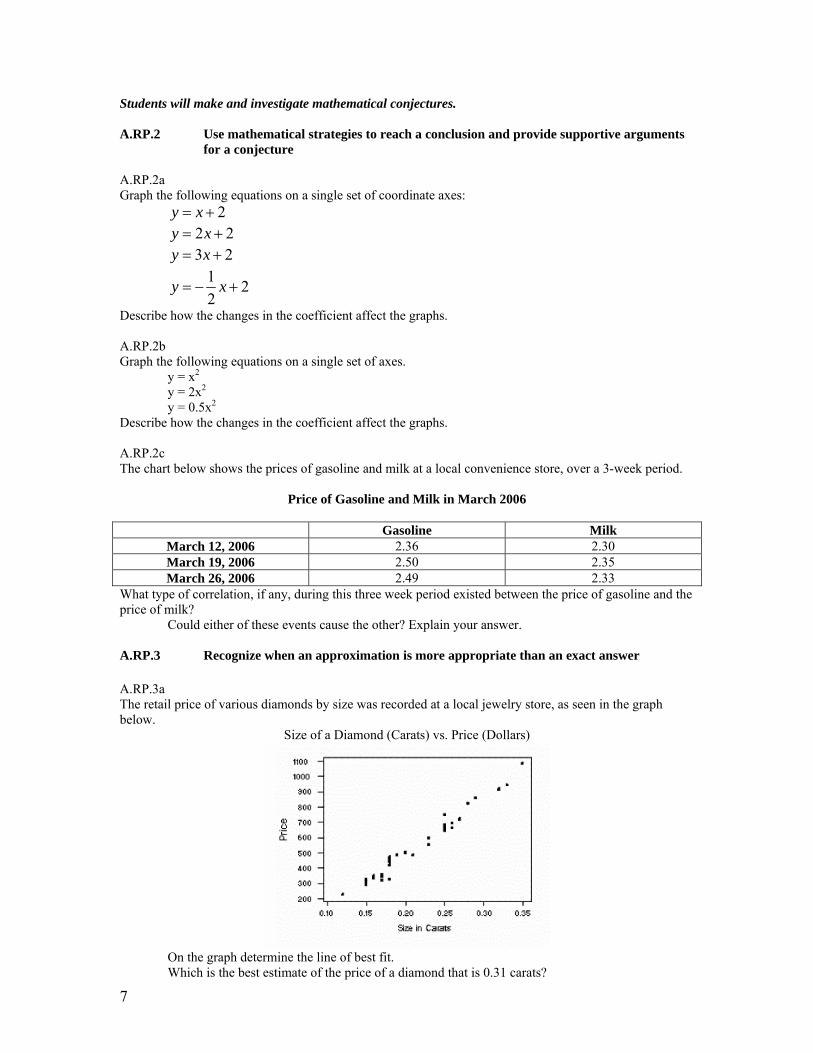
for a conjecture A.RP.2a Graph the following equations on a single set of coordinate axes:
2y x= + 2 2y x= + 3 2y x= +
1 22
y x= − +
Describe how the changes in the coefficient affect the graphs. A.RP.2b Graph the following equations on a single set of axes.
y = x2 y = 2x2 y = 0.5x2
Describe how the changes in the coefficient affect the graphs. A.RP.2c The chart below shows the prices of gasoline and milk at a local convenience store, over a 3-week period.
Price of Gasoline and Milk in March 2006 Gasoline Milk
March 12, 2006 2.36 2.30 March 19, 2006 2.50 2.35 March 26, 2006 2.49 2.33
What type of correlation, if any, during this three week period existed between the price of gasoline and the price of milk?
Could either of these events cause the other? Explain your answer. A.RP.3 Recognize when an approximation is more appropriate than an exact answer A.RP.3a The retail price of various diamonds by size was recorded at a local jewelry store, as seen in the graph below.
Size of a Diamond (Carats) vs. Price (Dollars)
On the graph determine the line of best fit. Which is the best estimate of the price of a diamond that is 0.31 carats?
8
Students will develop and evaluate mathematical arguments and proofs. A.RP.4 Develop, verify, and explain an argument, using appropriate mathematical ideas and
language A.RP.4a
The formula,2
)1( +nn, is used for finding the sum of the first n consecutive numbers, where n represents
the amount of numbers to be counted. Use the formula to find the sum of the first ten counting numbers. Add the first ten counting numbers to verify your answer. A.RP.4b The sides of a triangle are 5, 35 and 10. Do these sides form a right triangle? Justify your answer.
A.RP.5 Construct logical arguments that verify claims or counterexamples that refute them A.RP.5a Three friends (Mark, Oman and Patty) agreed to buy lunch for each other on Monday, Tuesday and Wednesday. They decided to eat pizza, tacos or burgers on each of the three days. They also agreed that:
Mark would not pay on Monday. Oman would pay before Mark paid. Patty would pay the first day.
Determine if this statement is correct, and justify your answer: “Mark paid on Wednesday.”
If Patty paid on the day they ate pizza, and Mark paid on a day they did not eat burgers, did they eat tacos on Tuesday? Justify your answer. A.RP.5b A math class practiced multiplying numbers written in scientific notation. The students were asked to devise a rule that could be used for this operation. Stephen made the following conjecture: ( 10 )( 10 ) 10x y xyN M NM× × = × Stephen believes that you should multiply the leading numbers between 1 and 10 (N and M) and you should also multiply the exponents (x and y). Do you agree with Stephen’s conjecture? If you agree, justify the conjecture. If you disagree, provide a counterexample. A.RP.6 Present correct mathematical arguments in a variety of forms A.RP.6a Having just purchased a DVD player, Dean is comparing the costs of renting DVDs from Lucas DVDs and Dynamite DVDs. Lucas charges a monthly membership fee of $50.00 and rents DVDs in multiples of 5. For each multiple of 5 DVDs, there is a $7.00 charge. Dynamite DVDs does not have a membership fee and also rents DVDs in multiples of 5. For each multiple of 5 DVDs, there is a charge of $30.00
Determine which DVD rental company offers a more cost-efficient offer by constructing a table and graphing the results for each company. For every multiple of 5 DVDs rented, would it always be better to use one company over the other? Justify your answer.
A.RP.7 Evaluate written arguments for validity A.RP.7a Explain why LINE #3 is not a causal relationship to Lines #1 and #2.
LINE #1: As children progress through elementary school, they often get more tooth fillings. LINE #2: As children progress through elementary school, they often increase their vocabulary. LINE #3: Therefore, if children get more cavities, they will increase their vocabulary.
9
Students will select and use various types of reasoning and methods of proof. A.RP.8 Support an argument by using a systematic approach to test more than one case A.RP.8a Given a is an even integer and b is an odd integer, is 2a + b 2 always even or always odd? Explain. A.RP.9 Devise ways to verify results or use counterexamples to refute incorrect statements A.RP.9a Given the following statement: If a and b are integers, then abba −=− .
Determine whether this statement is true or false. If true, justify. If false, give a counterexample. A.RP.9b In math class, Joseph did the following problem 15312 =+ . Is Joseph correct? If not, what is the correct sum and how would you show Joseph how to get that answer. A.RP.9c Tom stated that if n is a positive integer, then 412 ++ nn is prime. Sue stated that Tom was incorrect. Show how Sue was able to prove her case. A.RP.10 Extend specific results to more general cases A.RP.10a In how many ways can each of the following collections of different objects be arranged?
Five flowers The six letters in the word HOCKEY 10 books n candy bars The flags of r countries y playing cards from a standard deck
A.RP.10b Write an equation for the line that passes through each of the following pairs of points:
(1, 5) and (-7, 5) (12, 8) and (12, 1) (3, -2) and (-6, -2) (-9, -4) and (-9, 0)
(0, 4.5) and (11, 4.5) 1 1(2 , )2 2
and 1(2 , 6)2−
(8, a) and (-3, a) (p, -1) and (p, 5) (m, q) and (-2n, q) (c, 2b) and (c, 3b)
A.RP.11 Use a Venn diagram to support a logical argument A.RP.11a Mr. Johnson has 30 students in his first period math class. Of those 30 students, 18 students passed their first exam, 21 students passed the second exam and 14 students passed both exams. Construct a Venn diagram to represent this information and determine how many students did not pass either exam. A.RP.11b 100 children attended summer camp. 46 children played soccer. 25 children played soccer and basketball. 24 children played soccer and baseball. 50 children played basketball. 19 children played baseball and basketball. 46 children played baseball. 13 children played all three sports. Construct a Venn diagram to represent how many children played each sport. How many children did not play any of these sports? How many children played only one sport? How many children played baseball and soccer but not basketball?
10
A.RP.12 Apply inductive reasoning in making and supporting mathematical conjectures A.RP.12a In Mr. Smith’s classroom this school year, the students have studied the following quadrilaterals: parallelograms, rectangles, and squares. Based on the properties of these quadrilaterals, make at least 2 conjectures about the properties of quadrilaterals in general. When Mr. Smith’s students study the trapezoid, will your conjectures still be true? Explain your answer. Back to top
Communication Strand Students will organize and consolidate their mathematical thinking through communication. A.CM.1 Communicate verbally and in writing a correct, complete, coherent, and clear design
(outline) and explanation for the steps used in solving a problem A.CM.1a A research company wanted to obtain data on what is watched on television by community members who are 18 years old and older. The research company made random telephone calls to homes in the community. The telephone calls resulted in:
An inability to reach a person in 53% of the homes called. The exclusion of non-telephone homes in the community. Those surveyed were 72% male and 28% female.
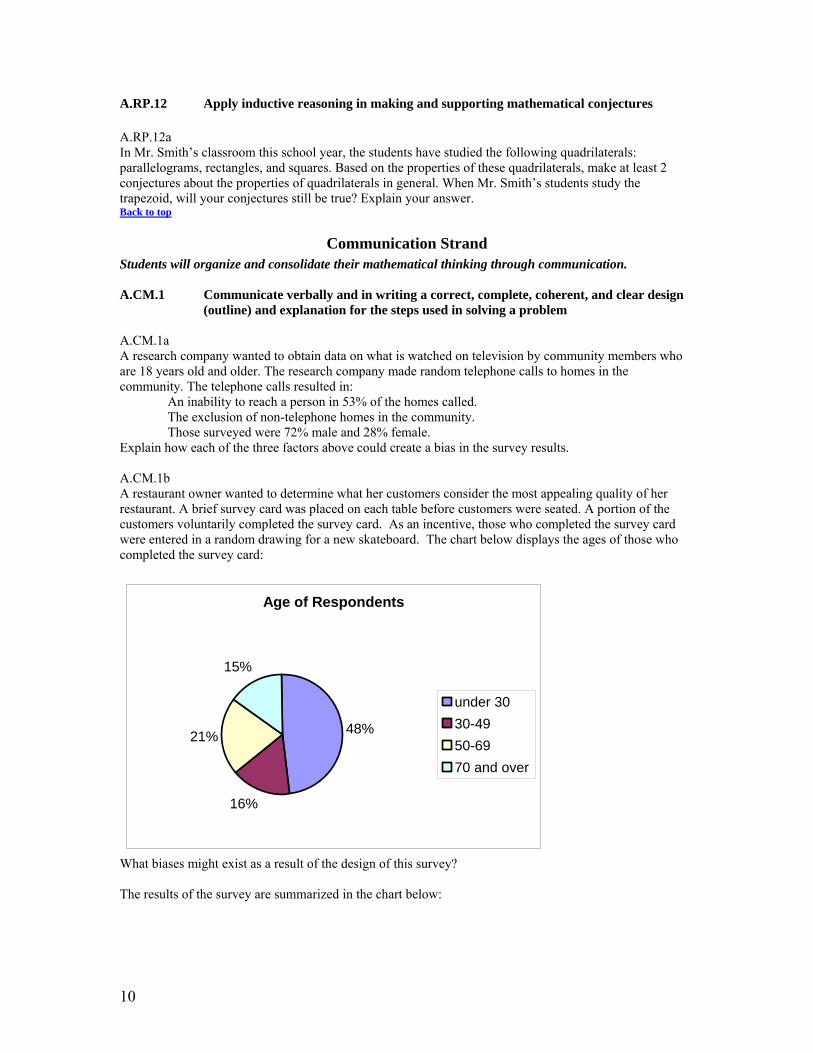
Explain how each of the three factors above could create a bias in the survey results. A.CM.1b A restaurant owner wanted to determine what her customers consider the most appealing quality of her restaurant. A brief survey card was placed on each table before customers were seated. A portion of the customers voluntarily completed the survey card. As an incentive, those who completed the survey card were entered in a random drawing for a new skateboard. The chart below displays the ages of those who completed the survey card:
Age of Respondents
16%
21%
15%
48%
under 3030-4950-6970 and over
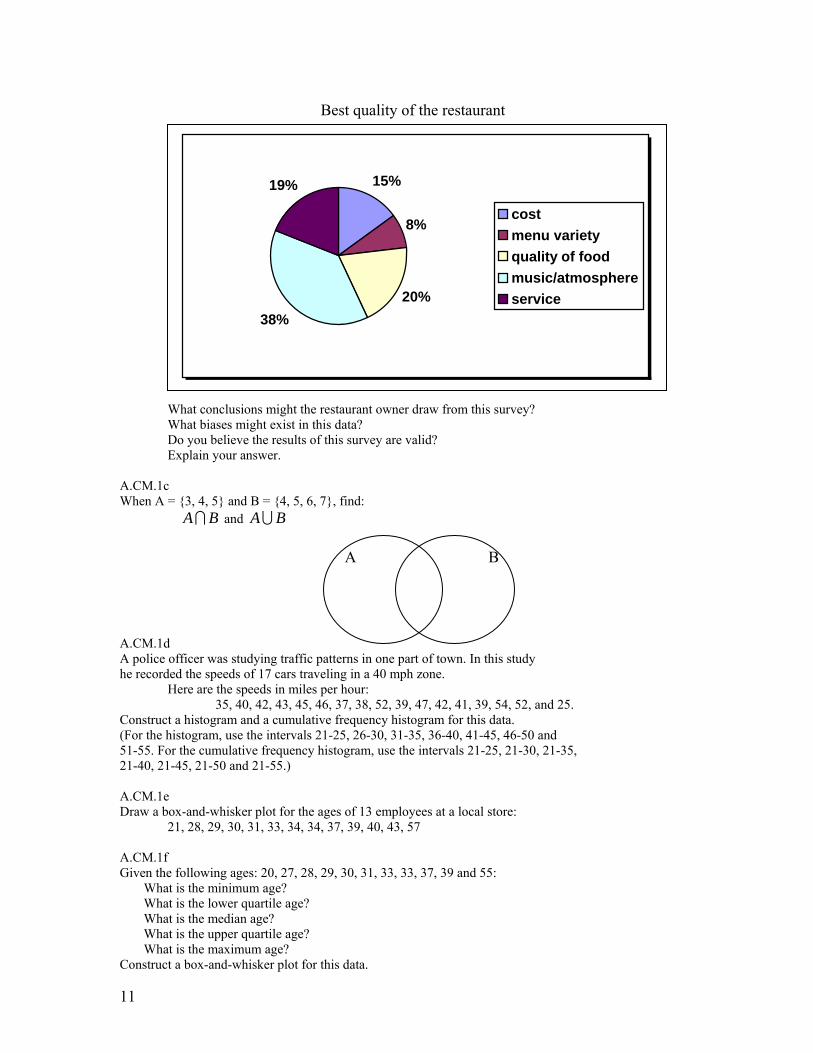
What biases might exist as a result of the design of this survey? The results of the survey are summarized in the chart below:
11
What conclusions might the restaurant owner draw from this survey? What biases might exist in this data? Do you believe the results of this survey are valid? Explain your answer.
A.CM.1c When A = {3, 4, 5} and B = {4, 5, 6, 7}, find: A BI and A BU
A.CM.1d A police officer was studying traffic patterns in one part of town. In this study he recorded the speeds of 17 cars traveling in a 40 mph zone.
Here are the speeds in miles per hour: 35, 40, 42, 43, 45, 46, 37, 38, 52, 39, 47, 42, 41, 39, 54, 52, and 25.
Construct a histogram and a cumulative frequency histogram for this data. (For the histogram, use the intervals 21-25, 26-30, 31-35, 36-40, 41-45, 46-50 and 51-55. For the cumulative frequency histogram, use the intervals 21-25, 21-30, 21-35, 21-40, 21-45, 21-50 and 21-55.) A.CM.1e Draw a box-and-whisker plot for the ages of 13 employees at a local store:
21, 28, 29, 30, 31, 33, 34, 34, 37, 39, 40, 43, 57 A.CM.1f Given the following ages: 20, 27, 28, 29, 30, 31, 33, 33, 37, 39 and 55:
What is the minimum age? What is the lower quartile age? What is the median age? What is the upper quartile age? What is the maximum age?
Construct a box-and-whisker plot for this data.
15%
8%
20%38%
19%
costmenu varietyquality of foodmusic/atmosphereservice
Best quality of the restaurant
A B
12
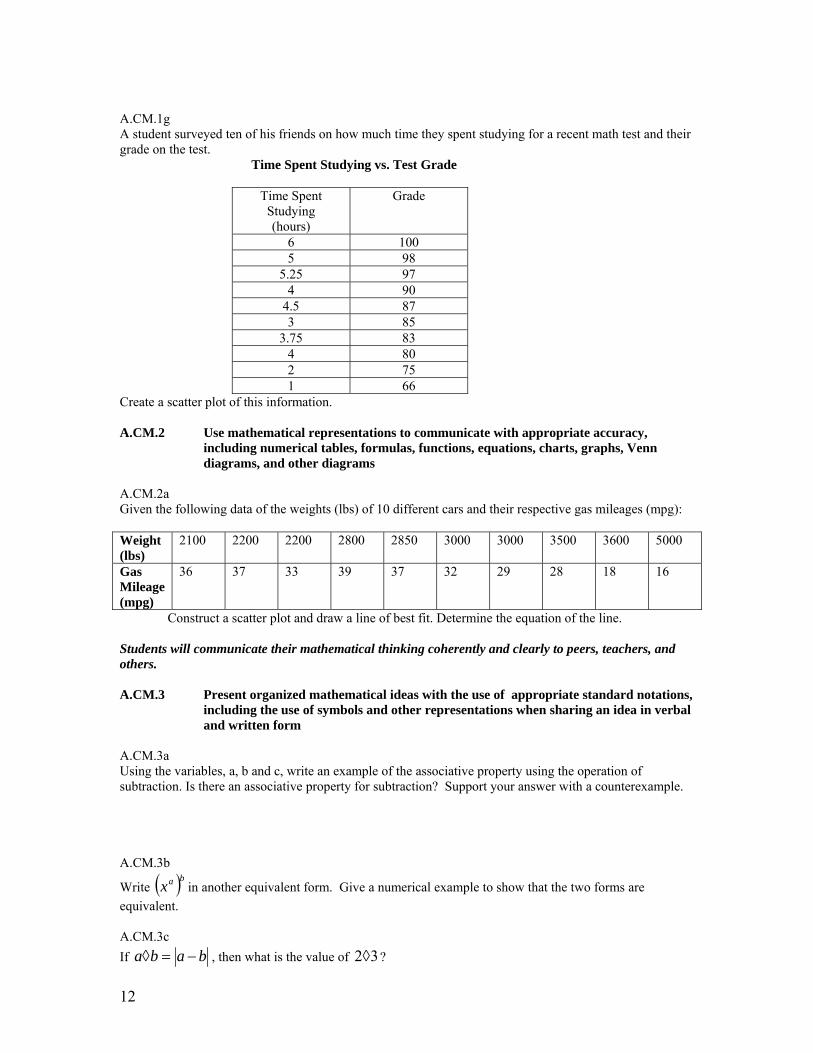
A.CM.1g A student surveyed ten of his friends on how much time they spent studying for a recent math test and their grade on the test. Time Spent Studying vs. Test Grade
Time Spent Studying (hours)
Grade
6 100 5 98
5.25 97 4 90
4.5 87 3 85
3.75 83 4 80 2 75 1 66
Create a scatter plot of this information. A.CM.2 Use mathematical representations to communicate with appropriate accuracy,
including numerical tables, formulas, functions, equations, charts, graphs, Venn diagrams, and other diagrams
A.CM.2a Given the following data of the weights (lbs) of 10 different cars and their respective gas mileages (mpg): Weight (lbs)
2100 2200 2200 2800 2850 3000 3000 3500 3600 5000
Gas Mileage (mpg)
36 37 33 39 37 32 29 28 18 16
Construct a scatter plot and draw a line of best fit. Determine the equation of the line. Students will communicate their mathematical thinking coherently and clearly to peers, teachers, and others. A.CM.3 Present organized mathematical ideas with the use of appropriate standard notations,
including the use of symbols and other representations when sharing an idea in verbal and written form
A.CM.3a Using the variables, a, b and c, write an example of the associative property using the operation of subtraction. Is there an associative property for subtraction? Support your answer with a counterexample. A.CM.3b
Write ( )bax in another equivalent form. Give a numerical example to show that the two forms are equivalent. A.CM.3c If baba −=◊ , then what is the value of 32◊ ?
13
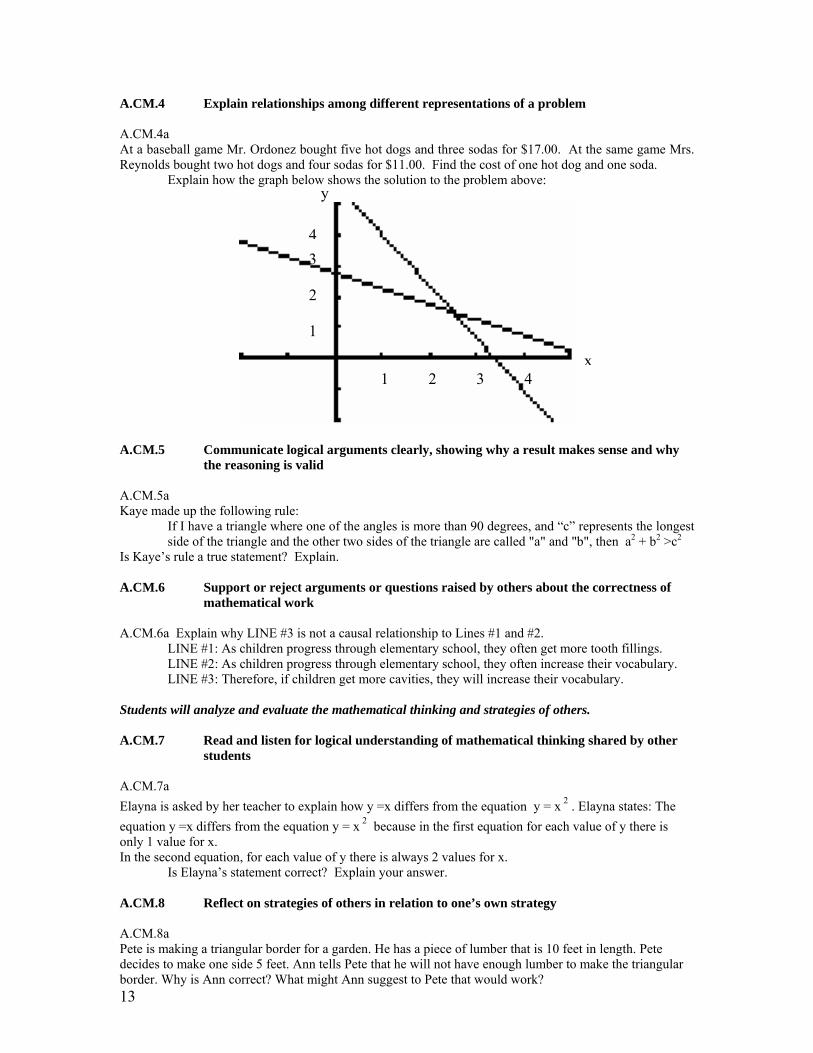
A.CM.4 Explain relationships among different representations of a problem A.CM.4a At a baseball game Mr. Ordonez bought five hot dogs and three sodas for $17.00. At the same game Mrs. Reynolds bought two hot dogs and four sodas for $11.00. Find the cost of one hot dog and one soda.
Explain how the graph below shows the solution to the problem above:
A.CM.5 Communicate logical arguments clearly, showing why a result makes sense and why
the reasoning is valid A.CM.5a Kaye made up the following rule:
If I have a triangle where one of the angles is more than 90 degrees, and “c” represents the longest side of the triangle and the other two sides of the triangle are called "a" and "b", then a2 + b2 >c2
Is Kaye’s rule a true statement? Explain. A.CM.6 Support or reject arguments or questions raised by others about the correctness of
mathematical work A.CM.6a Explain why LINE #3 is not a causal relationship to Lines #1 and #2.
LINE #1: As children progress through elementary school, they often get more tooth fillings. LINE #2: As children progress through elementary school, they often increase their vocabulary. LINE #3: Therefore, if children get more cavities, they will increase their vocabulary.
Students will analyze and evaluate the mathematical thinking and strategies of others. A.CM.7 Read and listen for logical understanding of mathematical thinking shared by other
students A.CM.7a Elayna is asked by her teacher to explain how y =x differs from the equation y = x 2 . Elayna states: The equation y =x differs from the equation y = x 2 because in the first equation for each value of y there is only 1 value for x. In the second equation, for each value of y there is always 2 values for x.
Is Elayna’s statement correct? Explain your answer. A.CM.8 Reflect on strategies of others in relation to one’s own strategy A.CM.8a Pete is making a triangular border for a garden. He has a piece of lumber that is 10 feet in length. Pete decides to make one side 5 feet. Ann tells Pete that he will not have enough lumber to make the triangular border. Why is Ann correct? What might Ann suggest to Pete that would work?
x
y
1 2 3 4
1
2
3 4
14
A.CM.9 Formulate mathematical questions that elicit, extend, or challenge strategies,
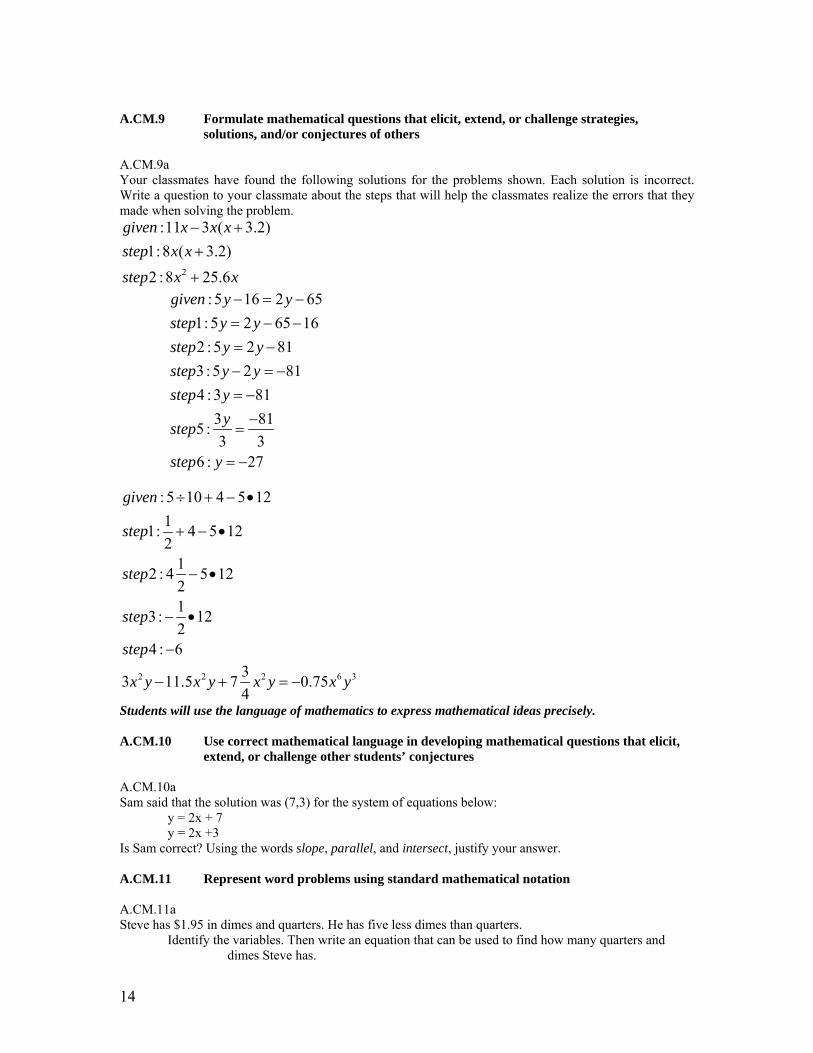
solutions, and/or conjectures of others A.CM.9a Your classmates have found the following solutions for the problems shown. Each solution is incorrect. Write a question to your classmate about the steps that will help the classmates realize the errors that they made when solving the problem.
2
:11 3 ( 3.2)1:8 ( 3.2)2 :8 25.6
given x x xstep x xstep x x
− ++
+
: 5 16 2 651: 5 2 65 162 : 5 2 813: 5 2 814 : 3 81
3 815 :3 3
6 : 27
given y ystep y ystep y ystep y ystep y
ystep
step y
− = −= − −= −− = −= −−
=
= −
: 5 10 4 5 1211: 4 5 122
12 : 4 5 12213: 122
4 : 6
given
step
step
step
step
÷ + − •
+ − •
− •
− •
−
2 2 2 6 333 11.5 7 0.754
x y x y x y x y− + = −
Students will use the language of mathematics to express mathematical ideas precisely. A.CM.10 Use correct mathematical language in developing mathematical questions that elicit,
extend, or challenge other students’ conjectures A.CM.10a Sam said that the solution was (7,3) for the system of equations below:
y = 2x + 7 y = 2x +3
Is Sam correct? Using the words slope, parallel, and intersect, justify your answer. A.CM.11 Represent word problems using standard mathematical notation A.CM.11a Steve has $1.95 in dimes and quarters. He has five less dimes than quarters.
Identify the variables. Then write an equation that can be used to find how many quarters and dimes Steve has.
15
A.CM.12 Understand and use appropriate language, representations, and terminology when describing objects, relationships, mathematical solutions, and rationale
A.CM.12a
Given y = 2x +17 and y = 21
x +15, describe the graph of these 2 lines using the words: slope, parallel and
intercept. A.CM.13 Draw conclusions about mathematical ideas through decoding, comprehension, and
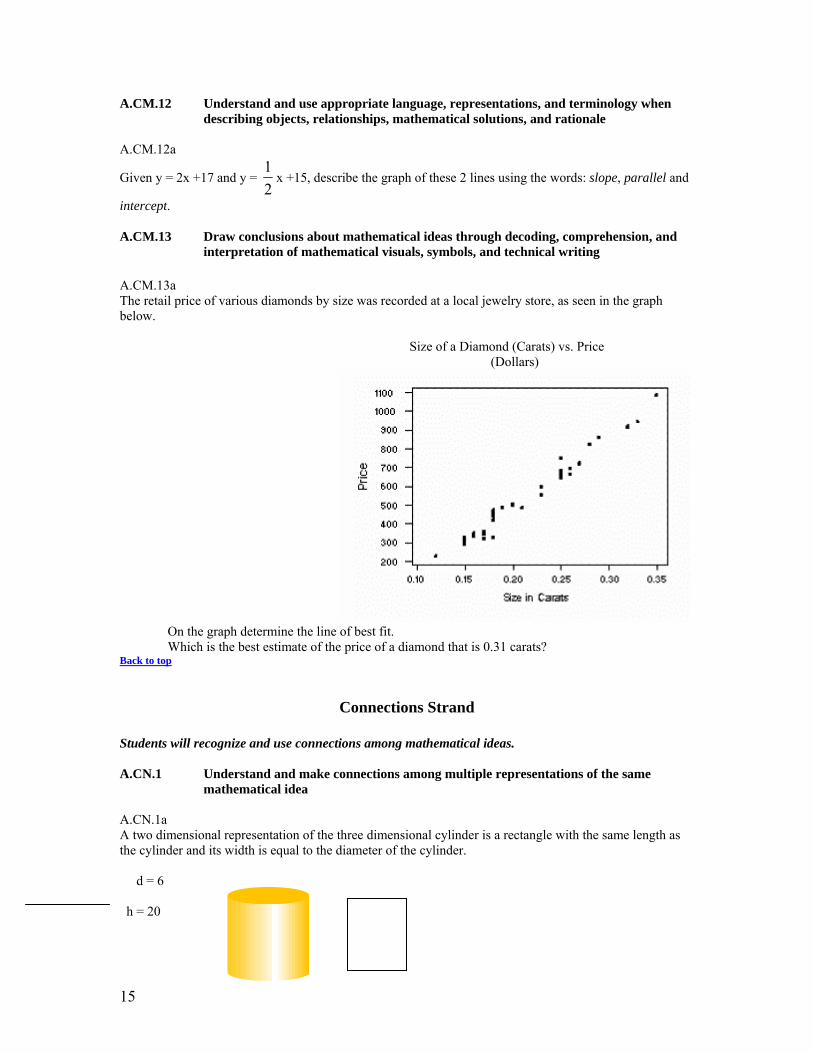
interpretation of mathematical visuals, symbols, and technical writing A.CM.13a The retail price of various diamonds by size was recorded at a local jewelry store, as seen in the graph below.
Size of a Diamond (Carats) vs. Price
(Dollars)
On the graph determine the line of best fit. Which is the best estimate of the price of a diamond that is 0.31 carats?
Back to top
Connections Strand Students will recognize and use connections among mathematical ideas. A.CN.1 Understand and make connections among multiple representations of the same
mathematical idea A.CN.1a A two dimensional representation of the three dimensional cylinder is a rectangle with the same length as the cylinder and its width is equal to the diameter of the cylinder. d = 6 h = 20
16
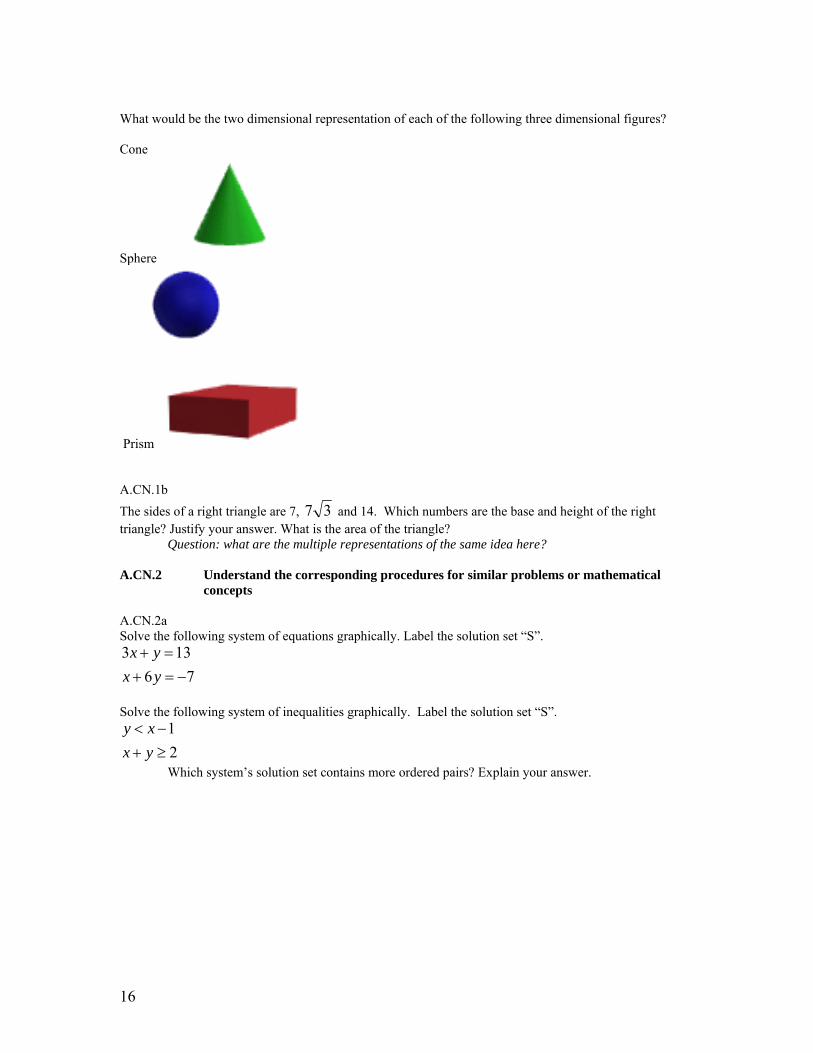
What would be the two dimensional representation of each of the following three dimensional figures? Cone
Sphere
Prism A.CN.1b The sides of a right triangle are 7, 37 and 14. Which numbers are the base and height of the right triangle? Justify your answer. What is the area of the triangle?
Question: what are the multiple representations of the same idea here? A.CN.2 Understand the corresponding procedures for similar problems or mathematical
concepts A.CN.2a Solve the following system of equations graphically. Label the solution set “S”. 3 13
6 7x y
x y+ =+ = −
Solve the following system of inequalities graphically. Label the solution set “S”.
12
y xx y< −+ ≥
Which system’s solution set contains more ordered pairs? Explain your answer.

17
Students will understand how mathematical ideas interconnect and build on one another to produce a coherent whole. A.CN.3 Model situations mathematically, using representations to draw conclusions and
formulate new situations A.CN.3a Find the area of each section of the rectangle shown. Then determine the total area. Using the distributive property, find the product of (c+3)(c+1) A.CN.4 Understand how concepts, procedures, and mathematical results in one area of
mathematics can be used to solve problems in other areas of mathematics A.CN.4a A cell phone company introduced a new plan that costs $10.00 a month and $.03 a minute for each call.
What would it cost Sabrina per month, if she anticipates talking on the phone for 10 hours per month? 12 hours per month? 15 hours per month?” Determine how knowing how to graph y = .03x + 10 helps to solve the problems.
A.CN.5 Understand how quantitative models connect to various physical models and
representations A.CN.5a Ed puts 5 cookies in each bag for a bake sale. He makes 63 bags and has no cookies left over. Sue said to Ed that they needed more bags of cookies and suggested to Ed that he put 4 cookies in each bag. If Ed follows Sue’s suggestion, how many bags of cookies will Ed have? How many cookies will be left over? A.CN.5b According to Hooke’s Law, the force required to stretch a spring varies directly with the distance you want to stretch it.
If it takes 3 Newtons to stretch a spring 18 cm, how many Newtons does it take to stretch a spring 108 cm? If fifty pounds stretches a spring five inches, how much will the spring be stretched by a force of 120 pounds?
A.CN.5c The distance an object, y, drops from rest in freefall varies directly with the square of the time, x. If y varies directly as x2, and y = 8 when x = 2, find y when x = 1.
c c 3
1
18
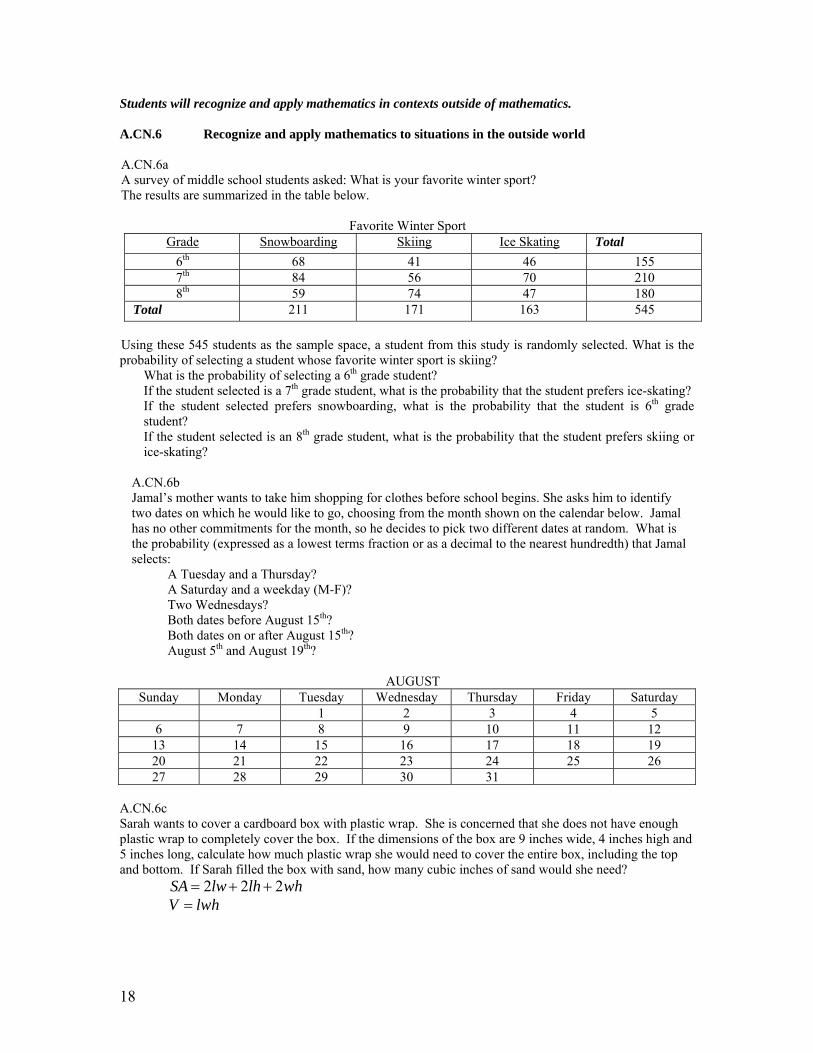
Students will recognize and apply mathematics in contexts outside of mathematics. A.CN.6 Recognize and apply mathematics to situations in the outside world A.CN.6a A survey of middle school students asked: What is your favorite winter sport? The results are summarized in the table below.
Favorite Winter Sport Grade Snowboarding Skiing Ice Skating Total
6th 68 41 46 155 7th 84 56 70 210 8th 59 74 47 180
Total 211 171 163 545 Using these 545 students as the sample space, a student from this study is randomly selected. What is the probability of selecting a student whose favorite winter sport is skiing?
What is the probability of selecting a 6th grade student? If the student selected is a 7th grade student, what is the probability that the student prefers ice-skating? If the student selected prefers snowboarding, what is the probability that the student is 6th grade student? If the student selected is an 8th grade student, what is the probability that the student prefers skiing or ice-skating?
A.CN.6b Jamal’s mother wants to take him shopping for clothes before school begins. She asks him to identify two dates on which he would like to go, choosing from the month shown on the calendar below. Jamal has no other commitments for the month, so he decides to pick two different dates at random. What is the probability (expressed as a lowest terms fraction or as a decimal to the nearest hundredth) that Jamal selects:
A Tuesday and a Thursday? A Saturday and a weekday (M-F)? Two Wednesdays? Both dates before August 15th? Both dates on or after August 15th? August 5th and August 19th?
AUGUST
Sunday Monday Tuesday Wednesday Thursday Friday Saturday 1 2 3 4 5
6 7 8 9 10 11 12 13 14 15 16 17 18 19 20 21 22 23 24 25 26 27 28 29 30 31
A.CN.6c Sarah wants to cover a cardboard box with plastic wrap. She is concerned that she does not have enough plastic wrap to completely cover the box. If the dimensions of the box are 9 inches wide, 4 inches high and 5 inches long, calculate how much plastic wrap she would need to cover the entire box, including the top and bottom. If Sarah filled the box with sand, how many cubic inches of sand would she need?
2 2 2SA lw lh wh= + + V lwh=

19
A.CN.6d A research company wanted to obtain data on what is watched on television by community members who are 18 years old and older. The research company made random telephone calls to homes in the community. The telephone calls resulted in:
An inability to reach a person in 53% of the homes called. The exclusion of non-telephone homes in the community. Those surveyed were 72% male and 28% female.
Explain how each of the three factors above could create a bias in the survey results. A.CN.6e A restaurant owner wanted to determine what her customers consider the most appealing quality of her restaurant. A brief survey card was placed on each table before customers were seated. A portion of the customers voluntarily completed the survey card. As an incentive, those who completed the survey card were entered in a random drawing for a new skateboard. The chart below displays the ages of those who completed the survey card:
Age of Respondents
16%
21%
15%
48%
under 3030-4950-6970 and over
What biases might exist as a result of the design of this survey? The results of the survey are summarized in the chart below:
What conclusions might the restaurant owner draw from this survey? What biases might exist in this data? Do you believe the results of this survey are valid? Explain your answer.
15%
8%
20%38%
19%costmenu varietyquality of foodmusic/atmosphereservice
Best quality of the restaurant
20
A.CN.7 Recognize and apply mathematical ideas to problem situations that develop outside of mathematics
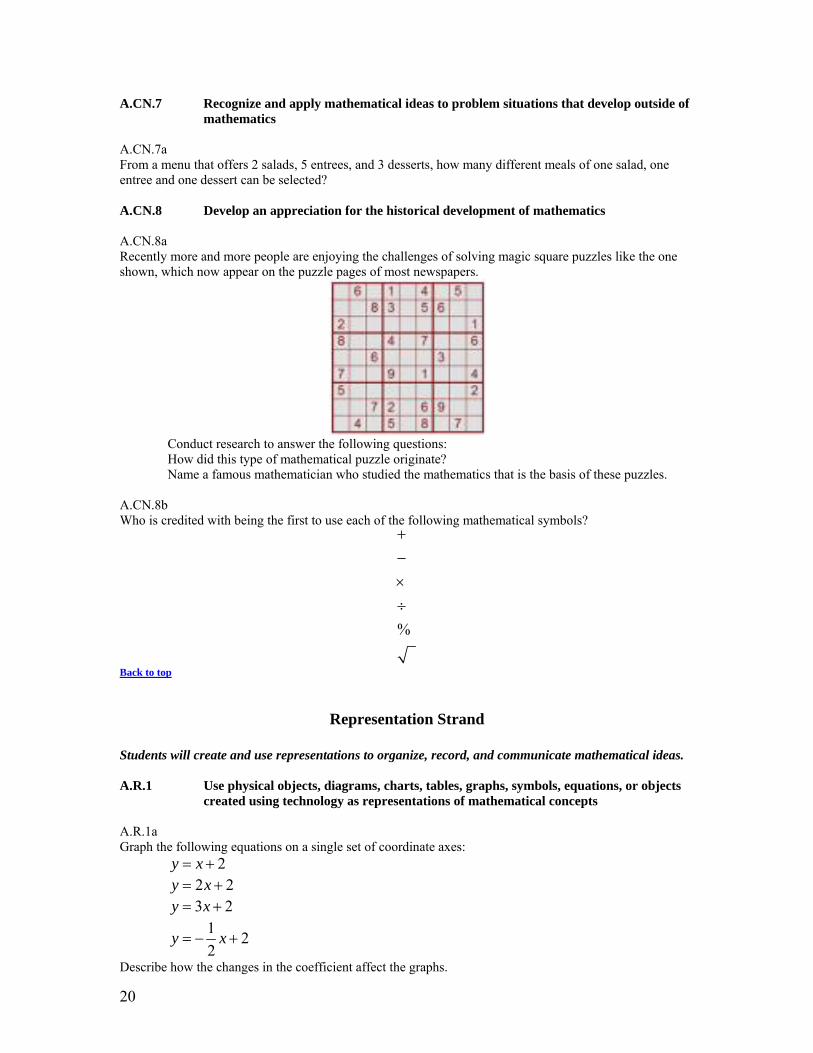
A.CN.7a From a menu that offers 2 salads, 5 entrees, and 3 desserts, how many different meals of one salad, one entree and one dessert can be selected? A.CN.8 Develop an appreciation for the historical development of mathematics A.CN.8a Recently more and more people are enjoying the challenges of solving magic square puzzles like the one shown, which now appear on the puzzle pages of most newspapers.
Conduct research to answer the following questions: How did this type of mathematical puzzle originate? Name a famous mathematician who studied the mathematics that is the basis of these puzzles.
A.CN.8b Who is credited with being the first to use each of the following mathematical symbols?
%
+−×÷
Back to top
Representation Strand Students will create and use representations to organize, record, and communicate mathematical ideas. A.R.1 Use physical objects, diagrams, charts, tables, graphs, symbols, equations, or objects
created using technology as representations of mathematical concepts A.R.1a Graph the following equations on a single set of coordinate axes:
2y x= + 2 2y x= + 3 2y x= +
1 22
y x= − +
Describe how the changes in the coefficient affect the graphs.
21
A.R.1b Graph the following equations on a single set of axes.
y = x2 y = 2x2 y = 0.5x2
Describe how the changes in the coefficient affect the graphs. A.R.2 Recognize, compare, and use an array of representational forms A.R.2a Mary receives $12 for reporting to work plus $8 an hour. Tim receives $10 per hour. Represent the problem algebraically, graphically, and with a table. Answer the following questions:
Which worker’s pay increases faster? Who would make more money if each worked a 4 hour day? 8 hour day? How much would each make working 4.5 hours? Which representation did you use to determine your answers? Explain.
A.R.3 Use representation as a tool for exploring and understanding mathematical ideas A.R.3a Explore the concept of “closure” by completing the following chart.
Complete columns 3 and 6. COLUMN 1 COLUMN 2 COLUMN 3 COLUMN 4 COLUMN
5 COLUMN
6 Odd Numbers Odd Numbers Column 1 +
Column 2 = Even Numbers Even Numbers Column 3 +
Column 4 = 3 3 2 2 5 5 4 4 7 7 6 6 9 9 8 8
11 11 10 10 13 13 12 12 15 15 14 14
What conclusion(s) may be drawn from the numbers in Column 3 and Column 6? Students will select, apply, and translate among mathematical representations to solve problems. A.R.4 Select appropriate representations to solve problem situations A.R.4a The sum of three consecutive prime numbers is 41. What is the smallest number? Show how the problem was solved. A.R.4b If all the edges of a cube are doubled, by what factor will the volume change?
Show how the problem was solved. A.R.4c The ratio of the length of a rectangle to its width is 5:2. If the length is 25 meters, what is the perimeter of the rectangle, in meters? Show how the problem was solved.
22
A.R.5 Investigate relationships between different representations and their impact on a given problem
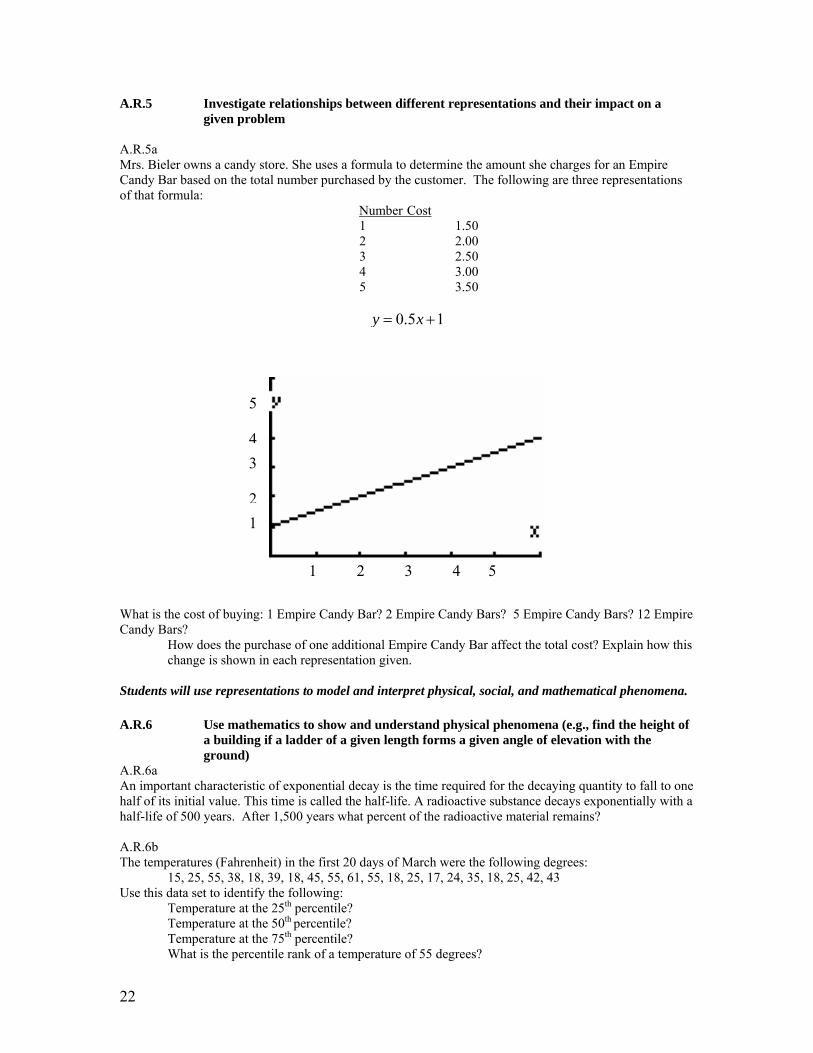
A.R.5a Mrs. Bieler owns a candy store. She uses a formula to determine the amount she charges for an Empire Candy Bar based on the total number purchased by the customer. The following are three representations of that formula: Number Cost
1 1.50 2 2.00 3 2.50 4 3.00 5 3.50
0.5 1y x= +
What is the cost of buying: 1 Empire Candy Bar? 2 Empire Candy Bars? 5 Empire Candy Bars? 12 Empire Candy Bars?
How does the purchase of one additional Empire Candy Bar affect the total cost? Explain how this change is shown in each representation given.
Students will use representations to model and interpret physical, social, and mathematical phenomena.
A.R.6 Use mathematics to show and understand physical phenomena (e.g., find the height of a building if a ladder of a given length forms a given angle of elevation with the ground)
A.R.6a An important characteristic of exponential decay is the time required for the decaying quantity to fall to one half of its initial value. This time is called the half-life. A radioactive substance decays exponentially with a half-life of 500 years. After 1,500 years what percent of the radioactive material remains? A.R.6b The temperatures (Fahrenheit) in the first 20 days of March were the following degrees:
15, 25, 55, 38, 18, 39, 18, 45, 55, 61, 55, 18, 25, 17, 24, 35, 18, 25, 42, 43 Use this data set to identify the following:
Temperature at the 25th percentile? Temperature at the 50th percentile? Temperature at the 75th percentile? What is the percentile rank of a temperature of 55 degrees?
1 2 3 4 5
1 2
3 4
5
23
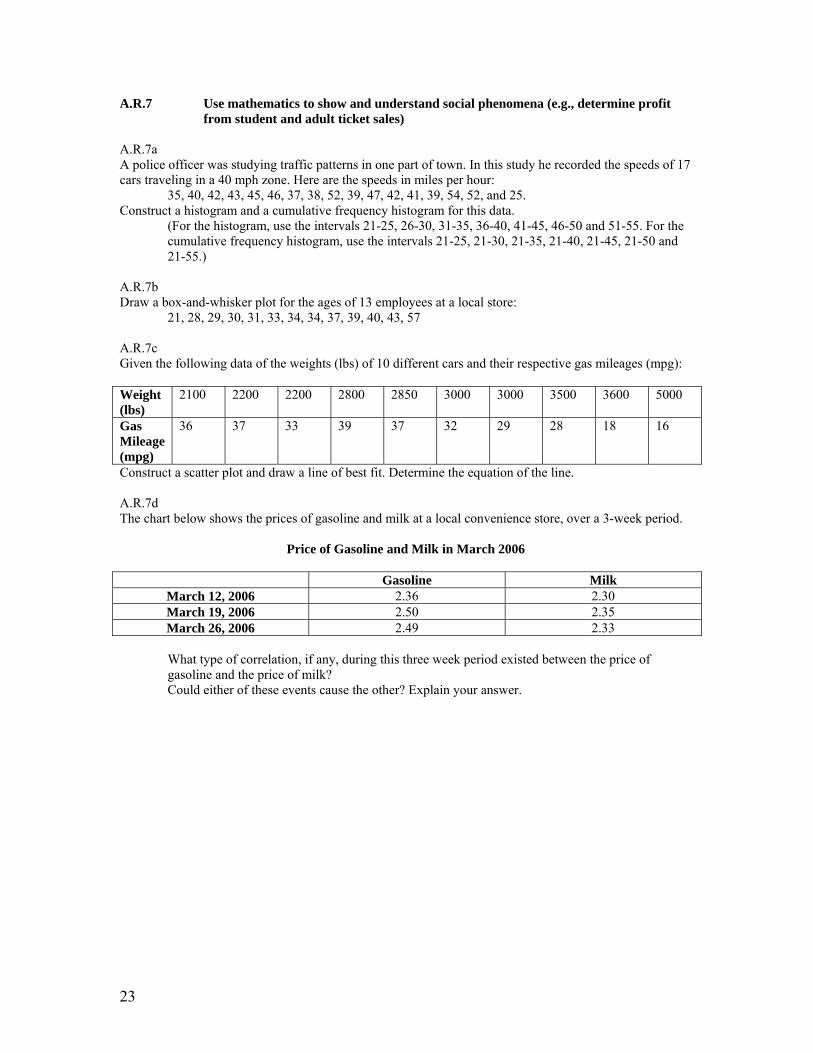
A.R.7 Use mathematics to show and understand social phenomena (e.g., determine profit from student and adult ticket sales)
A.R.7a A police officer was studying traffic patterns in one part of town. In this study he recorded the speeds of 17 cars traveling in a 40 mph zone. Here are the speeds in miles per hour:
35, 40, 42, 43, 45, 46, 37, 38, 52, 39, 47, 42, 41, 39, 54, 52, and 25. Construct a histogram and a cumulative frequency histogram for this data.
(For the histogram, use the intervals 21-25, 26-30, 31-35, 36-40, 41-45, 46-50 and 51-55. For the cumulative frequency histogram, use the intervals 21-25, 21-30, 21-35, 21-40, 21-45, 21-50 and 21-55.)
A.R.7b Draw a box-and-whisker plot for the ages of 13 employees at a local store:
21, 28, 29, 30, 31, 33, 34, 34, 37, 39, 40, 43, 57 A.R.7c Given the following data of the weights (lbs) of 10 different cars and their respective gas mileages (mpg): Weight (lbs)
2100 2200 2200 2800 2850 3000 3000 3500 3600 5000
Gas Mileage (mpg)
36 37 33 39 37 32 29 28 18 16
Construct a scatter plot and draw a line of best fit. Determine the equation of the line. A.R.7d The chart below shows the prices of gasoline and milk at a local convenience store, over a 3-week period. Price of Gasoline and Milk in March 2006 Gasoline Milk
March 12, 2006 2.36 2.30 March 19, 2006 2.50 2.35 March 26, 2006 2.49 2.33
What type of correlation, if any, during this three week period existed between the price of gasoline and the price of milk? Could either of these events cause the other? Explain your answer.
24
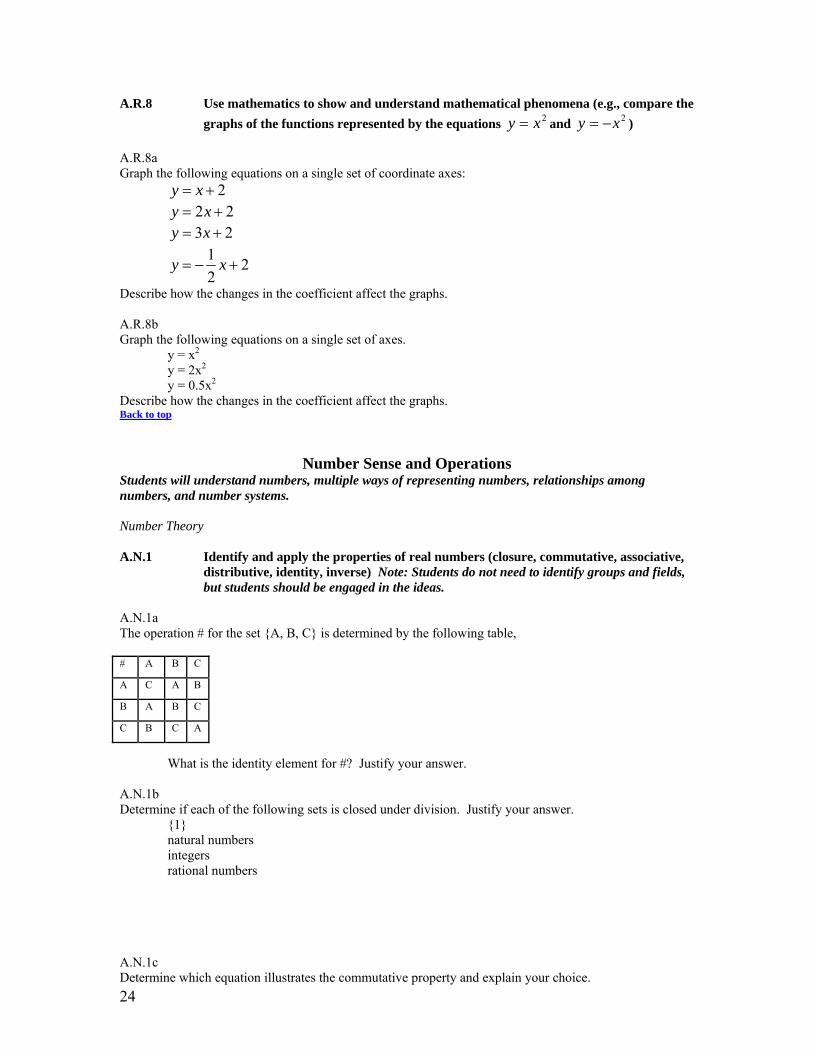
A.R.8 Use mathematics to show and understand mathematical phenomena (e.g., compare the graphs of the functions represented by the equations 2xy = and 2xy −= )
A.R.8a Graph the following equations on a single set of coordinate axes:
2y x= + 2 2y x= + 3 2y x= +
1 22
y x= − +
Describe how the changes in the coefficient affect the graphs. A.R.8b Graph the following equations on a single set of axes.
y = x2 y = 2x2 y = 0.5x2
Describe how the changes in the coefficient affect the graphs. Back to top
Number Sense and Operations
Students will understand numbers, multiple ways of representing numbers, relationships among numbers, and number systems. Number Theory A.N.1 Identify and apply the properties of real numbers (closure, commutative, associative,
distributive, identity, inverse) Note: Students do not need to identify groups and fields, but students should be engaged in the ideas.
A.N.1a The operation # for the set {A, B, C} is determined by the following table,
# A B C
A C A B
B A B C
C B C A
What is the identity element for #? Justify your answer.
A.N.1b Determine if each of the following sets is closed under division. Justify your answer.
{1} natural numbers integers rational numbers
A.N.1c Determine which equation illustrates the commutative property and explain your choice.
25
a + 0 = a a + ( b + c ) = ( a + b ) + c a + b = b + a a ( b + c ) = ab + ac
A.N.1d State the property justifying the following number proof:
Step 1: 2x + 3x = 5x Given statement Step 2: x ( 2 + 3) = 5x From Step 1 to Step 2, name the property:
____________________ Step 3: x (5)= 5x Addition Step 4: 5x = 5x From Step 3 to Step 4, name the property:
____________________
Students will understand meanings of operations and procedures, and how they relate to one another. Operations A.N.2 Simplify radical terms (no variable in the radicand) A.N.2a Simplify: 128
Simplify: 5 28 A.N.3 Perform the four arithmetic operations using like and unlike radical terms and
express the result in simplest form A.N.3a Perform the indicated operation and express the result in simplest form:
6 3373 −+
9850 +
243610 −
2)53( +
( )( )2735
( )( )5257
( )( )1423
250
25610

26
2483
32
A.N.3b If the two legs of a right triangle have lengths 35 and 5, find the length of the hypotenuse. Express the result in simplest form. A.N.4 Understand and use scientific notation to compute products and quotients of numbers A.N.4a Express the product of each of the following in scientific notation:
( )( )
( )( )
( )( )46
97
65
100.6100.4
100.2100.4
100.3100.2
−−
−
××
××
××
A.N.4b Express the quotient of each of the following in scientific notation:
3
5
102104
××
3
8
102.102.1
××
A.N.4c If the expression ( )( )53 1035.11003.6 ×× is evaluated, and the result is written in scientific notation, what is the value of the resultant exponent? A.N.4d In 2006, Linkup, a phone service provider, has more than 50 million customers worldwide and is growing at an amazing rate. One estimate from an analyst predicts Linkup could have up to 245 million customers by the end of 2008. Write Linkup’s worldwide number of customers in 2006 in scientific notation. What percent of increase does Linkup expect to attain by the year 2008? A.N.5 Solve algebraic problems arising from situations that involve fractions, decimals,
percents (decrease/increase and discount), and proportionality/direct variation
A.N.5a On the Hudson team of twenty-four students, two-thirds of the soccer team can play goalie. On the Ossie
team, %2137 of the 32 students can play goalie. Which team has more soccer players that can play goalie
and by how many? A.N.5b
27
Theresa had217 gallons of fruit punch for her party. If half of the fruit punch was served, how many
gallons of fruit punch did Theresa serve? A.N.5c Brian, trying to break a 42-year Olympic bobsled record for the United States, missed the bronze medal in the four-man event, finishing two-hundredths of a second behind France and Britain, who tied for third. Their time was 2:40.06. What was Brian’s time? A.N.5d This week’s price of gas is $2.80 a gallon. If there is going to be a 12% increase next week, what will be the price of a gallon of gasoline to the nearest cent? A.N.5e A serving of Pete’s Mint Chip Ice Cream Cookie has 1,270 calories. A person needs between 2,200 to 2,500 calories for the entire day. What is the percent range of the caloric intake of a serving of Pete’s Mint Chip Ice Cream Cookie? Express the range to the nearest whole percent. 203 calories come from fat. What percent of the total calories from a serving of Pete’s Mint Chip Ice Cream Cookie comes from fat? Express your answer to the nearest whole percent. A.N.5f Jerid’s parents presently pay $7,400 in school taxes. In next school year’s budget there will be a 9.56% increase. What will Jerid’s parents have to pay for school taxes next year? A.N.5g A football player in the National Football League went from an average of 281 pounds in 1986 to 318 pounds in 2006. What is the percent of increase, to the nearest tenth of a percent, of a football player’s weight for the two decades? A.N.5h
Find x: 3616
18=
x
Solve for a: 5
36
2 −=
+ aa
A.N.5i When mixing a 12-ounce can of lemonade mix with water it becomes 64 ounces of lemonade.
If you serve an 8-ounce serving to each person, how many servings will you get out of one 12-ounce can of lemonade mix?
If you need 144 servings, how many 12-ounce cans of lemonade mix will you need to buy?
A.N.5j Which equation represents: x varies directly as y, and x = 12 when y = 36?
a. xy31
=
b. yx31
=
c. xy 3= d. yx 3=
A.N.5k
28
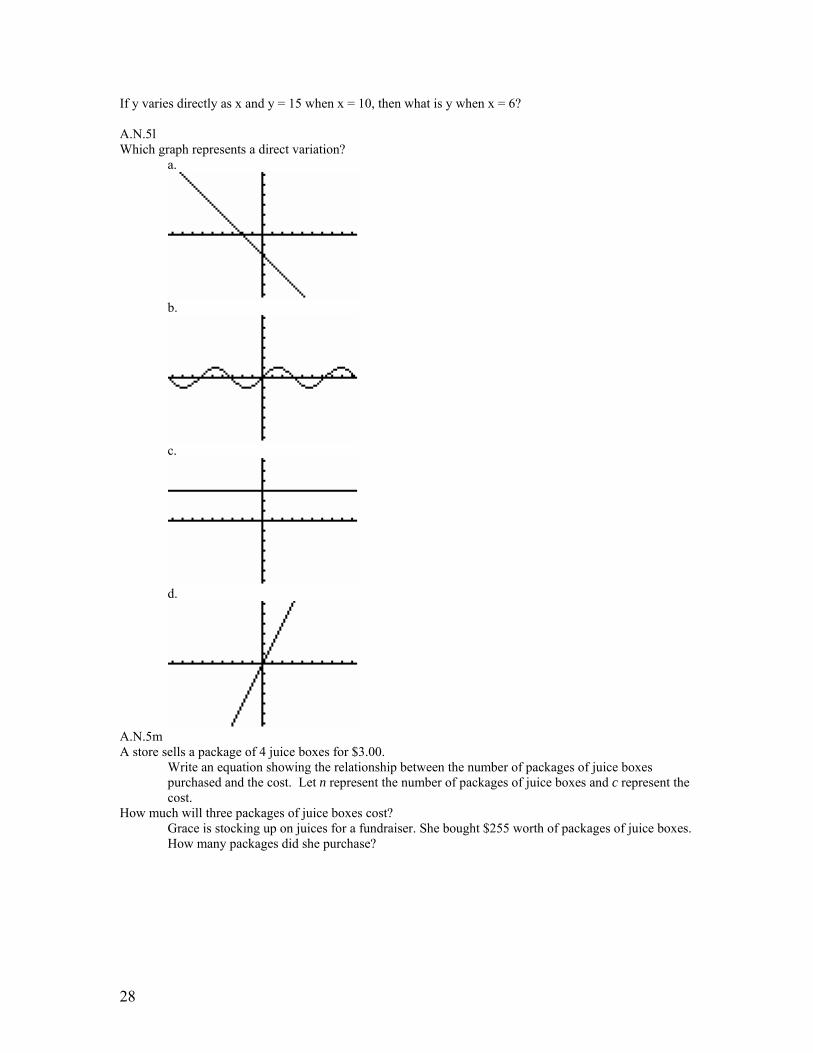
If y varies directly as x and y = 15 when x = 10, then what is y when x = 6? A.N.5l Which graph represents a direct variation?
a.
b.
c.
d.
A.N.5m A store sells a package of 4 juice boxes for $3.00.
Write an equation showing the relationship between the number of packages of juice boxes purchased and the cost. Let n represent the number of packages of juice boxes and c represent the cost.
How much will three packages of juice boxes cost? Grace is stocking up on juices for a fundraiser. She bought $255 worth of packages of juice boxes. How many packages did she purchase?
29
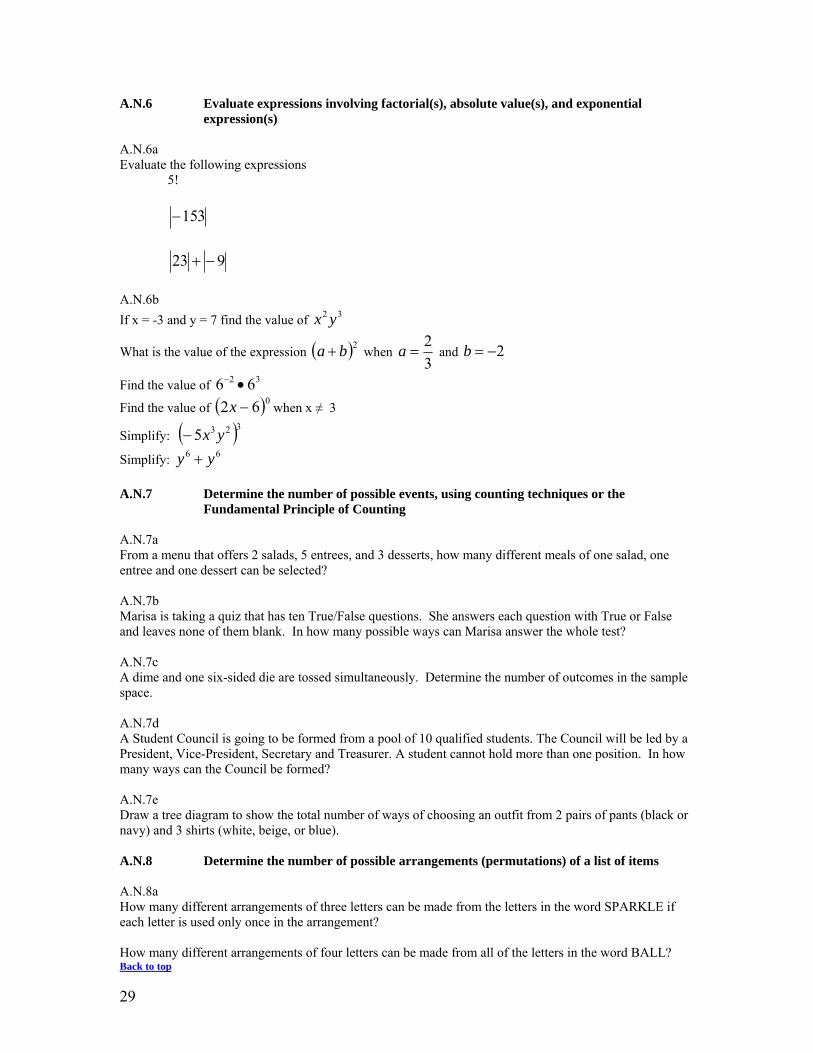
A.N.6 Evaluate expressions involving factorial(s), absolute value(s), and exponential expression(s)
A.N.6a Evaluate the following expressions
5!
315−
932 −+
A.N.6b If x = -3 and y = 7 find the value of 32 yx
What is the value of the expression ( )2ba + when 32
=a and 2−=b
Find the value of 32 66 •−
Find the value of ( )062 −x when x ≠ 3
Simplify: ( )3235 yx−
Simplify: 66 yy +
A.N.7 Determine the number of possible events, using counting techniques or the Fundamental Principle of Counting
A.N.7a From a menu that offers 2 salads, 5 entrees, and 3 desserts, how many different meals of one salad, one entree and one dessert can be selected? A.N.7b Marisa is taking a quiz that has ten True/False questions. She answers each question with True or False and leaves none of them blank. In how many possible ways can Marisa answer the whole test? A.N.7c A dime and one six-sided die are tossed simultaneously. Determine the number of outcomes in the sample space. A.N.7d A Student Council is going to be formed from a pool of 10 qualified students. The Council will be led by a President, Vice-President, Secretary and Treasurer. A student cannot hold more than one position. In how many ways can the Council be formed? A.N.7e Draw a tree diagram to show the total number of ways of choosing an outfit from 2 pairs of pants (black or navy) and 3 shirts (white, beige, or blue).
A.N.8 Determine the number of possible arrangements (permutations) of a list of items A.N.8a How many different arrangements of three letters can be made from the letters in the word SPARKLE if each letter is used only once in the arrangement? How many different arrangements of four letters can be made from all of the letters in the word BALL? Back to top
30
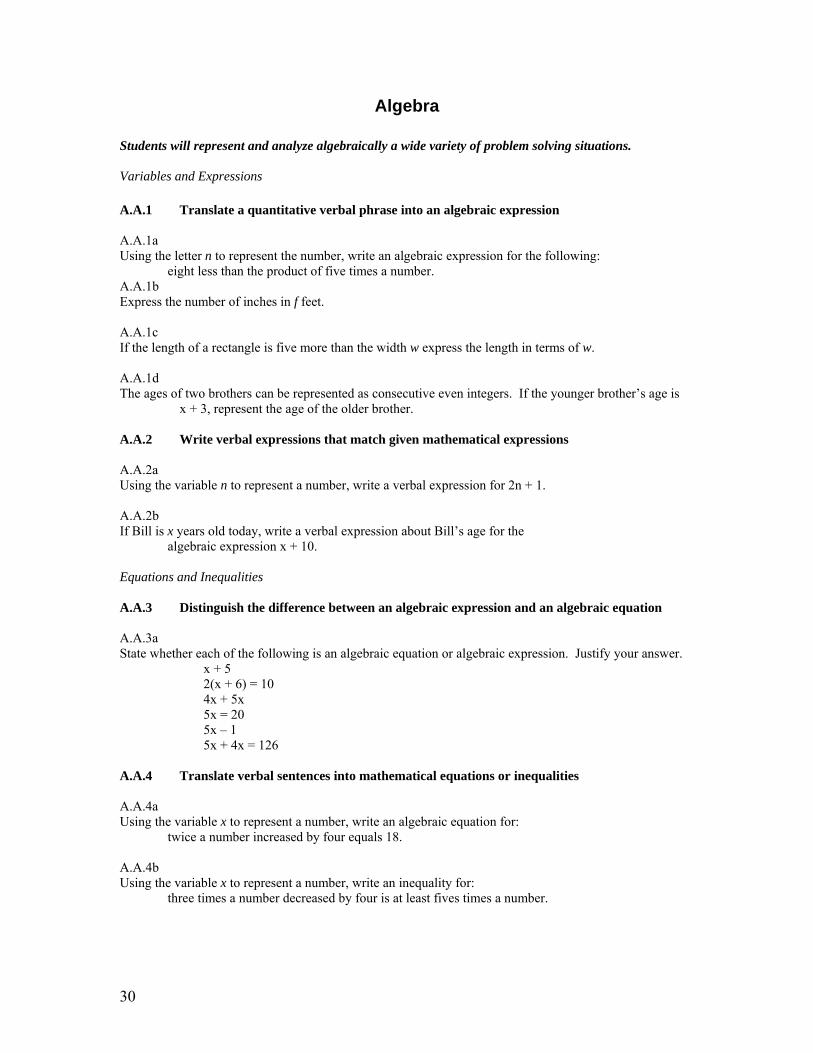
Algebra Students will represent and analyze algebraically a wide variety of problem solving situations. Variables and Expressions A.A.1 Translate a quantitative verbal phrase into an algebraic expression A.A.1a Using the letter n to represent the number, write an algebraic expression for the following:
eight less than the product of five times a number. A.A.1b Express the number of inches in f feet.
A.A.1c If the length of a rectangle is five more than the width w express the length in terms of w. A.A.1d The ages of two brothers can be represented as consecutive even integers. If the younger brother’s age is
x + 3, represent the age of the older brother. A.A.2 Write verbal expressions that match given mathematical expressions A.A.2a Using the variable n to represent a number, write a verbal expression for 2n + 1. A.A.2b If Bill is x years old today, write a verbal expression about Bill’s age for the
algebraic expression x + 10. Equations and Inequalities A.A.3 Distinguish the difference between an algebraic expression and an algebraic equation A.A.3a State whether each of the following is an algebraic equation or algebraic expression. Justify your answer. x + 5 2(x + 6) = 10 4x + 5x 5x = 20 5x – 1 5x + 4x = 126 A.A.4 Translate verbal sentences into mathematical equations or inequalities A.A.4a Using the variable x to represent a number, write an algebraic equation for:
twice a number increased by four equals 18.
A.A.4b Using the variable x to represent a number, write an inequality for:
three times a number decreased by four is at least fives times a number.
31
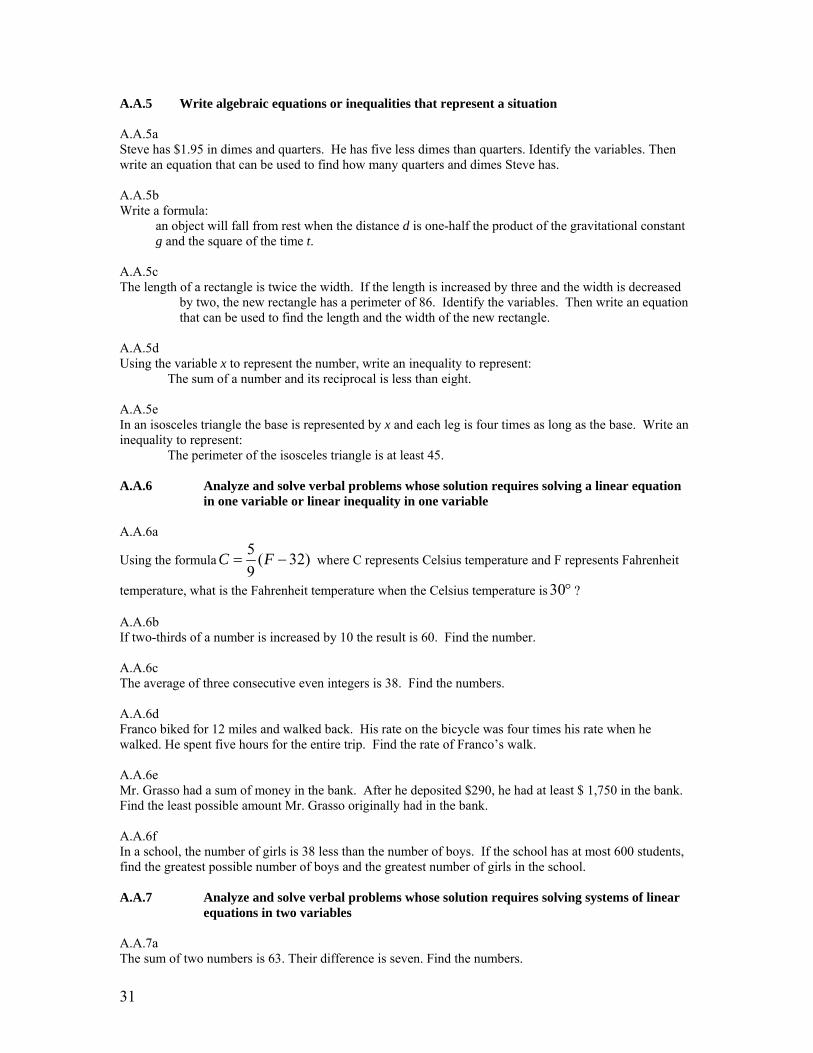
A.A.5 Write algebraic equations or inequalities that represent a situation A.A.5a Steve has $1.95 in dimes and quarters. He has five less dimes than quarters. Identify the variables. Then write an equation that can be used to find how many quarters and dimes Steve has.
A.A.5b Write a formula:
an object will fall from rest when the distance d is one-half the product of the gravitational constant g and the square of the time t.
A.A.5c The length of a rectangle is twice the width. If the length is increased by three and the width is decreased
by two, the new rectangle has a perimeter of 86. Identify the variables. Then write an equation that can be used to find the length and the width of the new rectangle.
A.A.5d Using the variable x to represent the number, write an inequality to represent:
The sum of a number and its reciprocal is less than eight. A.A.5e In an isosceles triangle the base is represented by x and each leg is four times as long as the base. Write an inequality to represent:
The perimeter of the isosceles triangle is at least 45. A.A.6 Analyze and solve verbal problems whose solution requires solving a linear equation
in one variable or linear inequality in one variable
A.A.6a
Using the formula5 ( 32)9
C F= − where C represents Celsius temperature and F represents Fahrenheit
temperature, what is the Fahrenheit temperature when the Celsius temperature is 30° ? A.A.6b If two-thirds of a number is increased by 10 the result is 60. Find the number.
A.A.6c The average of three consecutive even integers is 38. Find the numbers.
A.A.6d Franco biked for 12 miles and walked back. His rate on the bicycle was four times his rate when he walked. He spent five hours for the entire trip. Find the rate of Franco’s walk. A.A.6e Mr. Grasso had a sum of money in the bank. After he deposited $290, he had at least $ 1,750 in the bank. Find the least possible amount Mr. Grasso originally had in the bank.
A.A.6f In a school, the number of girls is 38 less than the number of boys. If the school has at most 600 students, find the greatest possible number of boys and the greatest number of girls in the school. A.A.7 Analyze and solve verbal problems whose solution requires solving systems of linear
equations in two variables A.A.7a The sum of two numbers is 63. Their difference is seven. Find the numbers.
32
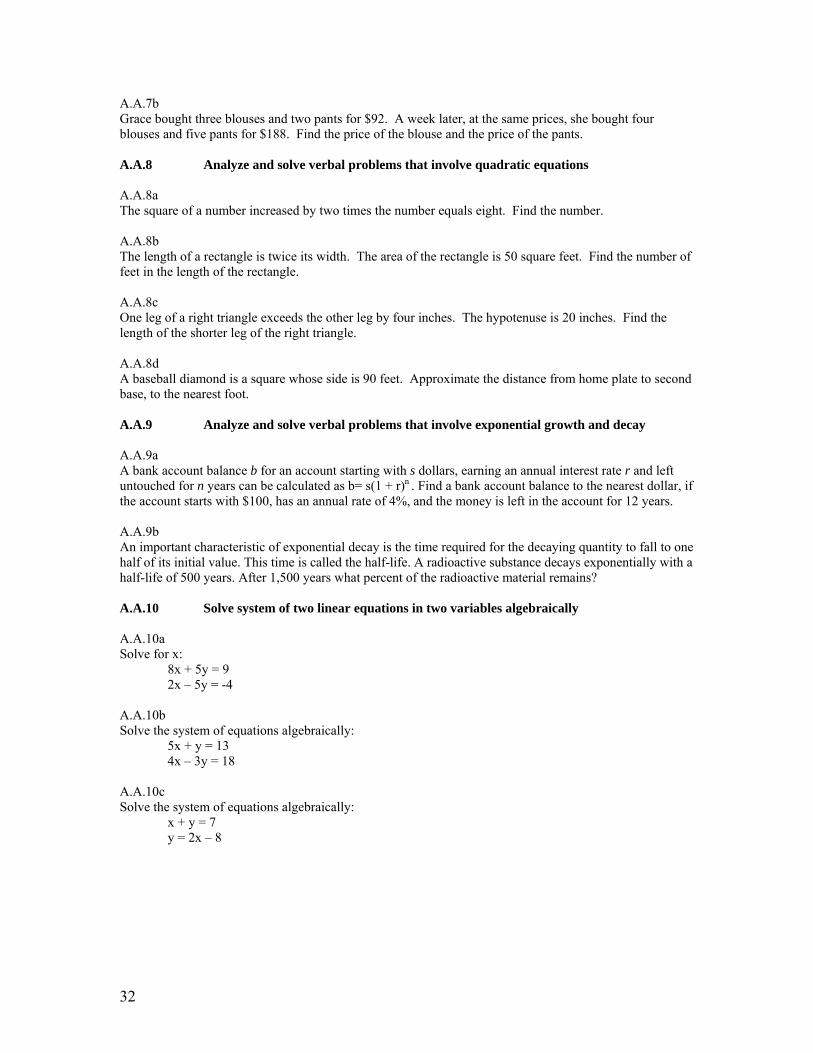
A.A.7b Grace bought three blouses and two pants for $92. A week later, at the same prices, she bought four blouses and five pants for $188. Find the price of the blouse and the price of the pants.
A.A.8 Analyze and solve verbal problems that involve quadratic equations A.A.8a The square of a number increased by two times the number equals eight. Find the number.
A.A.8b The length of a rectangle is twice its width. The area of the rectangle is 50 square feet. Find the number of feet in the length of the rectangle.
A.A.8c One leg of a right triangle exceeds the other leg by four inches. The hypotenuse is 20 inches. Find the length of the shorter leg of the right triangle. A.A.8d A baseball diamond is a square whose side is 90 feet. Approximate the distance from home plate to second base, to the nearest foot. A.A.9 Analyze and solve verbal problems that involve exponential growth and decay A.A.9a A bank account balance b for an account starting with s dollars, earning an annual interest rate r and left untouched for n years can be calculated as b= s(1 + r)n . Find a bank account balance to the nearest dollar, if the account starts with $100, has an annual rate of 4%, and the money is left in the account for 12 years. A.A.9b An important characteristic of exponential decay is the time required for the decaying quantity to fall to one half of its initial value. This time is called the half-life. A radioactive substance decays exponentially with a half-life of 500 years. After 1,500 years what percent of the radioactive material remains?
A.A.10 Solve system of two linear equations in two variables algebraically A.A.10a Solve for x:
8x + 5y = 9 2x – 5y = -4
A.A.10b Solve the system of equations algebraically:
5x + y = 13 4x – 3y = 18
A.A.10c Solve the system of equations algebraically:
x + y = 7 y = 2x – 8
33
A.A.11 Solve a system of one linear and one quadratic equation in two variables, where only factoring is required. Note: The quadratic equation should represent a parabola and the solution(s) should be integers.
A.A.11a Determine which of the following points are solutions for the system of equations y = x² + 2x + 7 and y = x + 7. Justify your answer.
(-6,1) (0,7) (-1,6) (-2,7)
A.A.11b Solve algebraically:
y = x² - 2x - 8 y = x - 4
Students will perform algebraic procedures accurately.
Variables and Expressions A.A.12 Multiply and divide monomial expressions with a common base, using the properties of exponents.
Note: Use integral exponents only A.A.12a Perform the indicated operation and simplify the following:
Divide: 2 2 2 2 372 10w x z wx z− ÷− A.A.13 Add, subtract, and multiply monomials and polynomials A.A.13a Perform the indicated operation and simplify each of the following:
Subtract 2 223p q from 2 220 p q Simplify: 2 2 2( 17.5 ) (9.8 ) ( 14 )d d d− + − − Multiply: 22 (3 5 12 )x x y z+ −
Multiply: 1 3( 50)( 10)2 5
y y− +
Simplify: 2 5( 4 ) (3.2 ) ( 20 )3 6
a b b a a b+ + − − −
Simplify: 3 3 2 2 3 3(25 20 7 ) (14 11 )t v t v tv t v tv+ − − − Simplify: (4 7.8 ) (0.5 3.89 4.1 )x y x y z− − − +

34
A.A.14 Divide a polynomial by a monomial or binomial, where the quotient has no remainder A.A.14a Divide:
215 25 505
x x− +−
4 5 2 3 6 3 3 2(28 14 ) ( 7 )g h j g h j g h j− ÷ −
2( 4 32) ( 4)d d d+ − ÷ −
A.A.14b Divide:
2 2 2 218 12 30x y x y xy+ − by 6xy
2( 11 30)a a+ + by ( 6)a + A.A.15 Find values of a variable for which an algebraic fraction is undefined A.A.15a For what value(s) of the variable is each fraction undefined?
2 12
5bb+−
14
10 4x − 2
2 72 15y
y y+
− −
A.A.16 Simplify fractions with polynomials in the numerator and denominator by factoring
both and renaming them to lowest terms
A.A.16a Simplify each fraction to lowest terms:
12 184 6
xx−−
21
14 7x
x−
2 2515 3b
b−−
2
2
2 159 20
n nn n
+ −+ +
7
7a
a−−
A.A.17 Add or subtract fractional expressions with monomial or like binomial denominators
A.A.17a Add or subtract the fractions below. Simplify answers to lowest terms.
7 10
3 2xy xy+ 2
22 114 2
x xa b a
+
2 2
24 4
mm m
+− −
10 7 8 62 1 2 1
k kk k+ +
−+ +
35
A.A.18 Multiply and divide algebraic fractions and express the product or quotient in simplest form
A.A.18a Multiply or divide the fractions below. Simplify answers to lowest terms.
3 220 3
9 10c dd c
⎛ ⎞⎛ ⎞⎜ ⎟⎜ ⎟⎝ ⎠⎝ ⎠
2
832x
÷
3
2
155 1
p pp p−
•+
2 6 2 42 10 3 15
f f ff f− − +
÷− −
A.A.19 Identify and factor the difference of two perfect squares A.A.19a Factor each expression: 2 25x − 2 121h −
2 1625
p −
216 0.09y −
2 281 144c m− 2 2 64 49a b n− A.A.20 Factor algebraic expressions completely, including trinomials with a lead coefficient of
one (after factoring a GCF)
A.A.20a Factor each expression completely.
2 25 5x y− 23 15 12b b+ +
3g g− 2 18 77ax ax a− +
6 2D D− 24 68 240n n+ +
5 4 34 21z z z− − 4 81y −
Equations and Inequalities A.A.21 Determine whether a given value is a solution to a given linear equation in one
variable or linear inequality in one variable A.A.21a Is x = 3 the solution to the following equation? Show your work.
3x + 16 = 9 A.A.21b Does the value y = 15 satisfy the following inequality? Show your work.
4y > y + 45
36
A.A.22 Solve all types of linear equations in one variable A.A.22a Solve the following equations for x or y:
6x – 3 = 7 + 5x
7y – 3 = 2 (y + 3)
2 (x - 5) = 18
3x + 4x -5 = 40
A.A.23 Solve literal equations for a given variable A.A.23a Solve the following equations for n:
-bx = n + nx p = n + b + c nc + 5 = d
A.A.24 Solve linear inequalities in one variable A.A.24a Find the solution set of each of the following inequalities:
2 4 10 16x x x− + < − 2 3( 5) 40x x+ − ≤ 6 2 10x− >
A.A.25 Solve equations involving fractional expressions. Note: Expressions which result in
linear equations in one variable. A.A.25a Solve the following equations for x.
1 2 1 12 3 4 6
x x+ = − 2 4 103x+ =
A.A.26 Solve algebraic proportions in one variable which result in linear or quadratic
equations A.A.26a Maria is making pancakes for the annual pancake breakfast. She needs two cups of batter to make eight 7-inch pancakes. If Maria needs to make one thousand two hundred 7-inch pancakes, how many cups of batter does she need?
A.A.26b Solve the following proportions for x.
3 52
xx
−=
23 4
x x+=
37
A.A.27 Understand and apply the multiplication property of zero to solve quadratic equations with integral coefficients and integral roots
A.A.27a Find the solution set of each equation below. Show your work. x² - 10x + 21 = 0 (x + 3)(x – 2) = 0 6y = 3y² n² - 81 = 0 d² + 5d = 40 – d x(x-6) = 7 A.A.27b Given: the product of two quantities, a and b, is equal to 0, i.e., ab = 0. Indicate whether each of the following statements is: always true sometimes true always false a = 0 b = 0 a = 0 and b = 0 a = 0 or b = 0 Explain your answers. A.A.28 Understand the difference and connection between roots of a quadratic equation and
factors of a quadratic expression A.A.28a Factor: x² + 17x + 16 A.A.28b Solve: x² + 17x + 16 = 0 A.A.28c Given y = (x+3)(x-2), where does the graph of this parabola intersect the x-axis? Explain how you found
your answer. A.A.28d If the roots of a quadratic equation are 2 and 5, write the quadratic equation in the form ax² +bx + c = 0. Students will recognize, use, and represent algebraically patterns, relations, and functions. Patterns, Relations, and Functions A.A.29 Use set-builder notation and/or interval notation to illustrate the elements of a set,
given the elements in roster form A.A.29a Express the following set of numbers using set builder notation: {3, 4, 5, 6, 7…} A.A.29b Express the following set of numbers in interval notation, using the variable x:
“The set of real numbers greater than four and less that nine”
38
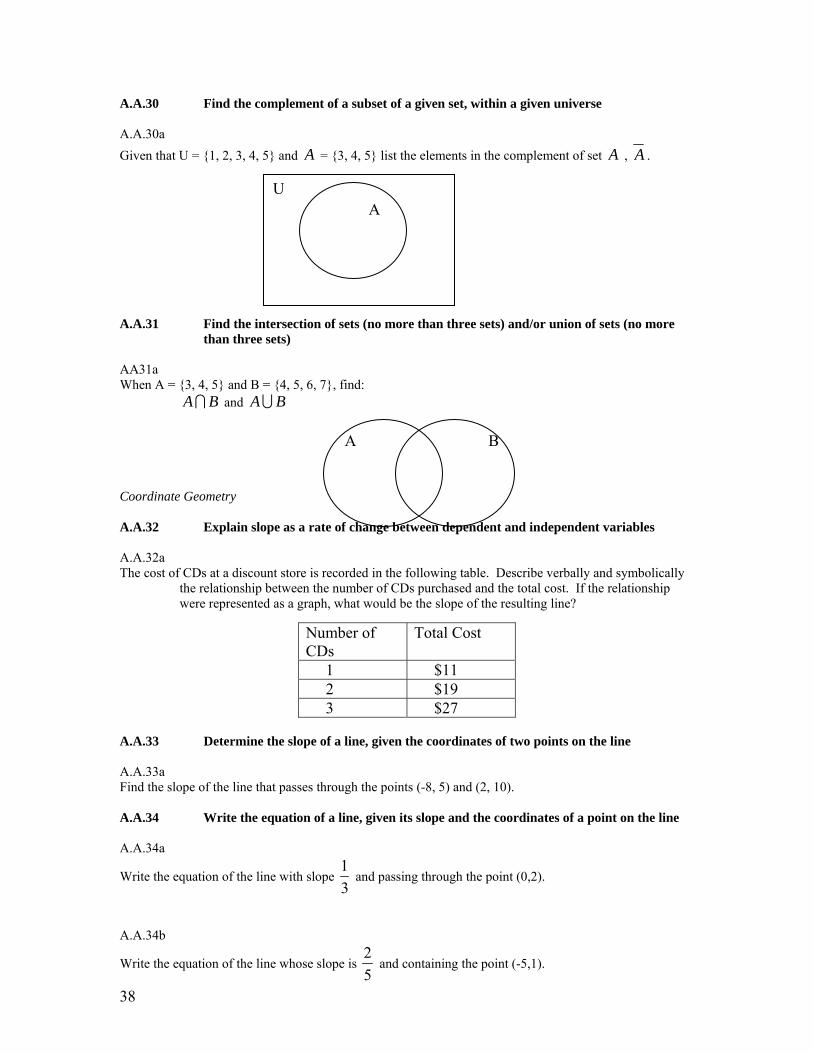
A.A.30 Find the complement of a subset of a given set, within a given universe A.A.30a Given that U = {1, 2, 3, 4, 5} and A = {3, 4, 5} list the elements in the complement of set A , A .
A.A.31 Find the intersection of sets (no more than three sets) and/or union of sets (no more
than three sets) AA31a When A = {3, 4, 5} and B = {4, 5, 6, 7}, find: A BI and A BU
Coordinate Geometry
A.A.32 Explain slope as a rate of change between dependent and independent variables A.A.32a The cost of CDs at a discount store is recorded in the following table. Describe verbally and symbolically
the relationship between the number of CDs purchased and the total cost. If the relationship were represented as a graph, what would be the slope of the resulting line?
A.A.33 Determine the slope of a line, given the coordinates of two points on the line A.A.33a Find the slope of the line that passes through the points (-8, 5) and (2, 10). A.A.34 Write the equation of a line, given its slope and the coordinates of a point on the line A.A.34a
Write the equation of the line with slope 13
and passing through the point (0,2).
A.A.34b
Write the equation of the line whose slope is 25
and containing the point (-5,1).
Number of CDs
Total Cost
1 $11 2 $19 3 $27
U A
A B
39
A.A.35 Write the equation of a line, given the coordinates of two points on the line A.A35a Write the equation of the line passing through the points (3, -7) and (11, -3). A.A.36 Write the equation of a line parallel to the x- or y-axis A.A.36a Write the equation of the line passing through the points (2, 4) and (2, 8). What do all the points on this line have in common? A.A.36b Write the equation of the line passing through the points (1, 7) and (5, 7). What do all the points on this line have in common? A.A.37 Determine the slope of a line, given its equation in any form A.A.37a What is the slope of the line for each of the following equations? 3x + 5y = 10
3 75
y x= − +
A.A.38 Determine if two lines are parallel, given their equations in any form A.A.38a Are the lines for these 2 equations parallel? Explain. 3x + 5y = 10
3 75
y x= − +
A.A.39 Determine whether a given point is on a line, given the equation of the line A.A.39a
Is the point (-8, 1) on the graph of the linear equation 3 74
y x= + ? Justify your answer.
A.A.40 Determine whether a given point is in the solution set of a system of linear inequalities A.A.40a Given the system of inequalities:
y > 3x – 1 y < 5x
Is either of the points (2, 3) or (1, 3) in the solution set of this system? Justify your answer. A.A.40b Paolo has exactly $12 to spend on snacks at the movie theater. He buys at least one bottle of water and some candy bars. His brother, Hector, has $6 and buys only candy bars, the same number as Paolo. Bottles
40
of water are $2.50 and candy bars are $3.00 each. The following system of inequalities represents what each boy could buy, with x = bottles of water and y = candy bars:
2.5x + 3y < 12 3y < 6
Without combining their money, could the boys have bought a total of two bottles of water and five candy bars? Justify your answer. A.A.41 Determine the vertex and axis of symmetry of a parabola, given its equation (See
A.G.10) A.A.41a Sketch a graph of the following function:
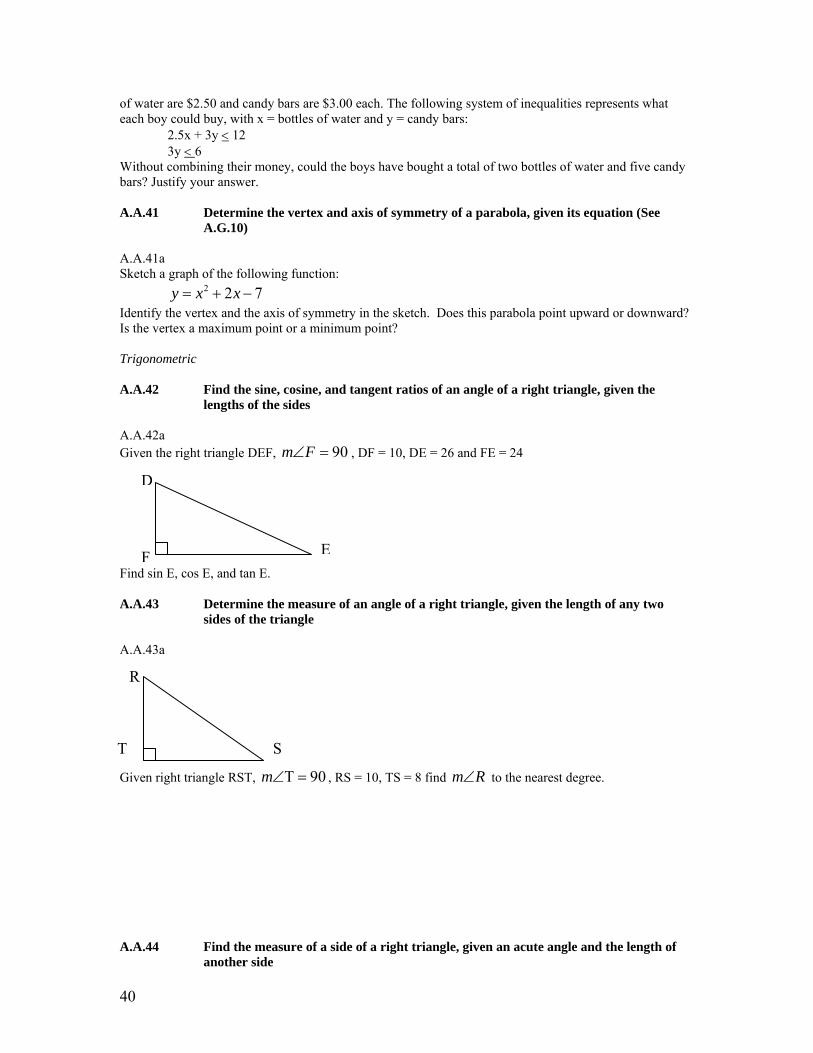
2 2 7y x x= + − Identify the vertex and the axis of symmetry in the sketch. Does this parabola point upward or downward? Is the vertex a maximum point or a minimum point? Trigonometric A.A.42 Find the sine, cosine, and tangent ratios of an angle of a right triangle, given the
lengths of the sides A.A.42a Given the right triangle DEF, 90m F∠ = , DF = 10, DE = 26 and FE = 24 Find sin E, cos E, and tan E. A.A.43 Determine the measure of an angle of a right triangle, given the length of any two
sides of the triangle A.A.43a Given right triangle RST, 90m∠Τ = , RS = 10, TS = 8 find m R∠ to the nearest degree. A.A.44 Find the measure of a side of a right triangle, given an acute angle and the length of
another side
D
EF
R
S T

41
A.A.44a L
Given right triangle LMN, LN = 15, 90m∠Ν = , 38m L∠ = , determine the length of LM to the nearest tenth. A.A.45 Determine the measure of a third side of a right triangle using the Pythagorean
theorem, given the lengths of any two sides A.A.45a For right triangle GHI, G 90m∠ = . Determine the length of the missing side. GI = 9 HI = 41 GH = ? A.A.45b For the following right triangle, 90m L∠ = . Determine the length of the missing side. JL = 16 LK = 30 JK =? Back to top
Geometry
Students will use visualization and spatial reasoning to analyze characteristics and properties of geometric shapes.
G
HI
J
KL
M N
42
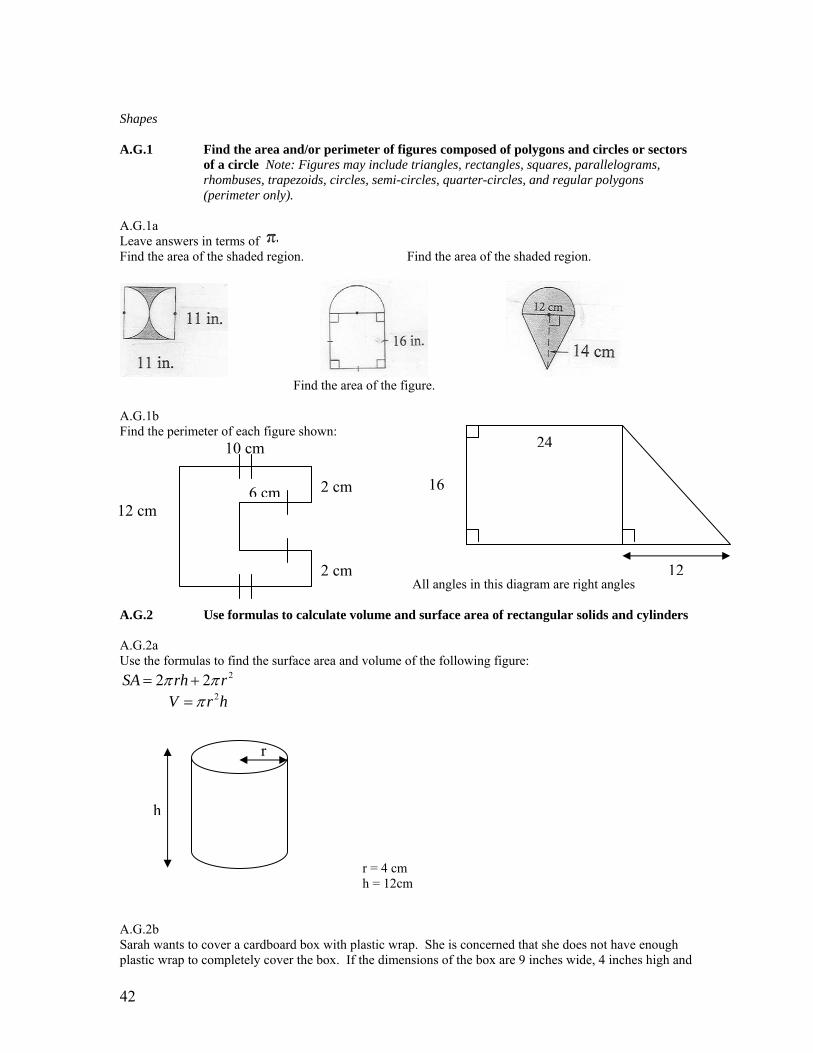
Shapes A.G.1 Find the area and/or perimeter of figures composed of polygons and circles or sectors
of a circle Note: Figures may include triangles, rectangles, squares, parallelograms, rhombuses, trapezoids, circles, semi-circles, quarter-circles, and regular polygons (perimeter only).
A.G.1a Leave answers in terms of Find the area of the shaded region. Find the area of the shaded region.
Find the area of the figure. A.G.1b Find the perimeter of each figure shown: All angles in this diagram are right angles A.G.2 Use formulas to calculate volume and surface area of rectangular solids and cylinders A.G.2a Use the formulas to find the surface area and volume of the following figure:
22 2SA rh rπ π= + 2V r hπ=
r = 4 cm h = 12cm
A.G.2b Sarah wants to cover a cardboard box with plastic wrap. She is concerned that she does not have enough plastic wrap to completely cover the box. If the dimensions of the box are 9 inches wide, 4 inches high and
h
r
10 cm
2 cm
2 cm
12 cm 6 cm
24
16
12

43
5 inches long, calculate how much plastic wrap she would need to cover the entire box, including the top and bottom. If Sarah filled the box with sand, how many cubic inches of sand would she need?
2 2 2SA lw lh wh= + + V lwh=
Students will apply coordinate geometry to analyze problem solving situations. Coordinate Geometry A.G.3 Determine when a relation is a function, by examining ordered pairs and inspecting
graphs of relations A.G.3a Determine if the graph of each of the relations is a function. Justify your answer.
A.G.3b Determine if each relation is a function. Justify your answer.
x y 3 7 7 11 9 13 -1 3
x y 0 2 1 3 1 -3 2 4
44
A.G.4 Identify and graph linear, quadratic (parabolic), absolute value, and exponential functions
A.G.4a Identify each of the following functions as one of the following:
linear, quadratic, absolute value or exponential. Draw the graph of each equation.
y = -13x2 + 2 y = 2x
y = 7x – 3 y = | x + 4 |
A.G.5 Investigate and generalize how changing the coefficients of a function affects its graph
A.G.5a Graph the following equations on a single set of coordinate axes:
2y x= + 2 2y x= + 3 2y x= +
1 22
y x= − +
Describe how the changes in the coefficient affect the graphs.
A.G.5b Graph the following equations on a single set of axes.
y = x2 y = 2x2 y = 0.5x2
Describe how the changes in the coefficient affect the graphs. A.G.6 Graph linear inequalities A.G.6a Solve the following system of inequalities graphically. Identify:
One point in the solution set of the given system. One point not in the solution set of either inequality of the given system.
y ≤ x + 5 y > 2
A.G.7 Graph and solve systems of linear equations and inequalities with rational coefficients
in two variables (See A.A.10)
A.G.7a Solve the following system of equations graphically.
y = 3x + 1 y = 2x + 2
45
A.G.8 Find the roots of a parabolic function graphically Note: Only quadratic equations with integral solutions.
A.G.8a Graph the equation 2 6 5y x x= − + over the interval 0 6x≤ ≤ . State an equation for the axis of symmetry, and the coordinates of the vertex. Use your graph to determine the roots of the equation
20 6 5x x= − + A.G.9 Solve systems of linear and quadratic equations graphically Note: Only use systems of
linear and quadratic equations that lead to solutions whose coordinates are integers. A.G.9a Solve the following systems of equations graphically.
y = x2 + 2 2 8 15y x x= − + y = 2x + 1 5y x= − +
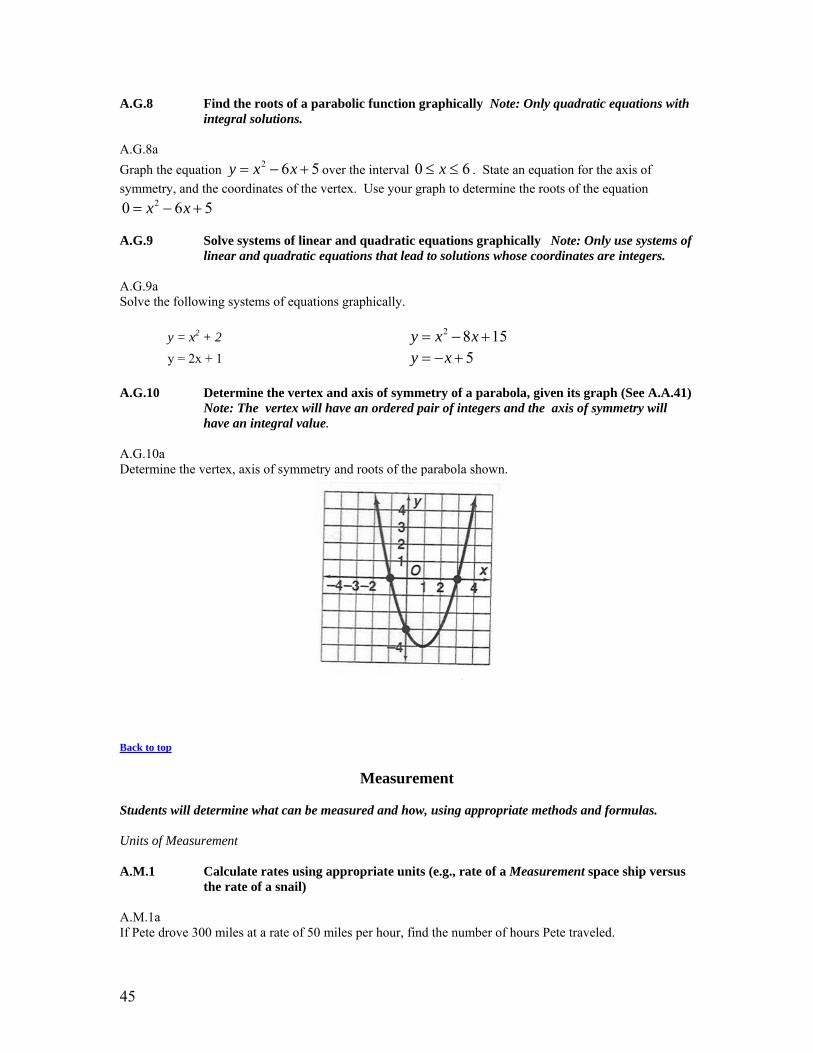
A.G.10 Determine the vertex and axis of symmetry of a parabola, given its graph (See A.A.41)
Note: The vertex will have an ordered pair of integers and the axis of symmetry will have an integral value.
A.G.10a Determine the vertex, axis of symmetry and roots of the parabola shown.
Back to top
Measurement
Students will determine what can be measured and how, using appropriate methods and formulas. Units of Measurement A.M.1 Calculate rates using appropriate units (e.g., rate of a Measurement space ship versus
the rate of a snail) A.M.1a If Pete drove 300 miles at a rate of 50 miles per hour, find the number of hours Pete traveled.
46
A.M.1b Sue walked to her school at 2 miles per hour, picked up her bicycle and rode back home at 10 miles per
hour. If the round trip took 211 hours, how far is the school from Sue’s house?
A.M.1c A copier takes 4 minutes to duplicate 480 pages. Express the rate at which the copier duplicates, in pages per second. A.M.1d If a car uses 18 gallons of gasoline to travel 558 miles, how far can the car travel on 12 gallons of gasoline? A.M.2 Solve problems involving conversions within measurement systems, given the
relationship between the units A.M.2a If one meter is approximately 3.25 feet, then how many feet would be in 7.2 meters? A.M.2b One ounce is approximately 28.4 grams. There are 16 ounces to a pound. a. An 8-ounce steak weighs how many grams? b. The average weight of a NFL player is currently 248 pounds. Represent that weight in grams. Students will understand that all measurement contains error and be able to determine its significance. Error and Magnitude A.M.3 Calculate the relative error in measuring square and cubic units, when there is an
error in the linear measure A.M.3a A ruler is accurate to 0.1 of a centimeter. A rectangle is measured as 19.4 cm by 11.2 cm.
What is the relative error, expressed as a decimal, in calculating the area? What is the percent error, to the nearest tenth of a percent, in calculating the area?
Back to top
Statistics and Probability Students will collect, organize, display, and analyze data. Organization and Display of Data A.S.1 Categorize data as qualitative or quantitative
A.S.1a Identify the following data sets as either qualitative or quantitative.
Presidents and their places of birth. Percent of persons living in poverty. Number of votes cast in the 2004 presidential election. Favorite places for vacation. Baseball players and the position they play.
47
A.S.2 Determine whether the data to be analyzed is univariate or bivariate A.S.2a State if the following data sets are univariate or bivariate.
Three-year rate of return for various mutual funds. Relationship between per capita gross domestic product and the life expectancy of residents of a country. Gestation period of an animal and the animal’s life expectancy. The pulse rate of eight randomly selected individuals after jogging for one minute.
A.S.3 Determine when collected data or display of data may be biased A.S.3a A research company wanted to obtain data on what is watched on television by community members who are 18 years old and older. The research company made random telephone calls to homes in the community. The telephone calls resulted in:
An inability to reach a person in 53% of the homes called. The exclusion of non-telephone homes in the community. Those surveyed were 72% male and 28% female.
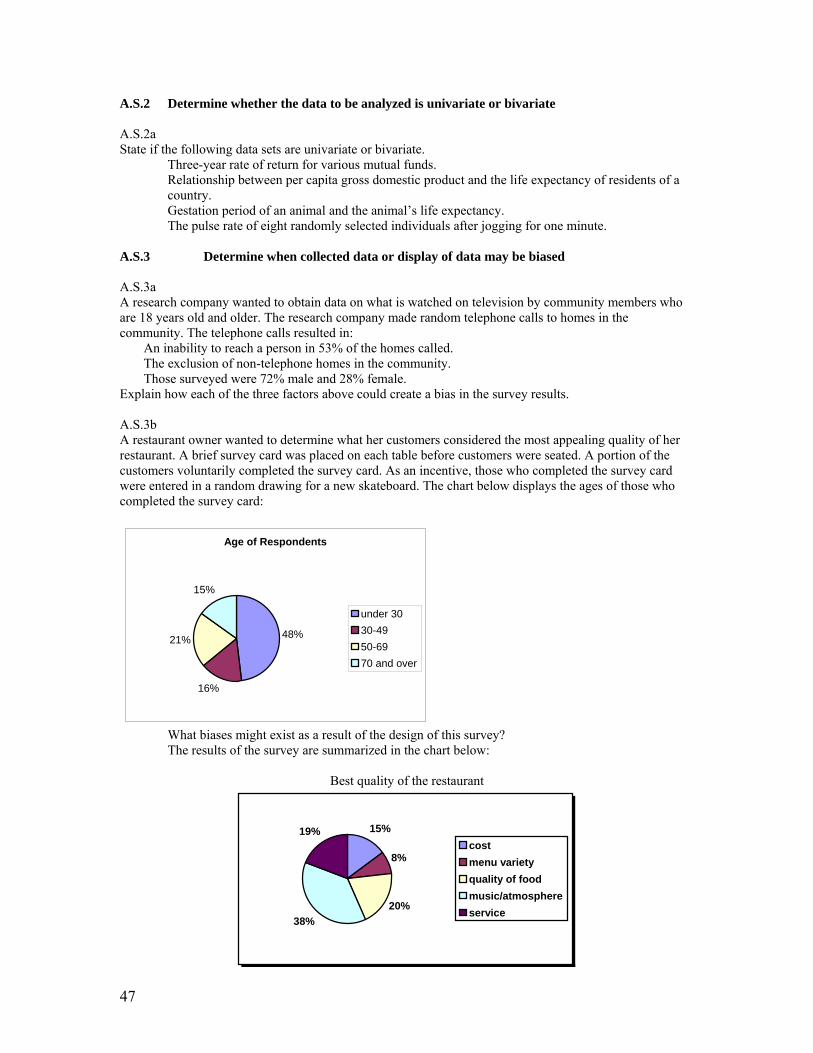
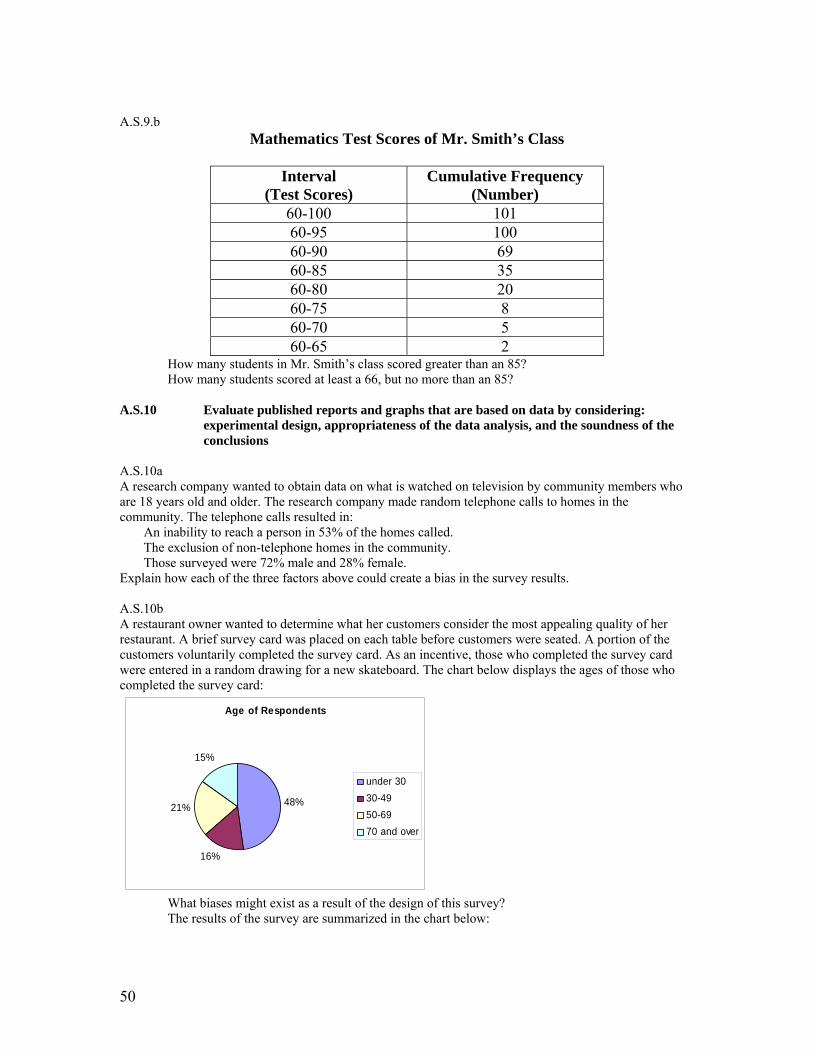
Explain how each of the three factors above could create a bias in the survey results. A.S.3b A restaurant owner wanted to determine what her customers considered the most appealing quality of her restaurant. A brief survey card was placed on each table before customers were seated. A portion of the customers voluntarily completed the survey card. As an incentive, those who completed the survey card were entered in a random drawing for a new skateboard. The chart below displays the ages of those who completed the survey card:
Age of Respondents
16%
21%
15%
48%
under 3030-4950-6970 and over
What biases might exist as a result of the design of this survey? The results of the survey are summarized in the chart below:
Best quality of the restaurant
15%
8%
20%38%
19%costmenu varietyquality of foodmusic/atmosphereservice

48
What conclusions might the restaurant owner draw from this survey? What biases might exist in this data? Do you believe the results of this survey are valid? Explain your answer.
A.S.4 Compare and contrast the appropriateness of different measures of central tendency
for a given data set A.S.4a Aimee wants to buy a house. Houses in her community have recently sold for: $125,000, $80,000, $140,000, $135,000, $136,000, $140,000 and $350,000. Given the above real estate information:
What is the mean? What is the median? What is the mode? What is the range?
Using these different measures of central tendencies, explain which one is the best one to represent the cost of a house in Aimee’s community. A.S.5 Construct a histogram, cumulative frequency histogram, and a box-and-whisker plot,
given a set of data A.S.5a A police officer was studying traffic patterns in one part of town. In this study he recorded the speeds of 17 cars traveling in a 40 mph zone. Here are the speeds in miles per hour:
35, 40, 42, 43, 45, 46, 37, 38, 52, 39, 47, 42, 41, 39, 54, 52, and 25.
Construct a histogram and a cumulative frequency histogram for this data. (For the histogram, use the intervals 21-25, 26-30, 31-35, 36-40, 41-45, 46-50 and 51-55. For the cumulative frequency histogram, use the intervals 21-25, 21-30, 21-35, 21-40, 21-45, 21-50 and 21-55.)
A.S.5b Draw a box-and-whisker plot for the ages of 13 employees at a local store:
21, 28, 29, 30, 31, 33, 34, 34, 37, 39, 40, 43, 57 A.S.6 Understand how the five statistical summary (minimum, maximum, and the three
quartiles) is used to construct a box-and-whisker plot A.S.6a Given the following ages: 20, 27, 28, 29, 30, 31, 33, 33, 37, 39 and 55:
What is the minimum age? What is the lower quartile age? What is the median age? What is the upper quartile age? What is the maximum age?
Construct a box-and-whisker plot for this data.
49
A.S.7 Create a scatter plot of bivariate data A.S.7a A student surveyed ten of his friends on how much time they spent studying for a recent math test and their grade on the test. Time Spent Studying vs. Test Grade
Time Spent Studying (hours)
Grade
6 100 5 98
5.25 97 4 90
4.5 87 3 85
3.75 83 4 80 2 75 1 66
Create a scatter plot of this information. A.S.8 Construct manually a reasonable line of best fit for a scatter plot and determine the
equation of that line A.S.8a Given the following data of the weights (lbs) of 10 different cars and their respective gas mileages (mpg): Weight (lbs)
2100 2200 2200 2800 2850 3000 3000 3500 3600 5000
Gas Mileage (mpg)
36 37 33 39 37 32 29 28 18 16
Construct a scatter plot and draw a line of best fit. Determine the equation of the line. Analysis of Data A.S.9 Analyze and interpret a frequency distribution table or histogram, a cumulative
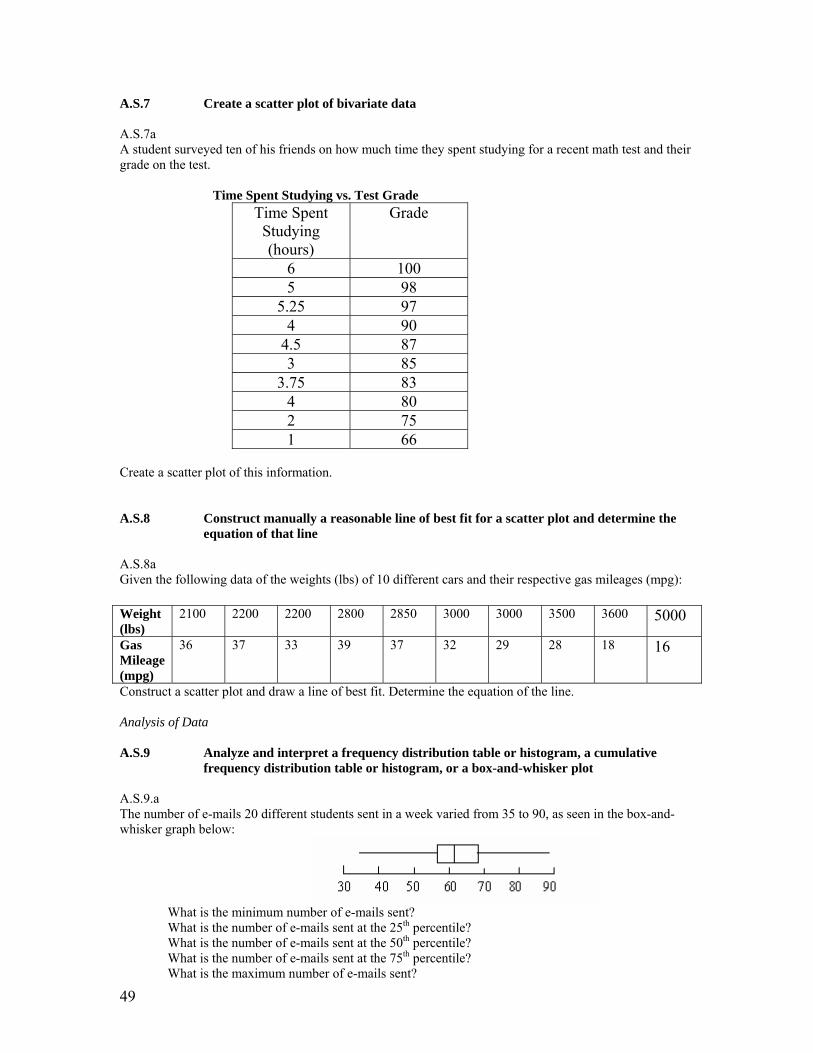
frequency distribution table or histogram, or a box-and-whisker plot A.S.9.a The number of e-mails 20 different students sent in a week varied from 35 to 90, as seen in the box-and-whisker graph below:
What is the minimum number of e-mails sent? What is the number of e-mails sent at the 25th percentile? What is the number of e-mails sent at the 50th percentile? What is the number of e-mails sent at the 75th percentile? What is the maximum number of e-mails sent?
50
A.S.9.b
Mathematics Test Scores of Mr. Smith’s Class
Interval (Test Scores)
Cumulative Frequency (Number)
60-100 101 60-95 100 60-90 69 60-85 35 60-80 20 60-75 8 60-70 5 60-65 2
How many students in Mr. Smith’s class scored greater than an 85? How many students scored at least a 66, but no more than an 85?
A.S.10 Evaluate published reports and graphs that are based on data by considering:
experimental design, appropriateness of the data analysis, and the soundness of the conclusions
A.S.10a A research company wanted to obtain data on what is watched on television by community members who are 18 years old and older. The research company made random telephone calls to homes in the community. The telephone calls resulted in:
An inability to reach a person in 53% of the homes called. The exclusion of non-telephone homes in the community. Those surveyed were 72% male and 28% female.
Explain how each of the three factors above could create a bias in the survey results. A.S.10b A restaurant owner wanted to determine what her customers consider the most appealing quality of her restaurant. A brief survey card was placed on each table before customers were seated. A portion of the customers voluntarily completed the survey card. As an incentive, those who completed the survey card were entered in a random drawing for a new skateboard. The chart below displays the ages of those who completed the survey card:
Age of Respondents
16%
21%
15%
48%
under 3030-4950-6970 and over
What biases might exist as a result of the design of this survey? The results of the survey are summarized in the chart below:
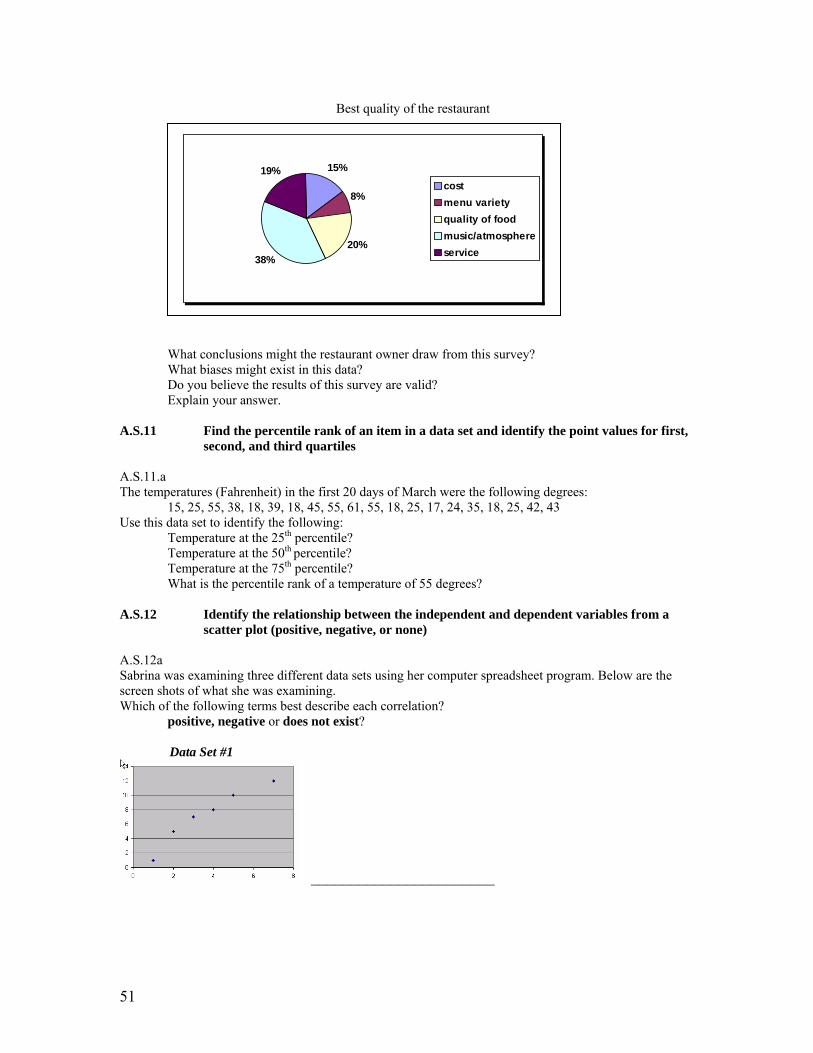
51
What conclusions might the restaurant owner draw from this survey? What biases might exist in this data? Do you believe the results of this survey are valid? Explain your answer.
A.S.11 Find the percentile rank of an item in a data set and identify the point values for first,
second, and third quartiles A.S.11.a The temperatures (Fahrenheit) in the first 20 days of March were the following degrees:
15, 25, 55, 38, 18, 39, 18, 45, 55, 61, 55, 18, 25, 17, 24, 35, 18, 25, 42, 43 Use this data set to identify the following:
Temperature at the 25th percentile? Temperature at the 50th percentile? Temperature at the 75th percentile? What is the percentile rank of a temperature of 55 degrees?
A.S.12 Identify the relationship between the independent and dependent variables from a
scatter plot (positive, negative, or none) A.S.12a Sabrina was examining three different data sets using her computer spreadsheet program. Below are the screen shots of what she was examining. Which of the following terms best describe each correlation?
positive, negative or does not exist? Data Set #1
_______________________
15%
8%
20%38%
19%costmenu varietyquality of foodmusic/atmosphereservice
Best quality of the restaurant
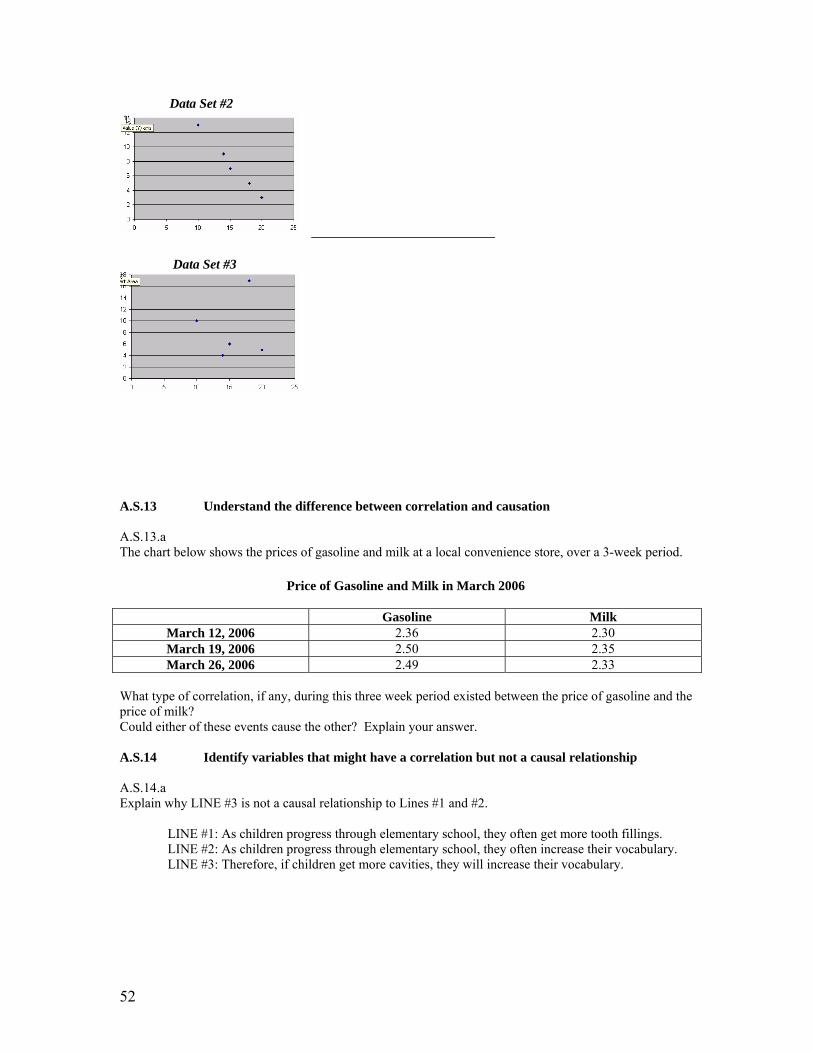
52
Data Set #2
_______________________ Data Set #3
A.S.13 Understand the difference between correlation and causation A.S.13.a The chart below shows the prices of gasoline and milk at a local convenience store, over a 3-week period. Price of Gasoline and Milk in March 2006 Gasoline Milk
March 12, 2006 2.36 2.30 March 19, 2006 2.50 2.35 March 26, 2006 2.49 2.33
What type of correlation, if any, during this three week period existed between the price of gasoline and the price of milk? Could either of these events cause the other? Explain your answer. A.S.14 Identify variables that might have a correlation but not a causal relationship A.S.14.a Explain why LINE #3 is not a causal relationship to Lines #1 and #2.
LINE #1: As children progress through elementary school, they often get more tooth fillings. LINE #2: As children progress through elementary school, they often increase their vocabulary. LINE #3: Therefore, if children get more cavities, they will increase their vocabulary.
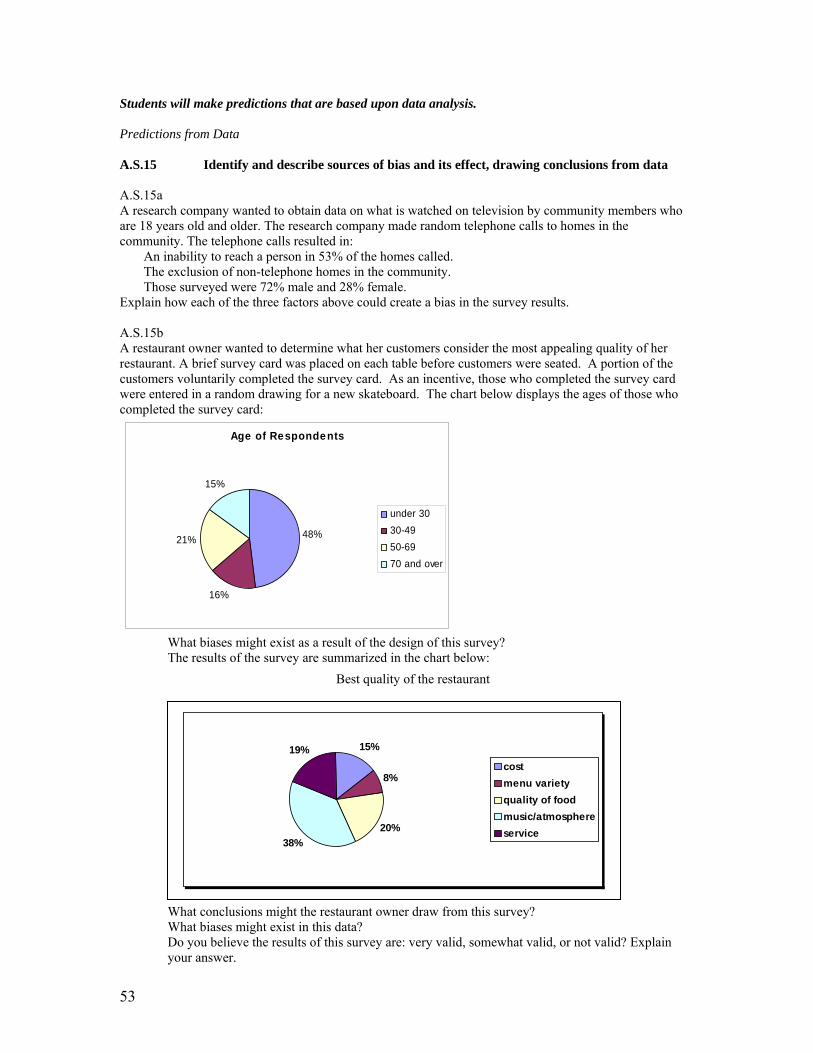
53
Students will make predictions that are based upon data analysis. Predictions from Data A.S.15 Identify and describe sources of bias and its effect, drawing conclusions from data A.S.15a A research company wanted to obtain data on what is watched on television by community members who are 18 years old and older. The research company made random telephone calls to homes in the community. The telephone calls resulted in:
An inability to reach a person in 53% of the homes called. The exclusion of non-telephone homes in the community. Those surveyed were 72% male and 28% female.
Explain how each of the three factors above could create a bias in the survey results. A.S.15b A restaurant owner wanted to determine what her customers consider the most appealing quality of her restaurant. A brief survey card was placed on each table before customers were seated. A portion of the customers voluntarily completed the survey card. As an incentive, those who completed the survey card were entered in a random drawing for a new skateboard. The chart below displays the ages of those who completed the survey card:
Age of Respondents
16%
21%
15%
48%
under 3030-4950-6970 and over
What biases might exist as a result of the design of this survey? The results of the survey are summarized in the chart below:
What conclusions might the restaurant owner draw from this survey? What biases might exist in this data? Do you believe the results of this survey are: very valid, somewhat valid, or not valid? Explain your answer.
15%
8%
20%38%
19%costmenu varietyquality of foodmusic/atmosphereservice
Best quality of the restaurant
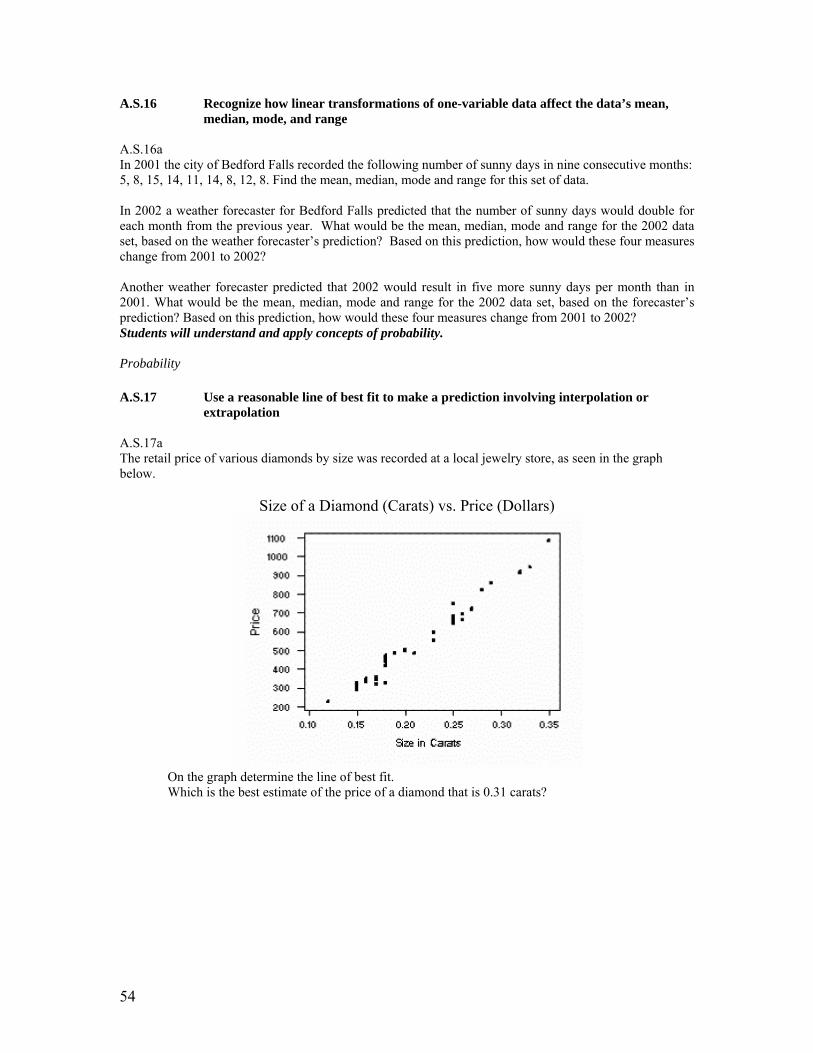
54
A.S.16 Recognize how linear transformations of one-variable data affect the data’s mean, median, mode, and range
A.S.16a In 2001 the city of Bedford Falls recorded the following number of sunny days in nine consecutive months: 5, 8, 15, 14, 11, 14, 8, 12, 8. Find the mean, median, mode and range for this set of data. In 2002 a weather forecaster for Bedford Falls predicted that the number of sunny days would double for each month from the previous year. What would be the mean, median, mode and range for the 2002 data set, based on the weather forecaster’s prediction? Based on this prediction, how would these four measures change from 2001 to 2002? Another weather forecaster predicted that 2002 would result in five more sunny days per month than in 2001. What would be the mean, median, mode and range for the 2002 data set, based on the forecaster’s prediction? Based on this prediction, how would these four measures change from 2001 to 2002? Students will understand and apply concepts of probability. Probability A.S.17 Use a reasonable line of best fit to make a prediction involving interpolation or
extrapolation A.S.17a The retail price of various diamonds by size was recorded at a local jewelry store, as seen in the graph below.
Size of a Diamond (Carats) vs. Price (Dollars)
On the graph determine the line of best fit. Which is the best estimate of the price of a diamond that is 0.31 carats?
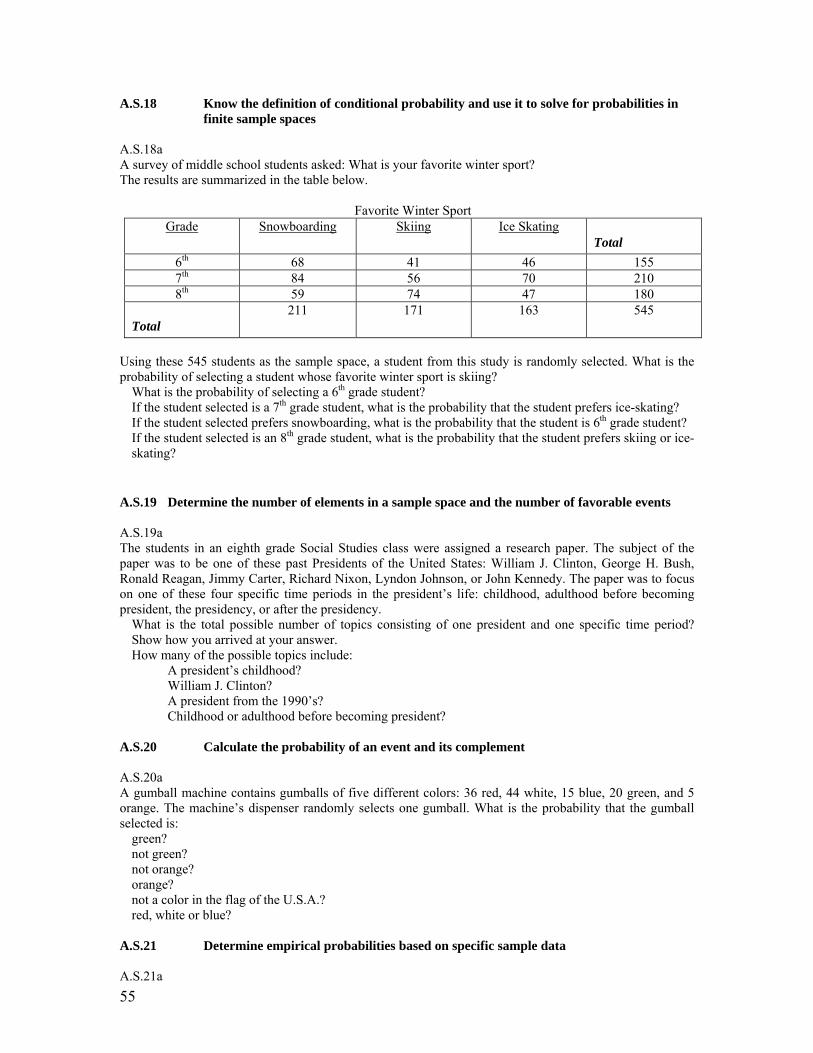
55
A.S.18 Know the definition of conditional probability and use it to solve for probabilities in finite sample spaces
A.S.18a A survey of middle school students asked: What is your favorite winter sport? The results are summarized in the table below.
Favorite Winter Sport Grade Snowboarding Skiing Ice Skating
Total 6th 68 41 46 155 7th 84 56 70 210 8th 59 74 47 180
Total 211 171 163 545
Using these 545 students as the sample space, a student from this study is randomly selected. What is the probability of selecting a student whose favorite winter sport is skiing?
What is the probability of selecting a 6th grade student? If the student selected is a 7th grade student, what is the probability that the student prefers ice-skating? If the student selected prefers snowboarding, what is the probability that the student is 6th grade student? If the student selected is an 8th grade student, what is the probability that the student prefers skiing or ice-skating?
A.S.19 Determine the number of elements in a sample space and the number of favorable events A.S.19a The students in an eighth grade Social Studies class were assigned a research paper. The subject of the paper was to be one of these past Presidents of the United States: William J. Clinton, George H. Bush, Ronald Reagan, Jimmy Carter, Richard Nixon, Lyndon Johnson, or John Kennedy. The paper was to focus on one of these four specific time periods in the president’s life: childhood, adulthood before becoming president, the presidency, or after the presidency.
What is the total possible number of topics consisting of one president and one specific time period? Show how you arrived at your answer. How many of the possible topics include:
A president’s childhood? William J. Clinton? A president from the 1990’s? Childhood or adulthood before becoming president?
A.S.20 Calculate the probability of an event and its complement A.S.20a A gumball machine contains gumballs of five different colors: 36 red, 44 white, 15 blue, 20 green, and 5 orange. The machine’s dispenser randomly selects one gumball. What is the probability that the gumball selected is:
green? not green? not orange? orange? not a color in the flag of the U.S.A.? red, white or blue?
A.S.21 Determine empirical probabilities based on specific sample data A.S.21a
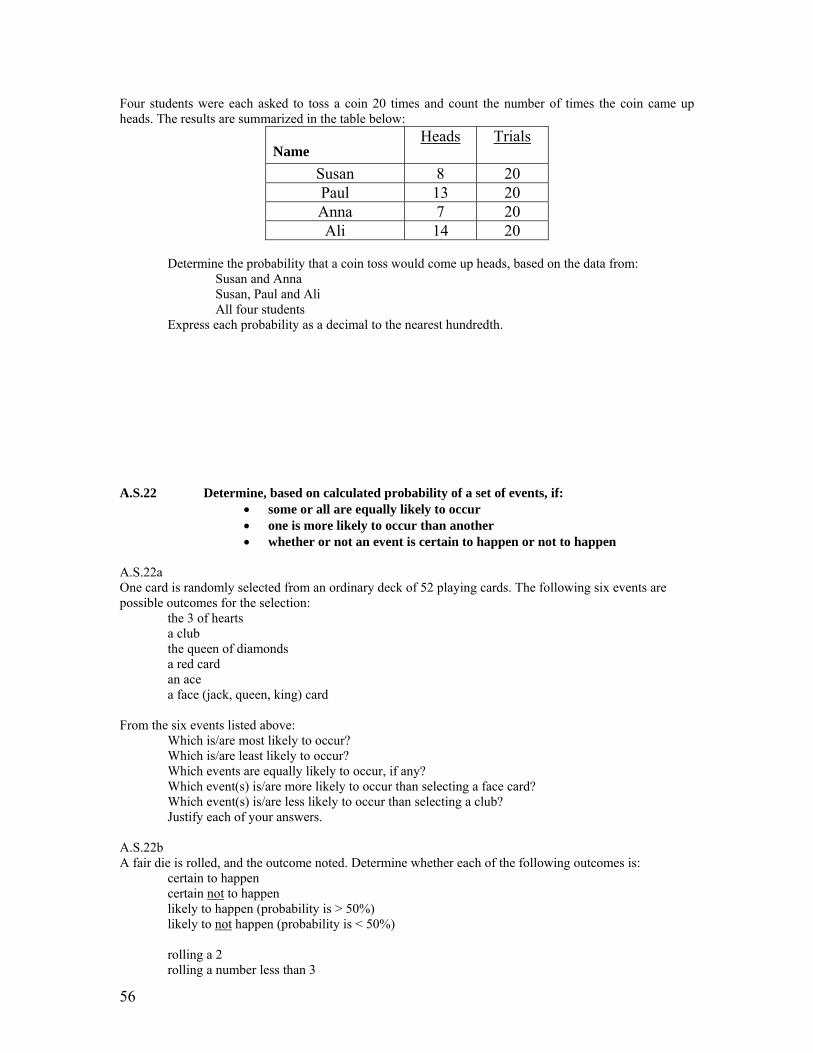
56
Four students were each asked to toss a coin 20 times and count the number of times the coin came up heads. The results are summarized in the table below:
Name Heads Trials
Susan 8 20 Paul 13 20 Anna 7 20 Ali 14 20
Determine the probability that a coin toss would come up heads, based on the data from:
Susan and Anna Susan, Paul and Ali All four students
Express each probability as a decimal to the nearest hundredth. A.S.22 Determine, based on calculated probability of a set of events, if:
• some or all are equally likely to occur • one is more likely to occur than another • whether or not an event is certain to happen or not to happen
A.S.22a One card is randomly selected from an ordinary deck of 52 playing cards. The following six events are possible outcomes for the selection:
the 3 of hearts a club the queen of diamonds a red card an ace a face (jack, queen, king) card
From the six events listed above:
Which is/are most likely to occur? Which is/are least likely to occur? Which events are equally likely to occur, if any? Which event(s) is/are more likely to occur than selecting a face card? Which event(s) is/are less likely to occur than selecting a club? Justify each of your answers.
A.S.22b A fair die is rolled, and the outcome noted. Determine whether each of the following outcomes is:
certain to happen certain not to happen likely to happen (probability is > 50%) likely to not happen (probability is < 50%) rolling a 2 rolling a number less than 3
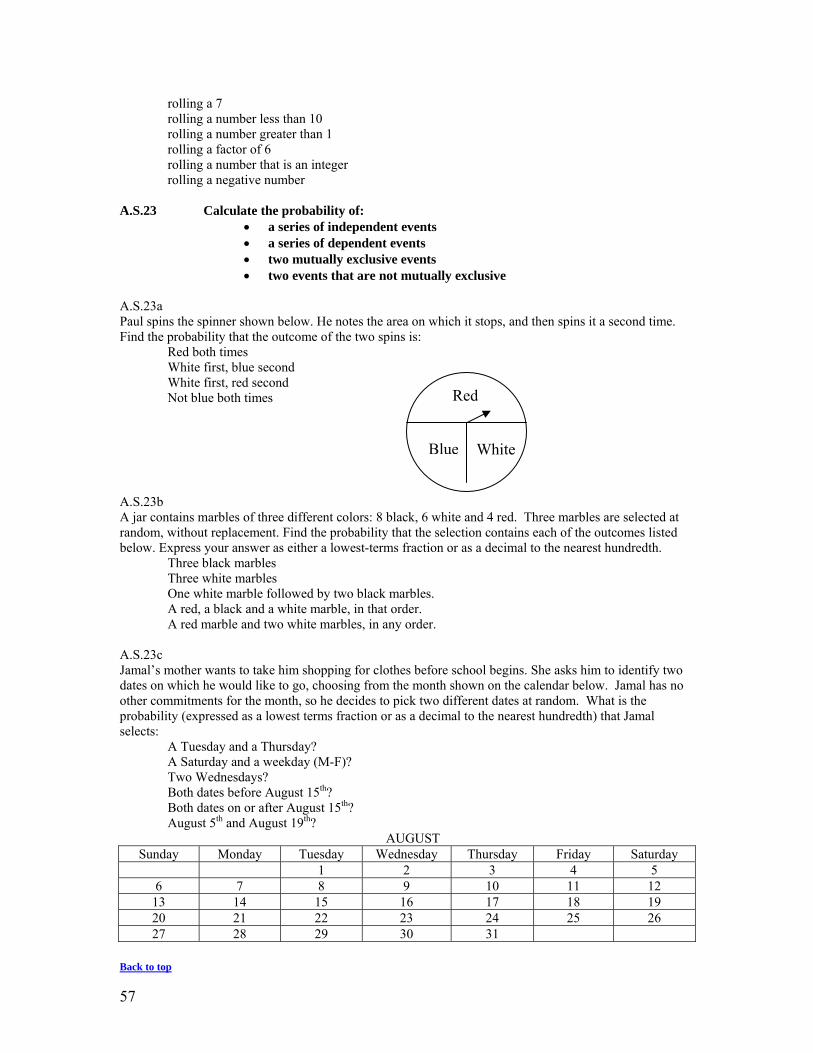
57
rolling a 7 rolling a number less than 10 rolling a number greater than 1 rolling a factor of 6 rolling a number that is an integer rolling a negative number
A.S.23 Calculate the probability of:
• a series of independent events • a series of dependent events • two mutually exclusive events • two events that are not mutually exclusive
A.S.23a Paul spins the spinner shown below. He notes the area on which it stops, and then spins it a second time. Find the probability that the outcome of the two spins is:
Red both times White first, blue second White first, red second Not blue both times
A.S.23b A jar contains marbles of three different colors: 8 black, 6 white and 4 red. Three marbles are selected at random, without replacement. Find the probability that the selection contains each of the outcomes listed below. Express your answer as either a lowest-terms fraction or as a decimal to the nearest hundredth. Three black marbles Three white marbles One white marble followed by two black marbles. A red, a black and a white marble, in that order. A red marble and two white marbles, in any order. A.S.23c Jamal’s mother wants to take him shopping for clothes before school begins. She asks him to identify two dates on which he would like to go, choosing from the month shown on the calendar below. Jamal has no other commitments for the month, so he decides to pick two different dates at random. What is the probability (expressed as a lowest terms fraction or as a decimal to the nearest hundredth) that Jamal selects:
A Tuesday and a Thursday? A Saturday and a weekday (M-F)? Two Wednesdays? Both dates before August 15th? Both dates on or after August 15th? August 5th and August 19th?
AUGUST Sunday Monday Tuesday Wednesday Thursday Friday Saturday
1 2 3 4 5 6 7 8 9 10 11 12
13 14 15 16 17 18 19 20 21 22 23 24 25 26 27 28 29 30 31
Back to top
Red
Blue White

58