Scalability of MANET routing protocols for heterogeneous and homogenous networks
Upload
independentCategory
view
0download
0
David C. Wyld et al. (Eds) : SAI, CDKP, ICAITA, NeCoM, SEAS, CMCA, ASUC, Signal - 2014
pp. 305–315, 2014. © CS & IT-CSCP 2014 DOI : 10.5121/csit.2014.41128
PERFORMANCE EVALUATION OF VANETS
ROUTING PROTOCOLS
Abduladhim Ashtaiwi1,Abdusadik Saoud
2 and Ibrahim Almerhag
1
1College of Information Technology, University of Tripoli,
2Electrical and Computer Engineering, Libyan Academy
[email protected], [email protected],[email protected]
ABSTRACT
Lately, the concept of VANETs (Vehicular Ad hoc Networks) has gotten a huge attention as
more wireless communication technologies becoming available. Such networkis expected to be
one of the most valuable technology for improving efficiency and safety of the future
transportation. Vehicular networks are characterized by high mobility nodes which pose many
communication challenging problems. In vehicular networks, routing Collision Avoidance
Messages (CAMs) among vehicles is a key communication problem.Failure in routing CAMs to
their intended destination within the time constraint can render these messages useless. Many
routing protocols have been adapted for VANETs, such as DSDV (Destination Sequenced
Distance Vector), AODV (Ad-hoc On demand Distance Vector), and DSR (Dynamic Source
Routing). This work compares the performance of those routing protocols at different driving
environments and scenarios created by using the mobility generator (VanetMobiSim) and
network simulator(NS2). The obtained results at different vehicular densities, speeds, road
obstacles, lanes, traffic lights, and transmission ranges showed that on average AODV protocol
outperforms DSR and DSDV protocols in packet delivery ratio and end-toend delay. However,
at certain circumstances (e.g., at shorter transmission ranges) DSR tends to have better
performance than AODV and DSDV protocols.
KEYWORDS
VANETs, MANETs, Routing protocols, ITS
1. INTRODUCTION
The World Health Organization (WHO) presented a report on road safety covers 182 countries
which account for almost 99 % of the world’s population. The report indicated that worldwide the
total number of road traffic deaths remains unacceptably high at 1.24 million per year [?]. The
advances in many technologies have helped many courtiers around the world implement plans to
reduce the road traffic fatalities. Vehicular Ad hoc Networks (VANETs) is very promising that
plays an important role in Intelligent Transportation System (ITS). VANETs assist vehicle drivers
to communicate (through enabling Vehicle-to-Vehicle (V2V) and Vehicle-to-Infrastructure (V2I)
communications) to avoid many critical driving situations.VANETs supports variety of safety
applications such as co-operative traffic monitoring, control of traffic flows, blind crossing,
prevention of collisions, nearby information services, and real-time detour routes computation.
VANETs consist of two entities: access points, called Road Side Units (RSUs), and vehicles,

306 Computer Science & Information Technology (CS & IT)
called On Board Unit(OBUs). RSUs are fixed and can act as a distribution point forvehicle
networks. Figure ?? shows VANETs communication model of VANETs system.
Fig. 1: VANETs Connection topology
In addition to road safety applications, VANETs provide Internet connectivity to vehicles while
on the move, so passengers can download music, send emails,book restaurants and/or play games.
Due to vehicle’s high speed, vehicular networks are characterized by rapid topology changes. The
latter makes designing an efficient routing protocols for vehicular environment very difficult.
Designing an adaptive routing protocols to such rapidly changing network typologies is very
critical to many vehicular safety applications as failing to route collision avoidance messages to
their intended vehicles can render these messages to be useless.
Considerable effort has been spent in performance comparison of VANETs routing protocols: the
authors in [?] evaluated the performance of Ad hoc On demand Distance Victor (AODV) and
Optimized Link State Routing Protocol (OLSR) for VANETs in city environment, in their study
all the characteristics are handled through the vehicle mobility model. Their study showed that
OLSR has better performance than AODV in the VANETs, as the AODV protocol has higher
routing overhead compared to OLSR. The performanceanalyses of traditional ad-hoc routing
protocols like AODV, Destination Sequenced Distance Vector (DSDV), and Dynamic Source
Routing (DSR) for some highway scenarios have been presented in [?]. The authors argued that
these routing protocols are not suitable for VANETs. Their simulation results showed that these
conventional routing protocols have higher routing overhead which cause less packet delivery
ratio. The work in [?] compared AODV and DSR with SWARMIntelligence based routing
protocol by varying mobility, load, and size of the network. Their results showed that AODV and
DSR have less performance than swarm intelligence routing algorithm in VANET environments.
The authors in [?], [?] compared the performance of the routing protocols: AODV, DSR, Fisheye
State Routing (FSR) and Temporally-Ordered Routing Algorithm (TORA), in city traffic
scenarios. Their results showed that both protocols AODV and DSR have the lowest routing
overheads and deliver packets quite fast.
Most previous studies on VANETs routing protocols focused on single driving environment.
Therefore, in our study we focus on evaluating these protocol at different environments,i.e.,
downtown, residential, and suburban. Moreover, the performance of different routing protocols
have not been well measured since each researcher used different simulator and performance
metrics for performance evaluation. Due to aforementioned problems, there is continuous need to
study various ad hoc routing protocols in order to select appropriate routing protocols for
different driving environments of VANETs. In this work we evaluate the performance of DSDV,
AODV, and DSR in different driving scenarios using the mobility generator (VanetMobiSim) and
network simulator (NS2) to model all the driving environment and networking details of the
vehicular ad hoc networks.

Computer Science & Information Technology (CS & IT) 307
The remaining of this work is organized as follows: in Section ?? we give background about the
objectives behind VANETs and how the standard work is produced. Section ?? classifies the
routing protocols and shows their scope and structure. Mobility generator and network simulator
tools which used to create different driving environments and scenarios are explained in Section
??. Section ?? defines the scope and structure of the simulation model framework. The obtained
results are presented and analyzed in Section ??. Finally our concluding remarks are presented in
our conclusion in Section ??.
2. VEHICLE ADHOC NETWORKS (VANETS)
Vehicles independently produce and analyze large amount of data such as time, heading angle,
speed, acceleration, position, brake status, steering angle, headlight status, turn signal status,
vehicle length, vehicle width, vehicle mass, and even the number of occupants in the vehicle.
This data is selfcontained within a single vehicle. VANETs enable vehicles to share this data
among themselves and with the road infrastructure.This shared driving information can then be
used to implement many road safety applications that help to avoid many critical driving
situations such as road side accidents, traffic jams, speed control, free passage of emergency
vehicles and unseen obstacles and etc. In October 1999, the United States Federal
Communications Commission (FCC) allocated 75 MHz of spectrum in the 5.9 GHz band to
Dedicated Short Range Communications (DSRC). As shown in Figure ?? two standards are
primarily involved: the IEEE 1609 standards (which defines the communications services and
also known as Wireless Access in Vehicular Environment (WAVE)) and IEEE 802.11 p (which
defines the physical and medium Application Layeraccess layer details).The IEEE1609 standard
breaks down into the following components: 1609.1 (WAVE resource manager), 1609.2 (WAVE
security services for applications and management messages), 1609.3 (WAVE networking
services), and 1609.4 (WAVE multi-channel operations). The IEEE task group ”P” has approved
the IEEE 802.11p amendment of IEEE 802.11 standard to support VANETs applications. The
main enhancements include short latency and higher ranges, up to 1000 meters.
Fig. 2: protocol Stack
3. ROUTING PROTOCOLS FOR VANETS The main goal of routing protocols is to provide optimal paths between network nodes at
minimum overhead possible. Figure ?? classifies the routing protocols into: topologybasedand
position-based routing protocols. In topology-basedrouting, each node should be aware of the

308 Computer Science & Information Technology (CS & IT)
Fig. 3: Routing Protocols hierarchy
Network layout also be able to forward packets using information about available nodes and links
in the networks. Topology-based routing protocols use link’s information which stored in the
routing table as a basis to forward packets from source to destination node; they are commonly
classified into two categories (based on their underlying architecture): Proactive (periodic) and
Reactive (on-demand) routing protocols.
Proactive protocols (also called table driven protocols) allow a network node to use the routing
table to store routes information for all other nodes in the network, each entry in thetable contains
the next hop used in the path to the destination,regardless of whether the route is actually needed
or not. To reflect the network topology changes, the proactive protocols frequently update their
routing table. The topology changes are broadcasted periodically to all neighbors. In proactive
routing protocols routes to destinations are always available when needed. Proactive protocols
usually depend on shortest path algorithms to determine which route is chosen. They generally
use two routing strategies: Link State (LS) strategy and Distance Vector (DV) strategy. The most
representative are DSDV [?], ADV (Adaptive Distance Vector) [?], GPSR (Greedy Perimeter
Stateless Routing) [?] and OLSR [?].
Reactive routing protocols (also called on-demand) reduce the network overhead by maintaining
routes only when needed. The source node starts a route discovery process if it needs a non-
existing route to a destination. It does this process by flooding the network by a route request
message. After the message reaches the destination node or to the node that has a route to the
destination, the receiving node sends a route reply message back to the source node using unicast
communication. Depending on how the routing method is implemented, reactive routing
protocols can be divided into source routing protocols and hop-by-hop or point-to-point
protocols.
In source routing protocols every data packet carries the whole path information in its header.
Before a source node sends data packets, it must know the total path to the destination, that is, all
addresses of intermediate nodes which compose the path from source to destination. There is no
need that intermediate nodes update their routing tables, since they only forward data packets
according to the header information. The most representative source routing protocol is DSR [?].
On the other hand, hop-by-hop routing protocols try to improve the performance by keeping the
routing information in each node. Every data packet does not include the whole path information
any more. They only include the address of the following node where data packet must be
forwarded to get the destination as well as the destination address. Every intermediate node, along
the path, must look up its own routing table to forward the data packets to the intended
destination, so that the route is calculated hop-by-hop. The most representative hop-by-hop
routing protocol is AODV [?].

Computer Science & Information Technology (CS & IT) 309
4. VEHICULAR SCENARIOS AND ENVIRONMENTS MODEL
In this work we used VanetMobiSim simulator which models all the VANETs traffic and
environment details. The Vanet- MobiSim framework includes a number of mobility modules,
parsers for geographic data sources in various formats, as well as visualization module. The
framework is based on the concept of pluggable modules so that it is easily extend the model to
cover many traffic and environment details. The chosen scenario is based on random street
configurations. While vehicles are distributed randomly and move in a random direction. Roads
in different driving environments are configured with single-lane as well as multi-lane.
The simulated scenario also includes different traffic flows and traffic lights located in different
places. Several speeds have been selected as well as level of congestion. The selected mobility
pattern is Random Waypoint mobility (RWP) with obstacles avoidance [?], in which vehicles
move randomly and freely without restrictions. In addition, vehicles motion is enhanced with
IntelligentDriving Model (IDM) which incorporates intersection management and lane changing
mechanism [?]. IDM with Intersection Management (IDM-IM) module describes perfectly
vehicle-to-vehicle and intersection managements. This module allows vehicles to adjust their
speed based on the movements of neighboring vehicles (e.g., if a vehicle in frontbrakes, the
succeeding vehicles also slow down and stop at intersections, or act according to traffic lights).
IDM with Lane Changing (IDM-LC) is an overtaking module which interacts with IDM-IM to
manage lane changes, vehicle accelerations, and deceleration. Based on IDM-LC module,
vehicles are able to change lane and perform over takings in presence of multilane roads.
Continuous bit rate (CBR) traffic sources are used in vehicles. The source-destination pairs are
spread randomly over the simulation area. The number of source-destination pairs and the packet
sending rate in each pair is varied to change the offered load in the network. 32-byte data packets
are used. Table ?? lists the mobility model parameters and their values used in the simulation.
TABLE I: Mobility modele parameters
To model the vehicular driving environment as close as possible to the real world environment, in
our created model we divide the simulation area into three clusters: downtown, residential, and
suburban. Clustering in VanetMobiSim tool are used to create different simulation areas with
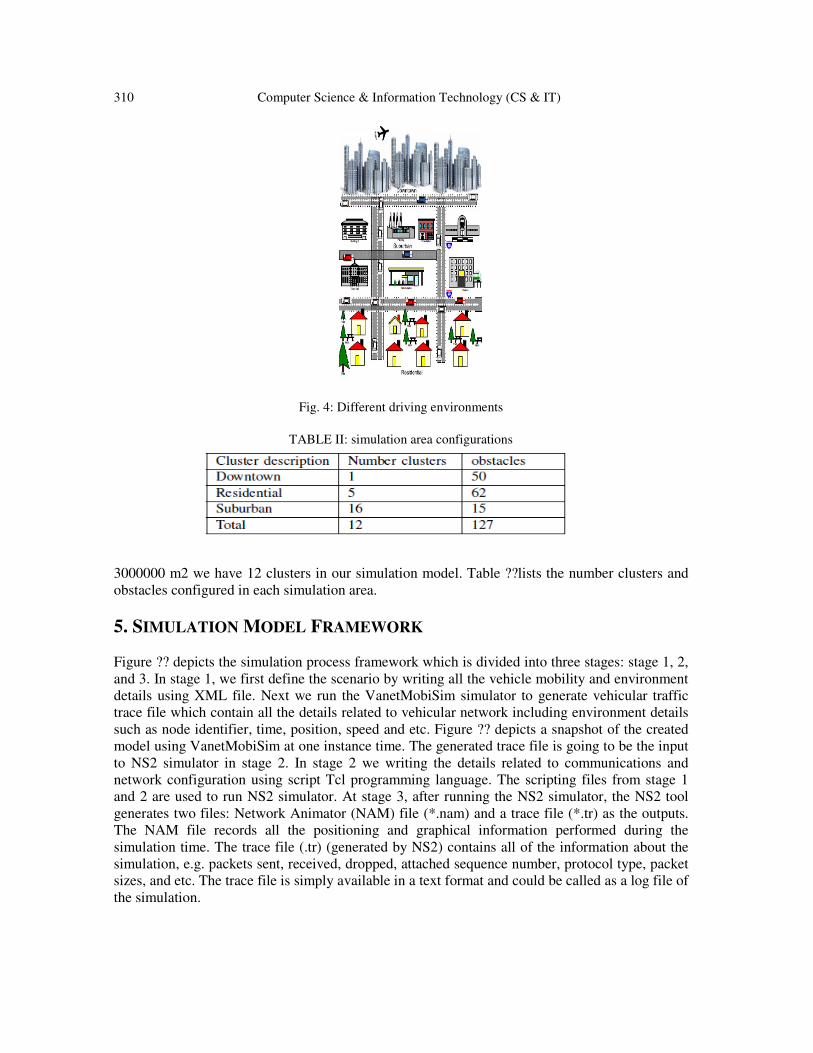
different driving environment and obstacles. Figure ??depict the different simulation areas:
downtown, residential, and suburban. The clustering density parameter describes how many
clusters per squared area (i.e., clusters/m2). In this model we set the cluster density to be 4
clusters per 1000000 m2 which is 250000 m2 per cluster area. Based on the simulated area which
is
310 Computer Science & Information Technology (CS & IT)
Fig. 4: Different driving environments
TABLE II: simulation area configurations
3000000 m2 we have 12 clusters in our simulation model. Table ??lists the number clusters and
obstacles configured in each simulation area.
5. SIMULATION MODEL FRAMEWORK
Figure ?? depicts the simulation process framework which is divided into three stages: stage 1, 2,
and 3. In stage 1, we first define the scenario by writing all the vehicle mobility and environment
details using XML file. Next we run the VanetMobiSim simulator to generate vehicular traffic
trace file which contain all the details related to vehicular network including environment details
such as node identifier, time, position, speed and etc. Figure ?? depicts a snapshot of the created
model using VanetMobiSim at one instance time. The generated trace file is going to be the input
to NS2 simulator in stage 2. In stage 2 we writing the details related to communications and
network configuration using script Tcl programming language. The scripting files from stage 1
and 2 are used to run NS2 simulator. At stage 3, after running the NS2 simulator, the NS2 tool
generates two files: Network Animator (NAM) file (*.nam) and a trace file (*.tr) as the outputs.
The NAM file records all the positioning and graphical information performed during the
simulation time. The trace file (.tr) (generated by NS2) contains all of the information about the
simulation, e.g. packets sent, received, dropped, attached sequence number, protocol type, packet
sizes, and etc. The trace file is simply available in a text format and could be called as a log file of
the simulation.

Computer Science & Information Technology (CS & IT) 311
To extract the statistics (such as transmitted/received bytes and packet loss) from the generated
file of NS2, we utilize AWK tool.
6. PERFORMANCE EVALUATION
The results obtained from modeled traffic and environment of vehicular networks using
VanetMobisim and NS2 simulators are presented and analyzed in this section. We evaluate the
scenarios using global metrics such as packet delivery ratio and end-to-end delay. The results are
studied at different driving environment parameters such as node’s density, speed and/or
transmission range. We used different node densities (i.e., 20 to 45 nodes/km2) while the speed of
the nodes are configured randomly between 30 to 50 km/h.
312 Computer Science & Information Technology (CS & IT)
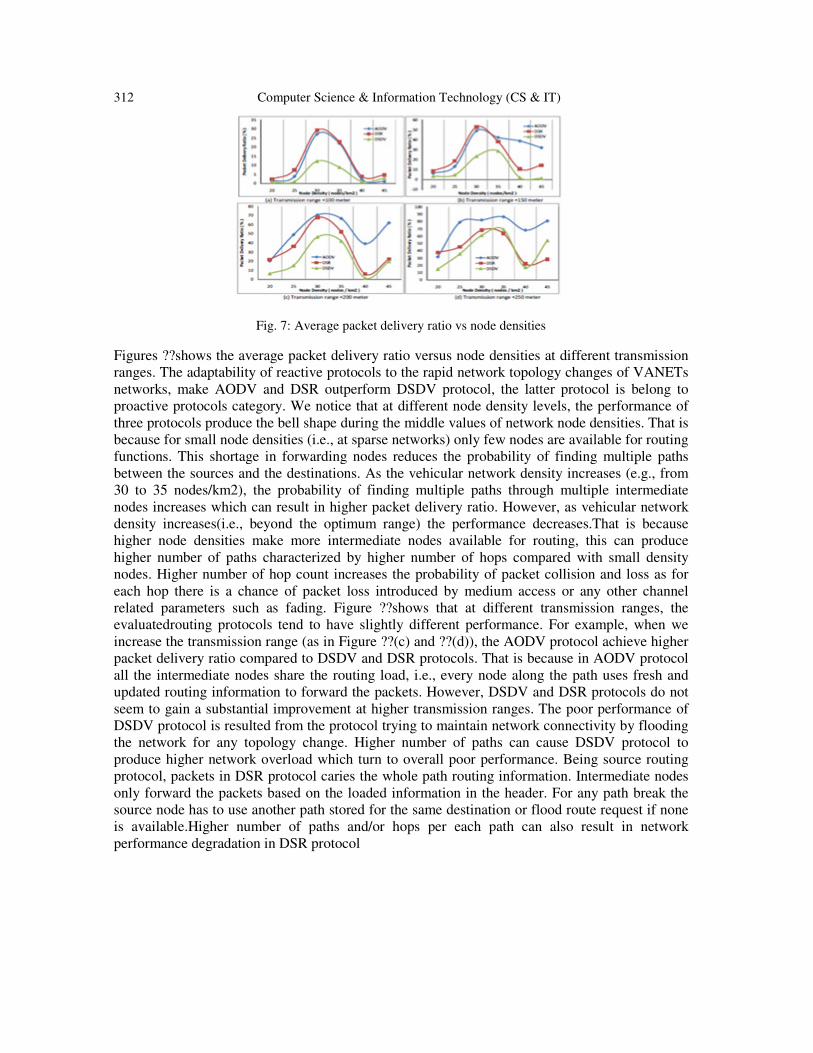
Fig. 7: Average packet delivery ratio vs node densities
Figures ??shows the average packet delivery ratio versus node densities at different transmission
ranges. The adaptability of reactive protocols to the rapid network topology changes of VANETs
networks, make AODV and DSR outperform DSDV protocol, the latter protocol is belong to
proactive protocols category. We notice that at different node density levels, the performance of
three protocols produce the bell shape during the middle values of network node densities. That is
because for small node densities (i.e., at sparse networks) only few nodes are available for routing
functions. This shortage in forwarding nodes reduces the probability of finding multiple paths
between the sources and the destinations. As the vehicular network density increases (e.g., from
30 to 35 nodes/km2), the probability of finding multiple paths through multiple intermediate
nodes increases which can result in higher packet delivery ratio. However, as vehicular network
density increases(i.e., beyond the optimum range) the performance decreases.That is because
higher node densities make more intermediate nodes available for routing, this can produce
higher number of paths characterized by higher number of hops compared with small density
nodes. Higher number of hop count increases the probability of packet collision and loss as for
each hop there is a chance of packet loss introduced by medium access or any other channel
related parameters such as fading. Figure ??shows that at different transmission ranges, the
evaluatedrouting protocols tend to have slightly different performance. For example, when we
increase the transmission range (as in Figure ??(c) and ??(d)), the AODV protocol achieve higher
packet delivery ratio compared to DSDV and DSR protocols. That is because in AODV protocol
all the intermediate nodes share the routing load, i.e., every node along the path uses fresh and
updated routing information to forward the packets. However, DSDV and DSR protocols do not
seem to gain a substantial improvement at higher transmission ranges. The poor performance of
DSDV protocol is resulted from the protocol trying to maintain network connectivity by flooding
the network for any topology change. Higher number of paths can cause DSDV protocol to
produce higher network overload which turn to overall poor performance. Being source routing
protocol, packets in DSR protocol caries the whole path routing information. Intermediate nodes
only forward the packets based on the loaded information in the header. For any path break the
source node has to use another path stored for the same destination or flood route request if none
is available.Higher number of paths and/or hops per each path can also result in network
performance degradation in DSR protocol

Computer Science & Information Technology (CS & IT) 313
Fig. 8: End-to-End delay vs node density
Figure ??shows the average end-to-end delay at different node densities and transmission ranges.
At all ranges and network densities used, DSDV protocol tends to have the lowest end-to-end
delay compared to AODV and DSR protocols. Comparing these results to the packet delivery
ratio in Figure ??, we observe that DSDV also has the lowest packet delivery ratio. As explained
above, DSDV is proactive protocol where every node in the network stores routing path for every
node in the network. Due to the fast topology change of VANETs environment, DSDV can not
maintain valid paths to the other destinations specially paths with multiple hops. The stale routing
table entry of DSDV protocol, make the latter protocol forwards packets toward broken links.
Due to this, the successfully delivered packets are only those of few number of hops which then
can result in small end-to-end delay. It is apparent from Figure ??that AODV outperforms DSR in
terms of end-to-end delay at all network densities and transmission ranges. That is because in
AODV protocol all nodes along the path share the routing load, where in DSR protocol only the
source node is responsible for maintaining the whole path information. Larger header size of DSR
(because of routing information stored in the header) consumes higher network capacity which
then can result in higher network delay compared to AODV. As shown in Figure ??, the three
evaluated protocols tend to have higher packet delivery ratio at the density range of 30-35
nodes/km2. They similarly tendto have lower end-to-end delay for the same density range as
shown in Figure ??. That is because higher packet delivery ratio means more packets have made
it cross the network to the destination, this, as result, indicates the optimum availability of number
of routing paths and network congestion during these values of node densities. As we increase the
transmission range, the end-to-end delay is decreasing for all the evaluated protocols.
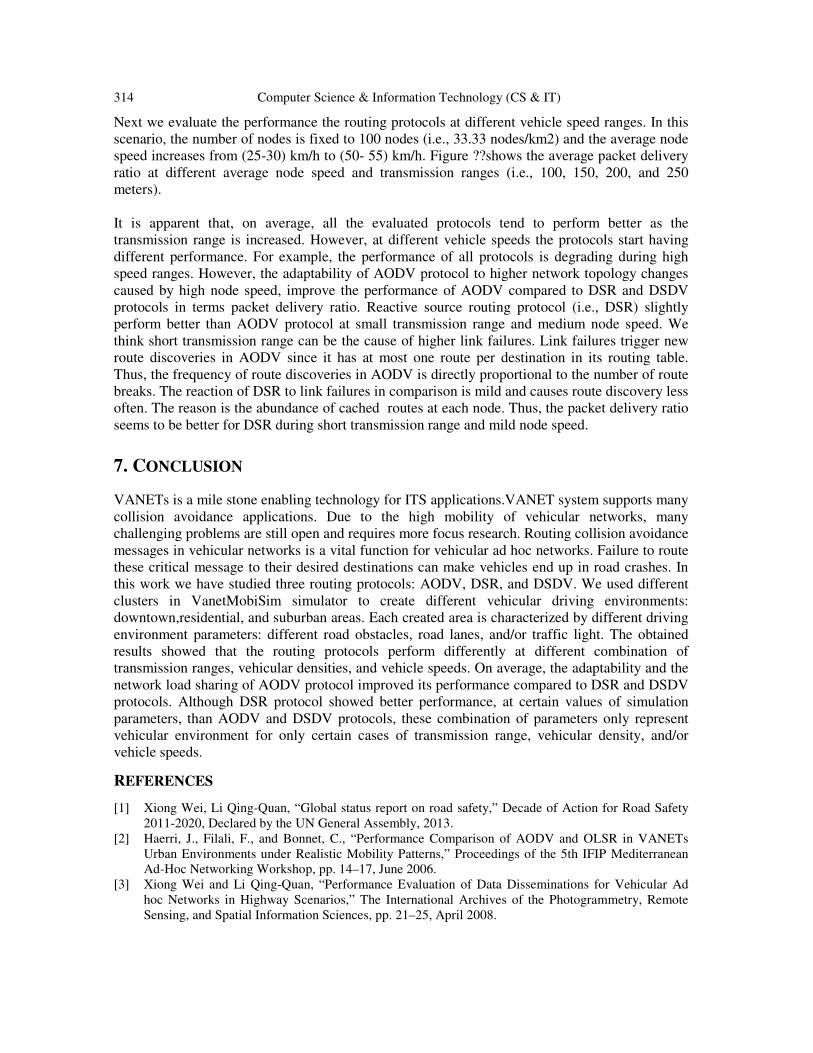
Fig. 9: Packet delivery ratio vs speed
314 Computer Science & Information Technology (CS & IT)
Next we evaluate the performance the routing protocols at different vehicle speed ranges. In this
scenario, the number of nodes is fixed to 100 nodes (i.e., 33.33 nodes/km2) and the average node
speed increases from (25-30) km/h to (50- 55) km/h. Figure ??shows the average packet delivery
ratio at different average node speed and transmission ranges (i.e., 100, 150, 200, and 250
meters).
It is apparent that, on average, all the evaluated protocols tend to perform better as the
transmission range is increased. However, at different vehicle speeds the protocols start having
different performance. For example, the performance of all protocols is degrading during high
speed ranges. However, the adaptability of AODV protocol to higher network topology changes
caused by high node speed, improve the performance of AODV compared to DSR and DSDV
protocols in terms packet delivery ratio. Reactive source routing protocol (i.e., DSR) slightly
perform better than AODV protocol at small transmission range and medium node speed. We
think short transmission range can be the cause of higher link failures. Link failures trigger new
route discoveries in AODV since it has at most one route per destination in its routing table.
Thus, the frequency of route discoveries in AODV is directly proportional to the number of route
breaks. The reaction of DSR to link failures in comparison is mild and causes route discovery less
often. The reason is the abundance of cached routes at each node. Thus, the packet delivery ratio
seems to be better for DSR during short transmission range and mild node speed.
7. CONCLUSION
VANETs is a mile stone enabling technology for ITS applications.VANET system supports many
collision avoidance applications. Due to the high mobility of vehicular networks, many
challenging problems are still open and requires more focus research. Routing collision avoidance
messages in vehicular networks is a vital function for vehicular ad hoc networks. Failure to route
these critical message to their desired destinations can make vehicles end up in road crashes. In
this work we have studied three routing protocols: AODV, DSR, and DSDV. We used different
clusters in VanetMobiSim simulator to create different vehicular driving environments:
downtown,residential, and suburban areas. Each created area is characterized by different driving
environment parameters: different road obstacles, road lanes, and/or traffic light. The obtained
results showed that the routing protocols perform differently at different combination of
transmission ranges, vehicular densities, and vehicle speeds. On average, the adaptability and the
network load sharing of AODV protocol improved its performance compared to DSR and DSDV
protocols. Although DSR protocol showed better performance, at certain values of simulation
parameters, than AODV and DSDV protocols, these combination of parameters only represent
vehicular environment for only certain cases of transmission range, vehicular density, and/or
vehicle speeds.
REFERENCES
[1] Xiong Wei, Li Qing-Quan, “Global status report on road safety,” Decade of Action for Road Safety
2011-2020, Declared by the UN General Assembly, 2013.
[2] Haerri, J., Filali, F., and Bonnet, C., “Performance Comparison of AODV and OLSR in VANETs
Urban Environments under Realistic Mobility Patterns,” Proceedings of the 5th IFIP Mediterranean
Ad-Hoc Networking Workshop, pp. 14–17, June 2006.
[3] Xiong Wei and Li Qing-Quan, “Performance Evaluation of Data Disseminations for Vehicular Ad
hoc Networks in Highway Scenarios,” The International Archives of the Photogrammetry, Remote
Sensing, and Spatial Information Sciences, pp. 21–25, April 2008.

Computer Science & Information Technology (CS & IT) 315
[4] Manvi, S.S., Kakkasageri, M.S., and Mahapurush, C.V., “Performance Analysis of AODV, DSR, and
Swarm Intelligence Routing Protocols In Vehicular Ad hoc Network Environment,” In International
Conference on Future Computer and Communication, pp. 21–25, April 2009.
[5] Iwata A. et al., “Scalable Routing Strategies for Ad-hoc Wireless Networks,” IEEE Journal on
Selected Areas in Communications, pp.1369–79, Aug 1999.
[6] Sven J., Marc B., and Lars W., “Evaluation of Routing Protocols for Vehicular Ad Hoc Networks in
City Traffic Scenarios,” in Proc of the 11th EUNICE Open European Summer School on Networked
Applications, Colmenarejo, pp. 584–602, April 2005.
[7] Perkins C.E. and Bhagwat P., “Highly Dynamic Destination-Sequenced Distance Vector Routing
(DSDV) for Mobile Computers,” SIGCOMM ’94 Proceedings of the Conference on Communications
Architectures, Protocols and Applications , pp. 234–244, Sep 1994.
[8] Boppana R.V. and Konduru P., “An Adaptive Distance Vector Routing Algorithm for Mobile Ad Hoc
Network,” Proceedings of the Twentieth Annual Joint Conference of the IEEE Computer and
Communications Societes, pp. 1753–1762, Oct 2001.
[9] Brad K. and Kung H. T., “Greedy Perimeter Stateless Routing for Wireless Networks,” Proceedings
of the 6th Annual International Conference on Mobile Computing and Networking , pp. 243–254, Oct
2000.
[10] Clausen, T. and Jacquet, P., “Optimized Link State Routing Protocol (OLSR),” RFC Editor, vol.
OLS:RFC3626, pp. 195–206, 2003.
[11] D. Maltz D. Johnson, and Y. Hu., “The Dynamic Source Routing (DSR) Protocol for Mobile Ad hoc
Networks for IPv4,” URL http://tools.ietf.org/html/ rfc4728, February 2007.
[12] Perkins C., Belding-Royer E., and Das E., “Ad-hoc On-demand Distance Vector Routing,” Mobile
Computing Systems and Applications, 1999. Proceedings. WMCSA ’99, pp. 90–100, Feb 1999.
[13] Johanson P., Larsson T., Hedman N., Mielczarek B., and Degermark M., “Scenario-based
Performance Analysis of Routing Protocols for Mobile Ad-hoc Networks,” Proceedings of
ACM/IEEE MOBICOM’99, pp. 195–206, Aug 1999.
[14] Helbing, D., Hennecke, A., Shvetsov, V., and Treiber, M, “MicroandMacrosimulation of Freeway
Traffic,” Mathematical and Computer Modelling Journal, vol. 35, pp. 517–547, 2002.
Copyright © 2022 FDOKUMEN