PATHS: analysis of PATH duration statistics and their impact on reactive MANET routing protocols
12
PATHS: Analysis of PATH Duration Statistics and their Impact on Reactive MANET Routing Protocols Narayanan Sadagopan † , Fan Bai , Bhaskar Krishnamachari , Ahmed Helmy † Department of Computer Science Department of Electrical Engineering University of Southern California {narayans,fbai,bkrishna,helmy}@usc.edu ABSTRACT We develop a detailed approach to study how mobility im- pacts the performance of reactive MANET routing proto- cols. In particular we examine how the statistics of path durations including PDFs vary with the parameters such as the mobility model, relative speed, number of hops, and ra- dio range. We find that at low speeds, certain mobility mod- els may induce multi-modal distributions that reflect the characteristics of the spatial map, mobility constraints and the communicating traffic pattern. However, our study sug- gests that at moderate and high velocities the exponential distribution with appropriate parameterizations is a good approximation of the path duration distribution for a range of mobility models. The reciprocal of the average path dura- tion is analytically shown to have a strong linear relationship with the throughput and overhead that is confirmed by the simulation results for DSR. Categories and Subject Descriptors C.2.2 [Computer-Communication Networks]: Network Protocols General Terms Design, Performance Keywords Mobile Ad Hoc Network, Performance, Mobility, Path Du- ration 1. INTRODUCTION Availability of small, inexpensive wireless communicating devices has played an important role in moving ad hoc net- works closer to reality. Consequently, Mobile Ad hoc NET- works (MANETs) are attracting a lot of attention from the research community. MANETs are advantageous because Permission to make digital or hard copies of all or part of this work for personal or classroom use is granted without fee provided that copies are not made or distributed for profit or commercial advantage and that copies bear this notice and the full citation on the first page. To copy otherwise, to republish, to post on servers or to redistribute to lists, requires prior specific permission and/or a fee. MobiHoc’03, June 1–3, 2003, Annapolis, Maryland, USA. Copyright 2003 ACM 1-58113-684-6/03/0006 ...$5.00. of their readily deployable nature as they do not need any centralized infrastructure. Since this field is still in its de- veloping stage, not many MANETs have been deployed yet. Thus, most of the research in this area is simulation based. These simulations have several parameters such as the mo- bility model, traffic pattern, propagation model, etc to name a few. We acknowledge that these and other factors like channel characteristics, MAC effects, etc do impact the pro- tocol performance and the study of the interplay of these factors is very complex. In this paper, we focus on develop- ing a detailed approach to study the effect of mobility per se on the performance of reactive MANET routing protocols like DSR [2] and AODV [5]. This paper proposes a novel approach to understand the effect of mobility on protocol performance. It uses statisti- cal analysis (of simulation data) to obtain detailed statistics of link and path duration including their Probability Den- sity Functions (PDFs). Further, through simple analytical models, using the case study of DSR, it shows a strong cor- relation between the reciprocal of average path duration and the throughput and overhead of reactive protocols. Recently, there has been a greater focus on a systematic study of the effect of mobility on the performance of routing protocols. [17] proposed the IMPORTANT framework to systematically analyze the effect of mobility on routing pro- tocols. In this framework, the authors proposed to evaluate the MANET routing protocols using a “test-suite” of mo- bility models that span several mobility characteristics like spatial dependence, geographic restrictions, etc. These mod- els included the Random Waypoint (RW), Reference Point Group Mobility (RPGM), Freeway (FW) and Manhattan (MH). They found that mobility significantly impacts the performance of the protocols, which is in agreement with several other studies. Moreover, they also proposed a reason for Why mobility impacts performance: Mobility impacts the connectivity graph (average link duration in particular) which in turn impacts the protocol performance. To explain How mobility impacts the performance, [18] introduced BRICS methodology. It proposed that a proto- col could be considered to be made up of parameterized “building blocks” or basic mechanisms. The effect of mo- bility on the entire protocol can be explained in terms of its effect on these “building blocks”. Some of the “build- ing blocks” proposed by BRICS for reactive protocols were flooding, caching, error detection, error notification and er- ror recovery. Both DSR and AODV use these “building blocks” in their operation. However, they still behave dif- 245
Transcript of PATHS: analysis of PATH duration statistics and their impact on reactive MANET routing protocols

PATHS: Analysis of PATH Duration Statistics and theirImpact on Reactive MANET Routing Protocols
Narayanan Sadagopan† , Fan Bai�, Bhaskar Krishnamachari� , Ahmed Helmy�
†Department of Computer Science�Department of Electrical Engineering
University of Southern California
{narayans,fbai,bkrishna,helmy}@usc.edu
ABSTRACTWe develop a detailed approach to study how mobility im-pacts the performance of reactive MANET routing proto-cols. In particular we examine how the statistics of pathdurations including PDFs vary with the parameters such asthe mobility model, relative speed, number of hops, and ra-dio range. We find that at low speeds, certain mobility mod-els may induce multi-modal distributions that reflect thecharacteristics of the spatial map, mobility constraints andthe communicating traffic pattern. However, our study sug-gests that at moderate and high velocities the exponentialdistribution with appropriate parameterizations is a goodapproximation of the path duration distribution for a rangeof mobility models. The reciprocal of the average path dura-tion is analytically shown to have a strong linear relationshipwith the throughput and overhead that is confirmed by thesimulation results for DSR.
Categories and Subject DescriptorsC.2.2 [Computer-Communication Networks]: NetworkProtocols
General TermsDesign, Performance
KeywordsMobile Ad Hoc Network, Performance, Mobility, Path Du-ration
1. INTRODUCTIONAvailability of small, inexpensive wireless communicating
devices has played an important role in moving ad hoc net-works closer to reality. Consequently, Mobile Ad hoc NET-works (MANETs) are attracting a lot of attention from theresearch community. MANETs are advantageous because
Permission to make digital or hard copies of all or part of this work forpersonal or classroom use is granted without fee provided that copies arenot made or distributed for profit or commercial advantage and that copiesbear this notice and the full citation on the first page. To copy otherwise, torepublish, to post on servers or to redistribute to lists, requires prior specificpermission and/or a fee.MobiHoc’03, June 1–3, 2003, Annapolis, Maryland, USA.Copyright 2003 ACM 1-58113-684-6/03/0006 ...$5.00.
of their readily deployable nature as they do not need anycentralized infrastructure. Since this field is still in its de-veloping stage, not many MANETs have been deployed yet.Thus, most of the research in this area is simulation based.These simulations have several parameters such as the mo-bility model, traffic pattern, propagation model, etc to namea few. We acknowledge that these and other factors likechannel characteristics, MAC effects, etc do impact the pro-tocol performance and the study of the interplay of thesefactors is very complex. In this paper, we focus on develop-ing a detailed approach to study the effect of mobility perse on the performance of reactive MANET routing protocolslike DSR [2] and AODV [5].
This paper proposes a novel approach to understand theeffect of mobility on protocol performance. It uses statisti-cal analysis (of simulation data) to obtain detailed statisticsof link and path duration including their Probability Den-sity Functions (PDFs). Further, through simple analyticalmodels, using the case study of DSR, it shows a strong cor-relation between the reciprocal of average path durationand the throughput and overhead of reactive protocols.
Recently, there has been a greater focus on a systematicstudy of the effect of mobility on the performance of routingprotocols. [17] proposed the IMPORTANT framework tosystematically analyze the effect of mobility on routing pro-tocols. In this framework, the authors proposed to evaluatethe MANET routing protocols using a “test-suite” of mo-bility models that span several mobility characteristics likespatial dependence, geographic restrictions, etc. These mod-els included the Random Waypoint (RW), Reference PointGroup Mobility (RPGM), Freeway (FW) and Manhattan(MH). They found that mobility significantly impacts theperformance of the protocols, which is in agreement withseveral other studies. Moreover, they also proposed a reasonfor Why mobility impacts performance: Mobility impactsthe connectivity graph (average link duration in particular)which in turn impacts the protocol performance.
To explain How mobility impacts the performance, [18]introduced BRICS methodology. It proposed that a proto-col could be considered to be made up of parameterized“building blocks” or basic mechanisms. The effect of mo-bility on the entire protocol can be explained in terms ofits effect on these “building blocks”. Some of the “build-ing blocks” proposed by BRICS for reactive protocols wereflooding, caching, error detection, error notification and er-ror recovery. Both DSR and AODV use these “buildingblocks” in their operation. However, they still behave dif-
245
ferently for a given mobility model. BRICS suggested thata possible reason for this difference might be the differentparameter settings for the “building blocks” in AODV andDSR. This leads to different impacts of mobility on thesemechanisms. A brief overview of the work done in [17] and[18] is given in the section 3.
In this paper, we develop an approach that combines sta-tistical analysis of simulation data and analytical modelingto get a deeper understanding of the protocol performancein the presence of mobility. [17] concluded that averagelink duration is a useful metric for relating mobility withprotocol performance. For a given pair of nodes, link dura-tion is defined as the time during which the two nodes arewithin the transmission range of each other. At the sametime, intuitively, the protocol performance depends on theduration of a path between the source and the destination,i.e. path duration. Both link and path duration are for-mally defined in section 4. Path duration is significantlyrelated to link duration. It is actually the minimum linkduration along a path. In general, longer the path duration,better the performance in terms of throughput and over-head. However, the relationship between the path durationand protocol performance (throughput and overhead) hasnot been categorized yet. In this paper, we examine the de-tailed statistics of link and path duration including PDFsacross the “test-suite” of mobility models proposed in [17].We then attempt to categorize the relationship between av-erage path duration, performance of the caching mechanism(non-propagating cache hit ratio) and protocol performance(throughput and routing overhead) as either strongly (orweakly) linearly (or non-linearly) related. The contributionsof this study are the following:
1. Characterizing the statistics of link and path durationsincluding PDFs for the different mobility models usedin our study using simple statistical analysis. This alsoleads to a characterization of link and path durationsbased on the communicating traffic pattern.
2. Investigating possible distributions to approximate thepath duration PDF across the mobility models used.At moderate to high mobility, we suggest that an ex-ponential distribution with an appropriate parameter-ization is a reasonable approximation to most of ourstudied models.
3. Establishing a linear relationship, through simple firstorder analytical models (that are validated by simu-lation results), between the reciprocal of the averagepath duration and protocol performance (throughputand routing overhead), that helps explain several per-formance trends under various mobility models.
The rest of the paper is organized as follows: Section 2gives an overview of the related work. Section 3 sets ourwork in context with the recent work in this area. Linkand path duration are formally defined in section 4. Section5 discusses our simulation setup while the results of thesesimulations are discussed in section 6. Section 7 gives firstorder analytical models relating the average path duration,and the protocol performance of reactive protocols using thecase study of DSR. Our conclusions and future work arelisted in section 8.
2. RELATED WORKIn this paper, we study the detailed statistics of link and
path duration including their PDFs across a rich set of mo-bility models. As mentioned in section 1, we believe such astudy might help in formulating analytical models for pro-tocol performance across these mobility models. However,such a thought was inspired by other pioneering work donein MANET research.
2.1 Mobility Models:Mobility models for simulations have been one of the early
topics of research in this field. One of the early contribu-tions was made by Broch, Maltz, Johnson, et al where theyevaluated DSR, AODV, DSDV [3] and TORA [16] usingthe RW model [1]. They concluded that mobility does im-pact the performance of routing protocols. To evaluate theseprotocols over a wider range of scenarios, Johansson, Lars-son, Hedman, et al proposed the scenario based performanceanalysis [10]. In this study they proposed mobility modelsfor disaster relief, event coverage and conferences. Hong,Gerla, Pei, et al proposed the Reference Point Group Mo-bility (RPGM) model in [8]. One of the main applicationsof this model is in battlefield communications. The authorsgive several other applications of RPGM in [8]. While defin-ing their framework, [17] proposed to evaluate the protocolsunder a richer set of mobility models. Apart from using theRW and RPGM, they used two other mobility models i.e.the FW and the MH models. In this study, we use thesefour models for our simulations.
2.2 Protocol Independent Metrics:Apart from analyzing the effect of mobility on protocol
performance, it is useful to characterize mobility indepen-dent of the protocols. Hence, there have been several at-tempts to propose mobility metrics. Johansson, Larsson,Hedman, et al proposed the relative motion between mobilenodes to distinguish the different mobility models used fortheir scenario based study in [10]. [17] used the metricsof relative motion and average degree of spatial dependenceto characterize the different mobility models used in theirstudy. They also proposed the connectivity graph metricsas a “bridge” relating the mobility metrics to the protocolperformance. They found that average link duration at thegraph level could explain this relationship. Hong, Gerla, Peiand Chiang proposed the rate of link change as a metric todifferentiate the various kinds of RPGM and RW models in[8]. We agree with [17] and [8] that the connectivity graphcharacteristics might help in relating mobility with protocolperformance. As mentioned in section 1, we believe that thepath duration can also be added to this set of connectivitygraph metrics. Moreover, unlike other studies, we not onlyexamine the averages, but also focus on the detailed statis-tics including the PDFs of link and path duration acrossseveral mobility models.
2.3 Reactive Protocols:In this paper, we focus on evaluating the reactive MANET
routing protocols like DSR and AODV. There have been sev-eral studies to compare both proactive and reactive routingprotocols. [11], [13], [2], [12] and [4] give a very good expo-sition of this subject. Here, we discuss the work that focuscompletely on reactive protocols. Johnson, Maltz, Broch,et al proposed DSR in [2], while AODV was proposed by
246

Perkins in [5]. Maltz, Broch, Jetcheva and Johnson gavea very comprehensive analysis of DSR in terms of its ba-sic mechanisms of route discovery and caching [4]. Theyproposed several optimizations for reducing the route dis-covery overhead. Most of these optimizations are now partof the DSR implementation in the network simulator (ns-2 )[15]. Das, Perkins and Royer compared the performance ofAODV and DSR in [12]. They observed that DSR outper-formed AODV in less demanding situations, while AODVoutperformed DSR at heavy traffic load and high mobility.To explain these differences, the BRICS methodology wasproposed to decompose protocols into basic “mechanisms”[18]. It illustrated an approach for this decomposition bysuggesting a common architecture that encompassed bothAODV and DSR. Though both AODV and DSR consist ofsimilar mechanisms or “building blocks” (that are parame-terized), they behave differently in the presence of mobility.Some of these mechanisms are caching, flooding, etc. Adetailed overview of BRICS is given in section 3. In thisstudy, we propose a simple analytical model that relates theaverage path duration and the performance of the cachingmechanism to the routing overhead of DSR (and reactiveprotocols in general). Both [4] and [18] consider this mech-anism to play an important role in determining the routingoverhead of DSR and other reactive protocols. Moreover,we also develop a simple intuitive model to show the re-lationship (linear or non-linear) between the average pathduration and the reactive protocol throughput.
2.4 AnalysisApart from simulation-based studies, the MANET research
literature also contains analytical work on mobility and pro-tocol performance modeling. One of the earliest analysis ofmobility was done by Mc Donald and Znati in [6]. Theyused a RW like mobility model and derived expressions forthe probability of path availability and link availability fordifferent initial conditions. Stochastic properties of the RWmodel were studied recently in [21], [22] and [23]. Su,Lee and Gerla exploited the non-random movement of mo-bile nodes during intervals to predict its location in [9].They proposed a model for link duration and evaluated itusing the RW model. In this paper, we examine the de-tailed statistics of link and path duration including PDFsacross several mobility models used in our study. Gruberand Li presented a very detailed analysis of link durationtimes for a two hop MANET in [24]. In this study, the dis-tribution of the link duration appeared to be exponential.Their analysis assumed that the source and destination arefixed while the intermediate hop is moving using the RWmodel. The exponential distribution of link duration alsocomes up in the analysis of single path and multipath DSRby Nasipuri, Castaneda and Das in [20]. They assumed thatthe link durations are exponentially distributed independentrandom variables (i.i.d) and analytically derived the distri-butions for path duration, which turns out to be exponentialas well. The underlying mobility model was not very clearlyspecified. Moreover, the exponential distribution assump-tion was not validated by simulation or real data. Inspiredby these works, in this paper, we examine the detailed statis-tics of link and path duration including PDFs across theRW, RPGM, FW and MH models. We observe that undercertain conditions the path duration PDFs can be approx-imated by exponential distributions for the models used in
our study. We demonstrate the effect of the number of hops,the transmission range and the relative speed of the mobil-ity model on the path duration PDF. Using the case studyof DSR, we propose simple analytical models that relate theaverage path duration and the non-propagating cache hitratio to the performance of reactive protocols (in terms ofthroughput and routing overhead).
3. BACKGROUNDOur approach of evaluating the protocols across mobility
models was inspired by the IMPORTANT framework pro-posed in [17]. This framework made an attempt towards thesystematic evaluation of the impact of mobility on MANETrouting protocols. It defined protocol independent metricslike the average degree of spatial dependence (D̄spatial) andthe average relative speed (R̄S)to capture certain mobilitycharacteristics. One of these characteristics was the extentto which the motion of a node is influenced by nodes inits neighborhood (which is captured by D̄spatial). Anothercharacteristic was the presence of geographic restrictions onmobility. Once these metrics were defined, mobility mod-els that spanned these mobility characteristics were chosen.These models were:
1. Random Waypoint (RW): At every time instant, anode randomly chooses a speed and destination, andmoves towards it. Each node moves independently ofother nodes.
2. Reference Point Group Mobility (RPGM): Nodesmove in either single or multiple groups. The move-ment of a node in a group is strongly influenced by theleader of the group.
3. Freeway (FW): Each node moves in its lane on thefreeway. Its movement is constrained by nodes movingahead of it in the same lane.
4. Manhattan (MH): Nodes move on a grid. As in theFW model, each node is constrained by nodes movingahead of it. However at the cross points of the grid,a node is free to change its direction unlike the FWmodel.
Different mobility patterns following the above mobility mod-els were generated by varying the maximum speed of themobile nodes. The mobility metrics of these mobility pat-terns were evaluated. Using these patterns, simulations wererun in the network simulator (ns-2 [15]) environment withthe CMU Wireless Ad Hoc networking extension to evalu-ate the performance of DSR, AODV and DSDV in termsof throughput and routing overhead. To explain the rela-tionship between the mobility metrics and the protocol per-formance, certain connectivity graph metrics were defined.Some of these metrics were the number of link changes, thepath availability and the average link duration. For theirstudy, the most useful of these graph metrics was the av-erage link duration (L̄D), which could help in relating themobility metrics to the protocol performance metrics. Thestudy observed that, given a communication traffic pattern,the underlying mobility pattern does have a significant im-pact on the performance of routing protocols. Moreover, itconcluded that there is no clear performance based rankingof the protocols across these mobility models.
247

To explain Why mobility affects the protocol performance,[18] proposed the BRICS methodology to systematically de-compose routing protocols into basic mechanisms or “build-ing blocks”. This methodology claimed that the differencein the protocol performance comes from the fact that the ba-sic mechanisms (or “building blocks”) of these protocols aredifferent. For example, DSR and AODV are reactive whileDSDV is proactive. However, although DSR and AODV be-long to the class of reactive protocols, they behave differentlyfor a given mobility model. To understand this differencebetter, BRICS proposed the following possible decomposi-tion of the reactive routing protocols:
Reactive protocols consist of two major phases:
1. Route Setup Phase: In this phase, a route betweenthe source and destination is setup on demand. Thebasic mechanisms (and their parameters) used in thisphase are:
(a) Flooding: It is responsible for distributing thesource’s route request in the network. Its param-eter is the range of flooding, which is specified bythe Time To Live (TTL) field in the IP header.
(b) Caching: Caching is an optimization to reducethe overhead of flooding. If a node has a cachedroute to the destination, it will reply to the source’sroute request. Its parameter is whether aggressivecaching should be used. i.e. should the nodes useall the overheard route replies and should theycache multiple routes to the destination.
2. Route Maintenance Phase: This phase is respon-sible for maintaining the path between the source andthe destination. The basic mechanisms used in thisphase are Error Detection, Error Notification and Er-ror Recovery.
Both DSR and AODV make different choices for the pa-rameters of the “building blocks” mentioned above. Forexample, in the caching “building block”, DSR performsaggressive caching while AODV does not. In the flooding“building block”, before flooding a route request in the net-work, DSR issues a route request with a TTL of 1 (non-propagating route request). On the other hand, AODV per-forms an expanding ring search (with TTL = 1, 3, 5 and7) before initiating the flooding1. As in [18], we definethe non-propagating cache hit ratio as the ratio of theroute requests which are answered by the one hop neighborsto the total number of route requests. [18] observed thatthe “building blocks” are impacted differently by a givenmobility model, depending on their choice for the param-eters. Moreover the performance of the entire protocol isdetermined by the performance of these building blocks.For example, the overhead of the protocol is affected bythe non-propagating cache hit ratio. Higher the ratio, lowerwill be the frequency of route request flooding. Since bothAODV and DSR use different caching strategies, this non-propagating cache hit ratio for the two protocols might bedifferent, which leads to different routing overheads for theseprotocols for a given mobility model.
1Although, the initial design does not specify the expand-ing ring search, the ns-2 implementation of AODV uses theexpanding ring search.
In this paper, we attempt to develop a deeper understand-ing of the impact of mobility on the protocol performance.We take a step further in the analysis of the impact of mo-bility on the connectivity graph. We determine the detailedstatistics (including PDFs) of link and path duration at theconnectivity graph level across the “test-suite” of mobilitymodels proposed by [17]. Our study suggests that for mod-erately high speeds and paths with more than two hops, thepath duration PDF can be approximated as an exponentialdistribution for the mobility models used. The average pathduration and the non-propagating cache hit ratio are relatedto the throughput and routing overhead of reactive proto-cols through simple first order analytical models (that arevalidated by simulation results), using DSR as a case study.
In the next section, we formally define the link and pathduration metrics.
4. CONNECTIVITY GRAPH METRICSOne of the main challenges for routing in MANETs is to
deal with the topology (connectivity graph) changes result-ing from mobility. The performance of a protocol is greatlydetermined by its ability to adapt to these changes. Realiz-ing this, researchers have proposed metrics to characterizethe effect of mobility on the connectivity graph with an aimto explain the effects of mobility on protocol performance.We define the link duration and path duration metrics inthis section.
First, we mention some commonly used symbols in thissection. Let
1. N be the total number of nodes.
2. Dij(t) be the Euclidean distance between nodes i andj at time t.
3. R be the transmission range of the mobile nodes.
The connectivity graph is the graph G = (V, E), such that|V | = N . At time t, a link (i, j) ∈ E iff Dij(t) ≤ R.
Let X(i, j, t) be an indicator random variable which hasa value 1 iff there is a link between nodes i and j at time t.Otherwise, X(i, j, t) = 0.
1. Link Duration: For two nodes i and j, at time t1,duration of the link (i, j) is the length of the longesttime interval [t1,t2] during which the two nodes arewithin the transmission range of each other. Moreoverthese two nodes are not within the transmission rangeat time t1 − ε and time t2 + ε for ε > 0. Formally,
LD(i, j, t1) = t2 − t1
iff ∀t t1 ≤ t ≤ t2, ε > 0 : X(i, j, t) = 1 and X(i, j, t1−ε) = 0 and X(i, j, t2 +ε) = 0. Otherwise, LD(i, j, t1) =0.
2. Path Duration: For a path P = {n1, n2, ...nk}, con-sisting of k nodes , at time t1, path duration is thelength of the longest time interval [t1, t2], during whicheach of the k− 1 links between the nodes exist. More-over, at time t1−ε and time t2+ε, ε > 0, at least one ofthe k links does not exist. Thus, path duration is lim-ited by the duration of the links along its path. Specif-ically, at time t1, path duration is the minimum of the
248

durations of the k−1 links (n1, n2), (n2, n3)...(nk−1, nk)at time t1. Formally,
PD(P, t1) = min1≤z≤k−1
LD(nz, nz+1, t1)
Thus, both link and path durations are a function of time.Link duration has been studied before across the “test-suite”of mobility models in [17]. However, that study was basedon average values. Here, we also examine the PDFs of thelink and path duration across these mobility models. Webelieve that this approach might give a deeper understand-ing of the impact of mobility on the protocol performance.PDFs are estimated using simple statistical analysis of thesimulation data. The simulation settings for estimating thePDFs are discussed in the next section.
5. SIMULATION SETTINGSHaving defined the metrics, as mentioned in 1, we focus
our attention on obtaining the detailed statistics of the linkand path duration across the different mobility models usedin our study. We simulate the node movement according tothe “test-suite” of mobility models proposed in [17]. Foreach mobility model, we collect the detailed statistics of thelink and path duration at the connectivity graph level. Thedetails of the mobility models used are mentioned in section5.1, while the collection of statistical data on link and pathduration from these simulations is mentioned in section 5.2.
5.1 Mobility PatternsThe mobility patterns are obtained from the mobility sce-
nario generator mentioned in [17]. This scenario genera-tor produces the different mobility patterns following theRPGM, FW and MH models according to the format re-quired by ns-2. In all these patterns, 40 mobile nodes movein an area of 1000m x 1000m for a period of 900 seconds. Thevalues for the transmission range will be mentioned in sec-tion 5.2 when the link and path durations are measured. RWmobility pattern is generated using the setdest tool whichis a part of the ns-2 distribution. For RPGM, we use 2 dif-ferent mobility scenarios: single group of 40 nodes and 4groups of 10 nodes each moving independent of each otherand in an overlapping fashion. Both Speed Deviation Ra-tio and Angle Deviation Ratio are set to 0.12. For the FWand MH models, the nodes are placed on the freeway lanesor local streets randomly in both directions initially. Theirmovement is controlled as per the specifications of the re-spective models. The maximum speed Vmax is set to 1, 5, 10,20, 30, 40, 50 and 60 m/sec to generate different movementpatterns for the same mobility model.
Once, the mobility patterns are obtained, we measure thelink and path duration across them. Our procedure for doingthis measurement in described in the next section.
5.2 Measuring Link Durations and Path Du-rations
For the purpose of measuring the link and path durationdistributions, the transmission range R of the mobile nodesis set to 250 m. Then, the link and path durations at the con-nectivity graph level are measured using our trace analyzer
2Speed Deviation Ratio and Angle Deviation Ratio are de-fined in [17]. They control the extent to which the groupmembers can deviate from the leader in speed and direction.
program. Given a mobility trace file, this program analyzesthe link and path durations. This analysis might get compli-cated due to node mobility. A common way to simplify theprocedure is to take a series of “snapshots” of the networkconnectivity graph during the simulations. For each snap-shot, the connectivity graph can be considered static andanalyzed. Our mobility scenarios have a granularity of onesecond i.e. during the time interval [t,t+1], the connectivitygraph does not change. Hence, we take a snapshot of theconnectivity graph once every second. Once the snapshot ofthe network connectivity graph is taken, the link and pathdurations can be readily measured as follows:
1. Link Durations: The status of a link between everypair of nodes within the transmission range of eachother is monitored during the simulation. The linkduration is calculated as the interval between the timewhen the link is created and time when it breaks. Thisis done for every link that comes into existence duringthe simulation. The different link durations are thensorted into bins of 1 sec, 2 sec ... 900 sec (simulationtime).
2. Path Durations: The status of a path between ev-ery source - destination pair in the network is mon-itored. The path duration is counted as the intervalbetween the time when the path is set up and the timewhen the path is broken. However, there can be po-tentially exponential paths between any specific source- destination pair. Analyzing the duration of all thesepaths might not be feasible. As a reasonable approx-imation, we define the path duration as the durationof the shortest path3. The shortest path between thesource and the destination is computed by the BreadthFirst Search(BFS) algorithm [25]. The path durationis measured for all source-destination pairs in the net-work. The different path durations thus obtained arethen sorted into bins of 1 sec, 2 sec ... 900 sec (simu-lation time).PDF estimation: After having sorted the samples oflink and path durations into bins as mentioned above,we plot a histogram of these durations for the mobil-ity scenarios mentioned in section 5.1. For link dura-tions, we plot the histograms for the different mobilitymodels and different maximum velocities Vmax for eachmodel. For path durations, we plot the histograms vis-a-vis the number of hops h in the path for the variousmobility models, various maximum velocities Vmax foreach model. Having collected a large set of samples forlink and path durations, we use the relative frequencyapproach (from standard probability theory) to esti-mate the PDFs of the link and path duration acrossthe different mobility models used in our study [26].Once, the PDFs are determined, we compute the av-erage link duration for the different mobility modelsand different values of Vmax. For computing the aver-age path duration, we also vary the transmission rangeR. The different values of R used are 50, 100, 150, 200and 250 m. We compute the average path duration for
3Thus, in general the one hop path duration is not the sameas the link duration. If a path of more than one hop alreadyexists between the source and the destination before theycome within range of each other, we still monitor the originalshortest path until it breaks.
249

the different mobility models, different values of Vmax,different values of h and different values of R. This de-tailed statistical analysis of the path duration is usedin section 7.
Our observations from these simulations and measurementsare discussed in the following section.
6. OBSERVATIONSThe purpose of examining the detailed statistics of link
and path duration across the “test-suite” of mobility mod-els was to gain a deeper understanding of the impact ofmobility on the protocol performance. We observe that forlow Vmax, some models like FW and RPGM (4 groups) havemulti-modal distributions for both link duration and pathduration. However, for moderate and high values of Vmax,path durations can be approximated as exponential distri-butions for most of the models used in our study. Moreover,we also learn some lessons about the effect of traffic patternon these distributions. We first discuss the link durationPDFs and follow it up with a discussion of the path dura-tion PDFs.
6.1 Link Duration PDFsWhen Vmax is small i.e. 1 or 5 m/sec, the link
duration PDF has a multi-modal distribution for theFW and the RPGM model (with four groups). Forthe rest of the section we will refer to a “peak” as a clusterin the PDF. For example, as shown in figure 1 there is abig peak in the link duration PDF for the FW model (ataround 100 sec) . Through simulation, we identify that thispeak accounts for the links between mobile nodes movingin the opposite directions. There are several small peakscentered at larger values of link duration (for example ataround 250 sec). These peaks account for the links betweenmobile nodes moving in the same direction. The peak onthe left side dominates the PDF i.e. the area under thepeak on the left side is much larger than the area under thepeak on the right side. This is because the links betweennodes traveling in opposite directions are frequently brokenand the number of such instances is larger, compared to thelinks between nodes traveling in the same direction.
A similar phenomenon is also observed for RPGM (with4 groups) at small velocities as shown in figure 2. However,in this case, we observe multiple peaks of almost similar size(for example at around 100 sec, 200 sec, 280 sec and 350 sec).The peak to the left of around 300 sec are slightly larger andare due to the links between the nodes from different groups,and the peaks to the right of 300 sec are due to the linksbetween nodes within the same group. The area under theleft peaks is more due to a larger number of inter-group linksas compared to the intra-group links in our scenarios.
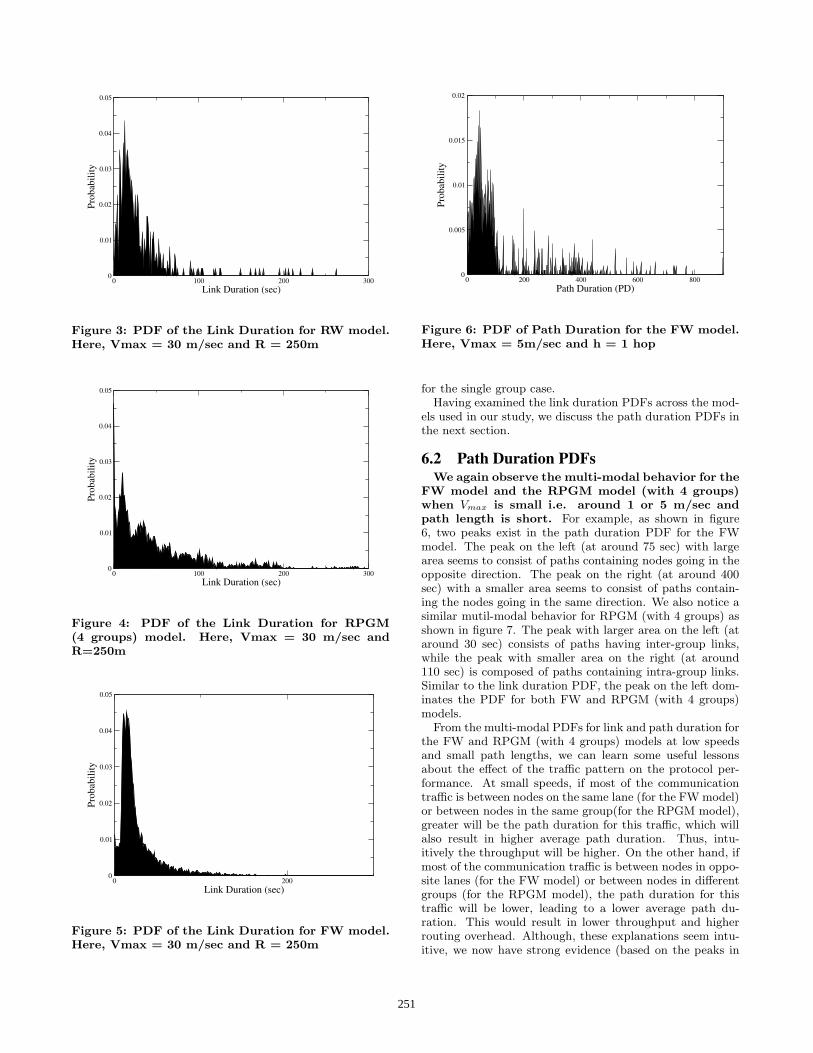
However, the link duration PDFs for the RW, MH, FWand the RPGM (with 4 groups) do not exhibit the multi-modal behavior for Vmax > 10 m/sec. The link durationPDF for the RW model, RPGM (4 groups) and the FWmodel at Vmax = 30 m/sec are shown in figures 3, 4 and 5respectively.
Moreover, for the RPGM (single group) model, it is ob-served that most of the links have a duration of around 900seconds (simulation time) i.e. most of the links last for theentire duration of the simulation. Since it does not conveyany new information, we do not show the link duration PDF
0 100 200 300 400 500Link Duration (sec)
0
0.01
0.02
0.03
0.04
Prob
abili
ty
Figure 1: PDF of the Link Duration for the FWmodel. Here, Vmax = 5 m/s and R = 250 m
0 100 200 300 400 500Link Duration (sec)
0
0.01
0.02
0.03
0.04
0.05
Prob
abili
ty
Figure 2: PDF of the Link Duration for the RPGMmodel with 4 Groups. Here, Vmax = 5 m/s and R= 250 m
250
0 100 200 300Link Duration (sec)
0
0.01
0.02
0.03
0.04
0.05Pr
obab
ility
Figure 3: PDF of the Link Duration for RW model.Here, Vmax = 30 m/sec and R = 250m
0 100 200 300Link Duration (sec)
0
0.01
0.02
0.03
0.04
0.05
Prob
abili
ty
Figure 4: PDF of the Link Duration for RPGM(4 groups) model. Here, Vmax = 30 m/sec andR=250m
0 200Link Duration (sec)
0
0.01
0.02
0.03
0.04
0.05
Prob
abili
ty
Figure 5: PDF of the Link Duration for FW model.Here, Vmax = 30 m/sec and R = 250m
0 200 400 600 800Path Duration (PD)
0
0.005
0.01
0.015
0.02
Prob
abili
ty
Figure 6: PDF of Path Duration for the FW model.Here, Vmax = 5m/sec and h = 1 hop
for the single group case.Having examined the link duration PDFs across the mod-
els used in our study, we discuss the path duration PDFs inthe next section.
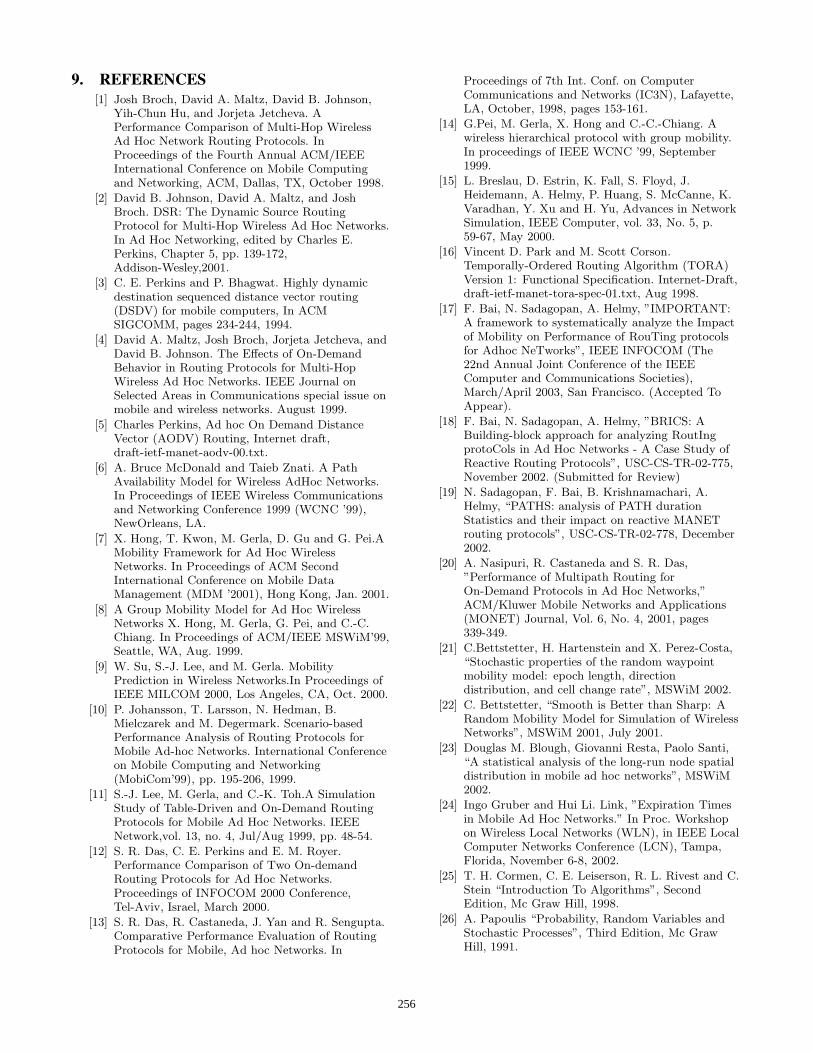
6.2 Path Duration PDFsWe again observe the multi-modal behavior for the
FW model and the RPGM model (with 4 groups)when Vmax is small i.e. around 1 or 5 m/sec andpath length is short. For example, as shown in figure6, two peaks exist in the path duration PDF for the FWmodel. The peak on the left (at around 75 sec) with largearea seems to consist of paths containing nodes going in theopposite direction. The peak on the right (at around 400sec) with a smaller area seems to consist of paths contain-ing the nodes going in the same direction. We also notice asimilar mutil-modal behavior for RPGM (with 4 groups) asshown in figure 7. The peak with larger area on the left (ataround 30 sec) consists of paths having inter-group links,while the peak with smaller area on the right (at around110 sec) is composed of paths containing intra-group links.Similar to the link duration PDF, the peak on the left dom-inates the PDF for both FW and RPGM (with 4 groups)models.
From the multi-modal PDFs for link and path duration forthe FW and RPGM (with 4 groups) models at low speedsand small path lengths, we can learn some useful lessonsabout the effect of the traffic pattern on the protocol per-formance. At small speeds, if most of the communicationtraffic is between nodes on the same lane (for the FW model)or between nodes in the same group(for the RPGM model),greater will be the path duration for this traffic, which willalso result in higher average path duration. Thus, intu-itively the throughput will be higher. On the other hand, ifmost of the communication traffic is between nodes in oppo-site lanes (for the FW model) or between nodes in differentgroups (for the RPGM model), the path duration for thistraffic will be lower, leading to a lower average path du-ration. This would result in lower throughput and higherrouting overhead. Although, these explanations seem intu-itive, we now have strong evidence (based on the peaks in
251

0 100 200 300 400 500Path Duration (PD)
0
0.01
0.02
0.03
0.04
0.05
0.06Pr
obab
ility
Figure 7: PDF of Path Duration for the RPGMmodel with 4 Groups. Here, Vmax = 5 m/sec andh = 2 hops
0 200Path Duration (PD)
0
0.05
0.1
0.15
0.2
Prob
abili
ty
Figure 8: PDF of Path Duration for RW model.Here, h = 2 hops, Vmax = 30 m/sec and R = 250m
the path duration PDF) to back these intuitions.The path duration PDF for the RW, FW, MH and RPGM
models seems to be exponentially distributed when Vmax ≥10 m/sec and h ≥ 2. Figures 8, 10 and 9 show the pathduration PDFs for the RW, FW and RPGM (with 4 groups)
Thus, from our simulations, we observe that ifVmax ≥ 10 m/sec and h ≥ 2, then the path durationfor the RW, MH, FW and RPGM can be approxi-mated as an exponential distribution. In section 7, wedevelop a simple analytical model to characterize the pathduration PDF across these mobility models. We then relatethe average path duration and the non-propagating cachehit ratio to the performance of reactive protocols by usingthe case study of DSR.
7. ANALYSISIn this section, we demonstrate the utility of studying the
link and path duration PDFs estimated statistically acrossthe different mobility models used in our study. This is
0 40 80 120Path Duration (PD)
0
0.05
0.1
0.15
0.2
0.25
Prob
abili
ty
Figure 9: PDF of Path Duration for the RPGMmodel with 4 groups. Here, h = 4 hops, Vmax = 30m/sec and R = 250m
0 20 40 60Path Duration (PD)
0
0.1
0.2
0.3
0.4
0.5
Prob
abili
ty
Figure 10: PDF of Path Duration for the FW model.Here, h = 4 hops, Vmax = 30 m/sec and R = 250m
252

done by first proposing an analytical model for path dura-tion PDF in section 7.1, which is validated by our simu-lations done in section 5. The average path duration andthe non-propogating cache hit ratio are related to protocolthroughput and overhead in section 7.2. The analysis in thissection can be used for those mobility scenarios where ourapproximation of the link and path duration PDFs as ex-ponential distributions is valid (as mentioned at the end ofsection 6.2).
We also assume that the transmission range R is fixed.In general, R is a function of a several parameters includ-ing channel characteristics, physical layer capabilities likepower control and ability to capture, smart antennas and soon. These factors would affect the connectivity graph con-siderably. Howeover, in this section, we attempt to developa simple intuitive first order model for the path durationPDF. Moreover, this model is validated by simulations inns-2. In these simulations, the transmission range of thenodes is fixed (they do not use power control, smart anten-nas, etc). Moreover, these simulations do capture some ofthe channel and MAC effects.
7.1 Analytical model for path duration PDFFor our study, we assume that the path duration for the
mobility models is exponentially distributed. However, thisassumption is valid only under the conditions mentioned atthe end of section 6.2. Now, we try to characterize thisdistribution for each mobility model i.e. develop a modelfor the parameter λpath of this distribution. However, intu-itively, λpath has the following properties:
1. Greater the number of hops h in the path, the morelikely a path is to break, thus the average path dura-tion decreases (i.e. λpath increases). Hence, λpath ∝ h.
2. As the average relative speed V increases, link dura-tion decreases and hence the average path durationdecreases (i.e. λpath increases). Hence, λpath ∝ V .
3. As the transmission range R increases, link durationincreases, the average path duration increases (i.e λpath
decreases). Hence, λpath ∝ 1R
.
Thus,
λpath = λ0hV
R(1)
where λ0 is the constant of proportionality. This constantfactor is determined by the map layout, node density andother detailed parameters of mobility scenarios. This con-stant is independent of V , h and R.
The above model for λpath is verified by our simulationsin section 5. Figures 12, 13 and 14 show that the averagepath duration estimated from the statistical analysis in sec-tion 5.2 varies effect inversely as h, inversely as Vmax anddirectly as R. In our analytical model, the average pathduration is 1
λpath, since the path duration is assumed to be
exponentially distributed with parameter λpath. In figure12, the curves for RPGM (4 groups) and FW appear to betruncated. This is because in our scenarios, the longest pathfor these models has 6 and 5 hops respectively, while the RWmodel has a longest path of 8 hops. Moreover, although weshow the effect of Vmax on the average path duration, theaverage relative speed and Vmax are almost linearly relatedacross all mobility models [17]. Hence, the relative speed
0 10 20 30 40 50 60Maximum Speed (m/sec)
0
10
20
30
40
50
Ave
rage
Rel
ativ
e Sp
eed
(m/s
ec)
Random WaypointRPGM (Single Group)RPGM (4 Groups)FreewayManhattan
Figure 11: Average Relative Speed
2 4 6 8Number of Hops
1
10
100
Ave
rage
Pat
h D
urat
ion(
sec)
FreewayRPGM(4 groups)Random Waypoint
Figure 12: Effect of h on the average path dura-tion for Vmax = 30 m/sec and R = 250m (inverserelationship)
will have a similar effect on the average path duration. Thevariation of average relative speed with Vmax is shown infigure 11.
Thus, the Probability Density Function (PDF) of the pathduration across most of the mobility models used in ourstudy can be approximated as an exponential distribution4:
f(x) =λ0hV
Re
−λ0hVR
x (2)
The Cumulative Density Function (CDF) of the path du-ration across the mobility models used in our study can beapproximated as follows:
F (x) = 1 − e−λ0hV
Rx (3)
In the next section, we show the utility of average path
4We conducted the Kolmogorov Smirnov test on thesePDFs. The D-statistic for the PDFs shown in figures 8, 9and 10 is 0.13, 0.17 and 0.19 respectively, which shows thatthe exponential distribution is a reasonable approximationfor the path duration PDF [26].
253

0 10 20 30 40 50 60Maximum Velocity (m/sec)
1
10
100
1000
Ave
rage
Pat
h D
urat
ion
(sec
)
FreewayRPGM(4 group)Random Waypoint
Figure 13: Effect of Vmax on the average path dura-tion for h = 2 and R = 250m (inverse relationship)
50 100 150 200 250Transmission Range (m)
0
5
10
15
20
Ave
rage
Pat
h D
urat
ion
(sec
)
FreewayRandom WaypointRPGM(4 groups)
Figure 14: Effect of R on the average path durationfor h = 2 and Vmax = 30 m/sec (linear relationship)
duration by relating it to general trends in the performanceof reactive MANET protocols.
7.2 Relating the average path duration to per-formance of reactive protocols
As mentioned in section 1, one of the objectives of ourstudy is to find whether the protocol performance is weakly(or strongly) linearly (or non linearly) related to the pathduration. In this section, we give a simple first order modelthat shows that the throughput and overhead are in a stronglinear relationship with the reciprocal of the average pathduration. We again use the case study of DSR.
Before we derive the analytical model to study the rela-tionship between path duration and protocol performancein terms of throughput and routing overhead, we first definethe commonly used variables in this section. Let
1. N be the total number of nodes.
2. T be the total simulation time.
3. Tflow be the time during which actual data transferplace at maximum rate.
4. trepair be the time spent to repair a broken path eachtime.
5. Trepair be the total time spent in repairing brokenpaths during the time T.
6. PD is the average path duration.
7. f is the frequency of path breaks, f = 1PD
.
8. D is total data transferred during simulation.
9. r is the data rate, which is assumed to be constant 5
Now, we propose a simple first order model relating thepath duration with throughput and routing overhead respec-tively. We derive the following models based on DSR, butwe believe these models can be applied to other reactiveprotocol like AODV with appropriate modifications.
Throughput:The throughput analysis is done as follows:For each source-destination pair, the time T is composed
of two parts: the time used to transfer data and the timeused to repair the broken path. Thus,
T = Tflow + Trepair
= Tflow + trepairfT (4)
Since PD = 1f, then
Tflow = (1 − trepair
PD)T
T =Tflow
1 − trepair
PD
(5)
5In genereal, the data rate might depend on MAC effects,channel characteristics, etc. However, the effect of thesefactors on protocol performance is beyond the scope of thiswork as we are mainly interested in the effect of mobility onprotocol performance. However, as mentioned earlier, oursimulations do capture some of these effects.
254

Now,
Throughput =D
T
=D
Tflow
1− trepairP D
= (1 − trepair
PD)
D
Tflow
= (1 − trepair
PD)r (6)
Overhead:The overhead analysis is done as follows:
TPD
gives the number of route requests issued by DSR intime T. A fraction p (the non propagating cache hit ratio)of these requests is replied by the first hop neighbors andthus needs only one route request transmission6. For theremaining fraction (1− p), flooding of the route request willhave to be done leading to N transmissions of the request. Ingeneral, the overhead of DSR (in terms of number of routerequest packets sent) can be given as follows:
Overhead =T
PD((p)1 + (1 − p)N) (7)
From equations 6 and 7, we make an interesting observa-tion: There exists a linear relationship between thereciprocal of the average path duration and the per-formance in terms of both throughput and routingoverhead. The correlation is positive between the recip-rocal of average path duration and overhead while the cor-relation is negative between the reciprocal of average pathduration and throughput. Intuitively, higher path durationresults in a higher throughput and lower overhead.
In order to validate the above models, we measure thePearson coefficient of correlation between reciprocal of theaverage path duration and throughput we recorded in the ex-periments, we find that the coefficient between DSR through-put and the reciprocal of path duration for the same set ofmobility patterns is -0.9165, -0.9597 and -0.9132 for RW,FW and MH mobility models respectively. Similarly, wealso find that the coefficient between DSR overhead and thereciprocal of the path duration for the same set of mobil-ity patterns is 0.9753, 0.9812 and 0.9978 for RW, FW andMH mobility models respectively. The above facts indicatea strong correlation between the reciprocal of path durationand DSR routing performance protocol. Thus, the two sim-ple analytical models (which DO NOT capture MAC andphysical layer effects) we propose are consistent with ourexperimental results (which DO capture MAC and physicallayer effects). For the RPGM model, such a strong corre-lation between the average path duration and protocol per-formance does not seem to exist. One plausible reason isthat number of path changes is relatively small in RPGMmodel and thus the accuracy of estimation is affected. Oursimulations for DSR were run in the ns-2 environment. Thetraffic consisted of 20 Constant Bit Rate (CBR) sources and30 connections. The source destination pairs were chosenat random. The data rate used was 4 packets/sec and the
6Under reasonable assumptions, it can be shown that p isindependent of the relative velocity of the mobility model.For an simple analytical model, refer [19]
packet size was 64 bytes. The mobility patterns generatedin section 5.1 were used for these simulations.
Although the simple analytical models are derived basedon DSR, we believe a similar approach can be extended toother reactive routing protocols such as AODV with appro-priate modifications. For example, for AODV, we wouldhave to take into account the cache hit probability at 1, 3,5 and 7 hops rather than just at 1 hop.
In this section, we gave simple first order models relatingthe average path duration to the throughput and overheadof reactive protocols. However, from section 7.1, for oursimulations, we observed that the average path duration isdirectly proportional to the transmission range R and in-versely proportional to the number of hops h and averagerelative speed V . Thus, our first order models also relatethe protocol throughput and overhead to several factors in-cluding the transmission range, the average number of hopsin the path, the relative speed of the mobility model used.Thus, this entire approach has given us a greater under-standing of the impact of mobility and other factors on pro-tocol performance.
8. CONCLUSIONS & FUTURE WORKWe proposed an approach for a deeper understanding of
the effect of mobility on MANET routing protocols. Tobegin with, this approach examined the detailed statistics(including PDFs) of link and path duration across a rich setof mobility models. For small velocities, these PDFs wereobserved to have a multi-modal distribution across some ofthe models used. This observation showed the impact of thetraffic pattern on the path duration PDF. For moderate andhigh velocities, across the mobility models used in our study,it was observed that the path duration PDFs for paths oftwo or more hops can be approximated by an exponentialdistribution which is parameterized by the relative speed ofthe mobility model, the transmission range of the node andthe number of hops in the path. We also proposed simpleanalytical models that show that the reciprocal of the aver-age path duration is strongly correlated with the throughputand overhead of reactive routing protocols. Simulations forDSR seemed to confirm this relationship.
Thus, path duration seemed to be a good metric to pre-dict the general trends in the performance of reactive routingprotocols. At the same time, our analytical models showedthe relationship between the path duration and other param-eters like the average relative speed of the mobility model,the transmission range of the mobile nodes and the averagenumber of hops in the path. These findings enabled us torelate the several parameters including mobility to the per-formance of reactive protocols using the detailed statisticsof path duration.
As part of future work, one of our immediate goals wouldbe to develop an analytical model for the non-propagatingcache hit ratio for the mobility models used in our study. Itwould also be interesting to see how this ratio is affected bythe communicating traffic pattern. As a longer-term goal,we seek to use richer analytical models to predict the per-formance trends of the reactive MANET routing protocolslike DSR and AODV. We believe that by analyzing the ba-sic mechanisms of these protocols, we can develop a com-prehensive model for the “whole” protocol. Moreover, thisanalysis can be readily applied to other protocols that usesimilar mechanisms.
255
9. REFERENCES[1] Josh Broch, David A. Maltz, David B. Johnson,
Yih-Chun Hu, and Jorjeta Jetcheva. APerformance Comparison of Multi-Hop WirelessAd Hoc Network Routing Protocols. InProceedings of the Fourth Annual ACM/IEEEInternational Conference on Mobile Computingand Networking, ACM, Dallas, TX, October 1998.
[2] David B. Johnson, David A. Maltz, and JoshBroch. DSR: The Dynamic Source RoutingProtocol for Multi-Hop Wireless Ad Hoc Networks.In Ad Hoc Networking, edited by Charles E.Perkins, Chapter 5, pp. 139-172,Addison-Wesley,2001.
[3] C. E. Perkins and P. Bhagwat. Highly dynamicdestination sequenced distance vector routing(DSDV) for mobile computers, In ACMSIGCOMM, pages 234-244, 1994.
[4] David A. Maltz, Josh Broch, Jorjeta Jetcheva, andDavid B. Johnson. The Effects of On-DemandBehavior in Routing Protocols for Multi-HopWireless Ad Hoc Networks. IEEE Journal onSelected Areas in Communications special issue onmobile and wireless networks. August 1999.
[5] Charles Perkins, Ad hoc On Demand DistanceVector (AODV) Routing, Internet draft,draft-ietf-manet-aodv-00.txt.
[6] A. Bruce McDonald and Taieb Znati. A PathAvailability Model for Wireless AdHoc Networks.In Proceedings of IEEE Wireless Communicationsand Networking Conference 1999 (WCNC ’99),NewOrleans, LA.
[7] X. Hong, T. Kwon, M. Gerla, D. Gu and G. Pei.AMobility Framework for Ad Hoc WirelessNetworks. In Proceedings of ACM SecondInternational Conference on Mobile DataManagement (MDM ’2001), Hong Kong, Jan. 2001.
[8] A Group Mobility Model for Ad Hoc WirelessNetworks X. Hong, M. Gerla, G. Pei, and C.-C.Chiang. In Proceedings of ACM/IEEE MSWiM’99,Seattle, WA, Aug. 1999.
[9] W. Su, S.-J. Lee, and M. Gerla. MobilityPrediction in Wireless Networks.In Proceedings ofIEEE MILCOM 2000, Los Angeles, CA, Oct. 2000.
[10] P. Johansson, T. Larsson, N. Hedman, B.Mielczarek and M. Degermark. Scenario-basedPerformance Analysis of Routing Protocols forMobile Ad-hoc Networks. International Conferenceon Mobile Computing and Networking(MobiCom’99), pp. 195-206, 1999.
[11] S.-J. Lee, M. Gerla, and C.-K. Toh.A SimulationStudy of Table-Driven and On-Demand RoutingProtocols for Mobile Ad Hoc Networks. IEEENetwork,vol. 13, no. 4, Jul/Aug 1999, pp. 48-54.
[12] S. R. Das, C. E. Perkins and E. M. Royer.Performance Comparison of Two On-demandRouting Protocols for Ad Hoc Networks.Proceedings of INFOCOM 2000 Conference,Tel-Aviv, Israel, March 2000.
[13] S. R. Das, R. Castaneda, J. Yan and R. Sengupta.Comparative Performance Evaluation of RoutingProtocols for Mobile, Ad hoc Networks. In
Proceedings of 7th Int. Conf. on ComputerCommunications and Networks (IC3N), Lafayette,LA, October, 1998, pages 153-161.
[14] G.Pei, M. Gerla, X. Hong and C.-C.-Chiang. Awireless hierarchical protocol with group mobility.In proceedings of IEEE WCNC ’99, September1999.
[15] L. Breslau, D. Estrin, K. Fall, S. Floyd, J.Heidemann, A. Helmy, P. Huang, S. McCanne, K.Varadhan, Y. Xu and H. Yu, Advances in NetworkSimulation, IEEE Computer, vol. 33, No. 5, p.59-67, May 2000.
[16] Vincent D. Park and M. Scott Corson.Temporally-Ordered Routing Algorithm (TORA)Version 1: Functional Specification. Internet-Draft,draft-ietf-manet-tora-spec-01.txt, Aug 1998.
[17] F. Bai, N. Sadagopan, A. Helmy, ”IMPORTANT:A framework to systematically analyze the Impactof Mobility on Performance of RouTing protocolsfor Adhoc NeTworks”, IEEE INFOCOM (The22nd Annual Joint Conference of the IEEEComputer and Communications Societies),March/April 2003, San Francisco. (Accepted ToAppear).
[18] F. Bai, N. Sadagopan, A. Helmy, ”BRICS: ABuilding-block approach for analyzing RoutIngprotoCols in Ad Hoc Networks - A Case Study ofReactive Routing Protocols”, USC-CS-TR-02-775,November 2002. (Submitted for Review)
[19] N. Sadagopan, F. Bai, B. Krishnamachari, A.Helmy, “PATHS: analysis of PATH durationStatistics and their impact on reactive MANETrouting protocols”, USC-CS-TR-02-778, December2002.
[20] A. Nasipuri, R. Castaneda and S. R. Das,”Performance of Multipath Routing forOn-Demand Protocols in Ad Hoc Networks,”ACM/Kluwer Mobile Networks and Applications(MONET) Journal, Vol. 6, No. 4, 2001, pages339-349.
[21] C.Bettstetter, H. Hartenstein and X. Perez-Costa,“Stochastic properties of the random waypointmobility model: epoch length, directiondistribution, and cell change rate”, MSWiM 2002.
[22] C. Bettstetter, “Smooth is Better than Sharp: ARandom Mobility Model for Simulation of WirelessNetworks”, MSWiM 2001, July 2001.
[23] Douglas M. Blough, Giovanni Resta, Paolo Santi,“A statistical analysis of the long-run node spatialdistribution in mobile ad hoc networks”, MSWiM2002.
[24] Ingo Gruber and Hui Li. Link, ”Expiration Timesin Mobile Ad Hoc Networks.” In Proc. Workshopon Wireless Local Networks (WLN), in IEEE LocalComputer Networks Conference (LCN), Tampa,Florida, November 6-8, 2002.
[25] T. H. Cormen, C. E. Leiserson, R. L. Rivest and C.Stein “Introduction To Algorithms”, SecondEdition, Mc Graw Hill, 1998.
[26] A. Papoulis “Probability, Random Variables andStochastic Processes”, Third Edition, Mc GrawHill, 1991.
256