
Determinants of unemployment duration in Ukraine
20
Journal of Comparative Economics 34 (2006) 228–247 www.elsevier.com/locate/jce Determinants of unemployment duration in Ukraine Olga Kupets a,b a Labor Group, Economics Research and Outreach Center, National University “Kyiv-Mohyla Academy”, Voloshskaya Street, bld. 10, office 214, 04070 Kiev, Ukraine b IZA, Bonn, Germany Received 2 February 2006 Available online 29 March 2006 Kupets, Olga—Determinants of unemployment duration in Ukraine There are few studies of unemployment duration in transition economies, including members of the CIS. This paper presents the first evidence of the determinants of unemployment duration in Ukraine. We examine the effects of various individual characteristics and local demand conditions on the hazards to employment or inactivity using multiple unemployment spell data from the Ukrainian Longitudinal Mon- itoring Survey (ULMS) for the years 1998–2002 and estimating the Cox proportional hazards model with two competing risks. The main estimated results are generally similar to those obtained in developed and other transition countries. The individual’s age, marital status, level of education, income while unemployed (including income from casual work activities and subsistence farming), and local demand constraints are significantly related to the total time in unemployment. The estimates of the baseline hazard to employment suggest marked negative duration dependence after 14 months in unemployment. Journal of Comparative Economics 34 (2) (2006) 228–247. Labor Group, Economics Research and Outreach Center, National Uni- versity “Kyiv-Mohyla Academy”, Voloshskaya Street, bld. 10, office 214, 04070 Kiev, Ukraine; IZA, Bonn, Germany. © 2006 Association for Comparative Economic Studies. Published by Elsevier Inc. All rights reserved. JEL classification: J64; J68 Keywords: Duration analysis; Unemployment benefits; Labor markets in transition; Ukraine E-mail address: [email protected]. 0147-5967/$ – see front matter © 2006 Association for Comparative Economic Studies. Published by Elsevier Inc. All rights reserved. doi:10.1016/j.jce.2006.02.006
-
Upload
independent -
Category
Documents
-
view
4 -
download
0
Transcript of Determinants of unemployment duration in Ukraine

Journal of Comparative Economics 34 (2006) 228–247
www.elsevier.com/locate/jce
Determinants of unemployment duration in Ukraine
Olga Kupets a,b
a Labor Group, Economics Research and Outreach Center, National University “Kyiv-Mohyla Academy”,Voloshskaya Street, bld. 10, office 214, 04070 Kiev, Ukraine
b IZA, Bonn, Germany
Received 2 February 2006
Available online 29 March 2006
Kupets, Olga—Determinants of unemployment duration in Ukraine
There are few studies of unemployment duration in transition economies, including members of theCIS. This paper presents the first evidence of the determinants of unemployment duration in Ukraine. Weexamine the effects of various individual characteristics and local demand conditions on the hazards toemployment or inactivity using multiple unemployment spell data from the Ukrainian Longitudinal Mon-itoring Survey (ULMS) for the years 1998–2002 and estimating the Cox proportional hazards model withtwo competing risks. The main estimated results are generally similar to those obtained in developed andother transition countries. The individual’s age, marital status, level of education, income while unemployed(including income from casual work activities and subsistence farming), and local demand constraints aresignificantly related to the total time in unemployment. The estimates of the baseline hazard to employmentsuggest marked negative duration dependence after 14 months in unemployment. Journal of ComparativeEconomics 34 (2) (2006) 228–247. Labor Group, Economics Research and Outreach Center, National Uni-versity “Kyiv-Mohyla Academy”, Voloshskaya Street, bld. 10, office 214, 04070 Kiev, Ukraine; IZA, Bonn,Germany.© 2006 Association for Comparative Economic Studies. Published by Elsevier Inc. All rights reserved.
JEL classification: J64; J68
Keywords: Duration analysis; Unemployment benefits; Labor markets in transition; Ukraine
E-mail address: [email protected].
0147-5967/$ – see front matter © 2006 Association for Comparative Economic Studies. Published by Elsevier Inc. Allrights reserved.doi:10.1016/j.jce.2006.02.006

O. Kupets / Journal of Comparative Economics 34 (2006) 228–247 229
1. Introduction
Ukraine is one of the transition countries that have been lagging behind in reforms in viewof considerable adjustment costs and social unrest usually associated with radical reforms. How-ever, delay in reforms created an environment of rent-seeking, state capture, and freezing oftransition (Havrylyshyn, 2005). Prolonged recession coupled with postponed enterprise restruc-turing has brought about a sclerotic labor market in which losing a job might be relatively rare,but once lost, finding a new job has been increasingly difficult. The weak demand for workersand competition with those still employed but looking for another job have combined to make itdifficult for the displaced workers and new entrants to find jobs. The immediate result has beena build-up of a stagnant pool of unemployment and a surge of long-term unemployment at thelevels similar to those of the less dynamic OECD countries. In 2003, for example, the fractionof the unemployed who have been looking for a job for more than a year (the measure of theincidence of long-term unemployment) amounted to 50.3% in Ukraine and to 42.3% on averagein the OECD European countries (see Table 1 for Ukraine).
Despite the extensive literature that examines the causes and consequences of long-term un-employment in developed economies (e.g. Machin and Manning, 1999; OECD, 1993, 2002), thedeterminants of exits from unemployment and the impact of unemployment benefits on unem-ployment dynamics in these countries (Devine and Kiefer, 1991; Atkinson and Micklewright,1991), relatively little has been written about unemployment duration and its determinants intransition countries with lagged reforms. Although there are many potential reasons for the emer-gence of long-term unemployment including demand and supply shocks, institutional featuresand outside labor markets, the Western literature focuses primarily on various characteristics oflabor market institutions as the main factor behind long-term unemployment in Europe. Theseinclude strict employment protection legislation, powerful trade unions, wide use of permanentcontracts, generous unemployment and welfare benefits, high labor taxes and minimum wages.
However, the functioning of the labor market in a transition economy is less likely to be drivenby the same institutional factors as in developed countries. According to Ham et al. (1998),the level of unemployment compensation has a moderate negative effect on the duration of un-employment in the Czech and Slovak republics, compared with the corresponding estimates inwestern countries, while the principal factors underlying the differences in exit rates from unem-ployment include growth rate of the new service sector, speed of privatization and restructuring,amount of foreign direct investment, enforcement of labor legislation, and alternatives for theworking-age population. A similar argument can be used to explain differences between Rus-sia and Ukraine in terms of unemployment dynamics and long-term unemployment. Brown andEarle (2006) show that increases in job reallocation and in the productivity-enhancing conse-quences of the labor reallocation process appear to have been somewhat slower in Ukraine thanin Russia. They conclude that a more aggressive reform strategy implemented in Russia has pro-duced greater job reallocation, faster job creation, and less net employment decline. This, in turn,has resulted in higher intensity of flows into and out of unemployment and shorter unemploymentduration.
Therefore, low outflows from unemployment and long unemployment spells in many tran-sition countries could be blamed on unsuccessful transition reforms leading to insufficient jobcreation and job reallocation rather than on labor market rigidities and generous unemploymentcompensation. On the other hand, we should not forget that supply-side determinants can bealso important in a transition context (Boeri, 2001). Some categories of the unemployed withunattractive work-related characteristics may encounter much greater difficulty in finding regu-

230 O. Kupets / Journal of Comparative Economics 34 (2006) 228–247
lar jobs than their more competitive counterparts. Also, depreciation of human capital, erosion ofwork habits, discouragement, loss of motivation, and other consequences of long-lasting spellsof joblessness (so-called duration dependence effect) may result in ever-declining chances ofreemployment (Machin and Manning, 1999).
In this paper, we examine the factors which may affect the probability of reemployment orwithdrawing from the labor force after the period of unemployment in Ukraine. The only studydirectly related to our research has been done by Stetsenko (2003). The author examines thedeterminants of duration of the registered unemployment in Kiev using the registered data fromthe city employment center over 2001–2003 and employing the Cox proportional hazards andthe piece-wise constant exponential models. The author finds significant positive effect for thelevel of unemployment benefits on the duration of registered unemployment. The other find-ings are that younger workers and males are more likely to leave the register to both competingdestinations (to job and for other reasons out of the register); that married females tend to havesignificantly lower probability of transition to employment; that individuals with less than generalsecondary education have higher probability of transition to employment relative to individualswith higher level of education; that having profession increases chances to get a job; and thatunobserved heterogeneity is insignificant.
Our paper makes several contributions. It provides evidence on the duration and demo-graphic structure of general unemployment (not only registered unemployment) in Ukraine. Weuse individual-level data from the first wave of the Ukrainian Longitudinal Monitoring Survey(ULMS), a nationally representative survey of individuals aged from 15 to 72. Therefore, ourresults refer to Ukraine as a whole and not only to its capital city, which is often consideredan outlier in terms of the labor market conditions. We use the sample of unemployment spellsthat started between January 1998 and December 2002. Thus, we analyze distribution of un-employment spells over the period which covers the years before and after 2000—the year ofeconomic reversal in Ukraine—as well as the years before and after the 2001 reform of the un-employment benefit system into unemployment insurance system. Finally, we test our hypothesisabout the disincentive effect of income from casual activities and subsistence farming during anon-employment period and the negligible effect of unemployment benefits with respect to ex-its to employment together with some basic hypotheses suggested by a job search model.1 Theissue of casual work activities and subsistence farming is very important in a transition econ-omy like Ukraine given the high share of individuals involved in various informal activities andweak monitoring capacity. Although occurrence of casual work activities during unemploymentis potentially endogenous, the estimated effect on the conditional probability of exit from unem-ployment may inform policymakers about important policy direction.
Our findings confirm broadly the results of studies for developed and transition countries.Married, younger and educated individuals living in large cities are more likely to leave unem-ployment to employment. The higher the regional unemployment rate is at the start of unem-ployment the lower the probability of reemployment (controlling for oblast and calendar timedummies). Those who have alternative sources of subsistence during unemployment includingincome from casual work activities or subsistence farming, household income, or pensions tendto stay in unemployment before exiting to a job significantly longer. The effect of unemploymentbenefits with respect to exits to a regular job is found to be insignificant in the total sample ofunemployed (i.e. with and without income from casual activities or subsistence farming), while
1 Discussion of the definition of unemployment adopted in our study is offered in Section 4 on Data.

O. Kupets / Journal of Comparative Economics 34 (2006) 228–247 231
it is significant and negative in the subsample of “standard” unemployed without any incomefrom casual work or farming activities. The baseline employment hazard is non-monotonic: itincreases with duration of unemployment during the first 14 months and decreases afterwards.Analysis of the determinants of unemployment duration before withdrawing from the labor forcesuggests that individuals over the age of 55, those who rely on household income, previouslyeconomically inactive persons, and the residents of rural area or large cities are more likely toleave unemployment for inactivity.
The paper is set up as follows. Section 2 provides an overview of the unemployment insurancesystem and the Public Employment Service in Ukraine and the consequences of their failure toprovide real assistance to the unemployed. Section 3 presents the econometric model used inthe analysis. Section 4 provides the details of the data and variables used. Section 5 offers theestimation results and Section 6 concludes the paper.
2. Challenge for an unemployed person in Ukraine: unemployment insurance oralternative sources of subsistence?
The Public Employment Service (PES) and the unemployment compensation system wereestablished in Ukraine according to the Law on Employment in March 1991. The unemploymentcompensation system was relatively liberal in terms of eligibility, entitlement and replacementratio until the new Law on Compulsory State Social Unemployment Insurance went into effectin 2001. In general, the PES is supposed to perform two major functions: to assist unemployedworkers in their job search and to provide income support during a period of unemployment.However, it is widely believed that it is not very successful at either of these tasks in Ukraine.
First, although firms are obliged to register all vacancies with the local employment centerand to use the center during recruitment, many firms fail to do so, preferring other recruitmentmethods. Also, the PES sometimes provides training or retraining for skills that are already insurplus in the local labor markets, and public works are usually of low skill level (Kupets, 2000).As a result, the probability of finding a good job with the help of the public employment centeris likely to be small, while the transaction costs of registration and staying on the register maybe relatively high. One such transaction cost of staying on the register is a necessary visit of theunemployed to the local employment center located in the administrative center of his/her civilregistration (new name of the old system of propiska) at least once a month. Since many peoplelive far from administrative centers of their registration, the above requirement demands heavyexpenses in terms of time and money in some cases.
Second, the level of unemployment benefits is too low both in nominal and real terms. Theratio of the average unemployment benefit to the official average wage in the economy is about25–28%, while its ratio to the nationally established level of minimum wage fluctuates between50 and 70% (Table 1).
Moreover, because of the strict unemployment benefit eligibility criteria and high incidence oflong-term unemployment, the coverage ratio (the ratio of those receiving unemployment benefitsor unemployment assistance to the total number of registered unemployed) has been less than70% for all years. Although with respect to incentives/disincentives to work the unemploymentinsurance system in Ukraine may seem better than in CEE countries, it is certainly worse in termsof income support and poverty prevention.
A study of the sources of subsistence during the period of unemployment confirms this state-ment. Only 4.6% of our sample of the unemployed reported that unemployment benefits were

232 O. Kupets / Journal of Comparative Economics 34 (2006) 228–247
Table 1Unemployment dynamics and unemployment benefits in Ukraine
1998 1999 2000 2001 2002 2003
Registered unemploymentRegistered unemployment rate, % of working-age able-bodied population
3.69 4.3 4.22 3.68 3.80 3.6
Fraction of registered unemployed receivingunemployment benefits, %
53.1 52.8 54.3 62 66.7 69.1
ILO-defined unemploymentUnemployment rate according to LFS, % of la-bor force aged from 15 to 70
11.3 11.9 11.7 11.1 10.1 9.1
Incidence of long-term unemployment (frac-tion of the unemployed who have been lookingfor job for more than 1 year), %
37 46.3 50.5 54.8 53.5 50.3
UBRatio of average UB to minimum wage, % 70 67.3 50.3 72.2 64.2 57.7Ratio of average UB to average wage, % 25.1 28 25.8 27.4 28.1 25.6
Note: Registered unemployment characteristics correspond to the end of years, while characteristics according to theLabor Force Survey (LFS) are presented for the fourth quarter in 1998 (yearly survey) and on average for 1999–2003(quarterly surveys).Source: Derzhkomstat.
the main source of their support.2 The dominant role in support of jobless is played by householdincome, i.e. income of parents, spouses or other relatives (68.3%). Income from various casualactivities or subsistence farming constitutes the second largest group among the main sourcesof subsistence (13.9%). It may serve as the only source of subsistence or operate in conjunctionwith household income, unemployment benefits, pensions, state transfers, or savings. Markedly,only 27.5% of those who receive unemployment benefits, along with other sources of subsis-tence, consider it to be their primary source of income during the period of unemployment. Mostof them rely on household income.
As a consequence of ineffective public employment policy and the unemployment insurancesystem, less than half of the actual unemployed (defined according to the ILO unemploymentcriteria) bother to register as unemployed in the public employment centers. An analysis of jobsearch methods among the unemployed in our sample indicates that people rely on the help offriends and relatives (29.2%), direct contacts with employers (16.4%), job advertisements in thenewspapers or Internet (37.6%) rather than on the assistance of the public employment service(10.8%).
Following from the above argument, it is unlikely that the unemployment insurance system isbehind the low outflows from general unemployment (as opposed to registered unemployment)in Ukraine, given how low the benefits are and how few unemployed register to receive them.3
However, another inference based on the weak enforcement of legislation and high payroll taxescould have more explanatory power. Because of very low unemployment benefits accompanied
2 Information about the main source of subsistence is taken from the answers of respondents for the direct questionabout the main source of subsistence during a period of joblessness. Most frequent or noteworthy compositions of thesources of subsistence are additionally reported in Kupets (2005) but not presented here for brevity.
3 Typically, economists have seen an unemployment benefit system as having a negative effect on unemploymentduration, with high benefits and long entitlement periods causing the unemployed to be less willing to accept jobs.Extensive discussion of this topic is offered in Atkinson and Micklewright (1991).
O. Kupets / Journal of Comparative Economics 34 (2006) 228–247 233
with still relatively low labor demand, many jobless people leave the formal labor market, pre-ferring to find an informal working activity or to rely on subsistence farming. Others start somesort of self-employment (usually in a low-productivity sector) just to survive. And some dis-couraged persons withdraw from the labor market to look for additional sources of income suchas stipends, pensions, child allowance, etc. Hence, prolonged joblessness may force some per-sons to intensify casual work activities or engage more actively in subsistence agriculture. Onthe other hand, those usually unemployed persons who are occasionally engaged in unreportedactivities or subsistence farming tend to search for regular jobs less intensively and, therefore,they are less likely to receive a job offer. For such individuals, alternative income may raise theirreservation wage, lowering the probability of accepting a job offer and thus the probability ofreemployment as a whole. Various kinds of non-labor income during an unemployment spell,including household income, pensions, other state and private transfers are likely to have thesame effect on the duration of unemployment as casual labor income. Thus, we hypothesize thatthe involvement of usually unemployed individuals in informal activities or subsistence farmingin view of labor demand constraints in the formal sector are of much greater importance thanunemployment benefits in explaining the stagnancy of unemployment in Ukraine during the lateperiod of transition.
3. Econometric model
We analyze duration of unemployment spells in Ukraine using a duration model.4 This modelis preferable to the usual regression model because of its ability to handle time-dependent co-variates and right-censoring in the data. The focus in modeling durations of unemployment isusually on the conditional probability of leaving unemployment, the hazard function. The hazardmodel used for this study is the Cox proportional hazards model (Cox, 1972) of the followinggeneral form:
λi(t) = λ0(t) exp(x′i (t)β
),
where xi is the set of explanatory variables for individual i, β is the vector of parameters to beestimated, and λ0(t) is the baseline hazard at time t , which is allowed to be nonparametric.5
In this study, most variables are taken as time-invariant (except the year and quarter dummies)due to the limited data on time-varying characteristics of the unemployment benefit system atour disposal and the potential endogeneity of certain characteristics, which vary with time inunemployment (e.g. marital status, number of kids).
One of the key assumptions of hazard models is that all inter-individual heterogeneity is dueto observed factors. However, it is possible that unobserved variables are also a source of hetero-geneity. Uncontrolled heterogeneity in duration models can lead to misleading inferences aboutduration dependence, and can also bias the estimated effects of the included explanatory variables(Lancaster, 1990). However, in certain cases, this may not be particularly serious. The empiricalwork of Meyer (1990) and of others suggests that failure to model distribution of unobservedheterogeneity explicitly does not seriously bias results if the baseline hazard is allowed to be
4 See Kiefer (1988) or Lancaster (1990) for more details on duration models and hazard functions.5 In the general case, explanatory variables may vary with unemployment duration t (classic examples are time-varying
unemployment benefits and the time remaining until their expiration), with calendar time (e.g. local labor market condi-tions or characteristics of the unemployment insurance system which varies with policy changes), or may remain fixedover time (as most personal characteristics).

234 O. Kupets / Journal of Comparative Economics 34 (2006) 228–247
nonparametric. Furthermore, Narendranathan and Stewart (1993) argue that there is no reason toexpect any distortions imposed by the use of techniques to allow for unobserved heterogeneityto be less serious than those caused by ignoring unobserved heterogeneity in the first place. Forthis reason, we have chosen to restrict attention in this paper to the models without accountingfor unobserved heterogeneity.6
Taking into account that an unemployment spell may end with the individual either starting ajob (exit to employment) or leaving the labor force (exit to inactivity), we estimate an independentcompeting risks model.7 This assumes that the hazard rate for exit to any destination is the sumof the two destination-specific hazard rates. We estimate the two risks separately: spells endingwith transition to inactivity are considered censored when estimating hazard to employment, andvice versa.
4. Data and variables
Our data are taken from the first wave of the Ukrainian Longitudinal Monitoring Survey(ULMS-2003), a nationally representative random sample of households consisting of 4056households and 8641 individuals aged 15 to 72. The ULMS data set is unique in Ukraine, sinceit is the richest individual-level data set available, and it allows for the analysis of more than fiveyears of labor market flows and unemployment duration owing to its retrospective nature.8
We use the inflow sample of unemployed including everyone who started with an unemploy-ment spell between January 1998 and December 2002 and who provided complete responses tothe questions about their period of job search. The spells starting after December 2002 are notused, and ongoing spells starting before December 2002 are censored at the date of December 31,2002, in order to avoid the possible effects of changing criteria for employment/unemploymentstatus when moving from the retrospective part of the questionnaire to the section referring tothe reference week. We have not restricted the age of individuals in the sample according to theusual age of retirement. We think that the low retirement age (55 for women and 60 for men)and very low level of pensions lead older Ukrainians to have almost the same work incentivesas those in younger age groups. Moreover, according to the ILO guidelines, pensioners, studentsand other individuals mainly engaged in non-economic activities who satisfy the basic criteriaof unemployment should be classified as unemployed.9 Finally, we have not separated men fromwomen in our analysis because there is no objective reason to expect significant differences inunemployment dynamics between men and women in a country like Ukraine. The total sample
6 We tested for gamma-distributed heterogeneity in our previous models with various specifications of the baselinehazard and different sets of explanatory variables. The variance of heterogeneity (gamma-distributed) was found to benot significantly different from zero. Insignificant unobserved heterogeneity has been also found in Stetsenko (2003) forUkraine and in Grogan and van den Berg (2001) and Foley (1997) (for exits to employment) for Russia.
7 We restrict our choice to these two main destination states because retrospective data with a very long recall period,used in our study, does not allow using more alternative destination states like in many other studies (e.g. Narendranathanand Stewart, 1993).
8 It should be stressed also that the ULMS is a unique data set in the CIS area because it allows for the hazard analysisin a continuous-time framework without many simplifying assumptions. Widely used Russian Longitudinal Monitor-ing Survey (RLMS) and other individual-level panel data sets have serious shortcomings as sources of information onunemployment durations. According to Kiefer (1988), the two main problems of such data sets are right-censoring (ex-clusive sampling of the current unemployed for information on unemployment duration) and length-biased sampling(underrepresentation of short spells). Problems connected with the retrospective ULMS data are discussed below.
9 We control for those who receive any kind of pension (not only for years of service or retirement age but also fordisability and loss of provider) by including a separate dummy for such persons.

O. Kupets / Journal of Comparative Economics 34 (2006) 228–247 235
according to the definition of unemployment adopted in our study (see below) comprises 1536unemployment spells experienced by 1293 individuals. The subsample of unemployment spellswithout income from casual work or farming activities according to the standard ILO criteria(call them “standard” unemployed) includes 1102 unemployment spells, and the subsample ofspells with any income from casual work or subsistence farming (call them “casual workers”)consists of 434 spells.
The unemployment duration measure refers to the length of an unemployment spell, which isdefined as the number of full months between the date of the beginning of job search (month andyear only) to the date of its end (or to December 31, 2002 in the case of right-censored spells).In order to isolate the net effect of time out of work on the hazard of leaving unemployment, weintroduced a set of control variables based on theoretical grounds and previous empirical findingsin developed and transition countries (see Devine and Kiefer, 1991 for review of some of them).The choice of variables was constrained by the data available in the retrospective sections of theULMS. Controls are included for gender, age, marital status and number of children under 15years old (and their interaction with gender), education level, previous labor market status, etc.The values of the characteristics are determined at the starting date of the unemployment spellto ensure their exogeneity. Additionally, we use six dummy variables representing the categoriesof sources of subsistence. These dummy variables reflect the presence or absence of a certaintype of income during a non-employment period. Unfortunately, the ULMS does not includeretrospective information on the level of income received from various sources. Also, there isno direct information about calendar time and the length of receipt of unemployment benefitsor other alternative income, as well as the remaining time for benefits to lapse. Due to the lackof this information, we are unable to analyze the effect of specific features of the unemploy-ment benefit system on reemployment probabilities, an analysis which would provide valuablepolicy implications. However, given the relatively small variation in the level of unemploymentbenefits and length of payment as well as the low coverage of the total unemployed population(as opposed to only the registered unemployed), a dummy representing benefit receipt should besufficient to capture the expected effect on the duration of general unemployment in Ukraine.10
In addition to individual characteristics, we use variables to account for differences in locallabor demand conditions. Differences in the local labor markets are proxied by the oblast-level quarterly registered unemployment rate at time of starting unemployment (accounting forbetween-region differences) and the type of settlement (accounting for within-region differ-ences).11 In our final model we include also oblast fixed effects to take into account possibleomitted regional characteristics which may affect unemployment duration and labor market con-ditions. Finally, we add calendar time dummies (year and quarter) which are allowed to changewith time in unemployment to control for changes in the macroeconomic environment and pos-sible seasonal effects.
10 Hunt (1995) finds for Germany that the dummy on receipt of UI is significant while the level of benefit receipt isinsignificant. Addison and Portugal (2003) use a dummy on access to unemployment benefits and find it highly significantin Portugal, but they group individuals by age (seven elements of age regressor) so as to “mimic the stepped increases inbenefit entitlement with age.”11 Regional unemployment rate is the most popular measure of the local labor demand conditions (inter aliaNarendranathan and Stewart, 1993 for the UK; Meyer, 1990 for the US; Foley, 1997 for Russia). The alternative mea-sures are local unemployment and vacancy rates for the individual’s education group, real value of regional per capitaindustrial production, and regional agricultural/industrial employment ratio (Ham et al., 1998) or Herfindahl-HirschmanIndex of employment concentration in the local labor market (Denisova, 2002).

236 O. Kupets / Journal of Comparative Economics 34 (2006) 228–247
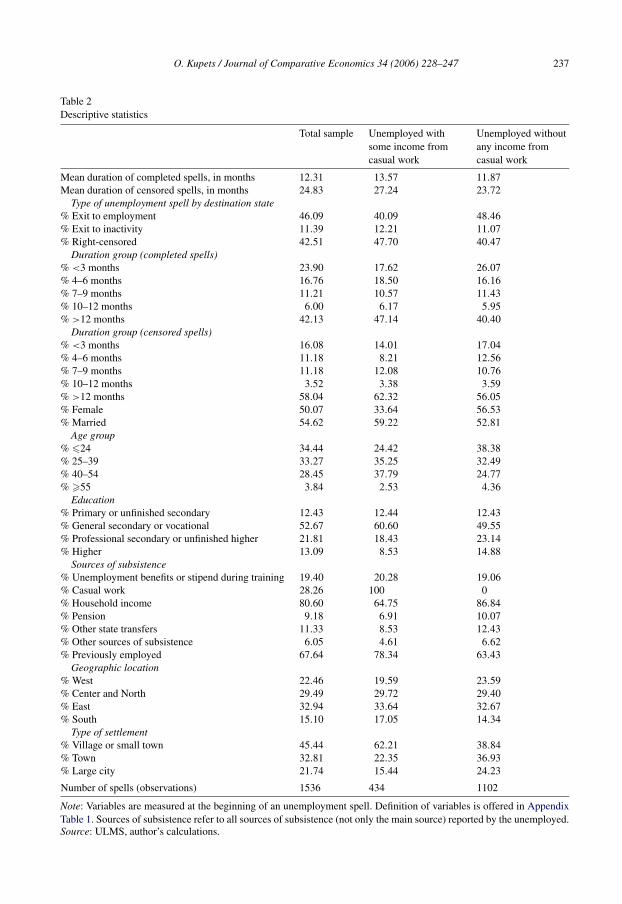
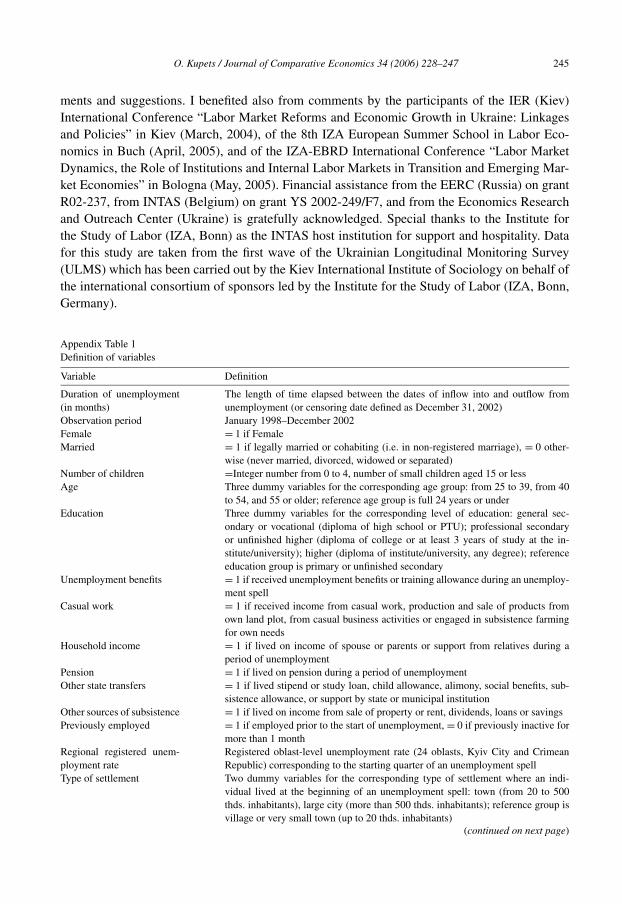
The definition of all variables is provided in Appendix Table 1. Table 2 provides some descrip-tive statistics for the variables used in the unemployment duration analysis for the three samples.The mean duration of censored spells is almost twice as high as completed unemployment spells,and the maximum duration is 60 months. Distribution of the unemployed with incomplete spellsby actual duration of their unemployment at the end of 2002 shows that the incidence of long-term unemployed was 58%.12
Table 2 shows that the majority of spells are experienced by the unemployed without incomefrom casual work (72%) implying that the total sample gives a disproportionate weighting tosuch job-seekers. As expected, the mean unemployment durations of completed and censoredspells among “casual workers” are about 2–3.5 months higher than among “standard” unem-ployed, and the corresponding difference in the incidence of long-term unemployment is about6 percentage points. There are much more previously employed males and married people withgeneral secondary/vocational or lower level of education in the subsample of “casual workers”than in the total sample or in the subsample of “standard” unemployed. It is worth noting alsothat in contrast to the total sample of unemployed or the subsample without income from casualwork, the proportion of unemployment spells experienced by the unemployed with income fromcasual work increases with age up to age 55. Not surprisingly, most of those involved in somekind of casual work or subsistence farming live in villages or very small towns (about 62%).Although the samples are very similar across geographic regions, Western Ukraine has fewer“casual workers” and Southern Ukraine has more.13 Overall, the data suggest that jobless indi-viduals participate in casual work activities because they have fewer employment opportunities,greater financial pressures, and generally worse job prospects. In other words, they have beenforced to take these unconventional measures just to survive.
Before turning to the discussion of results, several important methodological issues shouldbe stressed. The main problem is that the definition and measurement of unemployment differsacross sources, making comparisons difficult. Although we follow the ILO guidelines on definingthe unemployed as people without work and currently looking and available for work during agiven period of time (ILO, 2004), the definition of unemployment accepted in our study differsfrom the standard ILO definition due to the retrospective nature of the data with a long recallperiod.
First, since labor market states are measured in relation to a long reference period such asseveral years rather than to a short period such as one week or one day as in most longitudinalsurveys, the definition of the three labor market states employed in our study refers to the “usu-ally” employed, unemployed or economically inactive rather than to the “currently” employed,unemployed or economically inactive individuals.
Second, according to the standard ILO unemployment criteria, individuals who engage in ca-sual work or casual business activities can not be classified as unemployed. In our study, however,we do not exclude individuals on the basis of their engagement in irregular activities from thesample of unemployed if:
12 For comparison, the share of unemployed with duration of non-employment of more than 12 months according tothe official LFS data (fourth quarter in 2002) was 58.6% of all unemployed previously employed, and the share ofunemployed with duration of job search of more than 12 months was 52% of all unemployed who were looking for jobduring the preceding four weeks.13 Both Western and Southern parts of Ukraine are considered to be less industrially developed than the Eastern orCentral parts. The West is predominantly agricultural, while the Southern oblasts have relatively diversified economieswith developed service sectors.
O. Kupets / Journal of Comparative Economics 34 (2006) 228–247 237
Table 2Descriptive statistics
Total sample Unemployed withsome income fromcasual work
Unemployed withoutany income fromcasual work
Mean duration of completed spells, in months 12.31 13.57 11.87Mean duration of censored spells, in months 24.83 27.24 23.72
Type of unemployment spell by destination state% Exit to employment 46.09 40.09 48.46% Exit to inactivity 11.39 12.21 11.07% Right-censored 42.51 47.70 40.47
Duration group (completed spells)% <3 months 23.90 17.62 26.07% 4–6 months 16.76 18.50 16.16% 7–9 months 11.21 10.57 11.43% 10–12 months 6.00 6.17 5.95% >12 months 42.13 47.14 40.40
Duration group (censored spells)% <3 months 16.08 14.01 17.04% 4–6 months 11.18 8.21 12.56% 7–9 months 11.18 12.08 10.76% 10–12 months 3.52 3.38 3.59% >12 months 58.04 62.32 56.05% Female 50.07 33.64 56.53% Married 54.62 59.22 52.81
Age group% �24 34.44 24.42 38.38% 25–39 33.27 35.25 32.49% 40–54 28.45 37.79 24.77% �55 3.84 2.53 4.36
Education% Primary or unfinished secondary 12.43 12.44 12.43% General secondary or vocational 52.67 60.60 49.55% Professional secondary or unfinished higher 21.81 18.43 23.14% Higher 13.09 8.53 14.88
Sources of subsistence% Unemployment benefits or stipend during training 19.40 20.28 19.06% Casual work 28.26 100 0% Household income 80.60 64.75 86.84% Pension 9.18 6.91 10.07% Other state transfers 11.33 8.53 12.43% Other sources of subsistence 6.05 4.61 6.62% Previously employed 67.64 78.34 63.43
Geographic location% West 22.46 19.59 23.59% Center and North 29.49 29.72 29.40% East 32.94 33.64 32.67% South 15.10 17.05 14.34
Type of settlement% Village or small town 45.44 62.21 38.84% Town 32.81 22.35 36.93% Large city 21.74 15.44 24.23
Number of spells (observations) 1536 434 1102
Note: Variables are measured at the beginning of an unemployment spell. Definition of variables is offered in AppendixTable 1. Sources of subsistence refer to all sources of subsistence (not only the main source) reported by the unemployed.Source: ULMS, author’s calculations.

238 O. Kupets / Journal of Comparative Economics 34 (2006) 228–247
(1) a person answered that he/she didn’t have a job (including entrepreneurship, business activ-ities, individual work, work in a family enterprise or on a farm, and freelance work) at sometime period in the past;
(2) a person gave the reason of not having a job and answered that he/she was seeking andavailable for work for any time during that period;
(3) there is no overlap between the period of employment and the period of non-employmentaccording to respondent’s answers (if there was such overlapping we reclassified a person asemployed); and
(4) a person reported about the income from casual work or business activities, production andsale of products from own land plot, or subsistence farming for his/her own needs as one ofthe sources of subsistence at that time of non-employment.14
Unfortunately, the ULMS does not allow us to capture accurately the extent and the nature of suchirregular, usually short-term, activities within a long period of non-employment. It is impossibleto know for sure whether casual work or business activities in this case are really short-termand sporadic or whether they are regular; whether persons without a regular job in the formalsector have chosen these informal activities in light of unattractive formal sector opportunities,or whether they have been forced to engage in casual work activities or subsistence farming justto survive. It is also difficult to say whether engagement in such activities results in prolongingan unemployment spell, or whether the long-term unemployment intensifies the search for anykind of economic activity including casual activities or subsistence farming. The last issue raisesthe problem of the potential endogeneity of casual activities and subsistence farming, which isextremely difficult to address in duration models.
Finally, although some categories of individuals classified as “out of the labor force” are con-ceptually distinct from the “unemployed” (e.g. disabled or retired in the US), a substantial portionof those reporting themselves as economically inactive may be reclassified as unemployed, andvice versa (Poterba and Summers, 1995). Therefore, some allowance for spurious events thatresult from classification error should be made when analyzing unemployment duration and dy-namics. Furthermore, we might expect that the problem of classification error may become worseas respondents must recall details of events that occurred a long time ago.15 Our analysis basedon the retrospective data over more than five years is certainly subject to reliability problemsand recall bias (see Paull, 2002, among many others). Nevertheless, we believe that the relativelylow labor market mobility of the majority of Ukrainians, the salience and social undesirability ofunemployment for most individuals, and the careful design of the questionnaire have minimizedthis problem.
5. Estimation results
Results of fitting the Cox proportional hazards model in a competing risks framework to thethree samples of unemployment spells are given in Table 3.16 The figures reported are the esti-
14 Grogan and van den Berg (2001), who analyze determinants of unemployment duration in Russia, also do not excludeindividuals on the basis of informal sector activity from the sample of unemployed.15 Paull (2002) argues that time in unemployment is less likely to be recalled correctly than periods of employment andinactivity, and so the spell of unemployment may be reclassified as the spell of inactivity rather than forgotten at all.16 At the first stage of our empirical work we experimented also with parametric continuous-time models with Weibull,log-normal and log-logistic specifications of the baseline hazard as well as with discrete-time semiparametric model of
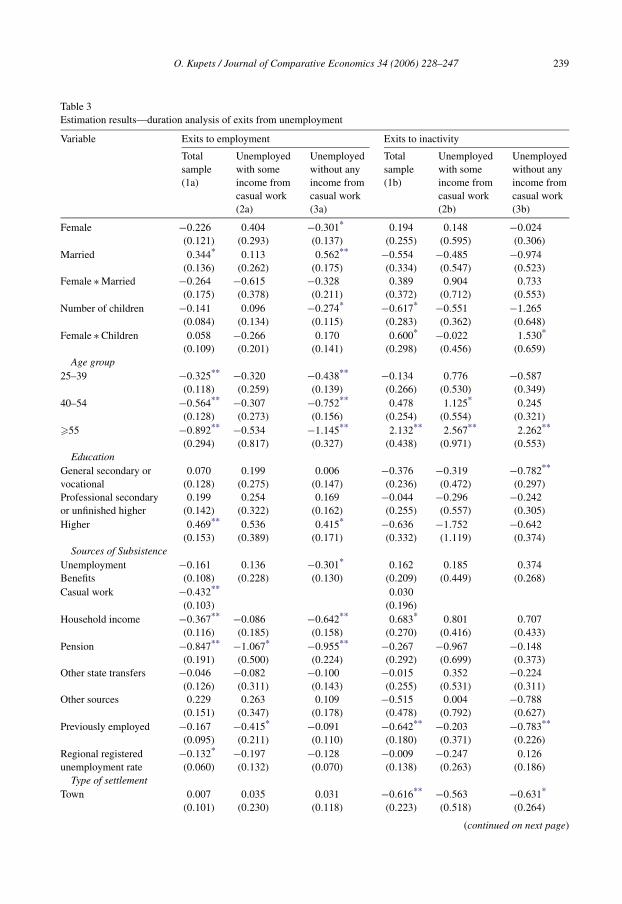
O. Kupets / Journal of Comparative Economics 34 (2006) 228–247 239
Table 3Estimation results—duration analysis of exits from unemployment
Variable Exits to employment Exits to inactivity
Totalsample(1a)
Unemployedwith someincome fromcasual work(2a)
Unemployedwithout anyincome fromcasual work(3a)
Totalsample(1b)
Unemployedwith someincome fromcasual work(2b)
Unemployedwithout anyincome fromcasual work(3b)
Female −0.226 0.404 −0.301* 0.194 0.148 −0.024(0.121) (0.293) (0.137) (0.255) (0.595) (0.306)
Married 0.344* 0.113 0.562** −0.554 −0.485 −0.974(0.136) (0.262) (0.175) (0.334) (0.547) (0.523)
Female ∗ Married −0.264 −0.615 −0.328 0.389 0.904 0.733(0.175) (0.378) (0.211) (0.372) (0.712) (0.553)
Number of children −0.141 0.096 −0.274* −0.617* −0.551 −1.265(0.084) (0.134) (0.115) (0.283) (0.362) (0.648)
Female ∗ Children 0.058 −0.266 0.170 0.600* −0.022 1.530*
(0.109) (0.201) (0.141) (0.298) (0.456) (0.659)
Age group25–39 −0.325** −0.320 −0.438** −0.134 0.776 −0.587
(0.118) (0.259) (0.139) (0.266) (0.530) (0.349)
40–54 −0.564** −0.307 −0.752** 0.478 1.125* 0.245(0.128) (0.273) (0.156) (0.254) (0.554) (0.321)
�55 −0.892** −0.534 −1.145** 2.132** 2.567** 2.262**
(0.294) (0.817) (0.327) (0.438) (0.971) (0.553)
EducationGeneral secondary or 0.070 0.199 0.006 −0.376 −0.319 −0.782**
vocational (0.128) (0.275) (0.147) (0.236) (0.472) (0.297)
Professional secondary 0.199 0.254 0.169 −0.044 −0.296 −0.242or unfinished higher (0.142) (0.322) (0.162) (0.255) (0.557) (0.305)
Higher 0.469** 0.536 0.415* −0.636 −1.752 −0.642(0.153) (0.389) (0.171) (0.332) (1.119) (0.374)
Sources of SubsistenceUnemployment −0.161 0.136 −0.301* 0.162 0.185 0.374Benefits (0.108) (0.228) (0.130) (0.209) (0.449) (0.268)
Casual work −0.432** 0.030(0.103) (0.196)
Household income −0.367** −0.086 −0.642** 0.683* 0.801 0.707(0.116) (0.185) (0.158) (0.270) (0.416) (0.433)
Pension −0.847** −1.067* −0.955** −0.267 −0.967 −0.148(0.191) (0.500) (0.224) (0.292) (0.699) (0.373)
Other state transfers −0.046 −0.082 −0.100 −0.015 0.352 −0.224(0.126) (0.311) (0.143) (0.255) (0.531) (0.311)
Other sources 0.229 0.263 0.109 −0.515 0.004 −0.788(0.151) (0.347) (0.178) (0.478) (0.792) (0.627)
Previously employed −0.167 −0.415* −0.091 −0.642** −0.203 −0.783**
(0.095) (0.211) (0.110) (0.180) (0.371) (0.226)
Regional registered −0.132* −0.197 −0.128 −0.009 −0.247 0.126unemployment rate (0.060) (0.132) (0.070) (0.138) (0.263) (0.186)
Type of settlementTown 0.007 0.035 0.031 −0.616** −0.563 −0.631*
(0.101) (0.230) (0.118) (0.223) (0.518) (0.264)
(continued on next page)
240 O. Kupets / Journal of Comparative Economics 34 (2006) 228–247
Table 3 (continued)
Variable Exits to employment Exits to inactivity
Totalsample(1a)
Unemployedwith someincome fromcasual work(2a)
Unemployedwithout anyincome fromcasual work(3a)
Totalsample(1b)
Unemployedwith someincome fromcasual work(2b)
Unemployedwithout anyincome fromcasual work(3b)
Large city 0.243 0.007 0.307 −0.326 0.072 −0.392(0.136) (0.302) (0.158) (0.243) (0.509) (0.292)
N (unemployment spells) 1536 434 1102 1536 434 1102Number of failures 708 174 534 175 53 122Log-likelihood −4582.82 −887.52 −3275.51 −1026.30 −232.85 −651.78
Notes. Estimation uses the Cox proportional hazards model. Figures reported are the estimated coefficients. Standarderrors are in parentheses. All models include oblast, year and quarter dummies. Exits to inactivity are considered censoredwhen estimating exits to employment, and vice versa.
* Significance at the 5% level.** Idem, 1%.
mated coefficients implying that the proportionate impact of each variable on the state-specifichazard can be calculated by taking the exponent of the corresponding coefficient. The split-sample estimation (columns (2a), (2b) and (3a), (3b)) points to the striking differences between“standard” unemployed (without any income from casual work) and those with some incomefrom casual work. The estimation results for the total sample and for the sample of “standardunemployed” confirm broadly the results of studies for developed and transition countries.17
Marriage in the case of males is associated with more rapid job finding after a period ofunemployment. The simplest explanation of this result is that, as household heads, married manare under greater financial pressure to return to work; they may have higher opportunity costsfor staying unemployed and search more intensively for a new job. Surprisingly, the number ofsmall children has no significant effect on the duration of unemployment for either females ormales. This finding may be partly attributed to the cheap and well functioning childcare systememerged under the Soviet era with the aim of promoting female labor force participation. Thesefindings for Ukraine are consistent with those obtained by Foley for Russia (Foley, 1997).
Age is negatively associated with the probability of reemployment, implying that older work-ers are at a disadvantage in Ukraine’s rapidly changing economic environment. Generally, thedifficulties which older workers face in finding work could be attributed to the restrictive hiringstandards of employers (especially in the emerging private sector) due to objective and discrim-inatory factors, such as obsolete skills, health problems (which from the employer’s viewpoint
the form suggested by Meyer (1990). We have also estimated the specifications including variables on religion, nation-ality, health status, the number of dependants younger than 15 or older than 75 in the household, previous employmentstatus, sector of previous employment, last wage, and last occupation before moving to unemployment, number of previ-ous unemployment spells, and time-changing national unemployment rate, but these factors appear to be not significant.Our main results are robust to their inclusion. Models analyzing only individuals with one unemployment spell showno discernible difference from those analyzing individuals who experienced more than one spell, implying that serialcorrelation is not a problem.17 Review of the studies on the determinants of unemployment duration and labor market transitions in the CEE coun-tries can be found in Svejnar (1999). Devine and Kiefer (1991) offer the literature review with detailed discussion fordeveloped countries.

O. Kupets / Journal of Comparative Economics 34 (2006) 228–247 241
are usually associated not only with a lower productivity of workers but also with a heavy bur-den of sickness benefits), loss of motivation and discouragement. All these factors may in turnlead to fewer job offers. These results are consistent with job search theory and empirical evi-dence for many developed and transition countries (e.g. Foley, 1997; Nivorozhkina et al., 2002;Stetsenko, 2003) but they are in contrast to the findings of many studies for the early period oftransition, which found longer periods of unemployment for young people (e.g. Earle and Pauna,1996).
Individuals who have completed higher education have significantly higher hazards to em-ployment than individuals with a lower level of education, ceteris paribus. Higher exit ratesamong educated people can be explained by their more efficient ability to search for a job due tobetter access to information, higher opportunity costs of unemployment, greater flexibility andwider range of alternatives for future employment. Whereas higher educated persons are ableto compete for jobs that require fewer years of schooling, the reverse is not generally the case.This issue is extremely important during the economic transition of former centrally-plannedeconomies. In her study of occupational mobility in Russia, Sabirianova (2002) found that whenthe transition period was accompanied by negative demand shocks, more downward unconven-tional switches occurred on the career ladder (or downward occupational mobility) with greaterlosses taking place among those with more education.18 However, our finding of the positiveeffect of education on the re-employment probability is in conflict with Stetsenko’s (2003) find-ings regarding the effect of education on exits from registered unemployment. We attribute thisdiscrepancy to the difference in the composition of vacancies registered at public employmentservice offices and those advertised in newspapers and private employment agencies in Ukraine,with the former heavily represented by vacancies for less educated persons with lower skills(Kupets, 2000). As has been shown before, our data favor people finding jobs through directcontacts with employers, the help of relatives or friends, advertisements in newspapers or pri-vate employment agencies. These jobs usually attract more highly educated people. Registeredvacancies available for registered unemployed at the public employment centers, on the contrary,mainly attract less educated people with low skills level.
The estimate of the variable on receipt of unemployment benefits fails to reject our hypothesisof insignificant effect of unemployment benefits on reemployment probability in the case of thetotal sample of unemployed. However, the effect of unemployment benefits is found to be signifi-cant and negative if we take only “standard” unemployed without any income from casual work.This implies that the existing unemployment benefit system may contribute to longer unemploy-ment spells in some cases but it should not be considered the primary determinant of stagnantunemployment in Ukraine. The existence of other sources of subsistence during a period of un-employment, including income from casual work activities and subsistence farming, householdincome and pension, significantly lowers the probability of reemployment. This effect is consis-tent with job search theory, with a longer search duration implied by the higher reservation wagesand lower job search intensity caused by alternative sources of subsistence.
The local labor demand variables proxied in our model by the regional unemployment rateat start of unemployment and the type of settlement have the expected signs. The residents ofregions with higher unemployment rates, all else equal, tend to have longer unemployment spellsbefore re-employment. The residents of large cities (more than 500 thousand of inhabitants) are
18 Classic examples of such downward occupational mobility in Ukraine for males include the transition from engineer,technician, and discharged armed forces serviceman to taxi driver, builder, loader or guard. For females, transitions occurfrom any profession requiring a higher level of education to street salesperson, babysitter or housekeeper.
242 O. Kupets / Journal of Comparative Economics 34 (2006) 228–247
likely to have higher exits to jobs than those living in the rural area or very small towns (at the10% confidence level). These effects presumably reflect the poorer opportunities facing peoplein depressed areas with relatively low labor market activity and a less diversified economy. Inaddition to these variables, oblast-level fixed effects were included in the model. A comparisonof models with and without oblast dummies (on the basis of the likelihood ratio test) has sup-ported the presence of oblast fixed effects which are assumed to be constant over the observationperiod.
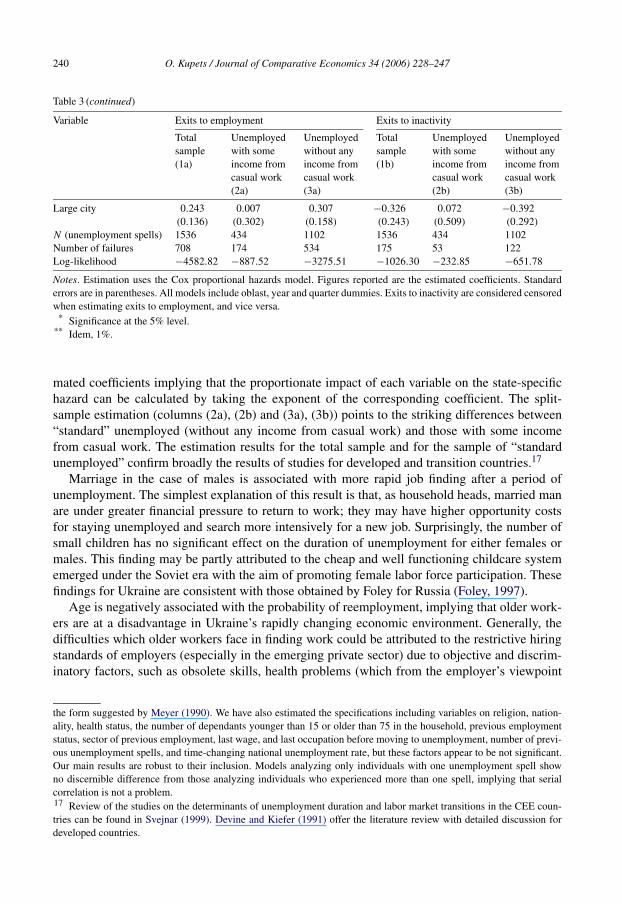
When we turn to the multivariate analysis of the factors affecting exits from unemployment toeconomic inactivity (column (1b)), several primary results emerge. Individuals with more smallchildren appear to search for a job longer before becoming discouraged or deciding to focuson non-market activities. As expected, workers older 55 have significantly higher exit rates toinactivity than prime-age or younger individuals. This age effect captures the stronger effect ofdiscouragement and loss of motivation among older individuals, higher possibility of retirementand stopping the job search process, health problems and some other attributes. Persons relyingon household income during unemployment are more likely to leave the labor force than personswithout alternative income support. Significant effect of presence of income from casual workactivities with respect to the exit to employment accompanied with its insignificant impact withrespect to the exit to inactivity probably indicates that various casual work activities and subsis-tence farming can be considered as simply survival measures taken by those who would preferthe stability of a formal regular job but with a reasonable remuneration. Previously employed in-dividuals appear to search longer before withdrawing from the labor force than those who camefrom inactivity. This finding presumably reflects higher importance of work and more negativeattributes associated with not having work and being idle for those previously employed. Alsothey may anticipate their relative advantage in finding a job and are not willing to leave the labormarket. Finally, we observe significantly longer unemployment durations before withdrawingfrom the labor force for the residents of small to medium towns compared to the residents ofrural areas or very small towns, and no significant difference in unemployment durations be-tween residents of cities and the latter. One of the possible explanations is that the residents ofrural areas can move to self-employment (primarily in subsidiary agriculture) as a last resort orwithdraw from the labor market in the case of unsuccessful search of paid employment, whereasresidents of small to medium towns stay unemployed longer hoping to find a regular job subjectto the limited number of alternative activities.
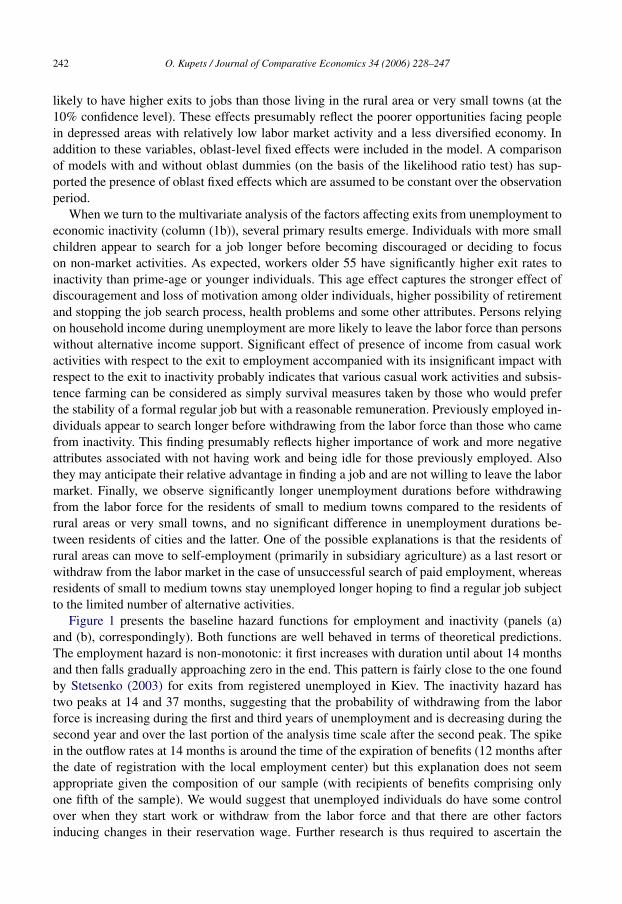
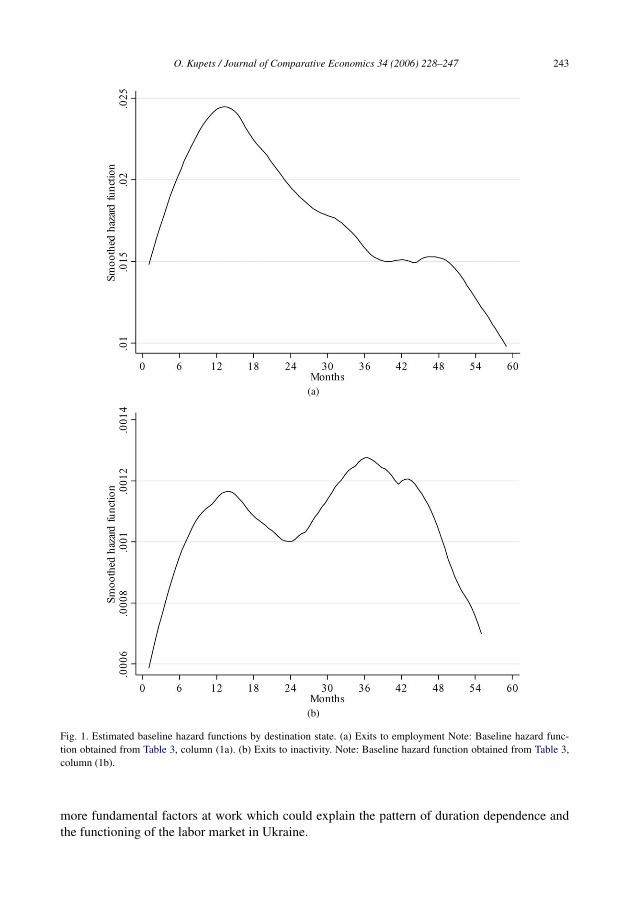
Figure 1 presents the baseline hazard functions for employment and inactivity (panels (a)and (b), correspondingly). Both functions are well behaved in terms of theoretical predictions.The employment hazard is non-monotonic: it first increases with duration until about 14 monthsand then falls gradually approaching zero in the end. This pattern is fairly close to the one foundby Stetsenko (2003) for exits from registered unemployed in Kiev. The inactivity hazard hastwo peaks at 14 and 37 months, suggesting that the probability of withdrawing from the laborforce is increasing during the first and third years of unemployment and is decreasing during thesecond year and over the last portion of the analysis time scale after the second peak. The spikein the outflow rates at 14 months is around the time of the expiration of benefits (12 months afterthe date of registration with the local employment center) but this explanation does not seemappropriate given the composition of our sample (with recipients of benefits comprising onlyone fifth of the sample). We would suggest that unemployed individuals do have some controlover when they start work or withdraw from the labor force and that there are other factorsinducing changes in their reservation wage. Further research is thus required to ascertain the
O. Kupets / Journal of Comparative Economics 34 (2006) 228–247 243
(a)
(b)
Fig. 1. Estimated baseline hazard functions by destination state. (a) Exits to employment Note: Baseline hazard func-tion obtained from Table 3, column (1a). (b) Exits to inactivity. Note: Baseline hazard function obtained from Table 3,column (1b).
more fundamental factors at work which could explain the pattern of duration dependence andthe functioning of the labor market in Ukraine.

244 O. Kupets / Journal of Comparative Economics 34 (2006) 228–247
6. Conclusion
This paper analyzes determinants of individual unemployment durations in Ukraine, usinga sample of individuals entering unemployment during January 1998–December 2002 from anew, rich, nationally representative data set (Ukrainian Longitudinal Monitoring Survey) andestimating the Cox proportional hazards models and competing risks of exits to employmentand to inactivity. Given the absence of an effective system of public employment services andunemployment insurance in Ukraine, this study tries to identify other potential determinants ofunemployment duration.
Our analysis has shown that there is huge heterogeneity among unemployed in the sample.The estimation results report evidence for existence of the disadvantaged groups of unemployedwith respect to the probability of reemployment. They include older, single, less educated indi-viduals, living in small towns or rural areas and relying on household income, pension or incomefrom casual work or subsistence farming during unemployment period. The negative effect ofcasual work activities is so strong that despite the relatively small share of casual workers in thefull sample it has been captured in the general model when a dummy variable on casual workis used. Recipients of unemployment benefits do not have significantly different unemploymentdurations in the total sample but they tend to remain unemployed considerably longer if a possi-bility of having income from casual work or farming activities during unemployment is excluded(the subsample of “standard” unemployed). After controlling for oblast fixed effects and chang-ing macroeconomic environment (calendar time dummies), local demand constraints, measuredby the oblast-level registered unemployment rate at start of unemployment, are found to have asignificant negative effect on the exit probability. As far as duration dependence is concerned,our results show positive duration dependence of the hazard to employment until 14 months andnegative duration dependence afterwards.
Demand shocks, technological changes in the early 1990s and delayed policy responses havebrought about persistent and stagnant unemployment in Ukraine in the late 1990s. In this studywe show that the possibility of different casual work activities or subsistence farming can beviewed as one of the potential contributors to stagnant unemployment during the late period oftransition. It should be noted, however, that a reverse-causality interpretation of this phenom-enon is also possible. Taking into account insufficient labor demand in the formal sector andinadequate assistance in retraining and job matching by public employment centers, many un-employed people, especially from disadvantaged groups at the labor market, may be forced toengage in informal casual work activities or subsistence farming just to survive. This in turnleads to ever-diminishing chances of their reemployment especially when a certain unemploy-ment duration threshold is passed. Thus, forced long-term unemployment accompanied withvarious casual work activities is likely to be a trap for those who for any reason lost a chance toget a regular job. In this situation, a good choice of policies and reforms in a number of areasis crucial to alleviate the problem of long-term unemployment and to boost the outflows fromunemployment.
Acknowledgments
The author is grateful to the two anonymous referees, Hartmut Lehmann, Rostislav Kape-lyushnikov, Irina Denisova, Jonathan Wadsworth, Michael Beenstock, John Earle, ChristianBelzil, Atanas Christev, Alexander Skiba, Anna Lukyanova, Inna Maltseva for valuable com-
O. Kupets / Journal of Comparative Economics 34 (2006) 228–247 245
ments and suggestions. I benefited also from comments by the participants of the IER (Kiev)International Conference “Labor Market Reforms and Economic Growth in Ukraine: Linkagesand Policies” in Kiev (March, 2004), of the 8th IZA European Summer School in Labor Eco-nomics in Buch (April, 2005), and of the IZA-EBRD International Conference “Labor MarketDynamics, the Role of Institutions and Internal Labor Markets in Transition and Emerging Mar-ket Economies” in Bologna (May, 2005). Financial assistance from the EERC (Russia) on grantR02-237, from INTAS (Belgium) on grant YS 2002-249/F7, and from the Economics Researchand Outreach Center (Ukraine) is gratefully acknowledged. Special thanks to the Institute forthe Study of Labor (IZA, Bonn) as the INTAS host institution for support and hospitality. Datafor this study are taken from the first wave of the Ukrainian Longitudinal Monitoring Survey(ULMS) which has been carried out by the Kiev International Institute of Sociology on behalf ofthe international consortium of sponsors led by the Institute for the Study of Labor (IZA, Bonn,Germany).
Appendix Table 1Definition of variables
Variable Definition
Duration of unemployment(in months)
The length of time elapsed between the dates of inflow into and outflow fromunemployment (or censoring date defined as December 31, 2002)
Observation period January 1998–December 2002Female = 1 if FemaleMarried = 1 if legally married or cohabiting (i.e. in non-registered marriage), = 0 other-
wise (never married, divorced, widowed or separated)Number of children =Integer number from 0 to 4, number of small children aged 15 or lessAge Three dummy variables for the corresponding age group: from 25 to 39, from 40
to 54, and 55 or older; reference age group is full 24 years or underEducation Three dummy variables for the corresponding level of education: general sec-
ondary or vocational (diploma of high school or PTU); professional secondaryor unfinished higher (diploma of college or at least 3 years of study at the in-stitute/university); higher (diploma of institute/university, any degree); referenceeducation group is primary or unfinished secondary
Unemployment benefits = 1 if received unemployment benefits or training allowance during an unemploy-ment spell
Casual work = 1 if received income from casual work, production and sale of products fromown land plot, from casual business activities or engaged in subsistence farmingfor own needs
Household income = 1 if lived on income of spouse or parents or support from relatives during aperiod of unemployment
Pension = 1 if lived on pension during a period of unemploymentOther state transfers = 1 if lived stipend or study loan, child allowance, alimony, social benefits, sub-
sistence allowance, or support by state or municipal institutionOther sources of subsistence = 1 if lived on income from sale of property or rent, dividends, loans or savingsPreviously employed = 1 if employed prior to the start of unemployment, = 0 if previously inactive for
more than 1 monthRegional registered unem-ployment rate
Registered oblast-level unemployment rate (24 oblasts, Kyiv City and CrimeanRepublic) corresponding to the starting quarter of an unemployment spell
Type of settlement Two dummy variables for the corresponding type of settlement where an indi-vidual lived at the beginning of an unemployment spell: town (from 20 to 500thds. inhabitants), large city (more than 500 thds. inhabitants); reference group isvillage or very small town (up to 20 thds. inhabitants)
(continued on next page)

246 O. Kupets / Journal of Comparative Economics 34 (2006) 228–247
Appendix Table 1 (continued)
Variable Definition
Macroregion for geographiclocation in Table 2
West stands for Chernivets’ka, Ivano-Frankivs’ka, Khmel’nyts’ka, L’vivs’ka,Rivnens’ka, Ternopil’s’ka, Volyns’ka, Zakarpats’ka oblasts, Center and Northconsists of Kiev City, Vinnyts’ka, Zhytomyrs’ka, Kyivs’ka, Kirovohrads’ka,Poltavs’ka, Sums’ka, Cherkas’ka and Chernihivs’ka oblasts, East includesDnipropetrovs’ka, Donets’ka, Zaporiz’ka, Luhans’ka and Kharkivs’ka oblasts,and South consists of Crimean AR and Sevastopol’, Mykolayivs’ka, Odes’ka andKhersons’ka oblasts
References
Addison, John T., Portugal, Pedro, 2003. Unemployment duration: Competing and defective risks. Journal of HumanResources 38, 156–191.
Atkinson, Anthony, Micklewright, John, 1991. Unemployment compensation and labor market transitions: A criticalreview. Journal of Economic Literature 29, 1679–1727.
Boeri, Tito, 2001. Transition with labour supply. Discussion paper No. 257. IZA, Bonn.Brown, David, Earle, John S., 2006. Job reallocation and productivity growth in the Ukrainian transition. In: Handrich,
Lars, Burakovsky, Ihor, Betliy, Olexandra, (Eds.), Labor Market Reforms and Economic Growth in Ukraine: Linkagesand Policies. Alpha-Print Publishing House, Kiev (in Ukrainian and English).
Cox, D.R., 1972. Regression models and life-tables. Journal of the Royal Statistical Society B 34, 187–220.Denisova, Irina, 2002. Staying longer in unemployment registry in Russia: Lack of education, bad luck or something
else? Working paper No. 17. Center for Economic and Financial Research, Moscow.Devine, Theresa J., Kiefer, Nicholas M., 1991. Empirical Labor Economics: The Search Approach. Oxford Univ. Press,
Oxford.Earle, John S., Pauna, Catalin, 1996. Incidence and duration of unemployment in Romania. European Economic Re-
view 40, 829–837.Foley, Mark C., 1997. Determinants of unemployment duration in Russia. Discussion paper No. 779. Economic Growth
Center, Yale University.Grogan, Louise, van den Berg, Gerard J., 2001. The duration of unemployment in Russia. Journal of Population Eco-
nomics 14, 549–568.Ham, John C., Svejnar, Jan, Terrell, Katherine, 1998. Unemployment and social safety net during transitions to a market
economy: Evidence from the Czech and Slovak Republics. American Economic Review 88, 1117–1142.Havrylyshyn, Oleh, 2005. Divergent Paths in Post-Communist Transformation: Capitalism for All or Capitalism for the
Few? Palgrave Macmillan.Hunt, Jennifer, 1995. The effect of unemployment compensation on unemployment duration in Germany. Journal of
Labour Economics 13, 88–120.International Labour Organisation (ILO), 2004. Sources and Methods: Labour Statistics, vol. 3: Economically Active
Population, Employment, Unemployment and Hours of Work (household surveys). ILO, Geneva.Kiefer, Nicholas M., 1988. Economic duration data and hazard functions. Journal of Economic Literature 26, 646–679.Kupets, Olga, 2000. The impact of active labor market policies on the outflows from unemployment to regular jobs in
Ukraine. Master of Arts Thesis. EERC, Kiev.Kupets, Olga, 2005. Determinants of unemployment duration in Ukraine. Working paper No. 05-01. EERC, Moscow.Lancaster, Tony, 1990. The Econometric Analysis of Transition Data. Cambridge Univ. Press, Cambridge.Machin, Stephen, Manning, Alan, 1999. The causes and consequences of long-term unemployment in Europe. In: Ashen-
felter, Orley, Card, David (Eds.), Handbook for Labor Economics, vol. 3C. Elsevier, North-Holland, pp. 3085–3139.Meyer, Bruce D., 1990. Unemployment insurance and unemployment spells. Econometrica 58, 757–782.Narendranathan, Wiji, Stewart, Mark B., 1993. Modeling the probability models of leaving unemployment: Competing
risks models with flexible baseline hazards. Journal of the Royal Statistical Society C 42, 63–83.Nivorozhkina, Lyudmila, Nivorozhkin, Evgenii, Shukhmin, Andrei, 2002. Modeling labour market behaviour of the pop-
ulation of a large industrial city: Duration of registered unemployment. Working paper No. 01-08. EERC, Moscow.Organisation for Economic Cooperation and Development (OECD), 1993. Long-term unemployment: Selected causes
and remedies. In: OECD Employment Outlook. OECD, Paris, pp. 83–117.Organisation for Economic Cooperation and Development (OECD), 2002. The ins and outs of long-term unemployment.
In: OECD Employment Outlook. OECD, Paris, pp. 187–243.

O. Kupets / Journal of Comparative Economics 34 (2006) 228–247 247
Paull, Gillian, 2002. Biases in the reporting of labour market dynamics. Working paper No. 02/10. Institute for FiscalStudies, London.
Poterba, James M., Summers, Lawrence H., 1995. Unemployment benefits and labour market transitions: A multinomiallogit model with errors in classification. Review of Economics and Statistics 77, 207–216.
Sabirianova, Klara, 2002. The great human capital reallocation: A study of occupational mobility in transitional Russia.Journal of Comparative Economics 30, 191–217.
Stetsenko, Serhiy, 2003. On the duration and the determinants of Ukrainian registered unemployment: A case study ofKyiv. Master of Arts Thesis. EERC, Kiev.
Svejnar, Jan, 1999. Labor markets in the transitional Central and Eastern European economies. In: Ashenfelter, Orley,Card, David (Eds.), Handbook for Labor Economics, vol. 3B. Elsevier, North-Holland, pp. 1809–2858.