Alaska Unemployment Insurance Actuarial Report 2016
55
-
Upload
khangminh22 -
Category
Documents
-
view
1 -
download
0
Transcript of Alaska Unemployment Insurance Actuarial Report 2016


Alaska Unemployment Insurance Actuarial Report 2016 Page i
Bill Walker, GovernorHeidi Drygas, Commissioner
Dan Robinson, Chief, Research and Analysis
Prepared by:Lennon Weller, EconomistTiff any Wadel, EconomistSara Whitney, EditorSam Dapcevich, Cover Ar st
For more informa on, contact Lennon Weller at (907) 465-4507 or [email protected] and Analysis Online: laborstats.alaska.gov
On the cover: Fox photo by Kent Miller, courtesy of Denali Na onal Park and Preserve
Alaska Unemployment InsuranceActuarial Report 2016
Published December 2017
Alaska Department of Labor and Workforce DevelopmentResearch and Analysis Section

Page ii Alaska Unemployment Insurance Actuarial Report 2016
Execu ve SummaryExecu ve Summary ............................................................................................................... ............................................................................................................... iviv
Chapter 1 Unemployment Insurance Benefi t Financing System ............................................ 1
Figure 1.1 UI Trust Fund End-of-Year Balance, 1981 to 2016 ........................................................................................... 1Figure 1.2 UI Trust Fund Balance, Monthly, 2007 to 2016 ............................................................................................... 3Figure 1.3 Other Measures of Trust Fund Adequacy, Cost Mul ples ............................................................................... 4
Table 1.1 Benefi t Cost Rate, 2005 to 2016 ..................................................................................................................... 5Table 1.2 Trust Fund Deposits and Disbursements, 2005 to 2016 ................................................................................. 6Table 1.3 Tax Base, Average Employer and Employee Tax Rates, and Ra o of Taxable to Total Wages, 2005 to 2016 .................................................................................... 7Table 1.4 Employer Accounts by Rate Type and Average Tax Rates by Industry ............................................................ 8Table 1.5 UI Tax Rate Calcula ons and Tax Rates by Rate Class, 2017 ........................................................................... 9Table 1.6 Administra ve Costs, 2004 to 2016 .............................................................................................................. 10Table 1.7 Collec ons, UI Regular Benefi ts Paid: Reimbursable Employment, 2007 to 2016 ........................................ 10Table 1.8 Collec ons, Benefi ts Paid, Trust Fund Reserves, and Average Employer Tax Rate as a Percentage of Wages, 1985 to 2016 ................................................................................................................................ 11
Chapter 2 Claims, Claimants, and Benefi t Payments by Industry ........................................ 12
Figure 2.1 Amount of UI Payments, Regular Benefi ts, 2004 to 2016 ............................................................................. 12Figure 2.2 Insured Unemployment Rate, Highest and Lowest Weeks, 1981 to 2016 .................................................... 13Figure 2.3 UI Regular Benefi t Payments by Industry, for In-State and Out-of-State Claimants, 2016 ............................ 14Figure 2.4 Claimants Receiving at Least One Week’s Benefi t Payment During Year, 2003 to 2016 ............................... 14
Table 2.1 Insured Unemployment, 1977 to 2016 ......................................................................................................... 15Table 2.2 UI Claimant Characteris cs, 2016 ................................................................................................................. 16Table 2.3 Schedule of UI Weekly Benefi t Amounts ...................................................................................................... 17Table 2.4 Schedule of Weekly Benefi ts Dura on .......................................................................................................... 18Table 2.5 UI Regular Benefi ts, 2005 to 2016 ................................................................................................................ 18Table 2.6 Extended Benefi ts, 2005 to 2016 .................................................................................................................. 19Table 2.7 State Supplemental Benefi ts, 2005 to 2016 .................................................................................................. 19Table 2.8 UI Regular Benefi t Payments by Industry: Intrastate, 2011 to 2016 ............................................................. 20Table 2.9 UI Regular Benefi t Payments by Industry: Interstate, 2011 to 2016 ............................................................. 22Table 2.10 UI Regular Benefi t Payments by Industry: Intrastate and Interstate Total, 2011 to 2016 ............................. 24Table 2.11 UI Regular Benefi t Payments by Borough/Census Area, 2016 ...................................................................... 26Table 2.12 Claimants With Dependents, 2006 to 2016 .................................................................................................. 27Table 2.13 Average Weekly Percentage of Unemployed Receiving Benefi ts, 2016 ........................................................ 28
Table of Contents

Alaska Unemployment Insurance Actuarial Report 2016 Page iii
Chapter 3 UI Covered Employment and Wages .................................................................... 29
Figure 3.1 Employment by Type of UI Coverage, 1981 to 2016 ..................................................................................... 29Figure 3.2 Average Monthly Covered Employment, 2004 to 2016 ................................................................................ 30Figure 3.3 Total Covered Wages, 2004 to 2016 ............................................................................................................. 31
Table 3.1 Nonagricultural Wage and Salary Employment, Covered and Noncovered, 2003 to 2016 .......................... 31Table 3.2 Average Monthly Covered Employment by Industry/Ownership, 2013 to 2016 .......................................... 32Table 3.3 Total Covered Wages by Industry/Ownership, 2013 to 2016 ........................................................................ 34Table 3.4 Taxable Wages by Industry/Ownership, 2013 to 2016.................................................................................. 36Table 3.5 Taxable as a Share of Total Wages by Industry/Ownership, 2013 to 2016.................................................... 37Table 3.6 Average Annual Wages in Covered Employment by Industry/Ownership, 2013 to 2016 ............................. 38
Appendices ............................................................................................................................... 39
Appendix A Data Sources and Limita ons ........................................................................................................................ 39Appendix B Summary of Major Changes in the Alaska Employment Security Act ........................................................... 40Appendix C Glossary ........................................................................................................................................................ 45
Table of Contents (con nued)

Page iv Alaska Unemployment Insurance Actuarial Report 2016
Benefi t costsAlaska disbursed $177.8 million in unemployment benefi ts in 2016, of which $130.6 million was chargeable to the Unemployment Insurance Trust Fund for tax calculation purposes. The remainder went mostly to reimbursable employers and interstate payments for those with wages from multiple states.
Payments in 2016 were up $18.1 million from the $159.7 million disbursed in 2015. For 2017, we expect roughly $106.6 million in chargeable benefi t costs. (See Chapter 1 for details.)
RevenueIn 2016, employers and employees contributed a combined $133.3 million in UI taxes with an average combined tax rate of 1.78 percent (0.50 for employees and 1.28 for employers) assessed on taxable wages ($39,700 in 2016).
The trust fund earned $9.95 million in interest, which will offset future contribution rates.
Fund balanceThe trust fund had $449.18 million in reserves at the end of 2016, an increase of roughly $892,000 from 2015’s ending balance of $448.28 million. The resulting reserve ratio at year’s end was 3.6 percent.
Claimant statisticsIn 2016, 43,017 individuals collected unemployment compensation, an increase of roughly 2 percent from 2015, or 879 people.
The average duration for regular benefi ts was 11.6 weeks, and the average weekly payment was $258.83.
Covered employment and wagesAlaska’s nonfarm wage and salary employment fell in 2016, the fi rst over-the-year decline since 2009 and a loss of 6,136 average jobs from the prior year.
Both state UI taxable and reimbursable employment and the estimated number of noncovered jobs fell by 5,668 and 704, respectively. Federal government added 235 jobs.
Total wages for taxable and reimbursable employment (totaling $16.3 billion) fell by nearly $700 million. Wages attached solely to reimbursable employers, however, grew from $3.921 billion in 2015 to $3.978 billion in 2016. Taxable wages fell from $8.003 billion in 2015 to $7.84 billion in 2016.
The statewide unemployment rate averaged 6.6 percent throughout 2016. The insured unemployment rate, or IUR, averaged 3.63 percent for the year and ranged from a high of 4.68 percent in early March to a low of 2.62 percent in late September.
Executive Summary

Alaska Unemployment Insurance Actuarial Report 2016 Page 1
Figure 1.1 UI Trust Fund End-of-Year BalanceB , 1981 2016
Chapter 1
Unemployment InsuranceBenefi t Financing SystemTrust fund usedto pay benefi ts Every state has a trust fund designated solely to pay unemployment insurance liabili es. To meet those li-abili es, a UI system must func on well and maintain its solvency.
In 1980, the Alaska Legisla-ture implemented the bulk of the current system. Tax rates adjust annually to refl ect changes in benefi t costs, wag-es, and the trust fund reserve ra o while the base on which taxes are assessed adjusts to changes in statewide average earnings.
These components provide both forward-looking and back-ward-looking parameters for maintaining fund solvency. The system is backward-looking in that it looks at costs already borne through benefi t payments and assigns a re-capture rate based on three years of data. It is also forward-looking in that it seeks to maintain a certain ra o of cov-ered wages — 3.0 to 3.3 percent — to prepare for a future downturn. The fi nal tax rate applied in any given year takes both cost recapture and future readiness into account.
Benefi t payments drivethe bulk of revenue needsFor tax calcula on purposes, benefi t payments are ex-pressed as a ra o of benefi ts paid to total wages of tax-paying employers. This ra o is the benefi t cost rate, or BCR, and it is calculated over three years to smooth out any given year. (See Table 1.5 for a detailed breakdown of the most recent year’s tax rate calcula on.)
Over the past decade, Alaska’s BCR has averaged 1.3 per-cent. In 2016, it was 1.1 percent. (See Table 1.1.)
Source: Alaska Department of Labor and Workforce Development, Research and Analysis Section
Payroll taxes are the fund’smain income sourceAlaska’s UI taxes, which are assessed on employers and employees, are the UI trust fund’s principal income source. Tax contribu ons totaled $133.3 million in 2016, down 15.3 percent from 2015.
In addi on to payroll contribu ons, the fund earned just under $10 million in interest. (See Table 1.2.) Those interest earnings off set benefi t costs in the tax rate calcula on.
Alaska’s UI taxes are assessed on wages up to a taxable wage base, defi ned in AS 23.20.175(c) as 75 percent of the average annual earnings in covered employment for the preceding state fi scal year (ending June 30). The state tax-able wage base was $39,700 in 2016, which increased by $100 to $39,800 for tax year 2017.
How tax rates are calculatedAlaska’s UI taxes on employers and employees have three
$01981 1983 1985 1987 1989 1991 1993 1995 1997 1999 2001 2003 2005 2007 2009 2011 2013 2015
$50 mil
$100 mil
$150 mil
$200 mil
$250 mil
$300 mil
$350 mil
$400 mil
$450 mil
$500 mil
Net UI Contribu onsTrust Fund Balance

Page 2 Alaska Unemployment Insurance Actuarial Report 2016
components: 1) the average benefi t cost rate, or ABCR; 2) individual employer experience factors; and 3) the trust fund solvency adjustment, or TFSA. Tax rates are calculated in November and apply to the following calendar year. Be-low are the current formulas for calcula ng tax rates.
• Employer tax rate = (0.73 X ABCR) X experience factor + TFSA
• Employee tax rate = (0.27 X ABCR)
The ABCR is similar to the BCR, but for tax rate calcula on the ABCR is defi ned as the cost of benefi ts (minus inter-est earnings) over the most recent three state fi scal years, divided by the total payroll of contribu ng employers over the fi rst three of the last four fi scal years, infl ated by the ra o of taxable to total wages of contribu ng employers in the most recent state fi scal year. (See Table 1.5.)
The ABCR measures benefi t payments that must be re-placed by contribu ons (taxes). Basing tax rate calcula ons on a three-year period helps mi gate single-year changes, and the averaging provides a more stable rate from year to year. While this is a key feature, it requires a buff er (or re-serve) to allow for a smoothed cost recapture.
Employers pay 73 percent (revised 2010) of the average benefi t cost rate, and employees pay the remaining 27 percent. Employee rates are uniform because they are not experience-rated. Employer rates, however, vary according to an experience ra ng system and may also include a sur-tax or credit to help maintain trust fund solvency.
20 tax rate classes are basedon employer experience ratingEmployers who lay off more workers generate higher un-employment and payment of UI benefi ts. Each state has an experience ra ng system to recognize that such employers should contribute a larger share to the UI trust fund.
Alaska has three types of employers that pay taxes. Most are in the experience-rated group: the “E class.” The experi-ence-rated have at least four quarters of wage history prior to June 30 of the year preceding the tax year to qualify for experience ra ng.
The industry-rated group, or “I class,” contains new employ-ers or those with fewer than four quarters of wage history; they pay a standard industry tax rate.
The penalty-rated group, “P class,” includes employers that either failed to report on a mely basis or are delinquent in their payments. The P class employers are taxed at the maximum rate, which can be no less than 5.4 percent.
In 2016, 88.7 percent of all contribu ng employers were experience-rated, 8.9 percent were industry-rated, and 2.3 percent were penalty-rated. (See Table 1.4.)
The State of Alaska uses a payroll decline method of ex-perience ra ng. The assump on is that employers with larger changes in payroll are responsible for more com-pensable unemployment and should contribute more to cover the higher benefi t costs of their former employees. While this is an indirect measure of experience with un-employment, the advantage is in its simplicity and cost-eff ec veness.
The payroll decline ra ng system averages each employer’s percent decline in payroll from one quarter to the next for the prior four to 12 quarters. The resul ng decline quo- ents of all employers are then arrayed in ascending order
and divided into 21 rate classes. Each class accounts for roughly 5 percent of total statewide payroll, except for the 20th and 21st rate classes, which account for 4.99 percent and 0.01 percent, respec vely.
Class 21 is the “standard rate class,” added in 1984 in re-sponse to federal legisla on requiring a standard tax rate of 5.4 percent from which the state could reduce tax rates based on experience. Experience ra ng alone doesn’t place an employer in Class 21, and it’s by direct assignment under administra ve penalty. So in prac ce, it is a penalty class.
Each rate class has experience factors — the higher the rate class, the greater the experience factor. Experience fac-tors range from 0.4 to 1.65, according to a schedule in AS 23.20.290(c). (See Table 1.5.)
Trust fund solvency The UI system fi nancing discussed so far has revolved around cost recapture, or backward-looking components, and the equitable distribu on of such costs by experience ra ng. While cost recapture is vital to keeping the system whole, so is an cipa ng future benefi t costs. To prepare for a variety of elevated claims scenarios, the fi nancing system includes a readiness component, or forward-looking ele-ment.
While the ABCR accounts for cost recapture, the fi nal rate may also incorporate a solvency adjustment to help keep the fund balance within an ideal range. To absorb benefi t payments in periods of elevated demand, the fund must maintain a reserve of between 3.0 and 3.3 percent of covered wages. Past benefi t costs determined this targeted percentage, and it proved appropriate dur-ing Alaska’s most severe recession to date: in the 1980s when costs in 1986 alone rose as high as 3.38 percent of covered wages.

Alaska Unemployment Insurance Actuarial Report 2016 Page 3
Figure 1.2 UI Trust Fund Balance, Monthly2007 2016
Source: Alaska Department of Labor and Workforce Development, Research and Analysis Section
Application of solvency adjustmentState statute dictates that the solvency tax may not in-crease by more than 0.3 percentage points from one year to the next. This limit allows for mul -year recovery and helps prevent drama c tax rate rises from year to year. The goal is to replenish the fund incrementally, allowing the system to prepare for the next cycle of elevated benefi t de-mand.
The trust fund solvency adjustment applies uniformly to all employers, regardless of rate class, and ranges from -0.4 percent to 1.1 percent depending on the trust fund reserve rate, according to AS 23.20.290(f).
In 2017, employers received a credit of 0.19 percent to their cost-based tax rate because the trust fund was at 3.49 percent at tax calcula on me, exceeding the targeted re-serve ra o range of 3.0 to 3.30 percent.
UI program administrationfunded by a federal taxSeparate from state-imposed taxes used solely to fi nance benefi t payments, employers pay an addi onal federal tax to cover the costs of administering the UI program. The Federal Unemployment Tax Act, or FUTA, imposes a tax of 6.0 percent on a base of $7,000 in wages. However, as long as state law conforms to federal law, employers receive an off se ng credit of 5.4 percent on the FUTA tax rate, making the eff ec ve tax rate 0.6 percent. The net result is a maxi-
mum $42 tax for each employee. The federal government es mates that in federal fi scal year 2016, employers in Alas-ka contributed $13.3 million in FUTA taxes. (See Table 1.6.)
The purpose of the FUTA credit is to encourage state pro-grams to comply with federal guidelines; as a result, con-formity to federal law is frequently the reason for adop ng new state provisions. Alaska’s Employment Security Act conforms to federal law.
The federal government pays for the administra on of each state’s unemployment program through administra ve grants. In federal fi scal year 2016, Alaska received $31.7 million in administra ve grants, including $24.7 million for unemployment insurance administra ve costs and $7.0 mil-lion for employment services. Alaska’s administra ve grants totaled 238.3 percent of state FUTA contribu ons —in oth-er words, the state received roughly $2.38 in grant funding for every $1.00 paid in FUTA taxes. (See Table 1.6.)
Trust fund revenue includesdirect reimbursementsWhile the state trust fund disburses all regular benefi ts, ex-tended benefi ts, and supplemental state benefi ts, they dif-fer in how they’re fi nanced. As men oned earlier, employer taxes are the fund’s major source of revenue, but revenues come from a variety of sources.
The federal government reimburses the trust fund for 100 percent of regular and extended benefi ts paid to former
$0
$100 mil
$200 mil
$300 mil
$400 mil
$500 mil
$600 mil
2007 2008 2009 2010 2011 2012 2013 2014 2015 2016
Mar 2012$202 mil
Nov 2008$360 mil
Target full solvency range(3.0 - 3.3 percent of wages covered)
Nov 2015$460 mil

Page 4 Alaska Unemployment Insurance Actuarial Report 2016
Figure 1.3 Other Measures of Trust Fund Adequacy C , 1 Q 2001 4 Q 2016
Source: U.S. Department of Labor, Employment and Training Administration, UI Data Summary
federal employees through its UCFE program and former military employees through its UCX program, as well as a por on (about 50 percent) of all nonfederal extended ben-efi t payments.
The federal government also pays interest on the trust fund balance. In 2016, the trust fund earned roughly $10 million in interest, which off sets benefi t costs and mi gates sol-vency taxes. (See Table 1.2.)
Nonprofi t organiza ons and state and local government agencies that opt to reimburse the trust fund directly in-stead of paying taxes reimburse 100 percent of the regular UI benefi ts and extended benefi ts paid to their former em-ployees.
Through 1988, nonprofi t agencies reimbursed only half the extended benefi ts, but the Alaska Legislature changed the law in 1989. Reimbursable employers paid back $9.29 mil-lion in 2016. (See tables 1.2 and 1.7.)
Training programs receive shareof employee UI tax contributionsThe Alaska Department of Labor and Workforce Develop-ment administers two employment training programs funded by a share of the unemployment insurance taxes that employees pay.
The State Training and Employment Program (STEP), cre-ated in 1989, was reauthorized six mes and made per-manent in 2009. The Technical and Voca onal Educa on Program (TVEP) was enacted in 2000. Both programs began with iden cal funding defi ni ons (AS 23.15.630 and AS 23.15.835, respec vely) providing an amount equal to 0.10 percent of taxable wages.
While the STEP funding rate has remained constant, the rate for TVEP has increased twice since incep on. The fi rst increase, eff ec ve in 2009, was by 50 percent, to 0.15 percent of taxable wages. In 2015, the TVEP rate went up another 1/100th of a percentage point, to 0.16 percent.
As of 2015, at the employee minimum UI tax rate of 0.5 percent, the share of employee tax contribu ons allocated for STEP (0.10 / 0.5) is 20 percent and for TVEP (0.16 / 0.5) is 32 percent. As a result, at the minimum employee tax, 52 percent of employee contribu ons are dedicated to these training programs and not deposited into the trust fund. However, as the employee tax increases from the minimum, the resul ng allocated percentage decreases.
In 2015, STEP and TVEP received $20.5 million, and in 2016 they received $20.3 million. During the last fi ve years, em-ployee tax contribu ons have provided more than $97.2 million for the training programs from the UI fi nancing system.
0.0%10.0%20.0%30.0%40.0%50.0%60.0%70.0%80.0%90.0%
100.0%110.0%120.0%130.0%140.0%150.0%160.0%170.0%
Avg high cost mul ple
High cost mul ple
2008 recession becomespart of the calcula on andthe 1980s recession falls o
Trust fund reserve rate rela v

Alaska Unemployment Insurance Actuarial Report 2016 Page 5
Table 1.1 Benefi t Cost Rate 2005 2016
Taxable Employment Reimbursable EmploymentBenefi t Benefi t
Benefi ts Total Wages Cost Benefi ts Total Wages CostPaid (Lagged 1 Yr) Rate Paid (Lagged 1 Yr) Rate
Year (In Thousands) (In Thousands) (Percent) (In Thousands) (In Thousands) (Percent)
2005 $121,260 $8,170,491 1.5% $9,890 $2,411,561 0.4%2006 $113,787 $8,629,441 1.3% $8,284 $2,519,453 0.3%2007 $107,410 $9,214,930 1.2% $7,897 $2,600,402 0.3%2008 $114,155 $9,877,150 1.2% $7,826 $2,691,732 0.3%2009 $179,562 $10,507,640 1.7% $12,108 $2,826,216 0.4%2010 $185,124 $10,637,463 1.7% $15,169 $3,024,074 0.5%2011 $169,400 $10,898,425 1.6% $14,033 $3,163,922 0.4%2012 $159,040 $11,390,626 1.4% $12,868 $3,274,322 0.4%2013 $157,746 $11,999,195 1.3% $12,201 $3,372,235 0.4%2014 $144,436 $12,364,344 1.2% $11,012 $3,467,292 0.3%2015 $122,741 $12,814,900 1.0% $9,379 $3,691,886 0.3%2016 $140,678 $13,086,381 1.1% $9,154 $3,921,715 0.2%
Note: Taxable employment benefi ts paid include Net UI + SSB, state share EB, and net wage combining interstate.
Sources: Alaska Department of Labor and Workforce Development, Research and Analysis Section:Unemployment Insurance Financial Transaction Summary, ETA 2112 report to the U.S. Department of Labor;Quarterly Census of Employment and Wages (QCEW)

Page 6 Alaska Unemployment Insurance Actuarial Report 2016
Table 1.2 Trust Fund Deposits and Disbursements 2005 2016
Deposits
Year
UI TaxContributions
(ex. reimb.)
FederalShare
ExtendedBenefi ts
AmountsRec’d From
Reimb.Employers
InterstateBenefi ts
WageCombining
FederalEmerg.Comp1 Net Penalty Other
TrustFund
InterestEarned
TotalRevenue
Deposited
2005 $145,990,785 $1,978,258 $10,692,011 $1,435,969 $235,400 $11,120,449 $4,703,701 $10,050,126 $186,206,6982006 $155,630,450 $0 $9,101,144 $1,143,862 $0 $12,130,828 $3,719,601 $11,922,978 $193,648,8642007 $141,857,022 $0 $7,769,782 $1,381,191 $16,900 $12,728,892 $3,534,700 $14,555,870 $181,844,3572008 $123,294,511 $1,760,900 $8,498,168 $1,139,703 $9,857,900 $14,773,157 $4,160,400 $16,226,742 $179,711,4812009 $102,925,167 $24,725,886 $10,912,421 $2,628,686 $57,078,819 $16,649,388 $11,794,907 $14,800,781 $241,516,0562010 $111,699,985 $37,397,073 $15,332,275 $4,046,388 $98,633,056 $16,923,833 $18,325,023 $11,037,930 $313,395,5632011 $150,876,106 $18,306,737 $14,860,497 $2,748,887 $104,680,250 $17,868,163 $8,902,300 $8,195,716 $326,438,6562012 $197,162,141 $5,132,361 $13,155,741 $2,127,352 $96,153,600 $18,656,384 $6,894,300 $6,813,917 $346,095,7952013 $230,041,831 $432 $12,745,377 $2,691,038 $67,091,600 $19,606,134 $6,725,700 $7,579,692 $346,481,8042014 $190,467,739 $255,594 $12,174,813 $1,999,803 $1,615,375 $20,351,281 $5,200,344 $8,933,794 $240,998,7432015 $157,355,840 -$107,100 $9,403,554 $1,469,663 -$1,012,000 $21,105,260 $3,503,600 $9,778,835 $201,497,6522016 $133,321,498 -$92,300 $9,285,108 $3,371,640 $868,809 $20,896,798 $1,099,383 $9,951,769 $178,702,705
Disbursements
Year
RegularBenefi ts
+ SSB
Extended
Benefi tPayments
Reimb.Benefi t
Payments
InterstateBenefi ts
WageCombining
FederalEmerg.Comp.1
TrainingAnd
BuildingFund Other
TotalBenefi ts
Disbursed
ReserveFund
Balance
2005 $108,545,340 $4,079,233 $9,890,482 $12,114,777 -$270,168 $11,295,341 $12,536,018 $158,191,022 $230,973,7762006 $102,806,753 -$305,756 $8,284,330 $12,277,205 -$448,030 $12,041,918 $6,758,048 $141,414,467 $283,208,1722007 $95,880,401 -$4,260 $7,897,265 $12,912,576 $31,663 $12,628,147 $6,678,243 $136,024,035 $329,028,4952008 $100,630,213 $3,464,794 $7,825,589 $12,949,475 $10,835,942 $14,756,828 $9,626,379 $160,089,219 $351,909,6212009 $160,374,040 $26,367,374 $12,107,607 $17,957,371 $58,175,601 $16,606,203 $5,899,685 $297,487,880 $295,937,7972010 $171,463,019 $37,684,897 $15,168,986 $17,011,630 $97,845,340 $16,994,436 $8,562,741 $364,731,049 $244,602,3112011 $157,292,889 $17,236,761 $14,032,924 $14,976,753 $103,591,824 $17,846,713 $10,210,225 $335,188,089 $235,852,8782012 $144,796,244 $3,428,825 $12,867,725 $16,379,383 $96,768,472 $18,259,636 $13,946,753 $306,447,039 $275,501,6352013 $143,947,724 -$340,746 $12,201,378 $16,534,278 $67,022,264 $19,553,480 $10,652,784 $269,571,161 $352,412,2782014 $130,377,061 -$229,250 $11,012,079 $16,087,402 -$891,989 $20,369,479 $10,216,055 $186,940,838 $406,470,1832015 $107,260,211 -$131,256 $9,379,205 $16,973,554 -$981,221 $21,132,710 $6,047,462 $159,680,666 $448,287,1692016 $122,273,218 -$102,228 $9,154,423 $21,786,658 -$911,957 $20,844,232 $4,766,760 $177,811,107 $449,178,767
1EUC-08: Emergency Unemployment Compensation 2008, July 2008 to April 2011
Source: Alaska Department of Labor and Workforce Development, Research and Analysis Section: Unemployment Insurance Financial Transaction Summary, ETA 2112 report to the U.S. Department of Labor

Alaska Unemployment Insurance Actuarial Report 2016 Page 7
Table 1.3 Tax Base, Average Employer and Employee Tax Rates, and Ra o of Taxable to Total Wages 2005 2016
Average EmployerTax Rate
Average EmployeeTax RateWages in Taxable
Employment (Thousands)Taxable
wages as a percentage of
Total Wages Year Tax Base
Percent of Taxable
Wages
Percent of TotalWages
Percent of Taxable
Wages
Percent of TotalWages
TotalWages
Taxable Wages
2005 $8,629,441 $5,436,868 63.0% $27,900 2.50% 1.58% 0.50% 0.3%2006 $9,214,930 $5,720,285 62.1% $28,700 2.43% 1.51% 0.51% 0.3%2007 $9,877,150 $6,074,631 61.5% $30,100 1.94% 1.19% 0.50% 0.3%2008 $10,506,492 $6,391,729 60.8% $31,300 1.50% 0.91% 0.50% 0.3%2009 $10,636,240 $6,455,222 60.7% $32,700 1.15% 0.70% 0.50% 0.3%2010 $10,897,265 $6,718,998 61.7% $34,100 1.31% 0.81% 0.50% 0.3%2011 $11,390,626 $6,963,554 61.1% $34,600 1.87% 1.14% 0.58% 0.4%2012 $11,999,195 $7,327,255 61.1% $35,800 2.38% 1.45% 0.66% 0.4%2013 $12,364,344 $7,608,675 61.5% $36,900 2.64% 1.62% 0.68% 0.4%2014 $12,806,848 $7,745,447 60.5% $37,400 1.97% 1.19% 0.62% 0.4%2015 $13,087,798 $8,001,869 61.1% $38,700 1.53% 0.94% 0.57% 0.3%2016 $12,334,282 $7,831,542 63.5% $39,700 1.28% 0.81% 0.50% 0.3%
Sources: Alaska Statutes 23.20.175 and 23.20.290, Alaska Department of Labor and Workforce Development, Research and Analysis Section: Quarterly Census of Employment and Wages (QCEW)

Page 8 Alaska Unemployment Insurance Actuarial Report 2016
Table 1.4 Employer Accounts by Rate Type and Average Tax Rates by Industry
2016 Employers, Assigned to 2017 Tax Rates, By Rate Type
Experience Rated
Industry Rated
Penalty Rated
Total Rated Employers
IndustryE-Rated
No.Percent of
E-RatedI-Rated
No.Percent of
I-RatedP-Rated
No.Percent of
P-RatedTotal
No.Grand
Total
Agriculture, Forestry, Fishing, and Hunting 182 1.1% 22 1.3% 2 0.5% 206 1.1%Mining 192 1.2% 13 0.8% 4 0.9% 209 1.1%Utilities 83 0.5% 4 0.2% 0 0 87 0.5%Construction 2,281 13.9% 244 14.8% 54 12.5% 2,579 14.0%Manufacturing 445 2.7% 49 3.0% 8 1.8% 502 2.7%Wholesale Trade 575 3.5% 39 2.4% 5 1.2% 619 3.4%Retail Trade 1,721 10.5% 124 7.5% 34 7.9% 1,879 10.2%Transporation and Warehousing 808 4.9% 63 3.8% 15 3.5% 886 4.8%Information 236 1.4% 41 2.5% 42 9.7% 319 1.7%Finance and Insurance 487 3.0% 52 3.2% 8 1.8% 547 3.0%Real Estate and Rental and Leasing 586 3.6% 39 2.4% 11 2.5% 636 3.4%Professional and Technical Services 1,821 11.1% 257 15.6% 20 4.6% 2,098 11.4%Management of Companies 56 0.3% 5 0.3% 0 0 61 0.3%Administrative and Waste Services 938 5.7% 83 5.0% 30 6.9% 1,051 5.7%Educational Services 243 1.5% 42 2.5% 5 1.2% 290 1.6%Health Care and Social Assistance 1,682 10.3% 140 8.5% 31 7.2% 1,853 10.0%Arts, Entertainment, and Recreation 512 3.1% 32 1.9% 10 2.3% 554 3.0%Accommodations and Food Services 1,633 10.0% 156 9.5% 64 14.8% 1,853 10.0%Other Services, except Public Administration 1,380 8.4% 163 9.9% 40 9.2% 1,583 8.6%Public Administration 332 2.0% 3 0.2% 18 4.2% 353 1.9%Unclassifi ed 195 1.2% 78 4.7% 32 7.4% 305 1.7% Total 16,388 100% 1,649 100% 433 100% 18,470 100%Percent of Grand Total 88.7% 8.9% 2.3% 100.0%
Average Tax Rates For Experience Rated Firms
2010 2011 2012 2013 2014 2015 2016 2017Agriculture, Forestry, Fishing,1 and Hunting 1.99% 2.65% 3.23% 3.58% 2.82% 2.32% 1.98% 1.64%Mining 1.75% 2.37% 2.94% 3.23% 2.49% 2.01% 1.75% 1.50%Utilities 1.44% 1.88% 2.34% 2.69% 1.97% 1.58% 1.36% 1.20%Construction 1.95% 2.63% 3.24% 3.51% 2.74% 2.21% 1.88% 1.55%Manufacturing 1.77% 2.41% 2.97% 3.20% 2.44% 1.96% 1.69% 1.39%Wholesale Trade 1.61% 2.20% 2.70% 3.93% 2.22% 1.78% 1.56% 1.30%Retail Trade 1.60% 2.17% 2.65% 2.91% 2.19% 1.75% 1.54% 1.29%Transporation and Warehousing 1.67% 2.25% 2.73% 2.97% 2.27% 1.84% 1.58% 1.34%Information 1.51% 2.02% 2.54% 2.78% 2.14% 1.74% 1.59% 1.27%Finance and Insurance 1.51% 2.01% 2.49% 2.73% 2.02% 1.64% 1.45% 1.23%Real Estate and Rental and Leasing 1.60% 2.14% 2.64% 2.86% 2.15% 1.72% 1.51% 1.28%Professional and Technical Services 1.63% 2.19% 2.72% 2.99% 2.28% 1.84% 1.61% 1.35%Management of Companies 1.71% 2.22% 2.85% 3.01% 2.39% 1.92% 1.61% 1.35%Administrative and Waste Services 1.75% 2.34% 2.88% 3.12% 2.40% 1.94% 1.69% 1.42%Educational Services 1.70% 2.29% 2.79% 3.08% 2.37% 1.95% 1.70% 1.39%Health Care and Social Assistance 1.38% 1.83% 2.27% 2.55% 1.87% 1.51% 1.36% 1.17%Arts, Entertainment, and Recreation 1.81% 2.46% 3.01% 3.29% 2.52% 2.05% 1.79% 1.49%Accommodations and Food Services 1.70% 2.27% 2.79% 3.05% 2.32% 1.87% 1.62% 1.36%Other Services, except Public Administration 1.51% 2.04% 2.50% 2.77% 2.05% 1.63% 1.44% 1.23%Public Administration 1.58% 2.16% 2.67% 2.94% 2.21% 1.74% 1.53% 1.27%Unclassifi ed 1.80% 2.40% 2.97% 3.21% 2.46% 1.97% 1.73% 1.43%
Notes: Fishing excludes nearly all commercial fi sh harvesting employment. Percentages may not sum to 100 due to rounding. Experience-rated fi rms have at least four quarters of reported wages to qualify for experience rating. Experience-rated employers are assigned to one of 20 rate classes based on their average payroll decline experience (regardless of their industry). Industry-rated fi rms are newer employers with fewer than four quarters of reportable wages. They are assigned to the tax class that is closest to their industry average. Penalty-rated fi rms are those who have failed to submit quarterly reports or pay taxes on schedule.
Source: Alaska Department of Labor and Workforce Development, Research and Analysis Section, Taxable Wages within Size of Payroll Code, Report BTA4310P

Alaska Unemployment Insurance Actuarial Report 2016 Page 9
Table 1.5 UI Tax Rate Calcula ons and Tax Rates by Rate Class 2017
Tax Rate Calculations
SFY 2013 SFY 2014 SFY 2015 SFY 2016
(1) Benefi t Cost (Ben-Reimb-Int) 142,761,564 115,441,001 124,609,572(2) Total Wages (taxable employers) 12,149,055,152 12,619,057,017 12,989,178,637 12,756,852,113(3) Taxable Wages 7,865,264,849
(4) Benefi t Cost for 3 Prev SFY $382,812,136(5) Total Wages, First 3 of Last 4 SFY $37,757,290,806(6) 3-Yr Benefi t Cost/Total Payroll (4)/(5) 0.010139(7) Taxable/Total Wages, Last SFY (3)/(2) 0.616552(8) Average Benefi t Cost Rate (6)/(7) 0.016444(9) UI Trust Fund Balance, Sep 30 445,426,466(10) Total Wages, Last SFY $12,756,852,113(11) UI Trust Fund Reserve Rate (9)/(10) 0.034917(12) Solvency Adjustment -0.0019
Tax Rates (the Percent of Taxable Wages)(13) Average Employer Tax Rate: (0.73 x ABCR) + TFSA = (0.73 x #8) + #12
1.01%
(14) Average Employee Tax Rate: (0.27 x ABCR) = (0.27 x #8) 0.50%
Tax Rates for Employees and Experience Rated Employers
RateClass
ExperienceFactor
EmployeeTax RatePercent
EmployerTax RatePercent
TotalTax RatePercent
1 0.40 0.50% 1.00% 1.50%2 0.45 0.50% 1.00% 1.50%3 0.50 0.50% 1.00% 1.50%4 0.55 0.50% 1.00% 1.50%5 0.60 0.50% 1.00% 1.50%6 0.65 0.50% 1.00% 1.50%7 0.70 0.50% 1.00% 1.50%8 0.80 0.50% 1.00% 1.50%9 0.90 0.50% 1.00% 1.50%
10 1.00 0.50% 1.01% 1.51%11 1.00 0.50% 1.01% 1.51%12 1.10 0.50% 1.13% 1.63%13 1.20 0.50% 1.25% 1.75%14 1.30 0.50% 1.37% 1.87%15 1.35 0.50% 1.43% 1.93%16 1.40 0.50% 1.49% 1.99%17 1.45 0.50% 1.55% 2.05%18 1.50 0.50% 1.61% 2.11%19 1.55 0.50% 1.67% 2.17%20 1.60 0.50% 1.73% 2.23%21 1.65 0.50% 5.40% 5.90%
Notes: Total wages, taxable wages, and UI benefi t costs are all for employees (current or former) of contributing (taxable) employers only.Reimbursable employers are excluded.Employee Tax Rate: Statutory minimum tax rate for employee is 0.50%. (Line 14)Employer Tax Rate: Statutory minimum tax rate for employer is 1.00%.
Sources: Alaska Statutes 23.20.290; Alaska Department of Labor and Workforce Development, Research and Analysis Section: Quarterly Census of Employment and Wages (QCEW); Unemployment Insurance Financial Transaction Summary, ETA 2112 report to the U.S. De-partment of Labor

Page 10 Alaska Unemployment Insurance Actuarial Report 2016
Table 1.6 Administra ve Costs 2004 2016
FederalFiscalYear1
FUTACollections(in millions)
UI Admin.Grants
(in millions)
Employment Security
Admin.Grants
(In millions)
OtherGrants
(In millions)
Total Administrative Grants
(In millions)
As a Percentage
of FUTA
2004 $14.7 $21.3 $7.8 $1.9 $29.1 198.0%2005 $15.4 $21.3 $7.7 $2.0 $29.0 188.3%2006 $16.1 $19.1 $7.6 $1.9 $26.7 165.8%2007 $16.3 $20.6 $7.4 $1.4 $28.0 171.8%2008 $16.5 $22.1 $7.4 $1.2 $29.5 178.8%2009 $16.3 $27.8 $8.5 $1.2 $36.3 222.7%2010 $16.4 $25.5 $10.6 $1.3 $36.1 220.1%2011 $16.6 $25.6 $7.4 $1.3 $33.0 198.8%2012 $12.8 $24.2 $7.4 $1.2 $31.6 246.9%2013 $12.9 $23.8 $7.3 $1.1 $31.1 241.1%2014 $13.2 $26.8 $7.0 $1.1 $33.8 256.1%2015 $13.2 $25.6 $7.0 $1.0 $32.6 247.0%2016 $13.3 $24.7 $7.0 $1.3 $31.7 238.3%
1The federal fi scal year is a 12-month period begining Oct. 1 of the prior year, ending Sept. 30 of the following year.For example, FFY 2013 would include activity between Oct. 1, 2012 and Sept. 30, 2013. The data table presented here uses a revised data series for 1981 to 2007, issued by USDOL in January 2009.
Source: U.S. Department of Labor, Employment and Training Administration, Offi ce of Workforce SecurityWeb site: www.ows.doleta.gov/unemploy/budget.asp. Select the link: “Estimated FUTA Receipts vs. Amounts Returned.”
Table 1.7 Collec ons, UI Regular Benefi ts Paid R , 2007 2016
Collections Benefi ts Paid
Year TotalPrivate
Nonprofi tGovernment
(State & Local) Total
PrivateNonprofi t
Government(State & Local)
Total CollectionsLess Benefi ts Paid
2007 $7,769,782 $990,146 $6,779,635 $7,897,265 $917,077 $6,980,188 -$127,4842008 $8,498,168 $1,220,277 $7,277,891 $7,825,589 $889,612 $6,935,977 $672,5792009 $10,912,421 $1,272,116 $9,640,305 $12,107,607 $1,147,965 $10,959,642 -$1,195,1862010 $15,332,275 $1,735,071 $13,597,204 $15,168,986 $1,481,034 $13,687,952 $163,2902011 $14,860,497 $1,863,240 $12,997,257 $14,032,924 $1,649,717 $12,383,207 $827,5742012 $13,155,741 $2,173,057 $10,982,684 $12,867,725 $1,842,133 $11,025,593 $288,0162013 $12,745,377 $2,322,614 $10,422,764 $12,201,378 $1,862,748 $10,338,629 $544,0002014 $12,174,813 $2,165,050 $10,009,763 $11,012,079 $1,620,903 $9,391,177 $1,162,7332015 $9,403,554 $1,819,213 $7,584,340 $9,379,205 $1,389,881 $7,989,324 $24,3492016 $9,285,108 $2,004,230 $7,280,878 $9,154,423 $3,376,093 $5,778,330 $130,685
10-Year Total $2,490,556
Source: Alaska Department of Labor and Workforce Development, Research and Analysis Section: Unemployment Insurance Financial Trans-action Summary, ETA 2112 report to the U.S. Department of Labor
Alaska Unemployment Insurance Actuarial Report 2016 Page 11
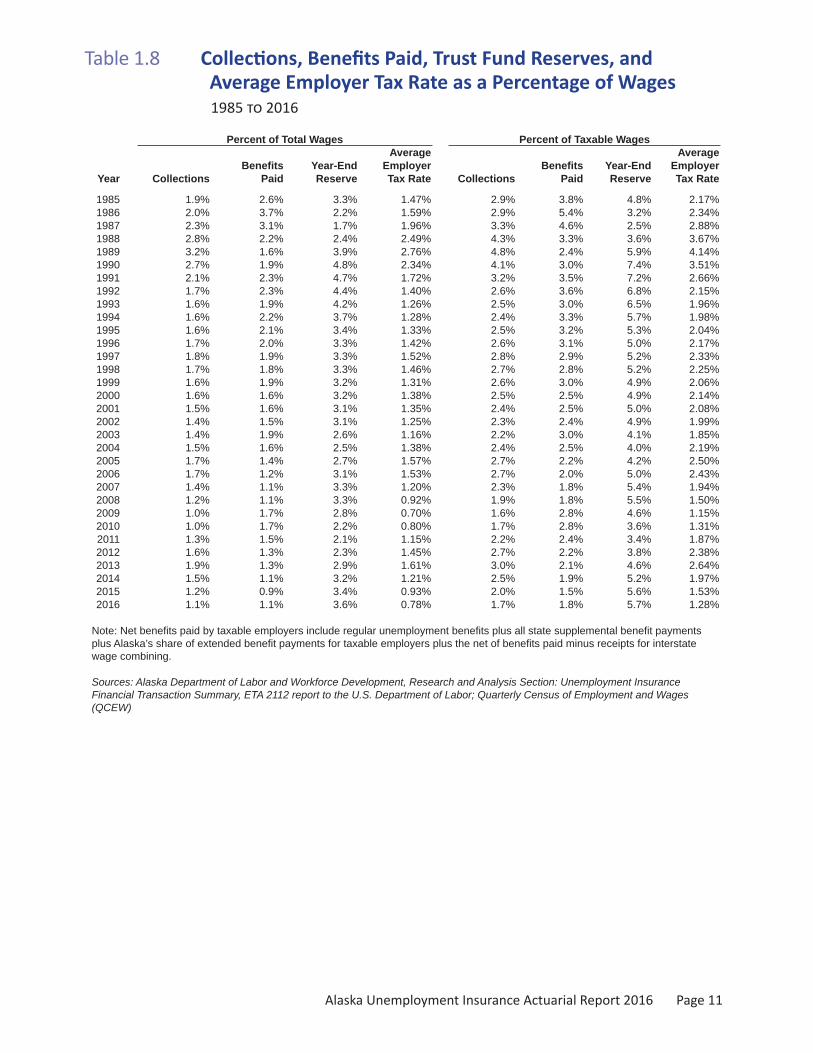
Table 1.8 Collec ons, Benefi ts Paid, Trust Fund Reserves, and Average Employer Tax Rate as a Percentage of Wages 1985 2016
Percent of Total Wages Percent of Taxable WagesAverage Average
Benefi ts Year-End Employer Benefi ts Year-End EmployerYear Collections Paid Reserve Tax Rate Collections Paid Reserve Tax Rate
1985 1.9% 2.6% 3.3% 1.47% 2.9% 3.8% 4.8% 2.17%1986 2.0% 3.7% 2.2% 1.59% 2.9% 5.4% 3.2% 2.34%1987 2.3% 3.1% 1.7% 1.96% 3.3% 4.6% 2.5% 2.88%1988 2.8% 2.2% 2.4% 2.49% 4.3% 3.3% 3.6% 3.67%1989 3.2% 1.6% 3.9% 2.76% 4.8% 2.4% 5.9% 4.14%1990 2.7% 1.9% 4.8% 2.34% 4.1% 3.0% 7.4% 3.51%1991 2.1% 2.3% 4.7% 1.72% 3.2% 3.5% 7.2% 2.66%1992 1.7% 2.3% 4.4% 1.40% 2.6% 3.6% 6.8% 2.15%1993 1.6% 1.9% 4.2% 1.26% 2.5% 3.0% 6.5% 1.96%1994 1.6% 2.2% 3.7% 1.28% 2.4% 3.3% 5.7% 1.98%1995 1.6% 2.1% 3.4% 1.33% 2.5% 3.2% 5.3% 2.04%1996 1.7% 2.0% 3.3% 1.42% 2.6% 3.1% 5.0% 2.17%1997 1.8% 1.9% 3.3% 1.52% 2.8% 2.9% 5.2% 2.33%1998 1.7% 1.8% 3.3% 1.46% 2.7% 2.8% 5.2% 2.25%1999 1.6% 1.9% 3.2% 1.31% 2.6% 3.0% 4.9% 2.06%2000 1.6% 1.6% 3.2% 1.38% 2.5% 2.5% 4.9% 2.14%2001 1.5% 1.6% 3.1% 1.35% 2.4% 2.5% 5.0% 2.08%2002 1.4% 1.5% 3.1% 1.25% 2.3% 2.4% 4.9% 1.99%2003 1.4% 1.9% 2.6% 1.16% 2.2% 3.0% 4.1% 1.85%2004 1.5% 1.6% 2.5% 1.38% 2.4% 2.5% 4.0% 2.19%2005 1.7% 1.4% 2.7% 1.57% 2.7% 2.2% 4.2% 2.50%2006 1.7% 1.2% 3.1% 1.53% 2.7% 2.0% 5.0% 2.43%2007 1.4% 1.1% 3.3% 1.20% 2.3% 1.8% 5.4% 1.94%2008 1.2% 1.1% 3.3% 0.92% 1.9% 1.8% 5.5% 1.50%2009 1.0% 1.7% 2.8% 0.70% 1.6% 2.8% 4.6% 1.15%2010 1.0% 1.7% 2.2% 0.80% 1.7% 2.8% 3.6% 1.31%2011 1.3% 1.5% 2.1% 1.15% 2.2% 2.4% 3.4% 1.87%2012 1.6% 1.3% 2.3% 1.45% 2.7% 2.2% 3.8% 2.38%2013 1.9% 1.3% 2.9% 1.61% 3.0% 2.1% 4.6% 2.64%2014 1.5% 1.1% 3.2% 1.21% 2.5% 1.9% 5.2% 1.97%2015 1.2% 0.9% 3.4% 0.93% 2.0% 1.5% 5.6% 1.53%2016 1.1% 1.1% 3.6% 0.78% 1.7% 1.8% 5.7% 1.28%
Note: Net benefi ts paid by taxable employers include regular unemployment benefi ts plus all state supplemental benefi t payments plus Alaska’s share of extended benefi t payments for taxable employers plus the net of benefi ts paid minus receipts for interstate wage combining.
Sources: Alaska Department of Labor and Workforce Development, Research and Analysis Section: Unemployment Insurance Financial Transaction Summary, ETA 2112 report to the U.S. Department of Labor; Quarterly Census of Employment and Wages (QCEW)

Page 12 Alaska Unemployment Insurance Actuarial Report 2016
Chapter 2
Claims, Claimants,and Benefi t Payments by Industry
Figure 2.1 Amount of UI Payments, Regular Benefi ts 2004 2016
Source: Alaska Department of Labor and Workforce Development, Research and Analysis Section
Regular benefi ts: The nation’sfundamental UI programCreated by the Employment Security Act of 1937, the regular benefi ts program was loosely modeled a er work separa on benefi t programs in Europe at the me.
In 2016 in Alaska, the unemployment insurance system covered 311,090 average jobs. In the same year, 43,017 individuals fi led for and collected at least one week of UI benefi ts. (See Figure 2.4.)
Average weekly claims in 2016 were up 7.7 percent from 2015, to 9,431.
Monetary eligibility Eligibility for regular benefi ts (revised 2009) requires a person to have earned at least $2,500 in wages in the base period with at least $250 earned outside the highest wage quarter of the base period.
A claimant’s base period is the fi rst four of the fi ve most recently completed quarters. While base period wages are directly related to a claimant’s actual wages over a given
period, they aren’t always iden cal. To compute benefi ts payable, base period wages are determined as follows:
• If 90 percent or more of wages are paid in one cal-endar quarter, base period wages are the sum of the remaining wages in the other three quarters mul plied by 10; or
• If less than 90 percent of wages are paid in one calen-dar quarter, base period wages are simply the wages during the base period.
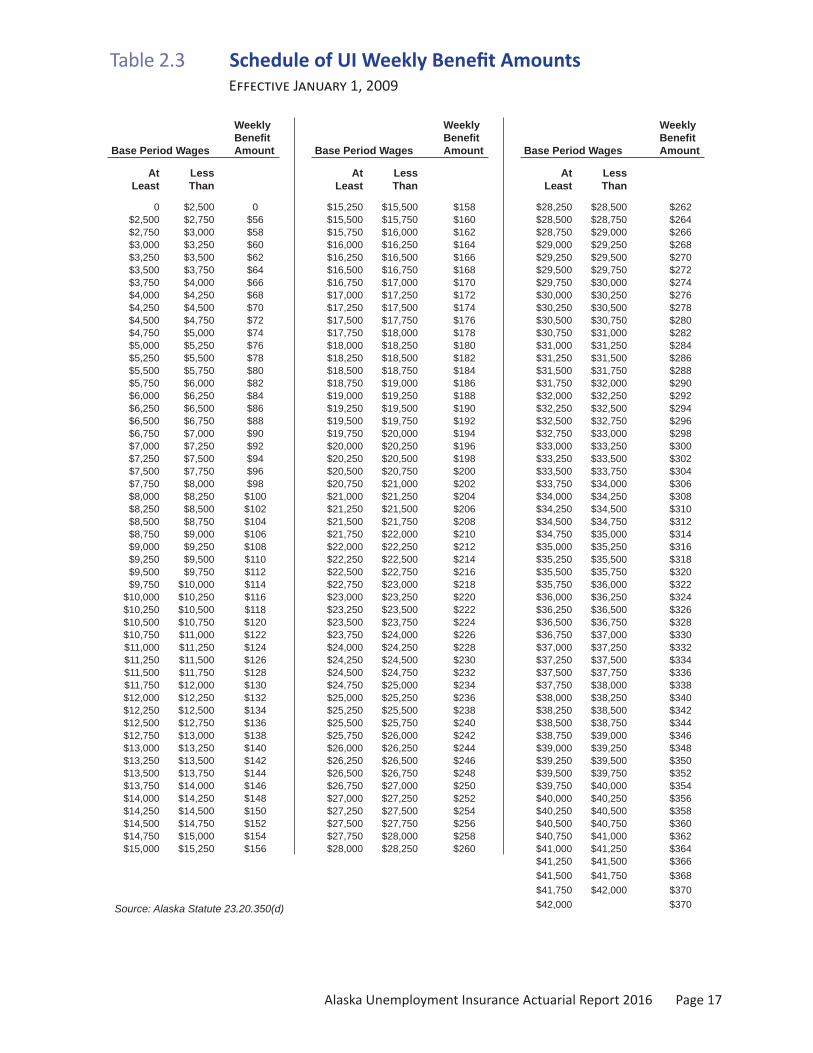
The benefi t schedule dictates the a weekly amount a claimant may receive, based on the base period wages. The minimum weekly benefi t amount (revised 2009) in the schedule is $56, which corresponds to $2,500 in base period wages and increases in $2 increments for each addi onal $250 in wages. The maximum weekly benefi t amount (in place since 2009) is $370 for base period wages of $41,750 or more. (See Table 2.3.)
The average weekly benefi t in 2016 was $258.83, and claimants were eligible for an average of 21.2 weeks of benefi ts. The average actual dura on was 11.6 weeks. Both the average for eligible dura on and actual dura on were up from 2015. (See Table 2.5.)
$0
$20 mil
$40 mil
$60 mil
$80 mil
$100 mil
$120 mil
$140 mil
$160 mil
Out of state
In state
2004 2005 2006 2007 2008 2009 2010 2011 2012 2013 2014 2015 2016

Alaska Unemployment Insurance Actuarial Report 2016 Page 13
Figure 2.2 Insured Unemployment Rate H L W , 1981 2016
Source: Alaska Department of Labor and Workforce Development, Research and Analysis Section
Claimants with childrenreceive additional allowanceAlaska is one of 13 states that provide addi onal benefi ts to UI claimants with dependents. The allowance increases the maximum amount of benefi ts payable because it is added to the basic weekly benefi t. Dependent benefi ts add the concept of need into what is fundamentally an insur-ance program.
In Alaska, the dependent allowance can exceed the base weekly benefi t amount for individuals earning less than $4,500 during their base period. Claimants are eligible to receive $24 per dependent per week up to a maximum of $72 (three children).
To qualify for dependent benefi ts, the child must be younger than 18 and be an unmarried child or stepchild of the claimant who is lawfully in the claimant’s physical cus-tody at the me of the claim or depends on the claimant for more than 50 percent of his or her support. A depen-dent may also be a legal ward of the claimant of any age who depends on the claimant for more than 50 percent of his or her support and is physically or mentally unable to work.
In 2016, the UI program paid $8 million in dependent benefi ts to roughly 15,500 people receiving regular UI benefi ts. These recipients accounted for 35.9 percent of all regular UI claimants. (See Table 2.12)
Duration depends on work stabilityThe length of me a person may claim benefi ts varies in each state, and in Alaska, it varies with each claimant. Alaska sets the poten al dura on for each claimant by dividing the amount of base period wages by the amount of wages in the highest quarter. The intent is to provide a dura on of benefi ts that refl ects the dura on of employ-ment — the higher the ra o, the more stable the earnings and therefore the higher the poten al dura on of benefi ts.
The poten al dura on of benefi ts is defi ned by a schedule in AS 23.20.350(e), and ranges from 16 weeks with a ra o of less than 1.50 to 26 weeks with a ra o of 3.50 or more. (See Table 2.4.) Claimants with a ra o of less than 1.50 have earned more than two-thirds of their wages in one quarter.
In Alaska’s seasonal economy, the amount paid to claim-ants in the late winter is frequently double the amount disbursed in late summer.
Benefi t duration shorterfor those who quit or were fi redAll states disqualify or postpone benefi ts for claimants who quit without good cause or are fi red. Forty-six states dis-qualify such claimants. To requalify for benefi ts, claimants in those states must obtain another job, work for a specifi c period, and then become unemployed again for a nondis-
9.54%9.16%
9.31% 8.38%9.04%
9.93% 9.14%7.67% 6.88%7.51%
7.63%8.65%
6.94%7.80%
7.39%7.51% 6.96%
6.60%6.97% 6.35%
6.24%6.45%
6.82%6.62% 6.14% 5.63% 4.99%
4.82%5.79%
7.30%7.08%
6.78%6.44% 5.92%
4.59%4.68%
5.19%5.12% 4.40%
4.35%5.12%
6.36%4.68% 3.85% 2.93%
3.57%4.52%4.45% 3.95%4.32% 3.74%
3.55%3.36%3.34%
3.48%3.37%
3.16%3.60%
3.76%3.32%
2.95%2.68%
2.39%2.64%
4.10%4.26% 3.78%
3.61%3.37%
2.96% 2.32%2.62%
0%
2%
4%
6%
8%
10%
12%
1981 1983 1985 1987 1989 1991 1993 1995 1997 1999 2001 2003 2005 2007 2009 2011 2013 2015

Page 14 Alaska Unemployment Insurance Actuarial Report 2016
Figure 2.3 UI Regular Benefi t Payments by Industry I -S O - -S C , 2016
Source: Alaska Department of Labor and Workforce Development, Research and Analysis Section
qualifying reason.
Alaska and two other states postpone or reduce benefi ts, or do both rather than disqualify. Claimants in Alaska who quit or are fi red must wait six weeks for benefi ts to begin, including the week wai ng pe-riod for all claimants. Their total benefi t is also reduced by three mes their weekly benefi t amount.
Alaska’s policy is the most lenient in the na on. The primary argument for the six-week wai ng period is that the disquali-fi ca on should be no longer than it takes the average person to fi nd work, and that a er six weeks, con nued unemployment is due to the lack of work rather than the original reason for leaving an employer.
About 22 percentdisbursed outside stateAlaska paid out $29.8 million in regular benefi ts to claimants living elsewhere in 2016, up from $27.5 million in 2015. (See Table 2.9.) Interstate claimants are people who earned wages in Alaska during their base period but lived out of state when benefi ts were paid.
Of the benefi ts sent outside Alaska in 2016, 44.3 percent went to the West Coast: California (19.8 percent), Wash-ington (17.6 percent), and Oregon (6.9 percent).
Figure 2.4 Claimants Receiving At Least One Week’s Benefi t Payment During Year
2003 2016
Source: Alaska Department of Labor and Workforce Development, Research and Analysis Section
0 $5 mil $10 mil $15 mil $20 mil $25 mil $30 mil
Agriculture, Forestry, Fishing, Hun ngMining, All
Oil and GasU li es
Construc onManufacturing, All
Food Paper Wood Other
TradeTransporta on & Warehousing
Informa onFinance and Insurance
Real Estate, Rental, LeasingProfessional and Technical Services
Management of CompaniesAdministra ve and Waste Services
Educa onal ServicesHealth Care and Social Assistance
Arts, Entertainment, Recrea onAccommoda on and Food Services
Other ServicesPublic Administra on
Unclassi ed
In state
Out of state
64,07161,544
53,053 51,597
47,77645,343
63,630
72,922 72,69669,224
63,643
49,826
42,138 43,017
2003 2004 2005 2006 2007 2008 2009 2010 2011 2012 2013 2014 2015 2016

Alaska Unemployment Insurance Actuarial Report 2016 Page 15
Table 2.1 Insured Unemployment 1977 2016
YearCovered
EmploymentInsured
Unemployment
InsuredUnemployment
Rate (IUR)Percent
1977 120,091 14,682 12.2%1978 144,445 13,421 9.3%1979 148,342 11,323 7.6%1980 150,004 11,167 7.4%1981 165,485 10,460 6.3%1982 180,666 11,111 6.2%1983 193,323 11,446 5.9%1984 202,183 11,907 5.9%1985 207,672 14,224 6.8%1986 197,829 16,620 8.4%1987 187,025 13,301 7.1%1988 191,039 10,485 5.5%1989 203,423 9,056 4.5%1990 214,644 11,170 5.2%1991 218,367 13,237 6.1%1992 221,795 13,880 6.3%1993 226,475 12,213 5.4%1994 223,455 13,554 6.1%1995 237,816 12,885 5.4%1996 239,746 13,120 5.5%1997 244,255 12,095 5.0%1998 250,251 12,140 4.9%1999 252,228 12,866 5.1%2000 254,310 12,290 4.8%2001 265,463 12,224 4.6%2002 270,525 13,980 5.2%2003 274,706 14,259 5.2%2004 279,151 13,471 4.8%2005 285,560 12,443 4.4%2006 291,179 11,649 4.0%2007 294,001 10,503 3.6%2008 298,443 10,995 3.7%2009 296,814 14,277 4.8%2010 299,311 13,896 4.6%2011 305,016 13,325 4.4%2012 311,059 12,520 4.0%2013 313,278 11,959 3.8%2014 315,332 10,659 3.4%2015 316,730 8,757 2.8%2016 311,090 9,431 3.0%
Notes: Insured unemployment is a weekly average of claimants derived from total weeks claimed in a calendar year divided by 52. Covered employment excludes the federal government.
Sources: Alaska Department of Labor and Workforce Development, Research and Analysis Section: Quarterly Census of Employment and Wages (QCEW); ETA 5-159 report to the U.S. Department of Labor, Line 201-10 and 201-11

Page 16 Alaska Unemployment Insurance Actuarial Report 2016
Table 2.2 UI Claimant Characteris cs 2016
Percentof Total
Percentof TotalNumber Number
Total Claimants 43,017 100.0% Occupation: Agriculature, Forestry, and Fishing 667 1.6%
Gender: Benchwork 138 0.3% Male 27,968 65.0% Clerical and Sales 5,309 12.3% Female 14,901 34.6% Machine Trades 1,148 2.7% Indeterminate 2 0 Processing 3,650 8.5% Did not answer 146 0.3% Professional, Technical, Managerial 5,210 12.1%
Service 5,685 13.2%Age: Structural Work 9,545 22.2% Less than 21 449 1.0% Miscellaneous and Unknown 11,665 27.1% 21 - 24 2,654 6.2% 25 - 34 12,138 28.2% Average Annual Earnings ($): 35 - 44 9,512 22.1% 0 - 9,999 5,447 12.7% 45 - 54 9,295 21.6% 10,000 - 19,999 8,332 19.4% 55 - 64 7,396 17.2% 20,000 - 29,999 7,626 17.7% 65 or over 1,573 3.7% 30,000 - 39,999 5,843 13.6%
40,000 - 49,999 4,065 9.4%Number of Dependents: 50,000 - 59,999 2,862 6.7% 0 27,590 64.1% 60,000 - 69,999 2,117 4.9% 1 6,555 15.2% 70,000 - 79,999 1,732 4.0% 2 5,038 11.7% 80,000 - 89,999 1,334 3.1% 3 or more 3,834 8.9% 90,000 + 3,659 8.5%
Ethnic Background: Geographic Location: Alaska Native or American Indian 10,014 23.3% Aleutians East Borough 79 0.2% Asian and Pacifi c Islander 4,081 9.5% Aleutians West Census Area 276 0.6% Black 2,166 5.0% Anchorage, Municipality 11,292 26.3% Hispanic 55 0.1% Bethel Census Area 1,248 2.9% White 24,221 56.3% Bristol Bay Borough 35 0.1% Other 1,391 3.2% Denali Borough 152 0.4% No Information 1,089 2.5% Dillingham Census Area 260 0.6%
Fairbanks North Star Borough 3,771 8.8%Industry: Haines Borough 153 0.4% Agriculture, Forestry, Fishing and Hunting 336 0.8% Hoonah-Angoon Census Area 170 0.4% Mining 3,788 8.8% Juneau, City and Borough 1,070 2.5% Oil and Gas 3,309 7.7% Kenai Peninsula Borough 3,289 7.6% Other Mining 479 1.1% Ketchikan Gateway Borough 649 1.5% Utilities 189 0.4% Kodiak Island Borough 778 1.8% Construction 7,395 17.2% Kusilvak Census Area 775 1.8% Manufacturing 5,548 12.9% Lake and Peninsula Borough 117 0.3% Food Products 5,006 11.6% Matanuska-Susitna Borough 5,627 13.1% Wood Products 83 0.2% Nome Census Area 665 1.5% Other Manufacturing 459 1.1% North Slope Borough 342 0.8% Trade 4,075 9.5% Northwest Arctic Borough 616 1.4% Transportation and Warehousing 2,370 5.5% Petersberg Census Area 127 0.3% Information 389 0.9% Prince of Wales-Hyder Census Area 536 1.2% Finance and Insurance 604 1.4% Sitka, City and Borough 275 0.6% Real Estate and Rental and Leasing 788 1.8% Skagway, Municipality 138 0.3% Professional and Technical Service 1,697 3.9% Southeast Fairbanks Census Area 419 1.0% Mangement of Companies 111 0.3% Valdez-Cordova Census Area 475 1.1% Administrative and Waste Services 2,073 4.8% Wrangell, City and Borough 102 0.2% Educational Services 797 1.9% Yakutat, City and Borough 37 0.1% Health Care and Social Assistance 3,088 7.2% Yukon-Koyukuk Census Area 561 1.3% Arts, Entertainment and Recreation 456 1.1% Alaska Area Unknown 0 0 Accommodation and Food Services 3,486 8.1% Other Services, except Public Admin 1,329 3.1% Public Administration 3,553 8.3% Total in state 34,034 79.1% Unclassifi ed/Unknown 945 2.2% Out of state 8,983 20.9%
Notes: Fishing excludes nearly all commercial fi sh harvesting employment.Percentages may not sum to 100 due to rounding.
Source: Alaska Department of Labor and Workforce Development, Research and Analysis Section: UI Claimant Characteristics Files
Alaska Unemployment Insurance Actuarial Report 2016 Page 17
Table 2.3 Schedule of UI Weekly Benefi t Amounts E J 1, 2009
Base Period Wages
WeeklyBenefi tAmount Base Period Wages
WeeklyBenefi tAmount Base Period Wages
WeeklyBenefi tAmount
AtLeast
LessThan
AtLeast
LessThan
AtLeast
LessThan
0 $2,500 0 $15,250 $15,500 $158 $28,250 $28,500 $262$2,500 $2,750 $56 $15,500 $15,750 $160 $28,500 $28,750 $264$2,750 $3,000 $58 $15,750 $16,000 $162 $28,750 $29,000 $266$3,000 $3,250 $60 $16,000 $16,250 $164 $29,000 $29,250 $268$3,250 $3,500 $62 $16,250 $16,500 $166 $29,250 $29,500 $270$3,500 $3,750 $64 $16,500 $16,750 $168 $29,500 $29,750 $272$3,750 $4,000 $66 $16,750 $17,000 $170 $29,750 $30,000 $274$4,000 $4,250 $68 $17,000 $17,250 $172 $30,000 $30,250 $276$4,250 $4,500 $70 $17,250 $17,500 $174 $30,250 $30,500 $278$4,500 $4,750 $72 $17,500 $17,750 $176 $30,500 $30,750 $280$4,750 $5,000 $74 $17,750 $18,000 $178 $30,750 $31,000 $282$5,000 $5,250 $76 $18,000 $18,250 $180 $31,000 $31,250 $284$5,250 $5,500 $78 $18,250 $18,500 $182 $31,250 $31,500 $286$5,500 $5,750 $80 $18,500 $18,750 $184 $31,500 $31,750 $288$5,750 $6,000 $82 $18,750 $19,000 $186 $31,750 $32,000 $290$6,000 $6,250 $84 $19,000 $19,250 $188 $32,000 $32,250 $292$6,250 $6,500 $86 $19,250 $19,500 $190 $32,250 $32,500 $294$6,500 $6,750 $88 $19,500 $19,750 $192 $32,500 $32,750 $296$6,750 $7,000 $90 $19,750 $20,000 $194 $32,750 $33,000 $298$7,000 $7,250 $92 $20,000 $20,250 $196 $33,000 $33,250 $300$7,250 $7,500 $94 $20,250 $20,500 $198 $33,250 $33,500 $302$7,500 $7,750 $96 $20,500 $20,750 $200 $33,500 $33,750 $304$7,750 $8,000 $98 $20,750 $21,000 $202 $33,750 $34,000 $306$8,000 $8,250 $100 $21,000 $21,250 $204 $34,000 $34,250 $308$8,250 $8,500 $102 $21,250 $21,500 $206 $34,250 $34,500 $310$8,500 $8,750 $104 $21,500 $21,750 $208 $34,500 $34,750 $312$8,750 $9,000 $106 $21,750 $22,000 $210 $34,750 $35,000 $314$9,000 $9,250 $108 $22,000 $22,250 $212 $35,000 $35,250 $316$9,250 $9,500 $110 $22,250 $22,500 $214 $35,250 $35,500 $318$9,500 $9,750 $112 $22,500 $22,750 $216 $35,500 $35,750 $320$9,750 $10,000 $114 $22,750 $23,000 $218 $35,750 $36,000 $322
$10,000 $10,250 $116 $23,000 $23,250 $220 $36,000 $36,250 $324$10,250 $10,500 $118 $23,250 $23,500 $222 $36,250 $36,500 $326$10,500 $10,750 $120 $23,500 $23,750 $224 $36,500 $36,750 $328$10,750 $11,000 $122 $23,750 $24,000 $226 $36,750 $37,000 $330$11,000 $11,250 $124 $24,000 $24,250 $228 $37,000 $37,250 $332$11,250 $11,500 $126 $24,250 $24,500 $230 $37,250 $37,500 $334$11,500 $11,750 $128 $24,500 $24,750 $232 $37,500 $37,750 $336$11,750 $12,000 $130 $24,750 $25,000 $234 $37,750 $38,000 $338$12,000 $12,250 $132 $25,000 $25,250 $236 $38,000 $38,250 $340$12,250 $12,500 $134 $25,250 $25,500 $238 $38,250 $38,500 $342$12,500 $12,750 $136 $25,500 $25,750 $240 $38,500 $38,750 $344$12,750 $13,000 $138 $25,750 $26,000 $242 $38,750 $39,000 $346$13,000 $13,250 $140 $26,000 $26,250 $244 $39,000 $39,250 $348$13,250 $13,500 $142 $26,250 $26,500 $246 $39,250 $39,500 $350$13,500 $13,750 $144 $26,500 $26,750 $248 $39,500 $39,750 $352$13,750 $14,000 $146 $26,750 $27,000 $250 $39,750 $40,000 $354$14,000 $14,250 $148 $27,000 $27,250 $252 $40,000 $40,250 $356$14,250 $14,500 $150 $27,250 $27,500 $254 $40,250 $40,500 $358$14,500 $14,750 $152 $27,500 $27,750 $256 $40,500 $40,750 $360$14,750 $15,000 $154 $27,750 $28,000 $258 $40,750 $41,000 $362$15,000 $15,250 $156 $28,000 $28,250 $260 $41,000 $41,250 $364
$41,250 $41,500 $366$41,500 $41,750 $368
Source: Alaska Statute 23.20.350(d)
$41,750 $42,000 $370$42,000 $370

Page 18 Alaska Unemployment Insurance Actuarial Report 2016
Table 2.4 Schedule of Weekly Benefi ts Dura on E O 1, 1980
Ratio of DurationBase Period Earnings of Benefi tsto High Quarter Earnings (in Weeks)
Less than 1.50 161.50-1.99 182.00-2.49 202.50-2.99 223.00-3.49 243.50 or more 26
Source: Alaska Statute 23.20.350(e)
Table 2.5 UI Regular Benefi ts 2005 2016
Average Duration in WeeksMaximum Weekly Benefi t Amount
Year Weeks Claimed
Numberof Final
Payments Potential ActualActual for Exhausts
Avg Weekly Benefi t
Benefi tsWithout
Dependents
Benefi tsWith
Dependents
2005 770,712 17,847 20.8 12.4 19.4 $193.91 $248 $3202006 714,443 16,069 20.8 11.6 19.2 $197.63 $248 $3202007 652,529 15,015 21.0 11.4 19.4 $200.09 $248 $3202008 678,301 15,736 21.0 12.3 19.6 $202.16 $248 $3202009 898,931 20,809 21.1 13.0 19.9 $241.12 $248 $3202010 907,657 25,653 20.9 12.7 19.5 $239.37 $370 $4422011 846,908 21,941 20.8 12.4 19.5 $241.92 $370 $4422012 835,609 20,771 20.9 11.9 19.6 $244.59 $370 $4422013 794,811 19,560 20.9 11.9 19.7 $250.04 $370 $4422014 703,193 16,398 20.8 11.5 20.8 $236.58 $370 $4422015 573,462 11,863 21.0 10.9 21.0 $248.82 $370 $4422016 604,889 12,354 21.2 11.6 21.5 $258.83 $370 $442
Notes: Payment data are for taxable and reimbursable benefi ts.Exhaustion: Those receiving payments for the maximum number of weeks available to them in a particular program.Dependents benefi t is $24 per dependent, to a maximum of three ($72).
Sources: Alaska Department of Labor and Workforce Development, Research and Analysis Section: ETA 5159 report to the U.S. Department of Labor; and Claimant Characteristics Report

Alaska Unemployment Insurance Actuarial Report 2016 Page 19
Table 2.6 Extended Benefi ts 2005 2016
Year
Number of Weeks Claimed
Number of Final
Payments
Average Weekly Benefi t
2005 33,585 1,199 $181.06 2006 0 0 $254.00 2007 0 0 $0 2008 27,065 1,172 $192.59 2009 141,499 6,877 $218.21 2010 182,948 8,237 $230.76 2011 87,681 3,930 $225.09 2012 28,571 475 $223.96 2013 11 1 $80.86 2014 0 0 N/A2015 0 0 N/A2016 0 0 N/A
Table 2.7 State Supplemental Benefi ts 2005 2016
Year
Number of Weeks Claimed
Number of Final
Payments
Average Weekly Benefi t
2005 1,165 73 $101.79 2006 0 0 $0 2007 0 0 $0 2008 846 52 $98.97 2009 2,766 201 $105.93 2010 2,316 93 $120.53 2011 1,115 40 $121.63 2012 528 0 $130.82 2013 29 0 $125.92 2014 0 0 N/A2015 0 0 N/A2016 19 0 N/A
Sources for Tables 2.6 and 2.7: Alaska Department of Labor and Workforce Development, Research and Analysis Section; and Claims and Payment Activities, ETA 5159 report to the U.S. Department of Labor
Page 20 Alaska Unemployment Insurance Actuarial Report 2016
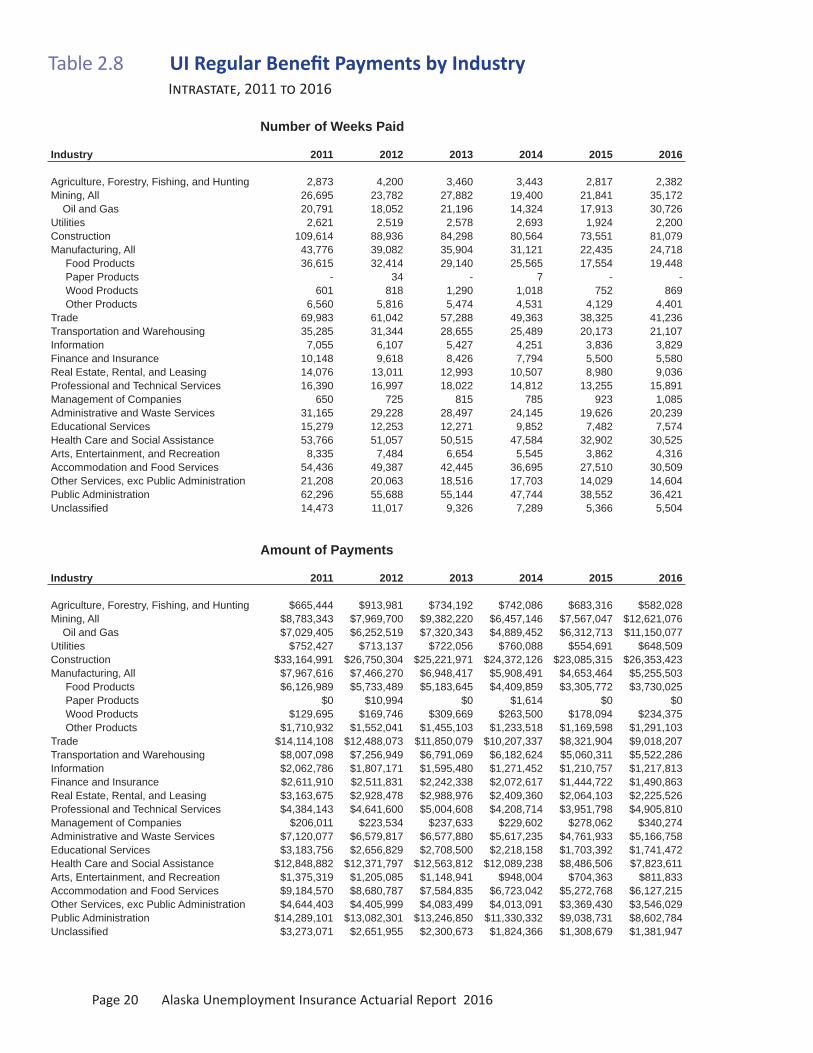
Table 2.8 UI Regular Benefi t Payments by Industry I , 2011 2016
Number of Weeks Paid
Industry 2011 2012 2013 2014 2015 2016
Agriculture, Forestry, Fishing, and Hunting 2,873 4,200 3,460 3,443 2,817 2,382 Mining, All 26,695 23,782 27,882 19,400 21,841 35,172 Oil and Gas 20,791 18,052 21,196 14,324 17,913 30,726 Utilities 2,621 2,519 2,578 2,693 1,924 2,200 Construction 109,614 88,936 84,298 80,564 73,551 81,079 Manufacturing, All 43,776 39,082 35,904 31,121 22,435 24,718 Food Products 36,615 32,414 29,140 25,565 17,554 19,448 Paper Products - 34 - 7 - - Wood Products 601 818 1,290 1,018 752 869 Other Products 6,560 5,816 5,474 4,531 4,129 4,401 Trade 69,983 61,042 57,288 49,363 38,325 41,236 Transportation and Warehousing 35,285 31,344 28,655 25,489 20,173 21,107 Information 7,055 6,107 5,427 4,251 3,836 3,829 Finance and Insurance 10,148 9,618 8,426 7,794 5,500 5,580 Real Estate, Rental, and Leasing 14,076 13,011 12,993 10,507 8,980 9,036 Professional and Technical Services 16,390 16,997 18,022 14,812 13,255 15,891 Management of Companies 650 725 815 785 923 1,085 Administrative and Waste Services 31,165 29,228 28,497 24,145 19,626 20,239 Educational Services 15,279 12,253 12,271 9,852 7,482 7,574 Health Care and Social Assistance 53,766 51,057 50,515 47,584 32,902 30,525 Arts, Entertainment, and Recreation 8,335 7,484 6,654 5,545 3,862 4,316 Accommodation and Food Services 54,436 49,387 42,445 36,695 27,510 30,509 Other Services, exc Public Administration 21,208 20,063 18,516 17,703 14,029 14,604 Public Administration 62,296 55,688 55,144 47,744 38,552 36,421 Unclassifi ed 14,473 11,017 9,326 7,289 5,366 5,504
Amount of Payments
Industry 2011 2012 2013 2014 2015 2016
Agriculture, Forestry, Fishing, and Hunting $665,444 $913,981 $734,192 $742,086 $683,316 $582,028 Mining, All $8,783,343 $7,969,700 $9,382,220 $6,457,146 $7,567,047 $12,621,076 Oil and Gas $7,029,405 $6,252,519 $7,320,343 $4,889,452 $6,312,713 $11,150,077 Utilities $752,427 $713,137 $722,056 $760,088 $554,691 $648,509 Construction $33,164,991 $26,750,304 $25,221,971 $24,372,126 $23,085,315 $26,353,423 Manufacturing, All $7,967,616 $7,466,270 $6,948,417 $5,908,491 $4,653,464 $5,255,503 Food Products $6,126,989 $5,733,489 $5,183,645 $4,409,859 $3,305,772 $3,730,025 Paper Products $0 $10,994 $0 $1,614 $0 $0 Wood Products $129,695 $169,746 $309,669 $263,500 $178,094 $234,375 Other Products $1,710,932 $1,552,041 $1,455,103 $1,233,518 $1,169,598 $1,291,103 Trade $14,114,108 $12,488,073 $11,850,079 $10,207,337 $8,321,904 $9,018,207 Transportation and Warehousing $8,007,098 $7,256,949 $6,791,069 $6,182,624 $5,060,311 $5,522,286 Information $2,062,786 $1,807,171 $1,595,480 $1,271,452 $1,210,757 $1,217,813 Finance and Insurance $2,611,910 $2,511,831 $2,242,338 $2,072,617 $1,444,722 $1,490,863 Real Estate, Rental, and Leasing $3,163,675 $2,928,478 $2,988,976 $2,409,360 $2,064,103 $2,225,526 Professional and Technical Services $4,384,143 $4,641,600 $5,004,608 $4,208,714 $3,951,798 $4,905,810 Management of Companies $206,011 $223,534 $237,633 $229,602 $278,062 $340,274 Administrative and Waste Services $7,120,077 $6,579,817 $6,577,880 $5,617,235 $4,761,933 $5,166,758 Educational Services $3,183,756 $2,656,829 $2,708,500 $2,218,158 $1,703,392 $1,741,472 Health Care and Social Assistance $12,848,882 $12,371,797 $12,563,812 $12,089,238 $8,486,506 $7,823,611 Arts, Entertainment, and Recreation $1,375,319 $1,205,085 $1,148,941 $948,004 $704,363 $811,833 Accommodation and Food Services $9,184,570 $8,680,787 $7,584,835 $6,723,042 $5,272,768 $6,127,215 Other Services, exc Public Administration $4,644,403 $4,405,999 $4,083,499 $4,013,091 $3,369,430 $3,546,029 Public Administration $14,289,101 $13,082,301 $13,246,850 $11,330,332 $9,038,731 $8,602,784 Unclassifi ed $3,273,071 $2,651,955 $2,300,673 $1,824,366 $1,308,679 $1,381,947

Alaska Unemployment Insurance Actuarial Report 2016 Page 21
Table 2.8 (cont.) UI Regular Benefi t Payments by Industry I , 2011 2016
Average Weekly Payment
Industry 2011 2012 2013 2014 2015 2016
Agriculture, Forestry, Fishing, and Hunting $231.62 $217.61 $212.19 $215.53 $242.57 $244.34Mining, All $329.03 $335.11 $336.50 $332.84 $346.46 $358.84 Oil and Gas $338.10 $346.36 $345.36 $341.35 $352.41 $362.89Utilities $287.08 $283.10 $280.08 $282.25 $288.30 $294.78Construction $302.56 $300.78 $299.20 $302.52 $313.87 $325.03Manufacturing, All $182.01 $191.04 $193.53 $189.86 $207.42 $212.62 Food Products $167.34 $176.88 $177.89 $172.50 $188.32 $191.79 Paper Products n/a $323.35 n/a $230.57 n/a n/a Wood Products $215.80 $207.51 $240.05 $258.84 $236.83 $269.71 Other Products $260.81 $266.86 $265.82 $272.24 $283.26 $293.37Trade $201.68 $204.58 $206.85 $206.78 $217.14 $218.70Transportation and Warehousing $226.93 $231.53 $236.99 $242.56 $250.85 $261.63Information $292.39 $295.92 $293.99 $299.09 $315.63 $318.05Finance and Insurance $257.38 $261.16 $266.12 $265.92 $262.68 $267.18Real Estate, Rental, and Leasing $224.76 $225.08 $230.05 $229.31 $229.86 $246.30Professional and Technical Services $267.49 $273.08 $277.69 $284.14 $298.14 $308.72Management of Companies $316.94 $308.32 $291.57 $292.49 $301.26 $313.62Administrative and Waste Services $228.46 $225.12 $230.83 $232.65 $242.63 $255.29Educational Services $208.37 $216.83 $220.72 $225.15 $227.67 $229.93Health Care and Social Assistance $238.98 $242.31 $248.71 $254.06 $257.93 $256.30Arts, Entertainment, and Recreation $165.01 $161.02 $172.67 $170.97 $182.38 $188.10Accommodation and Food Services $168.72 $175.77 $178.70 $183.21 $191.67 $200.83Other Services, exc Public Administration $218.99 $219.61 $220.54 $226.69 $240.18 $242.81Public Administration $229.37 $234.92 $240.22 $237.31 $234.46 $236.20Unclassifi ed $226.15 $240.71 $246.69 $250.29 $243.88 $251.08
Notes:Payment data include taxable and reimbursable. Fishing excludes nearly all commercial fi sh harvesting employment.Some line values are subsets of another line, for example: Mining and Manufacturing.
Source: Alaska Department of Labor and Workforce Development, Research and Analysis Section: Claimant Characteristics Report

Page 22 Alaska Unemployment Insurance Actuarial Report 2016
Table 2.9 UI Regular Benefi t Payments by Industry I , 2011 2016
Number of Weeks Paid
Industry 2011 2012 2013 2014 2015 2016
Agriculture, Forestry, Fishing, and Hunting 1,957 3,202 3,708 2,924 2,252 1,054 Mining, All 7,409 7,549 7,825 5,896 6,682 12,733 Oil and Gas 5,851 5,583 4,822 3,604 5,513 11,396 Utilities 399 292 399 602 310 285 Construction 13,349 10,955 9,455 8,734 8,987 8,436 Manufacturing, All 54,295 52,675 49,327 46,235 37,444 36,737 Food Products 52,643 51,344 48,233 45,256 36,797 35,789 Paper Products - - - - - - Wood Products 160 110 167 121 63 109 Other Products 1,492 1,221 927 858 584 839 Trade 11,509 10,920 10,013 7,899 5,255 4,743 Transportation and Warehousing 9,482 8,198 7,456 6,479 5,121 4,872 Information 1,842 1,319 1,341 1,001 890 864 Finance and Insurance 2,486 2,387 2,239 1,707 1,392 1,111 Real Estate, Rental, and Leasing 1,436 1,220 1,358 919 699 823 Professional and Technical Services 3,928 4,515 4,811 3,996 3,652 4,447 Management of Companies 54 144 99 73 144 85 Administrative and Waste Services 5,682 4,937 4,906 3,767 3,212 3,757 Educational Services 3,491 3,175 2,701 2,266 1,644 1,364 Health Care and Social Assistance 10,758 10,576 11,262 8,463 5,509 4,815 Arts, Entertainment, and Recreation 1,683 1,278 1,109 944 828 885 Accommodation and Food Services 13,589 11,807 11,901 9,206 6,477 6,447 Other Services, exc Public Administration 2,328 2,407 2,268 1,577 1,623 1,422 Public Administration 9,569 8,792 8,608 7,871 5,720 5,608 Unclassifi ed 10,112 9,253 8,890 6,437 4,736 4,334
Amount of Payments
Industry 2011 2012 2013 2014 2015 2016
Agriculture, Forestry, Fishing, and Hunting $522,929 $934,651 $1,162,798 $943,273 $730,536 $326,916 Mining, All $2,526,358 $2,629,984 $2,800,781 $2,102,534 $2,446,886 $4,737,485 Oil and Gas $2,050,860 $1,997,036 $1,746,288 $1,300,661 $2,044,505 $4,270,451 Utilities $132,710 $97,100 $128,071 $193,790 $106,463 $103,154 Construction $4,231,271 $3,498,430 $3,069,328 $2,916,271 $3,118,277 $2,923,099 Manufacturing, All $10,698,872 $10,671,231 $10,054,803 $9,582,217 $8,057,267 $8,527,482 Food Products $10,248,054 $10,291,418 $9,743,895 $9,285,941 $7,850,353 $8,200,832 Paper Products $0 $0 $0 $0 $0 $0 Wood Products $33,929 $24,734 $42,042 $39,932 $21,366 $30,649 Other Products $416,889 $355,079 $268,866 $256,344 $185,548 $296,001 Trade $2,508,165 $2,596,131 $2,456,902 $1,967,599 $1,359,043 $1,269,223 Transportation and Warehousing $2,426,048 $2,094,850 $1,884,514 $1,749,143 $1,386,835 $1,421,534 Information $561,513 $392,775 $395,491 $338,733 $314,991 $281,103 Finance and Insurance $759,074 $723,015 $706,127 $526,534 $426,026 $368,363 Real Estate, Rental, and Leasing $384,614 $342,691 $371,659 $256,995 $198,259 $252,466 Professional and Technical Services $1,172,352 $1,394,183 $1,507,130 $1,247,065 $1,166,439 $1,499,145 Management of Companies $18,980 $47,424 $34,546 $28,086 $46,316 $28,715 Administrative and Waste Services $1,485,578 $1,307,278 $1,278,238 $1,007,525 $891,754 $1,144,121 Educational Services $929,239 $884,665 $743,890 $621,593 $470,393 $397,332 Health Care and Social Assistance $2,953,711 $3,045,771 $3,305,962 $2,532,610 $1,667,887 $1,471,575 Arts, Entertainment, and Recreation $306,728 $228,607 $215,333 $208,989 $197,033 $192,773 Accommodation and Food Services $2,369,058 $2,171,521 $2,307,714 $1,851,113 $1,343,869 $1,500,372 Other Services, exc Public Administration $574,279 $627,221 $584,993 $435,557 $484,149 $455,152 Public Administration $2,734,466 $2,550,975 $2,577,223 $2,436,642 $1,793,821 $1,745,317 Unclassifi ed $2,365,639 $2,191,454 $2,201,002 $1,632,662 $1,299,809 $1,184,592

Alaska Unemployment Insurance Actuarial Report 2016 Page 23
Table 2.9 (cont.) UI Regular Benefi t Payments by Industry I , 2011 2016
Average Weekly Payment
Industry 2011 2012 2013 2014 2015 2016
Agriculture, Forestry, Fishing, and Hunting $267.21 $291.90 $313.59 $322.60 $324.39 $310.17Mining, All $340.99 $348.39 $357.93 $356.60 $366.19 $372.06 Oil and Gas $350.51 $357.70 $362.15 $360.89 $370.85 $374.73Utilities $332.61 $332.53 $320.98 $321.91 $343.43 $361.94Construction $316.97 $319.35 $324.62 $333.90 $346.98 $346.50Manufacturing, All $197.05 $202.59 $203.84 $207.25 $215.18 $232.12 Food Products $194.67 $200.44 $202.02 $205.19 $213.34 $229.14 Paper Products n/a n/a n/a n/a n/a n/a Wood Products $212.06 $224.85 $251.75 $330.02 $339.14 $281.18 Other Products $279.42 $290.81 $290.04 $298.77 $317.72 $352.80Trade $217.93 $237.74 $245.37 $249.09 $258.62 $267.60Transportation and Warehousing $255.86 $255.53 $252.75 $269.97 $270.81 $291.78Information $304.84 $297.78 $294.92 $338.39 $353.92 $325.35Finance and Insurance $305.34 $302.90 $315.38 $308.46 $306.05 $331.56Real Estate, Rental, and Leasing $267.84 $280.89 $273.68 $279.65 $283.63 $306.76Professional and Technical Services $298.46 $308.79 $313.27 $312.08 $319.40 $337.11Management of Companies $351.48 $329.33 $348.95 $384.74 $321.64 $337.82Administrative and Waste Services $261.45 $264.79 $260.55 $267.46 $277.63 $304.53Educational Services $266.18 $278.63 $275.41 $274.31 $286.13 $291.30Health Care and Social Assistance $274.56 $287.99 $293.55 $299.26 $302.76 $305.62Arts, Entertainment, and Recreation $182.25 $178.88 $194.17 $221.39 $237.96 $217.82Accommodation and Food Services $174.34 $183.92 $193.91 $201.08 $207.48 $232.72Other Services, exc Public Administration $246.68 $260.58 $257.93 $276.19 $298.30 $320.08Public Administration $285.76 $290.15 $299.40 $309.57 $313.61 $311.22Unclassifi ed $233.94 $236.84 $247.58 $253.64 $274.45 $273.33
Notes:Payment data include taxable and reimbursable. Fishing excludes nearly all commercial fi sh harvesting employment.Some line values are subsets of another line, for example: Mining and Manufacturing.
Source: Alaska Department of Labor and Workforce Development, Research and Analysis Section: Claimant Characteristics Report

Page 24 Alaska Unemployment Insurance Actuarial Report 2016
Table 2.10 UI Regular Benefi t Payments by Industry I I T , 2011 2016
Number of Weeks Paid
Industry 2011 2012 2013 2014 2015 2016
Agriculture, Forestry, Fishing, and Hunting 4,830 7,402 7,168 6,367 5,069 3,436 Mining, All 34,104 31,331 35,707 25,296 28,523 47,905 Oil and Gas 26,642 23,635 26,018 17,928 23,426 42,122 Utilities 3,020 2,811 2,977 3,295 2,234 2,485 Construction 122,963 99,891 93,753 89,298 82,538 89,515 Manufacturing, All 98,071 91,757 85,231 77,356 59,879 61,455 Food Products 89,258 83,758 77,373 70,821 54,351 55,237 Paper Products - 34 - 7 - - Wood Products 761 928 1,457 1,139 815 978 Other Products 8,052 7,037 6,401 5,389 4,713 5,240 Trade 81,492 71,962 67,301 57,262 43,580 45,979 Transportation and Warehousing 44,767 39,542 36,111 31,968 25,294 25,979 Information 8,897 7,426 6,768 5,252 4,726 4,693 Finance and Insurance 12,634 12,005 10,665 9,501 6,892 6,691 Real Estate, Rental, and Leasing 15,512 14,231 14,351 11,426 9,679 9,859 Professional and Technical Services 20,318 21,512 22,833 18,808 16,907 20,338 Management of Companies 704 869 914 858 1,067 1,170 Administrative and Waste Services 36,847 34,165 33,403 27,912 22,838 23,996 Educational Services 18,770 15,428 14,972 12,118 9,126 8,938 Health Care and Social Assistance 64,524 61,633 61,777 56,047 38,411 35,340 Arts, Entertainment, and Recreation 10,018 8,762 7,763 6,489 4,690 5,201 Accommodation and Food Services 68,025 61,194 54,346 45,901 33,987 36,956 Other Services, exc Public Administration 23,536 22,470 20,784 19,280 15,652 16,026 Public Administration 71,865 64,480 63,752 55,615 44,272 42,029 Unclassifi ed 24,670 20,806 18,472 13,967 10,313 10,118
Amount of Payments
Industry 2011 2012 2013 2014 2015 2016
Agriculture, Forestry, Fishing, and Hunting $1,188,373 $1,848,632 $1,896,990 $1,685,359 $1,413,852 $908,944 Mining, All $11,309,701 $10,599,684 $12,183,001 $8,559,680 $10,013,933 $17,358,561 Oil and Gas $9,080,265 $8,249,555 $9,066,631 $6,190,113 $8,357,218 $15,420,528 Utilities $885,137 $810,237 $850,127 $953,878 $661,154 $751,663 Construction $37,396,262 $30,248,734 $28,291,299 $27,288,397 $26,203,592 $29,276,522 Manufacturing, All $18,666,488 $18,137,501 $17,003,220 $15,490,708 $12,710,731 $13,782,985 Food Products $16,375,043 $16,024,907 $14,927,540 $13,695,800 $11,156,125 $11,930,857 Paper Products $0 $10,994 $0 $1,614 $0 $0 Wood Products $163,624 $194,480 $351,711 $303,432 $199,460 $265,024 Other Products $2,127,821 $1,907,120 $1,723,969 $1,489,862 $1,355,146 $1,587,104 Trade $16,622,273 $15,084,204 $14,306,981 $12,174,936 $9,680,947 $10,287,430 Transportation and Warehousing $10,433,146 $9,351,799 $8,675,583 $7,931,767 $6,447,146 $6,943,820 Information $2,624,299 $2,199,946 $1,990,971 $1,610,185 $1,525,748 $1,498,916 Finance and Insurance $3,370,984 $3,234,846 $2,948,465 $2,599,151 $1,870,748 $1,859,226 Real Estate, Rental, and Leasing $3,548,289 $3,271,169 $3,360,635 $2,666,355 $2,262,362 $2,477,992 Professional and Technical Services $5,556,495 $6,035,783 $6,511,738 $5,455,779 $5,118,237 $6,404,955 Management of Companies $224,991 $270,958 $272,179 $257,688 $324,378 $368,989 Administrative and Waste Services $8,605,655 $7,887,095 $7,856,118 $6,624,760 $5,653,687 $6,310,879 Educational Services $4,112,995 $3,541,494 $3,452,390 $2,839,751 $2,173,785 $2,138,804 Health Care and Social Assistance $15,802,593 $15,417,568 $15,869,774 $14,621,848 $10,154,393 $9,295,186 Arts, Entertainment, and Recreation $1,682,047 $1,433,692 $1,364,274 $1,156,993 $901,396 $1,004,606 Accommodation and Food Services $11,553,628 $10,852,308 $9,892,549 $8,574,155 $6,616,637 $7,627,587 Other Services, exc Public Administration $5,218,682 $5,033,220 $4,668,492 $4,448,648 $3,853,579 $4,001,181 Public Administration $17,023,567 $15,633,276 $15,824,073 $13,766,974 $10,832,552 $10,348,101 Unclassifi ed $5,652,876 $4,941,527 $4,540,221 $3,506,267 $2,683,091 $2,665,737

Alaska Unemployment Insurance Actuarial Report 2016 Page 25
Table 2.10 (cont.) UI Regular Benefi t Payments by Industry I I T , 2011 2016
Average Weekly Payment
Industry 2011 2012 2013 2014 2015 2016
Agriculture, Forestry, Fishing, and Hunting $246.04 $249.75 $264.65 $264.70 $278.92 $264.54Mining, All $331.62 $338.31 $341.19 $338.38 $351.08 $362.35 Oil and Gas $340.83 $349.04 $348.48 $345.28 $356.75 $366.09Utilities $293.09 $288.24 $285.56 $289.49 $295.95 $302.48Construction $304.13 $302.82 $301.76 $305.59 $317.47 $327.06Manufacturing, All $190.34 $197.67 $199.50 $200.25 $212.27 $224.28 Food Products $183.46 $191.32 $192.93 $193.39 $205.26 $215.99 Paper Products n/a $323.35 n/a $230.57 n/a n/a Wood Products $215.01 $209.57 $241.39 $266.40 $244.74 $270.99 Other Products $264.26 $271.01 $269.33 $276.46 $287.53 $302.88Trade $203.97 $209.61 $212.58 $212.62 $222.14 $223.74Transportation and Warehousing $233.05 $236.50 $240.25 $248.12 $254.89 $267.29Information $294.96 $296.25 $294.17 $306.59 $322.84 $319.39Finance and Insurance $266.82 $269.46 $276.46 $273.57 $271.44 $277.87Real Estate, Rental, and Leasing $228.74 $229.86 $234.17 $233.36 $233.74 $251.34Professional and Technical Services $273.48 $280.58 $285.19 $290.08 $302.73 $314.93Management of Companies $319.59 $311.80 $297.79 $300.34 $304.01 $315.38Administrative and Waste Services $233.55 $230.85 $235.19 $237.34 $247.56 $263.00Educational Services $219.13 $229.55 $230.59 $234.34 $238.20 $239.29Health Care and Social Assistance $244.91 $250.15 $256.89 $260.89 $264.36 $263.02Arts, Entertainment, and Recreation $167.90 $163.63 $175.74 $178.30 $192.20 $193.16Accommodation and Food Services $169.84 $177.34 $182.03 $186.80 $194.68 $206.40Other Services, exc Public Administration $221.73 $224.00 $224.62 $230.74 $246.20 $249.67Public Administration $236.88 $242.45 $248.21 $247.54 $244.68 $246.21Unclassifi ed $229.14 $237.50 $245.79 $251.04 $260.17 $263.46
Notes:Payment data include taxable and reimbursable. Fishing excludes nearly all commercial fi sh harvesting employment.Some line values are subsets of another line, for example: Mining and Manufacturing.
Source: Alaska Department of Labor and Workforce Development, Research and Analysis Section: Claimant Characteristics Report

Page 26 Alaska Unemployment Insurance Actuarial Report 2016
Table 2.11 UI Regular Benefi t Payments by Borough/Census Area 2016
Borough/Census Area Regular UIExtendedBenefi ts
State Supp
Benefi ts All ProgramsTotal
Aleutians East Borough $437,235 $0 $0 $437,235Aleutians West Census Area $488,189 $0 $0 $488,189Anchorage, Municipality $31,907,036 $0 $0 $31,907,036Bethel Census Area $5,853,552 $0 $0 $5,853,552Bristol Bay Borough $70,942 $0 $0 $70,942Denali Borough $484,791 $0 $0 $484,791Dillingham Census Area $698,788 $0 $0 $698,788Fairbanks North Star Borough $12,208,646 $0 $0 $12,208,646Haines Borough $438,400 $0 $0 $438,400Hoonah-Angoon Census Area $455,314 $0 $0 $455,314Juneau, City and Borough $2,243,507 $0 $0 $2,243,507Kenai Peninsula Borough $10,567,353 $0 $0 $10,567,353Ketchikan Gateway Borough $1,347,622 $0 $0 $1,347,622Kodiak Island Borough $1,745,515 $0 $0 $1,745,515Kusilvak Census Area $1,824,358 $0 $0 $1,824,358Lake and Peninsula Borough $343,489 $0 $0 $343,489Matanuska-Susitna Borough $14,738,415 $0 $0 $14,738,421Nome Census Area $1,946,295 $0 $0 $1,946,295North Slope Borough $1,054,833 $0 $0 $1,054,833Northwest Arctic Borough $1,858,577 $0 $0 $1,858,577Petersburg Census Area $321,223 $0 $0 $321,223Prince of Wales-Hyder Census Area $1,421,081 $0 $0 $1,421,081Sitka, City and Borough $662,530 $0 $0 $662,530Skagway, Municipality $320,425 $0 $0 $320,425Southeast Fairbanks Census Area $1,440,446 $0 $0 $1,440,446Valdez-Cordova Census Area $1,305,057 $0 $0 $1,305,057Wrangell, City and Borough $280,560 $0 $0 $280,560Yakutat, City and Borough $106,448 $0 $0 $106,448Yukon-Koyukuk Census Area $1,428,373 $0 $0 $1,428,373Area unknown $0 $0 $0 $0
Source: Alaska Department of Labor and Workforce Development, Research and Analysis Section: Claimant Characteristics File

Alaska Unemployment Insurance Actuarial Report 2016 Page 27
Table 2.12 Claimants With Dependents 2006 2016
Year
Number of Claimants with
DependentsAll Reg UI Claimants
PercentClaimants with
Dependents
WeeksCompensated
with DependentsAll Weeks
Compensated
Percent WeeksCompensated
with Dependents
Amount ofDependent
Benefi ts
2006 20,437 51,597 39.6% 245,339 598,796 41.0% $11,050,2962007 18,589 47,776 38.9% 217,065 542,965 40.0% $9,692,6642008 17,751 45,343 39.1% 220,911 556,108 39.7% $9,880,7522009 21,059 58,369 36.1% 277,671 755,797 36.7% $12,146,1362010 22,635 63,551 35.6% 295,842 806,017 36.7% $12,890,4722011 22,157 61,449 36.1% 285,021 763,482 37.3% $12,435,4802012 20,871 57,532 36.3% 254,922 681,872 37.4% $11,166,6002013 20,201 55,265 36.6% 248,314 657,650 37.8% $10,886,4242014 18,254 49,826 36.6% 217,023 574,016 37.8% $9,563,8322015 15,301 42,138 36.3% 171,310 461,162 37.1% $7,577,8082016 15,427 43,017 35.9% 183,047 498,109 36.7% $8,055,648
Notes: The allowance is $24.00 per dependent per week, with a maximum of $72.00.Data are for state regular UI program only.
Source: Alaska Department of Labor and Workforce Development, Research and Analysis Section: Annual Claimant Characteristics Report

Page 28 Alaska Unemployment Insurance Actuarial Report 2016
Table 2.13 Average Weekly Percentage of Unemployed Receiving Benefi ts 2016
Average Weekly
Unemployed
Average Weeks
Compensated
Compensated as Percent of Unemployed RankState
Alabama 129,525 16,364 12.6% 46Alaska 24,125 9,415 39.0% 4Arizona 175,250 23,128 13.2 % 44Arkansas 53,725 12,009 22.4% 28California 1,032,325 328,693 31.8% 12Colorado 94,850 24,377 25.7% 20Connecticut 100,150 38,716 38.7% 5Delaware 20,650 5,536 26.8% 18Dist. of Columbia 23,950 6,936 29.0% 16Florida 471,875 32,712 6.9% 52Georgia 259,175 24,399 9.4% 50Hawaii 21,675 6,084 28.1% 17Idaho 30,575 6,428 21.0% 31Illinois 391,950 102,211 26.1% 19Indiana 152,500 22,614 14.8% 41Iowa 65,700 22,073 33.6% 8Kansas 61,175 10,870 17.8% 36Kentucky 101,600 20,485 20.2% 32Louisiana 132,250 20,241 15.3% 40Maine 25,775 6,323 24.5% 24Maryland 139,025 31,785 22.9% 27Massachusetts 136,750 60,139 44.0% 2Michigan 230,475 55,253 24.0% 25Minnesota 117,100 37,654 32.2% 11Mississippi 75,925 8,874 11.7% 48Missouri 142,525 22,082 15.5% 39Montana 21,825 6,875 31.5% 13Nebraska 32,075 4,393 13.7% 43Nevada 83,475 19,213 23.0% 26New Hampshire 20,825 3,701 17.8% 35New Jersey 221,775 94,007 42.4% 3New Mexico 59,850 10,944 18.3% 34New York 465,925 140,660 30.2% 14North Carolina 248,200 17,337 7.0% 51North Dakota 12,825 7,107 55.4% 1Ohio 284,050 52,958 18.6% 33Oklahoma 87,950 19,267 21.9% 29Oregon 100,150 25,066 25.0% 21Pennsylvania 350,300 115,851 33.1% 9Puerto Rico 133,325 20,984 15.7% 38Rhode Island 29,525 8,701 29.5% 15South Carolina 116,750 13,712 11.7% 47South Dakota 12,525 1,614 12.9% 45Tennessee 145,925 16,943 11.6% 49Texas 611,050 150,914 24.7% 23Utah 52,425 8,873 16.9% 37Vermont 11,150 4,283 38.4% 6Virginia 167,250 24,620 14.7% 42Washington 203,075 44,383 21.9% 30West Virginia 47,300 15,455 32.7% 10Wisconsin 133,050 33,008 24.8% 22Wyoming 15,725 5,642 35.9% 7
United States 7,751,250 1,822,456 23.5%
Source: Alaska Department of Labor and Workforce Development, Research and Analysis Section UI Data Summary, Quarters 1-4, 2016, Produced by the U.S. Department of Labor

Alaska Unemployment Insurance Actuarial Report 2016 Page 29
Chapter 3
UI Covered Employment and Wages
Figure 3.1Figure 3.1 Employment by Type of UI Coverage Employment by Type of UI Coverage 1981 2016
Source: Alaska Department of Labor and Workforce Development, Research and Analysis Section
98.2 percent of workers coveredby unemployment insuranceState and federal unemployment insurance programs cov-ered an average of 326,280 workers in Alaska in 2016 — 98.2 percent of all nonagricultural wage and salary work-ers. (See Table 3.1 and Figure 3.1.) State programs covered 93.7 percent of Alaska’s workers, and federal programs covered 4.6 percent.
The remaining 1.8 percent of workers not covered by UI insurance includes full-commission salespeople, elected and appointed offi cials, and unpaid family workers. Fisher-men who work on a share basis are also excluded from coverage. As of 2006, real estate employment is also not covered.
Most employers pay UI taxes In Alaska, most employers pay taxes each quarter on the “taxable wages” of their employees, based on assigned yearly tax rates. However, a few select employers, such as nonprofi t organiza ons and state and local government
agencies, exercise their op on to reimburse the state di-rectly for any UI benefi ts paid to their former employees.
Reimbursable employment accounted for roughly one-fi h of covered employment in 2016, or 22.8 percent. (See Table 3.2.)
Covered employment downAverage monthly covered employment, which excludes the federal government but includes reimbursable employers, declined by 5,668 jobs — or -1.8 percent — from 316,758 in 2015 to 311,090 in 2016.
Although health care employment con nued to grow in 2016 and a few industries remained fl at, most lost jobs in 2016. The largest losses were in oil and gas, construc on, and state government. Other notable declines included manufacturing, trade, and professional/technical services. (See Table 3.2.)
Total covered wages declined Total covered wages declined by $690.9 million (-4.1 per-
0
50,000
100,000
150,000
200,000
250,000
300,000
350,000
400,000
Not coveredFederal UIState UI
198119821983198419851986198719881989199019911992199319941995199619971998199920002001200220032004200520062007200820092010201120122013201420152016

Page 30 Alaska Unemployment Insurance Actuarial Report 2016
Figure 3.2 Average Monthly Covered Employment 2004 2016
Source: Alaska Department of Labor and Workforce Development, Research and Analysis Section
cent) in 2016, to just over $16.3 billion. The private sector accounts for $694.4 million of the wage decline and $12.2 million was in state government. Local government wages grew by $15.7 million.
The majority of the decline came from mining, a result of job losses in the oil and gas industry. Those wages fell by $468 million. (See Table 3.3 and Figure 3.3.)
Meanwhile, taxable wages declined by $163 million (-2.0 percent).
Average wages also decreasedOn average, yearly wages decreased by $1,242 in 2016, or -2.3 percent, to $52,452.
By industry, mining’s average annual wage was highest at $128,249. At the low end of the spectrum was the arts, entertainment, and recrea on industry at an average of $21,641.
As a whole, public sector wages grew. State government wages grew by 3.7 percent, and local government wages declined -0.3 percent. Their average wages were $59,906 and $48,793, respec vely. (See Table 3.6.)
5,000
10,000
15,000
20,000
25,000
30,000
35,000
40,000
45,000
50,000Average Number of Jobs
MiningManufacturing
Construc on Fed Gov
State Gov
Local Gov
Health Care / Social AssistanceTrade
2004 2005 2006 2007 2008 2009 2010 2011 2012 2013 2014 2015 2016

Alaska Unemployment Insurance Actuarial Report 2016 Page 31
Figure 3.3 Total Covered Wages 2004 2016
Year
Total Nonagricultural
Wage and Salary Employment
State UI Taxable and
Reimbursable Employment
Percent of Total
Alaska Federal Government Employment
Percent of Total
Noncovered Employment
Percent of Total
2003 296,860 274,706 92.5% 17,105 5.8% 5,049 1.7%2004 301,466 279,151 92.6% 17,175 5.7% 5,140 1.7%2005 307,847 285,560 92.8% 16,977 5.5% 5,310 1.7%2006 314,338 291,179 92.6% 16,698 5.3% 6,461 2.1%2007 317,216 294,001 92.7% 16,806 5.3% 6,410 2.0%2008 321,765 298,443 92.8% 16,897 5.3% 6,425 2.0%2009 320,342 296,814 92.7% 17,064 5.3% 6,464 2.0%2010 323,412 299,311 92.5% 17,544 5.4% 6,557 2.0%2011 328,675 305,016 92.8% 17,037 5.2% 6,623 2.0%2012 334,026 311,059 93.1% 16,391 4.9% 6,575 2.0%2013 335,385 313,278 93.4% 15,473 4.6% 6,634 2.0%2014 336,813 315,332 93.6% 14,895 4.4% 6,587 2.0%2015 338,279 316,758 93.6% 14,955 4.4% 6,567 1.9%2016 332,143 311,090 93.7% 15,190 4.6% 5,863 1.8%
Note: Percentages may not sum to 100 due to rounding.
Source: Alaska Department of Labor and Workforce Development, Research and Analysis Section: Quarterly Census of Employment and Wages (QCEW)
Table 3.1 Nonagricultural Wage and Salary Employment C N , 2003 2016
Source: Alaska Department of Labor and Workforce Development, Research and Analysis Section
Fed Gov
Mining
Manufacturing
Construc on
Health Care/Social Assistance
Trade
2004 2005 2006 2007 2008 2009 2010 2011 2012 2013 2014 2015 2016
$2.5 bil
$2 bil
$1.5 bil
$1 bil
$0.5 bil
0
Local Gov
State Gov

Page 32 Alaska Unemployment Insurance Actuarial Report 2016
Table 3.2 Average Monthly Covered Employment by Industry/Ownership 2013 2016
Employment Percent 2013 2014 2015 2016 2013 2014 2015 2016
Total Taxable and Reimbursable 313,278 315,332 316,758 311,090 100% 100% 100% 100%
Private Industry 251,380 253,581 255,282 250,234 80.2% 80.4% 80.6% 80.4%Agriculture, Forestry, Fishing, and Hunting 1,098 1,123 1,137 1,105 0.4% 0.4% 0.4% 0.4%Mining 17,648 18,127 17,542 14,549 7.0% 7.1% 6.9% 5.8%Utilities 2,243 2,231 2,280 2,266 0.9% 0.9% 0.9% 0.9%Construction 16,449 17,003 17,574 16,152 6.5% 6.7% 6.9% 6.5%Manufacturing 14,391 14,497 14,165 13,768 5.7% 5.7% 5.5% 5.5%Trade 42,916 43,690 44,386 43,937 17.1% 17.2% 17.4% 17.6%Transportation and Warehousing 19,357 19,280 19,508 19,617 7.7% 7.6% 7.6% 7.8%Information 6,293 6,419 6,431 6,421 2.5% 2.5% 2.5% 2.6%Finance and Insurance 7,068 6,957 6,995 7,036 2.8% 2.7% 2.7% 2.8%Real Estate, Rental, and Leasing 4,838 4,852 4,820 4,737 1.9% 1.9% 1.9% 1.9%Professional and Technical Services 14,209 14,072 13,927 12,812 5.7% 5.5% 5.5% 5.1%Management of Companies 2,395 2,347 2,436 2,130 1.0% 0.9% 1.0% 0.9%Administrative and Waste Services 12,579 12,817 12,635 12,471 5.0% 5.1% 4.9% 5.0%Educational Services 2,289 2,290 2,355 2,354 0.9% 0.9% 0.9% 0.9%Health Care and Social Assistance 44,262 43,981 44,438 45,892 17.6% 17.3% 17.4% 18.3%Arts, Entertainment, and Recreation 4,832 4,783 4,763 4,916 1.9% 1.9% 1.9% 2.0%Accommodation and Food Services 28,240 28,657 29,628 29,805 11.2% 11.3% 11.6% 11.9%Other Services, except Public Administration 10,002 10,093 9,937 9,784 4.0% 4.0% 3.9% 3.9%Public Administration 0 0 0 0 0 0 0 0Unclassifi ed 271 363 326 482 0.1% 0.1% 0.1% 0.2%
State Government 24,013 24,288 23,576 22,534 7.7% 7.7% 7.4% 7.2%Education 5,809 5,972 5,741 5,428 24.2% 24.6% 24.3% 24.1%Public Administration 17,173 17,298 16,832 16,096 71.5% 71.2% 71.4% 71.4%All Other 1,031 1,019 1,004 1,010 4.3% 4.2% 4.3% 4.5%
Local Government 37,886 37,463 37,900 38,322 12.1% 11.9% 12.0% 12.3%Education 21,120 20,638 20,885 20,934 55.7% 55.1% 55.1% 54.6%Health Care and Social Assistance 1,261 1,299 1,316 1,362 3.3% 3.5% 3.5% 3.6%Public Administration 14,949 14,976 15,136 15,489 39.5% 40.0% 39.9% 40.4%All Other 555 550 563 537 1.5% 1.5% 1.5% 1.4%

Alaska Unemployment Insurance Actuarial Report 2016 Page 33
Table 3.2 (cont.) Average Monthly Covered Employment by Industry/Ownership 2013 2016
Employment Percent 2013 2014 2015 2016 2013 2014 2015 2016
Reimbursables Only 66,815 68,956 70,743 70,900 21.3% 21.9% 22.3% 22.8%
Private Industry 13,460 15,742 17,965 18,815 20.1% 22.8% 25.4% 26.5%Agriculture, Forestry, Fishing, and Hunting 40 40 44 42 0.3% 0.3% 0.2% 0.2%Mining 0 0 0 0 0 0 0 0Utilities 0 0 0 0 0 0 0 0Construction 0 0 0 0 0 0 0 0Manufacturing 0 0 0 0 0 0 0 0Trade 0 0 0 0 0 0 0 0Transportation and Warehousing 0 0 0 0 0 0 0 0Information 57 56 52 54 0.4% 0.4% 0.3% 0.3%Finance and Insurance 0 0 0 0 0 0 0 0Real Estate, Rental, and Leasing 0 0 0 0 0 0 0 0Professional and Technical Services 188 195 199 191 1.4% 1.2% 1.1% 1.0%Management of Companies 0 0 0 0 0 0 0 0Administrative and Waste Services 1 1 3 2 0 0 0 0Educational Services 261 249 255 362 1.9% 1.6% 1.4% 1.9%Health Care and Social Assistance 11,746 14,024 16,232 16,965 87.3% 89.1% 90.4% 90.2%Arts, Entertainment, and Recreation 120 124 117 121 0.9% 0.8% 0.7% 0.6%Accommodation and Food Services 24 30 27 34 0.2% 0.2% 0.1% 0.2%Other Services, except Public Administration 1,023 1,023 1,036 1,044 7.6% 6.5% 5.8% 5.5%Public Administration 0 0 0 0 0 0 0 0Unclassifi ed 0 0 0 0 0 0 0 0
State Government 23,699 23,991 23,292 22,247 35.5% 34.8% 32.9% 31.4%Education 5,808 5,972 5,740 5,428 24.5% 24.9% 24.6% 24.4%Public Administration 17,173 17,298 16,832 16,096 72.5% 72.1% 72.3% 72.4%All Other 718 721 720 723 3.0% 3.0% 3.1% 3.2%
Local Government 29,656 29,223 29,486 29,838 44.4% 42.4% 41.7% 42.1%Education 21,120 20,638 20,885 20,934 71.2% 70.6% 70.8% 70.2%Health Care and Social Assistance 1,154 1,190 1,204 1,248 3.9% 4.1% 4.1% 4.2%Public Administration 7,382 7,394 7,398 7,657 24.9% 25.3% 25.1% 25.7%
Notes: Fishing excludes nearly all commercial fi sh harvesting employment.
Source: Alaska Department of Labor and Workforce Development, Research and Analysis Section: Quarterly Census of Employment and Wages (QCEW)

Page 34 Alaska Unemployment Insurance Actuarial Report 2016
Table 3.3 Total Covered Wages by Industry/Ownership 2013 2016
Wages in Thousands Percent 2013 2014 2015 2016 2013 2014 2015 2016
Total Taxable and Reimbursable $15,831,852 $16,506,787 $17,008,097 $16,317,217 100% 100% 100% 100%
Private Industry $12,725,580 $13,346,406 $13,791,836 $13,097,458 80.4% 80.9% 81.1% 80.3%Agriculture, Forestry, Fishing, and Hunting $54,570 $55,770 $56,388 $53,920 0.4% 0.4% 0.4% 0.4%Mining $2,166,884 $2,354,298 $2,333,935 $1,865,894 17.0% 17.6% 16.9% 14.2%Utilities $184,632 $184,818 $198,387 $192,894 1.5% 1.4% 1.4% 1.5%Construction $1,227,117 $1,342,537 $1,426,495 $1,252,154 9.6% 10.1% 10.3% 9.6%Manufacturing $598,441 $613,801 $669,971 $659,089 4.7% 4.6% 4.9% 5.0%Trade $1,430,022 $1,490,449 $1,543,608 $1,525,352 11.2% 11.2% 11.2% 11.6%Transportation and Warehousing $1,167,789 $1,194,726 $1,219,988 $1,228,421 9.2% 9.0% 8.8% 9.4%Information $376,965 $397,432 $412,389 $401,228 3.0% 3.0% 3.0% 3.1%Finance and Insurance $413,418 $423,422 $442,719 $450,061 3.2% 3.2% 3.2% 3.4%Real Estate, Rental, and Leasing $191,478 $199,332 $203,460 $205,567 1.5% 1.5% 1.5% 1.6%Professional and Technical Services $1,002,429 $1,030,012 $1,023,980 $900,733 7.9% 7.7% 7.4% 6.9%Management of Companies $188,421 $198,013 $207,059 $189,016 1.5% 1.5% 1.5% 1.4%Administrative and Waste Services $517,327 $553,927 $559,347 $553,832 4.1% 4.2% 4.1% 4.2%Educational Services $71,321 $69,587 $72,187 $73,212 0.6% 0.5% 0.5% 0.6%Health Care and Social Assistance $2,053,178 $2,105,969 $2,230,211 $2,332,580 16.1% 15.8% 16.2% 17.8%Arts, Entertainment, and Recreation $96,234 $98,987 $101,711 $106,384 0.8% 0.7% 0.7% 0.8%Accommodation and Food Services $606,764 $642,519 $694,563 $706,016 4.8% 4.8% 5.0% 5.4%Other Services, except Public Administration $369,439 $375,377 $381,961 $380,849 2.9% 2.8% 2.8% 2.9%Public Administration $0 $0 $0 $0 0 0 0 0Unclassifi ed $9,151 $15,428 $13,477 $20,255 0.1% 0.1% 0.1% 0.2%
State Government $1,349,700 $1,375,314 $1,362,171 $1,349,927 8.5% 8.3% 8.0% 8.3%Education $312,836 $325,679 $316,818 $326,786 23.2% 23.7% 23.3% 24.2%Public Administration $968,287 $980,511 $976,832 $954,600 71.7% 71.3% 71.7% 70.7%All Other $68,576 $69,125 $68,521 $68,540 5.1% 5.0% 5.0% 5.1%
Local Government $1,756,572 $1,785,066 $1,854,089 $1,869,833 11.1% 10.8% 10.9% 11.5%Education $968,045 $975,237 $1,006,322 $1,010,482 55.1% 54.6% 54.3% 54.0%Health Care and Social Assistance $72,198 $78,143 $82,201 $88,863 4.1% 4.4% 4.4% 4.8%Public Administration $688,872 $706,334 $736,480 $743,051 39.2% 39.6% 39.7% 39.7%All Other $27,457 $25,352 $29,086 $27,437 1.6% 1.4% 1.6% 1.5%

Alaska Unemployment Insurance Actuarial Report 2016 Page 35
Table 3.3 (cont.) Total Covered Wages by Industry/Ownership 2013 2016
Wages in Thousands Percent 2013 2014 2015 2016 2013 2014 2015 2016
Reimbursables Only $3,467,295 $3,691,886 $3,921,715 $3,978,218 21.9% 22.4% 23.1% 24.4%
Private Industry $663,405 $841,404 $1,026,455 $1,087,524 19.1% 22.8% 26.2% 27.3%Agriculture, Forestry, Fishing, and Hunting $1,796 $1,839 $1,966 $1,861 0.3% 0.2% 0.2% 0.2%Mining $0 $0 $0 $0 0 0 0 0Utilities $0 $0 $0 $0 0 0 0 0Construction $0 $0 $0 $0 0 0 0 0Manufacturing $0 $0 $0 $0 0 0 0 0Trade $0 $0 $0 $0 0 0 0 0Transportation and Warehousing $0 $0 $0 $0 0 0 0 0Information $2,466 $2,586 $2,555 $2,611 0.4% 0.3% 0.2% 0.2%Finance and Insurance $0 $0 $0 $0 0 0 0 0Real Estate, Rental, and Leasing $0 $0 $0 $0 0 0 0 0Professional and Technical Services $10,028 $10,540 $10,169 $10,069 1.5% 1.3% 1.0% 0.9%Management of Companies $0 $0 $0 $0 0 0 0 0Administrative and Waste Services $27 $6 $82 $71 0 0 0 0Educational Services $7,877 $7,696 $7,836 $11,479 1.2% 0.9% 0.8% 1.1%Health Care and Social Assistance $607,031 $783,340 $965,335 $1,023,435 91.5% 93.1% 94.0% 94.1%Arts, Entertainment, and Recreation $3,792 $4,038 $4,614 $4,626 0.6% 0.5% 0.4% 0.4%Accommodation and Food Services $654 $838 $851 $1,175 0.1% 0.1% 0.1% 0.1%Other Services, except Public Administration $29,736 $30,520 $33,046 $32,197 4.5% 3.6% 3.2% 3.0%Public Administration $0 $0 $0 $0 0 0 0 0Unclassifi ed $0 $0 $0 $0 0 0 0 0
State Government $1,328,470 $1,354,937 $1,343,011 $1,330,379 38.3% 36.7% 34.2% 33.4%Education $312,816 $325,679 $316,805 $326,786 23.5% 24.0% 23.6% 24.6%Public Administration $968,287 $980,511 $976,832 $954,600 72.9% 72.4% 72.7% 71.8%All Other $47,367 $48,748 $49,375 $48,992 42.6% 40.5% 39.6% 39.2%
Local Government $1,475,420 $1,495,545 $1,552,250 $1,560,315 42.6% 40.5% 39.6% 39.2%Education $968,045 $975,237 $1,006,322 $1,010,482 65.6% 65.2% 64.8% 64.8%Health Care and Social Assistance $66,678 $72,827 $76,889 $81,925 4.5% 4.9% 5.0% 5.3%Public Administration $440,697 $447,481 $469,039 $467,908 29.9% 29.9% 30.2% 30.0%
Notes: Fishing excludes nearly all commercial fi sh harvesting employment.
Source: Alaska Department of Labor and Workforce Development, Research and Analysis Section: Quarterly Census of Employment and Wages (QCEW)

Page 36 Alaska Unemployment Insurance Actuarial Report 2016
Table 3.4 Taxable Wages by Industry/Ownership 2013 2016
Wages in Thousands Percent 2013 2014 2015 2016 2013 2014 2015 2016
Total $7,612,142 $7,751,931 $8,003,041 $7,840,089 100% 100% 100% 100%
Private Industry $7,389,066 $7,523,213 $7,765,900 $7,597,961 97.1% 97.0% 97.0% 96.9%Agriculture, Forestry, Fishing,and Hunting $39,532 $41,384 $41,709 $40,205 0.5% 0.6% 0.5% 0.5%Mining $783,622 $805,623 $789,850 $682,321 10.6% 10.7% 10.2% 9.0%Utilities $84,534 $85,115 $89,665 $89,992 1.1% 1.1% 1.2% 1.2%Construction $777,316 $826,547 $882,993 $791,556 10.5% 11.0% 11.4% 10.4%Manufacturing $469,473 $476,037 $529,276 $521,557 6.4% 6.3% 6.8% 6.9%Trade $1,094,938 $1,145,132 $1,185,894 $1,194,929 14.8% 15.2% 15.3% 15.7%Transportation and Warehousing $639,908 $654,439 $684,888 $696,599 8.7% 8.7% 8.8% 9.2%Information $211,028 $218,259 $227,870 $229,182 2.9% 2.9% 2.9% 3.0%Finance and Insurance $245,435 $245,502 $254,466 $261,344 3.3% 3.3% 3.3% 3.4%Real Estate, Rental, and Leasing $140,887 $144,884 $148,015 $151,783 1.9% 1.9% 1.9% 2.0%Professional and Technical Services $520,504 $521,901 $535,986 $495,044 7.0% 6.9% 6.9% 6.5%Management of Companies $87,095 $88,489 $94,294 $81,739 1.2% 1.2% 1.2% 1.1%Administrative and Waste Services $371,641 $385,536 $396,978 $400,628 5.0% 5.1% 5.1% 5.3%Educational Services $49,806 $48,340 $50,324 $47,252 0.7% 0.6% 0.6% 0.6%Health Care and Social Assistance $979,287 $899,435 $863,516 $896,820 13.3% 12.0% 11.1% 11.8%Arts, Entertainment, and Recreation $81,745 $82,955 $86,051 $91,251 1.1% 1.1% 1.1% 1.2%Accommodation and Food Services $556,931 $585,499 $634,230 $651,461 7.5% 7.8% 8.2% 8.6%Other Services, except Public Administration $247,867 $255,607 $259,619 $259,907 3.4% 3.4% 3.3% 3.4%Public Administration $0 $0 $0 $0 0 0 0 0Unclassifi ed $7,516 $12,528 $10,276 $14,391 0.1% 0.2% 0.1% 0.2%
State Government $11,604 $11,480 $11,022 $11,495 0.2% 0.1% 0.1% 0.1%Education $21 $0 $14 $0 0.2% 0 0.1% 0Public Administration $0 $0 $0 $0 0 0 0 0All Other $11,584 $11,480 $11,008 $11,495 99.8% 100% 99.9% 100%
Local Government $211,472 $217,239 $226,118 $230,633 2.8% 2.8% 2.8% 2.9%Education $0 $0 $0 $0 0 0 0 0Health Care and Social Assistance $3,615 $3,629 $4,041 $4,526 1.7% 1.7% 1.8% 2.0%Public Administration $188,780 $194,218 $202,408 $207,862 89.3% 89.4% 89.5% 90.1%All Other $19,078 $19,392 $19,669 $18,245 9.0% 8.9% 8.7% 7.9%
Notes: Fishing excludes nearly all commercial fi sh harvesting employment.
Source: Alaska Department of Labor and Workforce Development, Research and Analysis Section: Quarterly Census of Employment and Wages (QCEW)

Alaska Unemployment Insurance Actuarial Report 2016 Page 37
Table 3.5 Taxable as a Share of Total Wages by Industry/Ownership 2013 2016
2013 2014 2015 2016
Total 48.1% 47.0% 47.1% 48.0%
Private Industry 58.1% 56.4% 56.3% 58.0%Agriculture, Forestry, Fishing, and Hunting 72.4% 74.2% 74.0% 74.6%Mining 36.2% 34.2% 33.8% 36.6%Utilities 45.8% 46.1% 45.2% 46.7%Construction 63.3% 61.6% 61.9% 63.2%Manufacturing 78.4% 77.6% 79.0% 79.1%Trade 76.6% 76.8% 76.8% 78.3%Transportation and Warehousing 54.8% 54.8% 56.1% 56.7%Information 56.0% 54.9% 55.3% 57.1%Finance and Insurance 59.4% 58.0% 57.5% 58.1%Real Estate, Rental, and Leasing 73.6% 72.7% 72.7% 73.8%Professional and Technical Services 51.9% 50.7% 52.3% 55.0%Management of Companies 46.2% 44.7% 45.5% 43.2%Administrative and Waste Services 71.8% 69.6% 71.0% 72.3%Educational Services 69.8% 69.5% 69.7% 64.5%Health Care and Social Assistance 47.7% 42.7% 38.7% 38.4%Arts, Entertainment, and Recreation 84.9% 83.8% 84.6% 85.8%Accommodation and Food Services 91.8% 91.1% 91.3% 92.3%Other Services, except Public Administration 67.1% 68.1% 68.0% 68.2%Public Administration 0 0 0 0Unclassifi ed 82.1% 81.2% 76.2% 71.0%
State Government 0.9% 0.8% 0.8% 0.9%Education 0 0 0 0Public Administration 0 0 0 0All Other 16.9% 16.6% 16.1% 16.8%
Local Government 12.0% 12.2% 12.2% 12.3%Education 0 0 0 0Health Care and Social Assistance 5.0% 4.6% 4.9% 5.1%Public Administration 27.4% 27.5% 27.5% 28.0%All Other 69.5% 76.5% 67.6% 66.5%
Notes: Fishing excludes nearly all commercial fi sh harvesting employment.
Source: Alaska Department of Labor and Workforce Development, Research and Analysis Section: Quarterly Census of Employment and Wages (QCEW)
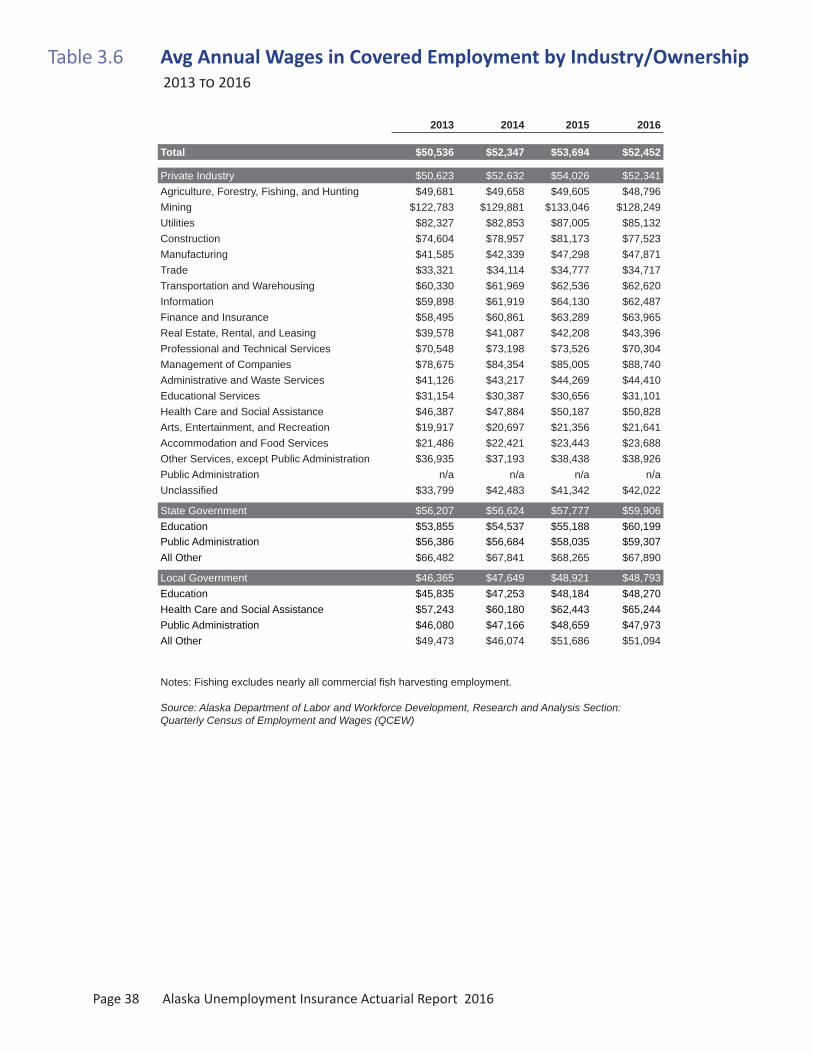
Page 38 Alaska Unemployment Insurance Actuarial Report 2016
Table 3.6 Avg Annual Wages in Covered Employment by Industry/Ownership 2013 2016
2013 2014 2015 2016
Total $50,536 $52,347 $53,694 $52,452
Private Industry $50,623 $52,632 $54,026 $52,341Agriculture, Forestry, Fishing, and Hunting $49,681 $49,658 $49,605 $48,796Mining $122,783 $129,881 $133,046 $128,249Utilities $82,327 $82,853 $87,005 $85,132Construction $74,604 $78,957 $81,173 $77,523Manufacturing $41,585 $42,339 $47,298 $47,871Trade $33,321 $34,114 $34,777 $34,717Transportation and Warehousing $60,330 $61,969 $62,536 $62,620Information $59,898 $61,919 $64,130 $62,487Finance and Insurance $58,495 $60,861 $63,289 $63,965Real Estate, Rental, and Leasing $39,578 $41,087 $42,208 $43,396Professional and Technical Services $70,548 $73,198 $73,526 $70,304Management of Companies $78,675 $84,354 $85,005 $88,740Administrative and Waste Services $41,126 $43,217 $44,269 $44,410Educational Services $31,154 $30,387 $30,656 $31,101Health Care and Social Assistance $46,387 $47,884 $50,187 $50,828Arts, Entertainment, and Recreation $19,917 $20,697 $21,356 $21,641Accommodation and Food Services $21,486 $22,421 $23,443 $23,688Other Services, except Public Administration $36,935 $37,193 $38,438 $38,926Public Administration n/a n/a n/a n/aUnclassifi ed $33,799 $42,483 $41,342 $42,022
State Government $56,207 $56,624 $57,777 $59,906Education $53,855 $54,537 $55,188 $60,199Public Administration $56,386 $56,684 $58,035 $59,307All Other $66,482 $67,841 $68,265 $67,890
Local Government $46,365 $47,649 $48,921 $48,793Education $45,835 $47,253 $48,184 $48,270Health Care and Social Assistance $57,243 $60,180 $62,443 $65,244Public Administration $46,080 $47,166 $48,659 $47,973All Other $49,473 $46,074 $51,686 $51,094
Notes: Fishing excludes nearly all commercial fi sh harvesting employment.
Source: Alaska Department of Labor and Workforce Development, Research and Analysis Section: Quarterly Census of Employment and Wages (QCEW)

Alaska Unemployment Insurance Actuarial Report 2016 Page 39
Data limitationsThe data in this report are derived from several sources, each with its own limitations. While reports may be gener-ated from the same source or appear similar, they may not be comparable.
Percentages may not add up to 100 due to rounding at one or two digits. Monetary data are reported to the full dol-lar amount whenever possible, but may be rounded to the nearest $1,000 in some tables due to space limitations.
Finally, industry groupings may include subcategories that must be subtracted when adding the columns.
Chapter 1 sourcesChapter 1 discusses fi nancial transactions, Alaska’s unem-ployment insurance trust fund, and Alaska’s benefi t fi nancing structure. This chapter draws heavily from the Employment Training Administration (ETA) 2112 reports and the Quarterly Census of Employment and Wages report, or QCEW.
Chapter 2 sourcesChapter 2 focuses on benefi t payment data derived from ETA reports and special runs on the state’s mainframe sys-tem. Payments by industry and area, Table 2.2, and tables 2.8 through 2.12 are derived from the Claimant Character-
istics Reports. Data in Table 2.1 and tables 2.5 through 2.7 are derived from the U.S. Department of Labor’s Claims Activity Report (ETA 5159).
Chapter 3 sourcesChapter 3 explains employment and wage data derived from the Quarterly Census of Employment and Wages re-port, which is based on quarterly payroll data that Alaska employers submit to the Department of Labor and Work-force Development. The department derives some QCEW information from estimates for delinquent employers.
The QCEW data comprise all employers covered by Alas-ka’s unemployment insurance system and consist of Alaska employers’ reported average monthly employment, total wages, and taxable wages. Employers’ tax assessments to be paid into the UI trust fund are also included.
Average monthly employment is an estimate of the num-ber of active jobs each month, based on reported employ-ment data for the pay period that includes the 12th of the month. Be cautious when using these fi gures to calculate annual wages, as they represent average annual wages per job, not per worker. Wages, in contrast, are the total wages paid during each quarter.
All data are broken out by industry, area, ownership, and tax status. Industries are categorized according to NAICS sectors.
2016 EditionAppendix A
Data Sources and Limitations

Page 40 Alaska Unemployment Insurance Actuarial Report 2016
2016 Edition
Part 1: Coverage Provisions of the Alaska Employment Security Act, 1937–2014
April 2, 1937 Alaska Employment Security Law enacted. Employers with eight or more employees in 20 weeks of the year are liable for taxes. The following types of employment are excluded from coverage: agricul-ture; domes c service; offi cers and crews on vessels; service performed by a parent, spouse, or child under 21; government; nonprofi t organiza ons; and those covered under a federal unemployment program. Employers not subject to the law may elect coverage with permission of the commission. Ch. 4, ESLA 1937
July 1, 1945 Coverage extended to employers of one or more people at any me. Ch. 7, SLA 1945
Mar. 20, 1947 List of excluded services extended. Addi onal exclusions include newsboys and students. Any employment liable for a tax under the Federal Unemployment Tax Act (FUTA) will be automa cally covered under the state U.I. law. Ch. 48, SLA 1947
Mar. 17, 1959 Employees in fi nance, insurance, and real estate paid on a commission basis are excluded from cov-erage. Ch. 46, SLA 1959
April 17, 1961 Faculty of nonprofi t universi es excluded. Ch. 108, SLA 1961
Jan. 1, 1972 Coverage made mandatory for employees of nonprofi t organiza ons, state hospitals, and ins tutes of higher educa on employing four or more in 20 weeks of the year. These employers are allowed to elect coverage on a reimbursable basis. Reimbursable fi nancing also made available, by elec on, to any poli cal subdivision. Ch. 94, SLA 1971
Jan. 1, 1972 Fishermen covered. Ch. 94, SLA 1971
April 1, 1977 Fishermen earning wages on a share basis excluded from coverage. Ch. 122, SLA 1977
Jan. 1, 1978 Coverage made mandatory for most employees of state and local governments. Coverage also ex-tended to certain domes c and agricultural workers. Ch. 122, SLA 1977
July 1, 1984 Execu ve offi cers of nongovernmental corpora ons are excluded. Ch. 106, SLA 1984
Sept. 27, 1995 Certain direct sellers of consumer products are excluded. Ch. 97, SLA 1995
May 28, 2009 Reimbursable fi nancing available to federally recognized tribes. Ch. 27, SLA 2009
Part 2: Financing Provisions of the Alaska Employment Security Act, 1937–2014
April 2, 1937 All wages paid to employees covered under the law are assessed a uniform tax of 1.8 percent. Ch. 4, ESLA 1937
Jan. 1, 1938 Uniform tax increased to 2.7 percent of total covered wages. Ch. 4, ESLA 1937
Mar. 26, 1941 Taxable wages limited to fi rst $3,000 of wages paid to an employee. Ch. 40, SLA 1941
June 30, 1947 Credits against the tax are available to qualifi ed employers if there is a fund surplus. The credit is based on the individual employer’s annual payroll decline. Ch. 74, SLA 1947
Appendix B
Summary of Major ChangesIn the Alaska Employment Security Act

Alaska Unemployment Insurance Actuarial Report 2016 Page 41
Jan. 1, 1955 Tax base increased to fi rst $3,600 of wages. An employee tax of 0.5 percent is also assessed. Employ-er tax credit is eliminated. Ch. 5, ESLA 1955
April 4, 1957 Tax base increased to fi rst $4,200 of wages. Ch. 169, SLA 1957
Mar. 30, 1960 Uniform employer tax increased to 2.9 percent. Uniform employee tax increased to 0.6 percent. Tax base increased to $7,200. Ch. 60, SLA 1960
Oct. 1, 1960 Individual employer and employee tax rates made variable depending on quarterly payroll declines of employer. Employer tax rates range from 1.5 percent to 4.0 percent with an average tax rate of 2.9 percent. Employee tax rates range from 0.3 percent to 0.9 percent averaging 0.65 percent. Ch. 60, SLA 1960
Jan. 1, 1974 Employee tax made uniform and employer tax le variable. The tax base is $10,000. There are 10 alterna ve tax rate schedules with the appropriate schedule determined by the “reserve mul ple,” which measures the ability of the fund to meet poten al benefi t payments. Ch. 43, SLA 1973
Jan. 1, 1981 Tax base will be 60 percent of the average annual wage for calendar years 1981 and 1982 and will be 75 percent of the average annual wage for future years. Ten alterna ve tax rate schedules are replaced with 20 “experience factors.” An employer’s yearly rate calcula on will be 82 percent of the benefi t cost rate mes the experience factor. A solvency tax will be added across the board if the “reserve ra o” of the fund is under 3.2 percent. Employee tax will be a uniform 18 percent of the benefi t cost rate. Ch. 9, SLA 1980
Oct. 1, 1984 The amount of interest earned on the trust fund balance will be deducted from the amount of ben-efi ts in the calcula on of average benefi t cost rate. Ch. 106, SLA 1984
Jan. 1, 1985 A new rate class, Class 21, is established and assigned an experience ra ng of 1.65 and a minimum employer tax rate of 5.4 percent. Solvency adjustments changed to provide a surcharge if the trust fund reserve rate falls below 3.0 percent and a credit if the reserve rate equals or exceeds 3.3 per-cent. Ch. 106, SLA 1984
Sept. 13, 1987 Interest on funds borrowed from the federal government to cover shor alls in the trust fund may be paid out of employee contribu ons. Ch. 82, SLA 1987
July 1, 1989 Training programs pilot project to be funded by transfer of 0.1 percent of taxable wages from amount contributed by employees. Ch. 95, SLA 1989
June 30, 1993 Training programs pilot project extended un l 1996. Ch. 17, SLA 1993
July 1, 1996 Training programs (STEP) extended un l June 30, 2002. Ch. 116, SLA 1996
Jan. 1, 1997 Employer’s yearly rate calcula on will be 80 percent of the benefi t cost rate mes the experience factor. (No change in the solvency tax provision). Employee tax will be a uniform 20 percent of the benefi t cost rate. Ch. 116, SLA 1996
July 1, 2000 Technical and Voca onal Educa on Program (TVEP) created. Program to be funded by transfer of 0.1 percent of taxable wages from amount contributed by employees. Ch. 132, SLA 2000
July 1, 2002 Training programs (STEP) extended un l June 30, 2003. Ch. 86, SLA 2002
July 1, 2003 Training programs (STEP) extended un l June 30, 2004. Ch. 49, SLA 2003
July 1, 2004 Training programs (STEP) extended un l June 30, 2008. Ch. 89, SLA 2004
July 1, 2008 Training programs (STEP) extended un l June 30, 2010. Ch. 46, SLA 2008
July 1, 2008 Technical and Voca onal Educa on Program (TVEP) expanded. Program to be funded by transfer of 0.15 percent (from 0.10) of taxable wages from amount contributed by employees. Ch. 47, SLA 2008

Page 42 Alaska Unemployment Insurance Actuarial Report 2016
Jan. 1, 2009 For 2009, the employer’s yearly rate calcula on will be 76 percent of the benefi t cost rate mes the experience factor (no change in the solvency tax provision). The 2009 employee tax will be a uniform 24 percent of the benefi t cost rate. For 2010 and future years, the employer’s yearly rate calcula on will be 73 percent of the benefi t cost rate mes the experience factor, and the employee tax will be a uniform 27 percent of the benefi t cost rate. Ch. 45, SLA 2008
June 24, 2009 Training programs (STEP) made permanent. Ch . 36, SLA 2009
July 1, 2013 A limita on on the decrease in the solvency surcharge was removed from AS 23.20.290(f). Table iden fying the previous solvency surcharge to be implemented has been removed and replaced with a formula calcula ng out to 1/100th of a percentage point. Ch. 50, SLA 2013
July 1, 2013 AS. 23.20.291 was adopted to give the department’s commissioner the discre on to prevent tax rate increases, in whole or in part, if the average high cost mul ple is .8 or greater. Ch.50, SLA 2013
July 1, 2014 TVEP expanded. Program to be funded by transfer of 0.16 percent (from 0.15) of taxable wages from amount contributed by employees. Takes eff ect January 2015. Ch. 15, SLA 2014
July 1, 2016 AS. 23.20.291 is repealed.
Part 3: Benefi t Provisions of the Alaska Employment Security Act, 1937 to 2015
April 2, 1937 Benefi ts fi rst made payable Jan. 1, 1939. Minimum payment is $5; maximum is $15. Weekly benefi t amount (WBA) set at 50 percent of full- me weekly wage. Total benefi t payments not to exceed 16 mes the WBA. Ch. 4, ELSA 1937
Jan. 17, 1939 Minimum payment is $5; maximum is $16. WBA set at one-twen eth of high quarter wages. Total ben-efi t payments not to exceed either 16 mes the WBA or a third of base year earnings. Ch. 1, SLA 1939
Oct. 1, 1946 Minimum payment is $8; maximum is $25. Maximum reduced to $20 if the fund balance is less than $2 million on Jan. 1. Total benefi t payments not to exceed either 25 mes the WBA or a third of base year earnings. Ch. 32, ESLA 1946
July 1, 1949 WBA is increased by 20 percent for each dependent of the claimant, up to three. Ch. 25, SLA 1949
July 1, 1951 Minimum payment is $8; maximum is $30. Ch. 11, SLA 1951
July 1, 1953 Minimum payment is $8; maximum is $35. WBA now based on total wages in base year. Total benefi t payments limited to 26 mes the WBA for most claimants. Ch. 99, SLA 1953
July 3, 1955 Minimum payment is $10; maximum is $45. Maximum limited to $25 for claimants residing outside the territory. WBA is increased by $5 for each dependent of the claimant, up to fi ve. Claimants with depen-dents residing outside the territory are disqualifi ed for the dependent allowance. Ch. 5, ESLA 1955
Mar. 30, 1960 Maximum WBA for interstate claimants reduced to $20. Ch. 60, SLA 1960
July 1, 1966 Minimum payment is $10; maximum is $55. Total benefi t payments limited to 28 mes the WBA for most claimants. Ch. 112, SLA 1966
July 1, 1969 Minimum payment is $18; maximum is $60. Ch. 106, SLA 1969
Jan. 29, 1971 Depending on the level of na onal and state unemployment rates, benefi t payments may be extend-ed. Extended benefi t payments not to exceed one-half of total benefi ts available under the regular program. Ch. 106, SLA 1971
Jan. 1, 1972 Discrimina on against nonresident claimants ends. Ch. 106, SLA 1971

Alaska Unemployment Insurance Actuarial Report 2016 Page 43
July 1, 1973 Minimum payment is $18; maximum is $90. Dependent allowance set at $10 per dependent, up to three. Ch. 43, SLA 1973
Oct. 1, 1980 Minimum payment is $34; maximum payment is $150 for basic WBA. Dependent allowance set at $24 per dependent, up to three. Dependent allowance increases if an addi onal dependent is acquired by birth or adop on. Poten al dura on of benefi ts (16 to 26 weeks) is determined by the ra o of total base period wages to high quarter wages. Ch. 9, SLA 1980
Oct. 31, 1981 Weekly benefi ts are reduced dollar for dollar upon receipt of periodic payments based on wages used to establish a benefi t year. Ch. 114, SLA 1981
Sept. 26, 1982 Child support obliga ons may be deducted from weekly benefi t checks. Ch. 115, SLA 1982
Jan. 1, 1983 Minimum payment is $34; maximum payment is $156 for basic WBA. Ch. 115, SLA 1982
Oct. 1, 1984 Minimum payment is $38; maximum payment is $188 for basic WBA. Ch. 106, SLA 1984
Oct. 1, 1990 Minimum payment is $44; maximum payment is $212 for basic WBA. Ch. 167, SLA 1990
Jan. 1, 1997 Minimum payment is $44; maximum payment is $248 for basic WBA. Ch. 116, SLA 1996
Jan. 1, 2009 Minimum payment is $56; maximum payment is $370 for basic WBA. Ch. 45, SLA 2008
Part 4: Qualifying Provisions of the Alaska Employment Security Act, 1937–2014
April 2, 1937 To qualify for benefi ts, a claimant must have: 1) been unemployed in two of the last 13 weeks pre-ceding claim; 2) have wages in the fi rst three of the last four calendar quarters totaling more than 16 mes the WBA; and 3) be ready and able to work. The claimant is disqualifi ed for fi ve addi onal weeks upon qui ng the last employment without good cause. Ch. 4, ESLA 1937
Jan. 17, 1939 Total wages in base year must equal or exceed 25 mes the WBA. Ch. 1, SLA 1939
Mar. 26, 1941 Claimant must have been unemployed for two weeks in the benefi t year including the week in which the claim was fi led. Ch. 40, SLA 1941
July 1, 1945 Women are disqualifi ed during the last two months of pregnancy and the month following pregnan-cy. Ch. 50, SLA 1945
Oct. 1, 1946 Minimum required wages in base year set at $150. Ch. 32, SLA 1946
June 30, 1947 Wai ng period reduced to one week. Ch. 74, SLA 1947
July 1, 1953 Minimum wage requirement set at $300. Seasonal workers are disqualifi ed for benefi ts for unem-ployment not occurring during their regular working season. Ch. 99, SLA 1953
July 3, 1955 Minimum wage requirement set at $450 or 1.25 mes high quarter wages. Women are disqualifi ed un l they subsequently earn $120 if they leave work: 1) to get married; 2) to live with their husband; or 3) due to pregnancy. Any week of unemployment due to a labor dispute is disqualifi ed. A claimant found guilty of fraud is disqualifi ed for 26 weeks. Ch. 5, ESLA 1955
April 4, 1957 Minimum wage requirement set at $500 or 1.25 mes high quarter wages. Ch. 169, SLA 1957
April 7, 1962 Claimants are not disqualifi ed while a ending a training course to improve their skills. Ch. 63, SLA 1962
July 1, 1969 Minimum wage requirement set at $750, $100 of which must have been earned outside the quarter with the highest wages. Ch. 106, SLA 1969
Jan. 1, 1972 Women no longer disqualifi ed during pregnancy. Ch. 106, SLA 1971

Page 44 Alaska Unemployment Insurance Actuarial Report 2016
Oct. 1, 1980 Minimum wage requirement set at $1,000 with at least 10 percent earned outside the quarter of highest wages. If a claimant earns more than 90 percent of the base period wages in one quarter, base period wages used for determining benefi ts will be reduced to 10 mes the wages paid in the base period outside the high quarter. The six-week disqualifi ca on for voluntary quit and misconduct includes a reduc on of poten al benefi ts by three mes the basic WBA. The six-week disqualifi ca on is li ed if the claimant returns to work and earns eight mes the WBA. Ch. 9, SLA 1980
Oct. 31, 1981 A wai ng week must be served for each new benefi t year. Extended benefi t claimants must ac vely seek work and may not refuse an off er of “suitable” work. Claimants fi ling for extended benefi ts from a state not triggered onto extended benefi ts are eligible for no more than two weeks of ben-efi ts. Ch. 114, SLA 1981
June 26, 1982 The na onal “on” and “off ” trigger indicators for extended benefi ts are repealed in conformity with federal law. Ch. 115, SLA 1982
Sept. 26, 1982 In conformity with federal law, the state “on” indicator for extended benefi ts is increased to 6 per-cent insured unemployment rate. In conformity with federal law, a claimant is not eligible for extend-ed benefi ts unless total base period wages equal or exceed 40 mes the weekly benefi t en tlement including dependent benefi ts. Supplemental state benefi ts are provided for claimants otherwise eligible for extended benefi ts except for the new 40 mes the WBA requirement. All other condi- ons of extended benefi ts apply to supplemental state benefi ts. Ch. 115, SLA 182
June 16, 1984 State interim benefi ts provided for noncer fi ed teachers of indigenous languages and school em-ployees in other than an instruc onal, research or principal capacity. Ch. 106, SLA 1984
July 2, 1989 An insured worker is ineligible for benefi ts for one year if discharged for commission of a felony or the in connec on with work. Ch. 100, SLA 1989
Nov. 15, 1991 An agreement with the U.S. Department of Labor allows the temporary payment of benefi ts under the Emergency Unemployment Act of 1991 (PL 102-162) in place of extended benefi ts.
July 1, 1993 The implementa on of the Emergency Unemployment Compensa on (EUC) program, 26 U.S.C. 3304. Eligibility for supplemental state benefi ts (SSB) remains in eff ect during a period in which extended benefi ts (EB) are triggered “off ,” but during which EUC benefi ts are payable. The eligibility for extended benefi ts set Oct. 3, 1993 requires the claimant meet the exis ng 40 mes WBA require-ment, or have a total of 1.5 mes the base period high quarter wage.
The total amount of extended benefi ts payable is the lowest of: (1) 80 percent of total regular ben-efi ts, (2) 20 mes the WBA or (3) 46 mes the WBA minus total regular benefi ts paid.
In addi on to the exis ng extended benefi ts triggers, extended benefi ts are “on” if the state three-month total unemployment rate (TUR) is 6.5 percent, and is 110 percent of the same three-month period in either of the prior two years. Extended benefi ts are “off ” if there is no “on” indicator, or if the state is eligible for the EUC program. Ch. 28, SLA 1993
Jan. 1, 2009 Minimum wage requirement set (from $1,000) to $2,500, with at least 10 percent ($250) in a second quarter. Ch. 45, SLA 2008.
Jan. 1, 2010 Alterna ve Base Period (last four completed quarters) created for those who fail to qualify for a ben-efi t with the standard base period. Ch. 27 SLA 2009

Alaska Unemployment Insurance Actuarial Report 2016 Page 45
Alaska geography (area defi ni ons): Geographic en es within Alaska. (1) Largest areas are the boroughs (legal boundaries) and census areas (sta s cal boundaries, equivalent to boroughs). (2) Ci es are defi ned by their legal descrip ons. (3) Census designated places (CDPs) are unincorporated established communi es.
alternate base period: The most recent completed calendar quarters immediately preceding the fi rst day of an individual’s benefi t year. The alternate base period is a secondary examina on for qualifying wages (a safety net), and is used only when an individual fails to qualify for a benefi t with the tradi onal base period. Alaska adopted the alternate base period to begin in 2010. (See “base period.”)
average annual wages: Total wages in covered employment, divided by average monthly covered employment.
average high cost rate: The average of the three highest calendar benefi t cost rates (from last 20 years, or a period including three recessions, if longer). Part of a federal solvency measure. (See “average high cost mul ple.”) average high cost mul ple (AHCM): A federal solvency measure. The reserve ra o divided by the average high cost rate. One of two federal solvency measures used to evaluate and compare the states.
average monthly covered employment: The sum of all reported covered employment for a 12-month period, divided by 12.
average weekly benefi t amount (AWBA): A UI program sta s cal measure: the total benefi ts paid for full- me unemployment, divided by the number of weeks compensated.
average weekly wages: Average annual wages in covered employment, divided by 52. base period: The earliest four of the fi ve most recently completed calendar quarters immediately preceding the fi rst day of an individual’s benefi t year. (See “alternate base period.”)
base period wages: (1) If workers were paid 90 percent or more of their wages in a single quarter of the base period, the BPW are the wages in the other three quarters mes 10. (2) If the workers were not paid 90 percent or more of their wages in a single quarter of the base period, the BPW are the wages during the base period.
benefi t: Monetary amount payable (weekly) to an individual under AS 23.20.
benefi t cost rate: A cost of benefi ts measure (percent) calculated as the ra o of regular benefi ts paid in the current year, divided by total wages in the previous year.
benefi t year: A one-year period beginning with the Sunday of the week an insured worker fi les a request for determina on of insured status.
claimant: An individual who has fi led a request for determina on of insured status, a no ce of unemployment, a cer fi ca on for wai ng week credit, or a claim for benefi ts.
2016 EditionAppendix C
Glossary

Page 46 Alaska Unemployment Insurance Actuarial Report 2016
combined wages (interstate wage combining): Earnings during a base period that were paid in more than one state for determining the share of liability in each state.
coverage: The determina on, by the state, whether an employing unit should be considered an employer subject to the state’s unemployment insurance laws. covered employment: The number of people employed during the pay period that included the 12th of each month, by place of work. Workers who are not covered include agricultural workers, self-employed workers, some employed students, most fi shermen, full-commissioned sales workers, private railroad workers, and elected and appointed offi cials.
decline quo ent: An es mate of an employer’s experience with unemployment, determined by dividing the decline in payroll within two consecu ve quarters by the payroll of the earlier quarter. An employer’s annual quo ent is the average of all declines for the last 12 quarters, with a minimum of four quarters’ wage records required for the calcula on.
dependent benefi ts (or dependents’ allowance [DA]): Benefi ts in addi on to the weekly benefi t amount paid to claimants with dependents, up to three dependents per claimant. Alaska’s DA is $24, and the maximum for three is $72.
Disaster Unemployment Assistance (DUA): A federal program funded by the Federal Emergency Management Agency in which UI benefi ts are authorized by the President of the United States for individuals unemployed as a result of a major disaster. dura on: The number of weeks in which payments were received by an individual (actual), or qualifi ed for (poten al), for each program. Average dura on is the number of weeks paid per program in a 12-month period, divided by the number of fi rst payments received in that program during that period.
earnings replacement: The propor on of average weekly wages replaced by the UI weekly benefi t amount. In general, the U.S. unemployment insurance system’s goal is 50 percent.
Emergency Unemployment Compensa on (1991) (EUC): A federally funded program similar to extended benefi ts, paying addi onal weeks of benefi ts, beginning November 17, 1991 and ending April 30, 1994. Alaska elected to pay EUC benefi ts instead of EB during that me.
Emergency Unemployment Compensa on 2008 (EUC08): A federally funded program similar to the 1990s EUC program. Benefi ts were fi rst payable for the week ending July 12, 2008, and the last week payable (fi rst extended to April 30, 2011) was re-extended to June 9, 2012 and extended again to the end of 2012. The four ers of the program provided up to 20, 14, 13, and six weeks of benefi ts, for a total of up to 53 maximum available weeks. Tiers three and four were available for Alaska based on the state’s total unemployment rate fi gures (three-month average TUR >= 6.0 for er three, and >= 8.5 for er four). Tier four payments ended July 3, 2010 and were again paid in 2011 from Jan. 16 to June 11, and in 2012 from Jan. 22 to May 12. One hundred percent federal funding for EB was also provided during most of this period (through 2011 to phase out in 2012).
Employment and Training Administra on (ETA): A division of the U.S. Department of Labor.
Employment Security Act: Title 23, Chapter 20 of the Alaska Statutes (AS 23.20), which governs the Unemployment Insurance Program. It started in 1937. Appendix B contains a summary of changes.

Alaska Unemployment Insurance Actuarial Report 2016 Page 47
exhausts: A person was paid all the weeks available for a specifi c UI benefi t program.
experience ra ng: A method of measuring an employer’s experience with unemployment. Alaska’s employers (those eligible for experience ra ng) are ranked by their average quarterly decline quo ent and are assigned to one of 20 tax rate classes, each with an experience factor between 0.40 and 1.60. A special penalty class 21 (with a factor of 1.65) was created in 1985 for fi rms that are delinquent in fi ling quarterly reports or making tax payments. New employers are assigned tax rates based on an industry average rate.
extended benefi ts (EB): Addi onal benefi ts available a er regular state UI benefi ts have been exhausted, but only when an extended benefi ts period is in eff ect. EB was enacted by Congress in 1970, and by Alaska in 1971.
extended benefi ts period: A period during which extended benefi t payments are authorized, usually defi ned as a period of 13 weeks or more as determined by unemployment rate data. Sec on 23.20.408 of the Alaska Employment Security Act defi nes the condi ons required for an extended benefi ts period.
Federal Addi onal Compensa on (FAC): Part of the 2009 federal economic s mulus programs. FAC provided an addi onal $25 to the weekly benefi t amount of all recipients. The fi rst Alaska FAC payable was the week ending Feb. 28, 2009. The last Alaska week payable (originally July 3, 2010) was Dec. 11, 2010.
federal fi scal year: Oct. 1 of the prior calendar year through Sept. 30 of the current calendar year. For example: federal fi scal year 2014 is from Oct. 1, 2013 to Sept. 30, 2014.
Federal Supplemental Benefi ts (FSB): A federally funded program similar to the Federal Supplemental Compensa on (FSC) that was in eff ect between 1975 and 1978.
Federal Supplemental Compensa on (FSC): A federally funded program in eff ect from October 1982 to April 1985 that provided addi onal payments a er regular benefi ts had been exhausted and extended benefi ts had been exhausted or an extended benefi ts period was not in eff ect. fi nal payment: The last payment of a weekly benefi ts en tlement. (See “exhausts.”) fi rst payment: The fi rst payment for a week of unemployment claimed under a specifi c program.
Federal Unemployment Tax Act (FUTA): U.S. employers pay a na onal FUTA tax, and receive credit (reduc on of FUTA tax owed) for UI taxes payed to approved state UI programs.
high cost rate: The highest benefi t cost rate of historical record (for Alaska = 4.33% for year 1958).
high cost mul ple (HCM): A measure of trust fund adequacy, TF as a percentage of total wages divided by the high cost rate. The high cost rate is the highest historical ra o of benefi ts to wages for a 12-month period.
high quarter: The quarter of the base period with the greatest reported wages.
high unemployment period (HUP): A defi ni on in the trigger for extended benefi ts that increases the maximum number of EB weeks payable from 13 to 20. The HUP is in eff ect if the three-month average total unemployment rate (TUR) is 8.0 percent or greater. HUP was in eff ect from 2009 week 19 through 2010 week 42, and again in 2011 for weeks 8 through 20.

Page 48 Alaska Unemployment Insurance Actuarial Report 2016
industry: The classifi ca on of an employer establishment by primary economic ac vity, according to a government coding system (NAICS). (See “North American Industry Classifi ca on System.”)
insured unemployment: The number of people fi ling con nued claims for full regular benefi ts or par al regular benefi ts, or who are in a wai ng week status during a given week.
insured unemployment rate (IUR): Ra o of insured unemployed, expressed as a percentage of average covered employment. It is computed as the average insured unemployment for a 13-week period, divided by average covered employment lagged six months. The IUR is computed weekly.
interstate claims, payments: Claims made by, or payments made to, people residing in other states who worked in Alaska, and for which Alaska is at least par ally liable for unemployment compensa on.
intrastate claims, payments: Claims made by, or payments made to, people residing within Alaska, including payments from other liable states.
Local Area Unemployment Sta s cs (LAUS): A federal-state coopera ve sta s cal program that provides labor force and unemployment rate data for areas within the state.
local offi ces: Unemployment insurance (UI) claims centers. Un l December 1995, there were 20 offi ces, including the mail claims and interstate unit. Beginning in late 1996, the local offi ces were reorganized into three UI call centers for UI claims purposes. Most claims are now fi led through the Internet or by phone.
mail claims: Claims that were fi led by mail to the mail claims center by people residing more than 55 miles from the nearest local offi ce. Claims from rural areas are now handled through the call center system.
North American Industry Classifi ca on System (NAICS): A na onal standardized system to classify employers into industries. The fi rst year of NAICS-based data in Alaska was 2003.
nonagricultural wage and salary employment: Employment that does not include self-employed workers, unpaid family workers, domes cs, most fi shermen, and agricultural workers, by place of work rather than residence.
ownership: Classifi ca on of employers according to legal proprietorship (private industry or federal, state, or local government) rather than by type of economic ac vity.
regular benefi ts (or state UI program): The main benefi ts program in the UI system, fi nanced by a state- administered tax system.
reimbursable: A contribu on system where certain employers can elect to reimburse the state UI trust fund directly for benefi ts paid to former employees, rather than pay taxes under the experience ra ng system. Eligible employers include state and local governments, schools, nonprofi ts, tribal corpora ons, and hospitals (nonprofi t, tribal, or government).
reserve rate: The measure of UI Trust Fund Solvency, computed as the balance of the fund on September 30divided by total wages paid by taxable employers during the last state fi scal year. The reserve rate determines the inclusion of a solvency tax or credit, if any, for the next tax year, according to the table in AS 23.20.290 (f).
reserve ra o: In general, it is the trust fund balance as a percent of total wages. See “reserve rate” for Alaska

Alaska Unemployment Insurance Actuarial Report 2016 Page 49
program specifi cs. The reserve ra o is used in several prevalent solvency measures.solvency adjustment: A surcharge added to employer taxes when the trust fund balance falls below 3.0 percent of the total payroll, or a credit lowering taxes when the balance rises above 3.3 percent.
Standard Industrial Classifi ca on System (SIC): A na onal standardized system to classify employers into industries, in eff ect through 2002. It was succeeded by NAICS.
state fi scal year: July 1 of the prior calendar year through June 30 of the current calendar year. For example, state fi scal year 2014 is from July 1, 2013 to June 30, 2014.
State Interim Benefi ts (SIB): A special Alaska program (started in 1984) which, for a few years, paid benefi ts to certain noninstruc onal educa onal employees between sessions.
State Supplemental Benefi ts (SSB): A special Alaska program (created in 1982) that pays benefi ts to claimants who have been denied extended benefi ts because they do not meet the federal requirement that they earn 40 mes their weekly benefi t amount in their base period.
State Training and Employment Program (STEP): A state administered training program, started in July 1989, funded by a share of worker UI tax funds, as defi ned by AS 23.15.620 – 645. (See “TVEP.”)
state UI regular program: An insurance program designed to provide temporary compensa on for those who are involuntarily unemployed, funded through employer and employee taxes and reimbursements.
supplemental payments: Payments made to claimants who were paid previously but may have been underpaid for various reasons.
tax base: The maximum amount of each employee’s wages subject to state unemployment insurance taxes. It is calculated (for each tax year) as 75 percent of the average annual wage (using last state fi scal year data).
tax rate class: Alaska’s experience-rated employers are assigned to one of 20 tax rate classes, or to a 21st penalty class. New employers are assigned to the rate class closest to the mathema cal average tax rate of experience-rated employers in the same industry. Classes 10 and 11 contain the average tax rate for the tax year. There is one tax rate for all employees.
taxable wages: The por on of total wages (payroll) of employers within the experience ra ng system that is subject to state unemplo yment tax provisions. Since 1983, the taxable wage base is defi ned as 75 percent of the average annual wage (using last state fi scal year data).
Technical and Voca onal Educa on Program (TVEP): A state administered training program, started in July 2000, funded by a share of worker UI tax funds, as defi ned by AS 23.15.820 – 850. (See “STEP.”)
Temporary Emergency Unemployment Compensa on (TEUC): A federal program enacted by Congress following the a acks of Sept. 11, 2001. Benefi ts were fi rst payable the week ending March 16, 2002. The last week for new claims was the week ending Dec. 27, 2003. The last week the program paid claims for was the week ending April 3, 2004.
total labor force: All people age 16 and older residing in a specifi c area who are either employed, unemployed

Page 50 Alaska Unemployment Insurance Actuarial Report 2016
and seeking employ ment, or involved in a labor dispute.total unemployment: All people age 16 and older who did not work during the survey week, but were available and seeking work or were wai ng to report for work within 30 days.
total unemployment rate (TUR): An expression of the number of unemployed people as a percent of the total civilian labor force. It is defi ned as the total unemployment divided by the total labor force. The TUR is the “offi cial” quoted rate of unemployment, issued monthly. total wages: The total of all wages and salaries (taxable and reimbursable) paid by covered employers. It includes bonuses, ps, cash value of meals, lodging, and other gratui es furnished with the job.
trade readjustment allowance (TRA): An allowance authorized under the federal Trade Act of 1974 for providing benefi ts and training to workers whose employment opportuni es have been impacted by adjustments to federal regula ons on interna onal trade. Training and Building Fund: An account separate from the UI trust fund that receives interest and penal es paid by taxed employers. It is used to support training and to provide offi ce space. trust fund: A state fund (at the U.S. Treasury) to receive and disburse unemployment insurance funds.
trust fund reserve: As an accoun ng defi ni on, it is the sum of amounts in the trust fund, plus balances in the state’s clearing account and benefi t payment account, as well as interest credited for the last quarter of the calendar year. The reserve of the trust fund, programma cally, is the amount beyond current infl ows and ou lows, designed to maintain fund solvency in recession when tax revenues lag far behind benefi t payments.
Unemployment Compensa on for Federal Employees (UCFE): A federally funded insurance program designed to provide temporary compensa on for former employees of the federal government who are involuntarily unemployed.
Unemployment Compensa on for Ex-Servicemen (UCX): A federally funded insurance program, similar to UCFE, designed to provide temporary unemployment compensa on for former members of the armed forces.
UI: Unemployment insurance
UI claims center (or call center): Offi ces in Anchorage, Fairbanks, and Juneau (including mail claims and interstate claims centers) that process UI claims. In-person claims fi ling was phased out in 1996 and 1997. In-state claims are fi led through the Internet, on an automated telephone system (VICTOR), and by mail.
wai ng week: The fi rst week of claimed unemployment, for which there is no disqualifi ca on. No payment is made for the wai ng week, but is made for subsequent qualifying weeks. States that have no wai ng week provision will not receive the federal share for the fi rst week of any claimant’s extended benefi ts payment.
weekly benefi t amount (WBA): The benefi t paid (actual) or en tled to (poten al) per week.
week claimed: A claim for a wai ng week credit, or benefi t, for a week of unemployment.
weeks paid: The number of weeks claimed that received a benefi t payment.


![The burden of unemployment [microform] : a study of unemployment ...](https://static.fdokumen.com/doc/165x107/631a7ae70255356abc08b300/the-burden-of-unemployment-microform-a-study-of-unemployment-.jpg)