UNEMPLOYMENT BENEFITS AND DURATION
130
UNEMPLOYMENT BENEFITS AND DURATION Charles A Lininger Jr.
-
Upload
khangminh22 -
Category
Documents
-
view
0 -
download
0
Transcript of UNEMPLOYMENT BENEFITS AND DURATION

UNEMPLOYMENT BENEFITS
AND DURATION
Charles A Lininger Jr.
UNEMPLOYMENT BENEFITS
AND DURATION
A Study of the Effect of Weekly Unemployment
Benefit Amounts on the Duration of
Unemployment Benefits
by
Charles A. Lininger Jr.
Library of Congress Catalog Card No. 63-63887
June, 1963
INSTITUTE FOR SOCIAL RESEARCH THE UNIVERSITY OF MICHIGAN ANN ARBOR, MICHIGAN

ACKNOWLEDGEMENTS
This study was i n i t i a l l y submitted to the Faculty of the Social Sciences at The U n i v e r s i t y of Chicago i n candidacy f o r the degree Doctor of Philosophy, December 1962. Many persons were p a r t i c u l a r l y h e l p f u l or instrumental i n t h i s study. At the Uni v e r s i t y of Chicago, Professor H. Gregg Lewis provided guidance and rigorous standards which are i n some measure r e f l e c t e d i n the analysis of the data; Professor A l b e r t Rees was s p e c i a l l y h e l p f u l during the analysis planning p e r i o d , and Professors Harry Johnson and George Shultz made u s e f u l suggestions and c r i t i c i s m s of the manuscript.
The data used were c o l l e c t e d by the Survey Research Center under contract t o Hope College which acted as agent of the Michigan State L e g i s l a t u r e w i t h f i n a n c i a l support from the M e r r i l l Foundation f o r the Ad/ancement of Fin a n c i a l Knowledge. The cooperation of the Michigan Employment Security Commission was e s s e n t i a l t o the successful sampling and d-ita c o l l e c t i o n program. Messrs. Max Horton, James Jones, Guy Tracy, Norman Barcus and James Sagel of the Michigan Employment Security Commission and Professors L e s l i e Kish and Charles Cannell of the Survey Research Center were i n s t r u mental to the success of the Hope College data c o l l e c t i o n . Professors Dwight B. Yntema of Hope College, D i r e c t o r of the study, gave me the opp o r t u n i t y to a s s i s t w i t h the data c o l l e c t i o n and t o undertake t h i s separate analysis.
i i
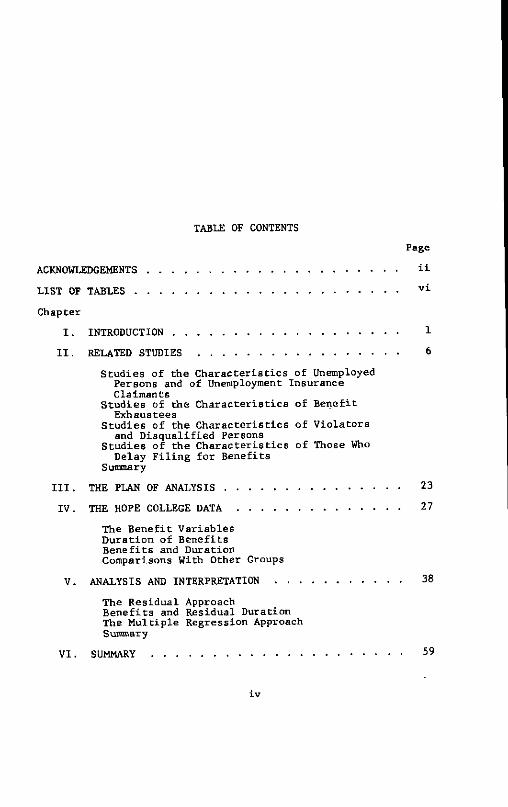
TABLE OF CONTENTS Page
ACKNOWLEDGEMENTS i i -LIST OF TABLES v i
Chapter I . INTRODUCTION 1
I I . RELATED STUDIES 6 Studies of the Ch a r a c t e r i s t i c s of Unemployed
Persons and of Unemployment Insurance Claimants
Studies of the C h a r a c t e r i s t i c s of Benefit Exhaustees
Studies of the Ch a r a c t e r i s t i c s of V i o l a t o r s and D i s q u a l i f i e d Persons
Studies of the Ch a r a c t e r i s t i c s of Those Who Delay F i l i n g f o r Benefits
Summary I I I . THE PLAN OF ANALYSIS 23 IV. THE HOPE COLLEGE DATA 27
The B e n e f i t Variables D u r a t i o n of Benefits B e n e f i t s and Duration Comparisons With Other Groups
V. ANALYSIS AND INTERPRETATION 38 The Residual Approach B e n e f i t s and Residual Duration The M u l t i p l e Regression Approach Summary
V I . SUMMARY 59
i v

I am a l s o pleased t o acknowledge Professors Ignacy Aleksandrowicz and John Lydenberg, of the Hobart College f a c u l t y , who by t h e i r example introduced me as an undergraduate to t h a t which i s f i n e i n our academic communities, and Professors I t h i e l de Sola Pool and George Katona, who at d i f f e r e n t times were supervisor and colleague to me and from whom I have learned much.
F i n a l l y I would l i k e t o mention the continuous encouragement of my w i f e , Barbara Alleman Lini n g e r , and the forebearance of my c h i l d r e n , Liz and Andy Lininger.
i i i
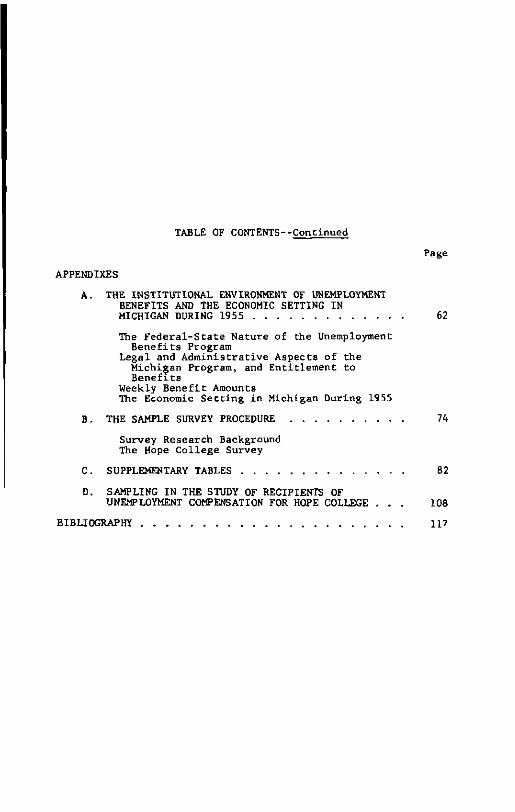
TABLE OF CONTENTS- -Continued Page
APPENDIXES A. THE INSTITUTIONAL ENVIRONMENT OF UNEMPLOYMENT
BENEFITS AND THE ECONOMIC SETTING IN MICHIGAN DURING 1955 62 The Federal-State Nature of the Unemployment
Benefits Program Legal and Admi n i s t r a t i v e Aspects of the
Michigan Program, and Entitlement to Benefits
Weekly Benefit Amounts The Economic S e t t i n g i n Michigan During 1955
B. THE SAMPLE SURVEY PROCEDURE 74 Survey Research Background The Hope College Survey
C. SUPPLEMENTARY TABLES 82 D. SAMPLING IN THE STUDY OF RECIPIENTS OF
UNEMPLOYMENT COMPENSATION FOR HOPE COLLEGE . . . 108 BIBLIOGRAPHY 117
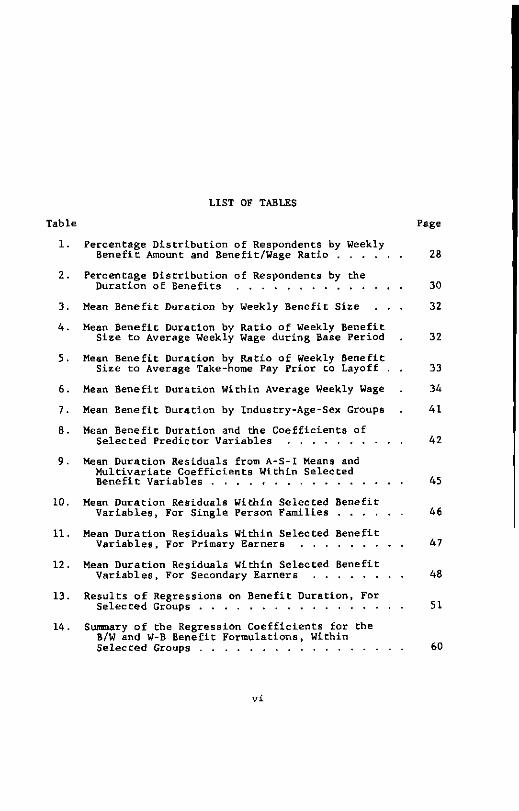
LIST OF TABLES Table Page
1. Percentage D i s t r i b u t i o n of Respondents by Weekly Be n e f i t Amount and Benefit/Wage Ratio 28
2. Percentage D i s t r i b u t i o n of Respondents by the Duration of Benefits 30
3. Mean Benefit Duration by Weekly Benefit Size . . . 32 4. Mean Benefit Duration by Ratio of Weekly Benefit
Size t o Average Weekly Wage during Base Period . 32 5. Mean Benefit Duration by Ratio o f Weekly Benefit
Size to Average Take-home Pay P r i o r to Layoff . . 33 6. Mean B e n e f i t Duration Within Average Weekly Wage 34 7. Mean B e n e f i t Duration by Industry-Age-Sex Groups . 41 8. Mean B e n e f i t Duration and the C o e f f i c i e n t s of
Selected Predictor Variables 42 9. Mean Duration Residuals from A-S-I Means and
M u l t i v a r i a t e C o e f f i c i e n t s Within Selected B e n e f i t Variables 45
10. Mean Duration Residuals Within Selected Benefit Variables, For Single Person Families 46
11. Mean Duration Residuals W i t h i n Selected Benefit Variables, For Primary Earners 47
12. Mean Duration Residuals Within Selected Benefit Variables, For Secondary Earners 48
13. Results o f Regressions on B e n e f i t Duration, For Selected Groups 51
14. Summary o f the Regression C o e f f i c i e n t s f o r the B/W and W-B Benefit Formulations, Within Selected Groups • • 60
v i
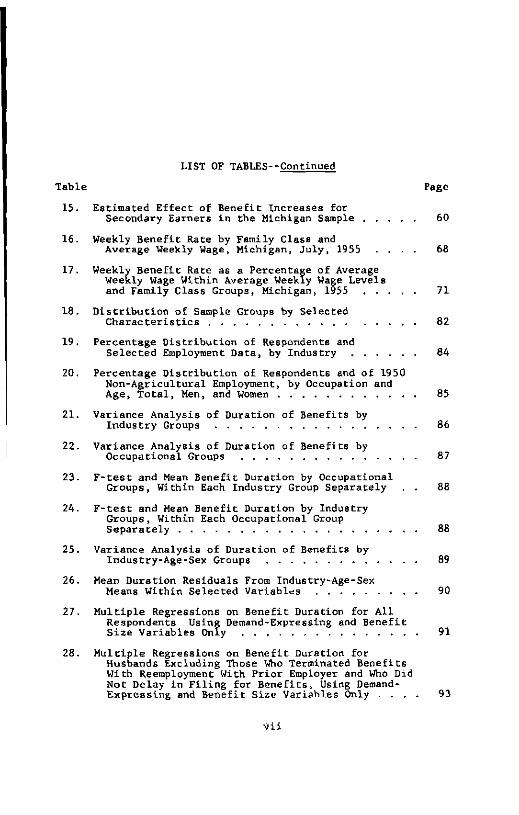
LIST OF TABLES--Continued Table Page 15. Estimated E f f e c t of Benefit Increases for
Secondary Earners i n the Michigan Sample 60 16. Weekly B e n e f i t Rate by Family Class and
Average Weekly Wage, Michigan, J u l y , 1955 . . . . 68 17. Weekly B e n e f i t Rate as a Percentage of Average
Weekly Wage Within Average Weekly Wage Levels and Family Class Groups, Michigan, 1955 71
18. D i s t r i b u t i o n of Sample Groups by Selected C h a r a c t e r i s t i c s 82
19. Percentage D i s t r i b u t i o n of Respondents and Selected Employment Data, by Industry 84
20. Percentage D i s t r i b u t i o n of Respondents find of 1950 Non-Agricultural Employment, by Occupation and Age, T o t a l , Men, and Women . 85
21. Variance Analysis of Duration of Benefits by In d u s t r y Groups 86
22. Variance Analysis of Duration of Benefits by Occupational Groups 87
23. F-test and Mean Benefit Duration by Occupational Groups, Within Each Industry Group Separately . . 88
24. F-test and Mean Benefit Duration by Industry Groups, Within Each Occupational Group Separately 88
25. Variance Analysia of Duration o f Benefits by Industry-Age-Sex Groups 89
26. Mean Duration Residuals From Industry-Age-Sex Means Within Selected Variables 90
27. M u l t i p l e Regressions on Benefit Duration f o r A l l Respondents Using Demand-Expressing and B e n e f i t Size Variables Only 91
28. M u l t i p l e Regressions on Benefit Duration f o r Husbands Excluding Those Who Terminated Benefits With Reemployment With P r i o r Employer and Who Did Not Delay i n F i l i n g f o r Benefits, Using Demand-Expressing and Benefit Size Variables Only . . . . 93
v i i

LIST OF TABLES--Continued Table Page 29. M u l t i p l e Regressions on Benefit Duration f o r
Primary Earners Who Terminated Benefits w i t h New Employment, Using Demand-Expressing and Benefit Size Variables and Selected Other Variables 95
30. M u l t i p l e Regressions on Benefit Duration f o r Primary Earners Who Terminated Benefits as Exhaustee, Using Demand-Expressing and Benefit Size Variables and Selected Other Variables . . . . 96
31. M u l t i p l e Regressions on B e n e f i t Duration f o r Primary Earners Who Terminated Benefits w i t h Customary Employing, Using Demand-Expressing and Benefit Size Variables and Selected Other Variables 98
32. M u l t i p l e Regressions on B e n e f i t Duration f o r Wives Excluding Those Who Terminated Benefits w i t h Reemployment w i t h Prior Employer and Who Did Not Delay i n F i l i n g for B e n e f i t s , Using Demand-Expressing and B e n e f i t Size Variables Only 99
33. M u l t i p l e Regressions on Benefit Duration f o r Single, Other Excluding Those Who Terminated Benefits w i t h Reemployment w i t h P r i o r Employer and Who Did Not Delay i n F i l i n g f o r B e n e f i t s , Using Demand-Expressing and Benefit Size Variables Only . 101
34. M u l t i p l e Regressions on Benefit Duration f o r Secondary Earners Who Terminated Benefits w i t h New Employment, Using Demand-Expressing and Benefit Size Variables and Selected Other Variables . . . . 103
35. M u l t i p l e Regressions on Benefit Duration f o r Secondary Earners Who Terminated Benefits as Exhaustee, Using Demand-Expressing and Benefit Size Variables and Selected Other Variables . . . . 104
36. M u l t i p l e Regressions on Benefit Duration f o r Secondary Earners Who Terminated Benefits w i t h Customary Employment, Using Demand-Expressing and Benefit Size Variables and Selected Other Variables 106
37. Units of Measurement for Variables i n Tables 29-31, 34-36 107
v i i i
LIST OF TABLES--Continued
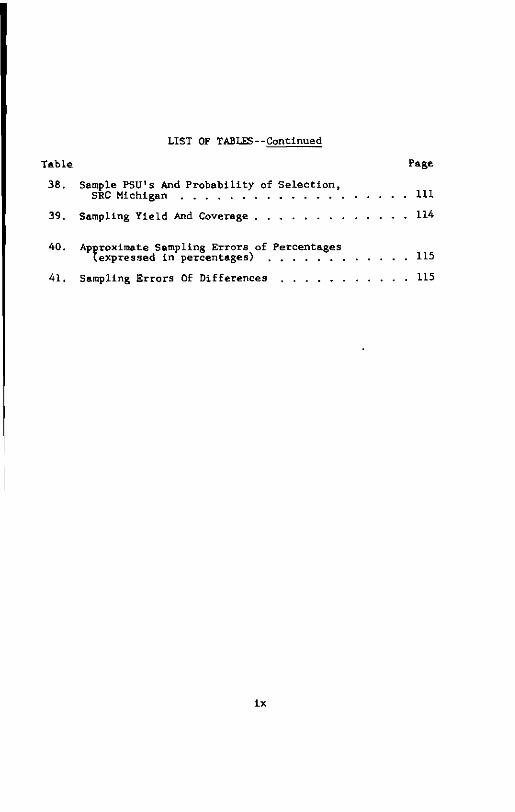
Table Page 38. Sample PSU's And P r o b a b i l i t y of S e l e c t i o n ,
SEC Michigan H I 39. Sampling Y i e l d And Coverage 114
40. Approximate Sampling Errors of Percentages (expressed i n percentages) 115
41. Sampling Errors Of Differences 115
i x

CHAPTER I
INTRODUCTION
The i n c e n t i v e aspects of unemployment compensation payments have been a matter of controversy f o r many years. The ass e r t i o n has f r e q u e n t l y been made t h a t higher levels of weekly unemployment compensation payments induce people to draw benefits f o r longer periods of time than they would at lower l e v e l s . Higher weekly payments have been seen as i n h i b i t i n g some people from t a k i n g s u i t able jobs and others from withdrawing from the labor market comp l e t e l y . These assertions have been used i n arguments against i n creasing the size of weekly b e n e f i t s .
Others have denied t h a t such r e l a t i o n s h i p s e x i s t . They maintain t h a t b e n e f i t claimants are industrious and do not want to continue i n b e n e f i t status when employment i s a v a i l a b l e . They also p o i n t out t h a t the r a t i o of average weekly b e n e f i t size to average weekly wage has declined. They c i t e t h i s f i n d i n g as evidence t h a t , i n general, the l e v e l of support i s now lower, and argue that i n creases i n the size of weekly b e n e f i t s are needed on welfare grounds.
An important part of the controversy about the i n c e n t i v e aspects o f unemployment compensation payments centers, t h e r e f o r e , on the si z e of weekly b e n e f i t s . The question i s : Does the size of weekly unemployment compensation payments a f f e c t the length of time i n d i v i d u a l s draw benefits?
1

2 Attempts to answer t h i s question have involved t a b u l a t i n g
the duration o f b e n e f i t s i n weeks f o r various subgroups of the claimant population by weekly b e n e f i t size i n d o l l a r s . Average weekly wage has also been tabulated. The c r i t i c a l d e f i c i e n c y here i s the absence of any attempt to c o n t r o l the i n f l u e n c e o f wide d i f ferences i n the kinds of employment o p p o r t u n i t i e s a v a i l a b l e to d i f f e r e n t types o f claimants.
I t i s contended i n t h i s study t h a t , i f the e f f e c t s of other appropriate v a r i a b l e s are c o n t r o l l e d , an association o f longer durat i o n of b e n e f i t s w i t h higher weekly wages p r i o r to unemployment would be evidence o f the d i s i n c e n t i v e e f f e c t of b e n e f i t size. Furthermore, the i n c e n t i v e question can be studied w i t h data from a cross-section sample of unemployment compensation r e c i p i e n t s . This study, theref o r e , i s focused on the r e l a t i o n s h i p s o f two major v a r i a b l e s , weekly b e n e f i t size and the d u r a t i o n of b e n e f i t s , while the e f f e c t s of other v a r i a b l e s are s t a t i s t i c a l l y c o n t r o l l e d .
The data f o r t h i s study were c o l l e c t e d f o r a cross-section sample of b e n e f i t r e c i p i e n t s i n the s t a t e of Michigan i n 1955 by personal interviews and from a d m i n i s t r a t i v e records. The range of weekly b e n e f i t payments i n Michigan during 1955 appears to have been broad enough i n d o l l a r amounts and as a percentage o f wages to provide a t e s t of the responsiveness of the dur a t i o n to b e n e f i t s to weekly b e n e f i t s i z e . I t would have been desirable to extend t h i s analysis over data which contain even greater v a r i a b i l i t y , but b e n e f i t s i z e could not, of course, be va r i e d experimentally under c o n t r o l l e d conditions and comparable data f o r other states
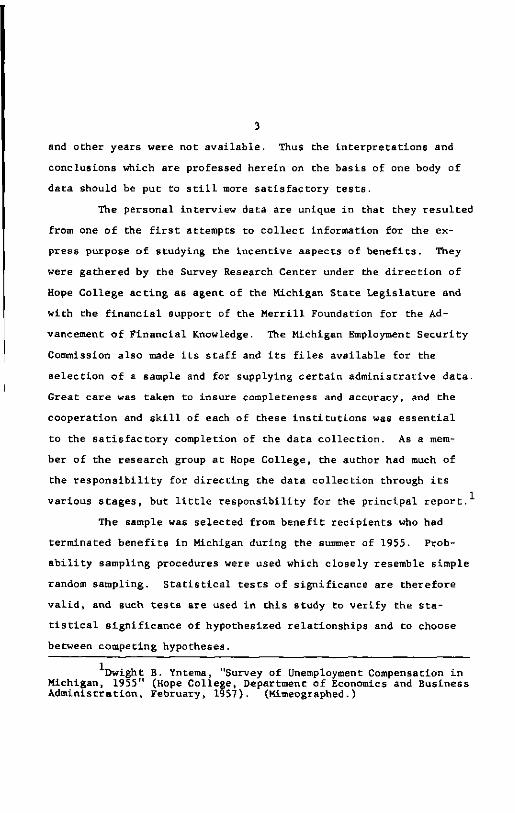
3 and other years were not a v a i l a b l e . Thus the i n t e r p r e t a t i o n s and conclusions which are professed herein on the basis of one body of data should be put to s t i l l more s a t i s f a c t o r y t e s t s .
The personal i n t e r v i e w data are unique i n that they r e s u l t e d from one o f the f i r s t attempts to c o l l e c t information f o r the express purpose o f studying the i n c e n t i v e aspects of b e n e f i t s . They were gathered by the Survey Research Center under the d i r e c t i o n of Hope College a c t i n g 36 agent of the Michigan State L e g i s l a t u r e and w i t h the f i n a n c i a l support of the M e r r i l l Foundation f o r the Advancement o f F i n a n c i a l Knowledge. The Michigan Employment Se c u r i t y Commission also made i t s s t a f f and i t s f i l e s a v ailable f o r the s e l e c t i o n o f a sample and for supplying c e r t a i n a d m i n i s t r a t i v e data. Great care was taken to insure completeness and accuracy, and the cooperation and s k i l l o f each of these i n s t i t u t i o n s was e s s e n t i a l to the s a t i s f a c t o r y completion of the data c o l l e c t i o n . As a member of the research group at Hope College, the author had much of the r e s p o n s i b i l i t y f o r d i r e c t i n g the data c o l l e c t i o n through i t s various stages, but l i t t l e r e s p o n s i b i l i t y f o r the p r i n c i p a l report.^"
The sample was selected from b e n e f i t r e c i p i e n t s who had terminated b e n e f i t s i n Michigan during the summer of 1955. Proba b i l i t y sampling procedures were used which closely resemble simple random sampling. S t a t i s t i c a l t e s t s of s i g n i f i c a n c e are therefore v a l i d , and such te s t a are used i n t h i s study to v e r i f y the s t a t i s t i c a l s i g n i f i c a n c e of hypothesized r e l a t i o n s h i p s and to choose between competing hypotheses.
^"Dwight B. Yntema, "Survey of Unemployment Compensation i n Michigan, 1955" (Hope College, Department o f Economics and Business A d m i n i s t r a t i o n , February, 19S7). (Mimeographed.)

4 At the time of the sample s e l e c t i o n i n 1955, employment
conditions i n Michigan were generally good. Recipients of unemployment b e n e f i t s probably f e l t t h a t they could pass up opportunit i e s f o r employment because other jobs would soon be forthcoming. As a r e s u l t , they tended t o exercise greater d i s c r e t i o n i n the number of weeks of b e n e f i t s they received than they would have had i f employment conditions had been worse.^ D i s c r e t i o n does not necessarily r e s u l t i n malingering however, or even i n maximum u t i l i z a t i o n of the b e n e f i t program. A n a t i o n a l sample survey conducted by the Unive r s i t y of Michigan's Survey Research Center i n 1958 revealed that many persons who had l e g a l r i g h t s to b e n e f i t s under e x i s t i n g state and f e d e r a l laws had not received b e n e f i t s f o r p a r t or a l l
2 of the time they were unemployed. When asked why, they said that they j u s t d i d n o t apply at a l l , or d i d not apply as soon as they were e l i g i b l e f o r unemployment b e n e f i t s .
Discussions of the i n c e n t i v e aspects of b e n e f i t s o f t e n r e f e r to the amount of malingering and known cases of v i o l a t i o n s of the s p i r i t of the unemployment compensation program as though they were a d i r e c t measure of the d i s i n c e n t i v e e f f e c t of weekly b e n e f i t s i z e . Systematic c o l l e c t i o n s of data on the incidence of fraud or malingering could be analyzed i n the same manner as the d u r a t i o n of
'''Additional i n f o r m a t i o n on the economic s e t t i n g i n Michigan during 1955 and the i n s t i t u t i o n a l background o f the unemployment compensation program i s presented i n Appendix A.
2 Wilbur J. Cohen, William Haber, and Eva Mueller, The Impact
of Unemployment i n Che 1958 Recession, A Report to the Special Committee on Unemployment Problems, U. S. Senate, 86th Congress, Second Session, pursuant to Senate Resolution 252, June, 1960 (Washington: Government P r i n t i n g O f f i c e , 1960), p. 34.
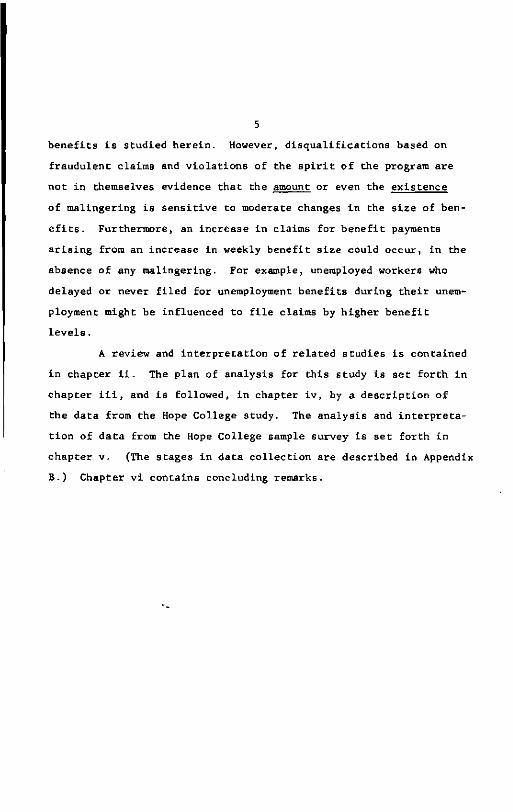
5 be n e f i t s i s studied herein. However, d i s q u a l i f i c a t i o n s based on fraudulent claims and v i o l a t i o n s of the s p i r i t o f the program are not i n themselves evidence t h a t the amount or even the existence of malingering i s s e n s i t i v e to moderate changes l n the size of bene f i t s . Furthermore, an increase I n claims f o r b e n e f i t payments a r i s i n g from an increase i n weekly b e n e f i t size could occur, i n the absence of any malingering. For example, unemployed workers who delayed or never f i l e d f o r unemployment benefits during t h e i r unemployment might be influenced to f i l e claims by higher b e n e f i t l e v e l s .
A review and i n t e r p r e t a t i o n o f r e l a t e d studies i s contained i n chapter i i . The plan of analysis f o r t h i s study i s set f o r t h I n chapter i i i , and i s followed, i n chapter i v , by a d e s c r i p t i o n o f the data from the Hope College study. The analysis and i n t e r p r e t a t i o n of data from the Hope College sample survey i s set f o r t h i n chapter v. (The stages i n data c o l l e c t i o n are described i n Appendix B.) Chapter v i contains concluding remarks.

CHAPTER I I
RELATED STUDIES
The l i t e r a t u r e dealing d i r e c t l y w i t h the i n f l u e n c e of the size of weekly unemployment be n e f i t s on the dur a t i o n of such b e n e f i t s i s very l i m i t e d . Nevertheless, there have been many r e p o r t s on experience under the unemployment compensation programs, on types of unemployment, and on the responses of persons to unemployment experience, which suggest the c h a r a c t e r i s t i c s of persona whose r e sponse to a change i n b e n e f i t amounts w i l l be greatest.
Studies of the C h a r a c t e r i s t i c s of Unemployed Persons and of Unemployment Insurance Claimants
Unemployment i s the r e s u l t of a v a r i e t y of f a c t o r s . During 1955-1957, years of r e l a t i v e p r o s p e r i t y , 20 per cent of the unemployed were new entrants or re-entrants to the labor f o r c e . ^ Voluntary s h i f t i n g about accounted f o r approximately 10 per cent o f the unemployment i n t h a t p eriod, and a t l e a s t 20 per cent was a t t r i b u t a b l e to seasonal f a c t o r s . The Department of Labor study estimated that another 10 per cent was due to s t r u c t u r a l changes over the decade from goods production to service production, and about 40 per cent was not measured. This study Incorporated the f o l l o w i n g observations about the s i g n i f i c a n c e of d u r a t i o n of unemployment:
1U. S. Department o f Labor, "The Extent and Nature of F r i c -t i o n a l Unemployment," Study Paper No. 6 f o r the J o i n t Economic Commit t e e , Congress of the United States (Washington, D.C, 1959).
6

7 The shorter the period of time a person has been out of a j o b , the greater the l i k e l i h o o d he w i l l be re-employed q u i c k l y . The reasons f o r these patterns i s not so much that d u r a t i o n o f unemployment i t s e l f renders the worker less employable, r a t h e r the p o i n t Beems to be t h a t duration of unemployment i t s e l f i s r e l a t e d to the personal and economic c h a r a c t e r i s t i c s o f workers and whatever c h a r a c t e r i s t i c s or s i t u a t i o n s caused them to be unemployed f o r varying times i n the f i r s t place, also determines t h e i r chances f o r re-employment i n any given month. 1
Another study of unemployed persons made by the Department 2
of Labor focused on labor surplus areas i n 1956-1957. At l e a s t o n e - f i f t h of t o t a l unemployment i n those years o r i g i n a t e d i n chroni c a l l y depressed areas and other areas of su b s t a n t i a l labor surplus and had much more serious welfare i m p l i c a t i o n s than d i d unemployment elsewhere. Long term unemployment was higher i n these areas and was concentrated to a la r g e r extent among adu l t men. The proport i o n of women i n the labor force was higher than i t was elsewhere, a r e s u l t , i n p a r t of the types of i n d u s t r i e s i n those areas.
Turning s p e c i f i c a l l y to the c h a r a c t e r i s t i c s of unemployment insurance r e c i p i e n t s , n a t i o n a l sample data s t a r t e d i n 1956 made i t possible t o compare t h i s group w i t h the n a t i o n a l labor f o r c e . ^ Certain groups were e a s i l y i d e n t i f i e d as d i f f e r e n t i n t h e i r claims experience. The proportion of males, u n s k i l l e d workers, and persons over f o r t y - f i v e years of age, were la r g e r i n the r e c i p i e n t population 1 I b i d . , p. 35.
U.S. Department of Labor, "The Structure of Labor i n Areas o f S u b s t a n t i a l Labor Surplus," Study Paper No. 23 f o r the J o i n t Economic Committee, Congress of the United States (Washington, D.C, I960).
3 U.S. Department of Labor, "Characteristics o f the Insured
Unemployed: (A Monthly Report)" (Washington. May, 1956-June, 1957). (Mimeographed.) U.S. Department of Labor, "Characteristics of the Unemployed: (A Monthly Report)" (Washington, Ju l y , 1957-September, 1958). (Mimeographed.) U.S. Department of Labor, "Monthly Report on the Labor Force" (Washington, Ju l y , 1959-present). (Mimeographed.)
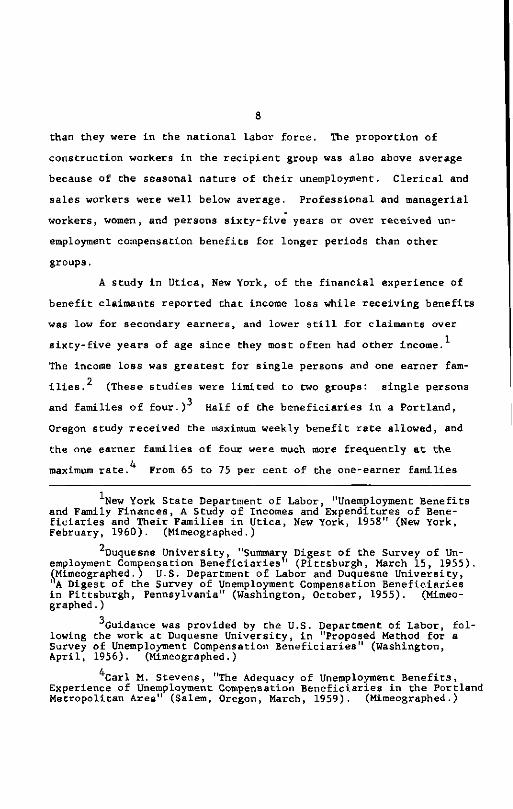
8 than they were I n the n a t i o n a l labor force. The proportion of construction workers i n the r e c i p i e n t group was also above average because of the seasonal nature of t h e i r unemployment. C l e r i c a l and sales workers were w e l l below average. Professional and managerial workers, women, and persons s i x t y - f i v e years or over received unemployment compensation b e n e f i t s f o r longer periods than other groups.
A study i n Utica, New York, o f the f i n a n c i a l experience of b e n e f i t claimants reported t h a t income loss while r e c e i v i n g b e n e f i t s was low f o r secondary earners, and lower s t i l l f o r claimants over s i x t y - f i v e years of age since they most o f t e n had other income.'' The income loas was greatest f o r s i n g l e persons and one earner fam-i l i e s . (These studies were l i m i t e d to two groups: s i n g l e persons and f a m i l i e s o f f o u r . ) ^ Half of the b e n e f i c i a r i e s i n a Portland, Oregon 6tudy received the maximum weekly b e n e f i t r a t e allowed, and the one earner f a m i l i e s of four were much more f r e q u e n t l y a t the maximum r a t e . ^ From 65 to 75 per cent of the one-earner f a m i l i e s
''"New York State Department of Labor, "Unemployment Benefits and Family Finances, A Study of Incomes and Expenditures o f Benef i c i a r i e s and Their Families i n Utica, New York, 1958" (New York, February, 1960) . (Mimeographed.)
Duquesne U n i v e r s i t y , Summary Digest of the Survey of Unemployment Compensation Beneficiaries'" ( P i t t s b u r g h , March 15, 1955). ("Mimeographed.) U.S. Department of Labor and Duquesne U n i v e r s i t y , "A Digest of the Survey of Unemployment Compensation B e n e f i c i a r i e s i n Pittsburgh, Pennsylvania" (Washington, October, 1955). (Mimeographed .)
3 Guidance was provided by the U.S. Department of Labor, f o l
lowing the work at Duquesne U n i v e r s i t y , i n "Proposed Method f o r a Survey of Unemployment Compensation B e n e f i c i a r i e s " (Washington, A p r i l , 1956). (Mimeographed.)
^Carl M. Stevens, "The Adequacy of Unemployment B e n e f i t s , Experience of Unemployment Compensation B e n e f i c i a r i e s i n the Portland Metropolitan Area" (Salem, Oregon, March, 1959). (Mimeographed.)
9 of four received b e n e f i t s which were less than h a l f as large as t h e i r former weekly take-home pay. From 50 to 75 per cent of the persons i n various groups studied had reduced t h e i r savings. Subs t a n t i a l numbers of single persons and one earner family heads i n St. Louis had dropped t h e i r medical insurance.*
Katz found t h a t p a r t i c i p a t i o n i n the labor force by secondary workers was p o s i t i v e l y associated w i t h longer du r a t i o n of
2 unemployment o f the family head. Furthermore, the p a r t i c i p a t i o n was i n v e r s e l y r e l a t e d to the general l e v e l of unemployment i n the l o c a l area, I n d i c a t i n g the e f f e c t of the economic environment on the success o f a desire to work. I n general, the presence of small c h i l d r e n i n the family r e s t r i c t e d p a r t i c i p a t i o n i n the labor force by secondary workers, but separate regressions f o r f a m i l i e s w i t h c h i l d r e n o f various ages showed that women wit h pre-school c h i l d r e n reacted more s t r o n g l y to t h e i r husbands' unemployment, perhaps t a k i n g work w h i l e leaving the husband to care f o r the household. Women w i t h older c h i l d r e n reacted more moderately to t h e i r husbands' unemployment.
I t appears that the length o f unemployment i n i t s e l f does not n e c e s s a r i l y render persons unemployable, but that s e l e c t i v e f a c t o r s operate so that p a r t i c u l a r types of persons are more f r e quently unemployed or more l i k e l y to be unemployed f o r longer periods. The f i n a n c i a l experience of d i f f e r e n t types of claimants
'''Washington Un i v e r s i t y School of Business and Public Administ r a t i o n , "Survey o f Unemployment Compensation B e n e f i c i a r i e s i n St. Louis C i t y and St. Louis County, Missouri, A p r i l , 1958" (St. Louis, June, 1959). (Mimeographed.)
Arnold Katz, " C y c l i c a l Unemployment and the Secondary Fami l y Worker" (Washington: By the author, 1962).
10 i s not the same. The unemployment experienced by new entrants or re-entrants to the labor force or by persons who are s h i f t i n g about i s not l i k e l y to be compensable under present unemployment compensat i o n programs. Unemployment o r i g i n a t i n g from seasonal f a c t o r s and s t r u c t u r a l changes i s l i k e l y to be compensable, and f o r some types of seasonal unemployment which can be a n t i c i p a t e d , unemployment compensation i s probably incorporated i n the work and wage l e v e l decisions. The relevance of need, which a l l economists would postulate on a p r i o r i grounds to be i n f l u e n t i a l i n work decisions, i s confirmed by e m p i r i c a l data on the proportion of women and secondary earners i n the labor force. Empirical data also r e v e a l the. disp r o p o r t i o n a t e frequency of c e r t a i n types of workers among unemployment compensation r e c i p i e n t s and among the longer term unemployed .
Studies of the C h a r a c t e r i s t i c s o f Benefit Exhaustees B e n e f i t r e c i p i e n t s who drew a l l the b e n e f i t payments to
which they were e n t i t l e d during a period are c a l l e d exhaustees. They were f r e q u e n t l y studied as a group d u r i n g the 1950's, i n many d i f f e r e n t states and i n various years.* There are marked s i m i l a r i t i e s I n the f i n d i n g s from the d i f f e r e n t states and the d i f f e r e n c e s which appeared seem to be l a r g e l y a t t r i b u t a b l e to d i f f e r e n t indust r i a l compositions of the states and to the general economic condit i o n s which p r e v a i l e d .
Two studies i n Oregon, one i n 1956 during r e l a t i v e l y good times and another i n 1958 during r e l a t i v e l y poor times i n d i c a t e
'''Many of these followed the lead of the U.S. Department o f Labor i n "A Guide to the Conduct of Post-Exhaustion Studies," UIPL No. 384 (Washington, August, 1955). (Mimeographed.)
that between 1956 and 1958 the exhaustion r a t i o increased many more times f o r men than f o r women.* I n Massachusetts when the durable goods i n d u s t r i e s were depressed, proportionately more men exhausted
2 t h e i r b e n e f i t s than at other times. The most depressed areas i n Pennsylvania had the highest percentage of exhau6tees who were able
3 t o f i n d some type of re-employment a f t e r t h e i r exhaustion. However, re-employment does not always mean r e t u r n to f u l l - t i m e work. The Pennsylvania study showed t h a t four months a f t e r they had stopped drawing b e n e f i t s , 20 per cent of the exhaustees who had been re-employed were only working part-time.
A m a j o r i t y of exhaustees are married and have dependents, but i n general the exhaustees as a group contained more older persons and more women than d i d a l l claimants for unemployment b e n e f i t s . The employment o f exhaustees i s t y p i c a l l y l e s 6 s t a b l e , and t h e i r earnings i n the base period are lower; they are less s k i l l e d and generally have a lower l e v e l of education than do a l l claimants. A study made i n New Jersey f o l l o w i n g a r e l a t i v e l y prosperous base period revealed that one-half of the exhaustees had worked less than t h i r t y - f i v e weeks during the twelve-month period and had
^Oregon State Department of Employment, "Experience of Claimants Exhausting Benefit Rights Under Unemployment Insurance l n Oregon, 1958 and 1956 Surveys Compared" (Salem, J u l y , 1959). (Mimeographed.)
2 Commonwealth of Massachusetts, D i v i s i o n of Employment
Se c u r i t y , " C h a r a c t e r i s t i c s and Labor Force Status as o f November 22, 1958 o f Claimants Who Had Exhausted Benefits Between January 1 and September 20, 1958" (Boston, January, 1960). (Mimeographed.)
3 Pennsylvania Bureau of Employment Security, Labor Force
Status of Workers A f t e r Exhausting Unemployment Compensation Bene f i t s i n Pennsylvania, 1957-1958" (Harrisburg, I960). (Mimeographed . )
12 earned less than $2,OOO.1 One-half of the exhaustees d i d not quali f y for maximum duration of b e n e f i t s . Nevertheless, 44 per cent of the exhaustees d i d not exhaust t h e i r b e n e f i t r i g h t s I n one s p e l l of unemployment.
Exhaustees studied i n Michigan e a r l y i n 1950 reported 2
d i f f e r i n g means of support during the post-exhaustion period. The younger exhaustees more freq u e n t l y had assistance from r e l a t i v e s w h i le the older exhaustees r e l i e d more h e a v i l y on savings. The middle aged exhaustees most o f t e n had casual employment.
Studies i n several states showed t h a t during the f i r s t two months a f t e r exhausting t h e i r b e n e f i t s , generally less than 15 per cent of the exhaustees had withdrawn from the labor market. A f t e r four months the proportions of the exhaustees who had l e f t the labor market ranged l n the various states from 10 to 19 per cent. Women and persons s i x t y - f i v e years of age and over tended to withdraw from the labor force more o f t e n than others."* The older workers who withdrew from the labor force claimed to have done so because they were discouraged about the p o s s i b i l i t y of being re-employed.
New Jersey Department of Labor and Ind u s t r y , "After Unemployment Insurance, An Analysis of the C h a r a c t e r i s t i c s and Post-exhaustion Experience o f Claimants Exhausting Unemployment Insurance Benefits During the Six-Month Period July Through December, 1957" (Trenton, March, 1960). (Mimeographed.)
2Ronald S. Johnson, "A Study o f People Who Have Exhausted Unemployment Ben e f i t s i n an Active Labor Market" (Ann Arbor: Univ e r s i t y of Michigan Bureau of Business Research, 1951), p. 61. (Paper.)
U.S. Department of Labor, Bureau of Employment Securit y , "Experience of Claimants Exhausting Unemployment Insurance Benefit Rights, January-March 1956, 14 States," BES Report No. U-168 (Washington, D.C, A p r i l , 1957). (Mimeographed.)
^Pennsylvania Bureau of Employment Securit y , "Labor Force and Claim Status o f Workers During the Sixteen Months Following Exhaustion of Unemployment Compensation Benefits i n Pennsylvania" (Harrisburg, n.d.). (Mimeographed.)
13 I n two s t a t e s , Vermont and Missouri, women under twenty-five years of age withdrew from the labor market i n disproportionate numbers.*" Exhaustees from the lowest income groups also tended to withdraw at
1
a higher r a t e . There appeared to be no disproportionate withdrawal from the labor force of exhaustees who had been employed i n c l e r i c a l , sales, and service occupations or i n the finance, insurance, and
3
r e a l estate i n d u s t r i e s . One-half of the exhaustees were unemployed and looking f o r
work two months a f t e r they had exhausted t h e i r b e n e f i t s ; and 35 to 45 per cent were s t i l l unemployed and look i n g f o r work a f t e r four months.
Among the exhaustees the re-eraployment r a t e was highest among the young and lowest among the o l d . Three-fourths o f men and women s i x t y - f i v e and over found no work while only one-third of the younger men and one-half of the younger women did not f i n d work. I t was generally t r u e t h a t re-employment was highest among those who had received maximum b e n e f i t amounts and lowest among those who had
^Vermont Unemployment Compensation Commission, "Labor Market Experience o f UC Exhaustees" (Montpelier, Vt., August, 1958j. (Mimeographed.) Idem , "Labor Market Experience of Ul Exhaustees" (Montpelier, Vt., May, 1960). (Mimeographed.)
Missouri D i v i s i o n of Employment Securit y , " C h a r a c t e r i s t i c s and Labor Market Status of Missouri Claimants Exhausting Unemployment Insurance Rights, February 1957-July 1957" (Jefferson C i t y , Mo., November, 1958) . (Mimeographed.)
3 "Experience o f Claimants Who Have Exhausted Ul Rights,"
Labor Market and Employment Security. November, 1957, pp. 1-5, 17. ^U.S. Department of Labor, Bureau of Employment Security,
"Experience of Claimants Exhausting Benefit Rights Under Unemployment Insurance, 17 Selected States," BES Report No. U-178 (Washi n g t o n , D.C, December, 1958). (Mimeographed.)
14 received the low b e n e f i t s . S i m i l a r l y the re-employment r a t e waa high among those whose earnings had been high.
Seasonality of employment exercised an important i n f l u e n c e on the r a t e o f re-employment. Occupation exercised l i t t l e I n f l u ence except as i t was r e l a t e d to seasonality. In North Carolina the re-employment r a t e was highest f o r non-whites and t h i s was a t t r i b u t a b l e to the seasonal nature o f t h e i r work.''" I n North Dakota seasonality was mentioned as one of the most important f a c t o r s as-
2 sociated w i t h re-employment.
The r a t e of re-employment by sex d i f f e r e d s u b s t a n t i a l l y from s t a t e to s t a t e . I n several states there was l i t t l e d i f f e r e n c e i n the rates of re-employment of men and women, whereas I n another s t a t e men returned to work sooner than women and i n s t i l l another sta t e more women returned to work more o f t e n than men.
Studies of the C h a r a c t e r i s t i c s of V i o l a t o r s and D i s q u a l i f i e d Persons
Recipients of unemployment b e n e f i t s are required to be able, w i l l i n g and a v a i l a b l e to work. Despite serious e f f o r t s to judge each case c a r e f u l l y on pre-determined c r i t e r i a , the necessary time and e f f o r t i s not always a v a i l a b l e . Suitable work and amount of work, time of day, distance, sabbath considerations, seasonality, former earnings l e v e l , customary occupation, p r e v a i l i n g wage cond i t i o n s , f a m i l y r e s p o n s i b i l i t i e s i n c l u d i n g c h i l d b e a r i n g a f f e c t
*North Carolina Employment Security Commission, "A Study of the C h a r a c t e r i s t i c s and Labor Market Experience o f Claimants Exhausting B e n e f i t s i n Calendar 1957" (Raleigh, November, 1958). (Mimeographed.)
2 North Dakota Unemployment Compensation Commission,
"Claimants' Experience A f t e r Exhausting Benef i t s " (Bismarck, 1959). (Mimeographed.)

15 a v a i l a b i l i t y . Each o f these f a c t o r s produce marginal s i t u a t i o n s i n which o b j e c t i v e operational rules cannot determine a v a i l a b i l i t y f o r work.*" I n the most extensive study to date, Ralph Altraan has concluded t h a t the r o l e of the a v a i l a b i l i t y requirement i s t h a t o f "a gross sieve designed t o block the c l e a r l y u n f i t from e n t e r i n g or remaining i n the b e n e f i t system. . . . Some claimants w i l l get past such a p r e l i m i n a r y examination despite t h e i r actual unwillingness and i n a b i l i t y t o work."
Work te s t s i n the form of r e f e r r a l s to s u i t a b l e work are suggested as the " f i n e r s i e v e . T h e d i f f i c u l t i e s o f f i n d i n g openings which would provide s u i t a b l e work for each i n d i v i d u a l I s c l e a r l y recognized and are known to increase w i t h higher l e v e l s o f unemployment. The a d m i n i s t r a t i v e system cannot, therefore, be expected to operate so as to exclude a l l v i o l a t o r s from b e n e f i t s . I t operates best i n the case of workers to whom an actual work te s t can be a p p l i e d , and leaves more opportunity f o r v i o l a t i o n i n the remainin g cases. V i o l a t i o n , i t must be noted, c a r r i e s I n t h i s context the whole range of motivation from o u t r i g h t fraud on the one hand to the honest b e l i e f by the worker that he and society are benef i t e d by postponing h i s re-employment u n t i l he can f i n d more s u i t able work.
Becker has estimated t h a t v i o l a t o r s received 3 t o 4 per cent of a l l unemployment b e n e f i t payments made during the
*Ralph Altman, A v a i l a b i l i t y f o r Work: A Study i n Unemployment Compensation (Cambridge, Mass.: Harvard U n i v e r s i t y Press, 1950), pp. xv-350.
2 I b i d . , p. 87. 3 I b l d .

16 reconversion period f o l l o w i n g World War I I . * The r e s u l t s of the experience of a t e s t o f f i c e operated i n New York i n 1950 seemed to i n d i c a t e t h a t , i n New York at l e a s t , "not more than 1 or 2 per cent of a l l payments went to v i o l a t o r s . . . . " The proportion of claimants who at some time during the year made an improper c l a i m was estimated at 10 per cent. Special i n v e s t i g a t i o n s i n Michigan f o r the f i s c a l year 1961 found i n an 0.A.S.I, post-audit check t h a t possibly 2 per cent of the r e c i p i e n t s had received overpayments and i n sp e c i a l Industry surveys i n establishments w i t h high turnover rates and numerous new h i r i n g s t h a t about 3 per cent had received improper payments.
Becker found t h a t women predominate among the non-working v i o l a t o r s , and Altman contends t h a t women present the greatest problems to ad m i n i s t r a t o r s who are t r y i n g to apply c r i t e r i a f o r a v a i l a b i l i t y . Altman, who wrote i n 1950 or e a r l i e r , f e l t t h a t t h i s was not necessarily a permanent sta t e of a f f a i r s since many of t h e i r problems were due to the tur b u l e n t s h i f t s i n the employment status o f women dur i n g and a f t e r the war. The r e s u l t s o f a more recent study show, however, that women are one of the groups which have high d i s q u a l i f i c a t i o n r a t e s , i n d i c a t i n g that the problem has not d i s a p p e a r e d R e f u s a l of s u i t a b l e work was much more
*Joseph M. Becker, The Problem of Abuse i n Unemployment Benefits: A Study i n L i m i t s (New York: Columbia U n i v e r s i t y Press, 1953), p. 412.
2 l b l d . . p. 312. 3 Michigan Employment Security Commission, Annual Report f o r
F i s c a l Year 1960 ( D e t r o i t : January, 1961), p. 15. ^Washington Employment Security Department, "Study of Dis
q u a l i f i e d Claimants" (Olympla, 1961). (Mimeographed.)

17 prevalent as a reason f o r d i s q u a l i f i c a t i o n among women than among men; and among women i t was somewhat less prevalent a t older age l e v e l s than at younger l e v e l s . D i s q u a l i f i c a t i o n s based on misconduct were more frequent among men.
V i o l a t o r s tended to be more numerous, according to Becker, among che lower income, less educated workers who have more to gain f i n a n c i a l l y and less to lose s o c i a l l y by v i o l a t i o n s . . . . V i o l a t o r s are also more numerous among the employees of the seasonal i n d u s t r i e s , i n the i n d u s t r i e s which use piecework, among the longshoremen, and i n l o c a l i t i e s where many workers h a b i t u a l l y s h i f t between industry and a g r i c u l t u r e . 1
Claimants from the a i r c r a f t , finance, insurance, r e a l e s t a t e , and services i n d u s t r i e s and those who were under t h i r t y - f i v e years of age were r e c e n t l y found to have high d i s q u a l i f i c a t i o n rates i n the stat e of Washington.
Explanations may be i n f e r r e d f o r the greater frequency of v i o l a t i o n s o f the unemployment compensation b e n e f i t program among c e r t a i n groups. To women and to workers who l i v e i n areas where i t i s common pra c t i c e to s h i f t between industry and agr i c u l t u r e , c e r t a i n kinds of home work may frequently be a v a i l able which are d i f f i c u l t to detect. This work may of t e n be non-d i s q u a l i f y i n g , yet i t tends to o b l i t e r a t e the d i f f e r e n c e between the weekly b e n e f i t rate and the wage r a t e from wage employment. I n the seasonal i n d u s t r i e s l n which unemployment can usually be a n t i c i p a t e d , the wage rates are l i k e l y to r e f l e c t income which the worker can expect to receive from unemployment compensation and to a t t r a c t workers who w i l l a v a i l themselves of unemployment b e n e f i t s .
Hecker, p. 308.
18 F i n a l l y , the r e a l value of income from fraud or marginal v i o l a t i o n s or abuse o f the unemployment program i s greatest f o r those who le a s t fear, and are l e a s t l i k e l y , to be caught i n v i o l a t i o n .
Studies of the C h a r a c t e r i s t i c s of Those Who Delay F i l i n g for Benefits
The occurrence of delay i n f i l i n g f o r b e n e f i t s has been v e r i f i e d by recent studies. I n two labor market areas i n Pennsylvania almost 30 per cent of I n i t i a l claimants delayed f i l i n g , ' " and i n other studies of delayed f i l i n g the proportions ranged upward to a high of 37 per cent i n West V i r g i n i a . About an a d d i t i o n a l 10 per cent o f the I n i t i a l claims i n the West V i r g i n i a study were by persons out of the labor force the week p r i o r to f i l i n g , so t h a t only about 53 per cent of the i n i t i a l claims f o r unemployment benefits were from persons who were employed the previous week. I n a study made i n the stat e of New York i n 1957, delay i n f i l i n g was found to be a major cause of the discrepancy between the number of weeks o f unemployment and the number of weeks compensated by
3 unemployment insurance.
^Pennsylvania Bureau of Employment Securit y , "Delayed F i l i n g of I n i t i a l Claims, Altoona, Pennsylvania, 1959" (Harrisburg, n.d.). (Mimeographed.) Idem. "Delayed F i l i n g of I n i t i a l Claims, Lancaster, Pennsylvania, 1959" (Harrisburg, n.d.). (Mimeographed.)
2 West V i r g i n i a Department of Employment Securit y , "Special
Study of the Delayed F i l i n g of I n i t i a l Claims i n West V i r g i n i a ' s Labor Market, J u l y , 1957-June, 1958" (Charleston, W. Va., December, 1959). (Mimeographed.)
Columbia Bureau of Applied Social Research, "Bene f i t s , Incomes, and Expenditures of Unemployed Workers; Experience of a Group of Unemployment Insurance B e n e f i c i a r i e s i n Albany-Schenectady-Troy, Spring, 1957" (New York, September, 1958). (Mimeographed.)
19 Uniformly, persons who were making new claims f o r b e n e f i t s
delayed longer and more o f t e n than persona who had f i l e d other claims f o r b e n e f i t s e a r l i e r i n the year. I n F l o r i d a and West V i r g i n i a , looking f o r work was the most frequent reason given f o r delayed f i l i n g . * Age was not r e l a t e d to delay i n the Oklahoma study, but i n Pennsylvania the young and old delayed more. The proportions of men and women who delayed f i l i n g I n Pennsylvania were equal, but i n Oklahoma, where a special l a y o f f during the
2 survey period was of great i n f l u e n c e , women delayed less. There was more delayed f i l i n g among workers from c l e r i c a l , sales, and service occupations, and less from semi- s k i l l e d and u n s k i l l e d workers.
Two suppositions may be made about the two groups who d i f f e r i n the promptness of f i l i n g claims. On the one hand, the prevalence o f delayed f i l i n g i n d i c a t e d that claimants exercised some d i s c r e t i o n over the number of week6 f o r which they were compensated. I n response to a change i n weekly b e n e f i t r a t e s , t h i s group could e a s i l y increase t h e i r duration of b e n e f i t s , but i t appears t h a t they would be casual about e x p l o i t i n g such a change. On the other hand, those who d i d not delay appeared to use the program to the maximum extent. This group of claimants would probably be most responsive to changes i n the system to the extent t h a t they had d i s c r e t i o n .
''Florida I n d u s t r i a l Commission, "Florida Study of Delayed F i l i n g of I n i t i a l Claims" (Tallahassee, Fla., September, 1959). (Mimeographed.)
n
Oklahoma Employment Security Commissions, "A Study of Delayed F i l i n g of I n i t i a l " Claims" (Oklahoma C i t y , Okla., September, 1959). (Mimeographed.)

20
Summary Both enabling conditions and motivations are Important i n
considering s e n s i t i v i t y to increases i n b e n e f i t r a t e s . Exhaustees cannot draw b e n e f i t s f o r a d d i t i o n a l weeks, yet those who have exhausted t h e i r b e n e f i t e n t i t l e m e n t are o f t e n presumed to have been h i g h l y motivated by weekly b e n e f i t s . Older persons and women exhausted b e n e f i t s more freq u e n t l y than other groups, and are therefo r believed to be more s e n s i t i v e to b e n e f i t r a t e l e v e l s , although demand conditions undoubtedly accounted f o r much of t h e i r longer duration.
Other claimants do not draw benefits f o r the maximum a l lowable d u r a t i o n . The possible responses t h a t t h i s group might make to higher b e n e f i t rates include attempts to delay r e t u r n t o work or postponement o f withdrawal from the labor market, but t h i s does not suggest t h a t they would respond i n a marked fashion to b e n e f i t rate increases. Unskilled workers, males, and persons f o r t y - f i v e years and over were found p r o p o r t i o n a t e l y more f r e quently among claimants than i n the labor force as a whole, yet t h i s was probably more a r e s u l t of the uneven incidence of unemployment than of d i s p r o p o r t i o n a t e responses to the b e n e f i t program.
Those who delay i n f i l i n g f o r b e n e f i t s do not use the program as I n t e n s i v e l y as others, and can be presumed to be l e a s t i n f l enced by b e n e f i t s . Age and sex, however, are not c l e a r l y r e l a t e d to delayed f i l i n g . Workers from the c l e r i c a l , sales, and service occupations delayed more than others, and i n i t i a l claimants f o r be n e f i t s delayed more than d i d repeat claimants.
Women were found d i s p r o p o r t i o n a t e l y more of t e n among

21 v i o l a t o r s and d i s q u a l i f i e d claimants. Since they t r i e d to over-u t i l i z e the program they would also be l i k e l y to be s e n s i t i v e to increases i n b e n e f i t r a t e s . Persons who have less to lose s o c i a l l y from d i s q u a l i f i c a t i o n would also be more disposed to o v e r - u t i l i z e the program and to be s e n s i t i v e to b e n e f i t increases.
The opportunity to engage i n a g r i c u l t u r e or other home work, though n o n - d i s q u a l i f y i n g , would tend to lessen the d i f f e r ence between weekly b e n e f i t s and wages. The opportunity f o r home work would probably increase the s e n s i t i v i t y to the b e n e f i t r a t e .
The income loss during the period i n which unemployment b e n e f i t s were received was found to be greater for s i n g l e persons and other one earner f a m i l i e s than f o r f a m i l i e s w i t h two or more earners. Those w i t h the l a r g e s t income loss may be expected to use the system most i n t e n s i v e l y , and also to r e t u r n to employment most r e a d i l y when the opportunity develops. Those whose income loss i s smallest would probably be more s e n s i t i v e to changes i n b e n e f i t r a t e s .
Since the influence of b e n e f i t size on duration has not been the d i r e c t object of any previous study, the information from these p r i o r studies does not provide d i r e c t evidence on my main problem. The conclusions which can be drawn from these studies are therefore t e n t a t i v e and speculative, and should be used i n planning a d d i t i o n a l i n v e s t i g a t i o n s rather than as the basis f o r p o l i c y . Only one p r i o r study (made i n the state of New York) tabulated the duration of benefits by b e n e f i t l e v e l . * The average
*New York State Department o f Labor, "Unemployment Insurance Claimants: C h a r a c t e r i s t i c s and Benefit Experience of New York Workers Who F i l e d Claims to Establish Benefit Years Ending i n 1955" (New York, October, 1957) . (Mimeographed.)

22 number of weeks of b e n e f i t s was highest f o r the group r e c e i v i n g the lowest weekly b e n e f i t r a t e , and lowest f o r the group r e c e i v i n g the highest weekly b e n e f i t r a t e .
This Inverse r e l a t i o n s h i p between b e n e f i t rates and b e n e f i t duration was evident f o r workers i n a l l age groups except the very young. ( I n the group under 25 years, persons w i t h h i g h rates tended to be out of work longer than those w i t h low rate s . ) I n terms o f b e n e f i c i a r i e s i n d u s t r i a l attachment, the inverse r e l a t i o n s h i p between b e n e f i t rates and b e n e f i t durat i o n was w e l l defined i n co n s t r u c t i o n , trade, t r a n s p o r t a t i o n - -other p u b l i c u t i l i t i e s and manufacturing other than apparel and metals and machinery. I n metals and machinery manufacturing longer b e n e f i t d u r a t i o n accompanied higher r a t e s . No r e l a t i o n s h i p was evident i n other i n d u s t r i e s . Occupationally, a tendency f o r shorter d u r a t i o n to be coupled w i t h higher rates was apparent i n a l l but the professional-managerial and service f i e l d s . 1
No attempt was made to exclude the d i f f e r e n t i a l demand conditions facing workers except as tabulations were made w i t h i n i n d u s t r y , occupation, and age groups separately. These data showed no cl e a r r e l a t i o n s h i p of longer duration of b e n e f i t s to higher b e n e f i t r a t e s ; r a t h e r , an inverse r e l a t i o n s h i p of these f a c t o r s generally prevailed.
I b i d . , p. 81.

CHAPTER I I I
THE PLAN OF ANALYSIS
The purpose of t h i s study i s to answer the question, "Does the size of weekly unemployment benefits a f f e c t the length of time i n d i v i d u a l s draw b e n e f i t s ? " The general approach i s a s t a t i s t i c a l analysis w i t h i n the t h e o r e t i c a l framework o f a demand-supply r e l a t i o n s h i p f o r labor. Wages are seen as competing w i t h l e i s u r e and productive work around the home f o r the time of the worker. Posi t i v e weekly unemployment b e n e f i t s , added to the value of l e i s u r e or home work, reduce the r e t u r n f o r working over unemployment. Since many claimants have some d i s c r e t i o n over the length of t h e i r unemployment, and since each has d i s c r e t i o n over whether to apply f o r b e n e f i t s for each week o f unemployment, i t i s possible larger weekly b e n e f i t s may r e s u l t i n longer i n d i v i d u a l durations of bene f i t s . Larger weekly b e n e f i t s may r e s u l t i n longer i n d i v i d u a l durations o f b e n e f i t s by encouraging other claimants to remain unemployed and i n b e n e f i t status rather than withdraw from the labor market. I n such cases the higher b e n e f i t s increase the opp o r t u n i t y cost o f pure l e i s u r e or home work.
Such reasoning places the e f f e c t of weekly b e n e f i t rates on the supply side, but i t i s also necessary to ask i f the r e l a t i o n between weekly b e n e f i t size and duration may also be af f e c t e d by demand. Do employers have any incentive to lay o f f f o r longer
23

24 periods workers w i t h b e n e f i t amounts of a p a r t i c u l a r size? The Incent i v e tax system i n Michigan provides each employer w i t h a r a t i n g based on the r a t i o o f ben e f i t s paid his former employees to the unemployment taxes he has paid. Workers who q u a l i f y f o r higher weekly b e n e f i t amounts would receive b e n e f i t s which are a smaller p r o p o r t i o n of t h e i r former wages than would workers who q u a l i f y f o r smaller weekly b e n e f i t s , f o r the same fa m i l y c l a s s . Workers w i t h fewer dependents would receive b e n e f i t s which are a smaller p r o p o r t i o n of t h e i r former wages than would workers w i t h more dependents, at each wage l e v e l . Therefore, employers would Incur lower charges against t h e i r b e n e f i t accounts f o r a given d o l l a r volume of wage unemployment by l a y i n g o f f workers w i t h few dependents and/or high earnings. Thus we might expect longer duration of unemployment f o r such workers.
On the other hand the unemployment tax on employers i s not based on a l l wages paid, but only wages f o r each employee up to $3,600 per year. Laying o f f workers whose earnings exceed $3,600 per year would mean g i v i n g up employees whose earnings above $3,600 would be tax fr e e . This would encourage employers not to lay o f f workers whose earnings are highest. I n p r a c t i c e , however, union r u l e s , j o b s p e c i a l i z a t i o n , and the size of work u n i t s make i t u n l i k e l y t h a t employers have much choice about whom to lay o f f , and there i s probably no net e f f e c t of demand considerations on the b e n e f i t - d u r a t i o n hypothesis.
The d i f f e r e n t i a l demand f o r labor remains the major complic a t i n g f a c t o r i n the analysis of the r e l a t i o n s h i p oetween the size o f weekly b e n e f i t s and the dur a t i o n of b e n e f i t s . When t o t a l

25 unemployment v a r i e s w i t h changes I n the l e v e l of employment (as d i s t i n c t from v a r i a t i o n s a r i s i n g from new accessions to the labor f o r c e ) , the amount of unemployment compensation generally v a r i e s through changes i n the number of claimants and the duration of benefits f o r claimants. The dur a t i o n of benefits generally i n creases i n times or places of greater unemployment and, conversely, decreases i n times and places of lesser unemployment. The analysis of the r e l a t i o n s h i p o f b e n e f i t size and dur a t i o n i n terms of the i n d i v i d u a l claimant has to Incorporate some means of e l i m i n a t i n g the differences l n the demand for labor which r e s u l t i n d i f f e r i n g durations of b e n e f i t s .
V a r i a t i o n s I n demand may be expressed through B e v e r a l v a r i a b l e s : occupation and in d u s t r y , length of employment w i t h the separating employer, education, age, sex, race, and place of residence. Two main approaches to the e l i m i n a t i o n of demand i n f l u ences on d u r a t i o n are used I n t h i s study.
1) The r e s i d u a l approach Involves adjustments to the a c t u a l duration of b e n e f i t s f o r each sample member based on v a r i a t i o n s i n dur a t i o n a t t r i b u t a b l e to the demand expressing v a r i a b l e s . Group means and m u l t i v a r i a t e c o e f f i c i e n t s from an i t e r a t i v e variance a n a l y s i s computer run are each used i n t urn to create two forms o f the r e s i d u a l duration v a r i a b l e . These are subsequently tabulated by the b e n e f i t variables to provide i n f o r m a t i o n on the major problem of t h i s study.
2) The second approach uses m u l t i p l e regressions and ad j u s t s f o r v a r i a t i o n i n demand by in c l u d i n g the demand

26 expressing v a r i a b l e s i n the equations along w i t h the b e n e f i t v a r i a b l e s and using a c t u a l duration o f b e n e f i t s as the dependent v a r i a b l e .
The Hope College data have been subjected to each o f these analyses and the r e s u l t s are presented i n chapter v.
CHAPTER IV
THE HOPE COLLEGE DATA
The weekly b e n e f i t amount, the r a t i o of weekly b e n e f i t amount to p r i o r weekly wages, and the difference between p r i o r weekly wages and weekly b e n e f i t amount are the main formulations of b e n e f i t size i n t h i s study. The duration of b e n e f i t s i s the dependent v a r i a b l e . Each i s introduced i n turn i n t h i s chapter. Since subsequent analyses are c a r r i e d out on the respondents o f the Hope College survey, the population of these respondents i s compared w i t h the non-interview and short-sequence groups from the same sample s e l e c t i o n , as w e l l as wit h the covered labor force i n Michigan of about the same period, and w i t h n o n - a g r i c u l t u r a l employment i n 1950.
The Benefit Variables The weekly b e n e f i t amount received by respondents i n the
Hope College sample ranged from less than $25 per week to over $50 per week; the weekly b e n e f i t amount/average weekly wage r a t i o ranged from less than 30 per cent to over 60 per cent. I n both of these v a r i a b l e s the maximum values were at least double the minimum
^ A d d i t i o n a l background on the unemployment compensation program and the s i t u a t i o n i n Michigan during 1955 i s given i n Appendix A. The sample survey procedure w i t h p a r t i c u l a r reference to the Hope College Survey i s presented i n Appendix B.
27
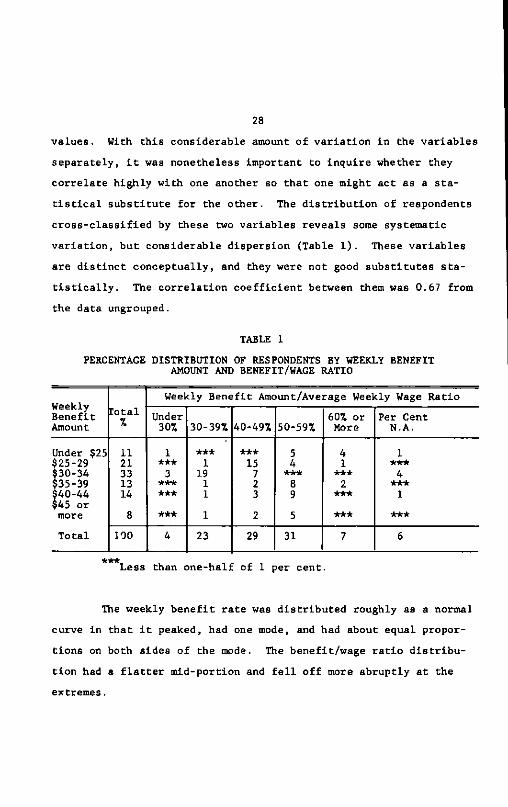
28 values. With t h i s considerable amount of v a r i a t i o n i n the v a r i a b l e s separately, i t was nonetheless important to i n q u i r e whether they c o r r e l a t e h i g h l y w i t h one another so t h a t one might act as a stat i s t i c a l s u b s t i t u t e f o r the other. The d i s t r i b u t i o n of respondents c r o s s - c l a s s i f i e d by these two variabl e s reveals some systematic v a r i a t i o n , b ut considerable dispersion (Table 1 ) . These v a r i a b l e s are d i s t i n c t conceptually, and they were not good s u b s t i t u t e s s t a t i s t i c a l l y . The c o r r e l a t i o n c o e f f i c i e n t between them was 0.67 from the data ungrouped.
TABLE 1 PERCENTAGE DISTRIBUTION OF RESPONDENTS BY WEEKLY BENEFIT
AMOUNT AND BENEFIT/WAGE RATIO
Amount
Weekly Benefit Amount/Average Weekly Wage Ratio Under 307. 30-39% 40-49% 50-59%
60% or More
Per Cent N.A.
Under $25 $25-29 $30-34 $35-39 $40-44 $45 or
To t a l
11 21 33 13 14
1 *** 3
*** *** ***
*** 1
19 1 1
*** 15 7 2 3
4 1
*** 2
100 23 29 31
1 *** 4 *** 1
***
Less than one-half of 1 per cent.
The weekly b e n e f i t r a t e was d i s t r i b u t e d roughly as a normal curve i n t h a t i t peaked, had one mode, and had about equal proport i o n s on both sides of the mode. The benefit/wage r a t i o d i s t r i b u t i o n had a f l a t t e r mid-portion and f e l l o f f more ab r u p t l y a t the extremes.

29 The b e n e f i t l e v e l s presented here became e f f e c t i v e J u l y 15,
1955. P r i o r to t h a t time the b e n e f i t maximum for each family class was lower, and the proportion of wages compensated a t the higher wage l e v e l s was also somewhat lower. The r e v i s i o n s of 1955 affected only those whose ben e f i t s at the o l d rates would have been at the maximum f o r the p a r t i c u l a r f a m i l y class. Supplemental unemployment b e n e f i t s such as those subsequently negotiated by the United Automobile Workers and the major auto companies were not i n e f f e c t during the summer of 1955.
I n the course of preparing f o r the regression analyses, another b e n e f i t v a r i a b l e was formed for each i n d i v i d u a l , average weekly wages p r i o r to b e n e f i t s minus the weekly b e n e f i t r a t e . I n the sample t h i s v a r i a b l e has a mean of $44.2 and a standard deviat i o n of $19.7, compared wi t h means of $33.1 and 45.1% and standard deviations of $7.5 and 9.8% r e s p e c t i v e l y f o r the weekly b e n e f i t r a t e and b e n e f i t wage r a t i o .
Duration of Benefits The d u r a t i o n of benefits ranged from the three-week minimum
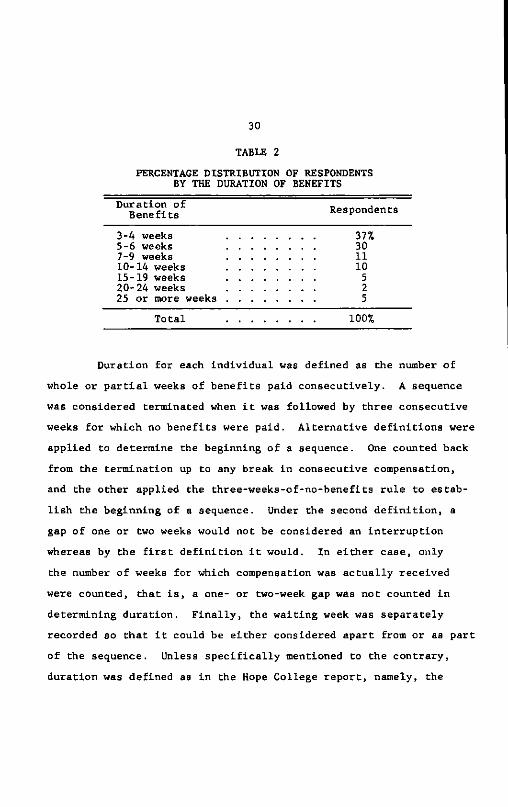
established f o r the i n t e r v i e w group to twenty-six weeks (the s t a t u t o r y maximum) or more. 1 The d i s t r i b u t i o n of respondents by b e n e f i t d u r a t i o n was c l e a r l y J-shaped (Table 2 ) . The d i s t r i b u t i o n of respondents by du r a t i o n r e s i d u a l s , which were formed i n the analyses, approximated a normal d i s t r i b u t i o n .
"̂The few cases which were over twenty-six weeks were unusual cases o f unemployment be n e f i t s which extended past the end of one b e n e f i t year i n t o the next one.
30
TABLE 2 PERCENTAGE DISTRIBUTION OF RESPONDENTS
BY THE DURATION OF BENEFITS Duration of D B B I V i-„..H
Benefits Respondents 3-4 weeks 37% 5-6 weeks 30 7-9 weeks 11 10-14 weeks 10 15-19 weeks 5 20-24 weeks 2 25 or more weeks 5
To t a l 100%
Duration f o r each I n d i v i d u a l was defined as the number of whole or p a r t i a l weeks of be n e f i t s paid consecutively. A sequence was considered terminated when i t was followed by three consecutive weeks f o r which no b e n e f i t s were paid. A l t e r n a t i v e d e f i n i t i o n s were applied to determine the beginning o f a sequence. One counted back from the termination up to any break i n consecutive compensation, and the other applied the three-weeks-of-no-benefits r u l e to establ i s h the beginning of a sequence. Under the second d e f i n i t i o n , a gap of one or two weeks would not be considered an I n t e r r u p t i o n whereas by the f i r s t d e f i n i t i o n i t would. I n e i t h e r case, only the number of weeks f o r which compensation was a c t u a l l y received were counted, t h a t i s , a one- or two-week gap was not counted i n determining d u r a t i o n . F i n a l l y , the w a i t i n g week was separately recorded so th a t l t could be e i t h e r considered apart from or as p a r t of the sequence. Unless s p e c i f i c a l l y mentioned to the c o n t r a r y , du r a t i o n was defined as i n the Hope College r e p o r t , namely, the
31 w a i t i n g week waa not counted and the i n i t i a l p o i n t of a sequence was determined by any break i n weeks compensated.
Benefits and Duration Since the major question i s the r e l a t i o n between weekly
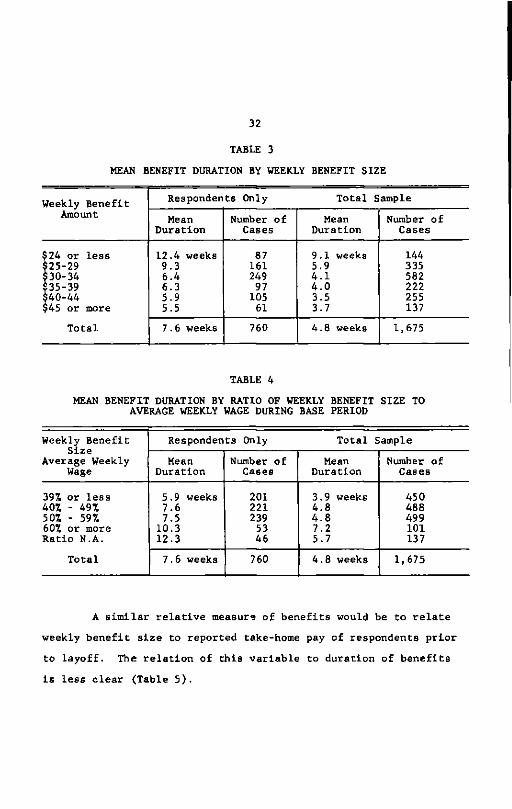
b e n e f i t size and d u r a t i o n , i t i s i n t e r e s t i n g to look at these v a r i ables f o r t h w i t h i n t h e i r raw form. Considering weekly b e n e f i t size f i r s t , the raw data reveal the same inverse r e l a t i o n between weekly b e n e f i t s i z e and the duration of be n e f i t s as was found i n the New York data.* For the interviewed group from the Hope sample, mean b e n e f i t d u r a t i o n declined w i t h higher weekly b e n e f i t s . For the whole sample i n c l u d i n g the r e c i p i e n t s of one and two weeks of bene f i t s , there was a s i m i l a r r e l a t i o n s h i p although average d u r a t i o n was, o f course, lower (Table 3). For the respondents, the c o r r e l a t i o n c o e f f i c i e n t between weekly b e n e f i t amount and duration was -.27.
Considering b e n e f i t s i n r e l a t i o n to average weekly wages during the base period, average b e n e f i t d u r a t i o n tends to increase w i t h the size of the benefit/wage r a t i o (Table 4 ) . For respondents, the c o r r e l a t i o n c o e f f i c i e n t was .12. I t i s not necessarily c o r r e c t , however, t o conclude t h a t higher r e l a t i v e b e n e f i t size brings about longer d u r a t i o n of b e n e f i t s because of a d i s i n c e n t i v e e f f e c t . Other f a c t o r s are possibly involved such as d i f f e r i n g demand conditions facing persons who d i f f e r by wage l e v e l s , age, sex, and area o f residence. Short l a y o f f s i n i n d u s t r i e s w i t h high wage r a t e s , f o r example, might account f o r the r e l a t i o n s h i p observed.
See footnote 1 on p. 22.
32
TABLE 3 MEAN BENEFIT DURATION BY WEEKLY BENEFIT SIZE
Weekly Benefit Respondents Only Tot a l Sample Amount Mean
Duration Number of
Cases Mean
Duration Number of
Cases
$24 or less $25-29 $30-34 $35-39 S40-44 $45 or more
12.4 weeks 9.3 6.4 6.3 5.9 5.5
87 161 249 97 105 61
9.1 weeks 5.9 4.1 4.0 3.5 3.7
144 335 582 222 255 137
T o t a l 7.6 weeks 760 4.8 weeks 1,675
TABLE 4 MEAN BENEFIT DURATION BY
AVERAGE WEEKLY RATIO OF WEEKLY BENEFIT WAGE DURING BASE PERIOD
SIZE TO
Weekly Benefit Size
Average Weekly Wage
Respondents Only T o t a l Sample Weekly Benefit Size
Average Weekly Wage
Mean Duration
Number of Cases
Mean Duration
Number of Cases
39% or less 40% - 49% 50% - 59% 60% or more Ratio N.A.
5.9 weeks 7.6 7.5
10.3 12.3
201 221 239 53 46
3.9 weeks 4.8 4.8 7.2 5.7
450 488 499 101 137
T o t a l 7.6 weeks 760 4.8 weeks 1,675
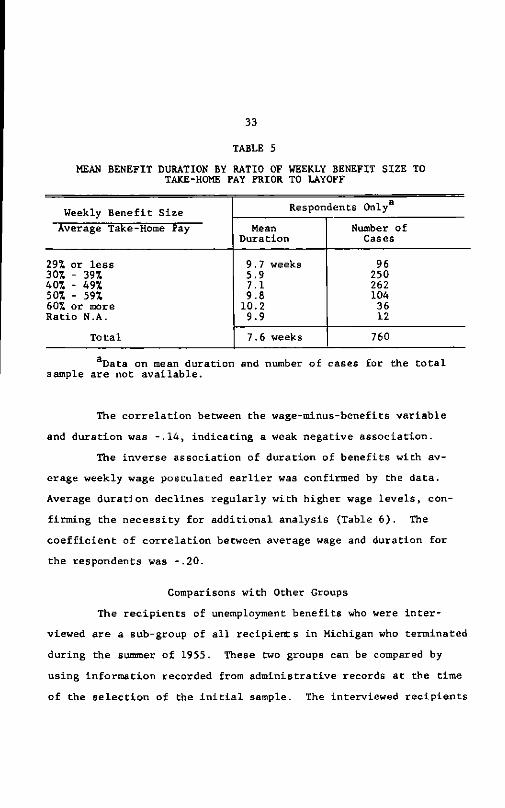
A s i m i l a r r e l a t i v e measure of ben e f i t s would be t o r e l a t e weekly b e n e f i t size to reported take-home pay of respondents p r i o r to l a y o f f . The r e l a t i o n of t h i s v a r i a b l e to duration of b e n e f i t s i s lees clear (Table 5 ) .
33
TABLE 5 MEAN BENEFIT DURATION BY RATIO OF WEEKLY BENEFIT SIZE TO
TAKE-HOME PAY PRIOR TO LAYOFF
Weekly B e n e f i t Size Respondents Only 8
Average Take-Home Pay Mean Number of Average Take-Home Pay Duration Cases
29% or less 9.7 weeks 96 307. - 39% 5.9 250 407. - 49% 7.1 262 50% - 59% 9.8 104 60% or more 10.2 36 Ratio N.A. 9.9 12
T o t a l 7.6 weeks 760
Data on mean duration and number of cases for the t o t a l sample are not a v a i l a b l e .
The c o r r e l a t i o n between the wage-minus-benefits v a r i a b l e and d u r a t i o n was -.14, i n d i c a t i n g a weak negative association.
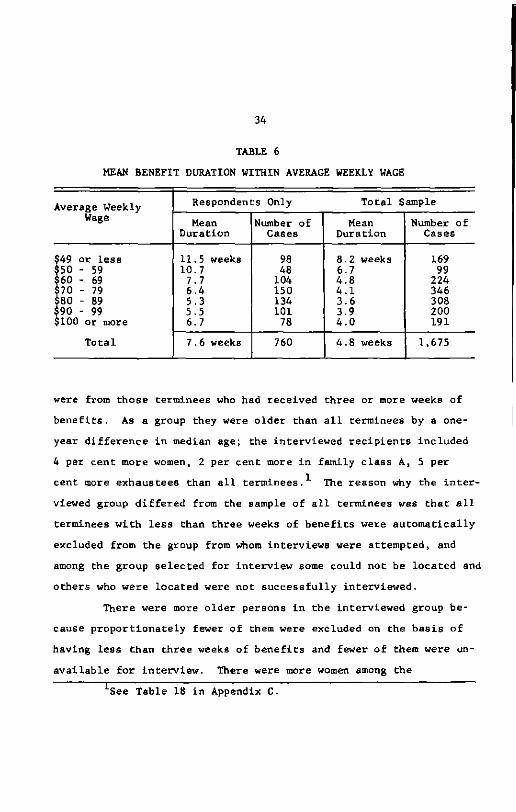
The inverse association of dur a t i o n of b e n e f i t s w i t h average weekly wage postulated e a r l i e r was confirmed by the data. Average d u r a t i o n declines r e g u l a r l y w i t h higher wage l e v e l s , conf i r m i n g the necessity f o r a d d i t i o n a l analysis (Table 6 ) . The c o e f f i c i e n t of c o r r e l a t i o n between average wage and duration f o r the respondents was -.20.
Comparisons w i t h Other Groups The r e c i p i e n t s of unemployment b e n e f i t s who were i n t e r
viewed are a sub-group of a l l r e c i p i e n t s i n Michigan who terminated during the summer of 1955. These two groups can be compared by using I n f o r m a t i o n recorded from a d m i n i s t r a t i v e records a t the time of the s e l e c t i o n of the i n i t i a l sample. The interviewed r e c i p i e n t s
34
TABLE 6 MEAN BENEFIT DURATION WITHIN AVERAGE WEEKLY WAGE
Average Weekly Respondents Only Tot a l Sample Wage Mean Number of Mean Number of
Duration Cases Duration Cases
S49 or less 11.5 weeks 98 8.2 weeks 169 550 - 59 10.7 48 6.7 99 $60 - 69 7.7 104 4.8 224 $70 - 79 6.4 150 4.1 346 $80 - 89 5.3 134 3.6 308 $90 - 99 5.5 101 3.9 200 §100 or more 6.7 78 4.0 191
T o t a l 7.6 weekB 760 4.8 weeks 1,675
were from those terminees who had received three or more weeks of be n e f i t s . As a group they were older than a l l terminees by a one-year d i f f e r e n c e i n median age; the interviewed r e c i p i e n t s included 4 per cent more women, 2 per cent more I n family class A, 5 per cent more exhaustees than a l l terminees. 1 The reason why the i n t e r viewed group d i f f e r e d from the sample o f a l l terminees was th a t a l l terminees w i t h less than three weeks of b e n e f i t s were a u t o m a t i c a l l y excluded from the group from whom inte r v i e w s were attempted, and among the group selected f o r I n t e r v i e w some could not be located and others who were located were not s u c c e s s f u l l y interviewed.
There were more older persons i n the interviewed group because p r o p o r t i o n a t e l y fewer of them were excluded on the basis o f having less than three weeks of b e n e f i t s and fewer of them were unav a i l a b l e f o r i n t e r v i e w . There were more women among the
iSee Table 18 i n Appendix C.

35 interviewed group p r i m a r i l y because proportionately more women than men were successfully interviewed. There were p r o p o r t i o n a t e l y more r e c i p i e n t s c l a s s i f i e d i n family classes A and B among the i n t e r viewed group because d i s p r o p o r t i o n a t e l y fewer o f them were excluded on the short-sequence c r i t e r i o n . There were fewer respondents who returned t o work f o r t h e i r former employers and more exhaustees among the interviewed group because so many of the short duration claimants returned t o t h e i r former employers before they had exhausted t h e i r b e n e f i t e n t i t l e m e n t . Comparison of the interviewed group w i t h a l l terminees by region showed that they d i f f e r l i t t l e ; compensating di f f e r e n c e s accounted f o r t h i s as fewer i n D e t r o i t were excluded on the basis of short sequences but p r o p o r t i o n a t e l y more i n D e t r o i t were not Interviewed successfully. The average weekly wage was higher f o r the interviewed group because there were d i s p r o p o r t i o n a t e l y more r e c i p i e n t s w i t h lower-than-average weekly wage among the short duration and the unsuccessfully interviewed groups than among the t o t a l sample. There were d i s p r o p o r t i o n a t e l y more r e c i p i e n t s o f low weekly b e n e f i t amounts among the interviewed group because the excluded groups had generally higher b e n e f i t s than the t o t a l sample.
Comparisons of the Interviewed group w i t h the t o t a l populat i o n of covered unemployed i n Michigan were not possible since not a l l the covered unemployed f i l e d f o r b e n e f i t s . A comparison of the interviewed group w i t h the covered employed population shows a d i s p r o p o r t i o n a t e number of the interviewees i n motor v e h i c l e and equipment manufacturing as compared w i t h the proportion employed i n
36 Chis i n d u s t r y . * The pro p o r t i o n of interviewees from c o n s t r u c t i o n was the same as were employed i n that i n d u s t r y , and i n the other manufacturing, trade and other i n d u s t r i e s , the proportion i n the interviewed group was w e l l below Che proportion employed i n those i n d u s t r i e s . S i m i l a r comparisons made w i t h n o n - a g r i c u l t u r a l employment i n 1950 reveals differences i n the same d i r e c t i o n , but of a d i f f e r e n t magnitude. By sex and occupation groups, the i n t e r viewed sample haB l a r g e r proportions of s e m i - s k i l l e d workers of both sexes and of women service workers than were present i n Michigan n o n - a g r i c u l t u r a l employment i n 1950, and about the same propor-
2 t i o n of s k i l l e d workers of each sex and of u n s k i l l e d male workers. The remaining groups were underrepresented i n the interviewed group. By age and sex, the main dif f e r e n c e s were t h a t i n the interviewed group, there were more men over s i x t y - f i v e , more women t h i r t y - f i v e to f o r t y - f o u r years of age, and fewer women under twen t y - f i v e , compared w i t h 1950 n o n - a g r i c u l t u r a l employment i n Michigan.
National s t a t i s t i c s of the unemployed were not wholly s a t i s f a c t o r y e i t h e r . Current population r e p o r t s i d e n t i f i e d the un-employeds but d i d not c l a s s i f y them by whether they were e l i g i b l e f o r unemployment compensation b e n e f i t s . The Survey Research Center conducted four n a t i o n a l surveys I n 1958 and 1959 which contained questions about the unemployed. I t was r e p o r t e d 3 that 38 per cent
1See Table 19 i n Appendix C. 2 See Table 20 i n Appendix C.
3Cohen, Haber and Mueller, p. 30, Table 20.

37 of the heade of spending u n i t s who had been unemployed during the previous twelve months claimed that they had not received unemployment b e n e f i t s , and another 23 per cent said t h a t they had received b e n e f i t s f o r only pa r t of the time they were out of work. From the two surveys i n 1958 i t was reported t h a t of those who had received no b e n e f i t s , close to h a l f had probably been i n covered employment. This suggests t h a t about 20 per cent of the unemployed heads of spending u n i t s from covered employment received no ben e f i t s a t a l l and that another 10 per cent received b e n e f i t s f o r only par t of the time-they were unemployed.
The unemployed i n the Hope College sample i n Michigan were not representative of the employed population i n Michigan. I t appears that the model-change l a y o f f s were the main reason f o r t h i s , coupled w i t h d i f f e r e n c e s i n the rates of unemployment i n i n d u s t r i e s and occupations not d i r e c t l y r e l a t e d to automobile production. Since model-change l a y o f f s have been commonplace i n Michigan and may only r e c e n t l y have become less severe as a consequence of new contracts negotiated between the auto workers and the auto companies, i t seems reasonable to assume that a sample of terminees taken during the summer of 1955 was not so very d i f f e r e n t from what would have been found during a s i m i l a r period i n other years. Current or recent data are not av a i l a b l e and the analyses presented i n the f o l l o w i n g chapter are r e s t r i c t e d to the sample of interviewed terminees from the summer of 1955.
CHAPTER V
ANALYSIS AND INTERPRETATION
The e l i m i n a t i o n of the e f f e c t of d i f f e r e n c e s i n the demand fo r various types o f labor on the dura t i o n of b e n e f i t s i s claimed to be e s s e n t i a l to a proper i n v e s t i g a t i o n of the e f f e c t of weekly b e n e f i t size on dur a t i o n . A p a i r of analyses are i n i t i a l l y r e ported i n which r e s i d u a l d u r a t i o n v a r i a b l e s are f i r s t generated as a means o f removing the i n f l u e n c e o f demand f a c t o r s , and then tabulated by the weekly b e n e f i t size v a r i a b l e s to provide data on the p r i n c i p a l problem of the study. A m u l t i p l e regression approach to the main problem I s reported i n the f i n a l section of t h i s chapter. Benefit d u r a t i o n was taken as the dependent v a r i a b l e ; the independent v a r i a b l e s included weekly b e n e f i t s i z e , v a r i a b l e s representing the demand f a c t o r s , and some a d d i t i o n a l v a r i a b l e s which might obscure the b e n e f i t - d u r a t i o n r e l a t i o n s h i p .
The Residual Approach The i n f l u e n c e of demand was expected to appear through
c e r t a i n v a r i a b l e s : occupation and i n d u s t r y , and the length o f employment w i t h the separating employer, education, age, sex, race and place o f residence. Differences I n h i r i n g and employment pract i c e s between occupation and i n d u s t r y groups are w e l l known. For example, p e r i o d i c l a y o f f s are common i n the auto I n d u s t r y and are fre q u e n t l y of s h o r t d u r a t i o n . Seasonal unemployment i s t y p i c a l of
38
39 the b u i l d i n g trades where f u l l year employment i s not common. Terminations i n sales and c l e r i c a l occupations are t y p i c a l l y f i n a l . Formal education and longer employment w i t h the separating employer were expected t o be associated w i t h shorter duration of b e n e f i t s , since both were expected to make the claimant a more valuable worker. Age and sex were also believed to d i f f e r e n t i a t e separate demands f o r labor. Men and women are not good s u b s t i t u t e s f o r one another because of the assignment of c e r t a i n jobs to men or women as a r e s u l t of a c c u l t u r a t i o n and because of such fundamental d i f ferences as physical c a p a b i l i t y to do strenuous work and the pot e n t i a l i n t e r r u p t i o n i n a v a i l a b i l i t y f o r work due to pregnancies. I n a d d i t i o n , demand d i f f e r s by age because of s k i l l d i f f e r e n c e s which a r i s e from experience and m a t u r i t y , and from the decline i n energy, and because of a b i l i t y to learn and adapt, and h e a l t h and ret i r e m e n t considerations f o r older workers. Racial d i s c r i m i n a t i o n leads t o gr e a t e r unemployment and b e n e f i t duration f o r Negroes. Area of residence r e f l e c t s d i f f e r i n g employment o p p o r t u n i t i e s throughout the s t a t e , as m o b i l i t y i s hindered by such things as tastes and home ownership.
With these varia b l e s possibly r e f l e c t i n g demand d i f f e r e n c e s , the s i g n i f i c a n c e and d i r e c t i o n of the v a r i a t i o n i n the mean d u r a t i o n of b e n e f i t s between the categories of each of the v a r i a b l e s sepa r a t e l y was estimated. S i g n i f i c a n t v a r i a t i o n i n the expected d i r e c t i o n was the c r i t e r i o n by which a va r i a b l e f o r possible use i n removing the demand influences on duration was selected, a l though more elaborate screening was c a r r i e d out, i n c l u d i n g t e s t i n g v a r i a t i o n I n mean duration between the categories of one v a r i a b l e ,
40 c o n t r o l l i n g on another v a r i a b l e . F-testa of the r a t i o s o f the mean square variances between and w i t h i n categories were used to t e s t s i g n i f i c a n c e a t .95 or higher p r o b a b i l i t i e s .
I n d u s t r y , age and sex were found to be of c h i e f consequence, and occupation and residence of smaller importance i n d i s t i n g u i s h i n g v a r i a t i o n i n b e n e f i t d u r a t i o n . The other possible demand-expressing v a r i a b l e s d i s t i n g u i s h e d l i t t l e v a r i a t i o n I n dura t i o n , and not generally i n the expected d i r e c t i o n . Seventeen subgroups were formed on the basis of the three main v a r i a b l e s and the v a r i a t i o n s i n mean b e n e f i t duration between them are presented (Table 7 ) . These were used as the expected values of b e n e f i t duration i n the c a l c u l a t i o n of one r e s i d u a l b e n e f i t d u r a t i o n v a r i a b l e described l a t e r .
M i n d f u l of the omission of occupation and residence I n the formation of sub-groups based on i n d u s t r y , age, and sex, an i t e r a t i v e m u l t i p l e c l a s s i f i c a t i o n analysis was run w i t h b e n e f i t duration as the dependent v a r i a b l e and a l l the p o t e n t i a l demand expressing v a r i a b l e s as Independent variables.''' The r e s u l t was a set of c o e f f i c i e n t s , one f o r each category o f each independent v a r i a b l e expressed as a d e v i a t i o n from the grand mean, which minimizes the e r r o r variance of the set of p r e d i c t i o n s f o r the sample cases. An a l t e r n a t i v e expected value o f b e n e f i t d u r a t i o n was then formed f o r each sample member by adding the c o e f f i c i e n t (plus or minus) associated w i t h the rele v a n t category of each of the f i v e
*The author expresses h i s a p p r e c i a t i o n to The U n i v e r s i t y o f Michigan Computing Center, on whose computer the analysis was run, and to John Sonquist and the Data Processing Section of the I n s t i t u t e f o r S o c i a l Research, who produced the computer program used.

41 Important independent v a r i a b l e s to the grand mean. The variabl e s education, length of employment, and race were omitted since t h e i r c o e f f i c i e n t s d i d not vary systematically and i n the expected d i r e c t i o n . Mean duration and the m u l t i v a r i a t e c o e f f i c i e n t s on which expected values were based are presented i n Table 8.
TABLE 7 MEAN BENEFIT DURATION BY INDUSTRY-AGE-SEX GROUPS
Sub-group Mean Duration ( i n weeks)
Number of Cases
Auto manufacturer X 4 8 319 Other auto mnfr, under 45, male 5 2 54 Other auto mnfr, under 45, female 7 2 28 Other auto mnfr, 45-64, male 8 4 37 Other auto mnfr, 45-64, female 15 2 13 Other auto mnfr, 65 and over 21 7 14 Other mnfr, under 45, male 6 7 54 Other mnfr, under 45, female 10 6 52 Other mnfr, 45-64, male 8 3 24 Other mnfr, 45-64, female 10 7 18 Other ranfr, 65 and over 14 3 13 Construction 8 2 41 Trade and other, under 45, male 6 5 18 Trade and other, under 45, female 14 3 28 Trade and o t h e r , 45-64, male 8 8 17 Trade and o t h e r , 45-64, female 12 4 21 Trade and o t h e r , 65 and over 19 9 9

42
TABLE 8 MEAN BENEFIT DURATION AND THE COEFFICIENTS
OF SELECTED PREDICTOR VARIABLES
Mean Number M u l t i v a r i a t e Predictor Variables Duration of C o e f f i c i e n t s
( i n weeks) Cases ( i n weeks) T o t a l 7.6 760 0.0
Industry Auto mnfr X 4.8 319 -2.2 Other auto mnfr 8.8 145 1.1 Other manufacturer 9.4 154 1.8 Construction 8.2 44 1-7 Trade 12.9 41 2.6 Other 11.4 52 1.8 Not ascertained 9.0 & 2.4
Age-Sex Under 45, male 5.4 330 -1.5 Under 45, female 9.1 152 0.9 45-64, male 6.8 169 -0.7 45-64, female 11.4 63 2.1 65, or more 15.8 46 7.3
Occupation Professional 12.3 18 2.9 C l e r i c a l and sales 12.2 57 2.8 S k i l l e d 8.0 124 -0.1 Semi-skilled 6.6 496 -0.5 Uns k i l l e d 8.6 42 -0.2 Service 13.4 15 3.1 Not ascertained 4.9 8 -0.9
Area of residence D e t r o i t 7.1 551 0.2 Other SMA1s, urban areas 7.6 91 -1.4 Other c i t i e s , l r . penln. 8.2 53 -1.4 Up.-lr. peninsula 11.3 24 1.4 Upper peninsula 11.7 35 1.7

43 TABLE 8--Continued
Mean I Number M u l t i v a r i a t e P redictor Variables Duration 1 ° f C o e f f i c i e n t s
( i n weeks) J Cases ( i n weeks) Education
1 1 1 0-8, other t r a i n i n g 9-11, no other t r a i n i n g 9-11, other t r a i n i n g 12 y r s . or more, no
other t r a i n i n g 12 y r s . or more, other
t r a i n i n g Not ascertained
0.1 -0.8 -0.4 0.6
-0.2 0.2 1.3
Length of Employment w i t h Separating Employer Under 1 year 6.8 137 -0.7 1-2 years 7.9 120 -0.5 3-4 years 7.0 120 -0.4 5-9 years 7.5 203 1.0 10 years or more 8.4 180 0.1
Race Non-Negro 7.8 619 -0.1 Negro 6.5 141 0.3
Two r e s i d u a l d u r a t i o n variables were formed, based respect i v e l y on the age-sex-industry means and the m u l t i v a r i a t e coe f f i c i e n t s . I n each case, the expected value of duration generated f o r a p a r t i c u l a r i n d i v i d u a l i n the sample was subtracted from h i s ac t u a l d u r a t i o n of b e n e f i t s , and the remainder retained f o r f u r t h e r a n a l y s i s . Mean values of the newly formed varia b l e s were then separately calculated f o r categories of the b e n e f i t v a r i a b l e s . A p o s i t i v e value of the r e s i d u a l , or of a mean r e s i d u a l f o r a subgroup, i s i n t e r p r e t e d as d u r a t i o n greater than expected; a negative value as d u r a t i o n less than expected.
AA
Benefits and Residual Duration The main problem can now be studied w i t h the two r e s i d u a l
duration v a r i a b l e s designed to be free of demand influences. Using the residuals formed from age-sex-industry means (A-S-I r e s i d u a l s ) and from the i t e r a t i v e m u l t i v a r i a t e analysis c o e f f i c i e n t s ( m u l t i v a r i a t e r e s i d u a l s ) , mean values and measures of v a r i a t i o n were calculated across several b e n e f i t v a r i a b l e s . The r a t i o of weekly b e n e f i t size to average weekly wage was considered a b e t t e r v a r i able to t e s t the main hypothesis than the r a t i o of weekly b e n e f i t size to weekly take-home pay p r i o r to l a y o f f . The average weekly wage was based on many months' earnings p r i o r to l a y o f f and excluded weeks o f unemployment whereas weekly take-home pay p r i o r to l a y o f f was believed to be d i s t o r t e d from usual earnings sometimes as a r e s u l t of e i t h e r overtime or shorter work weeks immediately preceding l a y o f f s . Mean residua l s by both v a r i a b l e s , and by weekly b e n e f i t amount, are presented i n Table 9.
Residual d u r a t i o n does not appear to increase s y s t e m a t i c a l l y w i t h the r a t i o of weekly b e n e f i t s to average weekly wage. Nor i s i t p o s i t i v e l y r e l a t e d to the r a t i o of weekly b e n e f i t s to take home pay p r i o r to l a y o f f . The b e n e f i t size i n d o l l a r s also f a i l s to show a p o s i t i v e association w i t h e i t h e r d u r a t i o n r e s i d u a l (Table 9 ) .
Although the hypothesized r e l a t i o n s h i p s f a i l e d to be supported i n the f u l l sample of respondents, f u r t h e r i n v e s t i g a t i o n was c a r r i e d out on three sub-groups of respondents: s i n g l e adults r e s i d i n g alone, primary earners i n f a m i l i e s of two or more, and secondary earners who f o r the most par t are wives.
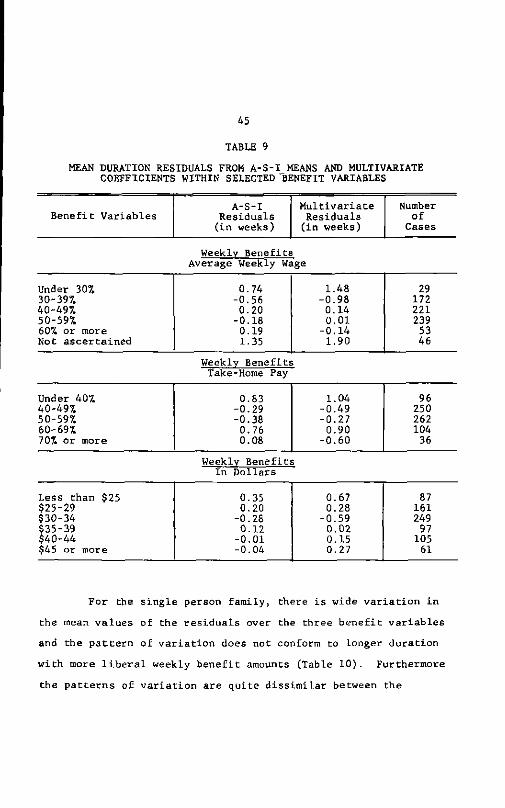
45
TABLE 9 MEAN DURATION RESIDUALS FROM A-S-I MEANS AND MULTIVARIATE
COEFFICIENTS WITHIN SELECTED "BENEFIT VARIABLES
, , , A-S-I
M u l t i v a r i a t e Number Benefit Variables Residuals Residuals of
( i n weeks) ( i n weeks) Cases
Weekly Benefits Average Weekly Wage
Under 307. 0.74 1.48 29 30-397. -0.56 -0.98 172 40-49% 0.20 0.14 221 50-59% -0.18 0.01 239 60% or more 0.19 -0.14 53 Not ascertained 1.35 1.90 46
Weekly Benefits Take-Home Pay
Under 40% 0.83 1.04 96 40-49% -0.29 -0.49 250 50-59% -0.38 -0.27 262 60-69% 0.76 0.90 104 70% or more 0.08 -0.60 36
Weekly Benefits I n Dollars
Less than $25 0.35 0.67 87 $25-29 0.20 0.28 161 $30-34 -0.28 -0.59 249 $35-39 0.12 0.02 97 $40-44 -0.01 0.15 105 $45 or more -0.04 0.27 61
For the si n g l e person family, there i s wide v a r i a t i o n i n the mean values of the residu a l s over the three b e n e f i t v a r i a b l e s and the p a t t e r n of v a r i a t i o n does not conform to longer duration w i t h more l i b e r a l weekly b e n e f i t amounts (Table 10). Furthermore the p a t t e r n s of v a r i a t i o n are q u i t e d i s s i m i l a r between the
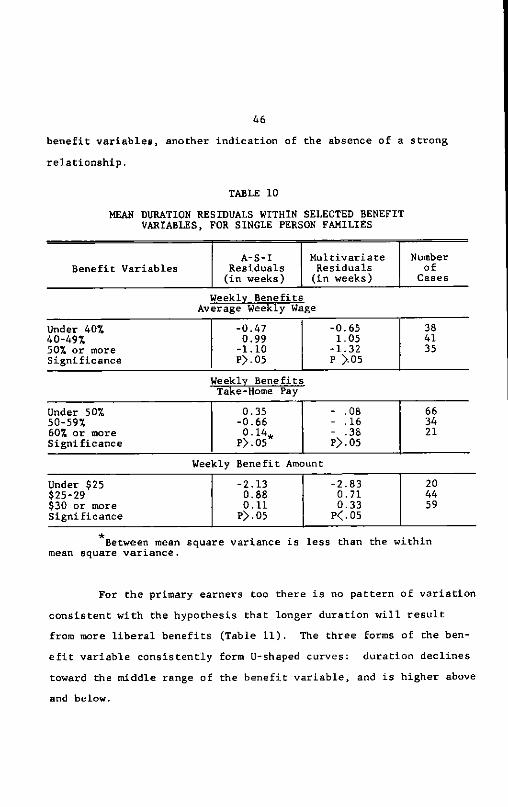
46 b e n e f i t v a r i a b l e s , another i n d i c a t i o n of the absence of a strong r e l a t i o n s h i p .
TABLE 10 MEAN DURATION RESIDUALS WITHIN SELECTED BENEFIT
VARIABLES, FOR SINGLE PERSON FAMILIES
A-S-I M u l t i v a r i a t e Number Benefit Variables Residuals Residuals of
( i n weeks) ( i n weeks) Cases Weekly Benefits
Average Weekly Wage Under 40% -0 47 -0.65 38 40-49% 0 99 1.05 41 50% or more -1 10 -1.32 35 Significance P> 05 P >.05
Weekly Benefits Take-Home Pay
Under 50% 0.35 - .08 66 50-59% -0.66 - .16 34 60% or more 0.14. - .38 21 Significance P>.05 P>.05
Weekly Benefit Amount Under $25 -2.13 -2.83 20 $25-29 0.88 0.71 44 $30 or more 0.11 0.33 59 Significance P>.05 P<.05
Between mean square variance i s less than the w i t h i n mean square variance.
For the primary earners too there i s no pa t t e r n of v a r i a t i o n consistent w i t h the hypothesis that longer duration w i l l r e s u l t from more l i b e r a l b e n e f i t s (Table 11). The three forms of the bene f i t v a r i a b l e c o n s i s t e n t l y form U-shaped curves: d u r a t i o n declines toward the middle range of the b e n e f i t v a r i a b l e , and i s higher above and below.
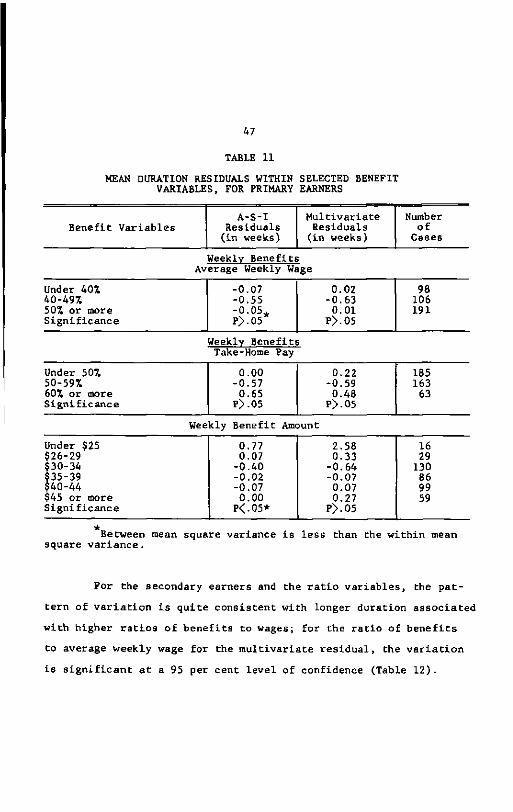
47
TABLE 11 MEAN DURATION RESIDUALS WITHIN SELECTED BENEFIT
VARIABLES, FOR PRIMARY EARNERS
A-S-I M u l t i v a r i a t e Number Benefit Variables Residuals Residuals o f
( i n weeks) ( i n weeks) Cases Weekly Benefits
Average Weekly Wage Under 401 -0.07 0.02 98 40-49% -0.55 -0.63 106 50% or more -0.05* 0.01 191 Significance P>.05 P>.05
Weekly Benefits Take-Home Pay
Under 50% 0.00 0.22 185 50-59% -0.57 -0.59 163 60% or more 0.65 0.48 63 Significance P>.05 P>.05
Weekly Benefit Amount Under $25 0.77 2.58 16 $26-29 0.07 0.33 29 $30-34 -0.40 -0.64 130 $35-39 -0.02 -0.07 86 $40-44 -0.07 0.07 99 $45 or more 0.00 0.27 59 Significance P<.05* P>.05
Between mean square variance i s less than the w i t h i n mean square variance.
For the secondary earners and the r a t i o v a r i a b l e s , the pattern of v a r i a t i o n i s q u i t e consistent w i t h longer duration associated w i t h higher r a t i o s of b e n e f i t s to wages; f o r the r a t i o of b e n e f i t s to average weekly wage f o r the m u l t i v a r i a t e r e s i d u a l , the v a r i a t i o n i s s i g n i f i c a n t a t a 95 per cent l e v e l of confidence (Table 12).
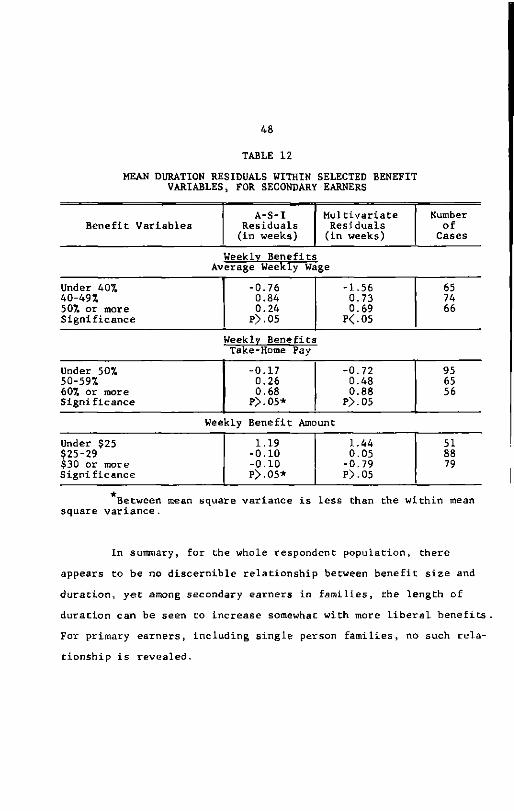
48
TABLE 12 MEAN DURATION RESIDUALS WITHIN SELECTED BENEFIT
VARIABLES, FOR SECONDARY EARNERS
A-S-I M u l t i v a r i a t e [lumber Benefit Variables Residuals Residuals o f
( i n weeks) ( i n weeks) Cases Weeklv Benefits
Average Weekly Wage Under 40% -0.76 -1.56 65 40-49% 0.84 0.73 74 50% or more 0.24 0.69 66 Significance P>.05 P<.05
Weekly Benefits Take-Home Pay
Under 50% -0.17 -0.72 95 50-59% 0.26 0.48 65 60% or more 0.68 0.88 56 SIgni ficance P>.05* P>.05
Weekly Benefit Amount Under $25 1.19 1.44 51 $25-29 -0.10 0.05 88 $30 or more -0.10 -0.79 79 Signi ficance P>.05* P>.05
Between mean square variance i s less than the w i t h i n mean square variance.
In summary, f o r the whole respondent population, there appears to be no d i s c e r n i b l e r e l a t i o n s h i p between b e n e f i t size and dur a t i o n , y e t among secondary earners i n f a m i l i e s , the length of durat i o n can be seen to increase somewhat w i t h more l i b e r a l b e n e f i t s . For primary earners, i n c l u d i n g s i n g l e person f a m i l i e s , no such r e l a t i o n s h i p i s revealed.

49
The M u l t i p l e Regression Approach The d u r a t i o n of b e n e f i t s , measured i n the number of weeks
for which each i n d i v i d u a l i n the sample received b e n e f i t s , was the dependent v a r i a b l e i n the m u l t i p l e regression approach. The general form of the hypothesis was that differences i n duration r e s u l t e d from (1) d i f f e r e n c e s i n demand conditions confronting each sample member, (2) possibly also his response to the size of the weekly b e n e f i t payment av a i l a b l e to him, and (3) a random v a r i a t i o n ; (4) d i f f e r i n g responses according to family circumstances of the respondent were also postulated. Some modifications of the o r i g i n a l formulat i o n of the regression equation based on the i n i t i a l f i n d i n g s were possible because of the a v a i l a b i l i t y of high speed computing equipment; i t was also possible to run regressions on several sub-groups of respondents.
There were two substantive objectives i n forming equations and groups. One was to determine whether there was a d i s c e r n i b l e r e l a t i o n between the size of weekly unemployment be n e f i t s and the number of weeks for which payments were made f o r the whole i n t e r viewed sample o f Michigan r e c i p i e n t s . * I c was a question of whether the sample of r e c i p i e n t s of that p a r t i c u l a r time and place
*The conclusions are derived from those who successfully applied f o r b e n e f i t s for three or more consecutive weeks ending during the summer. The Hope College interview study omitted the r e c i p i e n t s o f one and two weeks of benefits on the a p r i o r i assumpt i o n t h a t such persons would overwhelmingly be h i g h l y motivated to work; i t also omitted the disemployed who d i d not receive b e n e f i t s on grounds t h a t there was no economically feasible way to sample and i n t e r v i e w them. Both omissions were unfortunate, f o r the dec i s i o n to c l a i m b e n e f i t s or not, or to delay i n claiming b e n e f i t s , should have been be t t e r represented i n the data on which conclusions were based.
50
r e v e a l e d a d i s i n c e n t i v e e f f e c t of b e n e f i t s on d u r a t i o n . The other
was whether t h e r e were sub-groups of the r e c i p i e n t p opulation
w i t h i n which the s i z e of b e n e f i t s exerted an important i n f l u e n c e on
the number of weeks of b e n e f i t s compensated. Est i m a t e s o f the
s i z e o f the r e l a t i o n s h i p s , i f any, were a l s o d e s i r e d .
Mindful of the f i r s t o b j e c t i v e , the respondents were f i r s t
a nalyzed as a s i n g l e group. Separate r e g r e s s i o n s were run w i th one
of the f o r m u l a t i o n s of the b e n e f i t v a r i a b l e i n each as an independen
v a r i a b l e along with the same demand e x p r e s s i n g v a r i a b l e s used i n the
I t e r a t i v e v a r i a n c e a n a l y s i s : i n d u s t r y , occupation, sex, r e s i d e n c e ,
age, education, r a c e , and length of employment. Three a l t e r n a t i v e
b e n e f i t f o r m u l a t i o n s were t e s t e d here, and i n subsequent a n a l y s i s .
The b e n e f i t v a r i a b l e s were: B, weekly b e n e f i t s i z e i n d o l l a r s ;
B/W, the r a t i o of weekly b e n e f i t s i z e i n d o l l a r s to p r i o r d o l l a r
average weekly wage, i n whole percentages; and W-B, the d i f f e r e n c e
between p r i o r average weekly wage and weekly b e n e f i t s i z e , i n d o l
l a r s .
None o f the forms of the b e n e f i t v a r i a b l e had a c o e f f i c i e n t
which was s i g n i f i c a n t l y d i f f e r e n t from zero a t a one sigma t e s t
l e v e l , d e s p i t e i t s having been run on 749 c a s e s (Table 13, Regres
s i o n s 1, 2, 3 ) . Only the B/W v a r i a b l e had a s i g n c o n s i s t e n t w i th
the h y p o t h e s i s tha t longer duration r e s u l t e d from more l i b e r a l
weekly b e n e f i t amounts. The b e n e f i t c o e f f i c i e n t which had the
l a r g e s t a b s o l u t e v a l u e , B = -.029, makes no t h e o r e t i c a l sense, a l
though i t i s much c l o s e r to zero than the s i m p l e c o r r e l a t i o n coef
f i c i e n t of weekly b e n e f i t s i z e and d u r a t i o n , -.267.
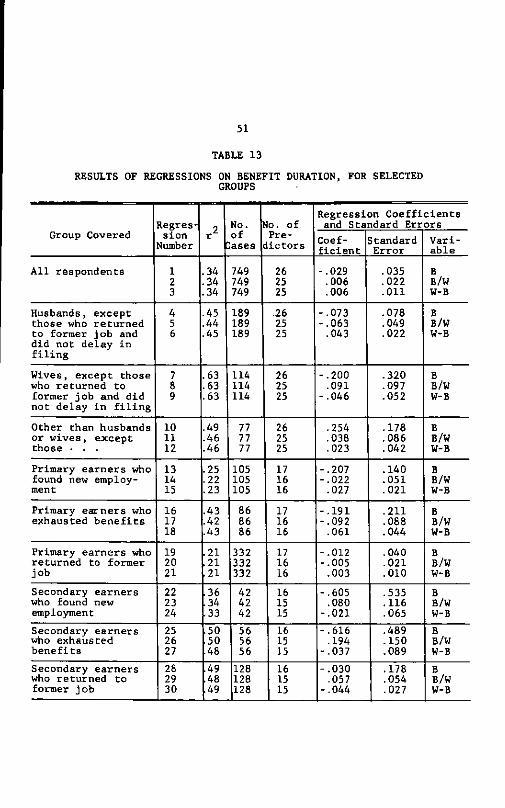
51
TABLE 13
RESULTS OF REGRESSIONS ON BENEFIT DURATION, FOR SELECTED GROUPS
Group Covered Regress i o n
Number r 2
No. of liases
•io. of Pre
d i c t o r s
Regression C o e f f i c i e n t s and Standard E r r o r s
Group Covered Regress i o n
Number r 2
No. of liases
•io. of Pre
d i c t o r s Coeff i c i e n t
Standard E r r o r
V a r i a b l e
A l l respondents 1 2 3
.34
.34
.34
749 749 749
26 25 25
-.029 .006 .006
.035
.022
.011
B B/W W-B
Husbands, except those who r e t u r n e d to former j o b and did not del a y i n f i l i n g
4 5 6
.45
.44
.45
189 189 189
.26 25 25
-.073 -.063 .043
.078
.049
.022
B B/W W-B
Wives, except those who r e t u r n e d to former j o b and d i d not d e l a y i n f i l i n g
7 8 9
.63
.63
.63
114 114 114
26 25 25
-.200 .091
-.046
.320
.097
.052
B B/W W-B
Other Chan husbands or wives, except those • . .
10 11 12
.49
.46
.46
77 77 77
26 25 25
.254
.038
.023
.178
.086
.042
B B/W W-B
Primary e a r n e r s who found new employment
13 14 15
.25
.22
.23
105 105 105
17 16 16
-.207 -.022 .027
.140
.051
.021
B B/W W-B
Primary e a r n e r s who exhausted b e n e f i t s
16 17 18
.43
.42
.43
86 86 86
17 16 16
-.191 -.092 .061
.211
.088
.044
B B/W W-B
Primary e a r n e r s who r e turned to former j ob
19 20 21
.21
.21 21
332 332 332
17 16 16
-.012 -.005 .003
.040
.021
.010
B B/W W-B
Secondary e a r n e r s who found new employment
22 23 24
36 34 33
42 42 42
16 15 15
-.605 .080
-.021
.535
.116
.065
B B/W W-B
Secondary e a r n e r s who exhausted b e n e f i t s
25 26 27
50 50 48
56 56 56
16 15 15
-.616 .194
-.037
.489
.150
.089
B B/W W-B
Secondary e a r n e r s who r e t u r n e d to former j o b
28 29 30
.49 48 49
128 128 128
16 15 15
-.030 .057
-.044
.178
.054
.027
B B/W W-B

52
The demand e x p r e s s i n g v a r i a b l e s had almost i d e n t i c a l c o e f f i c i e n t s i n the three r e g r e s s i o n s on a l l respondents, and the m u l t l p l 2
r was 0.34 f o r each. I t appeared that w i t h i n the sample as a whole
there was no c l e a r i n d i c a t i o n t h a t any formulation of the b e n e f i t
v a r i a b l e i n d i c a t e d a p o s i t i v e r e l a t i o n s h i p of longer d u r a t i o n w i t h
more l i b e r a l weekly b e n e f i t amounts.
The q u e s t i o n remained, however, of whether there were sub
groups of r e c i p i e n t s who were s e n s i t i v e to the s i z e of weekly ben
e f i t s . Two base s f or forming sub-groups were considered f or a n a l y s i s
(1) the rea s o n f o r t e r m i n a t i o n of b e n e f i t s , r e f l e c t i n g d i f f e r e n t
degrees of d i s c r e t i o n of b e n e f i t d u r a t i o n , and (2) p o s i t i o n o f the
r e c i p i e n t i n the f a m i l y , r e f l e c t i n g wage earning r e s p o n s i b i l i t i e s
to the f a m i l y , s o c i a l p r e s s u r e , and need.
One s e t of sub-groups was formed from the respondents who
remained a f t e r those r e c i p i e n t s who had terminated b e n e f i t s by r e
tu r n i n g to t h e i r former employer and who had not delayed i n f i l i n g
f o r b e n e f i t s were s e t a s i d e . The r e c i p i e n t s who were s e t a s i d e
were thought to have had the v e r y l e a s t d i s c r e t i o n i n the number of
weeks o f b e n e f i t s r e c e i v e d . Three sub-groups, 1 husbands, w i v e s ,
and o t h e r s , were formed from the remaining r e c i p i e n t s . Separate
r e g r e s s i o n s f o r each formulation of the b e n e f i t v a r i a b l e were run
fo r each of the three sub-groups (Table 13, Regressions 4 to 1 2 ) .
I n a d d i t i o n to the three b e n e f i t v a r i a b l e s , the same de
mand-expressing v a r i a b l e s which were used i n the r e g r e s s i o n s on a l l
respondents were i n c l u d e d i n the r e g r e s s i o n s on the sub-groups of
*The sub-group "wives" i n c l u d e s other secondary e a r n e r s , and the sub-group "o t h e r s i n c l u d e s s i n g l e persons and o t h e r s o f misc e l l a n e o u s r e l a t i o n s h i p to the fa m i l y head.
53
husbands, wives, and o t h e r s . T h i s was done to make the e f f e c t s o f
the sub-groupings most apparent. The r e s u l t i n g b e n e f i t v a r i a b l e
c o e f f i c i e n t s were g e n e r a l l y l a r g e r i n a bsolute s i z e than the c o r
responding c o e f f i c i e n t s based on the f u l l sample, although only
four of the n i n e b e n e f i t v a r i a b l e c o e f f i c i e n t s had s i g n s c o n s i s t e n t
w i t h the hyp o t h e s i s of longer d u r a t i o n of b e n e f i t s w i th more l i b e r a l
weekly b e n e f i t amounts. The s i g n s of the c o e f f i c i e n t s of the three
b e n e f i t v a r i a b l e s were not a l l c o r r e c t i n any of the sub-groups,
and no b e n e f i t v a r i a b l e had the c o r r e c t signs f or i t s c o e f f i c i e n t s
i n each of the t h r e e sub-groups. The s i g n of the B/W v a r i a b l e was
c o r r e c t twice ( f o r the "wives," and " o t h e r s " ) , and the B and W-B
v a r i a b l e s each had c o r r e c t s i g n s once, but i n n e i t h e r c ase was i t
f o r the sub-group "husbands." The c o e f f i c i e n t s of the b e n e f i t
v a r i a b l e s from the r e g r e s s i o n s run on "husbands" were q u i t e l a r g e
i n r e l a t i o n to t h e i r r e s p e c t i v e standard e r r o r s , and t h i s was prob
a b l y not the e f f e c t of sampling v a r i a b i l i t y . Rather, the s i z e of
these c o e f f i c i e n t s was probably a r e s u l t of one or more poorly
measured ( o r m i s s i n g ) explanatory v a r i a b l e s , for the c o n c l u s i o n
t h a t s h o r t e r d u r a t i o n r e s u l t e d from more generous weekly b e n e f i t
amounts i s not p l a u s i b l e .
New r e g r e s s i o n s were run and other v a r i a b l e s b e l i e v e d to be
r e l e v a n t were i n c l u d e d along w i t h a b e n e f i t v a r i a b l e and the demand
e x p r e s s i n g v a r i a b l e s which had been used i n Regressions 1 to 12.
"Other e a r n i n g s i n the f a m i l y " and "the number of dependents" were
added to the v a r i a b l e s f or they were expected to i n f l u e n c e d u r a t i o n
through need. Higher other earnings were expected to lengthen
d u r a t i o n , and more dependents were expected to shorten d u r a t i o n ,
54
p a r t i c u l a r l y f o r respondents who terminated b e n e f i t s for new employ
ment. "Whether unemployment was unusual" was added because d u r a t i o n
was expected t o be longer for those for whom unemployment was un
u s u a l . "Whether respondent delayed i n f i l i n g f o r b e n e f i t s " was
a l s o added. Those who delayed i n f i l i n g were expected to have gen
e r a l l y s h o r t e r d u r a t i o n , p a r t i c u l a r l y those who r e t u r n e d to t h e i r
former employer.
The demand e x p r e s s i n g v a r i a b l e s were a l s o modified to r e
duce the t o t a l number of v a r i a b l e s i n the e q u a t i o n s . New v a r i a b l e s
were formed from c a t e g o r i e s o f v a r i a b l e s which overlapped sub
s t a n t i a l l y , such as the u n s k i l l e d workers who l i v e d i n D e t r o i t and
worked for auto manufacturer x. I n other i n s t a n c e s contiguous
c a t e g o r i e s of a v a r i a b l e were combined, such as i n l e n g t h o f employ
ment w i t h the s e p a r a t i n g employer. Education was dropped e n t i r e l y .
F i n a l l y , the sub-groups were modified so as to i n c l u d e a l l
respondents. A b a s i c assignment o f respondents as a primary or
secondary breadwinner was the f i r s t s t ep. S i n g l e persons were
i d e n t i f i e d and c l a s s i f i e d as primary e a r n e r s i f they l i v e d a l o n e .
The primary and secondary e a r n e r s were f u r t h e r sub-divided
by reason for t e r m i n a t i n g b e n e f i t s . Those who r e t u r n e d to t h e i r
former employer were grouped together, r e g a r d l e s s of whether they
had delayed i n f i l i n g f o r b e n e f i t s . I t was f e l t t h a t t hese persons
had l i t t l e d i s c r e t i o n i n the d u r a t i o n of t h e i r b e n e f i t s a p a r t from
delayed f i l i n g . Those who ended b e n e f i t s because they had found
new employment were grouped together because these persons were
b e l i e v e d to have had the g r e a t e s t d i s c r e t i o n i n the d u r a t i o n o f
t h e i r b e n e f i t s . The remaining c a s e s , c a l l e d the exhaustees,
55
i ncluded those who had exhausted t h e i r b e n e f i t e n t i t l e m e n t and o t h e r s
whose b e n e f i t s had been terminated by a c t i o n of the employment s e
c u r i t y o f f i c e . I n g e n e r a l they must have had l i t t l e d i s c r e t i o n i n
the number of weeks for which they r e c e i v e d b e n e f i t s , except that
they probably continued as long as they could.
Three s e p a r a t e r e g r e s s i o n s , one for each form o f the b e n e f i t
v a r i a b l e , were run for each o f the s i x groups which, taken to
gether, encompassed a l l the respondents.
The c o e f f i c i e n t s o f the b e n e f i t v a r i a b l e B were negative
for each o f the s i x groups, and except f o r the two groups who r e
turned to t h e i r former employers, the v a l u e s of the c o e f f i c i e n t s
were l a r g e , and about as l a r g e or l a r g e r than t h e i r r e s p e c t i v e
standard e r r o r s - T h i s p o s i t i v e a s s o c i a t i o n of longer d u r a t i o n of
b e n e f i t s w i t h lower weekly b e n e f i t amounts was c o n t r a r y to what was
expected. As compared w i t h the corresponding c o e f f i c i e n t s from
p r i o r r e g r e s s i o n s on groups i n which there was s u b s t a n t i a l o v e r l a p
o f I n d i v i d u a l s , these c o e f f i c i e n t s were much l a r g e r and i n the
wrong d i r e c t i o n . The standard e r r o r s of the c o e f f i c i e n t s I n c r e a s e d
p r o p o r t i o n a t e l y l e s s than d i d the c o e f f i c i e n t s themselves.
Average weekly wage was included i n the r e g r e s s i o n s w i t h
the B v a r i a b l e and the c o e f f i c i e n t s were g e n e r a l l y p o s i t i v e , i n d i
c a t i n g longer d u r a t i o n a t highe r wage l e v e l s . Weekly b e n e f i t s i z e
and average weekly wage were p o s i t i v e l y c o r r e l a t e d , and both were
n e g a t i v e l y r e l a t e d to d u r a t i o n of b e n e f i t s i n two-way c o r r e l a t i o n s .
Furthermore, when average wage was introduced i n t o a r e g r e s s i o n ,
the c o e f f i c i e n t of the B v a r i a b l e tended to take on a l a r g e r nega
t i v e v a l u e .

56
For che primary earner groups, the s i g n s of the c o e f f i
c i e n t s of the three b e n e f i t v a r i a b l e s d i d not support the h y p o t h e s i s
of longer d u r a t i o n with more l i b e r a l weekly b e n e f i t amounts. The
c o e f f i c i e n t s f o r the primary e a r n e r s who r e t u r n e d to t h e i r p r i o r
employer were not s i g n i f i c a n t l y d i f f e r e n t from zero. The two other
primary e a r n e r groups, exhaustees and those who found new employment
overlapped to a l a r g e e x t e n t w i t h the "husbands" group o f the
e a r l i e r s e r i e s . Whereas "husbands" had c o e f f i c i e n t s f o r the B/W
and W-B v a r i a b l e s which were wrong i n s i g n and l a r g e i n r e l a t i o n to
t h e i r standard e r r o r s , the corresponding c o e f f i c i e n t s f o r the p r i
mary breadwinners who found new employment were c l o s e r to z e r o . For
exhaustees, the c o e f f i c i e n t s were s t i l l more i m p l a u s i b l e , and even
l a r g e r i n r e l a t i o n to t h e i r standard e r r o r s than those f o r "husbands
I n the group of primary e a r n e r s w i t h the g r e a t e s t d i s c r e t i o n (those
who found new employment), the b e n e f i t v a r i a b l e c o e f f i c i e n t s a r e not
s i g n i f i c a n t l y d i f f e r e n t from z e r o . Only among the exhaustees d i d
b e n e f i t s i z e and d u r a t i o n appear to be n e g a t i v e l y r e l a t e d .
The s i g n s of the b e n e f i t v a r i a b l e c o e f f i c i e n t s f o r B/W and
W-B f o r the secondary earners confirmed the h y p o t h e s i s o f a p o s i t i v e
r e l a t i o n s h i p of longer d u r a t i o n to more l i b e r a l weekly b e n e f i t s .
The s i g n was c o r r e c t i n each o f the three groups which had been
formed on the b a s i s of reason f o r b e n e f i t t e r m i n a t i o n . The bene
f i t c o e f f i c i e n t s a r e not l a r g e I n r e l a t i o n to t h e i r standard e r
r o r s , however, and a r e not s t a t i s t i c a l l y s i g n i f i c a n t . The r e
g r e s s i o n s r e p o r t e d e a r l i e r which were run on "wives" and " o t h e r s "
o v e r l a p c o n s i d e r a b l y w i t h the secondary e a r n e r s who exhausted or
who terminated b e n e f i t s with new employment. Except f o r the run

57
on " o t h e r s " u s i n g the W-B v a r i a b l e , the s i g n s of the c o e f f i c i e n t s (
the b e n e f i t v a r i a b l e s i n these groups support the h y p o t h e s i s of
longer d u r a t i o n a s s o c i a t e d w i t h more l i b e r a l weekly b e n e f i t s .
Summary
These r e g r e s s i o n f i n d i n g s confirm the e a r l i e r t e n t a t i v e
c o n c l u s i o n s based on the r e s i d u a l a n a l y s i s . The weekly d o l l a r
amount for m u l a t i o n of the b e n e f i t v a r i a b l e r e s u l t e d i n g e n e r a l l y
i m p l a u s i b l e f i n d i n g s i n n e a r l y a l l of the ways i n which i t was
used.
The d o l l a r weekly b e n e f i t was not s a t i s f a c t o r y i n the r e
g r e s s i o n a n a l y s i s s i n c e there was a curved r e l a t i o n s h i p between
d u r a t i o n and b e n e f i t s . T h i s r e s u l t e d i n higher n e g a t i v e v a l u e s
of the B c o e f f i c i e n t s when average weekly wages were added to the
equation. The p o s i t i v e c o e f f i c i e n t for wages provided a l a r g e
o f f s e t to the l a r g e negative p r e d i c t i o n of duration at high bene
f i t l e v e l s based on the ( l i n e a r ) c o e f f i c i e n t of the b e n e f i t v a r i
a b l e . A l a r g e negative c o e f f i c i e n t of the b e n e f i t v a r i a b l e was
a p p r o p r i a t e to the r a t h e r r a p i d d e c l i n e I n duration with i n c r e a s e s
i n b e n e f i t r a t e s a t low l e v e l s of b e n e f i t s .
I n g e n e r a l , the forms of the b e n e f i t v a r i a b l e , B/W and
W-B, y i e l d e d p l a u s i b l e r e s u l t s . The main exceptions were the
"husbands" and primary earners who were c l a s s e d as exhaustees.
C a l c u l a t i o n s f o r these r e c i p i e n t s g e n e r a l l y y i e l d e d i m p l a u s i b l e
v a l u e s of the b e n e f i t c o e f f i c i e n t s and r e l a t i v e l y low s t a n d a r d
e r r o r s o f the c o e f f i c i e n t s . That i s , d u r a t i o n was estimated to
d e c l i n e w i t h more l i b e r a l weekly b e n e f i t s i t e . The f i n d i n g s from

58
the group "husbands" are not p a r t i c u l a r l y r e l e v a n t , however, f o r
they were superseded by subsequent r e g r e s s i o n s and sub-groupings.
The new v a r i a b l e s added were not a l l s u c c e s s f u l , but those groups
for whom i m p l a u s i b l e f i n d i n g s r e s u l t e d were f u r t h e r narrowed to
the primary e a r n e r s who exhausted b e n e f i t s .
The r e l a t i v e l y low proportion of t o t a l v a r i a n c e e x p l a i n e d
i n the primary e a r n e r r e g r e s s i o n s suggests tha t r e l e v a n t v a r i a b l e s
are s t i l l not i n c l u d e d , or tha t those which are i n c l u d e d are poorly
measured. I n the l a t t e r category, perhaps, i s the wage measure
which i s used i m p l i c i t l y as an i n d i c a t o r of the wage a l t e r n a t i v e
to unemployment b e n e f i t s . I t may have been a poor proxy for the
conceptual v a r i a b l e . Among the primary e a r n e r s , the c o e f f i c i e n t s
o f the v a r i a b l e s "number o f dependents" and "delay i n f i l i n g " were
sometimes o p p o s i t e to e x p e c t a t i o n s .
In summary, among primary e a r n e r s there i s s t a t i s t i c a l l y
i n s i g n i f i c a n t evidence of a s m a l l n e g a t i v e response of d u r a t i o n o f
b e n e f i t s to an i n c r e a s e i n weekly b e n e f i t amount. The l a r g e s t
n e g ative response was found among exhaustees, a group which a l s o
i n c l u d e a l l those whose b e n e f i t s were terminated by a c t i o n of the
employment s e c u r i t y o f f i c e .
For secondary e a r n e r s there i s s t a t i s t i c a l l y i n s i g n i f i c a n t
evidence of a s m a l l p o s i t i v e response of d u r a t i o n to i n c r e a s e s i n
weekly b e n e f i t amount. Thus the d i f f e r e n c e i n response between
primary and secondary earners I s i n the expected d i r e c t i o n , but
i n an economic sense the estimated response f o r both groups i s
q u i t e s m a l l , and not s t a t i s t i c a l l y s i g n i f i c a n t a t 95 per c e n t
l e v e l s of c o n f i d e n c e .

CHAPTER VI
SUMMARY
C e r t a i n s t a t i s t i c s which have p r e v i o u s l y been presented
are summarized below. Seventy per cent of the respondents i n the
Michigan sample were the primary earners i n t h e i r f a m i l i e s - As
I n other s t u d i e s , the m a j o r i t y of exhaustees were found to be mar
r i e d with dependents. The m u l t i p l e r e g r e s s i o n c o e f f i c i e n t s of the
B/W and W-B v a r i a b l e s for the primary earners l n the Michigan
sample were e i t h e r i m p l a u s i b l e or not s i g n i f i c a n t l y d i f f e r e n t from
zero ( T a b l e 1 4 ) . Both r e s u l t s s u s t a i n the c o n c l u s i o n t h a t an i n
c r e a s e i n the s i z e of weekly unemployment b e n e f i t s would not l e a d
to longer d u r a t i o n s of such b e n e f i t s . For these people a r i s e i n
the weekly b e n e f i t r a t e would not r e s u l t i n c o s t i n c r e a s e s l n the
program g r e a t e r than the s i z e of the weekly i n c r e a s e times the num
ber of weeks which would have been compensated without the i n c r e a s e .
F o r the secondary e a r n e r s , who made up 30 per c e n t of the
respondents i n the Michigan sample, the c o e f f i c i e n t s of the b e n e f i t
v a r i a b l e s B/W and W-B suggest tha t i n a d d i t i o n to the d i r e c t c o s t s
of a b e n e f i t i n c r e a s e (the number of weeks for which compensation
would be r e c e i v e d times the weekly r a t e i n c r e a s e ) an i n d i r e c t c o s t
would be i n c u r r e d because some r e c i p i e n t s would draw b e n e f i t s f o r
a longer d u r a t i o n as a r e s u l t of the weekly r a t e I n c r e a s e . E s
timates of t h i s i n c r e a s e are presented as e l a s t i c i t i e s of d u r a t i o n
59
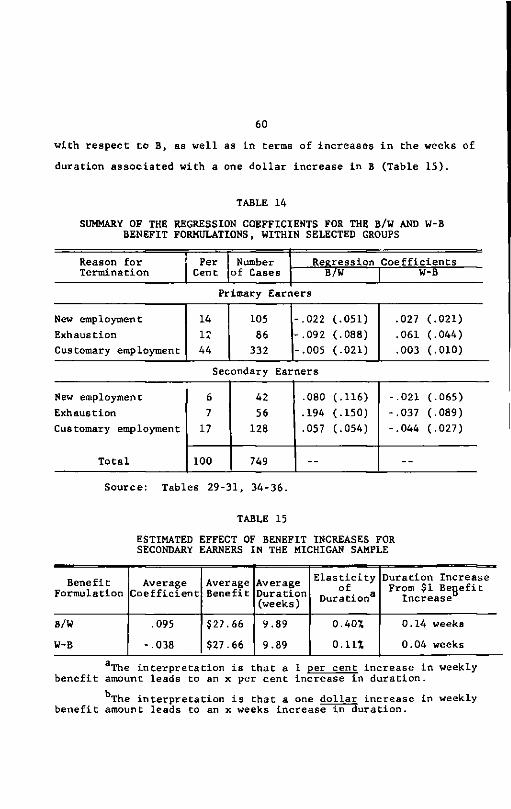
60
w i t h r e s p e c t to B, as w e l l as i n terms of i n c r e a s e s i n the weeks of
dur a t i o n a s s o c i a t e d w i th a one d o l l a r i n c r e a s e i n B (Ta b l e 1 5 ) .
TABLE 14
SUMMARY OF THE REGRESSION COEFFICIENTS FOR THE B/W AND W-B BENEFIT FORMULATIONS, WITHIN SELECTED GROUPS
. , Reason f o r j Per Termination 1 Cent
Number Re e r e s s i o n C o e f f i c i e n t s . , Reason f o r j Per Termination 1 Cent
of Cases B/W W-B
Primary Earn e r s
New employment Exhaustion Customary employment
14 12 44
105 86
332
-.022 (.051) -.092 (.088) -.005 (-021)
.027 (.021)
.061 (.044)
.003 (.010)
Secondary E a r n e r s
New employment Exhaustion
Customary employment
T o t a l
6 7
17
42 56
128
.080 (.116)
.194 (.150)
.057 (.054)
-.021 (.065) -.037 (.089) -.044 (.027)
New employment Exhaustion
Customary employment
T o t a l 100 749 -- --
Source: Tables 29-31, 34-36.
TABLE 15
ESTIMATED EFFECT OF BENEFIT INCREASES FOR SECONDARY EARNERS IN THE MICHIGAN SAMPLE
B e n e f i t Formulation
Average C o e f f i c i e n t
Average B e n e f i t
Average Duration (weeks)
E l a s t i c i t y of
D u r a t i o n 3
D u r a t i o n I n c r e a s e From $1 B e n e f i t
I n c r e a s e
B/W .095 $27.66 9.89 0.40% 0.14 weeks
W-B -.038 $27.66 9.89 0.11% 0.04 weeks aThe i n t e r p r e t a t i o n i s t h a t a 1 per c e n t I n c r e a s e i n weekly
b e n e f i t amount leads to an x per c e n t I n c r e a s e i n d u r a t i o n .
^The i n t e r p r e t a t i o n i s t h a t a one d o l l a r i n c r e a s e i n weekly b e n e f i t amount leads to an x weeks I n c r e a s e i n d u r a t i o n .
61
Thus, for secondary e a r n e r s , a 1 per cent i n c r e a s e i n B,
a c c o r d i n g to the B/W equation, lea d s to an i n c r e a s e of 0.4 per
c e n t i n d u r a t i o n . According to the W-B equation, a 1 per cent
i n c r e a s e i n B l e a d s to an i n c r e a s e of 0.11 per cent i n d u r a t i o n .
Viewed another way, a one d o l l a r i n c r e a s e i n B, according
to the B/W equation, lea d s to a 0.14 week i n c r e a s e I n average
d u r a t i o n f o r secondary e a r n e r s , or an i n c r e a s e of about 1.5 per
c e n t . According to the W-B equation, a one d o l l a r i n c r e a s e i n
weekly b e n e f i t s leads to a 0.04 week i n c r e a s e i n average d u r a t i o n
f o r secondary e a r n e r s , or an i n c r e a s e of l e s s than a 0.5 per
c e n t .
These changes are modest. One must a l s o be modest i n
drawing i m p l i c a t i o n s f o r p o l i c y from t h i s a n a l y s i s only. As
mentioned e a r l i e r , the absence of r e l e v a n t data c o v e r i n g other
s t a t e s and other times l i m i t e d the range of v a r i a t i o n of, and
between, the major v a r i a b l e s — w h i c h i n turn r e s t r i c t e d the gen
e r a l i z a t i o n s which could properly be drawn from the r e s u l t s of
the a n a l y s i s . I t did not hamper the development and e x p l o r a t i o n
of new hypotheses to e x p l a i n the d u r a t i o n of b e n e f i t s , however,
and a u s e f u l approach to the study of the i n c e n t i v e a s p e c t s of
weekly unemployment b e n e f i t s has been developed for f u t u r e use.
Advances i n the techniques of data c o l l e c t i o n together with i n
c r e a s i n g amounts of money being spent i n g a t h e r i n g i n f o r m a t i o n
g i v e promise of r e l e v a n t new data to analyze. I n t h i s way more
s a t i s f a c t o r y t e s t s of the r e l a t i o n s h i p of b e n e f i t d u r a t i o n to
weekly b e n e f i t s i z e w i l l be forthcoming to complete with i n t u i t i o n ,
p r e j u d i c e and I n e r t i a i n the p o l i t i c a l process which r e s u l t s i n
p u b l i c p o l i c y .
APPENDIX A
THE INSTITUTIONAL ENVIRONMENT OF UNEMPLOYMENT
BENEFITS AND THE ECONOMIC SETTING IN
MICHIGAN DURING 1955
A f a m i l i a r i t y w i t h the economic s e t t i n g and the i n s t i t u t i o n a l
.nvironment i n Michigan during 1955 i s important to an e v a l u a t i o n
o f t h i s study o f unemployment b e n e f i t s . To f u r t h e r e x p l a i n how
c l a i m a n t s whose i n t e r v i e w s are i n c o r p o r a t e d i n t h i s study had some
d i s c r e t i o n concerning the number of weeks of unemployment b e n e f i t s
for which they were compensated, a d d i t i o n a l i n f o r m a t i o n on the l e g a l
and a d m i n i s t r a t i v e s t r u c t u r e of the b e n e f i t program i s presented.
An understanding of c e r t a i n v a r i a t i o n s i n the d u r a t i o n of b e n e f i t s
between r e c i p i e n t s r e q u i r e s knowledge of the manner i n which en
t i t l e m e n t l i m i t s the b e n e f i t d u r a t i o n . An understanding o f v a r i a t i o n s
i n the s i z e of weekly b e n e f i t s between r e c i p i e n t s r e q u i r e s knowledge
of the b a s i s on which weekly b e n e f i t s a r e s e t for each c l a i m a n t .
Kn understanding of the c l i m a t e of opinion p r e v a i l i n g during the
period of data c o l l e c t i o n r e q u i r e s knowledge of the g e n e r a l economic
s e t t i n g i n Michigan d u r i n g t h a t time. These t o p i c s a r e covered i n
t h i s appendix.
The F e d e r a l - S t a t e Nature of the Unemployment B e n e f i t s Program
I n the United S t a t e s the unemployment compensation program
62

63
has always been a f e d e r a l - s t a t e program.* C e r t a i n s i m i l a r i t i e s a r e
found among s t a t e s as a r e s u l t of f e d e r a l l e g i s l a t i o n , but most
s t a t e s , i n c l u d i n g Michigan, have unique f e a t u r e s i n unemployment
compensation because s p e c i f i c implementation of the program i s de
termined by the s t a t e s . The importance of the f e d e r a l government
i n the program d e r i v e s from a 3 per c e n t f e d e r a l tax on t a xable em
p l o y e r p a y r o l l s . I n s t a t e s w i t h s u i t a b l e unemployment compensation
programs, however, employers ar e not r e q u i r e d to pay 2.7 per c e n t
of the f e d e r a l tax, although the remaining 0.3 per cent i s l e v i e d
and i s used to make grants to the s t a t e s to cover the a d m i n i s t r a t i v e
c o s t s of the s t a t e unemployment compensation programs. Since i n
f a c t every s t a t e now has an o p e r a t i v e unemployment compensation
program which h a s been deemed s u i t a b l e , a l l employers taxed under
the f e d e r a l law pay to the f e d e r a l government only the 0.3 per cent
tax on t a x a b l e p a y r o l l s . Each s t a t e has, however, l e v i e d a d d i t i o n a l
taxes on employers to provide funds to be paid as b e n e f i t s to un
employed workers who meet the requirements of i t s p a r t i c u l a r pro
gram. In a l l s t a t e s b e n e f i t s a r e paid as a matter of r i g h t , but
not a u t o m a t i c a l l y ; unemployed workers must make a c l a i m f o r bene
f i t s i n accordance w i t h the r e g u l a t i o n s of the s t a t e i n which they
r e s i d e .
The standards which the f e d e r a l government has e s t a b l i s h e d
f o r the states do not s e r i o u s l y l i m i t the k inds of programs which
a r e a c c e p t a b l e . Wide v a r i a t i o n s e x i s t between the s t a t e s i n the
tax r a t e s and i n the s i z e and d u r a t i o n of weekly b e n e f i t amounts
The S o c i a l S e c u r i t y Act passed by the Congress of the United S t a t e s o f America, approved August 14, 1935, as amended.
64
which a r e allowed. Only the s p e c i f i c f e a t u r e s of the Michigan pro
gram are r e l e v a n t to t h i s study. Although the d e t a i l s of the Mich
igan program have f r e q u e n t l y been modified, i t s g e n e r a l c h a r a c t e r
has not been s u b s t a n t i a l l y changed s i n c e 1955. The c o n d i t i o n s which
p r e v a i l e d d u r i n g 1955 a r e d e s c r i b e d below.
L e g a l and A d m i n i s t r a t i v e Aspects of the Michigan Program, and E n t i t l e m e n t to B e n e f i t s
The unemployment compensation program i n Michigan* r e q u i r e s
the a c t i v e p a r t i c i p a t i o n of the c l a i m a n t i n the c l a i m and b e n e f i t
payment procedure. The t o t a l amount of compensation r e c e i v e d by
two i n d i v i d u a l s with i d e n t i c a l employment and unemployment e x p e r i
ence w i l l be d i f f e r e n t i f one of them d e l a y s f i l i n g a c l a i m for
b e n e f i t s w h i l e the other f i l e s immediately a f t e r the onset of unem
ployment. At the time a c l a i m for unemployment compensation bene
f i t s was r e c e i v e d from an unemployed worker d u r i n g 1955, a s e p a r a t e
r e c o r d was e s t a b l i s h e d for t h a t c l a i m a n t based on i n f o r m a t i o n he
s u p p l i e d and on information secured from h i s most r e c e n t employer.
Employers are o b l i g e d to supply i n f o r m a t i o n requested by the Em
ployment S e c u r i t y Commission. On the b a s i s of i n f o r m a t i o n r e c e i v e d ,
an i n d i v i d u a l b e n e f i t year of 52 weeks was e s t a b l i s h e d for each
c l a i m a n t which began from the week he n o t i f i e d the commission that
he was unemployed and a p p l y i n g for b e n e f i t s . For each c l a i m a n t ,
e l i g i b i l i t y f o r b e n e f i t s was based upon h i s e a r n i n g s d u r i n g h i s
base p e r i o d , t h a t i s , the 52-week period p r i o r to the week i n which
he f i l e d h i s c l a i m .
*Michigan Employment S e c u r i t y Act (Act No. 1 of the P u b l i c Acts of the E x t r a S e s s i o n of 1936, as amended, i n c l u d i n g Act No. 281 of the P u b l i c Acts of 1955).

65
The minimum requirement for e l i g i b i l i t y f o r b e n e f i t s was
earnings i n covered employment 1 during the base peri o d of more than
$15.00 per week for 14 weeks. Two weeks of e l i g i b i l i t y f o r b e n e f i t s
were allowed f o r every three weeks during the base period i n which
he earned more than $15.00 per week, up to a maximum of 26 weeks
during any one b e n e f i t y e a r . I t follows t h a t 39 weeks of work i n
covered employment was s u f f i c i e n t to e n t i t l e the worker to the max
imum d u r a t i o n of b e n e f i t s . I f a claimant had more weeks of unemploy
ment during h i s b e n e f i t year than he had weeks of e n t i t l e m e n t , no
b e n e f i t s could be paid to him for the excess weeks of unemployment.
Only a t the e x p i r a t i o n of h i s b e n e f i t year could he f i l e a new
c l a i m , based on h i s earnings i n a new base period, t h a t i s , the
52-week perio d p r i o r to the date of the new c l a i m . I n the new de
t e r m i n a t i o n of e l i g i b i l i t y f o r b e n e f i t s , b e n e f i t payments would not
be c o n s i d e r e d as earnings i n covered employment.
I n Michigan the f i r s t week of unemployment fo l l o w i n g the
f i l i n g of a c l a i m f or b e n e f i t s i n a b e n e f i t year i s c a l l e d the "wait
ing week" and no b e n e f i t s are paid for t h i s i n i t i a l week. Unem
ployment b e n e f i t s could be paid to an e l i g i b l e c l a i m a n t for every
week he was unemployed during h i s b e n e f i t year subsequent to the
w a i t i n g week, s u b j e c t to the maximum e l i g i b i l i t y determined for him.
No weeks o f unemployment were compensated which oc c u r r e d p r i o r to
the f i l i n g of a c l a i m , and claims could not be f i l e d r e t r o a c t i v e l y .
'''Covered employment r e f e r s to employment to which the unemployment fund tax a p p l i e s . During 1955 t h i s i ncluded s e r v i c e s performed for remuneration for employers of e i g h t or more i n d i v i d u a l s , but excluded a g r i c u l t u r a l l a b o r , domes c i c s e r v i c e , p r o f e s s i o n a l s e r v i c e or s e r v i c e performed i n the employ of the s t a t e or any pol i t i c a l s u b - d i v i s i o n s thereof.
66
A d d i t i o n a l c o n d i t i o n s for r e c e i v i n g b e n e f i t s were t h a t the
c l a i m a n t s be a b l e , w i l l i n g and a v a i l a b l e to work. The a d m i n i s t r a t i v e
t e s t s that these c o n d i t i o n s were met i n c l u d e d the f o l l o w i n g : the
c l a i m a n t had to r e p o r t to the employment s e c u r i t y commission o f f i c e
a t scheduled times e i t h e r weekly or bi-weekly; the c l a i m a n t had to
r e g i s t e r w i th the employment s e r v i c e and a c c e p t r e f e r r a l s for em
ployment which they deemed s u i t a b l e for him; the c l a i m a n t had to
c a r r y out an independent s e a r c h f o r work and r e p o r t on h i s e f f o r t s .
S i n c e there were seldom enough r e f e r r a l s a t the employment s e r v i c e
to apply an a c t u a l work t e s t to most c l a i m a n t s , the other r e q u i r e
ments were i n p r a c t i c e more important i n i d e n t i f y i n g r e l u c t a n t
workers or m a l i n g e r e r s .
Because of the l i m i t e d e f f e c t i v e n e s s of these a d m i n i s t r a
t i v e c o n t r o l s , many c l a i m a n t s who wanted to delay t h e i r r e t u r n to
work s u c c e s s f u l l y postponed t h e i r re-employment and a t the same
time continued to c o l l e c t unemployment b e n e f i t s .
A d i f f e r e n t type of c o n t r o l over the number of weeks o f
b e n e f i t ? c o l l e c t e d a r i s e s from the requirement t h a t the c l a i m a n t
take an a c t i v e p a r t i n the c l a i m s procedure. Delays i n f i l i n g a
c l a i m f o r b e n e f i t s and f a i l u r e to r e p o r t for appointments a t the
c l a i m s o f f i c e r e s u l t i n l o s s o f compensation because r e t r o a c t i v e
f i l i n g i s not allowed.
I f a c l a i m a n t d e l a y s f i l i n g he may r e c e i v e b e n e f i t s for a
s m a l l e r number o f weeks of unemployment than he otherwise would,
although i f he remains unemployed long enough to r e c e i v e b e n e f i t s
for the maximum number of weeks to which he i s e n t i t l e d , t h i s
would not be the case. Evidence from the Hope C o l l e g e survey
67
i n d i c a t e s t h a t those who d i d not f i l e f o r b e n e f i t s as soon as
p o s s i b l e had h i g h e r exhaustion r a t e s than those who did not delay
(17 per c e n t and 13 per c e n t , r e s p e c t i v e l y ) , but the d i f f e r e n c e
i s not s t r i k i n g . Although some c l a i m a n t s who delayed f i l i n g d i d
not s h o r t e n t h e i r b e n e f i t sequence s i n c e they r e c e i v e d the maximum
number of weeks to which they were e n t i t l e d , most who delayed ap
p a r e n t l y d i d shorten t h e i r b e n e f i t sequence.
Weekly B e n e f i t Amounts
The s i z e of the weekly b e n e f i t amount for each e l i g i b l e un
employed worker was determined from a schedule of b e n e f i t s based
upon each c l a i m a n t ' s average weekly wage during h i s base period
and upon the number and r e l a t i o n s h i p of dependents. Separate ben
e f i t schedules were e s t a b l i s h e d for each of s i x d i f f e r e n t dependency
c l a s s e s i n which the s i z e of the weekly b e n e f i t v a r i e d w i t h the
l e v e l of the average weekly wage (Table 1 6 ) . C h i l d r e n counted for
more than o t h e r dependents i n determining dependency s t a t u s ; i n
some i n s t a n c e s two dependents who were not c h i l d r e n were equated
to one c h i l d . The f a t h e r was the only parent who could c l a i m the
c h i l d r e n as dependents u n l e s s the mother provided a l l or most of
t h e i r support. The dependency c l a s s e s were i d e n t i f i e d by the
l e t t e r s A through F. Dependency C l a s s A included s i n g l e persons
w i t h no dependents, and husbands and wiveB whose spouses a l s o work.
Dependency C l a s s B was f o r persons who had one dependent other than
a c h i l d - - t y p i c a l l y a husband whose w i f e does not work. C l a s s C
was for persons who had one c h i l d or two a d u l t dependents; C l a s s
D was f o r persons with two c h i l d r e n , or one c h i l d and one a d u l t
dependent, or three a d u l t dependents. C l a s s E and C l a s s F were for
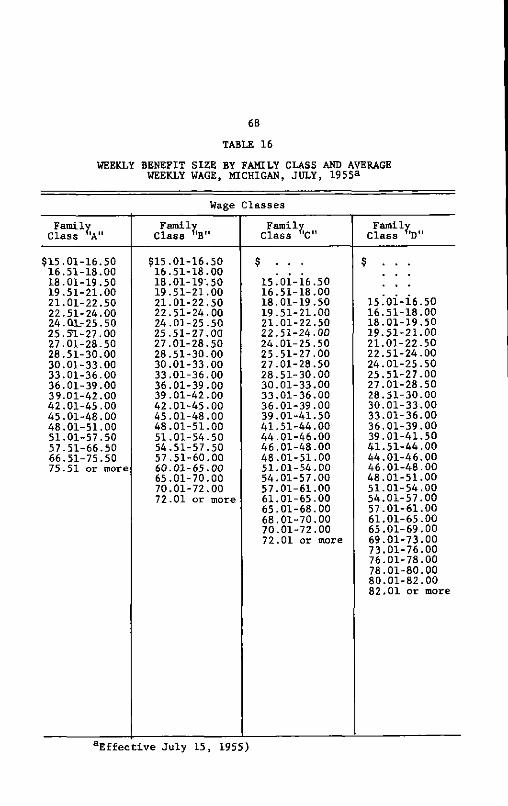
68
TABLE 16
WEEKLY BENEFIT S I Z E BY FAMILY CLASS AND AVERAGE WEEKLY WAGE, MICHIGAN, JULY, 1955 a
Wage C l a s s e s
Family C l a s s *'A"
Family C l a s s V'
Family C l a s s "C"
Famil y C l a s s V'
$15 01-16 50 $15 01-16 50 $ $ 16 51-18 00 16 51-18 00 , 18 01-19 50 18 01-19" 50 15 01-16 50 19 51-21 00 19 51-21 00 16 51-18 00 21 01-22 50 21 01-22 50 18 01-19 50 15 01-16 50 22 51-24 00 22 51-24 00 19 51-21 00 16 51-18 00 24 Qlr 25 50 24 01-25 50 21 01-22 50 18 01-19 50 25 51-27 00 25 51-27 00 22 51-24 00 19 51-21 00 27 01-28 50 27 01-28 50 24 01-25 50 21 01-22 50 28 51-30 00 28 51-30 00 25 51-27 00 22 51-24 00 30 01-33 00 30 01-33 00 27 01-28 50 24 01-25 50 33 01-36 00 33 01-36 00 28 51-30 00 25 51-27 00 36 01-39 00 36 01-39 00 30 01-33 00 27 01-28 50 39 01-42 00 39 01-42 00 33 01-36 00 28 51-30 00 42 01-45 00 42 01-45 00 36 01-39 00 30 01-33 00 45 01-48 00 45 01-48 00 39 01-41 50 33 01-36 00 48 01-51 00 48 01-51 00 41 51-44 00 36 01-39 OO 51 01-57 50 51 01-54 50 44 01-46 00 39 01-41 50 57 51-66 50 54 51-57 50 46 01-48 00 41 51-44 00 66 51-75 50 57 51-60 00 48 01-51 00 44 01-46 00 75 51 or more 60 01-65 00 51 01-54 00 46 01-48 00
65 01-70 00 54 01-57 00 48 01-51 OO 70 01-72 00 57 01-61 00 51 01-54 00 72 01 or more 61 01-65 00 54.01-57 00
65 01-68 00 57 01-61 00 68 01-70 00 61.01-65 00 70 01-72 00 65 01-69 00 72 01 or more 69 01-73.00
73.01-76 00 76 01-78 00 78 01-80 00 80 .01-82 00 82.01 or more
E f f e c t i v e J u l y 15, 1955)

69
TABLE 16--Continued
Wage C l a s s e s F a m i l y
C l a s s <'E" Family
C l a s s V' Weekly B e n e f i t Rate
§ . . . $ 10 11 12 13
15!oi-16 00 15 01-16.00 14 16.01-17 00 16 01-17.00 15 17.01-18 00 17 01-18.00 16 18.01-19 00 18 01-19.00 17 19.01-20 00 19 01-20.00 18 20.01-21 00 20 01-21.00 19 21.01-22 50 21 01-22.00 20 22.51-24 00 22 01-23.00 21 24.01-25 50 23 01-24.00 22 25.51-27 00 24 01-25.00 23 27.01-28 50 25.01-26.00 24 28.51-30 00 26 01-27.00 25 30.01-33 00 27 01-28.00 26 33.01-36 00 28 01-30.00 27 36.01-39 00 30 01-33.00 28 39.01-41 50 33 01-36.00 29 41.51-44 00 36 01-39.00 30 44.01-46 00 39 01-41.00 31 46.01-48 00 41 51-44.00 32 48.01-51 00 44 01-46.00 33 51.01-54 00 46 01-48.00 34 54.01-57 00 48 01-51.00 35 57.01-61 00 51 01-55.00 36 61.01-66 00 55 01-60.00 37 66.01-71 00 60 01-66.00 38 71.01-76 00 66 01-72.00 39 76.01-79 00 72 01-76.00 40 79.01-82 00 76 01-80.00 41 82.01-84 00 80 01-83.00 42 84.01-86 00 83 01-86.00 43 86.01-88 00 86 01-88.00 44 88.01-90 00 88 01-90.00 45 90.01-92 00 90 01-92.00 46 92.01-94 00 92 01-94.00 47 94.01 or more 94 01-96.00 48
96 01-98.00 49 98 01-100.00 50
100 01-102.00 51 102 01-104.00 52 104 01-106.00 53 106 01 or more 54
70
persons who had three and four c h i l d r e n r e s p e c t i v e l y , or other
combinations o f dependents i n the same g e n e r a l p a t t e r n r e p o r t e d
for C l a s s D. Wives who worked for wages were not allowed as de
pendents .
The c a l c u l a t i o n of average weekly wage was done s e p a r a t e l y
f o r each c l a i m a n t . Only wages from covered employment earned d u r i n g
the c l a i m a n t ' s base peri o d were i n c l u d e d i n the c a l c u l a t i o n . For
claim a n t s who had worked for more than one employer d u r i n g the base
period, wages w i t h the most r e c e n t employer were c o n s i d e r e d f i r s t .
An i n d i v i d u a l ' s average weekly wage with a base period employer was
determined by d i v i d i n g h i s t o t a l wages d u r i n g weeks i n which he
earned more than $15.00 by the number of such weeks.* S u b j e c t to
the l i m i t a t i o n of a maximum of 26 weeks of e n t i t l e m e n t i n any
b e n e f i t year, a c l a i m a n t who had two s u c c e s s i v e employers d u r i n g
h i s base p e r i o d and who remained unemployed long enough to use up
the weeks of b e n e f i t e n t i t l e m e n t d e r i v e d from h i s most r e c e n t em
ployer would be e l i g i b l e to r e c e i v e a d d i t i o n a l b e n e f i t s based on
h i s average weekly wage c a l c u l a t e d s e p a r a t e l y f o r e a r n i n g s r e
cei v e d from h i s p r i o r employer during h i s base p e r i o d .
The s i z e of weekly b e n e f i t s i n d o l l a r s i n c r e a s e d w i t h both
dependency c l a s s (determined by the number of dependents) and h i g h e r
average wages. Maximum weekly b e n e f i t s d i f f e r e d w i t h each de
pendency c l a s s . They were hig h e r f or dependency c l a s s e s r e p r e s e n t i n g
more dependents. Furthermore, a t every wage l e v e l , a l a r g e r weekly
* I t f o l l o w s th a t part-time work which l e s s e n s the average weekly wage a l s o r e s u l t s i n Iowar weekly b e n e f i t amounts; overtime work tends to i n c r e a s e the average weekly wage and thus the s i z e o f weekly b e n e f i t s .

71
b e n e f i t was g e n e r a l l y paid to clai m a n t s i n fa m i l y c l a s s e s r e p r e
s e n t i n g more dependents. Consequently a t every wage l e v e l g e n e r a l l y
a l a r g e r proportion of average weekly wage was compensated i n the
fa m i l y c l a s s e s r e p r e s e n t i n g more dependents. On the other hand,
w i t h i n each dependency c l a s s , the percentage of average weekly
wage compensated d e c l i n e d w i th i n c r e a s e s i n the average weekly
wage (Table 1 7 ) . B e n e f i t s paid to clai m a n t s who had low wage r a t e s
amounted to more than two-thirds of average weekly wage. At h i g h e r
wage r a t e s l e s s than h a l f of the average weekly wage was compen
sa t e d .
TABLE 17
WEEKLY BENEFIT SIZE AS A PERCENTAGE OF AVERAGE WEEKLY WAGE WITHIN AVERAGE WEEKLY WAGE LEVELS AND FAMILY CLASS
GROUPS, MICHIGAN, 1955 a
Average Weekly Wage
Family C l a s s Average Weekly Wage A B C D E F $30 67% 67% 70% 77% 83% 90% $40 58 58 62 68 72 78 $50 52 52 58 62 66 70 $60 47 48 53 57 60 62 570 41 44 50 53 54 56 $80 38 41 46 50 51 51 $90 33 37 41 47 50 50 $100 30 33 37 42 48 50 $125 24 26 30 34 38 43
Michigan Employment S e c u r i t y Act, Act No. 281, P u b l i c A c t s of 1955, e f f e c t i v e J u l y 15, 1955.
The Economic S e t t i n g i n Michigan during 1955
I n Michigan's economy i n the 1950's a s i n g l e i n d u s t r y ,
automobile manufacturing, accounted f o r about 20 per cent of t o t a l
wage and s a l a r y employment, and almost h a l f of manufacturing

72
employment. I n 1955, a r e c o r d y e a r f or the output f or c a r s and
tr u c k s i n the United S t a t e s , 9.2 m i l l i o n u n i t s were produced. Un
employment i n Michigan during 1955 averaged below 4 per c e n t , or
about 2 per c e n t l e s s than the average unemployment f i g u r e f o r
Michigan i n 1954 and 1956. N e v e r t h e l e s s , t o t a l wage and s a l a r i e d
employment was below the r e c o r d y e a r of 1953 and most of the de
c l i n e from 1953 was r e g i s t e r e d i n the automobile i n d u s t r y . The
d e c l i n e i n employment i n the Michigan automobile i n d u s t r y over the
pas t decade has been steady. I n c r e a s e s i n worker p r o d u c t i v i t y and
a c o n t i n u i n g tendency f o r the i n d u s t r y to d e c e n t r a l i z e and reduce
Michigan's t o t a l share o f the i n d u s t r y output have c o n t r i b u t e d to
the d e c l i n e .
The sample of unemployment compensation r e c i p i e n t s to be
in t e r v i e w e d was s e l e c t e d during the summer of 1955. Employment
was high and unemployment was low i n Michigan during these summer
months. N e v e r t h e l e s s , employment was d e c l i n i n g and unemployment
was i n c r e a s i n g s l i g h t l y . Manufacturing--predominantly auto manu
f a c t u r i n g — w a s r e s p o n s i b l e f or the d e c l i n e I n employment because
o f model-change l a y o f f s which o c c u r r e d during t h i s p e r i o d . I n
g e n e r a l , workers were not r e c a l l e d to the p l a n t s of two automobile
manufacturers during the summer. Workers who had been l a i d o f f as
a r e s u l t of the model changeovers made by these two companies were
a very sm a l l proportion o f the sample. Workers were r e c a l l e d to
the p l a n t s of a t h i r d automobile manufacturer during the summer and
a s i z e a b l e p o r t i o n of the sample i s from t h i s company. During the
1954-56 perio d t h i s t h i r d company was considered to have been the
l e a s t r e l i a b l e of the b i g three i n terms of the s t e a d i n e s s and pre
d i c t a b i l i t y of employment i n i t s p l a n t s .

73
During 1955 the number of unemployment compensation c l a i m s
f i l e d 1 decreased s t e a d i l y each month from the beginning of the year
u n t i l June, and then i n c r e a s e d month by month u n t i l October, when
the number began to d e c l i n e . The number of " f i r s t payments" ( i n d i
c a t i n g new unemployment) followed the same p a t t e r n except tha t the
low p o i n t was reached e a r l i e r , i n May, so that by June an i n c r e a s e
was a l r e a d y apparent. Each month from January, 1955, on the num
ber o f c l a i m a n t s who exhausted t h e i r b e n e f i t r i g h t s d e c l i n e d , w i t h
the s h a r p e s t d e c l i n e s o c c u r r i n g i n A p r i l , May, and June. The i n
c r e a s e d manpower demands of the automobile companies which r e s u l t e d
from the h i g h production r a t e s of 1955 were l a r g e l y met by an i n
t e n s i v e use of overtime r a t h e r than by an i n c r e a s e i n the number
of workers.
Each week c l a i m a n t s must a t t e s t to unemployment and c l a i m b e n e f i t s so the t o t a l number of c l a i m s f i l e d i s roughly equal to the number of people-weeks o f unemployment a t t e s t e d to. Because of " w a i t i n g weeks and f i n d i n g s of i n e l i g i b i l i t y , the t o t a l number of c l a i m s f i l e d t y p i c a l l y exceeds the number of weeks compensated.
APPENDIX B
THE SAMPLE SURVEY PROCEDURE
Survey Research Background
The sample survey i s a r e l a t i v e l y new r e s e a r c h t o o l . A
body of knowledge has developed about the sample survey which I s
s u f f i c i e n t l y e x t e n s i v e to c o n s t i t u t e a new d i s c i p l i n e . There i s ,
however, much o v e r l a p p i n g w i t h other r e s e a r c h d i s c i p l i n e s , as men
tioned e a r l i e r by Campbell and Katona.
The b a s i c survey procedure, as used i n the s o c i a l s c i e n c e s , i s made up o f a combination of techniques which have been developed i n v a r i o u s r e s e a r c h d i s c i p l i n e s . The procedures of i n t e r v i e w i n g , f or example, a r e based l a r g e l y on the experien c e of p s y c h o l o g i s t s , a n t h r o p o l o g i s t s , and o t h e r s who used the p e r s o n a l I n t e r v i e w both as a r e s e a r c h t o o l and as a means of d i a g n o s i s or therapy long before i t was adapted f o r survey use. Techniques of s c a l i n g and other methods of measurement have been borrowed from both s o c i o l o g y and psychology. Sampling methods have come i n p a r t from a g r i c u l t u r a l economics. Methods o f content a n a l y s i s have been drawn from a v a r i e t y of f i e l d s , i n c l u d i n g p o l i t i c a l s c i e n c e . Techniques o f s t a t i s t i c a l a n a l y s i s of, mass d a t a a r e common to a l l f i e l d s o f q u a n t i t a t i v e r e s e a r c h i n the s o c i a l s c i e n c e s . 1
Despite the o r i g i n s of these techniques i n other f i e l d s ,
much r e s e a r c h has a l r e a d y been d i r e c t e d e x p l i c i t l y a t improving
sample surveys and toward a b e t t e r understanding of the method.
The groups which pioneered I n survey r e s e a r c h a r e no longer alone
Angus Campbell and George Katona, "The Sample Survey: A Technique f or S o c i a l S c i e n c e R e s e a r c h , " Research Methods i n the Beh a v i o r a l S c i e n c e s , ed. Leon F e s t i n g e r and D a n i e l Rats (New York: The Dryden P r e s s , 1953), pp. 15-16.
74
75
i n the f i e l d . I n v a r y i n g degrees of i n s t i t u t i o n a l i z a t i o n , new
survey r e s e a r c h groups i n academic s e t t i n g s have developed i n r e
ce n t y e a r s to i n c r e a s e the use of the survey r e s e a r c h method i n
s o c i a l research.''" Although survey r e s e a r c h methods have become i n
c r e a s i n g l y understood throughout the academic p r o f e s s i o n , the
c e n t r a l importance o f survey data to t h i s study warrants a review
of the pro c e s s e s of i t s c o l l e c t i o n . The v a l i d i t y of the data a r e a s
important to the s u c c e s s of a r e s e a r c h r e p o r t as the v a l i d i t y of
the a n a l y s i s .
The Hope College Survey
The p e r i o d during which a r e s e a r c h goal i s made opera
t i o n a l v a r i e s e x t e n s i v e l y from study to study and with the e x p e r i
ence of the r e s e a r c h e r s . I n the Hope C o l l e g e survey, the r e q u e s t
f o r the study was made i n l a t e 1953 by the L e g i s l a t u r e , and the
r e s e a r c h team which executed most of the study was assembled i n
February, 1954. The remainder of the year 1954 was spent i n t r a n s
l a t i n g the g e n e r a l g o a l s i n t o a r e s e a r c h plan which would be eco
n o m i c a l l y f e a s i b l e and i n conducting a s e a r c h for funds to fi n a n c e
the study. The g r a n t from the M e r r i l l Foundation was made e a r l y i n
1955, but major t a s k s s t i l l remained to be done. These i n c l u d e d
s p e c i f i c a t i o n of the u n i v e r s e to be sampled and the s e l e c t i o n of
1The N a t i o n a l Opinion Research Center of The U n i v e r s i t y of Chicago was formed i n 1941; the Bureau of Program Surveys of the U.S. Department o f A g r i c u l t u r e was operating i n t h i s area i n the l a t e 1930's and a group from the Bureau formed the Survey Research Center i n 1946 a t The U n i v e r s i t y of Michigan. More r e c e n t l y survey r e s e a r c h c e n t e r s have heen e s t a b l i s h e d at u n i v e r s i t i e s i n C a l i f o r n i a , Wisconsin, and Minnesota. Methodological r e s e a r c h i s a l s o being c a r r i e d out under the d i r e c t i o n of Professor Robert Ferber a t the U n i v e r s i t y o f I l l i n o i s , and the Bureau of Applied S o c i a l Research of Columbia U n i v e r s i t y has conducted sur v e y s .
76
the sample, the design of the q u e s t i o n n a i r e , the a c t u a l c o l l e c t i o n
of data i n the f i e l d , and, f i n a l l y , coding and t a b u l a t i n g o f the
data p r i o r to a n a l y s i s . Each of these stages of the survey p r o c e s s
i s i l l u s t r a t e d through f u r t h e r d e s c r i p t i o n of the Hope survey.
Sampling.--The u n i v e r s e chosen was r e c i p i e n t s of unemploy
ment b e n e f i t s who terminated b e n e f i t s during the months of J u l y ,
August, and the f i r s t two weeks of September of 1955. A p r o b a b i l i t y
sample o f t hese r e c i p i e n t s was s e l e c t e d from the a d m i n i s t r a t i v e
r e c o r d s of the Michigan Employment S e c u r i t y Commission. R e c i p i e n t s
were sampled by t h e i r t e r m i n a t i o n s so there would be d e f i n i t e i n
formation c o v e r i n g t h e i r d u r a t i o n o f unemployment b e n e f i t s and to
i n s u r e t h a t i n t e r v i e w i n g could take p l a c e s h o r t l y a f t e r the termina
t i o n . The sample was f u r t h e r c l a s s i f i e d i n t o r e c i p i e n t s who had
( 1 ) r e c e i v e d o n l y one or two weeks o f b e n e f i t s , and those who had
( 2 ) r e c e i v e d t h r e e or more weeks of b e n e f i t s . I n t e r v i e w s were
only attempted w i t h r e c i p i e n t s i n the second group.
The sampling was c l o s e r to simple random sampling than that
u s u a l l y achieved i n l a r g e - s c a l e e m p i r i c a l i n v e s t i g a t i o n s . I t was
a two-stage a r e a sample i n which the a d m i n i s t r a t i v e o f f i c e s of the
Michigan Employment S e c u r i t y Commission were i d e n t i f i e d w i t h coun
t i e s because the Michigan Area Sample of the Survey R e s e a r c h Center
waB expressed by c o u n t i e s . At the Commission o f f i c e s w i t h i n the
county a r e a s s e l e c t e d as p a r t o f the Michigan Area Sample, l i s t s
provided by the c l a i m c a r d s of i n d i v i d u a l s f i l e d by the l a s t four
d i g i t s of t h e i r s o c i a l s e c u r i t y numbers were s y s t e m a t i c a l l y sampled
a t r a t e s which r e s u l t e d i n an o v e r - a l l uniform sampling f r a c t i o n .
Of the t o t a l sample of c l a i m a n t s , over 80 per cent were s e l e c t e d
77
i n s e l f - r e p r e s e n t i n g a r e a s , t h a t i s , i n areas from which the s e
l e c t e d c l a i m a n t s represented t h a t p a r t i c u l a r area and no o t h e r .
L e s s than 20 per cent were s e l e c t e d from areas which r e p r e s e n t one
or more c o u n t i e s i n a d d i t i o n to the county from which the s e l e c
t i o n was made. I n both types of a r e a s , m u l t i p l i c a t i o n o f the se
l e c t i o n p r o b a b i l i t i e s a t each stage y i e l d e d the same o v e r - a l l
p r o b a b i l i t y . The sample was t h e r e f o r e s e l f - w e i g h t i n g .
Because o f the thinness of the population i n some c o u n t i e s
i t was n e c e s s a r y to r e s o r t to n o n - s e l f - r e p r e s e n t i n g a r e a s . I n t e r
v i ewing c o s t s would otherwise have been p r o h i b i t i v e l y expensive.
Separate s t r a t a based on geographic l o c a t i o n and economic c h a r a c t e r
i s t i c s were formed from counties of l e s s e r population d e n s i t y . One
county i n each stratum was s e l e c t e d to represent both i t s e l f and
the other c o u n t i e s i n the stratum. The s e l e c t i o n o f r e c i p i e n t s
from a county so chosen was made a t a r a t e to r e p r e s e n t the whole
stratum.
The Upper P e n i n s u l a was d i v i d e d i n t o two s t r a t a , as was the
upper p o r t i o n of the Lower P e n i n s u l a . Seven a d d i t i o n a l s t r a t a were
formed from the p o r t i o n s o f the Lower Pen i n s u l a which remained
a f t e r the s e l f - r e p r e s e n t i n g areas of the D e t r o i t Metropolitan Area
and the c o u n t i e s around the c i t i e s of F l i n t , Saginaw, and Bay C i t y ,
L a n s i n g , Grand Rapids, and Muskegon were removed.
P r i o r to the f i n a l sample s e l e c t i o n , a p i l o t sampling was
c a r r i e d out which served two purposes. F i r s t , i t y i e l d e d an e s t i
mate w i t h c o n f i d e n c e i n t e r v a l s of the s i t e of the c l a i m a n t u n i
v e r s e , by means of which the sampling f r a c t i o n of the f i n a l sampling
was e s t a b l i s h e d . Secondly, i t provided an opportunity f o r t e s t i n g
78
sampling procedures, i n c l u d i n g the i n s t r u c t i o n s to the p e r s o n n e l of
the Michigan Employment S e c u r i t y Commission who c a r r i e d out the
a c t u a l sample s e l e c t i o n with l i a i s o n through the Research and
S t a t i s t i c s D i v i s i o n of the Commission.*
A d m i n i s t r a t i v e information.--For each of the b e n e f i t r e
c i p i e n t s I n the i n i t i a l sample, information was t r a n s c r i b e d from
the i n d i v i d u a l c l a i m c a r d and e v e n t u a l l y recorded on punch-
cards for easy t a b u l a t i o n . Data about the f o l l o w i n g items were
recorded: a c t u a l d u r a t i o n of b e n e f i t s , weekly b e n e f i t r a t e ,
q u a l i f y i n g average weekly wage, f a m i l y c l a s s , reason f or termina
t i o n of b e n e f i t s , p l a c e of r e s i d e n c e , and some other i n f o r m a t i o n .
Thus i t was p o s s i b l e , a f t e r the i n t e r v i e w s were completed, to com
pare the respondents and the non-respondents on these c h a r a c t e r
i s t i c s .
Qu e s t i o n n a i r e and p r e - t e s t i n g . - - T h e q u e s t i o n n a i r e went
through many d r a f t s as i s u s u a l f or s t u d i e s i n new a r e a s . Each
major v e r s i o n was t e s t e d i n a s e t of i n t e r v i e w s with r e c e n t r e
c i p i e n t s of b e n e f i t s s e l e c t e d from the p i l o t sampling o p e r a t i o n .
I t was p o s s i b l e to v a l i d a t e some of the responses by comparing
them with the Information which had been t r a n s c r i b e d from the ad
m i n i s t r a t i v e r e c o r d s , but the p r e - t e s t s were mostly used to a s s e s s
the i n t e r v i e w f or lengt h , respondent acceptance, ease o f adminis
t r a t i o n , and the apparent s a l i e n c e of i t s q u e s t i o n s . The q u e s t i o n
n a i r e was for the most p a r t c o n s t r u c t e d on a f i x e d - q u e s t i o n , open-
answer b a s i s , i n which the i n t e r v i e w e r s wrote the v e r b a t i m or
*See a l s o the author's more d e t a i l e d r e p o r t , "Sampling i n the Study of R e c i p i e n t s of Compensation for Hope C o l l e g e " (Survey Research Center, October, 1 9 5 6 ) , i n c l u d e d as Appendix D.

79
near-verbatim answers of the respondents on the schedule. The ques
t i o n n a i r e s c h e d u l e s were returned to the f i e l d o f f i c e of the Survey
Research Center i n Ann Arbor where a check on the d i s p o s i t i o n of each
s e l e c t e d respondent was maintained, and where the i d e n t i t y of the
sample a d d r e s s and the i n t e r v i e w were separated except through a
s p e c i a l code to a s s u r e the anonymity of the respondents.
On t h e i r own i n i t i a t i v e r e p r e s e n t a t i v e s of employer groups
had been i n touch with the development of the q u e s t i o n n a i r e and
union groups were i n v i t e d to i n s p e c t the q u e s t i o n n a i r e as i t neared
the f i n a l - d r a f t s t age. The union r e p r e s e n t a t i v e s r a i s e d some ob
j e c t i o n s to s e v e r a l q u e stion sequences and although s e v e r a l changes
based on t h e i r comments were i n c o r p o r a t e d , the o b j e c t i o n s remained.'''
The q u e s t i o n n a i r e was completed and made ready for i n t e r v i e w d u r i n g
the f a l l of 1955.
I n t e r v i e w e r s ' i n s t r u c t i o n book.--In a d d i t i o n to the f a c e -
t o - f a c e t r a i n i n g t y p i c a l of Center operation, an i n s t r u c t i o n book
was prepared as a guide for each i n t e r v i e w e r concerning the spe
c i f i c f e a t u r e s o f the survey. The background of the survey, the
sample, d e f i n i t i o n s and concepts p e c u l i a r to the study, suggested
i n t r o d u c t i o n s , f i e l d notes, and statements of the o b j e c t i v e s of
each q u e s t i o n i n the i n t e r v i e w schedule were i n c l u d e d . T h i s book
was completed i n October, 1955, and was d i s t r i b u t e d to a l l i n t e r
v i e w e r s as p a r t of t h e i r t r a i n i n g for the study.
F i e l d o p e r a t i o n s . - - P r o f e s s i o n a l i n t e r v i e w e r s of the Survey
Research Center were used to undertake p e r s o n a l i n t e r v i e w s w i th the
''"Memorandum from Ralph Showalter to Clayton E. Johnson, "Hope C o l l e g e Study on Unemployment Compensation--Questionnaire" ( R S : b s , l i u 7 2 c i o , November 7, 1955).

80 selected claimants in their homes. Several supervisors from other parts of the country assisted with interviewing in areas where a regular interviewing s t a f f was not maintained. "In order to concentrate on a group with more meaningful unemployment experience,"''" persons whose sequence of payments lasted for less than three weeks were excluded from the interview group.
There were 760 respondents who were successfully i n t e r viewed. I t was frequently necessary for the interviewer to make several c a l l s on one respondent for in many cases the i n i t i a l contact was not at a time when the claimant was able to grant an interview. Of a l l potential respondents, 88 per cent were found to reside at the addresses given on the original claim cards, or at forwarding addresses. The other 12 per cent were not located at the addresses given on the claim cards. Among those who were found, 92 per cent were successfully interviewed, for a combined coverage rate of 82 per cent. Interviews t y p i c a l l y lasted about 55 minutes.
Coding, or content analysis.—Cross-section samples of several hundred cases can only be e f f i c i e n t l y analyzed i f the data are processed on mechanical or electronic equipment. In practice, the variables which w i l l be available for analysis are limited by the decisions made at this stage. Although new variables can l a t e r be formed through combinations of one or more variables, the origi n a l decisions about what information to code and what variables and categories to use are most important. The inconvenience and
"Yntema, p. 3:1.
81 expense of going back to the original interviews after most of the data are coded i s the major limitation on recording.
Data from the personal interviews were i n i t i a l l y coded on six punchcards for each respondent. One additional punchcard for each respondent selected in the original sample contained information from the administrative records of the Michigan Employment Security Commission. A unique identifying number was recorded on a l l of the punchcards for one respondent so that information for that individual could be freely transferred among the original cards or to s t i l l other cards made up e x p l i c i t l y for the purpose of providing certain combinations of data. Most IBM mechanical equipment requires that information which i s to be analyzed together be on the same card. On the electronic computers the cost usually depends on the number of cards on which data i s stored for each sample case.
Tabulations.--An unusually extensive set of cross-tabulations was i n i t i a l l y provided to Hope College according to s p e c i f i cations which were established by i t s research staff and i t was from these tabulations that the i n i t i a l report was prepared. One set of punchcards was provided to Hope College while a duplicate set was retained by the Survey Research Center. After leaving Hope College the author had permission to conduct this independent analysis using the material at the Survey Research Center.
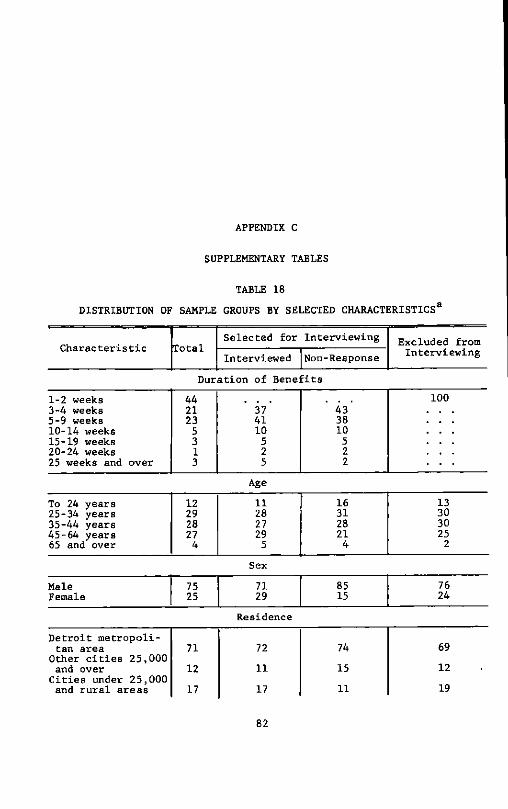
APPENDIX C
SUPPLEMENTARY TABLES
TABLE 18 DISTRIBUTION OF SAMPLE GROUPS BY SELECTED CHARACTERISTICS a
Characteristic Total Selected for Interviewing Excluded from
Interviewing Characteristic Total Interviewed Non-Response
Excluded from Interviewing
Dux ation of Benefits 1-2 weeks 44 100 3-4 weeks 21 37 43 5-9 weeks 23 41 38 10-14 weeks 5 10 10 15-19 weeks 3 5 5 20-24 weeks 1 2 2 25 weeks and over 3 5 2
Age To 24 years 25-34 years 35-44 years 45-64 years
13 30 30 25 2
Sex 1 1
Male 75 71 85 76 Female 25 29 15 24
Residence Detroit metropolitan area 71 72 74 69
Other c i t i e s 25,000 and over 12 11 15 12
Ci t i e s under 25,000 and rural areas 17 17 11 19
82
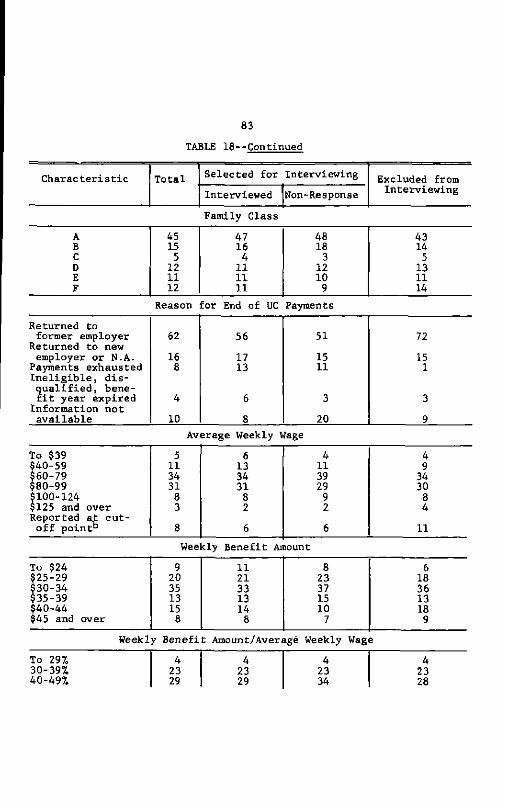
83 TABLE 18--Continued
Characteristic Total Selected for Interviewing Excluded from Interviewed Non-Response Interviewing
Family Class A 45 47 48 43 B 15 16 18 14 C 5 4 3 5 D 12 11 12 13 E 11 11 10 11 F 12 11 9 14
Reason for End of UC Payments Returned to former employer 62 56 51 72
Returned to new employer or N.A. 16 17 15 15
Payments exhausted 8 13 11 1 I n e l i g i b l e , disqualified , benef i t year expired 4 6 3 3
Information not available 10 8 20 9
Average Weekly Wage To $39 5 6 4 4 $40-59 11 13 11 9 $60-79 34 34 39 34 $80-99 31 31 29 30 S100-124 8 8 9 8 $125 and over 3 2 2 4 Reported at cutoff paint" 8 6 6 11
Weekly Benefit AT nount To $24 9 11 8 6 $25-29 20 21 23 18 $30-34 35 33 37 36 $35-39 13 13 15 13 $40-44 15 14 10 18 $45 and over 8 8 7 9
Weekly Benefit Amount/Average Weekly Wag e To 297o 4 4 4 4 30-39% 23 23 23 23 40-497. 29 29 34 28

84 TABLE 18--Continued
Characteristic Total Selected for Interviewing Excluded from Characteristic Total Interviewed Non-Response Interviewing
50-59% 30 36 28 29 60-69% 6 6 5 5 70% and over . 1 . Wage reported a t cut-off point b 8 6 6 11
Total 100 100 100 100 Number of cases 1,675 760 177 738
aDwight B. Yntema, "Survey of Unemployment Compensation i n Michigan, 1953' (Hope College, Department of Economics and Business Administration, February, 1957). (Mimeographed.)
Persons whose average weekly wage was reported as the amount needed to qualify for the maximum benefit of the recipient's family c l a s s though the actual wage figure may have been higher.
TABLE 19 PERCENTAGE DISTRIBUTION OF RESPONDENTS AND SELECTED
EMPLOYMENT DATA, BY INDUSTRY3
Indus try Hope
Michigan Workers Covered by
Unemployment Insurance
Michigan Non-Farm Wage and Salary
Workers Indus try College
Respondents 1954
Average Jan.-June
1955 Average
1954 Average
Jan.-June 1955
Average Motor vehicle and equipment manufacturing
Other manufacturing Construction Trade Other
62 21 5 5 7
25 36 5
18 16
26 36 4 18 16
20 29 5 19 27
21 30 4 19 26
Total 100 100 100 100 100
interna, p. 4:8.

85 TABLE 20
PERCENTAGE DISTRIBUTION OF RESPONDENTS AND OF 1950 NON-AGRICULTURAL EMPLOYMENT, BY OCCUPATION AND AGE, TOTAL, MEN, AND WOMEN
Respondents Hope College Interviewees
Michigan Non-Agricultural Employment, 1950
Total Men Women Total Men Women Occupation
Professional, managerial, and self-employed 2 3 2 18 18 17
C l e r i c a l and sales 8 3 18 21 13 41 Ski l l e d 16 22 3 18 24 2 Semi-skilled 66 64 71 28 32 19 Unskilled 6 7 2 10 6 20 Service 2 1 4 5 7 1
Age To 24 years 11 12 6 16 13 24 25-34 27 28 26 26 26 25 35-44 25 21 37 23 24 23 45-64 31 31 29 31 33 25 65 and over 6 8 2 4 4 3
Total 100 LOO 100 100 100 100 aYntema, pp. 4:8-4:9.
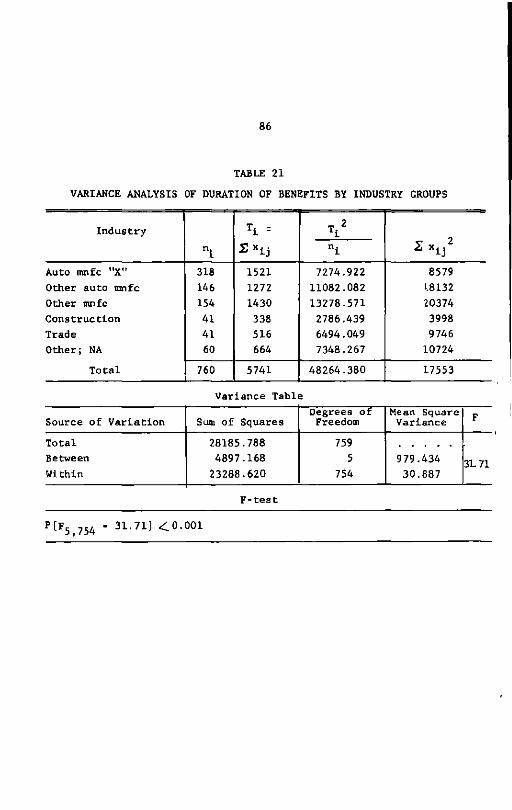
86
TABLE 21 VARIANCE ANALYSIS OF DURATION OF BENEFITS BY INDUSTRY GROUPS
Industry T i = x X i j
2 n l S * i j n i x X i j
2
Auto mnfc "X" 318 1521 7274.922 8579 Other auto nmfc 146 1272 11082.082 1.8132 Other mnfc 154 1430 13278.571 20374 Construction 41 338 2786.439 3998 Trade 41 516 6494.049 9746 Other; NA 60 664 7348.267 10724
Total 760 5741 48264.380 17553
Variance Tabl
Source of Variation Sum of Squares Degrees of Freedom
Mean Square Variance F
Total 28185.788 759 Between 4897.168 5 979.434 3L 71 Within 23288.620 754 30.887
3L 71
F-test
P [ F5,754 • 3 1 - 7 1 ] < 0 - 0 0 1

87
TABLE 22 VARIANCE ANALYSIS OF DURATION OF BENEFITS BY OCCUPATIONAL GROUPS
Occupation n i T i
^ 2
n i „ 2
Professional 18 222 2738.000 3660 Cler. & Sales 57 696 8498.526 11942 Skilled 124 995 7984.072 13645 Semi-skilled 496 3239 21151.454 33767 Unskilled 42 362 3120.095 4496 Service 23 227 2240.391 4043
Total 760 5741 45732.538 71553 Variance Ta ble
Source of Variation Sum of Squares Degrees of Freedon
Mean Square Variance F
Total 28185.788 759 Between Within
2365.326 25820.462
5 754
473.065 34.245
L3.81
F-test P[F 5 ? 5 4 = 13.81] -£0.001
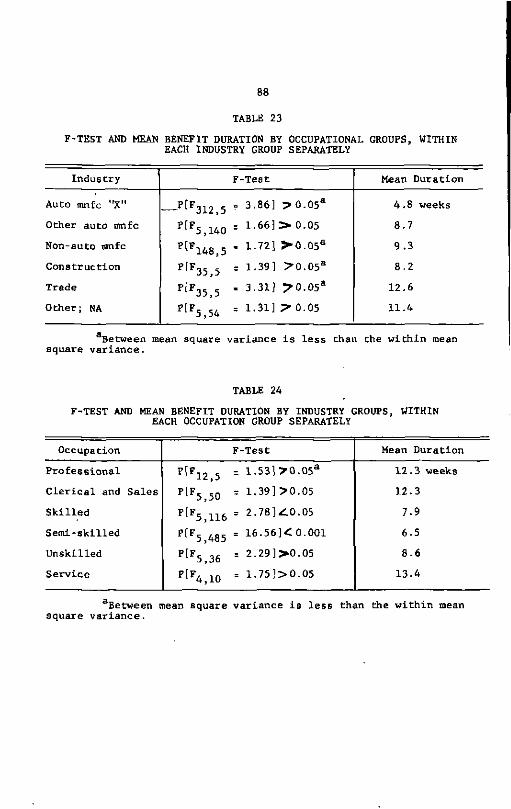
88
TABLE 23 F-TEST AND MEAN BENEFIT DURATION BY OCCUPATIONAL GROUPS, WITHIN
EACH INDUSTRY GROUP SEPARATELY
Industry F -Test Mean Duration
Auto mnfc "X" P [ F312,5 = 3.86] ^ 0 . 0 5 a 4.8 weeks Other auto mnfc P [ F5,140 = 1.66] > 0.05 8.7 Non-auto nmfc Pt F148,5 - 1.72] >0.05 a 9 .3 Construction P [ F35,5 = 1.39] ?"0.05 a 8.2 Trade Pf F35,5 - 3.31] ^ 0 . 0 5 a 12.6 Other; NA P [ F5,54 = 1.31] ^0.05 11.4
Between mean square variance i s less than the within mean square variance.
TABLE 24 F-TEST AND MEAN BENEFIT DURATION BY INDUSTRY GROUPS, WITHIN
EACH OCCUPATION GROUP SEPARATELY
Occupation F-Test Mean Duration Professional P [ F12,5 = 1.53] >0.O5 a 12 3 weeks C l e r i c a l and Sales P[ F5,50 c 1.39] >0.05 12 3 Ski l l e d P [ F5,116 = 2.78]Z.0.05 7 9 Semi-skilled P [ F5,485 = 16.56K0.001 6 5 Unskilled P [ F5,36 = 2.29]>0.05 8 6 Service P [ F4,10 = 1.75]>0.05 13 4
Between mean square variance i s less than the within mean square variance.

TABLE 25 VARIANCE ANALYSIS OF DURATION OF BENEFITS BY INDUSTRY-AGE-SEX GROUPS
Sub-Group n i
T i * 2 x i j n i S * i j 2
Auto mnfr X 319 1524 7280 803 8588 Other auto mnfr, under 45,M 54 281 1462 241 1801 Other auto mnfr, under 45,F 28 202 1457 286 1970 Other auto mnfr, 45-64,M 37 309 2580 568 3477 Other auto mnfr, 45-64,F 13 198 3015 692 4334 Other auto mnfr, 65 and over 14 304 6601 143 7166 Other mnfr, under 45, M 54 361 2413 352 3403 Other mnfr, under 45, F 52 549 5796 173 8235 Other mnfr, 45-64, M 24 200 1666 667 2770 Other mnfr, 45-64, F 18 192 2048 000 2806 Other mnfr, 65 and over 13 186 2661 231 3640 Construction 41 338 2786 439 3998 Trade and other, under 45,M 18 118 773 556 950 Trade and other, under 45,F 28 401 5742 893 7703 Trade and other, 45-64, M 17 150 1323 529 2002 Trade and other, 45-64, F 21 273 3549 000 4777 Trade and other, 65 and over 9 179 3560 111 4223
Total 760 5765 54718 684 71843
Variance Table Source ot Variation Sum of Squares Degrees of
Freedom Mean Square Variance F
Total 28112 441 759 Between 10988 125 16 686.76
29.79 Within 17124 316 743 23-05
F-test
p f F i f i TAT - 29.79] ,£0.001

90 TABLE 26
MEAN DURATION RESIDUALS FROM INDUSTRY-AGE-SEX MEANS WITHIN SELECTED VARIABLES
Selected Variables Mean Residual Number of (In weeks) Cases
Education 0-8 years, no other training 0.0 266 0-8 years, other training -1.2 69 9-11 years, no other training -0.4 141 9-11 years, other training 0.7 87 12 or more years, no other training 0.0 102 12 or more years, other training 0.6 67
Length of Employment with Separating Employer
Under 1 year -0.3 137 1-2 years -0.4 120 3-4 years -0.5 118 5-9 years 0.7 203 10-19 years 0.2 85 20 or more years -0.1 95
Race
Negro 0.3 141 Non-Negro 0.0 614
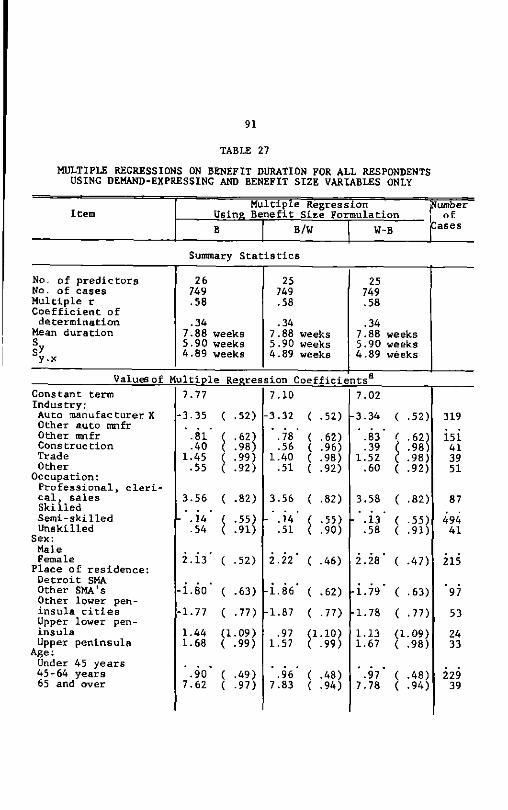
91
TABLE 27 MULTIPLE REGRESSIONS ON BENEFIT DURATION FOR ALL RESPONDENTS
USING DEMAND-EXPRESSING AND BENEFIT SIZE VARIABLES ONLY
Item Multiple Regression (Number
Usine Benefit Site Formulation i o f Item B B/W W-B f a s e s
Summary Stat 1
I s t i c s 1
No. of predictors No. of cases Multiple r Coefficient of de termination Mean duration
b y.x
26 749 .58 .34
7.88 weeks 5.90 weeks 4.89 weeks
25 749 .58 .34
7.88 weeks 5.90 weeks 4.89 weeks
25 749 .58 .34
7.88 weeks 5.90 weeks 4.89 weeks
Values of Constant term 7 77 7 10 7 02 Industry: Auto manufacturer X -3 35 C • 52) -3 32 < -52) -3 34 ( .52) 319 Other auto mnfr C • 52) < -52) ( .52) Other mnfr 81' ( .62) 78' ( -62) 83' < .62) 151 Construction 40 ( .98) 56 I .96) 39 ( .98) 41 Trade 1 45 ( .99) 1 40 C .98) 1 52 ( .98) 39 Other 55 ( .92) 51 ( .92) 60 ( .92) 51
Occupation: ( .92) ( .92) ( .92) Professional, c l e r i c a l , sales 3 56 c .82) 3 56 C -82) 3.58 ( .82) 87 Skilled c .82) C -82) ( .82) Semi-skilled 14 < •55) - 14 ' ( .55) . 13' < •55) 494 Unskilled 54 t .91) 51 ( -90) 58 ( .91) 41
Sex: ( -90) .91)
Male Female 2 13' ( .52) 2 22* ( .46) 2 28' ( -47) 215 Place of residence: ( .52) ( .46) ( -47) 215 Detroit SMA # . Other SMA's -1 80 ( .63) -1 86* ( .62) • i 79' ( .63) '97 Other lower pen ( .63) ( .62) ( .63) insula c i t i e s -1 77 c .77) -1 87 ( -77) -1 78 ( • 77) 53 Upper lower pen c ( -77) ( • 77) insula 1 44 (1 .09) 97 (1.10) 1 13 (1.09) 24 Upper peninsula 1 68 ( .99) 1 57 ( -99) 1 67 ( .98) 33
Age: ( .99) ( -99) ( .98) Under 45 years 45-64 years 90 c .49) 96* ( .48) 97* ( .48) 229 65 and over 7 62 ( •97) 7 83 ( .94) 7 78 i .94) 39

92 TABLE 27--Continued
Multiple Regression Number Item Usinfc Benefit Size Foi inula tion of
B B/W W- B Cases Education:
0-8 years - .26 c .43) - .30 ( .43) - .28 ( .43; 326 9-11 years 12 or more years -".24' ( .50) -'.20* ( .50) - ' .23' ( .50; 169
Other training: Other formal training .10 ( .41) .11 C .41) .10 ( .41: 220 No other formal training . . .
Race: Negro .40 c .50) .32 ( .50) .37 ( .50) 151 Non-Negro Length of prior employment: Under 1 year - .29 ( .63) - .31 ( .64) - .28 C .64) 137 1-2 years - .02 ( .65) - .02 ( .65) .01 ( .65) 120 3-4 years • • 5-9 years i . i V ( .58) 1.13 ( .58) 1.11 ( .58) 202 10-19 years .23 < •72) .23 ( .72) .20 c .73) 85 20 or more years .16 < .80) .22 I .80) .18 ( .80) 87 Benefit size k formulation - .029 eS 035) .006 022) .006d ( 0 1 1 ) 749
Average weekly wage .008 011) ( 0 1 1 )
749 Related Data
Simple correlation of the benefit si z e formulation and benefit duration - .270 .118 - .137 749
In weeks, unless otherwise specified. Weeks per dollar weekly benefit.
cWeeks per percentage which weekly benefits are of average weekly wage.
^Weeks per dollar difference between weekly benefits and average weekly wage.
eWeeks per dollar average weekly wage.

93
TABLE 28 MULTIPLE REGRESSIONS ON BENEFIT DURATION FOR HUSBANDS EXCLUDING THOSE
WHO TERMINATED BENEFITS WITH REEMPLOYMENT WITH PRIOR EMPLOYER AND WHO DID NOT DELAY IN FILING FOR BENEFITS, USING DEMAND-EXPRESSING AND BENEFIT SIZE VARIABLES ONLY
Item Multiple Regressi
Using Benefit Size Form on ulation
Number of
Cases Item
B B/W W-B
Number of
Cases
Summary S t a t i s t i c s No. of predictors No. of cases Multiple r Coefficient of de termination Mean duration
I * v.x
26 189 .67 .45
8.44 weeks 6.44 weeks 5.16 weeks
25 189 .66 .44
8.44 weeks 6.44 weeks 5.18 weeks
25 189 .67 .45
8.44 weeks 6.44 weeks 5.14 weeks
Value of Multiple Regression Coefficients 8
Constant term 7 16 11 45 6 16 Industry: Auto manufacturer X -3 43 (1 14) -3 53 (1 15) -3 43 (1 14) 40 Other auto mnfr Other mnfr - 86" d 19) - 85* (1 20) - 88* (1 19) '44 Construction -1 87 d
61) -1 44 58) -1 92 (1 61) 04) 21
Trade 1 96 (2 05) 1 73 (2 05) 1 97 (2 61) 04) 10
Other -1 06 (1 88) - 96 (1 88) -1 09 (1 87) 14 Occupation: Professional, c l e r i c a l , sales 2 48 (1 76) 2 68 (1 77) 2 52 (1 75) 16 Skilled (1
(1 01) Semi-skilled 05' (1 02) - 03* (1 02) 04 (1 01) io4 Unskilled 1 21 (1 85) 1 15 (1 86) 1 23 (1 84) 12
Sex: Male Female 2 18* (5 50) 2 09* (5 50) *2 34 (5 47) i
Place of residence: Detroit SMA Other SMA's - 96* (1 17) - i 14* (1 17) - 93 (1 17) "39 Other lower peninsula c i t i e s -2 35 (2 06) -2 58 (2 06) -2 41 (2 05) 9 Upper lower pen
22) insula 98 (2 25) 75 (2 29) 88 (2 22) 7 Upper peninsula 3 .78 (1 80) 3 .59 (1 .84) 3 77 d 80) 14
Age: Under 45 years . . 45-64 years i . 8 l ' (1 07) i .72' C .96) 2 01 ( 95) *63 65 and over 10 .02 (1 85) 10 .04 (1 .67) 10 .39 (1 .60) 20

94 TABLE 28--Continued
Item Multiple Regression
Using Benefit Size Formulation Number
of Cases
Item B B/W W -B
Number of
Cases
Education: 0-8 years - 67 C .90) - 71 C -91) - 67 ( 90) 96 9-11 years
18) . 12 or more years - 96 (1 .18) - 98 (1.19) - 9 l " (1 18) 30 Other training: Other formal training -1 33 ( .88) -1 30 ( -89) -1 28 ( 87) 65 No other formal training . . . Race: Negro 40 (1 .10) 35 (1.10) 39 (1 10) 42 Non-Negro , . . . . . Length of prior employment:
(1.36) (1 35) Under 1 year 61 (1 -35) 52 (1.36) 64 (1 35) 56 1-2 years -1 39 (1 .58) -1 60 (1-58) -1 35 (1 58) 23 3-4 years (1.40) . (1 38) 5-9 years i 88 (1 .39) i 75* (1.40) 1.86 (1 38) 47" 10-19 years -2 65 (1 .65) -2 78 (1.65) -2 74 (1 63) 20 20 or more years 92 (1 .89) 91 (1-91) 89 (1 88) 18
Benefit size J formulation - 073 u(. 378) - 063 c(.049) 043 u(.022) 189
Average weekly wage 046 e(. 323) 189 Related Data
Simple correlation of the benefit s i z e formulation and benefit duration - .274 - .185 - .141 189
a I n weeks, unless otherwise specified. Weeks per dollar weekly benefit.
cWeeks per percentage which weekly benefits are of average weekly wage.
dWeeks per dollar difference between weekly benefits and average weekly wage.
eWeeks per dollar average weekly wage.

95 TABLE 29
MULTIPLE REGRESSIONS ON BENEFIT DURATION FOR PRIMARY EARNERS WHO TERMINATED BENEFITS WITH NEW EMPLOYMENT, USING
DEMAND-EXPRESSING AND BENEFIT SIZE VARIABLES AND SELECTED OTHER VARIABLES
Item Multiple Regression
Using Benefit Sire Formulation Number
of B B/W W-B Cases
Summary S t a t i s t i c s No. of predictors No. of cases Multiple r Coefficient of determination Mean duration
b y.x
17 105 .50 .25
8.35 weeks 5.37 weeks 5.09 weeks
16 105 .47 .22
8.35 weeks 5-37 weeks 5.15 weeks
16 105 .48 .23
8.35 weeks 5.37 weeks 5.10 weeks
Values of Multiple Regression C o e f f i c i e n t s 3
Constant terms 9 04 7 26 4. 64 Indus try-Occupation: Semi-skilled; Detroit auto mnfr X 1 12 <1 99) 82 (1 99 1. 15 (1 99) 9
Professional, c l e r i <1 c a l , sales; trade - 34 (1 62) 22 (1 61) - 01 (1 61) 15
Unskilled; "other" industries - 13 (1 46) - 48 (1 46) - 33 (1 46) 18
Place of residence: Upper peninsula; upper
11) (2 06) lower peninsula 62 (2 05) 45 (2 11) 57 (2 06) 8 Lower, lower peninsula 21) excluding SMA's - 71 (1 21) -1 11 (1 22) - 88 (1 21) 35
Length of prior employment: 48) Under 5 years -1 97 (1 48) -1 94 (1 50) -1 94 (1 48) 72 10 or more years -2 .06 (1 85) -2 55 (1 85) -2 44 (1 .83) 16
Miscellaneous: Aged 55 yrs. or more 2 85 (1 44) 3 10 (1 41) 3 30 (1 .40) 22 Female 7 .44 (2 • 74) 7 14 (2 79) 7 66 (2 •74) 6 Negro - .64 (1 .78) - 37 (1 .78) - 29 (1 .76) 11 Single person family 1 .07 i l .86) 2 06 f l 73) 2 05 U .71) 17 Delayed f i l i n g for benefits - .93 (1 -25) -1 .14 (1 .26) -1 07 (1 • 25) 31 Unemployment i s
•24) unusual 1 .05 (1 •34) 1 .17 (1 .35) 1 25 (1 •24) 27 Number of dependents 1 .18 C .48) .74 ( .37) 73 ( .34) 105 Other earnings in the family .52 ( •59) .78 ( .56) 77 ( .56) 105

96 TABLE 29--Continued
Item Multiple Regression
Using Benefit Size Formulation Number
of B B/W W-B Cases
Benefit size formulation
Average weekly wage - .207 (.140)
.039 (.023) - .022 (.051) .027 (.021) 105
105 Simple correlation of the benefit s i z e formulation and benefit duration - .122 -040 .050 105
aFor the units of measurement of the variables, see Table 37.
TABLE 30 MULTIPLE REGRESSIONS ON BENEFIT DURATION FOR PRIMARY EARNERS
WHO TERMINATED BENEFITS AS EXHAUSTEE, USING DEMAND-EXPRESSING AND BENEFIT SIZE VARIABLES
AND SELECTED OTHER VARIABLES
Item Multiple Regression
Using Benefit Size Formulation dumber
of Cases
Item B 1 B/W W-B
dumber of
Cases Summary S t a t i s t i c s
No. of predictors No. of cases Multiple r Coefficient of determination
Mean duration
y.x
17 86 .66 .43
13.66 weeks 8.29 weeks 6.98 weeks
16 86 .65 .42
13.66 weeks 8.29 weeks 6.99 weeks
16 86 .66 .43
13.66 weeks 8.29 weeks 6.95 weeks
Values of Multiple Regression C o e f f i c i e nts a
Constant terms Indus try-Occupation: Semi-skilled; Detroit auto mnfr X
Professional, c l e r i c a l , sales; trade
Unskilled; "other" Industries
5.63
-3.81 (3.92) 4.74 (2.40) 2.59 (2.24)
9.96
-4.35 (3.89) 5.00 (2.41) 2.85 (2.20)
3.41
-4.11 (3.88) 4.92 (2.38) 2.90 (2.17)
4 19 16

97 TABLE 30--Continued
Multiple Regression dumber Item Using Benefit Size Formulation of
B B/W W-B 2asee
Place of residence: Upper peninsula; upper lower peninsula - 15 (2.25) - .29 (2.27) - .16 (2 24) 20
Lower, lower peninsu(2.27)
l a excluding SMA's -1 76 (2.03) -1.97 (2.07) -1.80 (2 02) 21 Length of prior
(2.07) etnp loyment:
(2.23) .25 (2 22) Under 5 years 19 (2.23) .13 (2-26) .25 (2 22) 44 10 or more years 35 (2.52) .53 (2.46) .68 (2 45) 25
Miscellaneous: (2.46)
Aged 55 yrs. or more 5 88 (2.16) 6.08 (2.15) 6.00 (2 .14) 34 Female 5 19 (2.34) 4.94 (2.37) 5.14 (2 .33) 18 Negro 1 09 (2.42) 1.12 (2-42) 1.20 (2 40) 14 Single person family 1 44 (2.48) 1.39 (2.48) 1.36 (2 47) 14 Delayed f i l i n g for benefits 63 (2.41) .27 (2.39) .55 (2 40) 14 Unemployment i s unusual 4 12 (1-90) 4.09 (1.90) 4.14 (1 .89) 34 Number of dependents 60 ( .83) .39 I .59) .22 ( .57) 86 Other earnings in the family 73 (1.08) .83 (1.06) .87 (1 .05) 86
Benefit size formulation - 191 (-211) - .092 (.088) .061 (. 044) 86
Average weekly wage 076 (.050) 86
Simple correlation of the benefit size formulation and benefit duration - .253 - .111 .094 86
^ o r the units of measurement of the variables, see Table 37.

98 TABLE 31
MULTIPLE REGRESSIONS ON BENEFIT DURATION FOR PRIMARY EARNERS WHO TERMINATED BENEFITS WITH CUSTOMARY EMPLOYMENT, USING
DEMAND-EXPRESSING AND BENEFIT SIZE VARIABLES AND SELECTED OTHER VARIABLES
Item Using Multiple Regression Benefit Size Formulation
Number of
B B/W W-B Cases
Summary S t a t i s t i c s No. of predictors No. of cases Multiple r Coefficient of determination Mean duration
y.x
17 332 .46 .21
5.76 weeks 2.97 weeks 2.70 weeks
16 332 .46 .21
5.76 weeks 2.97 weeks 2.70 weeks
16 332 .46 .21
5.76 weeks 2.97 week6 2.70 weeks
Values of Multiple Regression C o e f f i c i e n t s 3
Constant terms 6 38 6 47 6 13 Industry-Occupation: Semi-skilled; Detroit auto mnfr X -1 06 ( .37) -1 06 ( .37) -1 05 ( •37) 182
Professional, c l e r i c a l , sales: trade
Unskilled; ''other" 52 C .68) 53 ( .68) 53 ( .68) 20 c a l , sales: trade
Unskilled; ''other" C .68) ( .68) ( .68) industries 26 ( .68) 26 ( .68) 27 ( .68) 20
Place of residence: ( Upper peninsula; upper lower peninsula
Upper peninsula; upper lower peninsula 2 62 C .87) 2 64 ( .87) 2 63 ( .86) 130
Lower, lower peninsula excluding SMA1s
Lower, lower peninsula excluding SMA1s - 70 C .56) - 70 ( .56) - 70 C .56) 41
Length of prior employment: Under 5 years - 23 C .37) - 22 C • 37) - 22 ( • 37) 118 10 or more years - 94 ( •42) - 94 ( • 42) - 93 ( .42) 100
Miscellaneous: ( •42) ( ( Aged 55 yrs. or more 86 ( .50) 87 ( .49) 88 ( .50) 51 Female 2 38 ( .66) 2 42 ( .62) 2 43 C .63) 26 Negro 08 < .37) 08 ! .36) 08 i .36) 89 Single person family - 35 c .48) - 34 ( .48) - 33 ( .48) 58 Delayed f i l i n g for benefits 1 39 c .73) 1 40 ( .72) 1 41 C •72) 16
Unemployment i s c .73) ( .72) C •72) unusual 1 07 ( .47) 1 06 c •47) 1 06 ( •47) 47
Other earnings i n ( .47) c •47) ( •47) the family 07 ( .19) 08 ( .18) 08 ( .18) 332
No, of dependents - 03 ( 115) - 04 ( -13) - 05 ( • 11) 332

99 TABLE 31--Continued
Item Multiple Regression
Using Benefit Size Formulation dumber
of Cases Item
B B/W W-B
dumber of
Cases
Benefit size formulation
Average weekly wage
- .012 (.040) .003 (.010)
- .005 (.021) .003 (.010) 332 332
Simple correlation of the benefit size formulation and benefit duration - .226 .069 • .107 332
For the units of measurement of the variables, see Table 37.
TABLE 32 MULTIPLE REGRESSIONS ON BENEFIT DURATION FOR WIVES EXCLUDING THOSE
WHO TERMINATED BENEFITS WITH REEMPLOYMENT WITH PRIOR EMPLOYER AND WHO DID NOT DELAY IN FILING FOR BENEFITS- USING DEMAND-EXPRESSING AND BENEFIT SIZE VARIABLES ONLY
Multiple Regression Number Item Using Benefit Size Formulation of Item
B B/W | W-B Cases Summary S t a t i s t i c s
No. of predictors 26 25 25 No. of cases 114 114 114 Multiple r .63 .63 .63 Coefficient of de termination .40 .40 .40 Mean duration 11.84 weeks 11.84 weeks 11 .84 weeks S v 7.69 weeks 7-69 weeks 7 .69 weeks S y
y.x 6.78 weeks 6.76 weeks 6 .73 weeks
Values of Multiple Regression Coefficients Constant term 12.03 2.19 7 83 Industry: Auto mnfr X -1.44 (2.34) -1.56 (2.32) -1 37 (2 3D 22 Other auto mnfr - • • Other mnfr 3.99* (2.16) 3.86 (2.18) 4 6 4 ' { 2 14) 36 Construction .07 (5.44) - .11 (5-42) - 09 (5 33) 2 Trade - .09 (3.07) .11 (3.06) 29 (3 00) 11 Other .21 (2.75) .32 (2.76) 52 (2 67) 20
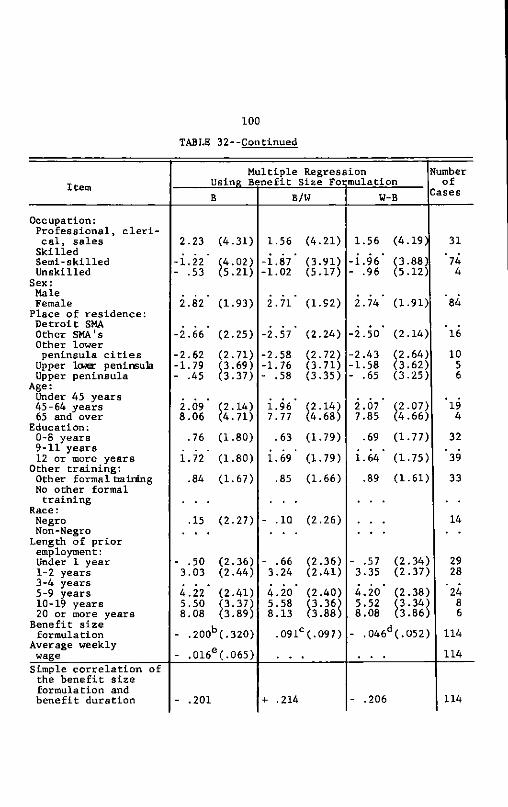
100 TABLE 32--Continued
Item Multiple Regress
Using Benefit Size Fox ion mulation
dumber of
!ases Item B B/W W- B
dumber of
!ases
Occupation: Professional, c l e r i c a l , sales 2 23 (4 .31) 1 56 (4 .21) 1 56 (4 19) 31
Skilled , , a Semi-skilled - i 22 ' ( 4 .02) -1 87 ' (3 -91) - i 96 (3 88) 74 Unskilled - 53 (5 .21) -1 02 (5 .17) - 96 (5 12) 4
Sex: Male Female 2 82 (1 .93) 2 71" (1 .92) 2 74' (1 91) '84
Place of residence: Detroit SMA # Other SMA's -2 66' (2 .25) -2 57 (2 .24) -2 50 (2 14) "l6 Other lower
(2 peninsula c i t i e s -2 62 (2 -71) -2 58 (2 .72) -2 43 (2 64) 10
Upper lower peninsula -1 79 (3 .69) -1 76 (3 •71) -1 58 (3 62) 5 Upper peninsula - 45 (3 .37) - 58 (3 .35) - 65 (3 25) 6
Age: Under 45 years , # , 45-64 years 2 09 .14) i 96 S 2 •14) 2 07* 07) 19 65 and over 8 06 (4 .71) 7 77 (4 .68) 7 85 (4 66) 4
Education: 0-8 years 76 (1 .80) 63 (1 .79) 69 (1 77) 32 9-11 years ,
(1 75) 12 or more years i 72" (1 .80) 1 69 ' (1 -79) i 64* (1 75) *39 Other training:
(1 .61) Other formal ba ining 84 (1 .67) 85 (1 .66) 89 (1 .61) 33 No other formal training .
Race: Negro 15 (2 .27) - 10 (2 .26) . . 14 Non-Negro . . . . . .
Length of prior employment: • 34) Under 1 year - 50 (2 .36) - 66 (2 .36) - 57 (2 • 34) 29 1-2 years 3 03 (2 .44) 3 24 (2 .41) 3 35 (2 .37) 28 3-4 years . . . . . . . (2 .38) . . 5-9 years 4 .22 (2 •41) 4 .20 (2 .40) 4 20 (2 .38) 24 10-19 years 5 .50 .37) 5 58 .36) 5 52 .34) 8 20 or more years 8 08 h .89) 8 .13 (3 .88) 8 08 3 .86) 6
Benefit size J formulation - .200 b O 320) .091 097) - 046 d(. 352) 114
Average weekly a 114 wage - .016 065) . . . 114 Simple correlation of the benefit size formulation and benefit duration - .201 + .214 - .206 114

101
TABLE 32--Contlnued
In weeks, unless otherwise specified. ^Weeks per dollar weekly benefit. cWeeks per percentage which weekly benefits are of average
weekly wage. '"weeks per dollar difference between weekly benefits and
average weekly wage. eWeeks per dollar average weekly wage.
TABLE 33 MULTIPLE REGRESSIONS ON BENEFIT DURATION FOR SINGLE, OTHER EXCLUDING
THOSE WHO TERMINATED BENEFITS WITH REEMPLOYMENT WITH PRIOR EMPLOYER AND WHO DID NOT DELAY IN FILING FOR BENEFITS,
USING DEMAND-EXPRESSING AND BENEFIT SIZE VARIABLES ONLY
Multiple Regression Number Item Using Benefit Size Formulation of
B B/W W-B Cases
Summary S t a t i s t i c s No. of predictors 26 25 25 No. of cases 77 77 77 Multiple r 70 68 .68 Coefficient of determination 49 46 .46
Mean duration 10 66 weeks 10 66 weeks 10 .66 weeks s v 7 03 weeks 7 03 weeks 7 .03 weeks S y
y.x 6 20 weeks 6 23 weeks 6 .29 weeks
Values of Multiple Regression Coefficients Constant term 3 39 9 45 10 85 Industry: Auto mnfr X -3 93 (2 70) -3 23 (2 63) -3 64 (2 73) 11 Other auto mnfr
(2 70) (2 Other mnfr - 86' (2 58) - 90' (2 34) - 54* (2 61) 22' Construction -1 32 (4 02) 27 (3 57) - 95 07) 7 Trade 1 25
(4 73)
(3 57) 57 (3 76) 8
Other 14 (3 55) - 63* (2 90) - 40 (3 58) 11 Occupation: Professional, c l e r i c a l , sales 4 78 (3 43) 4 59 (3 28) 3 56 (3 40) 17

103
TABLE 34
MULTIPLE REGRESSIONS ON BENEFIT DURATION FOR SECONDARY EARNERS WHO TERMINATED BENEFITS WITH NEW EMPLOYMENT, USING
DEMAND-EXPRESSING AND BENEFIT SIZE VARIABLES AND SELECTED OTHER VARIABLES
M u l t i p l e Regression dumber Item Using B e n e f i t S i z e Formulation of
B B/W | W-B Cases
Summary S t a t i s t i c s No. of p r e d i c t o r s 16 15 15 No. o f c a s e s 42 42 42 M u l t i p l e r 60 58 57 C o e f f i c i e n t of determination 36 34 33
Mean d u r a t i o n 10 57 weeks L0 57 weeks L0 57 weeks 5.82 weeks 5 82 weeks 5 82 weeks
s y
y.x 5 83 weeks 5.83 weeks 5 87 weeks
Values of M u l t i p l e Regre s s i o n C o e f f i c i e n t s 8
Constant terms 30 08 9 41 L3 35 Industry-Occupation: S e m i - s k i l l e d ; D e t r o i t auto mnfr X -1 85 (4 51) •3 29 (4 38) -3 13 <4.41) 4
P r o f e s s i o n a l , c l e r i c a l , s a l e s : trade
U n s k i l l e d ; ''other" -2 80 (2 84) -2 88 (2 84) -2 61 (2.85) 20 c a l , s a l e s : trade
U n s k i l l e d ; ''other" i n d u s t r i e s 94 (2 62) 66 (2 60) 89 (2.63) 12
Residence: Upper p e n i n s u l a ; up
79) (3.79) per lower p e n i n s u l a -1 09 (3 77) -1 69 (3 79) -1 32 (3.79) 6 Lower, lower peninsula e x c l u d i n g SMA's
Lower, lower peninsula e x c l u d i n g SMA's -2 57 (2 56) -2 25 (2 54) -2 07 (2.54) 14
Length of p r i o r employment: Under 5 y e a r s -2 51 (3 42) -1 82 (3 36) -1 52 (3.34) 34 10 or more y e a r s •11 99 (7 38) -•10 09 (7 17) -10.05 (7-25) 1
M i s c e l l a n e o u s : Aged 55 y r s . o r more 0 Female 25 62) - .85 60) - .29 (J4.63J 23 Negro -1 60 (3 17) -2 .33 k 14) -2 .16 (3.16) 5 S i n g l e person family Delayed f i l i n g f o r
(2.76) 10 b e n e f i t s -1 .63 (2 84) .56 (2 70) - .78 (2.76) 10 Unemployment i s
(2.18) 20 unusual 5 .24 (2 28) 4 .72 (2 23) 4 .39 (2.18) 20

102 TABLE 33--Continued
Item Multiple Regression
Using Benefit Size Formulation dumber of
;ases Item B B/W W- B
dumber of
;ases Sk i l l e d Semi-skilled - i 11' (2 94) - 88 ' (2 93) - i 72* (2 96) *40 Unskilled 2 58 (3 48) 1 55 (3 44) 1 51 (3 47) 80
Sex: (3 44) (3 47)
Male . Female 4 7 l ' (2 16) 4 16' (2 25) 4 83' (2 19) *28 Place of residence:
(2 16) (2 25) (2 19) Detroit SMA Other SMA's -2 35* <2 50) -2 25" (2 50) -2 26' (2 54) "l2 Other lower
<2 (2 50) (2 54) peninsula c i t i e s -3 31 < 2
67) -3 94 ( 2 62) -3 92 ( 2 68) 9 Upper lower peninsula 11 (3 .68) - 14 (3 59) 40 (3 74) 5 Upper peninsula -5 13 (3 •47) -6 23 (3 39) -5 34 (3 52) 7
Age: Under 45 years 45-64 years i 21 (2 .10) 26" (2 04) 54 (2 09) '29 65 and over 6 67 (3 .72) 5 67 (3 66) 5 50 (3 70) 7
Education: 0-8 years - 33 (2 • 17) 44 (2 14) 28 (2 16) 24 9-11 years 12 or more years i 71' (2 .43) 2 33" (2 36) i 95 ' (2 46) 25
Other training: (2 .43) (2 36) (2 46)
Other formal training - 94 (2 .04) -1 13 (2 03) -1 33 (2 06) 26 No other formal
(2 .04) (2 03) training
Race: Negro 3 04 (2 .54) 2 48 (2 54) 2 90 (2 57) 11 Non-Negro Length of prior employment: Under 1 year -5 76 (2 .61) -5 62 (2 61) -5 54 £2 65) 16 1-2 years -3 25 (2 -53j -3 24 (2 57) -2 82 (2 55) 17 3-4 years 5-9 years i 61' .25) i 92' (3 22) i 40' (3 30) '12 10-19 years -5 39 (3 .41) -4 34 (3 38) -4 92 (3 45) 11 20 or more years 79 (3 .99) 90 (3 96) 17 (4 03) 7
Benefit size v. .99) (3 96) 03)
formulation 254 L78) 038c (.086) 023' •"(.042) 77 Average weekly wage 004 043)
(.086) •"(.042) 77
Simple correlation of the benefit size formulation and benefit duration - .089 .138 - .025 77
a I n weeks, unless otherwise specified. Weeks per dollar weekly benefit. Q Weeks per percentage which weekly benefits are of average
weekly wage. 'Hteeks per dollar difference between weekly benefits and average weekly wage. eWeeks per dollar average weekly wage.
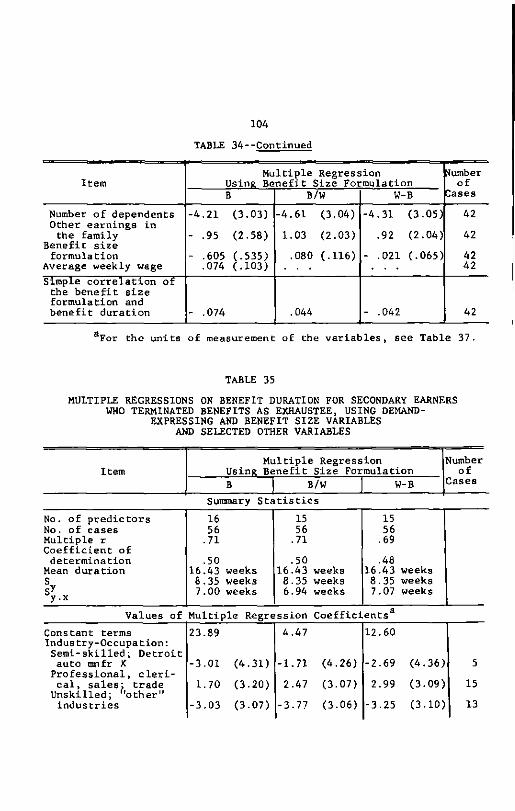
104 TABLE 34--Continued
Item Multiple Regression
Using Benefit Size Formulation dumber of
Cases Item
B B/W W-B
dumber of
Cases Number of dependents Other earnings in the family
Benefit size formulation
Average weekly wage
-4.21 (3.03) - .95 (2.58) - .605 (.535)
.074 (.103)
-4.61 (3.04) 1.03 (2.03) .080 (.116)
-4.31 (3.05) .92 (2.04)
- .021 (.065)
42 42 42 42
Simple correlation of the benefit size formulation and benefit duration - .074 .044 - .042 42
For the units of measurement of the variables, see Table 37.
TABLE 35 MULTIPLE REGRESSIONS ON BENEFIT DURATION FOR SECONDARY EARNERS
WHO TERMINATED BENEFITS AS EXHAUSTEE, USING DEMAND-EXPRESSING AND BENEFIT SI2E VARIABLES
AND SELECTED OTHER VARIABLES
Item Multiple Regression
Using Benefit Size Formulation Number
of Cases
Item B B/W W-B
Number of
Cases Summary S t a t i s t i c s
No. of predictors No. of cases Multiple r Coefficient of determination Mean duration
ST
16 56 .71 .50
16.43 weeks 8.35 weeks 7.00 weeks
15 56 .71 .50
16.43 weeks 8.35 weeks 6.94 weeks
15 56 .69 .48
16.43 weeks 8.35 weeks 7.07 weeks
Values of Multiple Regression C o e f f i c i e n t s 3
Constant terms Industry-Occupation: Semi-skilled; Detroit auto mnfr X
Professional, c l e r i c a l , sales; trade
Unskilled; ''other" industries
23.89
-3.01 (4.31) 1.70 (3.20)
-3.03 (3.07)
4.47
-1.71 (4.26) 2.47 (3.07)
-3.77 (3.06)
12.60
-2.69 (4.36) 2.99 (3.09) -3.25 (3.10)
5 15 13
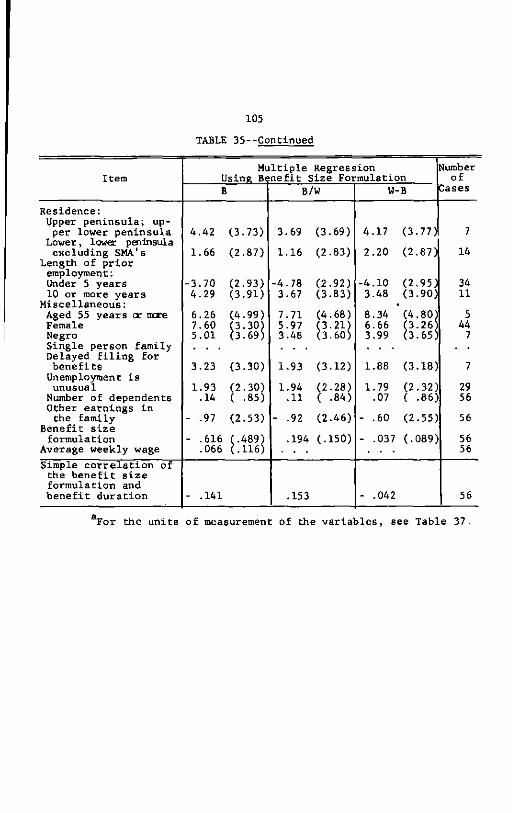
105 TABLE 35--Continued
Multiple Regression Number Item Using Be ne f i t Size Formulation of
B B/W W-B Cases Residence: Upper peninsula; upper lower peninsula 4 42 (3 73) 3.69 (3.69) 4 17 (3 77) 7
Lower, lower peninsula excluding SMA's
Lower, lower peninsula excluding SMA's 1 66 (2 87) 1.16 (2.83) 2 20 (2 87) 14
Length of prior employment: Under 5 years -3 70 (2 93) -4.78 (2.92) -4 10 (2 95) 34 10 or more years 4 29 (3 91) 3.67 (3.83) 3 48 (3 90) 11
Miscellaneous: (3
• Aged 55 years or more 6 26 (4 99) 7.71 (4.68) 8 34 (4 .80) 5 Female 7 60 .30) 5.97 (3.21) 6 66 S 3 .26) 44 Negro 5 01 (3 .69) 3.48 (3.60$ 3 99 (3 .65) 7 Single person family Delayed f i l i n g for benefits 3 23 (3 .30) 1.93 (3.12) 1 88 (3 .18) 7 Unemployment i s
(2 unusual 1 .93 (2 .30) 1.94 (2.28) 1 79 (2 .32) 29 Number of dependents 14 ( .85) .11 ( .84) 07 ( .86) 56 Other earnings in the family - 97 (2 .53) - .92 (2.46) - 60 (2 •55) 56
Benefit si z e formulation - 616 (.489) .194 (.150) - 037 (• 089) 56
Average weekly wage .066 (.iuS (.150)
56 Simple correlation of the benefit s i z e formulation and benefit duration - .141 .153 - 042 56
aFor the units of measurement of the variables, see Table 37.

106 TABLE 36
MULTIPLE REGRESSIONS ON BENEFIT DURATION FOR SECONDARY EARNERS WHO TERMINATED BENEFITS WITH CUSTOMARY EMPLOYMENT, USING
DEMAND-EXPRESSING AND BENEFIT SIZE VARIABLES AND SELECTED OTHER VARIABLES
Multiple Regression Number Item Using Benefit Size Formulation of
B 1 B/W | W-B Cases Summary S t a t i s t i c s
No. of predictors No. of cases Multiple r Coefficient of determination Mean duration
y.x
16 128 .70 .49
6.80 weeks 4.73 weeks 3.62 weeks
15 128 .69 .48
6.80 weeks 4.73 weeks 3.63 weeks
15 128 .70 .49
6.80 weeks 4.73 weeks 3.61 weeks
Values of Multiple Regression Coeffic L e n t s 3
Constant terms 6 53 .52 5 02 Industry-Occupation: Semi-skilled; Detroit auto mnfr X -1 34 ( .86) -1.49 ( -85) -1 40 ( -85) 56
Professional, c l e r i c a l , sales: trade
Unskilled; ''other" 5 33 (1 .17) 5.51 (1-16) 5 41 (1-15) 14 c a l , sales: trade
Unskilled; ''other" (1 (1-15) industries -2 35 (1 .81) -2.24 (1.81) -2 35 (1.80) 5
Residence: Upper peninsula; up
(2.45) per lower peninsula 5 23 (2 .51) 5.60 (2.53) 5 44 (2.45) 3 Lower, lower peninsula excluding SMA's (1-05)
Lower, lower peninsula excluding SMA's 57 (1 .06) .80 (1.08) 58 (1-05) 31
Length of prior employment:
( -78) Under 5 years -1 49 ( .78) -1.50 ( .78) -1 52 ( -78) 73 10 or more years - 97 (1 .11) -1.02 (1-12) -1 01 (1-10) 19
Miscellaneous: Aged 55 yrs. or more 5 96 (1 .87) 5.99 (1.88) 5 97 (1.86) 5 Female 23 ( .87) .29 ( .88) 22 f .87) 98 Negro 1 28 (1 -15$ 1.02 (1.12) 1 13 (i.io) 13 Single person family . . . . Delayed f i l i n g for
(1.99) (1-97) benefits - 12 (1 .99) - .17 (1.99) - 05 (1-97) 4 Unemployment I s unusual 1 51 ( .94) 1.45 ( .95) 1 47 f .94) 20 Number of dependents - 20 ( .355 - .23 ( -35) - 22 ( -35) 70 Other earnings i n the family 1 35 ( .88) 1.38 ( .88) 1 34 ( -87) 128
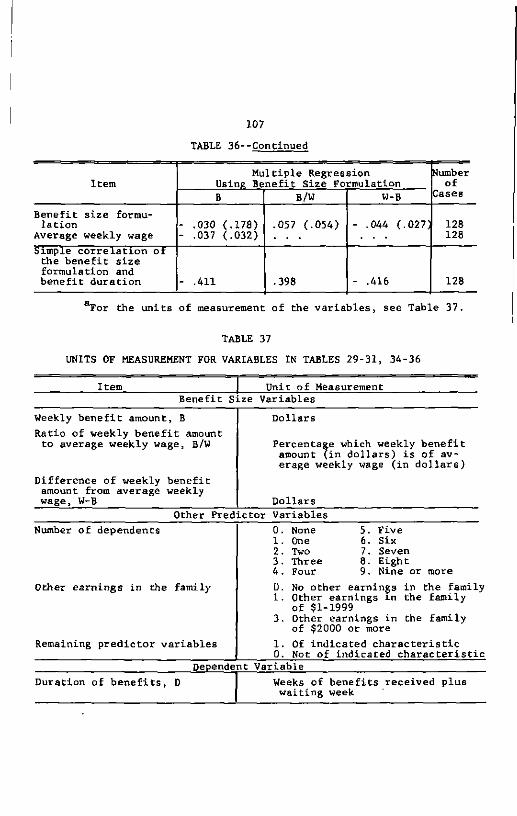
107 TABLE 36--Continued
Item Multiple Regression
Using Benefit Size Formulation Number
of Cases Item
B B/W W-B Number
of Cases
Benefit size formulation
Average weekly wage - .030 (.178) - .037 (.032)
.057 (.054) - .044 (.027; 128 128
Simple correlation of the benefit size formulation and benefit duration - .411 .398 - .416 128
^ o r the units of measurement of the variables, see Table 37.
TABLE 37 UNITS OF MEASUREMENT FOR VARIABLES IN TABLES 29-31, 34-36
Item Unit of Measurement Benefit Size Variables
Weekly benefit amount, B Dollars Ratio of weekly benefit amount to average weekly wage, B/W Percentage which weekly benefit
amount (in dollars) i s of average weekly wage (in dollars)
Difference of weekly benefit amount from average weekly wage, W-B Dollars
Other Predictor Variables Number of dependents 0. None 5. Five
1. One 6. Six 2. Two 7. Seven 3. Three 8. Eight 4. Four 9. Nine or more
Other earnings in the family
Remaining predictor variables
0. No other earnings in the family 1. Other earnings in the family
of $1-1999 3. Other earnings in the family
of $2000 or more 1. Of indicated characteristic 0. Not of indicated characteristic
Dependent Variable Duration of benefits, D Weeks of benefits received plus waiting week
APPENDIX D
SAMPLING IN THE STUDY OF RECIPIENTS OF UNEMPLOYMENT COMPENSATION FOR HOPE COLLEGE
The target population of the sampling consisted of recipients of unemployment compensation i n Michigan whose benefits ceased during the summer of 1955 for any reason. I t was decided to interview only those recipients of unemployment compensation who received payment for at least three consecutive weeks ending during the summer period, although recipients whose payments stopped during the summer after only one or two weeks of benefits were included in the originally selected sample. Date were transcribed for the recipients of both groups (the "interview" group and the "short sequence" group respectively) so they could be differentiated and compared l a t e r on.
The "summer period" was defined as the weeks July 3-9 to September 4-10, 1955, and a recipient was el i g i b l e for selection in the sample i f his last week compensated was one of MESC week numbers 27-36 inclusive. The working rule for deciding when a sequence of benefits ended -- when a week compensated was a "last week" compensated -- required that the last week be followed by at least three consecutive weeks for which no unemployment compensation was paid.
108

109 Recipients of half-week benefits were considered i n benefit
status along with recipients of full-week benefits, and recipients who were compensated on interstate claims, or under special programs for veterans, government employees or railroad workers were not included i n the target population.
The sample was selected by a method whereby every element in the population (every UC recipient defined above) had an equal probability of being selected. In addition, the design took advantage of both the off i c e procedures of the MESC and the existence of
1 trained S.R.C. interviewers in sample PSU's (counties) of the Michigan Area Sample of the Survey Research Center.
The offices of the Michigan Employment Security Commission were i d e n t i f i e d with the PSU's of the Michigan Area Sample, although in several instances itinerant offices had to be assigned d i f f e r e n t l y from the branch offices which operated them. Recipients of unemployment compensation i n Michigan were readily Identified with the local offices where they drew benefits.
For most of the sample (81%) the PSU's served as strata boundaries, and sampling of recipients within thera was done dire c t l y . In the rest of the sample (19%) the PSU's represented the selection of a county from i t s stratum, and following this step the selection of recipients in each PSU was done directly, though at a rate so as to represent the strata. In a l l , Michigan was divided into five regions. The Detroit Metropolitan Area (Wayne, Oakland and Macomb
1 Primary Sampling Units

110 counties) made up the f i r s t region, and five other areas dense enough to be self representing made up the second. The t h i r d region, from which seven PSU's were chosen, was the remaining area of Michigan below the Grand Rapids - Bay City latitude. The portion of the lower peninsula above thia latitude comprised the fourth region and the f i f t h region was the upper peninsula. Two PSU's were selected from each of the fourth and f i f t h regions. This sampling procedure is known as two stage area sampling -- area sampling because the procedure involved the i d e n t i f i c a t i o n of elements (recipients) with areas and the selection of elements was dependent on the selection of PSU's. The second stage involved the selection of "sample" recipients from a l l the e l i g i b l e recipients within the PSU's selected in the f i r s t stage. Table 38 below shows the sample PSU's and their probability of selection.
I t was the thinness of the population over the broad areas of the t h i r d , fourth and f i f t h regions which made i t necessary to choose sample PSU's to represent the regions for only that way could the travel portion of Interviewing costs be kept within an acceptable l i m i t .
The selection of sample recipients within the chosen PSU's was b u i l t around the MESC's system of handling claims and payments. In Michigan, every e l i g i b l e claimant has a permanent claim card containing much information about him and on which every benefit payment is automatically recorded. These permanent card3 are kept in the local offices where the claimants report and the selection of sample recipients was made by systematic cluster sampling the cards f i l e d in the local offices by the last four d i g i t s of the

111 claimants social security number.
Previous inquiry into the method of assigning social security numbers convinced us that the last four digits taken alone provided a good "mix" of the population, and i t seemed l i k e l y that the systematic cluster sampling approximated simple random sampling since many dif f e r e n t sets of last four digits were chosen from a table of random numbers. In this stage selections were made of both the "interview" and "short sequence" groups and data was transcribed for both.
TABLE 38 SAMPLE PSU's AND PROBABILITY OF SELECTION,
SRC MICHIGAN SAMPLE
Sample PSU Probability of Selection Wayne-Oakland-Macorab Kent Genesee Clinton-Eaton-Ingham Muskegon-Ottawa Bay-Saginaw
1 1 1 1 1 1
Kalamazoo Midland
Huron Jackson
St. Clair Van Buren
.1639
.4760
.5163
.1645
.5590
.2238 Grand Traverse Iosco
.1396
.0678 Chippewa Marquette
.1926
.2981
"With the goal of about 800 interviews and a design for

112 a probability sample, i t was necessary to estimate an overall sampling rate which would produce enough names when applied to the target population to get the desired number of interviews, but which was not so high as to require unnecessary work. Since there would be no chance to sample a second time, we had to set the sampling rate high enough to get at least enough names, even though this made i t l i k e l y that we would get more than enough.
No satisfactory estimate of the target population existed, so a p i l o t sampling study was planned and carried out which served the purpose of testing the sampling procedures in the f i e l d as well as providing the needed estimate of the target population.
In the p i l o t study the sampling instructions were sent with a l e t t e r from the Director of the MESC to 12 branch offices, and a representative from both the Commission and the study v i s i t e d a number of the offices to observe the sampling and discuss the procedure with the o f f i c e managers and the personnel carrying out the instructions. The valuable experience gained from this p i l o t study made i t possible to Improve the f i n a l instructions, and i n addition, an estimate of the target population, with confidence intervals, was calculated from the product of the p i l o t sampling.
The overall sampling rate was set and f i n a l Instructions
*"The procedure for setting the overall sampling rate was as follows: ,.. ,, E'
overall sampling rate= ------ ; where- E'= ^ ,
( f min) ( r min) and 1= number of interviews wanted f min= the minimum expected "found1
or "located" rate r min = the minimum expected respon;
rate among found recipients and where Y' = Y" - 2 s.e. CY"), and Y" i s the estimate of the
target population from the p i l o t study
113 2 prepared. The f i n a l sampling was carried our in much the same way
as the p i l o t study. The Director of the Commission sent a memorandum describing the Commission's part in the study to the managers of a l l the branches iden t i f i e d with the sample PSU's. A week later the sampling instructions were sent with another l e t t e r from the Director which included instructions to return the completed work to the Commission's planning and research department. A representative from the study was available to v i s i t any offi c e I f d i f f i c u l t i e s arose, but none developed.
The work of the Commission was completed as planned and somewhat more than enough e l i g i b l e recipients were selected, A f i n a l systematic subsampling was carried out to t a i l o r the inte r view group to the size (937) l i k e l y to produce the desired number of completed interviews. The short sequence group was subsampled at the same rate so the resulting groups could be directly compared.
Table 39 below shows the sampling yi e l d at various stages and the coverage.
The 111 recipients not located are the sum of cases clas s i f i e d as recipients unknown at the address or moved from the address and not traced, address not a dwelling or no such address. The 66 non-interviews are made up of recipients not contacted, or no one at home after repeated c a l l s , recipients incapacitated,
2 The sampling rate of recipients within each PSU was set
so that the probability of selection of the PSU times the probability of selection of a recipient within the PSU was equal to the overall sampling rate. For a general discussion of multistage area sampling, see Kish, Leslie, "Selection of Sample",Chapter 5 in Festinger and Katz, Research Methods in the Behavioral Sciences, (New York: The Dryden Press, 1953).

114 refusals, and miscellaneous other reasons.
TABLE 39 SAMPLING YIELD AND COVERAGE
Stage Number (1) Recipients selected from branch offices (not available from records Recipients selected from branch offices
at SRC) (2) Sample recipients subselected 9371
(3) Less: recipients not located 111 (4) Sample recipients found 826 (5) Less: non-interviews 66 (6) Interviews completed 760
Found rate (4)/(2) 88. 21 Response rate (6)/(4) 92.0% Coverage (6)/(2) 81.1%
1 I t was decided not to interview recipient from the short
sequence group, i.e., those who drew but one or two consecutive weeks of benefits. 738 such recipients were subselected at stage 2 in addition to the 937 recipients shown.
Properly conducted sample interview surveys yi e l d useful estimates but they do not y i e l d exact values. Errors arise from three major sources: sampling, non-response and reporting. Only sampling errors are dealt with here. Because the sample was carefully selected on a probability basis, the findings i n the sample can be expected to vary from what i s true of the whole population by an amount, called sampling error, which can be specified. The following tables show the sampling error for various estimates based on a procedure expected to give correct results 95 times out of 100. Tables based on a greater or smaller "level of confidence" than this can be constructed, but 95% Is the generally accepted level applied to social data.
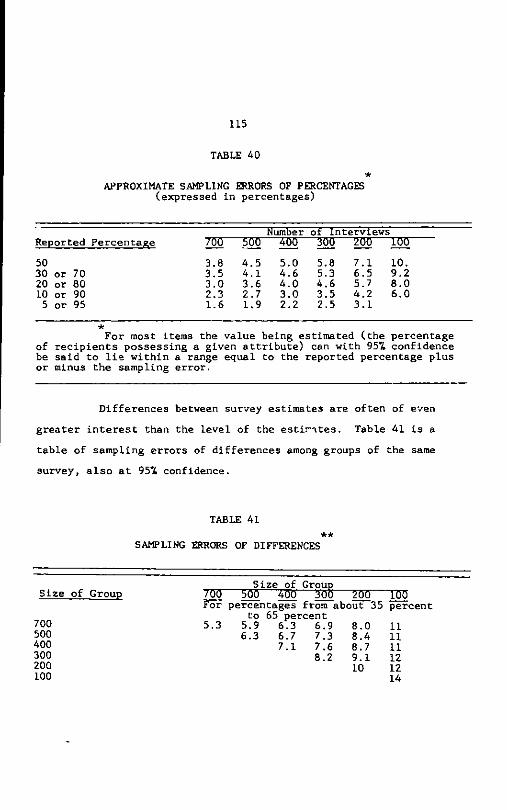
115
TABLE 40 *
APPROXIMATE SAMPLING ERRORS OF PERCENTAGES (expressed in percentages)
Number of Interviews Reported Percentage 700 500 400 300 200 100 50 3.8 4.5 5.0 5.8 7.1 10. 30 or 70 3.5 4.1 4.6 5.3 6.5 9.2 20 or 80 3.0 3.6 4.0 4.6 5.7 8.0 10 or 90 2.3 2.7 3.0 3.5 4.2 6.0 5 or 95 1.6 1.9 2.2 2.5 3.1
* For most items the value being estimated (the percentage
of recipients possessing a given attribute) can with 95% confidence be said to l i e within a range equal to the reported percentage plus or minus the sampling error.
Differences between survey estimates are often of even greater interest than the level of the e s t i n t e s . Table 41 is a table of sampling errors of differences among groups of the same survey, also at 95% confidence.
TABLE 41 *•*
SAMPLING ERRORS OF DIFFERENCES
Size of Group Size of Group TOO" 5073 400 300 2~UG TOO For percentages from about 35 percent 700 5.3 500 400 300 200 100
to 65 percent .9 6.3 6.9 8.0 11 .3 6.7 7.3 8.4 11
7.1 7.6 8.7 11 8.2 9.1
10 12 12 14
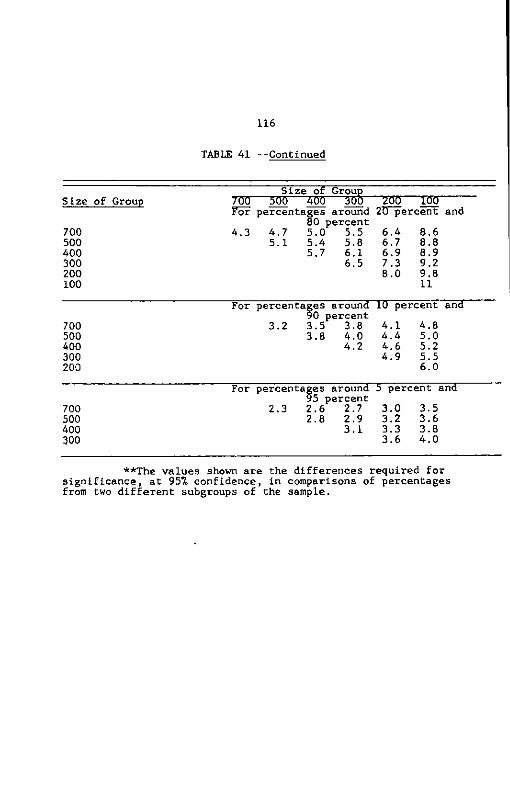
116
TABLE 41 --Continued
Size of Group Size of Group 700 500 400 300 200 100 Size of Group For percentages around 20 percent and
80 percent 700 4.3 4.7 5.0 5.5 6.4 8.6 500 5.1 5.4 5.8 6.7 8.8 400 5.7 6.1 6.9 8.9 300 6.5 7.3 9.2 200 8.0 9.8 100 11
For percentages around 10 percent and 90 percent 700 3.2 3.5 3.8 4.1 4.8 500 3.8 4.0 4.4 5.0
400 4.2 4.6 5.2 300 4.9 5.5 200 6.0
For percentages around 5 percent and 95 percent 700 2.3 2.6 2.7 3.0 3.5 500 2.8 2.9 3.2 3.6
400 3.1 3.3 3.8 300 3.6 4.0
**The values shown are the differences required for significance, at 95% confidence, in comparisons of percentages from two different subgroups of the sample.

BIBLIOGRAPHY
Altman, Ralph. Ava i l a b i l i t y for Work: A Study in Unemployment Compensation.Cambridge, Mass.: Harvard University Press, 1950. 3
Becker, Joseph M. The Problem of Abuse in Unemployment Benefits: A^Study in Limits.New York: Columbia University Press,
Campbell, Angus, Katona,George. "The Sample Survey: A Technique for Social Science Research, 11 Research Methods in the Behavioral Sciences, ed, Leon Festinger and Daniel Katz (.New York: The Dryden Press, 1953).
Cohen, Wilbur J., Haber, William, and Mueller, Eva. The Impact of Unemployment i n the 1958 Recession. A Report to the Special Committee on Unemployment Problems, U. S. Senate, 86th Congress, Second Session, pursuant to Senate Resolution 252, June, 1960. Washington: Government Printing Office, 1960.
Columbia Bureau of Applied Social Research. "Benefits, Incomes, and Expenditures of Unemployed Workers; Experience of a Group of Unemployment Insurance Beneficiaries i n Albany-Schenectady-Troy, Spring, 1957." New York, September, 1958. (Mimeographed.)
Commonwealth of Massachusetts, Division of Employment Security. "Characteristics and Labor Force Status as of November 22, 1958 of Claimants Who Had Exhausted Benefits Between January 1 and September 20, 1958." Boston, January, 1960. (Mimeographed.)
Duquesne University. "Summary Digest of the Survey of Unemployment Compensation Beneficiaries." Pittsburgh, March 15, 1955. (Mimeographed.)
"Experience of Claimants Who Have Exhausted Ul Rights," Labor Market and Employment Security, November, 1957.
Florida I n d u s t r i a l Commission. "Florida Study of Delayed F i l i n g of I n i t i a l Claims." Tallahassee, Fla., September, 1959. (Mimeographed.)
Johnson, Ronald S. "A Study of People Who Have Exhausted Unemployment Benefits in an Active Labor Market." Ann Arbor: University of Michigan Bureau of Business Research, 1951. (Paper.)
117

118 Katz, Arnold. "Cyclical Unemployment and the Secondary Family
Worker." Washington: By the author, 1962. Kish, Leslie. "Selection of Sample", Chapter 5 in Festinger and Katz, Research Methods i n the Behavioral Sciences. (New York": The Uryden Press, 19b3J . Michigan Employment Security Commission. Annual Report for
Fiscal Year I960. Detroit: January, 1961. Missouri Division of Employment Security. "Characteristics and
Labor Market Status of Missouri Claimants Exhausting Unemployment Insurance Rights, February 1957-July 1957." Jefferson City, Mo., November, 1958. (Mimeographed.)
New Jersey Department of Labor and Industry. "After Unemployment Insurance, An Analysis of the Characteristics and Post-exhaustion Experience of Claimants Exhausting Unemployment Insurance Benefits During the Six-Month Period July Through December, 1957." Trenton, March, 1960. (Mimeographed.)
New York State Department of Labor. "Unemployment Benefits and Family Finances, A Study of Incomes and Expenditures of Beneficiaries and Their Families i n Utica, New York, 1958. " New York, February, 1960. (Mimeographed.)
. "Unemployment Insurance Claimants: Characteristics and Benefit Experience of New York Workers Who Filed Claims to Establish Benefit Years Ending in 1955." New York, October, 1957. (Mimeographed.)
North Carolina Employment Security Commission. "A Study of the Characteristics and Labor Market Experience of Claimants Exhausting Benefits i n Calendar 1957." Raleigh, November, 1958 . (Mimeographed.)
North Dakota Unemployment Compensation Commission. "Claimants' Experience After Exhausting Benefits." Bismarck, 1959. (Mimeographed.)
Oklahoma Employment Security Commissions. "A Study of Delayed F i l i n g of I n i t i a l Claims." Tallahassee, Fla., September, 1959. (Mimeographed.)
Oregon State Department of Employment. "Experience of Claimants Exhausting Benefit Rights Under unemployment Insurance in Oregon, 1958 and 1956 Surveys Compared." Salem, July, 1959. (Mimeographed.)
Pennsylvania Bureau of Employment Security. "Delayed F i l i n g of I n i t i a l Claims, Altoona, Pennsylvania, 1959." Harrisburg , n.d. (Mimeographed.) "Delayed F i l i n g of I n i t i a l Claims, Lancaster, Pennsylvania , 1959." Harrisburg, n.d. (Mimeographed.)
119 - "Labor Force and Claim Status of Workers During the Sixteen Months Following Exhaustion of Unemployment Compensation Benefits in Pennsylvania." Harrisburg, n.d. (Mimeographed.)
. "Labor Force Status of Workers After Exhausting Unemployment Compensation Benefits i n Pennsylvania, 1957-1958. " Harrisburg, 1960. (Mimeographed.)
Stevens, Carl M. "The Adequacy of Unemployment Benefits, Experience of Unemployment Compensation Beneficiaries i n the Portland Metropolitan Area." Salem, Ore., March, 1959. (Mimeographed.)
U.S. Department of Labor. "Characteristics of the Insured Unemployed: (A Monthly Report)." Washington, May, 1956-June, 1957. (Mimeographed.)
. "Characteristics of the Unemployed: (A Monthly Report)." Washington, July, 1957-September, 1958. (Mimeographed.)
. "The Extent and Nature of Frictional Unemployment." Study Paper No. 6 for the Joint Economic Committee, Congress of the United States. Washington, D.C, 1959.
. "A Guide to the Conduct of Post-Exhaustion Studies," UIPL, No. 384. Washington, August, 1955. (Mimeographed .)
. "Monthly Report on the Labor Force." Washington, July, 1959-present. (Mimeographed.)
. "Proposed Method for a Survey of Unemployment Compensation Beneficiaries." Washington, A p r i l , 1956. (Mimeographed.)
. "The Structure of Labor in Areas of Substantial Labor Surplus." Study Paper No. 23 for the Joint Economic Committee, Congress of the United States. Washington, D.C, 1960.
U.S. Department of Labor, Bureau of Employment Security. "Experience of Claimants Exhausting Benefit Rights Under Unemployment Insurance, 17 Selected States. BES Report No. U-178. Washington, D.C, December, 1958. (Mimeographed .)
. "Experience of Claimants Exhausting Unemployment Insurance Benefit Rights, January-March 1956, 14 States." BES Report No. U-167. Washington, D.C, Apr i l , 1957. (Mimeographed.)
120 U.S. Department of Labor and Duquesne University. "A Digest of
the Survey of Unemployment Compensation Beneficiaries in Pittsburgh, Pennsylvania." Washington, D.C, October, 1955. (Mimeographed.)
Vermont Unemployment Compensation Commission. "Labor Market Experience of UC Exhaustees." Montpelier, Vt., August, 1958. (Mimeographed.)
. "Labor Market Experience of Ul Exhaustees." Montpelier, Vt., May, 1960. (Mimeographed.)
Washington Employment Security Department. "Study of Disqualified Claimants." Olympia, 1961. (Mimeographed.)
Washington University School of Business and Public Administration. "Survey of Unemployment Compensation Beneficiaries in St. Louis City and St. Louis County, Missouri, A p r i l , 1958." St. Louis, June, 1959. (Mimeographed.)
West Virginia Department of Employment Security. "Special Study of the Delayed F i l i n g of I n i t i a l Claims in West Virginia's Labor Market, July, 1957-June, 1958." Charleston, W. Va., December, 1959. (Mimeographed.)
Yntema, Dwight B. "Survey of Unemployment Compensation i n Michigan, 1955." Hope College, Department of Economics and Business Administration, February, 1957. (Mimeographed .