Mitigating Urban Youth Unemployment through Information ...
45
A Submission to the Geneva Challenge 2017 Camila Lercari Zachary Hoyer-Leitzel Jorge Salem Hermila Yifter Manasi Nanavati Mitigating Urban Youth Unemployment through Information Technology: Delala, the Work Connector DELALA ደ ላ ላ የስራ አገናኝ Vision Flourishing and structurally-transitioned Ethiopia supported by an urban labor market Mission Increased efficiency of the labor market in Addis Ababa by providing decentralized access to a robust and expansive digital job-matching platform
-
Upload
khangminh22 -
Category
Documents
-
view
5 -
download
0
Transcript of Mitigating Urban Youth Unemployment through Information ...

A Submission to the Geneva Challenge 2017
CamilaLercari
ZacharyHoyer-LeitzelJorgeSalem
HermilaYifterManasiNanavati
MitigatingUrbanYouthUnemploymentthroughInformationTechnology:Delala,theWorkConnector
DELALA
ደ ላ ላ
የስራ አገናኝ
Vision Flourishing and structurally-transitioned Ethiopia supported by an urban labor market
Mission Increased efficiency of the labor market in Addis Ababa by providing decentralized access to a robust and expansive digital job-matching platform

ii
ABSTRACT
Urban Ethiopia is plagued by frictional unemployment. The economic transition away from an agrarian base depends in part on an efficiently functioning urban labor market. However, currently existing but undiscovered matches between job seekers and open positions account for 20% of urban unemployment. This incredibly high level of frictional unemployment has spatial and informational components, driven by high transportation costs and low connectivity of internet. Through an online job-matching system, decentralized across the outskirts of the city through interactive touchscreen kiosks, our team proposes to provide better access to information and thus reduce search costs for potential candidates and employers. The real-time data generated from such a system can also inform investors and government toward more effective training, employment, and business-support policies.

iii
PARTICIPANT BIOGRAPHIES
Camila Lercari Nationality: Peruvian Graduate Education: MBA Candidate at Columbia Business School Undergraduate Education: B.S., Economics. Universidad de Piura, Peru
Prior to enrolling in Business School at Columbia University, Camila worked in private wealth management at the Latin American investment bank Credicorp Capital. Before that, she worked in investment management at Prima AFP, one of the largest Peruvian pension funds. Camila holds a bachelor degree in Economics from Universidad de Piura and is studying towards hers Master in Business Administration at Columbia University. Camila is from Lima, Peru.
Hermila Yifter Nationality: United States (American) Graduate Education: MPA in Development Practice at Columbia School of International and Public Affairs Undergraduate Education: B.S., Foreign Service in Culture and Politics, Georgetown University’s School of Foreign Service. While completing her undergraduate at Georgetown University, Hermila
worked for the Ethiopian Embassy in Washington, D.C., and continued on her internship at the Ministry of Foreign Affairs in Addis Ababa, Ethiopia. She worked at the Mayor’s Office on African Affairs in D.C. and worked on providing resources to African diaspora all throughout the D.C. greater metropolitan area. After graduating, Hermila served as an AmeriCorps VISTA in San Diego, CA, working on refugee resettlement issues in the development and outreach department. She currently is a Pickering Fellow pursuing her final year as a Master’s student at Columbia. Upon graduating, she will join the Department of State as a Foreign Service Officer. She speaks Amharic and Tigrigna fluently and is proficient in Arabic.
Manasi Nanavati Nationality: Indian Graduate Education: MPA in Development Practice at Columbia School of International and Public Affairs; MS in Environmental Sciences at University of Illinois Springfield Undergraduate Education: B.Sc., Environmental Sciences, The M.S. University of Baroda, India

Before entering graduate school, Manasi worked as an environmental executive in private environmental consultancy in Gujarat, India. While in UIS, she interned in Illinois Environmental Protection Agency as a data coordinator. Before joining SIPA, she was working as a research consultant in World Resources Institute-India, where she was a part of the Urban Climate Resilience team. In collaboration with WRI-Brazil, Manasi assisted in contextualizing indicators for Indian cities’ resilience assessment.
Jorge Salem Nationality: Peruvian Graduate Education: MPA in Development Practice at Columbia School of International and Public Affairs Undergraduate Education: B. A., International Political Economics, Colorado College, US.
Prior to enrolling in the Economic Development program at Columbia University, Jorge worked in supply chain management throughout Latin America at a mining company, Anglo American. Prior to that experience Jorge was a Business Manager at a Microfinance institution in Guatemala and owned his own high end craft company. Through his career switch from mining to economic development, Jorge demonstrates sincere interest in reducing the gap of income inequality and employment. Jorge holds a bachelor degree in International Political Economy from Colorado College and is studying towards his Master in Public Administration at Columbia University. Jorge is from Lima, Peru.
Zac Hoyer-Leitzel Nationality: United States Graduate Education: MPA in Development Practice at Columbia School of International and Public Affairs Undergraduate Education: B. A., Sociology, Oberlin College, U.S.
Before enrolling at SIPA, Zac spent almost a decade working in youth development and alternative education for vulnerable populations. Most recently, he taught in the NYC community college transition program CUNY Start and in a DYCD funded youth workforce development program in Washington Heights. Zac has built on this background at SIPA through eight months of academic credit earning M&E and strategy research work for Kiron Open Higher Education for refugees, and hopes to continue his transition from the classroom to policy research in the second year of his MPA studies.

Abstract …………………………………………………………………………………. ii Participant Biographies ………………………………………………………………... iii
1. Introduction: Ethiopia and Frictional Urban Unemployment ……………………… 1 1.1 Country Overview: Ethiopia ………………………………………………………… 1 1.2 Urban Unemployment ………………………………………………………………. 3 1.3 Sources of Frictional Unemployment ……………………………………………….. 4 1.4 Spatial Factors of Frictional Unemployment ………………………………………… 5 1.5 Informational Factors of Frictional Unemployment …………………………………. 6 1.6 Labor Supply Impacts ………………………………………………………………... 7 1.7 Labor Demand Impacts ………………………………………………………………. 7
2. Target Population .………………………………………...……………………………. 9 2.1 Target Demographics ………………………………………………………………… 9 2.2 Pilot in Addis Ababa: Market Size ………………………………………………….. 10 2.3 Job Search Methodology ……………………………………………………………. 11
3. Project Proposal: Delala the Work-Connector Kiosk ...……………………………... 13 3.1 Introduction: Using Technology to Solve Frictional Unemployment ………………. 13 3.2 The Nature of Service ……………………………………………………………….. 14 3.3 Integration of Institutions and Stakeholders ………………………………………… 15 3.4 Design and Interface of Kiosk ………………………………………………………. 17
4. Project Implementation … …………………………………………………………….. 24 4.1 Project Structure …………………………………………………………………….. 24 4.2 Project Finance ………………………………………………………………………. 27 4.3 Monitoring and Evaluation …………………………………………………………... 28 4.4 Fee Structure …………………………………………………………………………. 31
5. Expected Outcomes …..………………………………………………………………… 33 5.1 Short-Term Outcomes ……………………………………………………………….. 33 5.2 Long-Term Outcomes ……………………………………………………………….. 34 5.3 Limitation/Risk Analysis …………………………………………………………….. 36
6. Conclusion ...…………………………………………………………………………….. 38 7. Bibliography ……………………………………………………………………………...39 8. Appendix …………………………………………………………………………………. 41
Table of Contents

1
1.1 Country Overview: Ethiopia
Ethiopia, with over 100 million
people, is the most populous country in
the region and second most populous on
the continent. Ethiopia is still one of the
world’s poorest countries, with per
capita income of US $660 in 2016,1
lower than regional average of US
$732.2 But, Ethiopia has experienced an
economic boom over the past decade,
maintaining GDP growth of over 10%
between 2004 and 2015.3 The Ethiopian
government through its Growth and
Transformation Plan aspires to continue
this trend and move the economy from low income to lower-middle income status by 2025.
The increased activity in the agricultural and service sectors is responsible for the
majority of recent growth. Agriculture alone currently employs 80.7% of people and contributes
48.6% of the GDP.4 Public investment in infrastructure and private consumption dominated the
demand-side of the economy. Economic growth and targeted development efforts have triggered
strong poverty reduction outcomes in both rural and urban settings. Extreme poverty has dropped
from 55.3% in 2000 to 33.5% in 2011. Nationally, unemployment in Ethiopia has averaged
1 World Bank. 2016. World Development Indicators 2016. 2 United Nations, Department of Economic and Social Affairs, Population Division (2017). World Population Prospects: The 2017 Revision. This figure calculated by authors: average of existing 2016 Atlas Method UN estimates for countries in UN Stat. East Africa Geographical sub-region, excluding Seychelles, high-income, Mauritius, upper-middle income, and Comoros, low income, as these small island states have economies vastly different than that of Ethiopia. 3 World Bank. 2016. World Development Indicators 2016. 4 Open Data for Africa. “Ethiopia Agriculture Sheet.” http://ethiopia.opendataforafrica.org/ewwocj/ethiopia-agriculture-sheet
1. Introduction: Ethiopia and Frictional Urban Unemployment

2
around 5.5% since the 1990s5. Presently, important focus is on agricultural sector productivity
and value chain efficiency, as echoed by an Ethiopian diplomat our team interviewed in May
2017. However, continued growth rests on the success of the structural transformation of the
economy away from the agricultural base.
The future of Ethiopia is urban. Increasing population density and declining farm sizes
compel individuals in rural Ethiopia to seek non-farm employment to obtain economic support to
sustain life. Ethiopia’s population growth is near primed for a demographic dividend, with 65%
of people under 25 but a shrinking dependency ratio.6 Economic transformation, the subsequent
migration to urban areas, and expected fertility rates, will drive the tripling of the urban
population - from 15.2 million in 2012 (16% of total population) to 42.3 million in 2037 (27% of
total population).7
Structural transformation will bring urban challenges to the forefront of the national
landscape. Urban-rural migrants experience increasing difficulty finding employment in urban
area.8 Present land acquisition policies and regulations, prevailing poverty, and lack of resources
make this transition challenging.9 Urban youth and the urban poor have not benefitted from
Ethiopia’s economic growth.10 With the projected annual 3.8 percent continued urban
population growth, a functioning urban labor market is essential to absorb excess labor as well as
to facilitate the expansion of the non-agricultural sectors. Future urban success rests on building
sustainable urban systems now.
5 World Bank. 2016. World Development Indicators 2016 6 Martins, P. (2014). Structural change in Ethiopia: an employment perspective, Policy Research Working Paper. World Bank Africa Region. 7 Urban population stats taken from Ethiopian Central Statistics Agency. Total population estimates taken from UN Medium Variant projections, World Population Prospects: The 2017 Revision. Also noted in Gebremariam, Eyob Balcha and Corbett, HannahAddressing the Urban Youth Employment Challenge in Ethiopia. Institute of Developmet Studies. IDS Policy Briefing Issue 138. Februrary 2017. Pg. 1 8 Sosina Bezu, Stein Holden. Are Rural Youth in Ethiopia Abandoning Agriculture? World Development, Volume 64, 2014, Pages 259-272 9 Sosina Bezu, Stein Holden. Are Rural Youth in Ethiopia Abandoning Agriculture? World Development, Volume 64, 2014, Pages 259-272 10 Franklin, Simon. Job Search, Transport Costs and Youth Unemployment Evidence from Urban Ethiopia. June 2014. Pg. 1
3
1.2 Urban Unemployment
Ethiopia’s urban labor market is highly inefficient. Urban unemployment in Ethiopia was
16.5% in the latest (2013) National Labor Force Survey,11 and worst in Addis Ababa, which
recorded of 24.2% unemployment.12 It is the country’s largest city,13 boasts the proportion of
formal jobs,14 is a major arrival city for rural-urban migrants, and is one of the most rapidly
growing cities in Africa.15 Unemployment rates are high particularly among young and
moderately educated population in the cities. Unemployment is exacerbated by high
underemployment, reported at 23 percent and 29.4 percent for urban women and urban men,
respectively.16
The most recent World Bank Economic Update for Ethiopia (2016) takes an in-depth
look at the urban unemployment situation. The report demonstrates almost 20% of Addis Ababa
unemployment is the result of frictional issues, and over 90% of unemployment in the Addis
Ababa post-secondary educated subgroup17 is caused by frictional issues (2016, 58).
Contributing factors for Addis Ababa’s high level of frictional unemployment include: follow18 –
• Employers indicate finding the right employee is time consuming • Employers indicate that once hired, employees required training • Transportation from the outskirts of the cities is expensive and time consuming19 • Job searches are predominantly conducted through visiting centrally located physical
job boards where paper flyers are posted to advertise openings. • Unemployed candidates waiting for a stable wage employment take temporary jobs,
locking themselves out of waged employment opportunities. 11 Central Statistical Agency of Ethiopia, Ethiopia - National Labor Force Survey 2013, Central Statistical Agency - Ministry of Finance and Economic Development, 2014. 12 World Bank. 2016. “5th Ethiopia Economic Update : Why so Idle? - Wages and Employment in a Crowded Labor Market : Draft for Public Launch.” 110730. The World Bank. 13 Franklin, Simon. Job Search, Transport Costs and Youth Unemployment Evidence from Urban Ethiopia. June 2014. Pg. 1 14 Gebremariam, E. B. (2017). Addressing the Urban Youth Employment Challenge in Ethiopia. Institute of Developmet Studies. IDS Policy Briefing Issue 138. 15 Franklin, Simon. Job Search, Transport Costs and Youth Unemployment Evidence from Urban Ethiopia. June 2014. 16 Denu et al. (2007). Characteristics and determinants of youth unemployment, underemployment and inadequate employment in Ethiopia. Retrieved on July 29, 2017 from http://www.ilo.org/wcmsp5/groups/public/---ed_emp/---emp_elm/documents/publication/wcms_114148.pdf 17 The 90% of unemployment among Addis Ababa post-secondary educated subgroup caused by frictional and not structural issues accounts for 30% of labor force and 11% of total unemployment., according to the 2016 World Bank Economic Update. 18 Abebe et al, Job Fairs: Matching firms and workers in a field experiment in Ethipia, 2017, p1 19 Julia Austin, AFKinsider, 8 most expensive African cities for public transportation, http://afkinsider.com/129993/8-expensive-african-cities-public-transportation/4/. “In Addis Ababa, a monthly bus pass costs between $10 and $25. With the average monthly disposable income at $226, that means some commuters spend nearly 10 percent of their disposable income on transportation”

4
• Informational problems prevent young people from finding out what work suits them, including having unrealistic expectations about what kind of work they could reasonably do
• Training programs, in particular, have been found to have low returns in developing countries.
• A portion of lower skilled jobs are taken by high skilled workers while they wait for a better opportunity, also known as ‘queueing’.20
As a solution to these problems, our team proposes increasing access to better
information through an online job-matching system, decentralized and located across the
outskirts of cities in publically accessible areas, in the form of user friendly touch-screen
systems, also called “kiosks.” The intervention will reduce the drivers of frictional
unemployment: search costs and market misperceptions of potential candidates and employers.
1.3 Sources of Frictional Unemployment
Frictional unemployment is a result of the time it takes for potentially matched employers
and job seekers to find one another. Information generally takes time to communicate, but in
Addis Ababa, sufficient and systematic labor market information flows incredibly slowly and
does not reach many people.21 The labor market is analogue, not digital, with 50% of all
unemployed relying on centrally located physical job boards and newspapers. The boards are the
most common method of job search.22 Due to employers being swamped with applications and
not having a system to selectively exclude unqualified applicants, they rely on hiring through
networks and referrals instead publicly posting job openings.23
The nature of analogue communication itself slows down the flow of information that
matches open positions to qualified candidates, and analogue communication slows more across
greater distance. The flow of information is further limited by the costs of analogue job search,
which likewise increase with distance and are heightened by poverty. Moreover, analogue
communication across distance limits the amount information that reaches each actor in the
20 World Bank. (2016). 5th Ethiopia economic update : why so idle? - wages and employment in a crowded labor market : draft for public launch (No. 110730) 21 Gebremariam, Eyob Balcha and Corbett, Hannah. Addressing the Urban Youth Employment Challenge in Ethiopia. Institute of Developmet Studies. IDS Policy Briefing Issue 138. Februrary 2017 22 Franklin, Simon. Job Search, Transport Costs and Youth Unemployment Evidence from Urban Ethiopia. June 2014. Pg. 19 23 Franklin, Simon. Job Search, Transport Costs and Youth Unemployment Evidence from Urban Ethiopia. June 2014. Pg., 20

5
market. The interplay between space and information drives frictional unemployment to an
inefficient level.
1.4 Spatial Factors of Frictional Unemployment
Job searches cost money and time, increasingly so across larger distances. With the
centrally-located, paper based job boards in Addis, both time and money costs increase for those
job seekers who live further toward the peri-urban outskirts of the city,24 which can “span for up
to 10 km in any direction from the city center.”25 Travel around the city is expensive, and is the
largest individual cost of the job search, usually amounting to 25 percent of the weekly
expenditure.26 Low wages further decrease capacity to afford job market costs.27
Traditionally, the literature treats the costs of job search as separate from a job-seeker’s
typical living expenditures. Anyone who grew up poor could tell you different. Franklin
emphasizes this academically novel idea that a severe cash-constraint makes it impossible to
separate the utility from consumption and loss of utility due to job search.28 Generally speaking,
cash-constrained job seekers’ expenditures to find work directly impact their regular
consumption patterns. Many job seekers in Addis Ababa have so little money in comparison to
the high search costs, that they must take breaks from the search for formal employment to re-
generate savings through temporary or informal employment.29
24 As noted by Franklin, this finding is in line with a low-income country application of the spatial mismatch hypothesis. The hypothesis was formulated in a high-income country urban context, but the rise of urban centers and mega-cities throughout the low and medium income world calls for additional research on its application in these spaces. 25 Franklin, Simon. Job Search, Transport Costs and Youth Unemployment Evidence from Urban Ethiopia. June 2014. Pg. 9 26 Gebremariam, Eyob Balcha and Corbett, Hannah. “Addressing the Urban Youth Employment Challenge in Ethiopia.” Institute of Developmet Studies. IDS Policy Briefing Issue 138. Februrary 2017. Pg. 2 27 Abebe, G., Caria, S., Fafchamps, M., Falco, P., Franklin, S., & Quinn, S. (2016). Curse of Anonymity or Tyranny of Distance? The Impacts of Job-Search Support in Urban Ethiopia (No. w22409). National Bureau of Economic Research. 28 Franklin, Simon. Job Search, Transport Costs and Youth Unemployment Evidence from Urban Ethiopia. June 2014. Pg. 9 29 Franklin, Simon. Job Search, Transport Costs and Youth Unemployment Evidence from Urban Ethiopia. June 2014.

6
1.5 Informational Factors of Frictional Unemployment
The relatively large amounts of money and time spent on job searches are less efficiently
used when job seekers and employers don’t have enough current information. The flow of
information is also slowed by non-travel costs. Newspapers, which compile job market
information, are costly to rent or buy. 30 Once a job-seeker finds an opening, he is often charged
a fee to fill out an application, and privately run labor brokers charge money to connect job
seekers with vacancies.31 Information slowdowns also create misperceptions of both the labor
supply and demand. These misperceptions are additional causes of information-based frictional
unemployment.
Job seekers may have inaccurate perceptions of the job market, leading to overreaching
aspirations and unrealistic reservation wages. Abebe et al. show that this is especially true for
low-skilled workers. Employers can also be misinformed. Lacking exposure to the entire
candidate pool, employers often can have unrealistic expectations of entry-level workers, further
increasing frictional unemployment.32
Job seekers also contribute to employers’ misperceptions of the labor pool. Frictional
unemployment is increased by the inability of job-seekers to effectively communicate their skill
sets.33 Low-income country labor markets often see the introduction of new job-types, an influx
of young workers, and job seeker movement from agricultural or informal sector to the formal
urban wage market. Success in such transitions between livelihoods rests on transferable skills.
Job seekers who cannot demonstrate their skill sets are often subjected to rejection by employers
even though they are in reality good matches for the position.
Moreover, when job seekers cannot effectively communicate qualifications based on non-
traditional labor experience, the market inaccurately prices skills.34 Positions, open or filled, are
allocated higher than optimal salaries, inefficiently reducing labor demand in the face of an
invisible supply that would otherwise drive down the wages of skilled workers.
30 ibis 31 ibis 32 Abebe, G., Caria, S., Fafchamps, M., Falco, P., Franklin, S., Quinn, S., & Shilpi, F. (2017). Job Fairs: Matching Firms and Workers in a Field Experiment in Ethiopia. CSAE Working Paper. 33 ibis 34 Abebe, G., Caria, S., Fafchamps, M., Falco, P., Franklin, S., Quinn, S., & Shilpi, F. (2017). Job Fairs: Matching Firms and Workers in a Field Experiment in Ethiopia. CSAE Working Paper.

7
1.6 Labor Supply Impacts
Both spatial and informational frictions impact the labor supply. Spatial friction
constrains job search intensity, and informational friction lowers job search effectiveness.
Spatial friction diminishes labor supply by lowering the intensity of a job search in three
ways: first, through reducing jobs applied to per day of searching; second, through disrupting the
continuity of search periods as job seekers take cash-constraint motivated pauses to build savings
back up;35 and third, through shortening the duration of job searches as job hunters facing
insurmountable costs resign themselves to unemployment or temporary informal employment.
Friction caused by lack of information reduces the effectiveness of job seekers efforts.
The less market knowledge job seekers have, the worse they are at finding jobs that are good
matches. This effectiveness can be measured as a ratio of results (e.g., interviews or hire offers)
to number of applications submitted. Abebe et al. show that providing labor market information
to job seekers increases the effectiveness of job-seekers’ subsequent searches.36
1.7 Labor Demand Impacts
Employers are hurt by the spatial friction as they incur the money and time costs
necessary to physically post their openings on the central job boards. Additionally, the cost based
spatial effects on the supply side of the market shrink the pool of applicants, consequently
limiting the number of quality matches within the pool.
As a result of spatial and informational frictions, employers spend more time and energy
publicizing openings and trying to identify ideal candidates from a smaller and relatively less
well-matched pool of applications. Horton and Pallais have, in an online labor market context,
demonstrated that algorithmic matching and increasing information about applications lead to
more and better matches, overcoming some of the informational friction.37
35 Franklin, Simon. Job Search, Transport Costs and Youth Unemployment Evidence from Urban Ethiopia. June 2014. 36 Abebe, G., Caria, S., Fafchamps, M., Falco, P., Franklin, S., Quinn, S., & Shilpi, F. (2017). Job Fairs: Matching Firms and Workers in a Field Experiment in Ethiopia. CSAE Working Paper. 37 Pallais, A. (2014). Inefficient Hiring in Entry-Level Labor Markets. American Economic Review, 104(11), 3565–3599; Horton, J. J. (2016). The Effects of Algorithmic Labor Market Recommendations: Evidence from a Field Experiment. Journal of Labor Economics, 35(2), 345–385.
8
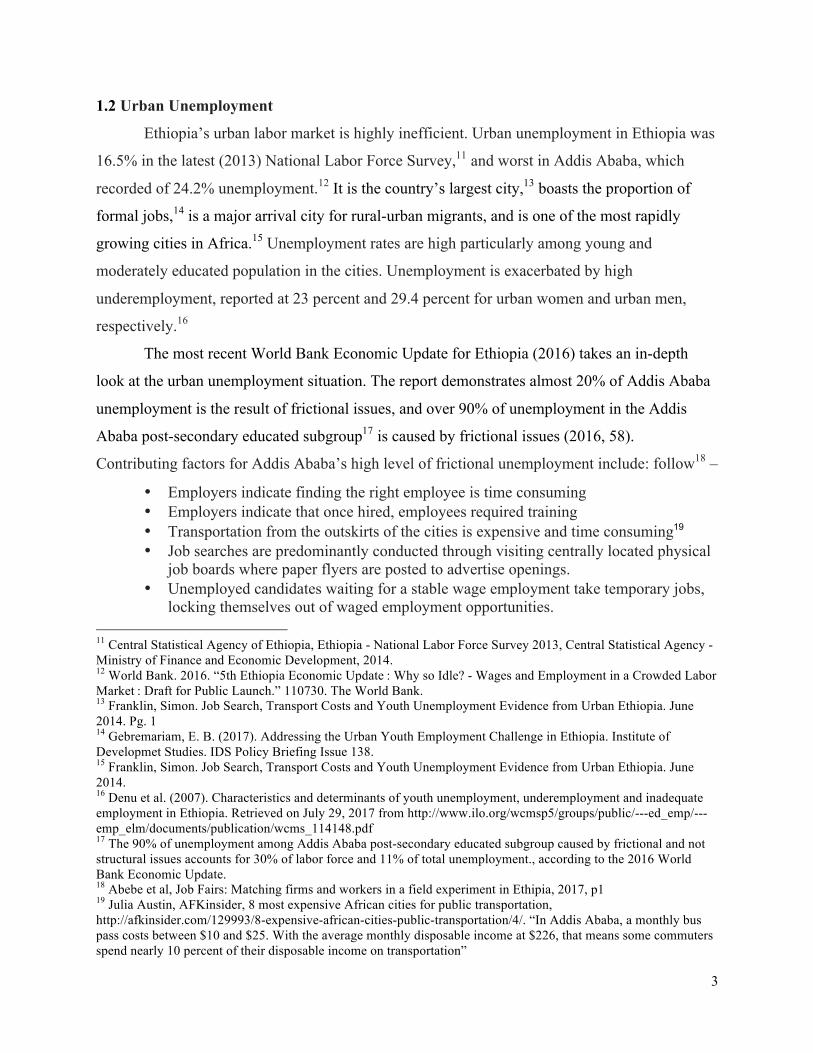
Figure 1 below demonstrates key contributing factors that cause frictional unemployment in Addis Ababa.
Figure 1: Causes of Frictional Unemployment in Addis Ababa

9
2.1 Target Demographics
Demographic shifts and urban-rural migration intersect to create a target population
which faces significant challenges to finding employment. Youth, urban-rural migrants and the
children of urban-rural migrants live in the city outskirts and acutely lack information and
networks for acquiring appropriate skills. They encounter limited opportunities for entry-level
work that is in their desired career path, lack experience and credentials for upward mobility, and
lack of work-relevant skills.38 These challenges cause under-investment in job search, resulting
in longer periods of unemployment or inferior matches on the job market.39
Increased access to higher education without innovative tools to facilitate skills training,
professional development, and job search has led to a rapidly growing number of unemployed
poor and graduates. In the past decade, the costs to attain higher education lowered,40 and the
amount of college-educated youth increased by over 20 percent between 1999 to 2011.41 The
rapid expansion of higher education increased the number of graduates from 5,693 in 1991 to
78,144 in 2012, allowing for more than 70,000 graduates to enter a very competitive labor
market each year.42
Once a guarantor into the middle class, a college degree now leads to unemployment. Not
only is the rate of unemployment higher for youth with some kind of post-secondary education
between the ages of 20 to 24,43 but also for literate persons than that for illiterate persons by 3
percent.44 The unemployment rate for adult youth45 is the highest for people between ages 20 to
24 and the second highest is for youth between 25 and 29 years old—in general, youth have the
38 Youth Unemployment Challenge and Solutions: What Business Can Do Now. Manpower Group. 2012. 39 Franklin, Simon. Job Search, Transport Costs and Youth Unemployment Evidence from Urban Ethiopia. June 2014. Pg., 2 40 Youth Unemployment Challenge and Solutions: What Business Can Do Now. Manpower Group. 2012. 41 ibis 42 Job Search and Graduate Employment in Ethiopia: Implications for Program Improvement Authors: Aklilu Amsalu and Teshome Neatibeb. Addis Ababa University 43 Franklin, Simon. Job Search, Transport Costs and Youth Unemployment Evidence from Urban Ethiopia. June 2014. Pg. 19 44 Kibret, Fitsum. Unemployent and Labor Market in urban cities: trends and current continue Center for Environment and Development, Addis Ababa University .2014 45 Youth (15-34) and our assessment excludes ages 15-19.
2. Target Population

10
highest unemployment rate among all working age groups.46 Females have the highest
unemployment rate amongst all adult youth age groups by 6 to 24 percent.47
Table 1: Project Target Population Summary
For the poor, connection to the labor market is hindered by lack of internet connectivity.
Ethiopia’s current internet penetration is only at 3.7 percent and only 11.1 percent of the
population use internet.48 Most people rely on their phones and internet cafes to access slow and
unreliable internet. This hinders the ability of people to effectively utilize the few online job
searching platforms operating in Ethiopia. Universities and other higher education/vocational
schools do not have career centers; job fairs are scarce and poorly advertised.
When the distribution of information about job vacancies or resources to make candidates
more competitive is not accessible to financially constrained and vulnerable youth, then
economic growth will mainly benefit the advantageous, which hinders sustainable development
and promotes urban inequality.
2.2 Pilot in Addis Ababa: Market Size
As per the latest World Bank data, about 49% of Ethiopian population account for its
labor force. While in rural regions, agriculture and self-employment dominate, in urban regions
46 Central Statistical Agency of Ethiopia, Ethiopia - National Labor Force Survey 2013, Central Statistical Agency - Ministry of Finance and Economic Development, 2014. 47 ibis 48 http://www.internetworldstats.com/africa.htm#et
Characteristics Focus Neighborhoods in
Addis Ababa Outskirts
City Centers in Addis
Ababa
• Youth between 20-34 years of age
• Completed Secondary and
Postsecondary Education
• Lower Socio-economic
• Minorities (females)
• Limited Internet Connection
• Reside in City Outskirts
• Jomo
• Akiki/Kaliti
• Dukom
• Debrezeit
• Alem Gena
• Alem Tena
• Mexico Square
• Bole
• Kazanchis
• Mexico
• Arat Kilo
• Meskel Adebabai

11
service and manufacturing sectors play a significant role in the job sector. Applying the national
labor force to population ratio to the capital’s total population, we estimate the Addis Ababa
labor force at 2.2 million. Within that economically active population, unemployed and
underemployed population account for about 1.2 million49 which is approximately 26% of the
total Addis Ababa population. Counting on strategic locations of the kiosk, and proper outreach
for this intervention, if 30% of potential target population utilizes the kiosk for job seeking
purposes, it translates into approximately 364,104 people using the kiosk. As the population in
Addis Ababa increases, more demand for non-farming employment arises, and greater use of the
kiosk is anticipated.
2.3 Job Search Methodology
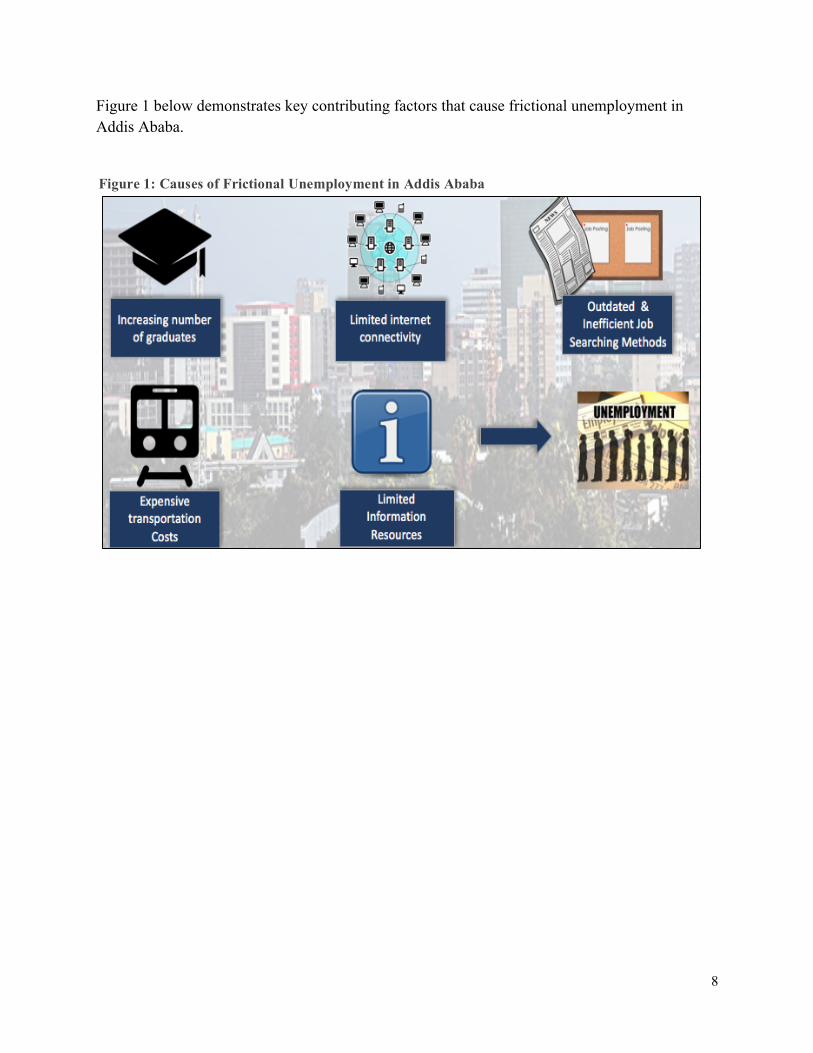
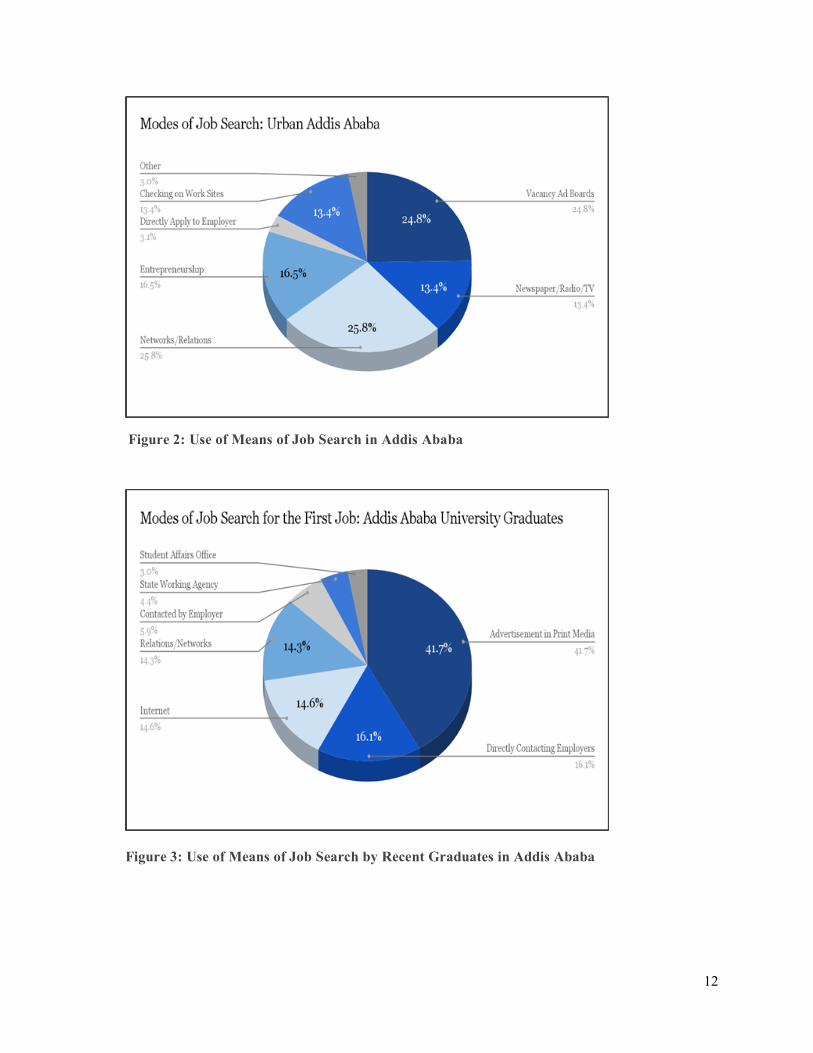
Figure 2 and figure 3 below represent job search methods implemented by Addis Ababa
urban population50 and recent university graduates , as per a study by Addis Ababa University.51
The team that surveyed recent graduates discovered that over 90 percent of surveyed participants
did not begin job searching before graduation while 36 percent did not look for a job after
graduation.52
49 These estimates are derived using 2013 National Labor Survey and World Bank Data. Target population comprises of unemployed and underemployed population of Addis Ababa; the latter is calculated based on people reporting mismatched profession and dissatisfaction because of low payment. 50 Central Statistical Agency of Ethiopia, Ethiopia - National Labour Force Survey 2013, Centeral Statistical Agency - Ministry of Finance and Economic Development, 2014. 51 Job Search and Graduate Employment in Ethiopia: Implications for Program Improvement Authors: Aklilu Amsalu and Teshome Neatibeb. Addis Ababa University 52 ibis
12
Figure 2: Use of Means of Job Search in Addis Ababa
Figure 3: Use of Means of Job Search by Recent Graduates in Addis Ababa

13
3.1 Introduction: Using Technology to Solve Frictional Unemployment
Encouraging information projects to provide career and labor market information for
young job seekers would be a substantial contribution in alleviating the high costs of job search
and frictional unemployment. Using information and communications technologies (ICT) to do
so is one of the key recommendations in the recent World Bank Ethiopia Economic Update.53
Adopted technology should take into account the factors behind frictional unemployment from
both the demand and supply side. It should provide youth with more transparent access to labor
market information while maximizing the recruitment reach of employers.54 According to policy
recommendations on this specific issue, it is widely stressed that there should be more
incentivizing and focus on the private sector to develop accessible technology to facilitate and
simplify matching.
Our team proposes increasing access to better information through a non-internet
requiring job-matching system that is decentralized across the outskirts of cities in the form of
publicly accessible, user friendly touch-screen systems -“kiosks.” This system is called Delala
(Amharic word for broker) Sera Agagnign (Amharic phrase for Job Connector) since the kiosk
would be used as a machine broker to connect employees and employers with each other.
Furthermore, it would also be available as an online platform and app to increase its
accessibility; thus, reducing search costs and market misperceptions of potential candidates and
employers.
Within the first 10 years, this intervention would drastically reduce an equivalent of 20%
of the current Addis Ababa’s unemployment attributable to frictional causes. The intervention
would also generate data on labor supply and demand which is currently not available. Such
data would be essential to find solutions to Ethiopia’s structural unemployment.55
53 World Bank. (2016). 5th Ethiopia economic update : why so idle? - wages and employment in a crowded labor market : draft for public launch (No. 110730) 54 Youth Unemployment Challenge and Solutions: What Business Can Do Now. Manpower Group. 2012. 55 World Bank. (2016). 5th Ethiopia economic update : why so idle? - wages and employment in a crowded labor market : draft for public launch (No. 110730)
3. Project Proposal: Delala the Work Connector Kiosk

14
3.2 The Nature of Service
Delala is an online software that matches candidates to jobs based on factors such as
industry and role experience, hard and soft skills, geographic proximity, and more. The
matching algorithm makes the screening process much easier for recruiters and other hiring
authorities, and makes the job search process much easier for workers. Customization of the
algorithmically produced results is available to both job seekers and employers. Job seekers will
need to create a personal account scanning their national ID or typing their personal information.
The service will include the following functionalities:
a) Resume Builder: Suggests a list of soft and hard skills based on education, years of
experience in a certain role and/or industry, and general aptitudes. The final output is a
Digital Resume, suited to comply with the highest standards. To complement the applicant’s
basic input, the Resume Builder offers an interactive feedback mechanism to signal and
affirm the applicant’s qualities and aptitudes and to prepare him/her for a future interview.
b) Job Postings Database: The database will be fed from the following sources of information:
• Web application that enables businesses to upload job opportunities in real time.
• Ground-research to obtain job opportunities mainly from micro-businesses which can’t
access the web application
• Search engine that retrieves information from the web
c) Job-matching algorithm:
For the job applicant: Proposes a filtered list of the best suited job opportunities for the
applicant, as the result of the following screening process:
• Optional filters selected by the applicant, such as location, working hours, industry, role
• Backend filters by applicants’ professional experience and skills retrieved from the
Digital Resume
• Available job offers from Job Postings Database
The user is able to modify the filters proposed by the algorithm.
For the recruiting company: The list of best suited job opportunities for job applicants
provides displays only positions the applicant may be qualified for and thus provides an
initial layer of applicant screening. For a premium fee, the companies posting the job
opportunities can set additional screening criteria such as location, years of industry/role
15
experience, proficiency in specific informatics, etc. for the incoming job applications. The
search engine will filter all the applications and will propose a list of the best suited
candidates for each job. Employers can choose whether visibility of job postings is limited to
the customized group of candidates.
d) Direct application system: Secure system that allows users to apply to positions by sending
their standardized Digital Resume to employer recruiters and to complete the next steps of
the recruiting process.
e) Education & Training: Tools to prepare the applicant for recruiting and career
advancement.
• Career path builder: Presents information about career paths and training opportunities,
customized to each applicant, to develop the skills that are most valued by the market.
• Recruiting preparation: Information about workshops on job search, personal brand, and
interview preparation. Short videos and flyers with recruiting tips.
• Information about fellowships and scholarships
f) Accessibility:: Touch screen interactive kiosks will be placed in strategic locations (such as
supermarkets, train stations, etc.) to promote and facilitate the use of the online job-matching
service in neighborhoods around Addis Ababa with a high concentration of the target
population. They will thus serve low-income populations that do not have high levels of
internet usage.
These kiosks will have following supporting features -
• Audio for the less literate, less digitally literate
• Explanatory video for user guidelines
• A closed Wi-Fi transmission network
Client account managers will be responsible for following up with employers to collect
numbers as per data-sharing clauses in the terms of service, which will be highlighted in new
employer client onboarding.
3.3 Integration of Institutions and Stakeholders
Building partnerships with international, national, and local institutions, organizations,
and businesses will strengthen Delala’s effectiveness in both the planning and implementation
phases. It is important for Ethiopian ministries on youth, urban development, education, and

16
economic development to further expand on cooperation with private firms to “formulate policy
strategies that correspond to the different drivers of urbanizations and the associated
challenges”56 through innovative technology. The following figure summarizes the different
partnerships and how it would contribute to Delala’s efficiency in mitigating urban
unemployment.
Table 1: Potential Partners and Contribution
Institutional Entity
Name Potential Contribution
Government Institutions
Ministry of Labour and Social Affairs
Data collection on employment agencies, and other employment trainings in Addis Ababa
Ministry of Youth and Sport Outreach to urban youth, campaigning, information collection, advertisement of kiosk
Ministry of Science and Technology Research, data analysis, IT support Ministry of Foreign Affairs administration & investment regulation Ministry of Finance & Economic Development
Funding, Financial Planning, Budget allocation
Private Businesses and Organizations
Top online job portals such as Ethiojobs, Eyega, Employ Ethiopia, Qefira Jobs, Jumia Jobs
Resource sharing on employers and opportunities
The Society of Human Resource Management in Ethiopia (SHRME)
sharing information & research resources on advocacy, job fairs, & trainings to put in kiosks
Universities’ Department of Student Affairs
Research, data collection and analysis
International Institutions
Multilateral organizations like World Bank, United Nations
Funding, support in project appraisal and scaling-up
Foundations such as Bill and Malinda Gates Foundation
Funding, support in upscaling of the project
56 Gebremariam, Eyob Balcha and Corbett, Hannah. “Addressing the Urban Youth Employment Challenge in Ethiopia.” Institute of Developmet Studies. IDS Policy Briefing Issue 138. February 2017.
17
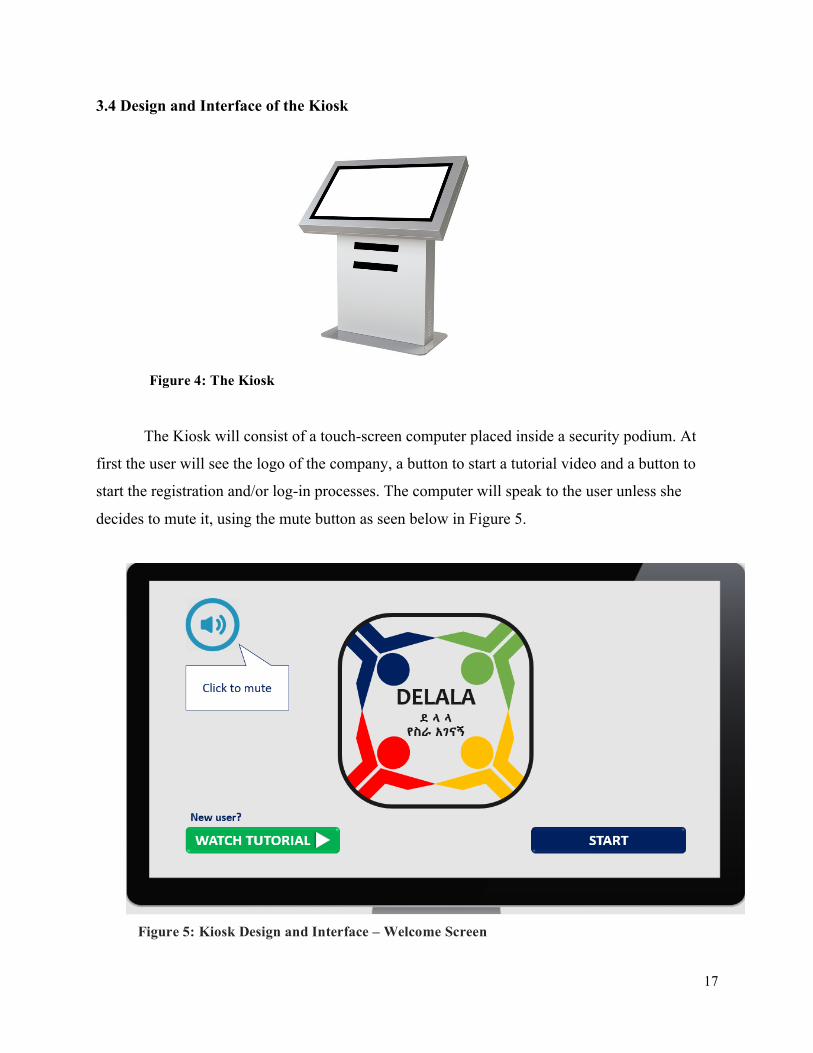
3.4 Design and Interface of the Kiosk
The Kiosk will consist of a touch-screen computer placed inside a security podium. At
first the user will see the logo of the company, a button to start a tutorial video and a button to
start the registration and/or log-in processes. The computer will speak to the user unless she
decides to mute it, using the mute button as seen below in Figure 5.
Figure 5: Kiosk Design and Interface – Welcome Screen
Figure 4: The Kiosk

18
The user will be able to create a profile and log-in by scanning her ID or by typing her
personal information. If the user already has an account, she can log-in directly by using the link
on the top of the screen. On this screen the user will also see advertisements from sponsoring
companies, as shown below in Figure 6.
Figure 6: Kiosk Design and Interface - Sign up/Sign in Screen

19
Next, the user will be prompted to a Home screen where she will find the links to all the
functionalities of the service and a summary of her activities and job-market information (figure
5). In order to use the “Job Finder”, “Send Applications” and “Education and Training” tools, the
user is required to build her digital resume.
The Home Screen shows the four tools available to job seekers. The final three tools are
faded-out in Figure 7 to demonstrate that these tools are not accessible until a resume is built.
This contingency enables Delala to provide an initial base level of candidate screening to all
employer clients. Job seekers are only shown postings which are algorithmically determined to
be feasible matches, based on the information input into the resume builder.
Figure 7: Kiosk Design and Interface – Individual’s Home Screen
20
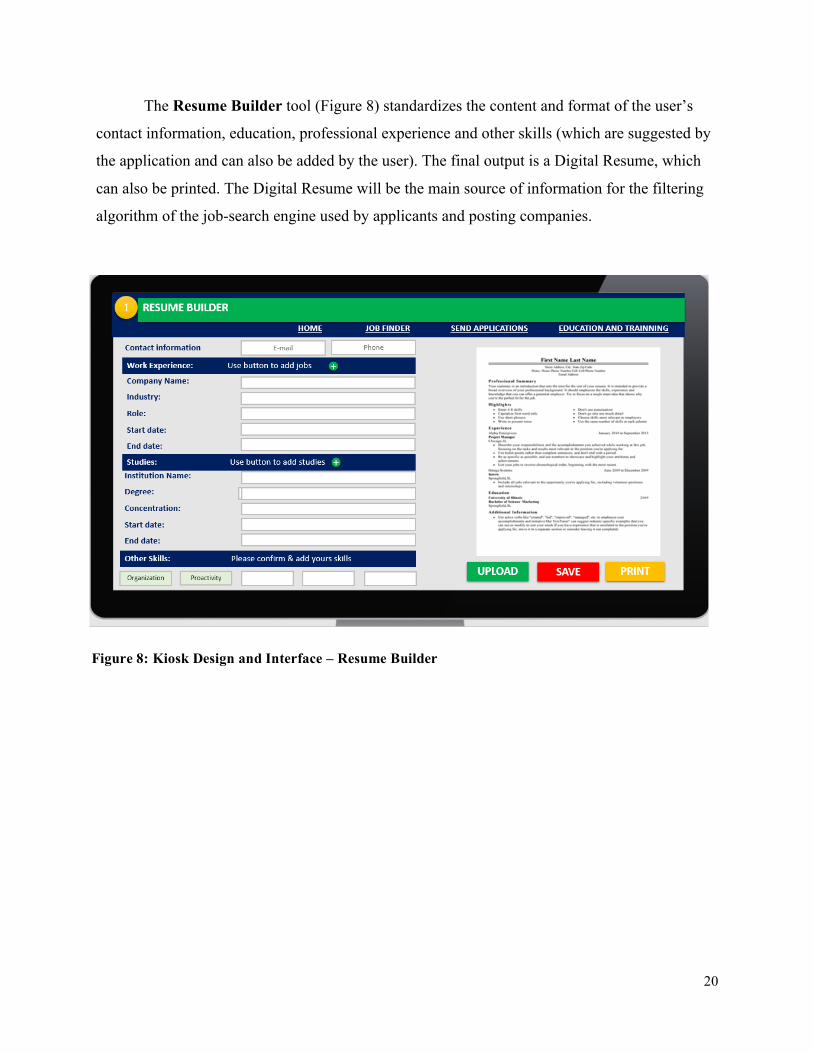
The Resume Builder tool (Figure 8) standardizes the content and format of the user’s
contact information, education, professional experience and other skills (which are suggested by
the application and can also be added by the user). The final output is a Digital Resume, which
can also be printed. The Digital Resume will be the main source of information for the filtering
algorithm of the job-search engine used by applicants and posting companies.
Figure 8: Kiosk Design and Interface – Resume Builder

21
The Job Finder tool (Figure 9) pulls information from the Digital Resume to screen the
best-fitting job opportunities for the user. Additionally, the suggested screening filters, such as
Industries, Roles, Locations, etc., can be modified by the user. The search engine will present all
the job postings that match the user’s screening filters, categorizing them by role. The user can
save the job postings for a later application or send her application directly.
Employers will be able to access a second level of customizable screening, by paying a
premium fee, the job-posting companies will be able to set screening criteria to receive only the
applications that comply with their customized minimum requirements, such as years of
professional experience in a certain role/industry, informatics proficiency, etc.
Figure 9: Kiosk Design and Interface – Job Finder

22
The Send Applications tool presents all the saved job-postings and the applications that
have been sent. It presents the stage of the application process and next steps, the expiration date,
and a link to search for similar jobs.
Figure 10: Kiosk Design and Interface – Send Application

23
The Education and Training tool presents links separated in two main categories
Resume & Interview which focusses on the recruiting process, and Education which focuses on
career advancement and education opportunities.
Figure 11: Kiosk Design and Interface – Education and Training

24
4.1 Project Structure
The launch of the job-matching system and installation of the Kiosks will take place in
three phases as described below. The goal is to have completed the city-wide scale up within 16
months of beginning of the project.
The detailed project implementation plan is presented in Table 3.
a) Design Phase: The design phase, lasting the first 8 months, will lay the groundwork for
quick scale up with two main goals of effective product design and partnership building.
Firstly, the team will have three units prototyped and will conduct focus groups with
representative samples from the target groups of job-seekers and employers. Focus groups
will enhance usability of the product for the target group. The prototypes will also be used in
presentations to Ethiopian government ministries, employers’ associations, and individual
companies. The connector between design and pilot phase will be the first push to secure
subscriptions from local hiring firms over the four months preceding the pilot launch.
b) Pilot Phase: The pilot phase will run for the remainder of the first year of the project.
During this time, the online job matching platform will be launched and 10 prototypes will be
installed in the Jomo, Kaliti and Mexico neighborhoods. The Jomo and Kaliti neighborhoods
are residential, and Mexico is a hub through which much transit around the city occurs. The
focus on these few neighborhoods is to get feedback on the public relations visibility, and
market penetrations mechanisms including word of mouth. These four months of pilot phase
will be dedicated to improve the project implementation and service delivery plans. The link
between pilot and scale up will be the second push for subscriptions to the product made by
local hiring firms.
c) Scale-up Phase: The second year of the project is dedicated to the two stages of city-wide
scale up, with the first stage of kiosk installation supplementing the pilot in Jomo, Kaliti and
Mexico, and the second stage of extending service into the remainder of the target
neighborhoods. Once feedbacks are received in the pilot phase, the scale-up phase will
incorporate newly gained insights to roll out a sustainable model for continued business
development on the labor demand side.
4. Project Implementation

25
No Activity Location Responsible Support 0 1 2 3 4 5 6 7 8 9 10 11 12 13 14 15 16 17 18 19 20 21 22 23 24DESIGNPHASE
1 ProjectInitialDesign NYC Team
2Pitchtoinvestorsforinitialfundsapproval Geneva Jorge Camila
3NetworkwithEthiopianGovernment,pitchprojectonmunicipaland NYC Hermila Zac
4 Tenderandselectsoftwaredeveloper NYC5 Developthesoftware NYC Camila Mansi6 Buildthefirstthreeprototypes NYC Mansi Zac7 TraveltoEthiopiaforayear AAB Team8 Conductfocusgroupsinfirstthree9 PitchtotheMinistryofLabor AAB Hermila Team
10 Pitchtolocalhiringcompanies AAB Hermila Team
11Signabusinessagreementswithpartners AAB Team
12 Marketing/LaunchingCampaign AAB Mansi Jorge13 DatagatheringfromEthipian AAB
14TryprototypeinEthiopiaandimproveweakness AAB
15Tenderandselecthardwaresuppliers(pcsandmetalstructures) AAB
16Firstsubscriptionpushtocontractfirmslookingtohire AABPILOTPHASE
17 Assemblethe10prototypes AAB Camila Mansi
18
Tenderandadjudicatecontracttoinsurancecompanyfor111unitsinarollingbasis AAB Jorge
19 Launchthepilotstage(10kisokunits AAB Jorge Zac
20Secondpushforservicesubscriptionsofhiringfirms
21Analyzethelaunchandfeedbackthemodel AAB Team
22Workwithsoftwareandhardwarecompaniestoincorporatefeedback AAB Zac Jorge
23 Improvetheservicedelvierymodel NYC TeamCITY-WIDESCALEUP
24 Launchthesecondstage(50units) AAB Team25 Feedbacktheexperience Team
26 Launchthe3rdstage(50units)AAB
Team27 Continousfeedback28 Implementationofsustainablemodel
INMONTHS-STARTINGJan2018
Table 2: Gantt-Rasci Chart

26
4.2 Project Finance
Table 3 below provides a summary of the project finance projections. These financial
projections contemplate both potential sources of income and expenses. The numbers selected
have been based on estimations (aee Appendix A) to help us simulate future costs and expenses.
This hypothetical exercise indicates profit of US$5.8mm, and a payback in the second year. That
means this social venture will not only tackle unemployment but at the same time generate a
considerable amount of income. Appendix B presents the entire cash flow.
Table 3: Project Finance
Description Unit Price (US$)
Quantity Total (US$)
INCOME
1 Grants 3 20,000 60,000
2 Subscription Premium Service- Annual fee 5 88,000 440,000
3 Private Companies sponsorships 5 5,000 25,000
4 Premium service for employees 50 36,410 1,820,519
5 Charge per job post (average) 100.0 50,000 5,000,000
6 Advertising 2,000.0 5 10,000
7 Computer Usage Rate for users 0.3 500,000 125,000
8 Net Resume Printing fees 0.3 200,000 50,000
EXPENSES
1 Develop the software 40,000 1 (40,000)
2 Build the first three prototypes 3,000 1 (3,000)
3 Travel to Ethiopia for a year 25,000 1 (25,000)
4 Marketing/ Launching Campaign 10,000 1 (10,000)
5 Data gathering from Ethiopian companies 5,000 1 (5,000)
6 Assemble the 10 prototypes 2,700 10 (27,000)
7 Tender and adjudicate contract to insurance company for 111 units in a rolling basis
100 111 (11,100)
8 Launch the pilot stage (10 kisok units and online job matching platform)
200 1 (200)
9 Improve the service delviery model 5,000 1 (5,000)
10 Launch the second stage (50 units) 2,700 50 (135,000)
11 Launch the 3rd stage (50 units) 2,700 50 (135,000)
12 Salaries - 5 team member 120,000 5 (600,000)
13 Bonuses 250,000 2 (500,000)
14 Printing paper 5,000 1 (5,000)
15 Other Expenses 200,000 1 (200,000)
Total Earned
5,829,219

27
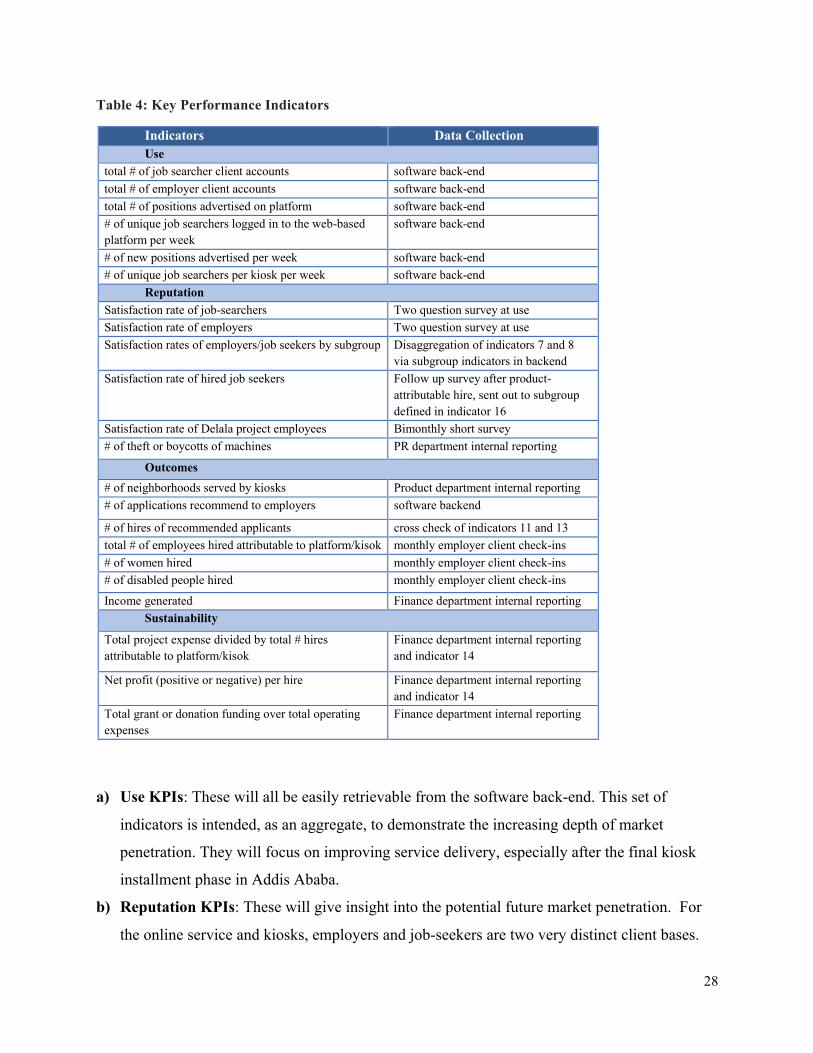
4.3 Monitoring and Evaluation
The project implementation plan includes phase and action item specific feedback
periods, but the project overall will be evaluated on a set of key performance indicators (KPIs),
proposed here and to be finalized before the city-wide scale up. The KPIs fall into four
categories: Use, Reputation, Outcomes, and fiscal Sustainability, and are presented in Table 4.
All totals are cumulative, with the remaining indicators being collected and reported per month,
unless otherwise indicated.
Data collection will include data from the software backend, a two question online client
satisfaction pop-up surveys, monthly check-ins with employer clients, a follow up survey for
job-seekers whose successful job matching is attributable to the product, and Delala internal
department reporting.
28
Table 4: Key Performance Indicators
a) Use KPIs: These will all be easily retrievable from the software back-end. This set of
indicators is intended, as an aggregate, to demonstrate the increasing depth of market
penetration. They will focus on improving service delivery, especially after the final kiosk
installment phase in Addis Ababa.
b) Reputation KPIs: These will give insight into the potential future market penetration. For
the online service and kiosks, employers and job-seekers are two very distinct client bases.
Indicators Data Collection Use
total # of job searcher client accounts software back-end total # of employer client accounts software back-end total # of positions advertised on platform software back-end # of unique job searchers logged in to the web-based platform per week
software back-end
# of new positions advertised per week software back-end # of unique job searchers per kiosk per week software back-end
Reputation Satisfaction rate of job-searchers Two question survey at use Satisfaction rate of employers Two question survey at use Satisfaction rates of employers/job seekers by subgroup Disaggregation of indicators 7 and 8
via subgroup indicators in backend Satisfaction rate of hired job seekers Follow up survey after product-
attributable hire, sent out to subgroup defined in indicator 16
Satisfaction rate of Delala project employees Bimonthly short survey # of theft or boycotts of machines PR department internal reporting
Outcomes
# of neighborhoods served by kiosks Product department internal reporting # of applications recommend to employers software backend
# of hires of recommended applicants cross check of indicators 11 and 13 total # of employees hired attributable to platform/kisok monthly employer client check-ins # of women hired monthly employer client check-ins # of disabled people hired monthly employer client check-ins
Income generated Finance department internal reporting Sustainability
Total project expense divided by total # hires attributable to platform/kisok
Finance department internal reporting and indicator 14
Net profit (positive or negative) per hire Finance department internal reporting and indicator 14
Total grant or donation funding over total operating expenses
Finance department internal reporting

29
At any given point, future success of the project will hinge largely upon present satisfaction
of these two client bases. The client satisfaction indicators will be an aggregation of a two
question survey delivered via pop-up to every account at the first session log-out of every
month. The questions will simply be an overall rating out of 5 stars and a net-promoter “how
likely are you to recommend this service?” on a 10 point scale. Satisfaction rate indicators
will be presented as two data points: an average overall rating for each client base and a ratio
of net-promoters (9 or 10 on the recommended scale) to total survey takers for each client
base. Employer and job-seekers satisfaction will be disaggregated by industry. The employer
clients will be broken down by firm size and the job-seeker clients by education level. This
will be easily accomplishable from a data perspective as the two question surveys will be
delivered through the product and results will be linked to demographic data for all accounts.
One particularly important subgroup is the set of job-seeker clients who are hired through
Delala’s services. Once these individuals are identified through monthly check-ins with
employers, these former job-seekers will be asked to take a Delala log-in pop-up 5 minute
survey to inform about their experiencing using the matching service and/or kiosks. A link to
the survey will also be sent via email and SMS. Internal reputation is essential to a young
company’s success. Delala employee satisfaction will be measured bimonthly in a brief
survey that will generate an average rating of employee belief in the company’s mission and
an average rating of employee overall satisfaction with the company.
c) Outcome KPIs: From a monitoring perspective, the outcomes will serve as an indication of
current success in matching job-seekers with employers. The main point of data collection
will be monthly check-ins with. For specific indicators in table 4, employers will be required
to ask new hires if they used Delala services to find the job posting or to include Delala in
the common ‘how did you hear about the position?’ question, This data will be checked
against a follow up to an ‘I got a job” response to a nudge SMS for job seekers who have not
logged on to the Delala platform via computer or kiosk in the past two weeks. Though this
level of self-reporting may suffer from some level of inaccuracy, any other method would
involve the invasive sharing of personal information of a client by Delala or hiring firms
which might discomfort its users.
d) Sustainability KPIs: These four indicators represent both the cost effectiveness of the
intervention and Delala’s overall fiscal health. It is expected to see high costs at the onset of

30
the project, but by the end of two years into the project implementation plan, we expect it to
reach an anticipated optimum target value.
When held in comparison against the Outcomes indicators, Use KPIs will provide insight
into the efficacy of the product. Indicator combinations such as hires per job-seeker client or
hires per posted job-opening will be used as a proof of concept. The objective of this
intervention is to increase the efficiency of the labor market in Addis Ababa. It is only by
comparing need (of clients) and successes (in getting hired). The duration of job-matching
process will be assessed by the system with the help of general Addis Ababa labor market
efficiency statistics.
The method by which Delala will increase labor market efficiency is by increasing the
number of job-applicant matches and not necessarily hires. Total number of hires attributable to
Delala services is a subset of this increase in matches, but is not comprehensive. Since this
increase in matches is the main service provided by Delala, it can also be indirectly measured
through client satisfaction. Juxtaposition of feedbacks by employers and job-seekers could
ultimately provide the overall effectiveness of this proposed system in terms of client
satisfaction.
4.4 Fee Structure
Following fees will be associated with the use of kiosk –
• Kiosk Fees: Affordable fee for minutes spent using the kiosk and for printing documents.
Charging a fee will prevent inefficient use of the kiosks.
• Private Partners Contributions: Charging organizations/schools/training facilities and other
relevant companies
• Advertising Fees: Companies can display ads digitally on the web application, and physically
on the kiosk structure (panel-like)
• Government and Multilateral Organizations Contributions: (World Bank), foundations (Bill
Gates), and tech company (Google) grants

31
5.1 Short-Term Outcomes
There is strong evidence supporting the hypothesis that spatial and informational
constraints influence employment outcomes. For example in Addis, suitable employment
opportunities become fewer with the increasing distance from the city center. As a consequence,
self-employment in the informal sector becomes more common on the outskirts of the city.57
Interventions like transport subsidies and job workshops have helped improve this situation.
However, more robust and relatively self-functioning intervention could further help in boosting
formal employment, and track the development in more quantitative way.
Of course, the proposed intervention, once implemented, needs careful evaluation and
monitoring. Given the overarching goal to minimize frictional unemployment and pilot objective
to connect job seeking individuals to employers and vice versa in an efficient way, short term
outcomes of the project can be assessed through the following simple indicators -
• Increase in number of people employed from peripheral urban regions, and
• Percentage Increase in formal employment
The data for these two indicators could easily be derived from aforementioned key performance
indicators (KPIs) as well as national statistics on labor market.
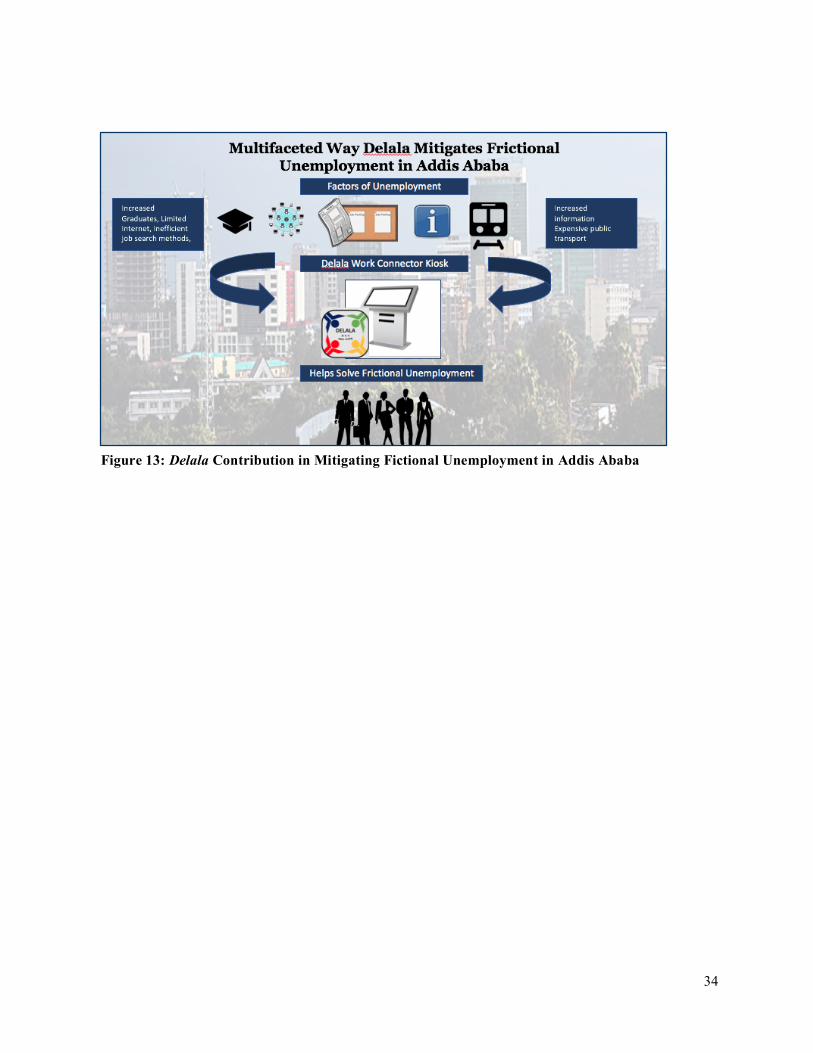
The kiosk will expand the work opportunities information base and will target individuals
who cannot easily access these opportunities. In turn, it will not only strengthen the labor force
but will also minimize additional time and resources spent on job search activities. As seen in the
infographics above, the kiosk will serve as a job seeker’s complete guide to finding an
employment. If unemployment prolongs beyond certain time period, it could have consequential
adverse impact on individual’s overall self-esteem, mental health, and well-being.58 This attempt
to reduce frictional unemployment invariably addresses these consequences as well.
57 Abebe, et al. (2016). Impact of job-search support: Evidence from Ethiopia. Retrieved July 29, 2017, from http://voxeu.org/article/impact-job-search-support-evidence-ethiopia 58 Moore, T., Kapur, N., Hawton, K., Richards, A., Metcalfe, C., & Gunnell, D. (2017). Interventions to reduce the impact of unemployment and economic hardship on mental health in the general population: A systematic review. Psychological Medicine, 47(6), 1062-1084.
5. Expected Outcomes

32
5.2 Long-Term Results
It is important to visualize cities as an engine to move forward the economy. In Ethiopia,
cities accounted for over 38 percent of the country’s GDP, while they employ 15% of the
national workforce,59 both formally and informally. Employment across services, manufacturing,
and industrial sectors together made up 70 percent of value-added growth in the period of 2005-
2011, and was heavily concentrated in cities. About 60% of 2.8 million new jobs in Ethiopia
created between 2005 and 2011 were in urban areas.60 In that light, it is crucial to manage urban
growth smartly so as to provide even opportunities to urban population.
Cities like Addis Ababa are experiencing rapid urban population growth which If not
managed proactively, may pose a demographic challenge as cities struggle to provide jobs,
infrastructure and services, and housing.61 In case of Addis Ababa, more than 60 percent of the
population survives on informal sector62, and therefore providing means to find an appropriate
employment opportunity could benefit economy through encouraging formal employment.
The component of poverty is integral to the issue of unemployment. Encouraging wage
employment by reducing inefficiencies in hiring and search costs can reduce poverty more than
general policies that encourage self-employment.63 As in the cities, non-farming activities
support major proportion of population, it is important to minimize cost of seeking jobs as well
as hiring employees.
In addition to availability of robust platform for comprehensive job related information,
this intervention can help minimize overall urban unemployment in the country. As frictional
unemployment is difficult to reduce in a dynamic economy, it creates a bar of unemployment
which cannot easily be lowered through structural shift and other modern developments. The
intervention upon its successful establishment could in fact provide inclusivity to the labor
market by providing access to information to the regions which were previously less informed
59 For details on the calculation of the contribution of urban areas to GDP, see the background paper Contribution of Cities to National GDP in Ethiopia by Onur Ozlu and Ana I. Aguilera de Llano 60 Central Statistical Agency of Ethiopia, Ethiopia - National Labour Force Survey 2013, Centeral Statistical Agency - Ministry of Finance and Economic Development, 2014. 61 Ozlu, M. O. et al. 2015. Ethiopia - Urbanization review : urban institutions for a middle-income Ethiopia. Washington, D.C. : World Bank Group. 62 Etana, D., & Tolossa, D. (2017). Unemployment and Food Insecurity in Urban Ethiopia. African Development Review, 29(1), 56-68. 63 Ozlu, M. O. et al. 2015. Ethiopia - Urbanization review : urban institutions for a middle-income Ethiopia. Washington, D.C. : World Bank Group.

33
and lacked resources to learn about suitable job openings. It is a practical tool to promote the
efficient absorption of labor force into formal economic activities.
Another subtle yet significant benefit is that it introduces technology in peripheral urban
regions in less intimidating and more user friendly manner. On an institutional level, data
collected for this intervention can in fact help policy makers to understand finer issues of labor
market through additional efforts like feedback sessions, surveys, group discussions among
others finally contributing to more robust policies.
The long term results could be inter-sectoral as well. Currently, the rate of unemployment
among women is higher than that among the male population in the country across all age
groups.64 Potentially, this intervention can provide physical space and specific assistance to
female job seekers particularly and could expand on specific training as well. As the population
in Ethiopia is young and rising, social awareness and value of equality could be integrated
through various interventions. With the support of multilateral organizations, government, and
other NGOs, a simple kiosk could serve as an important cog in more comprehensive
development efforts in the country.
Lastly, it is likely that countries that resemble Ethiopia in terms of development,
population dynamics, and employment issues could also benefit from such an intervention. With
contextualized design, efficient monitoring, and multi-stakeholder involvement in evaluation of
this intervention, it could potentially become a robust support for the government in fighting
sticky challenges, such as frictional unemployment, in the employment sector.
64 Central Statistical Agency of Ethiopia, Ethiopia - National Labour Force Survey 2013, Centeral Statistical Agency - Ministry of Finance and Economic Development, 2014.
34
Figure 12: Delala Contribution in Mitigating Fictional Unemployment in Addis Ababa Figure 13: Delala Contribution in Mitigating Fictional Unemployment in Addis Ababa

35
6.3 Limitations/Risk Analysis
Below is the list of the 5 main risks that we will face during the development and
implementation of the project:
Table 5: Risks and Coping Strategies
Main Risk of Failure
Mitigation Strategy Residual Risk Mitigation strategy
Budget
The government does not want to collaborate
Identify similar examples. Network adequately with the Labor Minister. Propose a low cost pilot program; and/or look for a private alliance
Due to change in government, ministry loses interest
Continuous engagement with technocrats in the government
0
The program is used only by tech savvy candidates
During feasibility and pilot program try the Kiosk with all the targeted audience
Still scare less tech savvy people.
Institute a feedback system
Cost integrated in design
Theft or boycott of the Kiosk
Generate an alliance with the government and install the Kiosk inside the Ministry of Labor
Theft or boycott still.
Insure the Kiosk
US$300 dollars
Lack of funding due to relatively risky location for investment
Successful Pilot, robust numbers, probably a social survey, involve small investors (not very sure about mitigation strategy)
Power play - might have to satisfy funder’s preferences which might conflict with the overarching objective of the initiative.
Software not robust enough to run adequate algorithms and match potential employees with employers
Adequate tendering and adjudication process
After the first launch the software is not robust enough
Assure to have a continuous improvement clause at least for the first and second phase and assure the entire payment is provided at the END
0

36
Frictional unemployment and underemployment are currently a problem in Addis Ababa.
High transportation costs, time consumed, low internet connectivity rates, mismatch of
information between what is required and what is offered are some of the main causes that generate
high frictional unemployment, especially among youth. This online platform and kiosk are a
solution to the current frictional unemployment and underemployment. The team believes that
through a strategic outreach and user friendly technology, the Kiosk could serve the large, but
marginalized and underserved youth population of Addis Ababa. In the midst of an economic
growth in Ethiopia, the Kiosk will catalyze increased efficiency in the labor market and strengthen
the formal urban economy.
6. Conclusion

37
Bibliography
Abebe, G. et al. (2017). Job Fairs: Matching Firms and Workers in a Field Experiment in
Ethiopia. CSAE Working Paper.
Abebe, G., Caria, S., Fafchamps, M., Falco, P., Franklin, S., & Quinn, S. (2016). Curse of
Anonymity or Tyranny of Distance? The Impacts of Job-Search Support in Urban
Ethiopia (No. w22409). National Bureau of Economic Research.
Aklilu, A. and Teshome, N. (n.d.) Job Search and Graduate Employment in Ethiopia:
Implications for Program Improvement. Addis Ababa University
Austin, J. (2016). 8 Of The Most Expensive African Cities For Public Transportation. Retrieved
July 29, 2017, from http://afkinsider.com/129993/8-expensive-african-cities-public-
transportation/4/
Bezu, S. and Holden, S. (2014). Are Rural Youth in Ethiopia Abandoning Agriculture? World
Development, 64
Central Statistical Agency of Ethiopia. (2014). Ethiopia - National Labor Force Survey 2013,
Central Statistical Agency - Ministry of Finance and Economic Development.
Denu et al. (2007). Characteristics and determinants of youth unemployment, underemployment
and inadequate employment in Ethiopia. Retrieved on July 29, 2017 from
http://www.ilo.org/wcmsp5/groups/public/---ed_emp/---
emp_elm/documents/publication/wcms_114148.pdf
Etana, D., & Tolossa, D. (2017). Unemployment and Food Insecurity in Urban Ethiopia. African
Development Review, 29(1), 56-68.
Franklin, S. (2014). Job Search, Transport Costs and Youth Unemployment Evidence from
Urban Ethiopia.
Gebremariam, E. B. (2017). Addressing the Urban Youth Employment Challenge in Ethiopia.
Institute of Developmet Studies. IDS Policy Briefing Issue 138.
Horton, J. J. (2016). The Effects of Algorithmic Labor Market Recommendations: Evidence
from a Field Experiment. Journal of Labor Economics, 35(2), 345–385.
Kibret, F. D. (2014). Unemployment and Labor Market in Urban Ethiopia: Trends and Current
Conditions. Sociology and Anthropology, 2(6), 207-218.

38
Martins, P. (2014). Structural change in Ethiopia: an employment perspective, Policy Research
Working Paper. World Bank Africa Region.
Moore, T. et al. (2017). Interventions to reduce the impact of unemployment and economic
hardship on mental health in the general population: A systematic review. Psychological
Medicine, 47(6), 1062-1084.
Ozlu, M. O. et al. (2015). Ethiopia - Urbanization review : urban institutions for a middle-income
Ethiopia. Washington, D.C. : World Bank Group.
Pallais, A. (2014). Inefficient Hiring in Entry-Level Labor Markets. American Economic
Review, 104(11), 3565–3599;
United Nations, Department of Economic and Social Affairs, Population Division (2017). World
Population Prospects: The 2017 Revision
World Bank. (2016). “5th Ethiopia Economic Update : Why so Idle? - Wages and Employment
in a Crowded Labor Market : Draft for Public Launch.” The World Bank.
Youth Unemployment Challenge and Solutions: What Business Can Do Now. (2012).
Manpower Group.

39
APPENDIX A
Estimation – Calculation and Sources
Description Population Source
Ethiopian Population 102,403,196 World Bank
Estimated Labor Force 49,975,441 World Bank
Labor Force/Population 49% Calculated
Population of Addis (2013) 3,156,057 2013 National Labor Force Survey
Population Growth in Addis 2.60 World Bank
Estimated Population in Addis (2017) 4,600,000 http://worldpopulationreview.com/countries/ethiopia-
population/
Estimated Addis Labor Force 2,244,920 Calculated; World Bank and National Labor Force Survey
Unemployment rate in Addis 24.2% 2013 National Labor Force Survey
Estimated unemployed Population in Addis 543,271 Calculated
Employed in Addis 1,701,650 Calculated; World Bank and National Labor Force Survey
Estimated Underemployed population 670,409 Calculated; World Bank and National Labor Force
Survey
Potential Market 1,213,680 Calculated
Potential Clients per Machine 10,934 Calculated
Adoption/use rate (target number of users per machine) 364,104 About 30% of potential market
Potential hired 36,410.39
Addis target population % 26.38434016

40
APPENDIX B
Estimation – Project Cash Flow