
The Determinants of Youth Unemployment in Qatar - Topics in ...
34
Topics in Middle Eastern and African Economies Vol. 17, Issue No. 2, May 2015 216 The Determinants of Youth Unemployment in Qatar 1 Edward Sayre 2 , Nada Abdelqader Benmansour 3 , and Samantha Constant 4 Jel Codes: J11, J16, O17 Abstract: While Qatari unemployment is low compared to regional standards, unemployment is even more concentrated among first time job-seeking youth than in other countries in the Arab world. This paper examines the factors that influence unemployment by young Qataris when they are first entering the labor market. This paper first introduces the set of labor market policies that govern the employment of Qatari nationals. Next, the paper examines the labor market outcomes of Qatari youth from 1995 to 2014 to evaluate the effect of these policies. Finally, the paper uses a unique data set of 2,000 primarily young Qataris to model unemployment duration. These data were collected in September and October of 2014 and explore typical labor market indicators as well as questions concerning the school to work transition. Using non-parametric models of unemployment duration, this paper describes the different characteristics that are correlated with longer spells of unemployment duration by first time job seekers. The paper finds that own education and gender are the two most important factors determining the length of unemployment spells for young Qataris. 1 The authors gratefully acknowledge the generous support from the Qatar National Research Foundation who supported this research through NPRP Grant #4-1591-5-240. 2 University of Southern Mississippi and Fikra Research & Policy, contact author [email protected] 3 Fikra Research & Policy 4 Fikra Research & Policy
-
Upload
khangminh22 -
Category
Documents
-
view
0 -
download
0
Transcript of The Determinants of Youth Unemployment in Qatar - Topics in ...

Topics in Middle Eastern and African Economies Vol. 17, Issue No. 2, May 2015
216
The Determinants of Youth Unemployment in Qatar1
Edward Sayre2, Nada Abdelqader Benmansour
3, and Samantha Constant
4
Jel Codes: J11, J16, O17
Abstract: While Qatari unemployment is low compared to regional standards, unemployment is
even more concentrated among first time job-seeking youth than in other countries in the Arab
world. This paper examines the factors that influence unemployment by young Qataris when
they are first entering the labor market. This paper first introduces the set of labor market
policies that govern the employment of Qatari nationals. Next, the paper examines the labor
market outcomes of Qatari youth from 1995 to 2014 to evaluate the effect of these policies.
Finally, the paper uses a unique data set of 2,000 primarily young Qataris to model
unemployment duration. These data were collected in September and October of 2014 and
explore typical labor market indicators as well as questions concerning the school to work
transition. Using non-parametric models of unemployment duration, this paper describes the
different characteristics that are correlated with longer spells of unemployment duration by first
time job seekers. The paper finds that own education and gender are the two most important
factors determining the length of unemployment spells for young Qataris.
1 The authors gratefully acknowledge the generous support from the Qatar National Research Foundation who
supported this research through NPRP Grant #4-1591-5-240. 2 University of Southern Mississippi and Fikra Research & Policy, contact author [email protected]
3 Fikra Research & Policy
4 Fikra Research & Policy

Topics in Middle Eastern and African Economies Vol. 17, Issue No. 2, May 2015
217
1. Introduction
The transition from schooling to work is one of the most difficult periods in the transition
from youth to adulthood. In the Middle East, this transition has been particularly fraught as labor
market structure and the recent youth bulge has caused a large number of young people, often
with advanced degrees to be seeking a relatively small number of jobs. This phenomenon is
manifested in youth unemployment rates that are the highest in the work. Furthermore because of
the relatively strong employment protection offered to workers with jobs, youth unemployment
is often 3 to 4 times that of adult unemployment rates. While the Gulf region, and especially
Qatar has lower unemployment rates, unemployment is primarily a youth phenomenon. This
paper examines the factors that influence unemployment by young Qataris when they are first
entering the labor market.
In order to fully understand this phenomenon, one must place the Qatari experience in its
appropriate policy context. As a labor receiving country, the policy challenge has involved
encouraging young people to get the right types of skills and encouraging private sector
employers to hire them. The policy challenge remains substantial because while governments
can easily prohibit forms of economic activity, it is much more difficult to encourage economic
activity in a given area. Encouraging Qatarization requires that Qataris be willing to work in the
private sector and that private sector manages be willing to hire Qataris under current labor
market conditions. There are both economic and institutional factors that create hurdles in
encouraging private sector employment. Qatarization policies have yet to be able to overcome
these institutional hurdles while some recent policies have actually made Qatarization of the
private sector more difficult.

Topics in Middle Eastern and African Economies Vol. 17, Issue No. 2, May 2015
218
One hurdle arises due to Qatar’s rapid economic growth in the past 15-20 years. With the
economic boom has come a demand for low skilled (expatriate) labor while at the same time,
many Qataris have been able to afford not to work. This is particularly true in the case of Qatari
men over the age of 40 who can begin to retire from public sector jobs and often have alternate
sources of income to supplement their pensions. The second hurdle is that policies to support
Qatari workers in the public sector have actually worked to impede Qatarization in the private
sector. This has been largely due to the more attractive work conditions and prestige associated
with the public sector compared to the private sector. After the fall 2011 Emiri decree of
increasing public sector salaries by 60 percent (120 percent for the military), private sector
businesses will find it even more difficult to attract and retain Qataris. Thus, while the Qatari
government is attempting to localize its workforce, other policy objectives may impede the
success of Qatarization.
The foundation for understanding the current policy environment in Qatar is the Qatar
National Vision 2030 (QNV). This vision influences all aspects of policy currently being
considered in Qatar. The QNV seeks to transform a rapidly growing hydrocarbon-based
economy that is dependent upon less skilled expatriate labor into an economy that seeks most of
its growth through knowledge intensive sectors. This concept of a K-economy for Qatar is based
upon a vision of sustainable growth beyond hydrocarbons. The QNV sets forth three interrelated
goals for the Qatari economy (1) a high standard of living; (2) expanded innovation and
entrepreneurship; and (3) economic outcomes being aligned with economic and financial
security. As part of this effort, the overriding emphasis is to create a diversified K-economy such
that it is not completely beholden to the whims of the international hydrocarbon market. In order
to implement the QNV, the National Development Strategy 2011-2016 sets out more specific

Topics in Middle Eastern and African Economies Vol. 17, Issue No. 2, May 2015
219
action items in order to build towards the QNV goals. The NDS attempts to align expatriate labor
demand with the QNV by attempting to match the size and quality of the expatriate labor force
with the path to development. Specifically, the NDS hopes to move away from low skilled labor
and towards high skilled labor while skill upgrading continues for the Qatari labor force, with a
target Qatarization rate of 15 percent in the private sector. However, with only 16% of Qatar’s
entire labor force being comprised of Qatari nationals, the challenge of meeting this target will
be daunting.
The recent growth of the expatriate population within Qatar has been phenomenal. The
total population of Qatar grew from 490,000 in 1990 (Willoughby, 2004) to 1.7 million in 2010
(QSA, 2010). This population growth primarily happened since 1997 and was largely due to the
growth in the expatriate workforce. The expatriate population more than doubled from 2004 to
2010. This growth in the expatriate population was necessary to fuel the economic growth that
took place, especially due to the booming liquefied natural gas (LNG) sector.
This paper will use a unique data set collected in September and October of 2014 and
explore typical labor market indicators as well as questions concerning the school to work
transition. Using parametric and non-parametric models of unemployment duration, this paper
describes the different characteristics that are correlated with longer spells of unemployment
duration by first time job seekers. The paper finds that own education and parental education are
the two most important factors influencing the school to work transition for young Qataris.
2. Qatari Labor Market conditions
Qatar’s population increased dramatically in the past twenty years. The number of Qatari
nationals increased from 1990 to 2010 from 116 thousand to over 230 thousand, roughly
doubling. The overall population increased even more dramatically as the population of

Topics in Middle Eastern and African Economies Vol. 17, Issue No. 2, May 2015
220
expatriates increased from 305 thousand in 1990 to over 1.4 million in 2010. This was largely as
a response to the aggressive development strategies pursued since 1995 and the need for non-
Qatari labor, especially in the construction sector. As of 2013 the population stood at nearly 2.2
million with less than one seventh of that population native Qatar (Snoj, 2013).
Given these relative numbers it is clearly not possible to exclusively use a domestic labor
force to fill all of these jobs. When individuals discuss Qatarization, even of the private labor
force, they generally do not tend to imply that they expect all of the basic occupations in
construction, domestic service and services to have a certain proportion Qatari. Instead, the
implication is Qatarization of only a certain section of jobs. However, even given this narrower
definition of Qatarization, an examination of other labor market characteristics will shows that
there are weaknesses of the Qatari labor force and areas that could be improved regarding
staffing of private sector and government sector jobs with more Qatari nationals.
By examining the policy settings of Qatar, it will now be possible to interpret the current
labor market conditions and finally analyze the impact that Qatarization policies have on
employment of youth. The first basic labor market statistic to understand is the labor force
participation rate. This rate is defined as the proportion or percentage of the total working age
population which is either currently employed or not employed, but looking for work
(unemployment). Those not in the labor force include retirees, the disabled, students and those
who are fully dedicated to household duties.
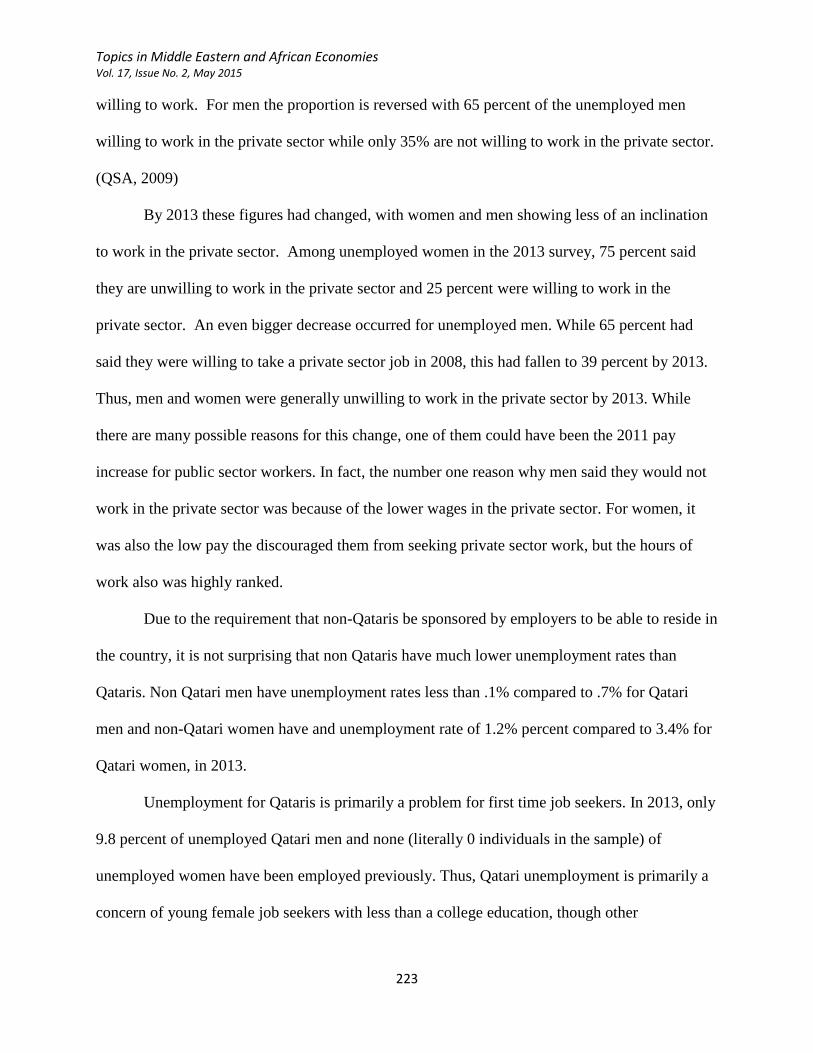
The primary observations of the labor force participation rate can be summed up as
follows. Labor force participation rate among Qatari men is low compared to both developed and
developing countries. The labor force participation rate for women is low compared to most
developed countries, but it is increasing especially compared to fellow GCC countries. In the

Topics in Middle Eastern and African Economies Vol. 17, Issue No. 2, May 2015
221
second quarter of 2014, the labor force participation rate for Qatari men over the age of 15 was
68%; while the rate for women was 36%. In general, there has been an upward trend in labor
force participation for men, as fewer are continuing on with their studies, while women’s labor
force participation has remained roughly the same, around 35% (see Figure 1).
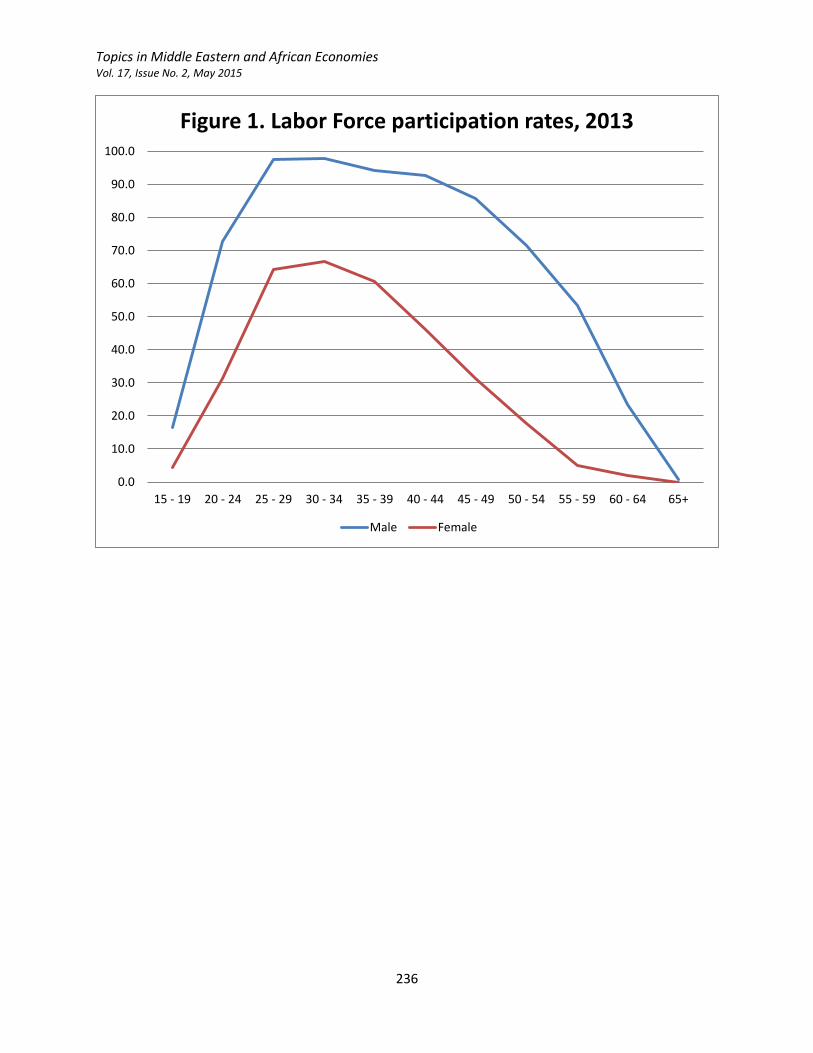
The labor force participation rate for women shows a substantial increase in the past 20
years. This is particularly apparent among women aged 20 to 24 in recent years (see Figure 2).
Figure 3 shows labor force participation of Qatari men, by year and age group. As seen in this
figure, the recent rise in labor force participation has come from several age groups, but the most
dramatic increase was for the group aged 20-24. If these young men were not in the labor force,
then they would like be schooling so the increase in the labor force participation of young men is
actually a negative sign of the movement away from continued schooling (this will be discussed
further below). For women, older, post-schooling age groups have been increasing their
participation in the last couple of years while school aged women have had their labor force
participation or dropping somewhat from 2012 to 2013 (see Figure 4).
Unemployment is fairly low, as one would expect in such a rapidly developing economy,
but it differs significantly by age, gender and educational level. For men, the highest
unemployment rates are for those young men with only secondary schooling or below. For
women, the highest unemployment rate is for those women with university level schooling.
Unemployment is a market failure in that the available positions in the economy are not well
matched with the workers who are willing to take on work, or there is lack of information about
the availability of workers or jobs. However, it is clear that when it comes to matching workers
with jobs, the primary consideration is one of social norms, benefits and expectations.

Topics in Middle Eastern and African Economies Vol. 17, Issue No. 2, May 2015
222
The overall female unemployment rate (3.3 percent) is over four times the male
unemployment rate (0.7 percent). These figures can seem even more dramatic depending on the
age group and year (see Table 1). In the most recent years, unemployment for young women has
been as high as 10 times higher than unemployment for male youth. In 2013, the 20-24 year old
age group, women have a 12.7 percent unemployment rate compared to only a 1.2 percent for
men. By the time these young people reach the 25-29 year old age group, the men’s
unemployment rate drops to a negligible 1.2 percent, and for women the unemployment rate
stays drops to2.5 percent. However, in recent years, when the labor market wasn’t quite so
strong, women’s unemployment rate would stay above 10 percent until women were in their 30s.
The effect of education on unemployment also differs between men and women. For
men, with the exception of illiterate Qatari’s, the higher level of education, the lower the
unemployment rate. For women, there unemployment is highest for those with the lowest level
of schooling (for the purpose of 2013 data, this would be primary level), and then decreases with
education level. Women with only primary schooling have a 23 percent unemployment rate,
those with a preparatory have a 14 percent unemployment rate, but those with university or more
schooling have an unemployment rate under 1 percent. For men, unemployment follows a
similar pattern with those at the secondary level having a slightly higher unemployment rate than
those at the preparatory level (.8 percent compared to .7 percent), but the highest unemployment
is with primary level (2.5 percent) and the lowest is with university or above .3 percent.
One of the telling aspects of the issue of unemployment involves the fact that many of the
unemployed are waiting for jobs in the public sector. In the 2008 labor force survey one half of
all unemployed Qataris responded that they were not willing to work in the private sector. For
women the proportion not willing to work in the private sector is 64 percent with only 36 percent
Topics in Middle Eastern and African Economies Vol. 17, Issue No. 2, May 2015
223
willing to work. For men the proportion is reversed with 65 percent of the unemployed men
willing to work in the private sector while only 35% are not willing to work in the private sector.
(QSA, 2009)
By 2013 these figures had changed, with women and men showing less of an inclination
to work in the private sector. Among unemployed women in the 2013 survey, 75 percent said
they are unwilling to work in the private sector and 25 percent were willing to work in the
private sector. An even bigger decrease occurred for unemployed men. While 65 percent had
said they were willing to take a private sector job in 2008, this had fallen to 39 percent by 2013.
Thus, men and women were generally unwilling to work in the private sector by 2013. While
there are many possible reasons for this change, one of them could have been the 2011 pay
increase for public sector workers. In fact, the number one reason why men said they would not
work in the private sector was because of the lower wages in the private sector. For women, it
was also the low pay the discouraged them from seeking private sector work, but the hours of
work also was highly ranked.
Due to the requirement that non-Qataris be sponsored by employers to be able to reside in
the country, it is not surprising that non Qataris have much lower unemployment rates than
Qataris. Non Qatari men have unemployment rates less than .1% compared to .7% for Qatari
men and non-Qatari women have and unemployment rate of 1.2% percent compared to 3.4% for
Qatari women, in 2013.
Unemployment for Qataris is primarily a problem for first time job seekers. In 2013, only
9.8 percent of unemployed Qatari men and none (literally 0 individuals in the sample) of
unemployed women have been employed previously. Thus, Qatari unemployment is primarily a
concern of young female job seekers with less than a college education, though other

Topics in Middle Eastern and African Economies Vol. 17, Issue No. 2, May 2015
224
demographic groups still exhibit significant numbers of unemployed. Finally, it should be noted
that although the overall unemployment rates are much higher for women, the total number of
unemployed are not as dramatically different, due to differences in participation rates. For the
2013 survey, the estimate is only 1,029 Qatari women were unemployed and 400 Qatari men
were unemployed.
3. Has Qatarization been successful?
While there are no clear guidelines as to what will ultimately define successful
Qatarization efforts, an analysis of the extant data will allow us to get a better understanding as
to how much progress has been made. In order to understand where these Qatarization efforts
stand, this paper will examine the distribution of employment by industry and nationality, the
changes over time in the distribution by sector and the degree to which Qataris are engaging in
both employment and schooling.
The distribution of employment by industry, gender and nationality is seen in Table 2.
While the public administration workforce is comprised of more than 50 percent Qatari
nationals, most other major industries have less than 10 percent of their total workforce made up
of Qatari nationals. For example, construction, which employs more than half a million workers,
has less than one fourth of one percent of its workface made up of native Qataris. Education is
another field that employs a large share of Qatari nationals. Thirty percent of total education
employment are Qatari nationals and 84 percent of these Qataris are women.
Table 2 shows that the percentage of those employed who are Qatari definitely differs
based upon gender. For men, 48 percent of the 80,000 men who work in public administration

Topics in Middle Eastern and African Economies Vol. 17, Issue No. 2, May 2015
225
and defense are Qatari. For women the number is even more striking as 71 percent of the women
who work in this sector are Qatari. Another sector where there is a strong difference between
men and women is education. While only 13 percent of the 13,000 men who work in education
are Qatari, Qatari women comprise a total of 36 percent of the 26,000 women in this sector.
Other fields that are predominantly Qatari include mining and quarrying where 9 percent of the
men are Qatari and 32 percent of the women are Qatari. Both health and information technology
sectors are ones that should be expected to grow given the QNV 2030 and given the proportion
of Qatari employment, this is a promising development. In the health sector 11 percent of the
13,000 men who work in this sector are Qatari and 24 percent of the 14,000 women who work in
this sector are Qatari. Of the women engaged in professional and scientific activities, 11 are
Qatari, while of the men only one percent are Qatari, which may reflect the relative increase in
the greater numbers of Qatari women pursuing advanced degrees compared to men.
There are two things that must take place for the proportion of Qataris in private and
mixed sectors to increase. First, more Qataris must enter the work force and stay in it longer to
meet the market demand for these workers. Second, incentives must be such that the private and
mixed sectors will hire more Qataris and more Qataris must be willing to their supply of labor to
these sectors.
One statistic that will help assess the degree to which Qataris are more engaged in the
labor force is the labor force participation rate. However, it is also useful to note that in addition
to encouraging more Qataris to work, there has also been educational reform which has
encouraged them to stay in school for longer and to obtain tertiary education. One of the effects
of encouraging students to stay in school is that there will be lower labor force participation rates
for especially those aged 20-24 as they are not leaving school after the secondary level to pursue

Topics in Middle Eastern and African Economies Vol. 17, Issue No. 2, May 2015
226
work. Thus, there are two statistics that I will refer to below. The first is labor force participation
rate of those aged 25 to 39, who are less likely to be affected by efforts to increase the level of
schooling. The second is the proportion of the population that is engaged in either schooling or
work. This is the work+schooling rate is 84.5% for men and 58.1% for women in 2009. In 2007,
the work+school rate was 85.0% for men and 55.5% for women. Women increased the
proportion that they were both in the workforce and in schooling during these two years.
Looking back a bit earlier, they work+schooling rate in 2001 for men was 81% while the
work+schooling rate for Qatari women was 50%. Thus, there has been an eight percentage point
increase in this more broadly defined version of economic activity for women. Since 2009, the
rate has remained flat. In second quarter of 2014, the work+schooling rate for women was up to
58% and for men it stood at 86%.
The source for the change for women has been entirely due to the increase in the
employment to population rate for women. In 2001, employment rate for women was only 21.4
percent. This figure grew to 32.6 percent in 2005 and 34.7 percent in 2009 and stayed nearly
steady at 33.9 in 2014. From 2005 to 2009, the proportion of women going to school decreased
during this time, but the overall growth in employment made up for this. Thus, the decline in
schooling is not because women are not achieving the same level of education as education rates
are increasing. Instead, there are relatively smaller cohorts of women in school at any time
(compared to those who have finished schooling), while the absolute numbers continue to grow.
Based upon the 20 percent goal in all sectors (government, government company, mixed
and private) Qatarization targets were met early on in the public sector. In 1997, the quantitative
target was to reach 20 percent in 4 years. Most, if not all, public sector authorities met this target.
In 1999, for example, figures and statistics show that Qatarization in the public administration

Topics in Middle Eastern and African Economies Vol. 17, Issue No. 2, May 2015
227
was 60 percent, in government corporations it was 27 percent, and in the mixed sector it was 18
percent. Thus, Qatarization in most organizations was actually above the stated target. However,
more recent data show that since the economic boom during the 2000s, there has such rapid
expansion of the Qatari economy and the labor force that the percentage Qatari in each sector has
dropped since 1999. Figure 5 shows the relative distribution of Labor Force between Qataris and
Non-Qataris by sector in 2013 (QSA, 2014). As seen in this figure, Qataris now make up less
than 50 percent of the government sector workers. In government companies the percentage is
less than 20 percent and in the private sector, the Qatari share of employment is less than only .1
percent. Finally, Oil and Gas Sector (OGS) also promoted a separate Qatarization policy that has
been met with some success. While the overall goal has had to be revised downward, this sector
has increased the overall Qatari share since the 1980s from 30 percent to 50 percent today.
While the overall percentage of Qataris in any sector is going to be negatively affected by
the dramatic expansion of the economic in the past 10 years, there can be some indication of the
success of Qatarization based upon the sector of employment. If Qataris are becoming less
dependent upon the public sector, either public administration or public companies, then some of
the goals of Qatarization can be seen as being met. Figures 6 and 7 show the percentage of
Qataris in employment by sector for men (Figure 6) and women (Figure 7) from 2006 to 2013.
As seen in Figure 6, there has been a decline in the share of Qatari employment for men in
government companies and a rise in the share in the private sector. In government companies
while 16 percent of Qatari men worked in this sector in 2006, the figure has fallen to 13 percent
in the more recent data. In the private sector, while only 6 percent of Qatari men worked in this
sector in 2006, this figure has now increased to nearly double at 11 percent. While the change in

Topics in Middle Eastern and African Economies Vol. 17, Issue No. 2, May 2015
228
distribution is important, it is also worthwhile to note that this represents nearly a trebling of the
total number of Qatari men in the private sector from 2400 to 6500.
Table 5 shows the economic status by age from the 2010 Qatari Census for all employed
Qataris (men and women). It is clear from looking at these figures that the proportion of the
workforce that are either on their own account or are employers is very low in the Qatari
economy. This is not a surprise given the relatively few individuals that are employed in the
private sector, where most of the employers will be located. In 2010 fewer than 2 percent of
employed youth were either on their own or employed others. The highest rate of
entrepreneurship was actually among 15-19 year olds of whom 2.3 percent were employers or on
their own account. These rates stay very low until Qataris reach their 40s. It is likely when they
retire from public sector jobs in their 40s, many Qataris then decide to begin a second career as
an employer.
4. Qatarization efforts, youth and families
The efforts to increase the proportion Qataris working in the Qatari economy can only
come about through a combination of some or all of the following factors. First, the overall
demand for labor, especially unskilled labor, will need to decrease. Given the relative size of the
Qatari population, an increase in unskilled labor demand will continue to create strong demand
for expatriate labor.
Second, there will need to be an increase in labor force participation for Qataris in their
40s and 50s. As there is an increase in health outcomes and educational levels, the movement to
a K-economy should promote the ability of Qatari men to stay in the workforce later, instead of
labor force participation decreasing around the age of 40.

Topics in Middle Eastern and African Economies Vol. 17, Issue No. 2, May 2015
229
Third, there will need to be an increase in labor force participation of Qatari women.
Right now, the labor force participation rate of Qatari women at 36 percent reflects important
growth in this aspect of Qatarization. However, compared to the most highly developed
countries, this participation rate still lags behind the natural peers that Qatar should aspire to
compare itself with. Furthermore, since employment of Qatari women is largely found in the
education and public administration sectors and there is a relatively large unemployment rate for
women who cannot find jobs in these sectors, there appears to be an imbalance in the matching
job seekers and job opportunities. The essence of this problem lies in the social norms that attract
women primarily to government sector jobs and the relatively unattractive nature of private
sector jobs. Of unemployed women surveyed less than half said that they would be interested in
a private sector job.
Fourth, there needs to be an overall increase in Qatari population. The Qatari government
has explicitly begun a pro-natalist policy in order to effect this increase in Qatari population, thus
leading to needing fewer expatriate workers in the future due to a relatively largely domestic
population. However, this effort to increase population growth rates will negatively impact
Qatari women’s ability to participate in the labor force and thus works against another factor to
increase Qatarization.
5. Unemployment Duration during the school to work transition
Data
Data for the following section comes from the 2014 Global Entrepreneurship Monitor (GEM)
data for Qatar. The GEM was started as a joint venture with the London Business School and
Babson College in 1999 and now covers countries entailing 75% of the world’s population and
90% of the world’s GDP. Silatech is the local partner for 2014 GEM Qatar. The current data

Topics in Middle Eastern and African Economies Vol. 17, Issue No. 2, May 2015
230
come from a module within GEM Qatar that was created to study the school to work transition
for young Qatari’s through a partnership between Silatech and FIKRA Research & Policy. The
survey was conducted August-October 2014 and released to partner organizations in December
2014.
This data set contains 2,025 Qataris and 2,235 non-Qataris. This analysis will focus on
the Qatari sample which is relatively well educated: 17% have less than secondary schooling;
40% have secondary and 34% have tertiary schooling. The bulk of the survey is between 18 and
34 years old. 23 % are 18-24 years old; 30% are 25-34 while 40% are between 35 and 54. The
sample is slightly more female than male, representing the greater likelihood for Qatari males to
be abroad: 52 % are female and 48% are male.
Figure 8 shows unemployment duration through a Kaplan Meier survival function. The y
axis shows the proportion of the population that has “survived” in the base state, which in this
case is to be unemployed (seeking work). The x axis is the months that the individual has been
seeking work without finding a job. Figure 8 shows that non-Qataris are more likely to exit
unemployment after finishing schooling than are Qataris. It takes approximately 4 months longer
for three quarters of Qataris to find a job compared to non-Qataris. The rest of the figures will
only examine the Qatari portion of sample and will look at various subgroups.
Figure 9 shows unemployment duration by sex. Male exit unemployment more rapidly
than women, but this mostly shows up in the amount of time it takes the very slowest job finders
take. For example, approximately 50 percent of both men and women find work within 4-5
months. However for men 75% percent of them have found a job within 6 months, but it takes 6
months longer for 75 percent of women to find work (a full 12 months).

Topics in Middle Eastern and African Economies Vol. 17, Issue No. 2, May 2015
231
By age (Figure 10) and education (Figure 11), a few clear patterns emerge. First, note that
while Figure 10 shows the findings by age group, since this is retrospective data about their
transition from schooling to work, the transition for older workers took place many years before
the transition for younger workers. The very youngest workers in the sample (18-24) and
workers over 45 have the shortest unemployment durations. This may reflect the relatively small
size of the employment cohort for older workers by which the public sector easily absorbed
workers going back 20 years or more and that fewer women participated in the labor force in
previous years. The youngest workers having short duration might be a selection issue by which
only those who do not going on to tertiary schooling (because they have access to a job already)
are in this pool.
Figure 11 shows the impact of education independently on unemployment duration. The
four education groups shown in this figure are less than secondary; secondary; diploma (or 13-15
years) and university. In the figure that includes both men and women (Figure 11), we see that
less than secondary and secondary have longer spells of unemployment after finishing schooling
than do those Qataris that earn either a diploma or a university degree. Getting a university
degree only tends to cut unemployment duration slightly when looking at this pooled data. Even
more of an issue, those that complete a secondary degree have longer durations on the right hand
tail (last 25% to find a job) than those who have less than secondary degree. Since most young
people nowadays have at least a secondary degree, this may represent some pooling over
generations.
Figures 12 and 13 attempt to examine the independent impact of education separately for
men and women. Figure 12 shows that for men each level of education decreases the duration of
unemployment, though often the differences are minor. For men with both tertiary forms of

Topics in Middle Eastern and African Economies Vol. 17, Issue No. 2, May 2015
232
schooling (diploma and university) about 75% of young people find jobs within 6 months. It
takes an additional 3 months for 75% of those with secondary degrees to find a job and another
month longer for 75% of those with less than a secondary to find work. For women, the story is
more diverse. While 75% of women with a university degree find work within 6 months, it takes
nearly a year for 75% of those with only a diploma to find work. For those with only a secondary
degree, it takes nearly two years for them to find a job after finishing schooling. Thus, for
women there is a real return to going to university since tertiary education leads to significantly
shorter unemployment duration.
6. Conclusions
The policy problem created by the large expatriate population in Qatar today is
multifaceted. It is impossible to continue to develop at the rate that they have been without
continued reliance on workers from abroad. However, with a redirection of the economy away
from such a heavy dependence on the hydrocarbon sector and towards a knowledge-based
economy, there is the possibility of effective Qatarization.
Unfortunately, most of the success of Qatarization has taken place within the government
sector. This is largely due to the increase in employment of Qatari women and the increased
educational levels of all Qataris leading to the greater use of high skilled domestic labor instead
of foreign labor. However, the stigma against working in the private sector remains and the only
serious attempts increase the demand for Qatari labor in the private sector and increase the
supply of labor to that sector will take the place of making both Qatari and non-Qatari labor

Topics in Middle Eastern and African Economies Vol. 17, Issue No. 2, May 2015
233
more expensive. Non-Qatari labor needs to become more expensive (it is argued) because the
low wages that can be offered leads to expansion in sectors that are low skilled intensive.
On the other hand, it is argued that private sector jobs should become more expensive to
employers is justified due the need to make these jobs more attractive to Qataris by offering
benefits and wages that are equivalent to those found in the public sector.
However, what is keeping Qataris out of the private sector is as much a matter of social
norms and cultural values as it is about riyals and benefits. For example the low labor force
participation rate of Qatari women is one factor that increases the need for expatriate labor. If
women worked as much as men, there would be 20,000 fewer expatriates needed in the
workforce. However, it is seen as by some in Qatar to be prestigious to have women not work
outside the home (GSDP Labor, 2010). Without the need for a second income due to the
relatively high wages for Qatari men, the only thing that will push women into the workforce is
social norms and cultural values that view working outside the home as something prestigious or
aspirational. With role models such as Her Highness SHeikha Mozah Bint Nasser Al-Misnad,
and countless women holding high level positions throughout the workforce, there is likely to be
increased acceptance and willingness to work outside the home (Felder and Vuollo, 2008).
However, employer attitudes towards women still need to be improved because certain positions
are seen as not appropriate because women ask for too much time off for family reasons (Stasz,
Eide, and Martorell, 2007).
Likewise, Qatari men also show a strong preference to working in the public sector, even
though it is not as strong of a preference as that shown by Qatari women. There is relatively
little labor force attachment for non-pecuniary reasons and as soon as Qatari men can afford to
retire due to generous pension plans, end of service payments and non-labor income, they choose

Topics in Middle Eastern and African Economies Vol. 17, Issue No. 2, May 2015
234
to do so. Keeping these men in the workforce after they can afford to retire will take a change in
social norms and culture as much as any economic incentives that may be offered.
In terms of unemployment determination, men and women have very different
experiences. While 50 percent of men find employment within 3 months, it takes 50% of women
4 months to find a job. Also, while younger cohorts have slightly shorter spells than older
cohorts, the pattern is not clear and could be tied to generational issues related to education and
gender as much as other patterns. Finally, education has a different impact for men and women.
While a university degree or diploma for men leads to 50% finding jobs in 3-4 months, it takes
less than secondary 5 months for 50% to find a job. For university and diploma educated men
75% find jobs within 6 months; it takes 9 months of secondary educated to reach this milestone.
For women, there is a bigger return for the university degree. While 75% of women with a
university degree have found a job within 6 months (same as men), for women with only a
secondary degree it takes 24 months for 75% of them to end their unemployment spells.

Topics in Middle Eastern and African Economies Vol. 17, Issue No. 2, May 2015
235
References
Felder, Dell and Mirka Vuollo (2008). “Qatari Women in the Workforce” Rand-Qatar Policy Institute
Working paper WR 612 Qatar.
Facing Human Capital Challenges of the 21st Century, Rand-Qatar Policy Institute Working paper WR 612
Qatar.
“QIB wins award for Qatarization policy” Qatar Tribune, November 22, 2010. Page 18.
Berrebi, Claude, Francisco Martorell and Jeffery C. Tanner (2009) “Qatar’s Labor Markets at a Crucial
Crossword” The Middle East Journal 63 (3): pp. 421-442.
Ibrahim, Ibrahim and Frank Harrigan. 2012. “Qatar’s Economy: Past, Present, and Future.” QScience
Connect 2012 (9). http://dx.doi.org/10.5339/connect.2012.9
“Strategic Qatarization Plan” http://www.qatarization.com.qa last accessed November 17, 2014
Qatar: Human and Social Development Profile Situation and Prospects, Department of Social
Development, General Secretariat for Development Planning, 16 April 2010
Population, Labour Force and Qatari Employment Sector Strategy: Phase 1 Situation Analysis,
Benchmarking and Policy Gaps, National Development Strategy 12 July 2010.
Keller, Jennifer and Mustapha K. Nabli. “The Macroeconomics of Labor Market Outcomes in MENA over
the 1990s: How Growth has Failed to Keep Pace with a Burgeoning Labor Market” June 2002. IMF
Working paper.
Snoj, Jure. “Population of Qatar.” BQ Doha December 12, 2013
http://www.bqdoha.com/2013/12/population-qatar last accessed November 20, 2014
Topics in Middle Eastern and African Economies Vol. 17, Issue No. 2, May 2015
236
0.0
10.0
20.0
30.0
40.0
50.0
60.0
70.0
80.0
90.0
100.0
15 - 19 20 - 24 25 - 29 30 - 34 35 - 39 40 - 44 45 - 49 50 - 54 55 - 59 60 - 64 65+
Figure 1. Labor Force participation rates, 2013
Male Female
Topics in Middle Eastern and African Economies Vol. 17, Issue No. 2, May 2015
237
0.0
10.0
20.0
30.0
40.0
50.0
60.0
70.0
80.0
90.0
100.0
2007 2008 2009 2011 2012 2013
Figure 2. Female Labor Force Participation by year
15 - 19 20 - 24 25 - 29 30 - 34 35 - 39

Topics in Middle Eastern and African Economies Vol. 17, Issue No. 2, May 2015
238
0.0
10.0
20.0
30.0
40.0
50.0
60.0
70.0
80.0
90.0
100.0
2007 2008 2009 2011 2012 2013
Figure 3. Male Labor Force Participation, by year
15 - 19 20 - 24 25 - 29 30 - 34 35 - 39

Topics in Middle Eastern and African Economies Vol. 17, Issue No. 2, May 2015
239
0.0
10.0
20.0
30.0
40.0
50.0
60.0
70.0
80.0
2007 2008 2009 2011 2012 2013
Figure 4. Female Labor Force Participation by Year and Age Group
15 - 19 20 - 24 25 - 29 30 - 34 35 - 39

Topics in Middle Eastern and African Economies Vol. 17, Issue No. 2, May 2015
240
0%
10%
20%
30%
40%
50%
60%
70%
80%
90%
100%
Government Department Government Company/Corporation
Mixed Private
Figure 5. Male Employment by Sector and Nationality, 2013
Qatari Non-Qatari

Topics in Middle Eastern and African Economies Vol. 17, Issue No. 2, May 2015
241
0%
10%
20%
30%
40%
50%
60%
70%
80%
90%
100%
2006 2007 2008 2009 2011 2012 2013
Figure 6. Employment Share of Qatari Men, by sector and year
Private
Mixed
Gov Company
Gov Administration

Topics in Middle Eastern and African Economies Vol. 17, Issue No. 2, May 2015
242
0%
10%
20%
30%
40%
50%
60%
70%
80%
90%
100%
2006 2007 2008 2009 2010 2011 2012 2013
Figure 7. Employment share of Qatari women, by sector and year
Government Gov Company Mixed Private

Topics in Middle Eastern and African Economies Vol. 17, Issue No. 2, May 2015
243
Figure 8 . Unemployment duration by nationality

Topics in Middle Eastern and African Economies Vol. 17, Issue No. 2, May 2015
244
Figure 9. Unemployment duration by sex

Topics in Middle Eastern and African Economies Vol. 17, Issue No. 2, May 2015
245
Figure 10. Unemployment duration by age

Topics in Middle Eastern and African Economies Vol. 17, Issue No. 2, May 2015
246
Figure 11. Unemployment duration by education

Topics in Middle Eastern and African Economies Vol. 17, Issue No. 2, May 2015
247
Figure 12. Unemployment Duration Male by Education

Topics in Middle Eastern and African Economies Vol. 17, Issue No. 2, May 2015
248
Figure 13. Unemployment Duration: Female by Education

Topics in Middle Eastern and African Economies Vol. 17, Issue No. 2, May 2015
249
Table 1. Unemployment rates by nationality, gender and year, 2007-
2013 (percent)
2007 2008 2009 2011 2012 2013
Qatari male youth (15-24) 4.6 3.8 4.5 2.4 3.2 1.1
Qatari female youth (15-24) 20.4 11.5 10.9 17.1 18.6 12.3
Qatari male total (15+) 1.7 1.6 1.6 1.7 1.3 0.7
Qatari female total (15+) 6 3.7 3.4 8 6.4 3.3
Non-Qatari male total (15+) 0.13 0.1 0.1 0.1 0.1 0.1
Non-Qatari female total (15+) 1.7 1.2 1.5 2.4 2.1 1.2
Qatari Non-Qatari
Males Females Total Males Females Total
Construction 1026 288 1314 564312 3050 567362
Wholesale and retail trade
1144 343 1487 185834 6763 192597
Manufacturing 1238 137 1375 117222 855 118077
Public administration and defense;
38215 10776 48991 42521 4260 46781
Mining and quarrying
7557 1054 8611 84620 2177 86797
Administrative and support service activities
333 643 976 43619 3341 46960
Transportation and storage
1384 238 1622 37287 6029 43316
Education 1779 9347 11126 11644 16920 28564
Accommodation and food service activities
444 326 770 34769 3369 38138
Professional, scientific and technical activities
277 189 466 26495 1598 28093
Human health and social work activities
1419 3550 4969 11518 11356 22874


![The burden of unemployment [microform] : a study of unemployment ...](https://static.fdokumen.com/doc/165x107/631a7ae70255356abc08b300/the-burden-of-unemployment-microform-a-study-of-unemployment-.jpg)