Production and Characterization of Rice Husk Biochar and ...
Upload
khangminh22Category
view
0download
0
PRODUCTION, UTILIZATION, CHARACTERIZATION
AND ANTIMICROBIAL ACTIVITY OF TAMARIND
(Tamarindus indica) ACCESSIONS FROM SEMI-ARID
EASTERN KENYA
MERCY LIHARAKA KIDAHA
DOCTOR OF PHILOSOPHY
(Horticulture)
JOMO KENYATTA UNIVERSITY OF
AGRICULTURE AND TECHNOLOGY
2022

Production, Utilization, Characterization and Antimicrobial Activity of
Tamarind (Tamarindus Indica) Accessions from Semi-Arid Eastern
Kenya
Mercy Liharaka Kidaha
A Thesis Submitted in Partial Fulfilment of the Requirements for The
Degree of Doctor of Philosophy in Horticulture of the Jomo Kenyatta
University of Agriculture and Technology
2022

ii
DECLARATION
This thesis is my original work and has not been presented for a degree in any other
university.
Signature: ………………………………………Date: …………………….
Mercy Liharaka Kidaha
This thesis has been submitted for examination with our approval as university
supervisors.
Signature: ……………………………………………Date: ………………………
Prof. Fredah K. Rimberia Wanzala
JKUAT, Kenya
Signature: ………………………………………….…Date: …………………........
Dr. Remmy Kasili Wekesa
JKUAT, Kenya
Signature ……………………………………………...Date………………………
Prof. Wariara Kariuki
SCOTT Christian University, Kenya

iii
DEDICATION
This thesis is dedicated to my dad, Albert Kidaha Govoga for the encouragement to
work hard and be different and to my mother Sarah Munga, for pushing me to
accomplish what she did not. May God give them fruitful long lives!!

iv
ACKNOWLEDGEMENT
I wish to express my profound gratitude to my supervisors Prof. Fredah K. Rimberia
Wanzala, Dr Remmy Kasili Wekesa and Prof. Wariara Kariuki for their great support,
guidance and encouragement during the entire study period. I wish to thank the Institute
for Biotechnology Research staff and the Department of Horticulture and Food Security,
JKUAT, particularly Prof. Turoop Losenge and Prof. Aggrey Nyende. I wish to
appreciate DAAD for sponsoring my PhD program and JKUAT for giving me ample
time to study. I thank Dr. Grace Wacheke, Dr. Dadjo Columbe, Mr. Samuel Mwaura,
Mr. Richard Rotich whose advice was helpful in molecular work. I wish to appreciate
my beloved family and friends for their love and constant encouragement, as well as
advice throughout this work. Above all, I give thanks to God Almighty for His grace,
uncountable blessings, strength, love and energy which made this research possible.

v
TABLE OF CONTENTS
DECLARATION ............................................................................................................. II
DEDICATION ............................................................................................................... III
ACKNOWLEDGEMENT ............................................................................................ IV
TABLE OF CONTENTS ................................................................................................ V
LIST OF TABLES ....................................................................................................... XII
LIST OF FIGURES ................................................................................................... XVI
LIST OF PLATES .................................................................................................. XVIII
LIST OF APPENDICES ............................................................................................. XX
ACRONYMS AND ABBREVIATIONS ................................................................. XXII
ABSTRACT ............................................................................................................. XXIII
CHAPTER ONE .............................................................................................................. 1
GENERAL INTRODUCTION ....................................................................................... 1
1.1 Background of the study ........................................................................................................... 1
1.1.1 Morphological description ................................................................................ 3
1.1.2 Importance of tamarind ..................................................................................... 4
1.1.3 World production and utilization ...................................................................... 5

vi
1.1.4 Molecular markers ............................................................................................ 6
1.1.5 Antimicrobial activity ....................................................................................... 7
1.2 Statement of the problem ......................................................................................... 8
1.3 Justification .............................................................................................................. 9
1.4 Objectives ............................................................................................................... 11
1.4.1 General objective ............................................................................................ 11
1.4.2 Specific Objectives.......................................................................................... 11
1.5 Null hypotheses (H0)………………………………………………………………..11
CHAPTER TWO ........................................................................................................... 13
LITERATURE REVIEW .............................................................................................. 13
2.1 Origin and taxonomy of tamarind .......................................................................... 13
2.2 Utilization of tamarind ........................................................................................... 14
2.3 Morphological characterization of tamarind .......................................................... 15
2.4 Molecular characterization of tamarind ................................................................. 16
2.5 Antimicrobial compounds of tamarind .................................................................. 18
2.5.1 Bacteria pathogens .......................................................................................... 20
2.5.2 Control of bacterial pathogens ........................................................................ 21
2.5.3 Control of plant fungal pathogens ................................................................... 22
CHAPTER THREE ....................................................................................................... 25
GENERAL MATERIALS AND METHODS .............................................................. 25

vii
3.1 Description of the study area.................................................................................. 25
3.2 Sampling ................................................................................................................ 27
3.3 Labelling of samples .............................................................................................. 27
3.4 Evaluation of tamarind production and utilization................................................. 28
3.5 Morphological characterization of tamarind .......................................................... 28
3.6 Molecular characterization of tamarind ................................................................. 28
3.7 Antimicrobial evaluation of tamarind .................................................................... 29
CHAPTER FOUR .......................................................................................................... 30
EVALUATION OF TAMARIND (Tamarindus indica) PRODUCTION AND
UTILIZATION IN SEMI-ARID EASTERN KENYA ............................................... 30
Abstract ........................................................................................................................ 30
4.1 Introduction ............................................................................................................ 31
4.2 Materials and methods ........................................................................................... 33
4.2.1 Survey data collection ..................................................................................... 33
4.2.2 Data analysis ................................................................................................... 33
4.3 Results ........................................................................................................................................... 34
4.3.1 Social characteristics of tamarind respondents ............................................... 34
4.3.2 Crops intercropped with tamarind in semi-arid Eastern Kenya ...................... 34
4.3.3 Production of tamarind in semi-arid Eastern Kenya ....................................... 35

viii
4.3.4 Land preparation methods and crop management practices of tamarind in
semi-arid Eastern Kenya .......................................................................................... 37
4.3.5 Maturity and harvesting of tamarind in semi-arid Eastern Kenya .................. 39
4.3.7 Utilization of tamarind fruit and tree in semi-arid Eastern Kenya .................. 42
4.3.8 Constraints in tamarind production in semi-arid Eastern Kenya. ................... 44
4.4 Discussion .............................................................................................................. 44
4.5 Conclusion ............................................................................................................. 48
4.6 Recommendation.................................................................................................... 48
CHAPTER FIVE ............................................................................................................ 49
EVALUATION OF MORPHOLOGICAL DIVERSITY OF TAMARIND
(Tamarindus indica) ACCESSIONS IN SEMI-ARID EASTERN KENYA ............. 49
Abstract ........................................................................................................................ 49
5.1 Introduction ............................................................................................................ 50
5.2 Materials and methods ........................................................................................... 51
5.2.1 Sampling ......................................................................................................... 51
5.2.2 Morphological characterization of tamarind ................................................... 51
5.2.3 Data collection and analysis ............................................................................ 52
5.3 Results ............................................................................................................................................ 53
5.3.1 Quantitative morphological results for tamarind in semi-arid Eastern Kenya 53
5.3.2 Qualitative morphological results for tamarind in semi-arid Eastern Kenya. . 55
ix
5.3.3 Principal component analysis of tamarind using quantitative traits ................ 58
5.3.4 Cluster analysis of tamarind using Agglomerative Hierarchal clustering
(AHC) ....................................................................................................................... 61
5.4 Discussion .............................................................................................................. 63
5.5 Conclusion ............................................................................................................. 65
5.6 Recommendation.................................................................................................... 66
CHAPTER SIX .............................................................................................................. 67
EVALUATION OF GENETIC DIVERSITY OF TAMARIND (Tamarindus indica)
ACCESSIONS IN SEMI-ARID EASTERN KENYA USING ISSR MARKERS .... 67
Abstract ........................................................................................................................ 67
6.1 Introduction ............................................................................................................ 68
6.2 Materials and methods ........................................................................................... 69
6.2.1 Sample preparation.......................................................................................... 69
6.2.2 DNA extraction ............................................................................................... 69
6.2.3 PCR reaction ................................................................................................... 70
6.2.4 Data analysis ................................................................................................... 71
6. 3 Results ........................................................................................................................................... 72
6.3.1 Selection of polymorphic primers from candidate ISSR primers ................... 72
6.3.2 Level of polymorphism in tamarind using ISSR markers ............................... 73

x
6.3.3 Analysis of molecular variance (AMOVA) in tamarind accessions from semi-
arid Eastern Kenya ................................................................................................... 84
6.3.5 Cluster analysis of tamarind accessions from semi-arid Eastern Kenya......... 85
6.4 Discussion .............................................................................................................. 86
6.5 Conclusion ............................................................................................................. 88
6.6 Recommendation ....................................................................................................................... 88
CHAPTER SEVEN ........................................................................................................ 89
EVALUATION OF ANTI-MICROBIAL ACTIVITY OF EXTRACTS FROM
TAMARIND (Tamarindus indica) IN SEMI-ARID EASTERN KENYA AGAINST
BACTERIA AND PLANT FUNGAL PATHOGENS. ............................................... 89
Abstract ........................................................................................................................ 89
7.1 Introduction ............................................................................................................ 90
7.2 Materials and methods ........................................................................................... 93
7.2.1 Sample preparation.......................................................................................... 93
7.2.2 Extraction of anti-microbial compounds ......................................................... 93
7.2.3 Pathogen for the study ..................................................................................... 93
7.2.4 Pathogen inoculation ....................................................................................... 94
7.2.5 Data collection and analysis ............................................................................ 94
7.3 Results ..................................................................................................................... 95

xi
7.3.1 Inhibition of Bacillus subtilis by tamarind extracts from semi-arid Eastern
Kenya ....................................................................................................................... 96
7.3.2 Inhibition of P. aeruginosa by tamarind extracts from semi-arid Eastern
Kenya ..................................................................................................................... 102
7.3.3 Inhibition activity of tamarind extracts from Kitui, Mwingi, Embu, Kibwezi
and Masinga), solvents (Water and methanol) and plant parts (leaves and fruits) 107
7.4 DISCUSSION ........................................................................................................................................ 107
7.4.1 Inhibition of bacteria (B. subtilis, S. aureus, E. coli, P. aeruginosa) by
tamarind extracts .................................................................................................... 107
7.4.2 Inhibition of plant fungal pathogens (P. digitatum, C. gloeosporioides, A.
solani) by tamarind extracts ................................................................................... 110
7.5 Conclusion ........................................................................................................... 111
7.6 Recommendation.................................................................................................. 111
CHAPTER EIGHT ...................................................................................................... 112
GENERAL CONCLUSION AND RECOMMENDATIONS .................................. 112
8.1 Conclusions .......................................................................................................... 112
8.2 Recommendations ................................................................................................ 113
REFERENCES ............................................................................................................. 114
APPENDICES .............................................................................................................. 154
xii
LIST OF TABLES
Table 3.1: Global positioning system coordinates of the study sites in semi-arid
Eastern Kenya ...................................................................................... 27
Table 4.1: Social characteristics of tamarind farmers in semi-arid Eastern Kenya
............................................................................................................. 34
Table 4.2: Crops intercropped with tamarind in semi-arid Eastern Kenya ............ 35
Table 4.3: Type of production, nature of production, farm size in acres and
proportion of farm occupied by tamarind in semi-arid Eastern Kenya36
Table 4.4: Land preparation method and crop management in tamarind production
in semi-arid Eastern Kenya .................................................................. 38
Table 4.5: Maturity indices, maturity length, yield per plant per season of
tamarind in semi-arid Eastern Kenya................................................... 40
Table 4.6: Proportion of tamarind fruit sales in semi-arid Eastern Kenya. ........... 42
Table 4.7: Utilization of tamarind fruit, medicinal use and opinion on tamarind
farming in semi- arid Eastern Kenya ................................................... 43

xiii
Table 4.8: Constraints in tamarind production in semi-arid Eastern Kenya .......... 44
Table 5.1: Morphological descriptors used to study tamarind accessions in semi-
arid Eastern Kenya ............................................................................... 52
Table 5.2: Quantitative Morphological variation of tamarind in semi-arid Eastern
Kenya ................................................................................................... 54
Table 5.3: Qualitative Morphological Variations in Tamarind from Semi-arid
Eastern Kenya ...................................................................................... 57
Table 5.4: Principal components loadings of 12 quantitative traits in 89 tamarind
accessions in semi-arid Eastern Kenya ................................................ 59
Table 6.1: ISSR primers used in characterization of 89 tamarind accessions from
semi-arid Eastern Kenya. ..................................................................... 71
Table 6.2: Analysis of polymorphism obtained using 7 ISSR primers in 64
tamarind accessions from semi-arid Eastern Kenya ............................ 81
Table 6.3: Analysis of loci and the total number of allele frequencies using 7 ISSR
primers from semi-arid Eastern Kenya ................................................ 82
Table 6.4: Genetic distance among the 64 tamarind accessions from semi-arid
Eastern Kenya ...................................................................................... 83

xiv
Table 6.5: Analysis of molecular variance in 64 tamarind accessions from semi-
arid Eastern Kenya .............................................................................. 84
Table 6.6: Principal coordinate analysis of 64 tamarind accessions from semi-arid
Eastern Kenya ...................................................................................... 84
Table 7. 1: Inhibition of B.subtilis by tamarind extracts from semi-arid Eastern
Kenya ................................................................................................... 95
Table 7. 2: Inhibition of P.aeruginosa by tamarind extracts from semi-arid
Eastern Kenya. ..................................................................................... 95
Table 7.3: Inhibition of B.subtilis with methanol leaf extracts from semi-arid
Eastern Kenya compared to common antibiotics ................................ 97
Table 7. 4: Inhibition of B. subtilis with methanol fruit extracts from semi-arid
Eastern Kenya compared to standard antibiotics. ................................ 98
Table 7. 5: Inhibition of B.subtilis with tamarind water leaf extracts from semi-
arid Eastern Kenya compared with common antibiotics. .................. 100
Table 7.6: Inhibition of B.subtilis with tamarind water extracts from semi-arid
Eastern Kenya compared to common antibiotics .............................. 101

xv
Table 7.7: Inhibition of P.aeruginosa by methanol leaf extracts from semi-Eastern
Kenya compared to common antibiotics ........................................... 103
Table 7.8: Inhibition of P. aeruginosa by tamarind leaves extracted using water
from semi-arid Eastern Kenya compared to common antibiotics. .... 105
Table 7.9: Inhibition of P.aeruginosa by tamarind fruits extracted using water
compared to common antibiotics ....................................................... 106

xvi
LIST OF FIGURES
Figure 3.1: Tamarind sampling and study sites in semi-arid Eastern Kenya ............ 26
Figure 5.1: Scree plot of 12 quantitative variables (A) and correlation variable plot
of among 12 quantitative characters of tamarind associated with the first
and second principal component. ........................................................... 60
Figure 5.2: Dendrogram constructed based on morphological characters of 89
tamarind accessions from Eastern Kenya and the Euclidian average
distances. Green – cluster 2, red –cluster 1 and blue –cluster 3..... 62
Figure 6.1: Principal coordinate analysis (PCoA) of tamarind populations from semi-
arid Eastern Kenya (1-Mwingi, 2-Masinga, 3-Kibwezi, 4- Embu)........ 85
Figure 6.2: HAC dendrogram of 64 tamarind accessions from semi-arid Eastern
Kenya amplified using 7 ISSR markers. ................................................ 86
Figure 7.1: Inhibition of B. subtilis by tamarind leaves extracted using methanol .... 96
Figure 7.2: Inhibition of B. subtilis by tamarind fruits extracted using methanol ..... 98
Figure 7. 3: Inhibition of B. subtilis by tamarind leaves extracted using water ......... 99

xvii
Figure 7.4: Inhibition of B. subtilis by tamarind fruits from semi-arid Eastern Kenya
extracted using water............................................................................ 101
Figure 7.5: Inhibition of P. aeruginosa by tamarind leaves extracted using methanol
from semi-arid Eastern Kenya ............................................................. 103
Figure 7.6: Inhibition of P. aeruginosa by tamarind leaves extracted using water
from semi-arid Eastern Kenya ............................................................. 104
Figure 7.7: Inhibition of P. aeruginosa by tamarind fruits extracted using water from
semi-arid Eastern Kenya. ..................................................................... 106
Figure 7.8: Inhibition zones of tamarind extracts: Study regions (A), extraction
solvent (B), plant parts (C) and study micro-organism (D) ................. 107

xviii
LIST OF PLATES
Plate 4.1: Nature of tamarind production in semi-arid Eastern Kenya: ........................ 36
Plate 4.2: Tamarind management practices in semi-arid Eastern Kenya: .................... 38
Plate 4.3: Maturity indicator of brown color pods ........................................................ 41
Plate 4.4: Utilization of tamarind tree in semi-arid Eastern Kenya .............................. 43
Plate 5.1: Tamarind quantitative morphological variation in semi-arid Eastern Kenya
....................................................................................................................... 55
Plate 6.1: A representation of ISSR Primers (836, 814, 807, 835, 17899A, 17899B,
HB11, 848, 860 842 and 844) pattern used for screening polymorphic
primers used to analyze 64 tamarind accessions in semi-arid Eastern Kenya
....................................................................................................................... 73
Plate 6.2: ISSR primer pattern for polymorphic primer ISSR 807 used to analyze 64
tamarind accessions in semi-arid Eastern Kenya. ......................................... 74
Plate 6.3: ISSR primer pattern for polymorphic primer ISSR 836 used to analyze 64
tamarind accessions in semi-arid Eastern Kenya. ......................................... 75

xix
Plate 6.4: ISSR primer pattern for polymorphic primer ISSR 17899B used to analyze
64 tamarind accessions in semi-arid Eastern Kenya. .................................... 76
Plate 6.5: ISSR primer pattern for polymorphic primer 17899A used to analyze 64
tamarind accessions in semi-arid Eastern Kenya. ......................................... 77
Plate 6.6: ISSR primer pattern for polymorphic primer ISSR 844 used to analyze 64
tamarind accessions in semi-arid Eastern Kenya. ......................................... 78
Plate 7.1: Inhibition of B.subtilis by tamarind leaves (A) and fruits (B) extracted using
methanol ........................................................................................................ 99
Plate 7.2: Inhibition of B.subtilis by tamarind fruits (A) and leaves (B) extracted
using water .................................................................................................. 102

xx
LIST OF APPENDICES
Appendix I: Questionnaire on production and utilization of tamarind in semi-arid
Eastern Kenya ........................................................................................... 154
Appendix II: ANOVA table for trunk diameter at the ground variate ......................... 157
Appendix III: ANOVA tables for trunk diameter at the neck variate .......................... 157
Appendix IV:ANOVA table for height to the first branch variate ............................... 157
Appendix V:ANOVA table for number of primary branches variate ........................... 158
Appendix VI: ANOVA table for number of secondary branches variate ..................... 158
Appendix VII: ANOVA table for the number of seeds per pod variate ....................... 158
AppendixVIII : ANOVA table for number of seeds per pod variate ........................... 159
Appendix IX: ANOVA table for pod weight variate .................................................... 159
Appendix X: ANOVA table for pod width variate ....................................................... 159
Appendix XI: ANOVA table for terminal shoot length variate.................................... 160
Appendix XII: ANOVA table for seed weight variate ................................................. 160

xxi
Appendix XIII: ANOVA table for pulp weight variate ............................................... 161
Appendix XIV: Variance between morphological clusters .......................................... 161
Appendix XV: Distance between morphological clusters ............................................ 161

xxii
ACRONYMS AND ABBREVIATIONS
AFLP Amplified Fragment Length Polymorphism
AMOVA Analysis of Molecular Variance
ANOVA Analysis of Variance
CTAB Cetyl Trimethyl Ammonium Bromide
DNA Deoxyribose Nucleic Acid
EDTA Ethylene diamine tetraacetic acid
GPS Global Positioning System
ISSR Inter Simple Sequence Repeats
MAS Metres Above the Sea level
PC Principal Component
PCA Principal Component Analysis
PCoA Principal Coordinate Analysis
PCR Polymerase Chain Reaction
RAPD Random Amplified Polymorphic DNA
SSR Simple Sequence Repeats
TBE Tris borate EDTA

xxiii
ABSTRACT
Tamarind (Tamarindus indica L) is a fruit tree native to tropical parts of Africa and
Asia. It is used as food and a source of raw material in the food industry,
pharmaceuticals as well as providing ecosystem services. Despite the great value of
tamarind, there is limited information related to its utilization, production,
morphological diversity, genetic diversity and antimicrobial potential in Kenya. The
objectives of this study were to evaluate production and utilization, morphological
diversity, genetic diversity and antimicrobial activity of tamarind extracts from semi-arid
Eastern Kenya. A total of 89 trees were sampled and studied. Data on production and
utilization were collected through personal interviews with the farmers and the use of
questionnaires and the data was analyzed using SPSS software at a significance of
P<0.05. Standard descriptors for tamarind were used in morphological diversity. The
data were subjected to Exlstat software for Principal Component Analysis (PCA),
correlation and cluster analysis and Genstat for descriptive statistics and analysis of
variance and at the significance of P<0.05. DNA was extracted using the CTAB method
and amplified using ISSR markers. The molecular data were analyzed using GeneAlex
and R software. Antimicrobial compounds were extracted sequentially from fruits and
leaves using methanol and water. The pathogenic bacteria (Bacillus subtilis,
Staphylococcus aureus, Pseudomonas aeruginosa and Escherichia coli) were cultured in
nutrient agar while the pathogenic Penicillium digitatum, Colletotrichum
gloeosporioides and Alternaria solani) were cultured on Potato Dextrose Agar, Malt
Extract Agar and Sabouroud Glucose Agar respectively. Data on inhibition zones were
collected and analyzed using SPSS and the significance of P<0.05. This study revealed
that all farmers used seeds from tamarind trees as their source of planting material.
Tamarind was grown for market and subsistence use, the fruit was utilized as a dessert,
an ingredient in porridge and as a source of herbal medicine. The cropping system used

xxiv
by most farmers was intercropping with crops like cereals and legumes. Weed control
and harvesting practices were carried out when necessary. Time taken for the trees to
mature was approximately 5-6 years. Maturity indicators included changes in fruit color
and pod brittleness. Farmers harvested less than 180kgs of tamarind fruits per tree in a
season. The challenges of tamarind production included tamarind weevil infestation,
harvesting from tall trees, marketing and transportation. Morphological results revealed
that there were significant variations in trunk diameter at the ground, pod length, color
and shape, seed shape across the counties. There were no significant differences in
terminal shoot length, trunk diameter at the neck and height to the first branch, pod
weight, pulp length, seed weight and the number of seeds per pod, primary and
secondary branches, growth habit, seed color, roughness and brilliance, pod shape and
seed shape across the counties. Quantitative PCA revealed 5 PCs. Agglomerative
Hierarchical Clustering revealed 3 major clusters. Morphological variation within
clusters was 66.12% and between the cluster was 33.1%. The ISSR markers revealed
polymorphism of 68.7-84.7%, PIC ranges of 0.72-0.89 and genetic diversity of 0.74-0.9.
Cluster analysis showed 7 distinct clusters that indicated that tamarind accessions were
diverse. There were no significant differences in the inhibition zones between leaf and
fruit extracts against B. subtilis. There were significant differences in the inhibition of
tamarind extracts from the study regions and the extraction solvents against B. subtilis.
There were significant inhibition differences in the extracts from study regions, leaf and
fruit extracts and the extraction solvents against P. aeruginosa. Tamarind extracts were
not effective against S. aureus, E. coli, P. digitatum, C. gloeosporioides and A. solani.
Tamarind fruit and leaf extracts of accessions KB004, KB005, KB011, KB012, KB014
and KB015 had higher inhibition than ampicillin streptomycin, kanamycin and
cotrimoxazole against B. subtilis and P. aeruginosa. In conclusion, tamarind was
produced as an intercrop and utilized as an ingredient. The accessions showed
morphological and genetic diversity and antimicrobial activity in B. subtilis and P.
aeruginosa. There is a need to establish management practices in tamarind production,

xxv
sensitize the public on tamarind fruit value addition. Morphological and genetic
diversity data can be used in breeding for improved tamarind varieties. Antimicrobial
activity information will be utilized in herbal medicine.

1
CHAPTER ONE
GENERAL INTRODUCTION
1.1 Background of the study
Tamarind (Tamarindus indica L.) belongs to the family Fabaceae and subfamily
Caesalpinioideae (Khanzada et al., 2008). Tamarindus has been reported by Mbora and
Bernekov, (2006) to be a monotypic genus containing only T. indica. It is considered
indigenous to tropical, subtropical and semi-arid areas of Africa (Bibitha et al., 2002). It
was also cultivated in South East Asia, Australia and America (Rao and Mary, 2012).
The plant has 24 chromosomes with 2n=24 (Purseglove et al., 1987). It is cross-
pollinated resulting in variation within populations (Nandini et al., 2011).
Cross-pollination is affected by pollinators as selective agents, floral characteristics,
geographical selection on floral characters and the role of pollinators in the evolution of
reproductive isolation. Pollinator-driven speciation is among the most widely spread
form of ecological speciation (Forest et al., 2014). The pollinators can initiate
diversification at several different levels (Schiestl & Johnson 2013) and have revealed a
potential of pollinator-driven micro-evolution. Evidence from phylogenetic splitting in
many flowering plants is associated with changes in the pollination system and
correlated changes in flower characteristics (Schiestl & Johnson 2013). Predictions in
ecological speciation are mediated when 1) different pollinators act as agents of
divergent selection on floral traits 2) geographic mosaic of divergent selection which
involves adaptation to the most efficient pollinator may occur and is aided by variable

2
pollinator distributors leading to the formation of pollinator ecotypes (Goodwillie et al.,
2010). Differences in floral characters may result from new pollinators as a by-product
which may lead to reduced or increased pollination by the original pollinator. When
plants depend on pollinators for reproduction the pollinators shift will contribute to
reproductive isolation hence speciation. The absence of both original and alternative
pollinators may lead to the evolution of self-pollination which will lead to reproductive
isolation (Goodwillie et al., 2010).
Cross-pollination bears phenotypic variability that enables the plant to adapt to different
environments and increases the likelihood of survival and evolutionary changes
(Simpson, 2019). It’s enhanced by floral changes in structure especially the separation
between the anthers and the stigma (Simpson, 2019)
For breeding purposes, both quantitative and qualitative traits are considered. Qualitative
traits are easily selected for breeding to the next generation because they have a
profound effect on plant value and utilization and are governed by one or a few major
genes. Quantitative traits of economic importance are governed by many genes each
having a small effect and are hard for a breeder to control because:1) the number of
genes involved makes heredity change slow and difficult to detect, 2) differences in the
traits involved are detectable through measurements and statistical analysis and 3) 95%
of the variation is due environmental changes while 5% is brought about by genes
(Allard, 2019).
Selection involves choosing traits of importance and evaluating them in successive
generations. Plants with desirable traits are selected and the unwanted ones discarded.
Commercial growers ensure uniformity in the plants from season to season and from one
plant to another. Uniformity and stability are enhanced by intense selection over many

3
seasons. Common methods of selection are mass selection, family selection,
backcrossing, pure line selection and line-breeding (Loria, 2019)
1.1.1 Morphological description
The tamarind tree is large, evergreen and grows up to 30 m tall. The leaves are pinnately
arranged with opposite leaflets. The flowers are yellow and are produced in racemes.
Tamarind fruit is a brown pod and the fruit shape varies from straight to curved to a
sausage shape. The pod contains many hard-coated seeds (Hemshekhar et al., 2011).
Tamarindus indica plants are morphologically different in terms of fruit color and shape,
crown diameter, foliage density, trunk size, seed color and seed shape as well as flower
characteristics (Nandini et al., 2011). Schabel (2004) reported that fruit taste ranged
from sweet to acidic. Parrotta (1990) reported red fruits in India. In Kenya, tamarind has
been reported to be sour and is harvested when the pod is brittle and brown (Plate 1.1).
The pulp color is red-brown and sticky (Betser, 2009; Wanjala, 2019). Morphological
descriptors have enhanced the selection of superior cultivars for the market in terms of
fruit taste and pulp thickness (Elsiddig et al., 2006). In Africa, many studies have been
done on biochemical compounds of tamarind (Soloview et al., 2004).
Morphological markers utilize visible traits and represent genetic polymorphism which
is easily identified and manipulated. They have been utilized in the construction of
linkage maps by classical 2-3-point test. Some are linked with agronomic characters and
can be used in indirect selection criteria in practical breeding. Morphological markers
are limited and many are not associated with economic traits such as yield and have
undesirable effects on the growth and development of plants and are highly influenced
by environmental conditions (Bekele and Bekele 2014; Chesnokov et al., 2020)

4
Cytological markers have been used in characterization and utilize structural features of
chromosomes shown by chromosome karyotype and bands. The banding patterns are
displayed in color, width order and position. The patterns depict differences in the
distribution of euchromatin and heterochromatin. Chromosome landmarks are useful in
the characterization of normal chromosome detection of mutation, physical mapping and
linkage group identification. Physical maps derived from morphological and cytological
markers lay a basis for genetic linkage mapping with the help of molecular techniques.
Their use is limited in genetic mapping and plant breeding (Kwiatek et al., 2019)
Plate 1.1: Tamarind tree in semi-arid Eastern Kenya: (A) flowering and (B)
fruiting.
1.1.2 Importance of tamarind
Tamarind fruits are either eaten fresh or processed into juices, jams or chewing gums
(NRC, 2008; Nazir et al., 2017). Fruits are rich in carbohydrates, Vitamin C, Calcium,
tartaric acid and Potassium (El-Siddig et al., 2006; Azad, 2018). Leaves are used as

5
vegetables and fodder for animals (Maundu et al., 2005). The plant is considered a
source of food in the marginalized areas, especially during the dry spells when other
sources of food were scarce (Maundu et al., 2005). The stem is used as a source of
hardwood timber while the leaves and bark are used in traditional medicine for the
treatment of ailments such as jaundice and dysentery (Srinivasan et al., 2001).
Industrially, tamarind is used in the production of tamarind pulp powder, tamarind
kernel powder and alcohol (Azad, 2018). The seed is important in the production of
preservatives, jute, paper, adhesives for textile sizing and printing (Leakey, 2017). In
India, tamarind is used in the production of fortified wine where seed, wood, leaves,
bark, roots in dry form were used to flavor it (Panesar et al., 2017).
1.1.3 World production and utilization
Commercial cultivation of tamarind is carried out in Asia. In India, it is considered an
important cash crop and ranked 6th in the export market (Pal and Mukherjee, 2020). In
2017-2018, tamarind was produced on an acreage of 74.26 hectares with a production of
309.44 metric tonnes (Israel et al., 2019). India was closely followed by Thailand and
Mexico. In America, Costa Rica showed a potential of producing up to 200 tonnes
annually which would be exported to North America and Europe ( Rao and Mary, 2012).
Tamarind is native and widespread in Africa from Sudan, Ethiopia, Kenya, Tanzania,
Sub-Sahelian Africa to Senegal (Yahia and Salih, 2011). In West Africa it is produced in
Benin, Nigeria, Mali and Senegal where it is utilized as fodder, food, medicine as well as
spiritual and in ethnoveterinary purposes (Van der Stege et al., 2011). In East Africa,
tamarind trees grow in the semi-arid areas and upon maturity, the fruits are collected and
utilized in homes or sold through informal channels (Omari, 2016). In Kenya, tamarind
is mainly found in wild woodlands in dry areas of Kitui, Tharaka Nithi, Baringo, West
Pokot, Turkana, Homa Bay, Taita Taveta, Kwale, Lamu, Makueni and Embu (Wanjala,

6
2019). The fruits are collected by middlemen and sold in Mombasa where they are used
locally in coastal dishes and some are exported to Asian countries (Wanjala, 2019).
Tamarind is among the top 10 prioritized fruits for future crop diversification programs
and development in Sub-Saharan Africa (NRC. 2008).
1.1.4 Molecular markers
Molecular markers are used in many tropical fruits to determine their genotypes,
biodiversity evaluation, germplasm conservation and understanding genetic backgrounds
(Ouédraogo et al., 2019). Molecular markers reveal polymorphism between different
genotypes or alleles of a gene of a particular sequence of DNA in a population of a gene
pool. Polymorphism is detected by PCR and Southern blotting markers play a key role in
molecular breeding. For them to be effective in marker-assisted breeding they should
show high levels of polymorphism, be evenly distributed in the entire genome, be
codominant in expression, clear distinct allelic features, have no detrimental effect on
the phenotype and be genome-specific (Jiang, 2013; Nybom, 2017). The molecular
markers include; Inter Simple Sequence repeats (ISSRs), Amplified Fragment Length
Polymorphism (AFLP), Random Amplified Polymorphism DNA (RAPDs) and Simple
Sequence Repeats (SSRs). Inter Simple Sequence repeats (ISSRs) are highly
polymorphic, reproducible, efficient and offer a quick method of determining diversity
by combining SSRs, AFLPs and RAPDs (Ng and Tan, 2015; Sarmieto et al., 2017).
ISSRs are used in phylogenic analysis, gene tagging, genome mapping, evolutionary
biology, cluster analysis and plant breeding (Pradeep et al., 2002; Alansi et al., 2015).
Sarmieto et al., (2017) used ISSR markers and determined the diversity of tamarind in
Ecuador and identified important tamarind trees for breeding, but no markers have been
used to determine the diversity of Kenyan tamarind.

7
Molecular markers assist in the selection of desired traits simultaneously using 2nd
generations back cross populations near-isogenic links, double haploids and recombinant
inbred lines (Nadeem et al., 2018). Molecular markers should be near the target genes.
The selection of the marker ensures success in the selection of the genes. Linkage maps
provide a framework that detects marker-trait association and for the selection of
markers to be used in assisted breeding (Platten et al., 2019). High-density maps derived
from genetic linkage maps are important in molecular-assisted breeding. Only markers
that are closely related to the related genes provide success in practical breeding (Jiang,
2013).
1.1.5 Antimicrobial activity
Antimicrobial compounds in plants can control diseases caused by pathogenic micro-
organisms (Hayashi et al., 2013; Gonelimali et al., 2018). In tamarind, extracts from
different plant parts have shown the ability to control different pathogenic bacteria
(Escalona-Arranz et al., 2010; Abdallah & Muhammad, 2018). Studies on antimicrobial
compounds in plants have increased the use of herbal medicine since most bacteria have
become resistant to commercial antibiotics (CDC, 2018; WHO, 2018). Studies on
antibacterial compounds of tamarind have been carried out in Sudan and India (Sanaa
and Yagoub, 2008; Pauldas and Banerjee, 2014).
Plant fungal pathogens cause plant diseases and have increased yield losses in recent
years as well as limiting storage and post-marketing period (Yang et al., 2017). Control
of fungal pathogens has largely depended on synthetic chemicals that are a threat to the
environment and humans. In addition to this, pathogens have developed resistance to
synthetic chemicals (Droby et al., 2009; Hua et al., 2018). The challenges in the
chemical control of fungal pathogens have increased research towards control using
plant extracts that may be used as alternative fungicides. Tamarind extracts have been

8
reported to be effective against Alternaria solani, Fusarium solani and C.
gloeosporioides ( John et al., 2004; Garcia, 2011; Alcasid et al., 2016). There is no
available information on the antimicrobial activity of Kenyan tamarind and this has
limited the exploitation of its extracts in the pharmaceutical industry.
1.2 Statement of the problem
Tamarind is abundant in the semi-arid areas of Nyanza, Eastern, Coastal and North-
Eastern parts of Kenya (Infonet Biovision, 2019). The study focused on Eastern Kenya
due to the availability of the trees and improvement would solve food security in the
region and promote ecosystem service. There is limited information on tamarind
production and utilization. Tamarind trees grow in the wild as forest trees, in the
homesteads along with other farm crops and along the roads. In these semi-arid areas,
production practices of the crop are limited even though it is in abundance. Improved
varieties are present in India, Mexico and Thailand in terms of flavor and yield (Reddy
2017) but in Kenya, there are no improved varieties and even information on what is
available is still scanty which has limited production, utilization and commercialization
of tamarind in Kenya (Wanjala, 2019).
Tamarind has been distinguished based on morphological descriptors of seed, fruit, pod
and floral morphology in India, Mexico and Venezuela (Osorio et al., 2018). In Kenya,
tamarind has been known to be sour and there is limited information available to
distinguish tamarind in different regions based on morphological descriptors.
Molecular markers have been used to identify and conserve tamarind genotypes
(Algabal et al., 2011) in Bangalore. Research has been done to distinguish tamarind
using AFLPs, RAPDs and ISSRs (Algabal et al., 2011; Kumar et al., 2015; Sarmiento et
al., 2017) in Bangalore, India and Ecuador. The diversity of Kenyan tamarind has not
been studied at a molecular level (Wanjala, 2019). There is limited information on the

9
available tamarind genotypes and this has limited the possibility of improving the
accessions using conventional methods of breeding.
Antimicrobial compounds in plants have been exploited in the production of herbal
medicine against bacteria in Brazil (Hayashi et al., 2013; Bhardwaj et al., 2016; Anand
et al., 2019). Tamarind extracts have been reported to be effective against gram-positive
(B. subtilis, S. aureus) and negative (E. coli, P. aeruginosa) bacteria (Doughari, 2006).
In Nigeria, Nwodo et al. (2011) reported that extracts of tamarind bark, fruit pulp, stems
and leaves were effective against both gram-negative and positive bacteria. In India,
Gupta et al. (2015) reported that extracts of tamarind were active against gram-positive
and negative bacteria. Tamarind extracts were reported to be effective against C.
gloeosporiodes, A. Solani, F. solani ( Bautista-Baños et al., 2003; Gatan and Jonnalaxer,
2013; Alcasid et al., 2016). There is no available information on antimicrobial
compounds of Kenyan tamarind and this has limited its utilization for antibiotic and
fungicidal purposes.
1.3 Justification
Tamarind is an economically important plant with many uses ranging from food,
ecosystem uses, ethnomedicine, ethnoveterinary, timber and fungicides. An increase in
production would provide income to farmers in the arid and semi-arid areas of Kenya.
Production of tamarind in India, Thailand and Mexico has been commercialized because
of the improved varieties and the farmers have benefited by exporting tamarind products
(Rao & Mary, 2012) while in Kenya there are no improved varieties. An increase in
utilization would promote industrialization due to an increase in value-added products.
Tamarind has a great impact on the ecosystem such as windbreaks, control of soil
erosion, provision of shade and increase in its production would increase the ecosystem
uses in the environment.

10
Morphological descriptors have been used by Fadohan et al. (2010) to distinguish
tamarind cultivars in Benin. The authors reported that both quantitative and qualitative
traits were important in distinguishing cultivars. Floral morphology, fruit size, pulp
color, pulp taste, and the number of seeds per pod were used in Venezuela, Columbia,
Mexico and India to distinguish between varieties (Osorio et al., 2018). Studying
morphological differences of tamarind from Kitui, Kibwezi, Mwingi, Embu and
Masinga could permit initial identification of what is available in the different regions.
The information will enhance crop improvement through breeding programs and
conservation strategies.
Molecular markers have been used in the determination of genetic diversity, cluster
analysis, identification of plants, conservation and breeding programs in China and
America (Grover & Sharma, 2016; Jo et al., 2017). Molecular markers are highly
polymorphic, not influenced by the environment, are not limited and can detect variation
at the DNA level (Samantaray, 2017). ISSRs have revealed higher polymorphism due to
high annealing temperatures and longer sequences (Qian et al., 2001). Inter Simple
Sequence Repeat (ISSR) markers have been used by Sarmiento et al.(2017) for diversity
determination and the results showed diversity among the Ecuadorian tamarind
genotypes this was useful in the selection of trees for clonal propagation and
identification of diverse trees for hybridization programs. The molecular
characterization will help establish the genotypes present in Eastern Kenya and enhance
tamarind improvement through marker-assisted breeding.
Studies on antimicrobial activity of tamarind have been carried out in West Africa,
Sudan, India and America and the results revealed that they are more effective compared
to commercial antibiotics and fungicides (John et al., 2004, 2004; Nwodo et al., 2011).
Antimicrobial activity determined will improve the consumption of tamarind for health
benefits, have tamarind used as raw materials in pharmaceutical industries and improve

11
the economic standards of farmers. Tamarind herbal medicine will be readily available
at a cheaper cost and the side effects induced by the synthetic antibiotics and fungicides
will be reduced.
1.4 Objectives
1.4.1 General objective
To determine production, utilization, morphological and genetic diversity and
antimicrobial activity of tamarind (Tamarindus indica) accessions found in the semi-arid
Eastern Kenya.
1.4.2 Specific Objectives
1. To evaluate tamarind (Tamarindus indica) production and utilization in semi-arid
Eastern Kenya
2. To assess the morphological diversity of tamarind accessions in semi-arid
Eastern Kenya
3. To evaluate the genetic diversity of tamarind accessions in semi-arid Eastern
Kenya
4. To evaluate the antibacterial and antifungal activity of extracts from tamarind
accessions collected from semi-arid Eastern Kenya against bacterial and fungal
pathogens.
1.5 Null hypotheses (H0)
1. There is no production and utilization of tamarind in semi-arid Eastern Kenya.
2. There are no morphological differences among T. indica accessions in semi-arid
Eastern Kenya.

12
3. There is no genetic diversity among T. indica accessions in semi-arid Eastern
Kenya.
4. Extracts of T. indica accessions in semi-arid Eastern Kenya have no anti-
bacterial and antifungal activity against pathogens.

13
CHAPTER TWO
LITERATURE REVIEW
2.1 Origin and taxonomy of tamarind
Tamarind (Tamarindus indica L) is native to Madagascar. It belongs to the family
Fabaceae, subfamily Caesalpinioideae, genus Tamarindus and species indica. The
genus Tamarindus is monotypic (Khanzada et al., 2008). It was introduced to India
from Africa and India is believed to be its secondary origin (Du Preez, 2003). It was
also introduced to America and Mexico by Spanish and Portuguese colonialists and
cultivated in the tropics (Azad, 2018).
The tree is multipurpose, wind-resistant, evergreen and best known for its fruits (Yahia
and Salih, 2011; Infonet Biovision, 2019). It grows up to a height of 24 - 30m with
pinnate leaves. The leaves have oblong leaflets that are 2.5 - 25 mm long and 5 – 6 mm
wide (Du Preez, 2003). Flowers are born on small racemes with 5 petals where two of
them are reduced to bristles and are yellow with orange or red streaks. Fruits have brown
pods like legumes with soft acidic pulp with shapes varying from curved to semi-curved
to straight (Hemshekhar et al., 2011; Infonet Biovision, 2019).
The pod length is 50 - 150mm long and 20-30mm wide with seeds that are hard coated
with blackish to brown pulp (Hemshekhar et al., 2011; Infonet Biovision, 2019).
Tamarind grows in an acid climate and tolerates humid to dry hot regions. Optimum
rainfall should be 750-1900mm but still does well at low amounts of 500-750mm.
Altitude requirements are 0-1600 meters asl, soils should be deep loamy or alluvial but
can still tolerate slightly saline and alkaline soils. The plants are pollinated by honey

14
bees (Samake et al., 2014). Flowering starts after 5-8 years for plants raised from seeds
during the dry season. Flowering lasts for 2-3 months’ fruits set in at the inception of
rains and gets to the 6-8 months later (Samake et al., 2014; Fandohan et al., 2015).
2.2 Utilization of tamarind
In homes, tamarind is used as an ingredient in sauces, porridge and juices and as
vegetables during lean periods. Additionally, it is utilized in the treatment of ailments
such as jaundice and dysentery (Srinivasan et al., 2001). The leaves are also fed to
animals as fodder, the wood is used in charcoal production which served as a major
source of energy used in urban areas of Senegal ( Fandohan et al., 2010a). The tamarind
tree is tolerant to adverse environmental conditions that make them possible to be used
in shade provision and the shaded areas were utilized as meeting places in villages (
Ranaivoson et al., 2015).
Industrially, tamarind has been used in the production of tartaric acid, tartrates, wine,
vermouth and tamarind pulp powder (Singh et al., 2007; Panesar et al., 2017; Nazir et
al., 2017). The pulp has been used in vinegar production and herbal therapies (Taha et
al., 2016; Abdallah & Muhammad, 2018). Dried tamarind pulp has been used as layer
chicken feed as a supplement to reduce egg yolk cholesterol by 12-14% without
affecting egg production qualities (Biradar and Kanduri, 2016).
Tamarind seeds are separated from the pulp manually or mechanically and used to
produce tamarind kernel powder that is important in sizing material in textile, paper and
jute industries (Kumar & Bhattacharya, 2008). The tamarind seed gum is used as a
polysaccharide to improve the texture and viscosity of processed food (Nazir et al.,
2017). The polysaccharide is also used in the production of gels with a wide range of pH
that could be used as an alternative to pectin (Azad, 2018). The seed is used as an

15
adhesive filler in the plywood industry and as a stabilizer for the brick industry (Nazir et
al., 2017).
In pharmaceutical treatment, tamarind leaves, pulp, seeds and bark extracts have been
effective in the control of gram-positive and gram-negative bacteria pathogens ( Sanaa
and Yagoub, 2008; Escalona-Arranz et al., 2010). Extracts of tamarind leaves, barks,
stems and seeds have been used in the control of plant fungal pathogens such as
Colletotrichum spp, Alternaria spp, Fusarium spp and Penicillium spp (Bautista-Baños
et al., 2003; John et al., 2004).
The tree has a vast effect on the improvement of soil organic matter, soil biological
properties and is considered an ornamental tree due to its evergreen nature and
windbreak in farms ( Faust et al., 2015).
2.3 Morphological characterization of tamarind
Characterization describes the entire plant germplasm. Morphological, physiological,
agronomical and molecular markers have been used in characterization (Engels &
Visser, 2003; El-Esawi, 2019). Characterization has enhanced accession identification,
utilization and conservation (Khan et al., 2015).
Plant morphological characterization utilizes plant vegetative and reproductive
characters. The characters determine plant phenotype and reflect plant genetics and
ecology (Engels & Visser , 2003; Cervantes & Diego,2010; Wyatt 2016). Morphological
markers should be easy to observe and score by naked eyes and expressed in all
environmental conditions (Khan et al., 2015; Martinez et al., 2017). In Ecuador,
quantitative and qualitative traits were used to study the diversity of tamarind and the
results revealed six dissimilar clusters with stem height, fruit, flower and leaf descriptors
being significant (Alvarez et al., 2019). In Columbia, Osorio et al. (2018) used morpho-

16
agronomic descriptors to study diversity among the sweet and sour tamarind and they
observed significant diversity in the two groups. In Uganda, Nyadoi, et al. (2010) and
Okello et al. (2018) evaluated twelve quantitative morphological descriptors of tamarind
fruit and seed and their results depicted morphological variations and correlation
relationships that could be used for the selection of trees for breeding. In West Benin,
Fandohan et al. (2011) studied the impact of habitat type on conservation of tamarind
and the results revealed that the variations were significantly correlated with the
ecological factors which indicated that fruit and seed size as well as mass increased with
an increase in humidity (Fandohan et al., 2011).
2.4 Molecular characterization of tamarind
A molecular marker is a DNA sequence that has a known chromosome location and can
control a particular trait (Nadeem et al., 2018). Molecular markers have been used in
cultivar identification, biodiversity evaluation, germplasm conservation and
understanding genetic backgrounds of living things (Grover & Sharma, 2016; Jo et al.,
2017; Sharma, 2019). Genetic diversity can alter species populations through
hybridization, recombination, gene flow and introgression (Coates et al., 2018).
Maintenance of genetic diversity is important in breeding programs (Ma et al., 2008,
Nara et al., 2009). Geographical differences may cause changes in populations of the
same species (Biron et al., 2002).
Amplified Fragment Length Polymorphism (AFLPs) were used by Algabal et al. (2011)
and revealed diversity among the 36 tamarind genotypes. The authors found out that
AFLPs were unsuitable for diversity studies for they were to be scored dominantly,
required the development of locus-specific markers from individual fragments and used
different kits adapted to the size of the genome that was analyzed.

17
Random Amplified Polymorphic DNA (RAPDs) are PCR-based techniques that are
adapted for the rapid detection of polymorphism. The markers use single or multi short
oligonucleotides primers of random or arbitrary sequence (Krawczyk & Kur 2018;
Chatterjee et al., 2019). RAPDs have been useful in determining the genetic diversity of
C, brasiliense, C. colocynthis, pome, papaya and tamarind in Brazil and India
(Mendonca et al 2014; Kumar et al., 2015; Verma et al., 2017; Zarei et al., 2017; Kumar
et al., 2019). The results revealed the diversity and could be utilized in hybridization
programs.
Simple sequence repeats (SSRs) are regions in the genome where a group of bases of 1-8
is repeated in tandem. SSRs are codominant, multi-allelic, reproducible and have high
resolutions (Cai et al., 2019). SSR markers have been used in trait and marker
association of plants, cultivar identification, genetic diversity studies and marker-
assisted breeding for variety development (Lou et al., 2015: Biswas et al., 2019). Thirty-
five SSR markers were used by Biswas et al. (2019) in the USA to determine diversity
among the cultivated and wild strawberry varieties and the results revealed genetic
diversity. Twenty SSR markers were used by Israr et al. (2019) in India to determine the
diversity of traditional mango cultivars and the results revealed high intraspecies
diversity between monoembryonic and polyembryonic mango cultivars. In Taiwan, Ma
et al., (2019) used SSR markers to determine diversity among 45 guava cultivars and the
authors reported that they were able to distinguish seedling strains with unclear parental
origin and accurately identify the cultivars.
Inter simple sequence repeats (ISSRs) markers use primers containing only the repetition
of a particular SSR di, tri, tetra or pentanucleotide of 16-25bp. The markers are
polymorphic, reproducible and efficient. The markers combine the variability of SSRs,
AFLPs and RAPDs and do not require prior information about the species genome
(Sarmieto et al., 2017; Pena et al., 2020). ISSR markers are used in phylogenic analysis,

18
gene tagging, genome mapping, taxonomy studies, population genetics and plant
breeding (Alansi et al., 2015; Pena et al., 2020).
Ten ISSR primers were used to study the genetic diversity of mango cultivars in
Vietnam by Ho and Tu (2019) and the results depicted dissimilarities within the
cultivars. In Ethiopia 17 ISSR primers were used by Indracanti et al. (2019) to determine
the diversity among 5 landraces and introduced cultivars of date palm and the results
indicated high diversity. ISSR markers were able to differentiate the five cultivars of
Ziziphus jujubi species from Spain (Reche et al., 2019). In Brazil, Jamile da Silva
Oliveira et al. (2019) studied the genetic diversity of Passiflora spp using ISSR markers
and the results revealed high genetic variability and adequate accession differentiation.
2.5 Antimicrobial compounds of tamarind
Most bacterial infections are caused by micro-organisms that have developed resistance
to antibiotics and this has increased the cost of treatment (Angiolella et al., 2018). The
emergence of natural products has significantly increased the production of
antimicrobial compounds that have been effective against micro-organisms (Boakye,
2019). Antimicrobial compounds are easily obtained from herbal plants as well as
terrestrial and marine organisms (Angiolella et al., 2018). Herbal plants are readily
available, less expensive and contain active compounds that have antimicrobial activity
(Cheesman et al., 2017). Most rural communities still depend on herbal medicine in
primary health care (Rahayu et al., 2020).
Antimicrobial compounds are secondary metabolites such as alkaloids, glycosides,
terpenoids, saponins, steroids, flavonoids, tannins and quinones. Antimicrobials are used
to control microbial growth by altering membrane permeability and reduction of pH
(Cheesman et al., 2017; Elisha et al., 2017).

19
Alkaloids are naturally occurring compounds in flowering plants. They have been
reported to be drug stimulants that have shown antimicrobial, anti-cancer and analgesic
activity. They have been useful in diet ingredients, supplements and pharmaceuticals
(Cushnie et al., 2014; Hussain et al., 2018). Flavonoids are polyphenols, widely found in
vegetables, fruits and some beverages. They are found as flavones, flavanones, flavanes,
isoflavones, bio flavones and chalcones (Panche et al., 2016). They are found in most
plant parts such as the flowers leaves, roots, seeds and barks (Ruiz‐Cruz, 2017). They
have been reported to have antimicrobial, anti-cancer, anti-viral, anti-mutagenic and
anti-inflammatory activities (Djouossi et al., 2015).
Tannins are water-soluble natural polyphenols in plants. They are often applied as
medicinal agents such as anti-oxidants, anti-inflammatory, anti-carcinogenic and
antiseptics. They have properties that make them suitable candidates for pharmaceutical
the industry (Singh, 2020). The compounds are accumulated in flowering plant parts
such as bark, wood, fruits and leaves (Krzyzowska et al., 2017; Ribeiro et al., 2018).
Saponins are detergent-like substances with the capability to kill and destroy bacteria
and cancer cells, protozoa and mollusca (Desai et al., 2009; Kregiel et al., 2017). They
are found in plant products as secondary metabolites (Hussain et al., 2019). They have
exhibited antioxidant, antimicrobial, anti-inflammatory and analgesic activity (Kregiel et
al., 2017). Saponins antibacterial activity has often been limited but it has an excellent
antifungal activity (Guil-Guerrero et al., 2016).
Quinones are secondary metabolites isolated from aromatic plants. They are products of
hydroquinone oxidation (Eyong et al., 2013). They are grouped into benzoquinone and
hydroquinone. They are found in nature as a pigment in animals, plants and microbes
and they are the main ingredients in many herbs (Eyong et al., 2013).

20
In Nigeria, Abdalla and Muhammad, (2018) carried out phytochemical screening of
tamarind leaves and fruits and the results revealed that the two parts contained alkaloids,
glycosides, saponins, tannins, flavonoids, terpenoids, phenols and anthraquinone. In
India, the active compounds of tamarind shells were screened by Gomathi et al. (2017)
and the results revealed the presence of alkaloids, cardiac glycosides, saponins, tannins,
flavonoids, terpenoids, phenols and anthraquinone, steroids and xanthoproteins.
In Nigeria, tamarind seed coats, pulp and leaves showed the presence of flavonoids,
saponins and terpenoids (Adeniyi et al., 2017). In Nigeria, tamarind pulp extracted using
hot water contained saponins at 2.2%, alkaloids at 4.32% and glycosides at 1.59%
(Abukakar et al., 2008).
2.5.1 Bacteria pathogens
A pathogen is an organism that is capable of causing a disease in a host (Piglowski,
2019). Pseudomonas aeruginosa is a gram-negative bacterium that is rod-shaped, mono
flagellated and obligate. It can live in water, rhizosphere and humans (Paškevičius et al.,
2017). It causes infections in plants and animals such as sepsis, pneumonia and burn
wound infections (Paškevičius et al., 2017). The pathogens have developed resistance to
synthetic antibiotics (Bassetti et al., 2013). Reports by WHO declared that P. aeruginosa
was a problem of clinical importance (Tacconelli & Magrini, 2017).
Escherichia coli belongs to the family Enterobacteriaceae that is composed of gram-
negative, facultative anaerobic rod-shaped bacteria. The bacterium does not produce
enzyme oxidase and is either motile or non-motile (Desmarcheller & Fegan, 2016). It
causes diarrhea, hospital-acquired pneumonia, urinary tract infections, bacteremia and
neonatal meningitis. It has caused up to 70% mortality in delayed treatment
(Poolman.2017; Farver, 2018; Madappa, 2019). Infections are prevalent in young

21
children with weakened immune systems and older adults after consumption of
contaminated food and beverages ( Lim et al., 2010; Richter et al., 2018). Prevention
mechanism has been used against it E.coli (Christian, 2017).
Bacillus subtilis is a gram-positive bacterium that is positive for catalase, forms
endospores in unfavorable conditions, is aerobic to facultative (Du et al., 2019). The
bacterium is concentrated in soil, water and food products with a plant origin (Schultz et
al., 2017). It affects humans through food poisoning, infection is evident by diarrhea
and vomiting ( Elshaghabee et al., 2017).
Staphylococcus aureus is a facultative gram-positive anaerobe that occurs singly, in
pairs or irregular clusters. It is a non-motile, spore-forming bacterium found in the
environment and humans (Taylor and Unakal, 2018). S. aureus multiplies rapidly at
room temperature and produces toxins that cause infections (Taylor & Unakal, 2018).
Treatment of S. aureus infections depends on the type of infections as well as the
presence or absence of drug-resistant strains. Resistance has increased morbidity,
mortality and treatment cost (Gnanamani & Hariharan, 2017).
2.5.2 Control of bacterial pathogens
Anti-biotics have been used in the control of bacterial pathogens, but bacteria have
developed resistance to antibiotics (Das & Patra, 2017; Aslam et al., 2018). Resistance
may be due to excessive use of antibiotics, increased international travel, poor sanitation
and release of non-metabolized antibiotics and their residues to the environment (Aslam
et al., 2018). Antibiotic resistance has threatened the effectiveness of antibiotics and has
limited the treatment of common infections (Liu et al., 2017). The resistance has shifted
attention to natural products which could be used as effective drugs to treat human

22
diseases with high efficiency against pathogens and negligible side effects (Liu et al.,
2017).
Tamarind fruits extracted using water and ethanol have been reported by Warda et al.
(2007) to be effective against gram-positive and negative bacteria. Tamarind aqueous
leaf extracts have been reported to be effective against gram-positive (Escalona-Arranz
et al., 2010). Tamarind bark and leaf extracts have been reported by Abdallah &
Muhammad (2018) to be effective against gram-positive and gram-negative bacteria.
Tamarind ethanol extracts from Sudan have been reported to be more effective than
common antibiotics (Sanaa & Yagoub, 2008). Tamarind fruit pulp from India, extracted
using methanol showed higher activity against B. subtilis compared to the commercial
antibiotics (Pauldas and Banerjee, 2014).
2.5.3 Control of plant fungal pathogens
Fungal plant pathogens are fungi that cause plant diseases and they have increased yield
losses in recent years (Yang et al., 2017). Fungal pathogens cause both field and post-
harvest losses limiting storage and post-marketing period (Zhang et al., 2019). The fungi
use various mechanisms to infect the plant such as killing the host and feeding on the
dead materials, others colonize the living tissue (Doehlemann et al., 2017). Fungi infect
unripe fruits but the symptoms become visible in ripening due to the favorable
conditions of the fruit (Buchholz et al., 2018). The pathogens are spread by wind,
rainwater and vectors (Jain et al., 2019).
Control of fungal pathogens has been done using chemicals, biological agents, cultural
practices and integrated disease management (IDM). Integrated disease management
aims at the optimization of the pathogen in an ecologically and economically viable
manner. IDM is accomplished by coordinated use of multiple tactics that ensure stable

23
crop production and maintenance of pathogen damage below economic injury levels
while reducing harm to animals and the environment (Bittman et al., 2019).
Biological control is emphasized to reduce the effects of chemical fungicides.
Pathogenic organisms are suppressed and their effects on the host are reduced and
beneficial organisms are favored. Biological control agents used include fungi, bacteria
and viruses. Common bacteria used include; Bacillus spp, Pseudomonas spp, Rhizobium
and Streptomyces. Common fungi used are Trichoderma spp, Gliocladium spp.
Arbuscular mycorrhizal fungi and Chaetomium spp (Rashad and Moussa, 2020).
Cultural control methods include crop rotation, proper spacing, proper watering and
planting disease-resistant cultivars (Hosack & Miller, 2017).
Control of fungal pathogens has mainly depended on synthetic chemicals that are a
threat to the environment and humans (Droby et al., 2009). Chemical control is not
satisfactory due to the development of resistance hence the need to search for an
alternative fungicide (Mahlo et al., 2016; Hua et al., 2018). Pathogenic fungi of
economic importance include; Colletotrichum spp, Alternaria spp, Fusarium spp,
Penicillium spp.
Anthracnose (Colletotrichum gloeosporioides) is the most economically important
destructive disease in mango, papaya and avocado (Gatan and Jonnalexer, 2013). It
affected both pre and post-harvest quality of fruits and vegetables (John et al., 2004).
Conventional control has been done using synthetic chemicals which are not only
expensive but have proved to be hazardous to the user and plants (Alcasid et al., 2016).
Aqueous tamarind leaf and stem extracts have been reported by Bautista-Baños et al.,
(2003) to reduce conidial germination of C. gloeosporioides. Aqueous and ethanolic
tamarind extracts were evaluated for their activity against C. gloeosporioides and both

24
revealed significant inhibition with leaf extracts having higher inhibition zones
compared to the commercial fungicide mancozeb ( Gatan & Jonnalaxer, 2013). In the
Philippines, Alcasid et al. (2016) studied the activity of aqueous and ethanolic extracts
against anthracnose and the results revealed that aqueous extracts were not active
whereas ethanolic extracts showed 42% activity indicating that they could be used as
fungicide if the mode of application could be enhanced. In a study by John et al., (2004)
antifungal activity of tamarind extracts was evaluated and the results showed that they
were effective against a wide range of fungal pathogens including C. gloeosporioides
and A. solani. The researchers concluded that tamarind extracts offered a great
opportunity to be used as an antifungal to control soil, seed and airborne
phytopathogenic fungi. Garlic and tamarind extracts were evaluated against C.
gloeosporioides in bananas and garlic was shown to be more effective than the tamarind
(Garcia, 2011).

25
CHAPTER THREE
GENERAL MATERIALS AND METHODS
3.1 Description of the study area
The study was carried out in semi-arid areas of Kitui, Embu, Machakos and Makueni
counties in Kenya. The counties lie within an altitude of 833-1377 meters above sea
level. Machakos county is majorly arid and semi-arid (ASAL) and it receives an annual
rainfall of 500-1300mm. The rains are bimodal with long rains from March to May and
short rains from October to December. The temperatures range from 18-29˚C and the
coldest month is July. Agro ecological zones (AEZ) in this county include upper
midland (UM), UM2-3, UM5-6, lower medium (LM), LM3, LM4 and LM5 (Machakos
county, 2015). Makueni county is fairly hot and dry, it receives rainfall of 500 to 750
mm, temperatures range from 21-25˚C. The wet season is from January to June (GoK,
2013). The long rains are from March to April and short rains are experienced in
November and December whereas June to December are dry periods. Makueni county
has eight AEZ of lower highland (LH), LH2, UM3, UM4, LM3, LM4, LM5 and inner
lowland 6 (IL6). LM4, LM5, LM6 and IL6 are ASAL and form 80% of the county
(Maluki et al., 2016). Embu county receives an annual rainfall of 600-1800 mm which is
bimodal. Temperatures range from 12 to 26˚C, in the cold season temperatures average
up to 11˚C and in the hot season they average up to 25˚C. AEZ in Embu county include
LH1, UM1, UM2, UM3, UM4, LM3, LM4 and LM5 (Mburu et al.,2016). Kitui county
is drought tolerant with bimodal rainfall. Annual rainfalls range from 500-1050 mm.
Annual mean minimum temperatures range from 22 to 28˚C and the annual maximum
temperatures range from 28 to 32˚C. AEZ in Kitui county includes UM3, UM4, LM3,
LM4, LM5 and LM6 (Mugo, 2014). Dominant soils are alfisols, ultisols, oxisols, lithic

26
soils. The soils are highly erodible with low levels of fertility (Obiero and Onyando,
2013).
Figure 3.1: Tamarind sampling and study sites in semi-arid Eastern Kenya
The Global Positioning System (GPS) and location coordinates were obtained for each
tree (Table 3.1).

27
Table 3.1: Global positioning system coordinates of the study sites in semi-arid
Eastern Kenya.
County Sub-
county
Latitude Longitude Elevatio
n (MAS)
Temp Soils
Kitui Kitui
central
S01.451-
S02.056
E038.054-
E038.181
1335-
1375
27°C oxisols
Mwingi S00.865-
S00939
E037. 637–
E38.234
1365-
1377
25°C vertisols
Embu Ishiara S00.455-
S00.470
E037.733-
E037.791
1328-
1377
21°C Vertisols
Machako
s
Masing
a
S00.846-
S00.924
E037.610-E37.681 1130-
1376
23°C Andosols
Makueni Kibwez
i
S02.372-
S02.397
E037.932-
E037.996
833-1121 23°C sandy
clays
3.2 Sampling
A field survey was carried out from December 2015 to August 2016 (Figure 3.1). Multi-
stage sampling method was used starting with purposive with the help of key informants
such as administrative chiefs, village elders and Kenya Wildlife Service (KWS) officers
who identified tamarind farms. This was then followed by random sampling in the
farms. In Masinga and Embu most of the sampling was on-farm, while in Kitui, Mwingi
and Kibwezi it was either on-farm or in the forest reserves. In Kitui county, 35 trees
were sampled and studied; 25 trees from Kitui central and 10 trees from Mwingi. In
Embu county a total of 21 trees were sampled and studied from the Ishiara location. In
Machakos county, a total of 6 trees were sampled in Masinga. Most of the plants in
Masinga were sparse as they had been cleared to pave way for other crops. In Makueni
county, a total of 27 trees were sampled and studied in the Kibwezi location.
3.3 Labelling of samples
Samples from Kitui sub-county were labeled as KT001-KT025. Samples from Mwingi
sub-county were labeled as MW001-MW010. Samples from Embu were labeled as

28
E001-E021. Samples from Machakos were labeled as MS001- MS006. Samples from
Makueni county were collected in Kibwezi and labeled as KB001- KB027.
3.4 Evaluation of tamarind production and utilization
Data were collected on the production system, cultural practices, source of planting
material, time taken to maturity, maturity indices, fruit yield per tree per season, number
of harvests per year, the portion of fruit sold, uses of the tamarind fruit, use of tamarind
tree, challenges in tamarind production. Data were collected by observation and through
personal interviews (I asked the farmers the questions as they responded) with the
farmers using structured and semi-structured questionnaires.
3.5 Morphological characterization of tamarind
Characterization was done according to the International Union of Plant protection of
new Vegetal Variants ( Tripp,et al.,2007)., the International Committee of Plant Genetic
Resources of plant for the description of tropical plants (IPGR, 1991) and according to
the procedure by (Fandohan et al., 2010). Qualitative and quantitative descriptors of the
stem, fruit and seeds were used. Data on the stem were measured as an average of three
readings. Pod length, width, weight, pulp weight and seed number were determined as
an average of five pods. Seed weight was determined as an average of seeds in an entire
pod. A standard color chart was used to determine color variations. Data were analyzed
to get Analysis of Variance (ANOVA), Principal Component Analysis PCA and
Agglomerative Hierarchal Clustering (AHC) using Genstat version 12.1 and Xlstat
software respectively.
3.6 Molecular characterization of tamarind
Young apical leaves were used and DNA extracted using modified CTAB as described
by Doyle & Doyle 1990 and visualized in 0.8% agarose after 45 minutes. DNA was

29
amplified using ISSR primers as described by Sarmiento et al. (2017) and visualized on
2% agarose. Band sizes were estimated by comparing with 100bp ladder. Data collected
were either (1) for the presence of bands and (0) for the absence of bands. Genalex 6.5
software (Peakall & Smouse, 2012) was used to estimate pairwise individual relatedness,
genetic diversity, Principal Coordinate Analysis (PCoA) and Analysis of Molecular
Variance (AMOVA). Phylogenetic clusters were obtained using R software.
3.7 Antimicrobial evaluation of tamarind
Leaf and fruit samples were dried under shade and antimicrobial compounds were
extracted sequentially using methanol and water as described by Uthayarasa et al.
(2010). The extract was dried and reconstituted as described by Predrag et al. (2005) and
stored at 4°C. Bacillus subtilis, S. aureus, E. coli and P. aeruginosa were preserved in
nutrients broth and stored at 4˚C and cultured on 28g/l of nutrient agar. Pathogenic fungi
Penicillium digitatum, Alternaria solani and Colletotrichum gloeosporioides were
isolated from an orange, tomato and avocado and cultured PDA, Malt extract agar and
Sabouraud glucose agar respectively.
Disc diffusion method was used to determine the antimicrobial activity of tamarind
extract against pathogens (Sandle, 2016). The bacteria were incubated at 24°C for 48 hrs
and fungi at 37 ̊C for 96 hrs. The experiment was done in 3 replicates in a split block.
Data on inhibition zones were collected in millimeters and analyzed using Two –way
ANOVA at a significant level of P< 0.05 using SPSS version 12.

30
CHAPTER FOUR
EVALUATION OF TAMARIND (Tamarindus indica) PRODUCTION
AND UTILIZATION IN SEMI-ARID EASTERN KENYA
Abstract
Tamarind is a multipurpose, evergreen tree, in the Fabaceae family. It is mainly used as
a fruit, with the other parts having limited exploitation. This study aimed at evaluating
tamarind production and utilization in semi-arid Eastern Kenya. Data were collected
through personal interviews with the selected farmers using questionnaires. Data
collected were on social factors of farmers, production systems, planting material,
cultural practices, the proportion of tamarind sold, time taken to maturity, maturity
indices as well as uses and challenges in tamarind production. Results indicated that
33.78 % of the respondents were female and 66.22% were male. Tamarind was mainly
produced for home use and local market (48.3%). Tamarind was produced by 72.2% of
the respondent as an intercrop. Many respondents (44.9%) had farm sizes of 2 to 4 acres
but tamarind occupied the least percentage of the farm with 76.4% of the respondents
having tamarind on 2.1 to 4% of the farm. Land preparation was mainly done using
handheld implements (61.8%) such as hoes and machetes. All farmers (100%) reported
that they did not propagate, but tamarind grew naturally from seeds. Weed control was
practiced by 68.5% of the respondents. Most of the farmers (57.3%) reported that pod
brittleness and change in pod color were the maturity indicators. The majority of the
respondents (60.7%) were not sure of the actual time tamarind trees took from
germination to maturity, but 20.7% approximated it to be 5 to 6 years. A larger number
of the respondents (34.8%) harvested less than 180kg of tamarind fruits per tree per
season. All the respondents (100%) reported that they harvested tamarind once a year.

31
Approximately 46.1% of the respondents did not sell tamarind fruits harvested. A
greater number of the farmers (76.4%) reported that they utilized tamarind as a dessert
and an ingredient in porridge preparation while 49.4% used the fruit for medicinal
purposes. Most of the farmers (71.9%) had a negative attitude towards tamarind farming.
More than half of the farmers (67.6%) reported that they had transport difficulties and
almost all (98.9%) had challenges with tamarind weevil (Sitophilus lineans) attacks
during post-harvest handling. The majority of the farmers (60.7%) reported challenges in
harvesting from tall trees and (79.8 %) reported a lack of links to urban markets.
4.1 Introduction
Production of tamarind is characterized by wild growth with no or minimal supervision.
Traditionally the tree is considered a forest tree (Ranaivoson et al., 2015). Cultivation of
the tree requires 40 to 50 trees per acre. The plant is considered hardy which requires
less irrigation (Ledesma, 2013). Irrigation is important if the tree is raised from seeds in
a seedbed and during transplantation for four years. True to type tamarind plants are
raised by vegetative means (Ledesma, 2013). Red loamy and alluvial soils are suitable
for its cultivation with pH 4.5-9 (Reddy, 2015). Dry weather is critical for the ripening
of the fruits during the harvesting period. Tamarind trees remain productive for up to a
century (Reddy, 2015).
Tamarind is cultivated by Asian countries with India as a leading producer whereby
production in India has increased with an increase in awareness in cultivation (Panesar et
al., 2017). The more tamarind was produced the more it was utilized both locally and
internationally and this increased the market price of the crop (Du Preez, 2003). In India,
tamarind is produced commercially in several districts with a total production of 98.16
tonnes in 2017-2018 (National Horticulture Board, 2017). Du Preez, (2003) reported
that tamarind from India was imported by Australia, Canada, Germany, America,
Pakistan and Qatar. Two varieties have been reported in India; PKM1, which matured

32
early and produced up to 25 tonnes of pods/ha and Urigam, which was the local, sweet,
long variety (Reddy, 2015). In India, the leaves and the flowers are utilized as food and a
source of herbal medicine. Kumar and Bhattacharya (2008) reported that the seeds had
various uses but had not been fully utilized in oil, textile, food and tanning industries.
In Africa tamarind is grown in the tropics; in the woodlands and semi-arid areas where
the leaves, bark, flowers and seeds are used as food and in traditional medicine for the
treatment of jaundice and dysentery as was reported by El-Siddig et al., (2006).
Tamarind was found planted for landscaping due to its ability to tolerate extreme
environmental conditions and its evergreen nature and provide shade on country roads,
highways and homesteads. For example in Kenya tamarind tree provided shade for
meeting places in the villages and was used as a source of food in the semi-arid regions
during the lean periods (Maundu et al., 2005; NRC, 2008; Orwa et al., 2009). It was
used for the control of soil erosion in areas prone to mudslides and was a source of
firewood and timber for construction (Orwa et al., 2009). Fandohan et al., (2010a)
reported that farmers benefited from sales in charcoal and the leaves were fed to goats
and sheep.
In Kenya, research findings showed that tamarind was grown in the Coastal, Eastern,
Nyanza and North Eastern regions. In the Coastal region, tamarind had equal importance
with the mangoes and cashew nuts as it was utilized as a spice in most of the dishes (El-
Siddig et al., 2006). Tamarind fruits collected from Tharaka in Kenya were sold in the
Coastal market (Betser, 2009).

33
4.2 Materials and methods
4.2.1 Survey data collection
Data were collected by observation, personal interviews with the farmers using
structured and semi-structured questionnaires (Appendix I). Farmers provided
information on the type of production system, cultural practices, source of planting
material, time taken to maturity, maturity indices, fruit yield per tree per season, number
of harvests per year, the portion of fruit sold, uses of the tamarind fruit, use of tamarind
tree, challenges in tamarind production; market, transport, pests and diseases.
4.2.2 Data analysis
Data were summarized using cross-tabulations and processed descriptively using means,
frequencies and percentages, Chi-square X2, F test and one-way analysis of variance
(ANOVA) using Statistical Package for Social Science (SPSS) Version 18 (SPSS Inc.
Chicago USA). Analysis of variance was conducted to assess the differences between
counties, gender, age of farmers, crops grown, type of production, farm size in acres,
nature of production, the proportion of tamarind sales, the proportion of farm under
tamarind and land preparation methods. Source of planting materials, crop management
practices, maturity indices, use of the tamarind fruit, medicinal uses, maturity length,
source of planting seed, opinion on tamarind farming and challenges in tamarind
production were also analyzed using ANOVA.

34
4.3 Results
4.3.1 Social characteristics of tamarind respondents
Most of the respondents (61.90 %) were male and middle-aged while females were only
38.10% (Table 4.1).
Table 4.1: Social characteristics of tamarind farmers in semi-arid Eastern Kenya
Variable County
Embu
N=21
Kitui
N=35
Machakos
N=6
Makueni
N=27
Mean
N=89
Gender %
Female 38.10 23.81 33.33 38.46 33.78
Male 61.90 76.19 66.67 61.54 66.22
Age of the farmers in years 42.14 41.62 47.83 39.54 41.54
N is the number of respondents
4.3.2 Crops intercropped with tamarind in semi-arid Eastern Kenya
Crops that were intercropped with tamarind included maize, beans, mangos, pawpaw,
khat, pigeon peas and other trees. Maize was grown in all the regions, mangoes,
avocadoes and pawpaw were highly produced in upper Embu. Beans were planted in all
regions; pigeon peas were mostly grown in the lower eastern regions with Makueni
recording the highest production than the upper region of Embu that had the least
production.

35
Table 4.2: Crops intercropped with tamarind in semi-arid Eastern Kenya
Variable
(%)
County
Embu
N=21
Kitui
N=35
Machakos
N=6
Makueni
N=27
Mean
N=89
Maize 95.2 51.4 66.7 18.5 52.8
None/trees 0 48.6 0 25.9 27.0
Beans 28.6 17.1 50.0 7.4 19.1
Pigeon peas 9.5 22.9 16.7 85.2 38.2
Mangoes 57.1 5.7 16.7 0 16.9
Khat 0 0 0 16.7 1.1
Avocados 23.8 0 0 0 5.6
Pawpaw 33.3 0 0 0 7.9
N is the number of respondents
4.3.3 Production of tamarind in semi-arid Eastern Kenya
There was a significant difference in the types of tamarind production. A great
proportion of tamarind produced in Embu was for home use. A great proportion of
tamarind fruits produced in Makueni and Kitui and Machakos were for both market and
home use. There was a significant difference in the nature of production. Tamarind
farms were intercropped with legumes and cereals across the region with Machakos and
Makueni recording 100%. Abandoned production was observed in Embu and Kitui
especially Mwingi areas with forest reserves. There was a significant difference in the
farm sizes across the counties. Very few farmers in Machakos and Makueni reported
farm sizes of greater than 8 acres. In Machakos the respondents had between 4-8 acres.
An acreage of 2-4 acres was reported in all the regions except in Machakos and a high
number was reported in Makueni. Out of 2-4 acres’ farmers had only a small 2.1-4%
percentage of it that was on tamarind production which was high in Embu, Makueni and

36
Machakos (Table 4.3 and Plate 4.1). All farmers reported that tamarind grew from seeds
upon falling and obtained favorable growth conditions.
Table 4.3: Type of production, nature of production, farm size in acres and
proportion of farm occupied by tamarind in semi-arid Eastern Kenya
Variable (%) County Significance
Embu
N=21
Kitui
N=35
Machakos
N=6
Makueni
N=27
Mean
N=89
chi-square
tests
P-
value
Type of production (A)
None 38.1 0 0 3.7 10.1 42.761 0.00 **
Subsistence 61.9 45.7 0 29.6 41.6
Subsistence
+Market
0 54.3 100 66.7 48.3
Nature of production
Intercrop 33.3 71.4 100 100 72.2 119.363 0.000 **
Abandoned 66.7 28.6 0 0 26.7
Farm size in acres 0-2 38.1 25.7 16.7 33.3 30.3 25.669 0.002 **
2-4 33.3 45.7 0 63.0 44.9
4-8 28.6 28.6 66.7 0 22.5
>8 0 0 16.7 3.7 2.2
The proportion of land under tamarind
0-2% 0 45.7 0 0 18 39.480 0.000 **
2.1-4% 100 42.9 83.3 100 76.4 4.1-8% 0 11.4 16.7 0 5.6
**significant difference, Chi-square analysis and F-test at P<0.05, N is the number of
respondents
(A) Abandoned (B) Intercropped
Plate 4.1: Nature of tamarind production in semi-arid Eastern Kenya:

37
4.3.4 Land preparation methods and crop management practices of tamarind in
semi-arid Eastern Kenya
There was a significant difference in the methods used in land preparation. Embu
(100%) and Kitui (20%) were abandoned hence the land was not prepared. The simple
implements included hoes, machetes which were used across the region with high
percentages in Makueni. Animal-drawn implements were used across the region except
upper for region Embu and highly used in Machakos. Machine usage was only reported
in Machakos (16.7%). There was a significant difference in crop management practices
across the region. Weed control was mainly done in tamarind farms with intercrops
which was high in Machakos and Makueni. Cultural practices such as pruning, fertilizer
application and pesticide application were not carried out in tamarind production. All
farmers reported that tamarind grew from seeds of the same tree naturally (Table 4.4 and
Plate 4.2).

38
Table 4.4: Land preparation method and crop management in tamarind
production in semi-arid Eastern Kenya
Variable (%) County Significance
Embu
N=21
Kitui
N=3
5
Machako
s
N=6
Makueni
N=27
Mean
N=89
chi-square
tests
P value
Land preparation method
None 61.9 25.7 0 0 24.7 49.285 0.000*
*
Simple
implements
38.1 60.0 33.3 88.9 61.8
Animals 0 14.3 50.0 11.1 12.4
Machine 0 0 16.7 0 1.1
Crop
Management
None 100 20 0 0 31.5 68.03 0.000*
*
Weed control 0 80 100 100 68.5
**significant difference, Chi-square analysis and F-test at P<0.05, N is the number of
respondents
Plate 4.2: Tamarind management practices in semi-arid Eastern Kenya:
A Weeds not controlled
B Weeds controlled

39
4.3.5 Maturity and harvesting of tamarind in semi-arid Eastern Kenya
There was a significant difference in maturity indicators across the region. Both indices
of pod brittleness and pod color change from green to brown were observed across the
counties. Most farmers were not sure how long tamarind took to maturity with a high
number in Embu (100%). Farmers in Makueni reported that it took 5-6 years to get to
maturity. There was a significant difference in fruits harvested across the counties.
Farmers across the region were not keen on the quantity of tamarind fruits they
harvested with high numbers in Embu (71.4%). Those who kept records reported they
harvested less than 180 kg per season per tree with a greater percentage from Kitui
(42.9%). Farmers in Makueni reported higher yields of more than 271kg per plant per
season. The fruits were harvested by shaking, climbing and handpicking (Table 4.5 and
Plate 4.3).

40
Table 4.5: Maturity indices, maturity length, yield per plant per season of tamarind
in semi-arid Eastern Kenya
Variable County Significance Embu
N=21
Kitui
N=35
Machakos
N=6
Makueni
N=27
Mean
N=89
chi-
square
tests
P
value
Maturity indices %
Pod brittleness 19.0 20.0 0 33.3 22.5 24.407 0.00**
Pod color change 52.4 11.4 50 0 20.2
Both 28.6 68.6 50 66.7 57.3
Maturity length of tamarind (years)
Not sure 100 74.3 50 14.8 60.7 50.916 0.00**
5-6 0 17.1 0 66.7 27.0
6-8 0 8.6 50 18.5 12.4
Yield per plant per season (kgs)
Not sure 71.4 5.7 16.7 25.9 28.1 43.247 0.00**
<180 28.6 42.9 33.3 29.6 34.8
181-270 0 22.9 33.3 0 11.2
>271 0 28.6 16.7 44.4 25.8
**significant difference, Chi-square analysis and F-test at P<0.05, N is the number of
respondents

41
Plate 4.3: Maturity indicator of brown color pods
Harvesting of tamarind fruits was done once a year, the fruits were either for home use
or sold in Nairobi or Mombasa by middlemen who determined the market price. There
was a significant difference in the proportion of tamarind sold across the region. Farmers
across the region had limited tamarind fruit sales with a high number from upper Embu
(90.5%). Most sales were less than 25% of the fruits harvested with high a percentage
from Makueni (74.1%). Few farmers sold above 75% of the harvest and this was highly
reported in Machakos (33%) (Table 4. 6).
(A) Harvesting of tamarind
fruits by hand picking
(B) Semi-arid Eastern Kenya
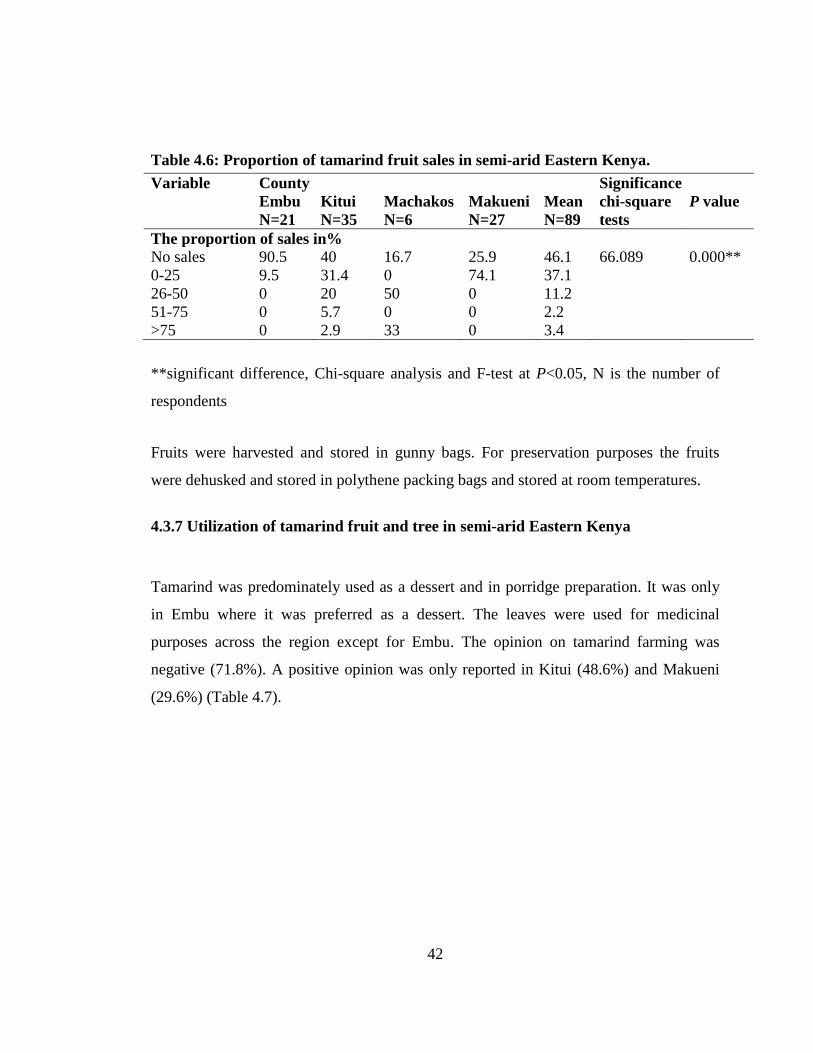
42
Table 4.6: Proportion of tamarind fruit sales in semi-arid Eastern Kenya.
Variable County Significance
Embu
N=21
Kitui
N=35
Machakos
N=6
Makueni
N=27
Mean
N=89
chi-square
tests
P value
The proportion of sales in%
No sales 90.5 40 16.7 25.9 46.1 66.089 0.000**
0-25 9.5 31.4 0 74.1 37.1
26-50 0 20 50 0 11.2
51-75 0 5.7 0 0 2.2
>75 0 2.9 33 0 3.4
**significant difference, Chi-square analysis and F-test at P<0.05, N is the number of
respondents
Fruits were harvested and stored in gunny bags. For preservation purposes the fruits
were dehusked and stored in polythene packing bags and stored at room temperatures.
4.3.7 Utilization of tamarind fruit and tree in semi-arid Eastern Kenya
Tamarind was predominately used as a dessert and in porridge preparation. It was only
in Embu where it was preferred as a dessert. The leaves were used for medicinal
purposes across the region except for Embu. The opinion on tamarind farming was
negative (71.8%). A positive opinion was only reported in Kitui (48.6%) and Makueni
(29.6%) (Table 4.7).

43
Table 4.7: Utilization of tamarind fruit, medicinal use and opinion on tamarind
farming in semi- arid Eastern Kenya
Variable County Significance
Embu
N=21
Kitui
N=35
Machakos
N=6
Makueni
N=27
Mean
N=89
chi-square
tests
P value
Use of tamarind fruit
Dessert 66.7 8.6 0 0 19.1 41.333 0.00**
Porridge 0 11.4 0 0 4.5
Both 33.3 80.0 100.00 100 76.4
Medicinal use
Not used 100 14.3 33.3 63 50.6 41.33 0.00**
Used 0 85.7 66.7 37.0 49.4
Opinion on tamarind farming
Negative 100 51.4 100 70.4 71.9 17.847 0.00**
Positive 0 48.6 0 29.6 28.1
**significant difference, Chi-square analysis and F-test at P<0.05, N is the number of
respondents
Tamarind trees were reported to have various uses in the area; used as landscaping trees,
as a source of fuel in form of charcoal, timber, shade, in control of soil erosion during
flash floods and as a storage area for animal feeds (Plate 4.4).
Plate 4.4: Utilization of tamarind tree in semi-arid Eastern Kenya
(A) Shade for animal
feeds
(A) Shade for animal
feeds
(A) Shade for animal
feeds
(B)source of firewood (C) source of human shade

44
4.3.8 Constraints in tamarind production in semi-arid Eastern Kenya.
Transporting tamarind fruits was a challenge in Makueni and Kitui. Tamarind weevil
attacked the fruits throughout the region at maturity before harvesting and in storage.
Harvesting the fruits from the trees was a challenge experienced in all the counties with
greater effects in Kitui (100%). All four counties had a challenge with marketing
tamarind fruits. (Table 4.8).
Table 4.8: Constraints in tamarind production in semi-arid Eastern Kenya
Variable County Significance
Embu
N=21
Kitui
N=35
Machakos
N=6
Makueni
N=27
Mean
N=89
chi-square tests P value
Challenges in tamarind production
Transport
Not a challenge 100 0 100 34.3 67.4 53.103 0.00**
Challenge 0 100 0 65.7 32.6
Pests
Not a challenge 0 2.9 0 0 1.1 1.560* 0.668ns
Challenge 100 97.1 100 100 98.9
Harvesting
Not a challenge 38.1 2.9 83.3 77.8 39.3 41.123 0.00**
Challenge 61.9 97.1 16.7 22.2 60.7
Market
Not a challenge 0 42.9 50 0 20.2 72.484 0.00**
Challenge 100 57.1 50 100 79.8
ns no significant difference, **significant difference, Chi-square analysis and F-test at
P<0.05, N is the number of respondents
4.4 Discussion
Tamarind in semi-arid Eastern Kenya has vast uses ranging from food to ecosystem
services. Most uses were skewed towards the ecosystem which includes: control of soil
erosion as the area is prone to mudslides, source of firewood, use as shelter and shade.

45
This observation was also reported by Ranaivoson et al. (2015) where the authors
reported that tamarind in West Africa provided more ecosystem services.
Tamarind fruit was either eaten as a dessert or used as an ingredient in porridge
preparation which was also reported by Singh et al. (2007). The authors reported that in
India, the fruit pulp could be eaten raw when dipped in a sweetener or salt as a snack
while in the Bahamas it was dipped in wood ash and also used in the preparation of other
foods. Havinga et al. (2010) also reported that in Africa, tamarind fruit is a useful source
of food during lean periods. The authors stated that tamarind was also used in cultural
activities such as worship which was not evident in semi-arid Eastern Kenya. In this
study tamarind was used as a cure to mouth rash which was similar to (Pinar, 2014) who
reported that tamarind fruits and leaves in Turkey were effective against fungal
pathogens.
In Kitui, Machakos, Embu and Makueni land was prepared manually using simple
implements like hoes and machetes which were readily available. Farmers in Machakos
(50%), Kitui (14.4%) and Makueni (11.1%) used animal-drawn plow donkeys that were
readily available. Farmers reported they were not able to afford and maintain farm
machinery in the production of tamarind.
Due to the low acreage of productive land, farmers were forced to intercrop tamarind
with other crops. Short season intercrops (pigeon pea, beans and maize) provided food
and income to the farmers unlike tamarind which is perennial. The pigeon peas and other
intercrops benefited as they did not get scorching from the sun. Weed control was
mainly practiced due to the presence of intercrops.
Farmers (100%) reported that they did not have a particular season when they planted
tamarind as it grew on its own upon seeds falling on the ground and having obtained

46
favorable germination conditions. This finding was also reported by Singh et al. (2007),
that commercial use of tamarind in Africa was still underdeveloped. Infonet Biovision
(2019), reported that in the Philippines tamarind was grown on a large scale, propagation
was done by vegetative means that included; cleft grafting, shield and patch budding.
Farmers (60.7%) were not sure of the period tamarind took to mature but most ( 27%) of
them reported 5-6 years which was contrary to reports by Infonet Biovision, (2019)
which indicated 3-4 years since the trees were raised by vegetative means. The fruit was
harvested for market and home use and this was similarly reported by Rao and Kumar,
(2015). The authors reported that tamarind produced in Africa was mainly for domestic
consumption. Fruits from Kitui and Makueni were sold to traders from coastal Kenya,
who used the fruits for making jams, juices and sauces for making dishes. This was also
reported by Ranaivoson et al. (2015), who reported that tamarind fruit could be used to
make sauces and juice. High (42.9%) yields and positive opinions on tamarind
production in Kitui were associated with the ready market to the coastal Kenya traders.
The ready market in the Kenyan coast was also reported by Betser, (2009) who stated
that tamarind could be collected around Tharaka in Kenya and sold to the coast and used
in making dishes. The yields in this study were slightly lower (not more than 270kgs)
than yields reported by Rao and Kumar, (2015). They reported that each tamarind tree in
India yielded 150-500kg per season. Alveraz et al. (2019) reported fruit yields of up to
200 kg/tree per season in Asia where the fruit varied based on the age of the tree, genetic
potential and climatic condition. These authors reported that after 50 years’ production
decreased. Low yield also could be influenced by poor management practices such as
pruning, fertilization and phytosanitary control.
Challenge in transport experienced was associated with the poor infrastructure of the
region. The most dominant mode of transport was human and animal transport. There
were no reported mechanical means of transporting the produce to the market.

47
Marketing tamarind fruits was a challenge and this was similar to the findings by Betser,
(2009) who reported that the ready market for tamarind in the Tharaka region was only
available in the coast region of Kenya. This forced the traders to travel to the Kenyan
coast, which is far away from the region of production.
Harvesting tamarind fruits was a challenge mainly in Kitui as this region had huge, tall
trees (more than 1.5M) where climbing, picking by hand and shaking of the branches
was difficult. The trees are huge and tall because they are raised from seeds and pruning
was not done which is in agreement with reports by Infonet Biovision, (2019). In this
report trees that were raised from seeds grew taller than their counterparts raised by
vegetative means. The taller they are the more difficult it is to harvest using the common
methods of climbing, picking and shaking. In Embu tamarind was in abundance due to
the favorable climate. The fruit trees were abandoned as the farmers had a negative
opinion on tamarind production. The negative opinion was associated with the fact that
Embu is a high agricultural potential area that has a diversity of products to choose from
such as mangoes, maize, beans, avocado and pawpaw. The tamarind trees were majorly
used as a source of firewood which was similar to the findings by Ranaivoson et al.
(2015), who reported that tamarind trees in West Africa were heavily used as a source of
fuel.
The farmers (100%) did not report any incidence of diseases and similar findings were
made by (Singh et al., 2007), in India where the authors reported that tamarind trees
were free from serious diseases. Reports by Infonet Biovision, (2019) in Kenya
indicated that tamarind was attacked by powdery mildews and leaf spots, a sooty mold,
stem disease, stem, root and wood rot, stem canker, a bark parasite and a bacterial leaf-
spot. A serious pest in tamarind production was reported to be the weevil that attacked
the fruits when they mature on the trees and after harvesting which was similar in
Nigeria and India (Ojo & Omoloye 2015; Mercedo-Mesa et al., 2018). This was

48
contrary to the reports by Soemardji, (2007) in Japan who reported that the major pests
that attacked tamarind were mealy bugs, seed beetles and bruchid pod beetles.
4.5 Conclusion
Tamarind was not produced as the main crop in semi-arid Eastern Kenya. It was
intercropped with the other crops (legumes and cereals). Tamarind occupied less acreage
of the total farms, management practices such as fertilizer application, pruning and
propagation were not carried out hence the less yields. Tamarind was not considered as
the main food it was utilized as an ingredient in juices, sources and only considered as
an important vegetable during the lean periods. Tamarind production was constrained by
weevils and poor marketing channels
4.6 Recommendation
Production information collected can be used in the improvement of tamarind yields by
developing crop management practices such as vegetative propagation, pruning, pest
control (tamarind weevil), fertilization e.t.c. Utilization information could be used to
sensitize the public on the importance of tamarind and develop commercialization and
industrialization. There is a need to develop proper marketing strategies so that the
farmers can realize the full potential of tamarind.

49
CHAPTER FIVE
EVALUATION OF MORPHOLOGICAL DIVERSITY OF
TAMARIND (Tamarindus indica) ACCESSIONS IN SEMI-ARID
EASTERN KENYA
Abstract
The morphological diversity of tamarind in Kenya has not been evaluated. The aim of
this study was to evaluate the morphological diversity of tamarind accessions in semi-
arid Eastern Kenya. Standard descriptors of tamarind stems, seeds and fruits were used.
Data were collected on the number of primary and secondary branches, height to the first
branch, growth habit, number of seeds per pod, seed color, seed shape, seed weight, seed
brightness, seed roughness, pod color, pod shape, pod length, pod width and pulp color.
Data were analyzed using unbalanced one-way analysis of variance (ANOVA) to
compare differences across the counties and F test and PCA analysis, correlations and
cluster analysis using Genestat and Exlstat at a significant level of (P≤0.05). There was
significant variation in terminal shoot length, trunk diameter at ground, trunk diameter at
the neck, pod length, pod width, irregular and ovate seed shape, dark brown, brown and
black seed colors, curved and semi-curved pod shape, pod color and pulp color. There
were no significant differences in number of primary and secondary branches, height to
the first branch, pod weight, seed weight, number of seeds per pod, growth habits, seed
color of dark brown at center and brown at the edges and light brown, quadrant and D-
shape, seed brightness and straight pod shape. Quantitative PCA revealed 5 PCs.
Descriptors that contributed positively to PC1, PC2, PC3, PC4 and PC5 were trunk
diameter at the ground, pod weight, number of seeds per pod, height to the first branch

50
and pod width respectively. Agglomerative Hierarchical clustering revealed 3 major
clusters. The variation within the clusters was 66.12% and 33.88% between clusters. A
high correlation was observed between terminal shoot length and trunk diameter at the
ground, between pod length and the seed number per pod. Morphological diversity was
observed among tamarind accessions in semi-arid Eastern Kenya. The differences in
tamarind morphology across the counties can be used in selecting accessions with
desirable traits for molecular-assisted breeding.
5.1 Introduction
Morphological descriptors are used as basic characters in the identification of plants,
breeding, commercialization, cluster analysis, genetic diversity and conservation of plant
resources (Khan et al., 2015; Martinez et al., 2017). Components of fruits such as fruit
size, shape, color and general appearance of the plants are important in description
(Nasution & Yapwattanaphun, 2017). Morphological descriptors have been used to
differentiate between many plant species such as capsicum which have been classified
based on fruit shape (Nasution & Yapwattanaphun, 2017). Morphological descriptors
have limitations in distinguishing subfamilies and tribes as the traits are similar
(Swenson & Anderberg, 2005). Tamarindus indica is morphologically different in terms
of fruit; color, shape, taste, crown size and density, foliage color, trunk diameter, flower
characteristics as well as seed color, weight and shape (Nandini et al., 2011). Schabel,
(2004) evaluated fruit taste, which ranged from sweet to acidic and Parrotta, (1990)
reported red fruits in India. Obulesi, (2011) also documented light brown-reddish fruits
in India while Vanden, (2014) recorded sour, small and large fruits in Mali.
Morphological and physiochemical traits were used to study Asian tamarind populations
and the results revealed the existence of morphological and genetic differences
(Fandohan et al., 2010). These descriptors enabled the authors to choose superior
cultivars for the market in terms of taste, pulp thickness and taste (Elsiddig et al., 2006).

51
In West Africa, most studies have been carried out on biochemical compounds of
tamarind (Adeola & Aworh, 2012). In Columbia, India, Mexico and Venezuela,
tamarind varieties have been differentiated using fruit taste, pulp color, seed number,
pod color and floral morphology (Du Preez, 2003; Osorio et al., 2018). Fandohan et al.
(2011) suggested that quantitative and qualitative descriptors should be combined in
distinguishing varieties. In Kenya, there is no information on research aspects available
that can be used to compare morphological differences among tamarind populations.
5.2 Materials and methods
5.2.1 Sampling
Sampling was done as shown in Chapter 3 (Section 3.2).
5.2.2 Morphological characterization of tamarind
Characterization was done according to the International Union of Plant Protection of
New Vegetal Variants ( Tripp et al., (2007). International Plant Genetic Resources
Institute (IPGRI, 1991) and according to the procedure by (Fandohan et al., 2010).

52
Table 5.1: Morphological descriptors used to study tamarind accessions in semi-
arid Eastern Kenya
Plant part Quantitative Qualitative
Stem Terminal shoot length (cm) Growth habit
Trunk diameter at ground (cm)
Trunk diameter at the neck(cm)
Height to first branch (cm)
Number of primary branches
Number of secondary branches
Seed Number/pod Shape, color, brightness,
roughness
Weight (g)
Fruit Length(cm), width(cm) weight(g) Shape and color
Pulp Weight(g) Color
Qualitative descriptors used included: growth habit, pulp color, seed color, pod color,
seed shape, fiber color, seed brightness and seed roughness. Quantitative descriptors
used included: trunk diameter at the ground and neck, height to the first branch, pod
length, width, weight, seed weight, seed number per pod and pulp weight (Table 5.1). A
standard color chart was used to determine the color shades.
5.2.3 Data collection and analysis
Data were collected on mature fruiting tamarind trees. Trunk diameter at the ground was
measured as an average of three readings at the ground. Trunk diameter at the neck was
an average of three readings of the diameter where the tree started branching. Height to
the first branch was measured as an average distance from the ground to the first branch
from three angles of the tree.

53
Pod length was determined as an average of five pods from pole to pole. Pod width was
determined as a mean of five pods from the equator of the cross-section of the fruit and
pod weight was determined as a mean of five pods of the same tree. Seed weight was
determined as an average of seeds in an entire pod. Pulp weight was determined as the
average of pulp in 5 pods per accession. Seed number was determined as an average of
seeds in 5 pods from the same accession. Growth habit was determined as either
orthotropic if the branching started above the ground or plagiotropic if the branching
started at the ground level.
Data were summarized using cross-tabulation and processed using unbalanced one-way
analysis of variance ANOVA to compare differences across the counties and F test using
Genstat software version 12.1. Quantitative data were submitted to principal component
analysis (PCA), correlation of traits was carried out and cluster analysis using
Agglomerative Hierarchical Clustering (AHC). This was done using Xlstat 2021.1.1
software.
5.3 Results
5.3.1 Quantitative morphological results for tamarind in semi-arid Eastern Kenya
There were significant variations in tamarind tree terminal shoot length, trunk diameter
at the ground, trunk diameter at the neck, pod length and pod width across the counties.
There was no significant variation in height to the first branch, number of primary and
secondary branches, number of seeds/pod, seed weight, pulp weight and seed weight
(Table 5.3, Plate 5.1 and Appendix II-XII).

54
Table 5.2: Quantitative Morphological variation of tamarind in semi-arid Eastern
Kenya
Variable Minimum Maximum Mean Standard
deviation
F. Value
Terminal shoot length 340 2400 842.7 339.76 0.002**
Trunk diameter at the
ground
54 590 203.2 114.39 0.013**
Trunk diameter at the neck 43 590 196.4 119.45 0.001**
Height to the first branch 28 420 148.7 61.22 0.664 ns
Number of primary branches 1 3 1.11 0.38 0.246 ns
Number of secondary
branches
1 12 3.39 1.94 0.319 ns
Number of seeds per pod 1 12 6.87 1.76 0.308 ns
Pod length 3.3 20.83 11.49 2.78 0.030**
Pod weight 3 41.59 15.3 6.73 0.671 ns
Pod width 2.6 10.7 5.97 1.98 <0.001**
Seed weight 0.27 1.16 0.65 0.19 0.350 ns
Pulp weight 0.28 2.5 0.76 0.33 0.284 ns
ns not significant at p< 0.05 and ** significant difference

55
Plate 5.1: Tamarind quantitative morphological variation in semi-arid Eastern
Kenya
5.3.2 Qualitative morphological results for tamarind in semi-arid Eastern Kenya.
Significant variations were observed in pulp color, pod color, irregular and ovate seed
shape, dark brown, brown and black seed color and in curved and semi-curved pod
shape (Table 5.4 and Plate 5.2). There was no significant difference in the growth habit
across the counties, orthotropic habit was predominantly observed. Plagiotrophic was
not observed in Embu and Machakos. Irregular and ovate seed shapes recorded a
significant variation across the counties while there was no significant variation in
quadrant and D shape. Dark brown, brown and black seed colors significantly varied
across the counties while there was no significant variation in seed colors of brown and
dark brown at the center and brown to the edges. Pod shapes of curved and semi-curved

56
showed variations across the regions while straight shapes did not show significant
variation. Pod colors of cinnamon-brown and greyish brown significantly varied in the
counties. Greyish brown was not observed in Machakos while cinnamon-brown was not
observed in Embu. Pulp color significantly varied across the counties. Dark brown pulp
color was predominant across the counties while brown was not observed in Embu and
Makueni.
Plate 5.2: Tamarind qualitative morphological variations in semi-arid Eastern
Kenya: Color of seeds: Black (A), Brown (B), light brown (C), dark brown (D) and dark
brown at the center and brown outside (E), Color of tamarind pulp: brown (F) and Dark brown
(A). Tamarind pod shape: straight (H), semi-curved (I) and curved (J). Tamarind pod color:
cinnamon brown (H and I) and greyish brown (J). Tamarind seed shape: Quadrant (K), irregular
(L), D shape (M) and ovate (N). Tamarind growth habits: Orthotropic (O) and plagiotropic (P).

57
Table 5. 3: Qualitative Morphological Variations in Tamarind from Semi-arid Eastern Kenya
Variable Counties Significan
ce
Kitui
N=35
Embu
N=21
Makueni
N=27
Machakos
N=6
Means
N=89
Minimum Maximum STD p value
Growth habit (%) 1 2 0.3
Orthotropic 85.74 100 88.89 100 93.65 0.267ns
Plagiotropic 14.26 0.00 11.11 0.00 6.35 0.267 ns
Seed shape (%) 1 4 1
Quadrant 54.29 19.05 33.33 50.00 39.16 0.054 ns
Irregular 14.29 76.2 11.11 50.00 37.90 <0.001**
D shape 8.57 4.75 25.93 33.30 18.19 0.112 ns
Ovate 0.00 0.00 25.93 0.00 6.48 <0.001**
Seed color (%) 1 5 1
Dark brown 71.43 38.10 29.63 50.00 47.29 0.006**
Dark brown/brown 17.14 42.86 33.33 0.00 23.33 0.066 ns
Brown 11.43 19.05 11.11 50.00 22.89 0.0094 **
Light brown 0.00 0.00 11.11 0.00 2.78 0.068 ns
Black 0.00 0.00 14.81 0.00 4.94 0.006**
Pod shape ( %) 1 3 0.54
Curved 82.86 100 66.67 0.00 62.38 0.012 **
Semi curved 0.00 0.00 18.52 0.00 11.77 0.031**
Straight 17.14 0.00 14.81 100 32.99 0.177 ns
Pod color(%) 1 2 0.3
Grayish brown 40.00 100.00 15.9 0.00 30.28 <0.001**
Cinnamon brown 60 0 74.1 100 60.83 <0.001**
Pulp color (%) 1 2 0.37
Brown 28.57 0.00 85.19 0.00 30.97 <0.001**
Dark-brown 71.43 100 14.81 100 71.56 <0.001**
ns not significant at p< 0.05 and ** significant difference, STD- standard deviation

58
5.3.3 Principal component analysis of tamarind using quantitative traits
Components with SS loadings of greater than one and cumulative variations of greater
than 75% are considered. Eleven traits contributed 84.35% variation in the first 5 PCs.
PC1 contributed 25.77% of the total variation. A positive correlation was contributed by
trunk diameter at the ground, trunk diameter at the neck and terminal shoot length. PC2
contributed 20.56% of the total variation. Pod weight, number of seeds per pod and
trunk diameter at the ground contributed positively to the PC. PC3 contributed 19.56%
of the variation and the positive contributors in the component were the number of
seeds per pod, pod length and number of secondary branches. PC4 traits contributed
10.78% of the variation with height to the first branch, the number of seeds per pod and
pod length as positive contributors. PC5 contributed 7.70% of the total variation with
positive contributors as the number of secondary branches, trunk diameter at the neck
and ground.

59
Table 5.4: Principal components loadings of 12 quantitative traits in 89 tamarind accessions in semi-arid Eastern
Kenya
Values in bold represent the most relevant trait that contributed to a particular principal component
Variable PC1 PC2 PC3 PC4 PC5
-0.19
-0.11
-0.15
-0.26
0.11
0.59
-0.13
0.27
0.06
-0.18
0.60
0.12
0.98
0.08
0.76
Terminal shoot length 0.78 0.07 0.18 -0.20 -0.38
Trunk diameter at ground 0.73 0.49 -0.12 0.21 0.39
Trunk diameter at neck 0.71 0.45 -0.13 0.29 0.40
Height to the first branch 0.59 -0.28 -0.08 0.47 -0.28
No of the primary branches 0.16 -0.74 0.37 0.16 0.25
No. of secondary branches -0.34 -0.45 -0.19 -0.30 0.54
No of seeds/pod -0.55 0.50 0.12 0.49 0.03
Sd. weight 0.26 -0.31 0.76 0.05 0.08
Pulp weight 0.39 -0.08 0.81 -0.27 0.07
Pod length -0.59 0.11 0.48 0.44 -0.08
Pod width -0.02 0.77 0.10 -0.53 -0.03 Pod weight -0.28 0.48 0.78 -0.03 0.10
SS Loadings 3.09 2.47 2.34 1.29 0.92
Variability % 25.77 20.56 19.53 10.78 7.70
Cumulative variability % 25.77 46.33 65.86 76.65 84.35

60
The first two principal components contributed to 46.33% of the variation. A high
correlation was observed between terminal shoot length (TSL), trunk diameter at the
neck (CDN) and trunk diameter at the ground (CDG), between pod length (PDL) and the
number of seeds per pod (SD/pod). Terminal shoot length (TSL) and the seed number
per pod, Terminal shoot length (TSL) and pod length (PDL) are not connected. Pod
width (PDW), secondary branches (SB), height to the first branch (HB) and the number
of seeds per pod (SD/pod) are well represented for they are in the 5th, 3rd and 4th
principal components. The variables to the right (CDG, TSL, CDN, No. of SB, HB, No.
of PB, Pd Width and pp weight) of the plot are correlated and the ones on the left
(SD/pod, PDL, PDWT and sd weight) are not connected to the ones on the right. (Fig
5.1).
Figure 5.1: Scree plot of 12 quantitative variables (A) and correlation variable
plot of among 12 quantitative characters of tamarind associated with the first and
second principal component.
NB Pd- pod, Pp-pulp, PB- primary branches, CDG- crown diameter at the ground, CDN-
trunk diameter at the neck, Sd -seed, SB –secondary branches, HB – height to the first
branch, No-number

61
5.3.4 Cluster analysis of tamarind using Agglomerative Hierarchal clustering
(AHC)
Agglomerative Hierarchal Clustering (AHC) distinguished three major clusters.
Variation within the classes was 66.12% and between classes was 33.88% and the
distance between the cluster 1 and 3 was 0-5.712 (Appendix XIV-XV). Cluster 1 had 45
accessions from all counties with curved pods. The accessions included: E001, E002,
E003, E004, E006, E007, E013, E016, E017, E018, E019, E021, KT001, KT003,
KT004, KT005, KT012, KT014, KT017, KT018, KT020, KT021, KT023, KT027,
KT028, KT029, KT030, KT031, KT032, KT033, KT034, KT035, MS04, MK002,
MK004, MK009, MK010, MK012, MK015, MK021, MK022, MK023, MK024, MK025
and MK027. Cluster 2 consisted of 36 accessions from all four counties: E005, E008,
E009, E010, E011, E012, E014, E015, E020, KT002, KT006, KT008, KT011, KT013,
KT015, KT016, KT019, KT024, KT025, MS001, MS002, MS003, MS005, MS006,
MK005, MK007, MK008, MK011, MK013, MK014, MK016, MK017, MK018,
MK019, MK020 and MK025. Predominant in cluster 2 was dark-brown pulp and long
pod. Cluster 3 had 8 accessions from two counties Kitui and Makueni; KT007, KT009,
KT010, KT022, KT026, MK001, MK003, MK006. The accession in the third cluster
had curved pods (Fig 5.2).

62
Figure 5.2: Dendrogram constructed based on morphological characters of 89
tamarind accessions from Eastern Kenya and the Euclidian average distances.
Green – cluster 2, red –cluster 1 and blue –cluster 3.
C
lu
st
er
3
Cluster 1

63
5.4 Discussion
Morphological descriptors have been used in the initial identification of organisms
(Piyasundura et al., 2008). In this study, morphological diversity was reported among
accessions collected from semi-arid Eastern Kenya, similar variations were reported by
Nyadoi et al. (2014). The authors reported that there was a great diversity among the
tamarind populations collected in Uganda. Fandohan et al. (2011) in Benin reported 3 to
8 primary branches and 30 to 60 secondary branches, but my study revealed that the
number of primary branches ranged from one to two and secondary branches from 2 to
12. Trunk diameters varied greatly where tamarind trees in intercrop farms were
shorter with smaller diameters than those in forest reserves. These findings were similar
to reports by Nyadoi et al. (2014) where the authors reported that trunk diameter varied
greatly with the type of vegetation in the habitat. The authors studied farmlands, savanna
and forests in Uganda and observed that tamarind trees in the forests were bigger
compared to those in the farmlands. The growth habit of orthotropic and plagiotropic
branches in my study were in line with the findings by Ali et al. (2010) which were
reported in Southern India. The authors indicated that the growth habit of tamarind was
not influenced by changes in the environment and cultural practices. Three pod shapes
were observed in my study: curved, semi-curved and straight and these were similar to
the findings by Algabal et al. (2011) in Bangalore. Fandohan et al. (2010) in Benin,
reported two pod shapes: curved and straight. Pod shape differences were affected by
the seed number and seed shapes which are components of genetics (Fawzi, 2011). Pod
colors in my study were either greyish brown or cinnamon brown, which was similar to
the findings by Ayala-Silva et al. (2016) and Toungos (2019) in Florida and Nigeria.
Variations in pod color are highly influenced by the age of the pod and environmental
changes (Bhatangar et al. 2013). Pulp color varied from brown to dark brown in my
study which slightly varied from the findings by Ayala- Silva et al. (2016) in Florida,

64
where the authors reported pulp colors of reddish-brown and brown and also indicated
that pulp color was influenced by the genetic make-up of the plant (Bilcke et al., 2014).
The diversity observed in seed color was more compared to the findings by Fandohan et
al. (2011) in Benin. In their study they reported three seed colors of black, brown and
dark brown but this study revealed additional colors of dark brown at the center and
brown outside and light brown. Seed colors reported in this study were similar to the
findings by Fawzi, (2011) in England. Seed color was an inherited trait and affected by
the environment, and in different environments different colors could be observed
(Fawzi, 2011). Fandohan et al. (2011) also observed seed shapes of quadrant, bowl
shape and irregular while Fawzi (2011) reported seed shapes that were oblong,
asymmetrical, ovate and rhomboid but from this study, seed shapes of ovate, irregular,
quadrant and D-shape were reported. Seed shape was an inherited trait that was affected
by the environment (Fandohan et al., 2011). In this study, pod weight was 3 to 31.4 g,
while Bhatangar et al. (2013) recorded pod weight of 5.49 to 24.55 g in India. Pod
weight was directly correlated to pulp weight and seed number. Pulp weight ranged
from 0.28 to 1.92 g while Bilcke et al. (2014) reported pulp weight of 1.96-4.65 g in
Mali. Pulp weight was a factor of management practices given to the tree. Osorio et al.
(2018) reported 6 seeds per pod in Columbia while this study depicted seed range of one
to twelve per pod. The number of seeds per pod coincides with the reports by Tounges
2019 who also found 1-12 seeds per pod in Nigeria. This was highly influenced by the
nutrition available for the plant and the management practices that also influence the
length of the pod directly (Bilcke et al., 2014).
Diversity was not observed in fiber color, seed roughness, seed brilliance and pulp taste.
Fiber color observed was yellow-brown, all seeds were rough, non-brilliant and pulp
was sour. These factors were not altered in Makueni, Machakos, Kitui and Embu.
Fandohan et al. (2011) reported both brilliant and non-brilliant seeds, rough and

65
polished seeds and this could be affected by different environmental factors. AHC
clustering grouped the accessions into three major clusters. The samples were from all
four counties indicating that the diversity was not based on the specific county. These
findings were similar to the reports by Idi Garba et al. (2015) where the authors reported
that accessions did not cluster based on their collection sites.
According to Chatfield and Collins (1980) components with eigenvalues less than one
should be eliminated; so those with eigenvalues of one and above were considered to be
more significant. The eigenvalues decreased from PC1 to PC5 showing a decrease in
variation. The first five components explained 76% of total variations among the
accessions (Table 5.6). Variables that contributed to variations in the PCAs and clusters:
trunk diameter at the ground, trunk diameter to the neck, terminal shoot length pod
weight, pod length, seed weight, pulp weight, number of seeds per pod, height to the
first branch and pod shape could be explored further to realize the full potential of
tamarind in molecular-assisted breeding programs.
5.5 Conclusion
There exists morphological diversity among tamarind accessions in semi-arid Eastern
Kenya. Cluster analysis revealed three clusters with 66.12% variation within the clusters
and 33.88% among the clusters and the clusters had accessions across the counties. The
5 PCs contributed a variation of 84.35% which were contributed by trunk diameter at the
ground, trunk diameter to the neck, terminal shoot length pod weight, pod length, seed
weight, pulp weight, number of seeds per pod, height to the first branch and pod shape.
Variation across the counties was contributed by seed dispersal by animals from one
locality to another and the agents of pollination. The number of seeds and pod length
traits, terminal shoot length, trunk diameter at ground and neck were highly correlated
whereas vegetative and fruit characters were not correlated.

66
5.6 Recommendation
Diversity information will be used in the improvement of the crop through conventional
breeding methods.

67
CHAPTER SIX
EVALUATION OF GENETIC DIVERSITY OF TAMARIND
(Tamarindus indica) ACCESSIONS IN SEMI-ARID EASTERN
KENYA USING ISSR MARKERS
Abstract
There is limited information on the genetic diversity of tamarind in Kenya. The
objective of this study was to evaluate the genetic diversity of 89 tamarind accessions
from Eastern Kenya using 12 Inter Simple Sequence Repeats (ISSRs). DNA was
extracted from apical leaves using the CTAB method and amplified using ISSR markers.
Data collected were scored as presence (1) or absence (0) of bands and analyzed using
GeneAlex and R software. Twelve ISSR primers were used and only seven of them
amplified the DNA of 64 accessions. A total of 46 alleles were produced for the 7 loci
with an average of 6.5 per loci. Polymorphic information content varied from 0.72 to
0.89 and genetic diversity of 0.74 to 0.9. The ISSR markers revealed effective
polymorphism of 40.87-101.46% and the band sizes varied from 100-1000 bp. Analysis
of molecular variance revealed high variation within the population at 90% least
variation among the population at 10%. Principal coordinate analysis revealed that the
first three components contributed 40.83% of the variation. Cluster analysis showed that
tamarind accessions were diverse and were grouped into seven major distinct groups.
Tamarinds were different within counties but the variations were minimal among
counties. There exists genetic diversity among the tamarind accessions in semi- Eastern
Kenya.

68
6.1 Introduction
Tamarind pulp is used in food, pharmaceuticals, textile, cosmetic, oil, paper and printing
industries (Chawananorasest et al., 2016; Altrafine, 2018). Tamarind leaves are used as
vegetables and are reported to contain vitamins and minerals such as calcium, iron and
ascorbic acid (Narina et al., 2019). Tamarind is grown in home gardens, farmlands,
roadsides and on common lands (Algabal et al., 2011). Tamarind is mostly sown from
seeds of unknown parentage and this has resulted in wide variation among the progenies.
Wide genetic variation is also aided by the wide geographical distribution and adaptation
and cross-pollination nature of the tree. (Algabal et al., 2011; Kumar et al., 2015). Trees
with wide variation within a population offer opportunities in selecting the best trees in
relation to crop improvement (Kumar et al., 2015). Very little is known about its genetic
improvement and farmers choose cultivars based on observable desirable traits
especially of pulp (Algabal et al., 2011). These observable traits are highly altered by
environmental factors and have many limitations in perennial crops (Algabal et al.,
2011). Very little has been studied on tamarind conservation, genetic characters and
population biology (Sarmiento et al., 2017).
Characterization based on DNA markers is more reliable and not hindered by
environmental factors (Nadeem et al., 2018). A clear and detailed study of the molecular
diversity of Kenyan tamarind has not been done. Molecular characterization has been
carried out in Bangalore using AFLPs by Algabal et al. (2011). RAPDs have been used
in Burkina Faso and India by Diallo et al. (2007) and Kumar et al. (2015) respectively.
ISSRs have been used in Ecuador by Sermiento et al. (2017) due to their superiority
over SSRs, RAPDs and AFLPs. The ISSRs are highly polymorphic, simple,
reproducible and use a primer length of 16-25 mers (Pena et al., 2020). Twelve ISSR
primers were used to determine the diversity of 89 tamarind accessions from Eastern
Kenya.

69
6.2 Materials and methods
6.2.1 Sample preparation
Five apical leaves from the tip of the leaf were collected and placed in falcon tubes
containing silica gel and transported to the laboratory. The leaves were crushed in liquid
nitrogen and stored for further extraction as described by Doyle & Doyle 1990.
6.2.2 DNA extraction
DNA extraction was done using 0.4 g of leaves that were ground in 3ml of extraction
buffer (CTAB) as described by Doyle & Doyle 1990. The buffer contained (1M Tris
HCL (pH 8), 0.5M Ethylene diamine tetraacetic acid (EDTA) (pH 8.0), 5M Sodium
Chloride (NaCl2), Sodium Sulphate (NaSO4), Polyvinyl pyrrolidone (PVP10) and 2%
CTAB and then incubated at 65°C for 30 minutes. The samples were then centrifuged at
13000 revolutions per minute (rpm) for 12 minutes and the supernatant was mixed with
equal volumes of chloroform: Isoamyl (24:1). The mixture was centrifuged at 13000
rpm for 10 minutes and the chloroform: Isoamyl step was repeated. The supernatant was
mixed with equal volumes of cold isopropanol and incubated at room temperature. The
nucleic acid was pelleted at 13000 rpm for 5 minutes and then washed with 70% ethanol
twice. The pellet was air-dried and re-suspended in 50 µl of sterile distilled water.
Visualization gel was prepared by weighing 0.8g of agarose in 100ml of Tris Borate
EDTA (TBE) buffer and heated for 2 minutes using microwave and Ethidium bromide
(EtBr) added. Loading dye of 3 µl was mixed with 7 µl of re-suspended pellet in
distilled water and loaded. Observations were made and the presence and absence of
bands was scored after 45 minutes.

70
6.2.3 PCR reaction
DNA amplification was done using ISSR primers as described by Sarmiento et al.
(2017) in (Table 6.1). Each 20 µl of PCR mix comprised of 10 µl of 2X Bioneer ready
mix with 2 µl of primer, 2 µl of DNA and 6 µl of PCR water. Twelve primers were used
to screen for more polymorphic primers. The PCR reaction was: initial denaturation at
94˚C for 5 minutes, denaturation at 94˚C for 30 seconds annealing at 54 to 44˚C for 1
minute, extension at 72˚C for 2 minutes and final extension at 72˚C for 7 minutes as
described by Sarmiento et al. (2017). Amplified DNA was visualized on 2% agarose.
Band sizes were estimated by comparing with 100 bp DNA ladder.

71
Table 6.1: ISSR primers used in characterization of 89 tamarind accessions from
semi-arid Eastern Kenya.
S/NO Name Sequence
1 ISSR807 AGA GAG AGA GAG AGA CT
2 ISSR814 CTC TCT CTC TCT CTC TA
3 ISSR836 AGA GAG AGA GAG AGA GCTA
4 ISSR860 TGT GTG TGT GTG TGT GAGA
5 ISSRHB11 GT GT GT GT GT GT CC
6 ISSR808 AGA GAG AGA GAG AGA GC
7 ISSR844 CT CT CT CT CT CT CT CT AC
8 ISSR835 AGA GAG AGA GAG AGA GCTC
9 ISSR17899A CA CA CA CA CA CA AG
10 ISSR17899B CA CA CA CA CA CA GG
11 ISSR848 CAC ACA CAC ACA CAC AGC
12 ISSR 842 GAG AGA GAG AGA GAG ACTG
6.2.4 Data analysis
Data from ISSR primers were generated by scoring (1) for presence and (0) for absence
of bands. The binary data was used to obtain polymorphic information content (PIC)
according to Liu et al.,2011. PIC=1- where Pij is the frequency of the jth
allele for ith locus and summation extends n alleles scored for ISSR locus. Genetic
diversity was obtained using. Genotypic richness (number of multilocus genotypes
observed per population MLG). Genotypic diversity was estimated as the percentage of
polymorphism observed detected by each population %Pj, ShanWeiner index of MLG
diversity per population. Simposons index per population Lambda, Evenness index per
population –E. Expected heterozygosity or unbiased gene diversity for each population –
He. Observed heterozygosity per population –Ho were analyzed using R3.6.3 software

72
Genalex 6.5 software (Peakall & Smouse, 2012) was used to estimate pairwise
individual relatedness, Principal Coordinate Analysis (PCoA), Analysis of Molecular
Variance (AMOVA) was also carried out to give the difference between populations and
between the accessions. The obtained data were subjected to R software to obtain
phylogenetic clusters using Hierarchical cluster analysis. Accessions from Mwingi were
denoted as population 1, Masinga denoted as population 2, Kibwezi as population 3 and
Embu as population 4.
6. 3 Results
6.3.1 Selection of polymorphic primers from candidate ISSR primers
Optimization was done using touch-down PCR at annealing temperatures of 54 to 44 ˚C
for 35 cycles. Primers ISSR 807, ISSR 836, ISSR 842, ISSR 844, ISSR HB11, ISSR
17899A and ISSR 17899B produced reproducible bands while primers ISSR 808, ISSR
814, ISSR 835, ISSR848 and ISSR 860 did not amplify DNA products (Plate 6. 1).
Amplification was only done to 64 accessions from Mwingi, Masinga, Kibwezi and
Embu. Accessions from Kitui were not amplified with the ISSR primers.
For all the plates in this chapter, M denotes 100bp molecular weight ladder, Mw denotes
accessions from Mwingi, Ms denotes accessions from Masinga, E denotes accessions
from Embu and KB denotes accessions from Kibwezi.

73
Plate 6.1: A representation of ISSR Primers ISSR (836, 814, 807, 835, 17899A,
17899B, HB11, 848, 860 842 and 844) pattern used for screening
polymorphic primers used to analyze 64 tamarind accessions in semi-arid
Eastern Kenya
6.3.2 Level of polymorphism in tamarind using ISSR markers
The seven ISSR primers produced 545 scorable bands which were used for the
estimation of Analysis of Molecular Variance, estimation of genetic diversity, principal
coordinate analysis, analysis of relatedness within populations and cluster analysis. The
banding pattern is represented in Plates 6.2-6.8. In all the plates M denotes 100 bp
molecular weight ladder, Mw are accessions from Mwingi, Ms are accessions from
Masinga, E are accessions from Embu and KB are accessions from Kibwezi.
ISSR807 produced 43 loci with 32 polymorphic loci with band sizes were 200, 300, 500,
600 and 700 bp. Accession of MW004, E009, E010, E017 and E021. 300 bp allele was
present in MS006, E005 and E009. 500 bp was present in MW004, E001, E009, E010
and E021. Allele of 600 bp was observed in MW002, MW007, KB001, KB002, KB004,
KB005, KB006, KB010, KB011, KB012, KB018, KB026, E001, E009, E010 and
E0021. Band size of 700 bp was observed in KB001, KB004, KB005, KB006, KB010,
KB011, KB012, KB022, E001, E002, E003 and E021.

74
Plate 6.2: ISSR primer pattern for polymorphic primer ISSR 807 used to analyze
64 tamarind accessions in semi-arid Eastern Kenya.
ISSR 836 produced bands of 400, 500, 600, 700 and 800 bp. Accessions with the 400
bp allele included MW005, MS001, E001, E009 and E010. 500 bp allele was observed
in accessions from MS001, E001, E007, E009 and E010. Accessions with 600 bp bands
included MW10, MS002, MS006, KB004, KB005, KB006, KB007, KB009, KB011,
KB012, KB013, KB014, KB011, KB015, KB019, KB021, KB023, KB025, KB027,
E001, E007, E009, E010 and E017. Accessions with the allele size of 700 bp included
MW04, MW009, KB002, KB004, KB005, KB006, KB007, KB009, KB011, KB012,
KB013, KB014, KB015, KB016, KB019, KB021, KB023, KB025, KB027, E001, E007,
E009 and E010. 800 bp allele was observed in KB010, KB012, KB013, KB014, KB015,
KB016, KB019, KB021, KB023, KB025, KB027, E001, E003, E007, E009, E010 and
E021

75
Plate 6.3: ISSR primer pattern for polymorphic primer ISSR 836 used to analyze
64 tamarind accessions in semi-arid Eastern Kenya.
ISSR 17899B produced bands that ranged from 100-1000 bp. The primer was highly
polymorphic with 79 polymorphic bands. 100 bp band was observed in MW001,
MW006, MW007, MW008, MW010, E001, E004, E008, E009, E012, E013 and E017.
300 bp was observed in MW006, MW007, MW008, MS003, KB022, KB023, KB024,
KB025, KB026, KB027, E001, E008, E009, E012, E013 and E014. The band size of
400 was observed in MS003, KB004, KB005, KB006, KB012, KB013, KB016, E001,
E008, E009, E011, E012, E013 and E014. Band size of 500 bp was present in the
following accessions; MS001, KB004, KB006, KB007, KB016, E003, E008, E009 and
E016. Band size of 600 bp was present in the following accessions; MS003, KB004,
KB005, E001, E007, E008, E009, E013, E014 and E021. Band size of 700 was observed
in MS003, KB004, KB005, KB016, E001, E002, E003, E008, E009, E014, E015,
E021.800 bp band was observed in MS003, KB005, KB006, KB017, E001, E008, E009,
E013, E014, E015 and E021. 900bp was present in E001, E008, E009, E014, E015,

76
E019, E020, E021, MS005 and MS006. 1000 bp was reported in E001, E008, E009,
E021, MS001, MS002 and MS003.
Plate 6.4: ISSR primer pattern for polymorphic primer ISSR 17899B used to
analyze 64 tamarind accessions in semi-arid Eastern Kenya.
ISSR17899A produced 63 polymorphic loci. The band sizes were 100, 300, 400, 500,
600, 700 and 800 bp. Accessions that had 100 bp included MW002, MW003, MW004,
MW008, MW009, KB007, KB016, E001, E008, E009, E015, E021. Accessions with
300 band size included MW004, MW005, MW006, MW007, MW010, KB011, KB012,
KB015, E001, E008, E009, E011, E012, E013, E021. 400 band size was observed in
KB011, E001, E009, E011, E012, E013 and E021. 500 bp was observed in MW005,
MW006, MW008, KB011, E001, E003, E008, E009, E010, E011, E012 and E013. Band
size of 600 was observed in KB011, KB020 E001, E003, E008, E009, E010, E011,
E012, E013, E014, E015 and E016. 700 bp was observed in KB021, E001, E005, E008,
E009, E011, E012, E013, E014 and E015. Band size of 800 was recorded in KB022,
E001, E005, E008, E009, E012 and E013.

77
Plate 6.5: ISSR primer pattern for polymorphic primer 17899A used to analyze 64
tamarind accessions in semi-arid Eastern Kenya.
ISSR 844 produced band sizes of 200, 500, 600,700, 800 and 900.The primer had 66
polymorphic loci. Band size of 200 bp was observed in MW002, MW003, KB027,
E001, E009 and E010 accessions. 500 bp band was observed in in MW002, MW003,
MS005, KB007, KB016, KB020, KB022, E001, E009, E010, E012 and E015
accessions. Band size of 600 was recorded in MW002, MW003, MS003, MS004,
MS005, KB008, KB016, KB020, KB023, E001, E003, E009, E010, E014 and E016
accessions. Band size of 700 bp was observed in MW001, MW002, MW003, MW004,
MW008, MW009, MW010, MS001, MS003, MS004, MS005, MS006, KB001, KB002,
KB004, KB005, KB006, KB010, KB011, KB012, KB013, KB014, KB015, KB016,
KB017, KB020, KB021, KB024, E001, E003, E009, E010, E012 and E013.

78
Plate 6.6: ISSR primer pattern for polymorphic primer ISSR 844 used to analyze
64 tamarind accessions in semi-arid Eastern Kenya.
ISSR 842 produced band sizes of 300, 400, 500, 600 and 700 bp with 66 polymorphic
loci. 300 band size was observed in MW009, E002, E005, E007, E008, E015 and E016.
500 bp was observed in MW002, MW005, MW009 MS006,KB001, KB002, KB004,
KB005, KB006, KB011, KB012, KB015, KB024, E002, E003, E007, E008, E015 and
E016. Band size of 600bp was observed in MW007, MW009, MS001, KB001, KB003,
KB004, KB005, KB008, KB011, KB012, KB015, KB024, E002, E007, E013 and E018.
Band size of 700 bp was present in MW002, MW005, KB011, KB012, KB015, E002,
E007, E013 and E014.

79
Plate 6.7: ISSR primer pattern for polymorphic primer ISSR 842 used to analyze
64 tamarind accessions in semi-arid Eastern Kenya.
ISSR HB11 produced band sizes of 100, 200, 300, 400, 500, 600,700, 800, 900 and 1000
bp with 68 polymorphic loci. Band size of 100 was present in accessions of KB020,
KB021, KB026,E001, E008, E009,E011, E019 and E020. Band of 200 bp was observed
in KB005, KB006, KB011, KB020, KB021, E001, E008, E009, E012 and E013. 300 bp
band size was present in accessions of MW002, MW009, KB020, E001, E008, E009.
400 bp band was present in accessions of KB001, KB004, KB013, KB018, KB020,
KB026, E001, E008 and E009. Band size of 500 bp was observed in MW002, MW004,
MS001, MS005, KB004, KB007, KB022, E001, E005, E008 and E009. Band size of
600 b was observed in MW003, MW009, KB001, KB004, KB005, KB006, KB008,
E001, E003, E008, E009, KB011, KB012 and KB013. The band size of 700 bp was
present in MW002, MW008, MW009, KB009, E001, E008, E009 and E011. Band size
of 800 bp was observed in MW010, MS001, MS005, E001, E003, E008, E009 and

80
E011. Band size of 900 bp was observed in MW009, E001,E008, E009 and E011. Band
size of 1000 bp was observed in MW009, E001, E003, E008 and E009.
Plate 6.8: ISSR primer pattern for polymorphic primer ISSR HB11 used to analyze
64 tamarind accessions from semi-arid Eastern Kenya.
The size of bands amplified ranged from 100 bp to 1000 bps. Primer ISSR17899B and
ISSRHB11 had the highest effective polymorphism of 101.43% and 87.33%
respectively while ISSR807 had the least effective polymorphism (Table 6.2).

81
Table 6.2: Analysis of polymorphism obtained using 7 ISSR primers in 64
tamarind accessions from semi-arid Eastern Kenya
ISSR
Primers
Number of
amplified
loci(a)
Number of
polymorphic loci
(b)
Effective
Polymorphism
%
Min
band
Max
band
ISSR807 43 32 40.87 200 800
ISSR836 72 61 78.33 400 800
ISSR842 78 66 84.76 300 700
ISSR844 83 57 73.24 200 900
ISSR17899A 80 63 80.92 100 800
ISSR17899B 103 79 101.46 100 1000
ISSRHB11 86 68 87.33 100 1000
The seven scorable primers resulted in 7 loci with a total of 46 alleles. The average
number of alleles was 6.5 alleles per locus. The alleles ranged from 5 for 807 to 10
alleles for ISSRHB11. ISSRHB11 had the highest polymorphism of 0.89 and the highest
gene diversity of 0.90. ISSR807 showed the least polymorphism of 0.73 with the least
gene diversity of 0.74 (Table 6.3).

82
Table 6.3: Analysis of loci and the total number of allele frequencies using 7 ISSR
primers from semi-arid Eastern Kenya
Loci allele 1-D (PIC) Hexp Evenness
ISSR807 5 0.727 0.7452 0.8376
ISSR836 5 0.735 0.7454 0.8740
ISSR844 6 0.773 0.7814 0.8282
ISSR842 5 0.775 0.7859 0.9372
ISSR17899A 6 0.825 0.8348 0.9720
ISSR17899B 9 0.885 0.8937 0.9812
ISSRHB11 10 0.891 0.9016 0.9552
Mean 6.571 0.802 0.8126 0.9122
Total 46
KEY: allele = Number of observed alleles, 1-D = Simpson index (Simpson, 1949),
Hexp = Nei's 1978 gene diversity, Evenness of allele distribution
Genetic distance between the 64 tamarind accession ranged from 2-44. The highest
genetic distance was between E009 and E002 of 44, E18 and E001 of 43, E002 and
E001 of 43, E001 and KB003 of 42. The lowest genetic distance was between KB017
and MW001 of 2, KB008 and MW001 of 3, MW007 and MW006 of 3 (Table 6.4).

83
Table 6.4: Genetic distance among the 64 tamarind accessions from semi-arid Eastern Kenya

84
6.3.3 Analysis of molecular variance (AMOVA) in tamarind accessions from semi-
arid Eastern Kenya
Analysis of molecular variance revealed more variation within a population than among
populations. Variation within a population was 90% while among the population was
10% (Table 6.5). Principal coordinate analysis revealed that the first three components
of two-dimensional PCoA contributed to 40.83% variation (Table 6.6). Accessions in
populations 1, 2, 3 (Mwingi, Masinga and Kibwezi) were closely related while
accessions from Embu were further apart (Fig 6.1).
Table 6.5: Analysis of molecular variance in 64 tamarind accessions from semi-arid
Eastern Kenya
Source df SS MS Est. Var. %
Among Pops 3 49.764 16.588 0.712 10%
Within Pops 60 374.846 6.247 6.247 90%
Total 63 424.609 6.959 100%
Table 6.6: Principal coordinate analysis of 64 tamarind accessions from semi-arid
Eastern Kenya
Axis 1 2 3
% 21.20 11.05 8.58
Cum % 21.20 32.25 40.83

85
Figure 6.1: Principal coordinate analysis (PCoA) of tamarind populations from
semi-arid Eastern Kenya (1-Mwingi, 2-Masinga, 3-Kibwezi, 4- Embu)
6.3.5 Cluster analysis of tamarind accessions from semi-arid Eastern Kenya
HAC clustered the 64 accessions into 7 major clusters. Cluster one comprised of
accessions from Embu which included; E008, E001 and E009. Cluster two comprised of
accessions from Mwingi only and one from Masinga which include; MW009, MW008,
MW010, MW006, MW007, MW005, MW002, MW003 and MS004. Cluster 3
comprised of accessions from Embu and Masinga which included; E011, E012, E013,
E021, E003, MS003 and E014. Cluster four comprised of accessions from Kibwezi
which included; KB004, KB005, KB006, KB012, KB015, KB001, KB010, KB011,
KB002 and KB007. Cluster five comprised only one accession from E010. Cluster six
comprised of accessions from Kibwezi and Masinga which included; KB020, MS01,
KB008, KB017, MS002, KB009, MS006, KB024, KB021, KB024, KB027, KB023,
KB019, KB025, KB002, KB013 and KB014. Cluster seven comprised of accessions

86
from Embu and Kibwezi which included E015, E016, KB022, KB018, KB026, E005,
E017, KB019, KB020, KB004, KB006, KB003 and E018.
Figure 6.2: HAC dendrogram of 64 tamarind accessions from semi-arid Eastern
Kenya amplified using 7 ISSR markers.
6.4 Discussion
ISSR markers were used in characterization studies and revealed genetic diversity in
Opuntia (Valadez-Moctezuma et al., 2014), in cucumber (Kumari et al., 2016), hassawi
rice (Al-Turki & Basahi, 2015) and in tamarind (Sarmiento et al., 2017). Genetic
variation analysis for the four populations revealed high genetic differences within
populations and this was similar to the findings by (Chen et al., 2014; Nilkanta et al.,

87
2017) where the authors found high differences within populations of M. baccifera using
ISSR markers.
Self-incompatible plants had genetic differences at species level and lower differences
among populations (Zawko et al., 2001). Genetic differences in tamarind were expected
since it is a cross-pollinated plant and propagated using seeds thereby displaying
significant variation within the population (Borba et al., 2001). The presence of
pollinators promotes diversity and decreases inbreeding. Sufficient pollinators promote
gene flow which in turn promotes diversity (Ksiazek-Mikenas et al., 2019). Plants with
high geographical ranges tend to maintain high genetic diversity than geographically
localized species (Wang et al., 2018). Genetic diversity within a population is also
influenced by population size, genetic drifts, gene flow and extended periods with a low
number of individuals (Sheeja et al., 2009; Nilkanta et al., 2017)). When the population
size is large the genetic variation is also high and the plants can adapt to climatic
changes unlike small populations which are threatened by genetic drifts that led to
inbreeding depression and loss of diversity (Soo-Rang et al., 2018). Extended long
periods with a low number of individuals in an area can also minimize diversity.
Genetic clusters revealed more diversity compared to the morphological cluster which is
in agreement with reports by Masumbuko and Bryngelsson, (2006); Gajera et al., (2014)
whereby genetic relationship and revealed high genetic diversity among cowpeas and
coffee. Very few accessions clustered based on the counties of collection but most of
them clustered across the counties which was supported by the fact that the tamarind tree
is self-incompatible (Govindaraj et al., 2015) and propagated using seeds (Hogbin &
Peakall, 1999). The presence of pollinators that promote gene flow within populations,
tamarind populations are still large. This clustering was contrary to reports by Wu et al.,
(2018) who reported that plum varieties evaluated clustered based on the regions of
study. Perennials are also able to maintain high levels of variation compared to annuals

88
and short-lived perennials (Ledig, 1986). High levels of variation were also associated
with the fact that the tree was able to adapt to different environmental conditions
(Algabal et al., 2011). Tamarind populations were genetically isolated by mutation and
genetic drift that lead to differences in the allele frequencies at selectively natural loci.
The least diversity was Masinga and this is attributed to habitat loss, small population,
degradation, exploitation and introduction of crop plants in the region.
6.5 Conclusion
Genetic diversity was demonstrated among the tamarind accessions in semi-arid Eastern
Kenya. Populations from Embu were more diverse as they clustered in 10 groups and
PCoA they clustered differently from the rest while least diversity was in Masinga and
Mwingi population. AMOVA revealed variation within a population as 90% while
among populations to be 10%. PIC values for the 7 loci varied from 0.72-0.89 and
diversity from 0.74-0.9. High polymorphism is attributed to pollinators that promote
gene flow within populations and also climatic conditions of different regions. Cluster
analysis 7 major and 19 subclasses with accessions from different regions grouping in
different clusters. Genetic distance between the 64 tamarind accessions ranged from 2-
44. The highest genetic distance was between E009 and E002 of 44, E18 and E001 of
43, E002 and E001 of 43, E001 and KB003 of 42. The lowest genetic distance was
between KB017 and MW001 of 2, KB008 and MW001 of 3, MW007 and MW006 of 3.
6.6 Recommendation
High diversity in Embu can be exploited in marker-assisted breeding. High PIC
produced by primer ISSR17899A and ISSRHB11 can be used to study the genes that
code for important traits in tamarind.

89
CHAPTER SEVEN
EVALUATION OF ANTI-MICROBIAL ACTIVITY OF EXTRACTS FROM
TAMARIND (Tamarindus indica) IN SEMI-ARID EASTERN KENYA AGAINST
BACTERIA AND PLANT FUNGAL PATHOGENS.
Abstract
Natural products are alternatively used in the control of pests and diseases because they
are highly available, cheap and environmentally friendly. This study aimed at evaluating
the antimicrobial activity of leaf and fruit extracts from tamarind trees growing in semi-
arid Eastern Kenya. The extracts were tested for their activity against Bacillus subtilis,
Staphylococcus aureus, Pseudomonas aeruginosa and Escherichia coli, Penicillium
digitatum, Colletotrichum gloeosporioides and Alternaria solani. Fruits and leaves were
sequentially extracted using methanol and water and evaporated using a rotary
evaporator at 40°C. The extracts were then reconstituted using the solvent and stored at
4°C. The pathogenic bacteria were cultured on 28g/l of nutrient agar and the extract-
impregnated discs were inoculated on the plates and cultured at 37°C. Penicillium
dumigitatum was isolated from an orange fruit and cultured on 39g/l of PDA, A. solani
was isolated from tomato fruits and cultured on 50g/l of Malt extract agar.
Colletotrichum gloeosporioides was isolated fran avocado fruit and cultured on 65g/l of
Sabouraud glucose agar. The media were supplemented with chloramphenicol 500mg/l.
Pathogens were incubated at 37 ̊C for 96 hrs. Sub-culturing was done to obtain pure
isolates of the pathogens. Data on bacteria inhibition zones were recorded after 24 hrs
while data on fungal inhibition were collected after 96 hrs and analyzed using SPSS
Version 12. The results of the study revealed that there was no significant difference in

90
inhibition between the leaf and fruit extracts. However, there was a significant inhibition
difference between the five study regions and a significant difference in water and
methanol extracts against B. subtilis. There was significant inhibition of P. aeruginosa in
the five study regions, fruits and leaves and water and methanol. Tamarind extracts were
not effective against S. aureus and E. coli. When compared to common antibiotics
Ampicillin, Methanol leaf extracts from accessions KT007, E017 and E020 had a higher
inhibition to B. subtilis and water fruit extracts from accessions E008 and E014 had a
higher inhibition to B. subtilis. Additionally, methanol leaf extracts from accessions
KT012, E001, KB008 and KB011 had higher inhibition against P. aeruginosa compared
to Streptomycin, Kanamycin and Co-trimoxale. Water fruit extracts from the accession
of KT012 had a higher inhibition of P. aeruginosa compared to Streptomycin,
Kanamycin and Co-trimoxale. Additionally, waterleaf extracts from accessions of
KT001, KB004, KB005, KB011, KB012, KB014 and KB016 had a higher inhibition of
P. aeruginosa compared to Kanamycin, Gentamycin, Streptomycin, Ampicillin, and Co-
trimoxale. There was no significant inhibition of S. aureus and E. coli by tamarind
extracts. There was no significant inhibition of fungal pathogens by tamarind extracts.
The results of this study revealed that Kenyan tamarind had limited potential to be used
as a biological control agent against B. subtilis and P. aeruginosa. However, using
tamarind leaf and fruit extracts as fungicides against P. digitatum, A. solani and C.
gloeosporioides proved to be ineffective.
7.1 Introduction
Tamarind has been used for many years to control fungal and bacterial pathogens as
different parts of tamarind contain different medicinal properties (Escalona Arranz et al.,
2010). The increased antimicrobial properties of tamarind increased its ethnobotanical
use in Latin America, Asia and Africa (Meléndez & Capriles, 2006). Tamarind fruit
extracts are used as refrigerants in fever and as laxatives and carminatives alone or as a
combination. In southeast Asia the pulp has been used to cure sore throats (Du Preez,

91
2003). Tamarind pulp is composed of tartaric acid, malic acid, citric acid, pectin gum,
potassium bitartrate and parenchymatous fiber (Nazir et al., 2017).
In West Africa tamarind has been used as food and in herbal therapies (Nwodo et al.,
2011). In Nigeria the pulp is used in the production of the local drink, preservation of
food and general traditional medicine as a drug conveyor. A combination of tamarind
with other herbs was reported to be effective against constipation, fever and sore throats
(Abukakar et al., 2008).
Most rural communities worldwide depended on traditional medicines for health
solutions (Nwodo et al., 2011), which were more effective compared to the predominant
synthetic drugs popularly found in urban areas where resistance to conventional
medicine was a challenge. The resistance increased research in herbal medicine (Paul
Das & Banerjee, 2014). Extracts of biologically active compounds were reported to offer
a new source of antibacterial and antifungals (Abukakar et al., 2008).
Pathogenic fungi of economic importance in horticulture include; Anthracnose spp,
Alternaria spp, Fusarium spp, Penicillium spp that cause crop disease and post-harvest
losses (Yang et al., 2017). Fungi infect the plants by killing the host, feeding on the
dead materials and others colonizing the living tissue (Doehlemann et al., 2017). Most
pathogens infect unripe fruits and the symptoms become visible as the fruit ripens due to
the favorable conditions of the fruit (Buchholz et al., 2018). The pathogens are spread by
wind, water and vectors (Narayanasamy, 2011). Control of fungal pathogens has
depended on synthetic chemicals that are a threat to the environment and humans (Droby
et al., 2009). Most pathogens have developed resistance to chemicals used in control
(Hua et al., 2018) and this has led to resistance to chemical control has increased
research towards using plant extracts that offer alternative bio-fungicide that are
relatively nontoxic (Mahlo et al., 2016).

92
In the Philippines, young tamarind leaf extracts were evaluated in different solvents and
they produced a strong inhibitory effect against C. gloeosporioides, the inhibition was
higher compared to the commercial fungicide Mancozeb (Gatan & Jonnalaxer, 2013).
John et al. (2004), evaluated the antifungal activity of tamarind extracts and the results
showed that the extracts were effective against a wide range of fungal pathogen; C.
gloeosporioides, A. solani, F. solani. The author concluded that the extracts offered a
great opportunity to be used as a bio-fungicide against soil, seed and airborne
phytopathogenic fungi.
Plant extracts have been used in the control of P. digitatum and proved to be more
effective than the commercial fungicides or equal to their activity. In Nigeria, Adeola &
Aworh. (2012) evaluated the activity of tamarind fruits extracted using methanol and
hexane and the results showed that hexane fruit pulp extracts were effective against
Penicillium spp. Gupta et al. (2014) evaluated the activity of tamarind ethanol extracts
against food fungal and bacterial pathogens reported that Penicillium spp and
Aspergillus were partially inhibited. Leaves, seeds and fruits of forty-five plant samples
in Morocco were evaluated for antifungal activity against P. digitatum. Their fruits,
leaves, stems and seeds were evaluated and 23 plants reported a significant antifungal
activity of more than 50%. The other 22 aqueous extracts showed reduced inhibitory
effect or enhanced mycelia growth (Askarne et al., 2011). In Kenya tamarind is present
in the arid and semi-arid areas and there is limited information on its antimicrobial
activity.

93
7.2 Materials and methods
7.2.1 Sample preparation
Leaf and fruit samples were collected from tamarind trees as described in Chapter 3
(Section 3.2). The pods and the leaves were collected and dried under shade, the pods
were dehusked and the pulp separated and the leaves pulverized and used for evaluation.
7.2.2 Extraction of anti-microbial compounds
Twenty grams of the leaves and fruit from each accession were weighed and each
dissolved in 120 ml of solvent. This was extracted sequentially using methanol and
water as described by Uthayarasa et al. (2010). The extract was dried using a rotary
evaporator at 30-40°C and 0.2 gms of the extract was dissolved in 1ml of the solvent as
described by Predrag et al., (2005) and stored at 4°C.
7.2.3 Pathogen for the study
Two gram-positive bacteria (B. subtilis and S. aureus) and two gram-negative bacteria
(E. coli and P. aeruginosa) were used. The micro-organisms were collected from
National Public Health laboratories then preserved in nutrients broth and stored at 4˚C
and cultured on 28g/l of nutrient agar. Pathogenic fungi were isolated from several
horticultural crops; oranges, tomatoes and avocados. Penicillium digitatum was isolated
from an orange fruit. The infected orange was surface sterilized with distilled water and
cultured on 39g/l of Potato dextrose agar (PDA). Alternaria solani was isolated from a
tomato fruit and cultured on 50g/l of Malt Extract Agar (MEA). Colletotrichum
gloeosporioides was isolated from avocado fruit and cultured on 65g/l of Sabouraud
Glucose Agar (SGA). The three media: PDA, MEA and SGA were supplemented with

94
500mg/l of chloramphenicol. The pathogens were subsubcultured to obtain pure cultures
which were identified based on morphology as described by Samson and Verga, (2007).
7.2.4 Pathogen inoculation
Disc diffusion method was used to test the antimicrobial potential of tamarind extract
against the selected bacteria species as described by (Sandle, 2016). The pathogens were
inoculated on nutrient agar media onto which extract impregnated discs were placed and
incubated at 24°C for 48 hrs. Plant pathogens were inoculated into PDA, MAE and SGA
media and incubated at 37°C for 96 hrs.
The antimicrobial potential of the tested extract was validated by measuring the
magnitude of a clear zone of inhibition around the point of application of the disc with
the extract. The solvents were used as negative control while streptomycin, kanamycin
and co-trimoxale, tetracycline, ampicillin, gentamycin, sulfamethoxazole and benomyl
were used as control antibiotics and antifungal.
7.2.5 Data collection and analysis
The experiment was done in 3 replicates in a split-block design (two main blocks of
leaves and fruits, each block divided into methanol and water as solvents, then solvent
tested against the seven pathogens. Data on inhibition zones were collected as the
diameter of the zone in millimeters (mm) and analyzed using two –way ANOVA
followed by Post Hoc Test using Chi-squares are to compare mean inhibition zones of
tamarind plant part and solvent extracts. The significance level was set at p< 0.05. This
was done by SPSS Version 12.

95
7.3 Results
Inhibition was observed against B. subtilis and P. aeruginosa while there was no
activity against E. coli, S. aureus, Penicillium digitatum, Alternaria solani and
Colletotrichum gloeosporioides.
There was a significant difference in inhibition of tamarind extracts from study regions;
Kitui, Mwingi, Embu, Masinga and Kibwezi (Table 7.1). Tamarind leaf and fruit
extracts were not significantly different but there was significant inhibition in water and
methanol extracts against B. subtilis at p<0.05.
Table 7. 1: Inhibition of B.subtilis by tamarind extracts from semi-arid Eastern
Kenya
Source Wald Chi-Square Sig.
Study regions 65.484 .000
Plant parts (leaves and fruits) .001 .973
Extraction solvent ( water and
methanol)
22.456 .000
There was a significant inhibition of P. aeruginosa by tamarind extracts from study
regions; Kitui, Mwingi, Masinga, Embu and Kibwezi extracts. Tamarind leaf and fruit
extracts showed significant inhibition. The extraction solvents; water and methanol
revealed significant inhibition against P. aeruginosa (Table 7.2).
Table 7. 2: Inhibition of P.aeruginosa by tamarind extracts from semi-arid Eastern
Kenya.
Source Wald Chi-
Square
Sig.
Study sites 16.460 .002
Plant parts (leaves and fruits) 242.176 .000
Extraction solvents (methanol and
water)
207.033 .000

96
7.3.1 Inhibition of Bacillus subtilis by tamarind extracts from semi-arid Eastern
Kenya
Methanol Leaf extracts that were active against B. subtilis included accessions of
KT001, KT002, KT004, KT007, KT011, KT012, KT015, KT018, KT020, E001, E003,
E004, E005, E008, E009, E010, E012, E014, E015, E016, E017, E018, E020, E021,
MW002, MW005, MW006, MW010, MS004, KB002, KB004, KB006, KB009, KB010
and KB022 (Fig 7.1 and Plate 7.1 A).
Figure 7.1: Inhibition of B. subtilis by tamarind leaves extracted using methanol
Tamarind methanol leaf extracts of accessions of KT007, E017 and E020 inhibited B.
subtilis better than ampicillin (Table 7.3). All the other common antibiotics showed a
higher inhibition activity compared to the tamarind extracts.

97
Table 7.3: Inhibition of B.subtilis with methanol leaf extracts from semi-arid
Eastern Kenya compared to common antibiotics
Leaf
samples
Mean
(mm)
Leaf
samples
Mean
(mm)
Common
antibiotics
Mean
(mm)
KT007 1.47±0.29 E004 1.33±0.67 Gentamycin 22.67±0.67
KT011 1.07±0.58 E008 2.33±0.33 Tetracycline 22.33±0.33
MW002 1.17±0.44
E009 1.33±0.33
Ampicillin
1.33±0.33
MW005 1.33±0.88
E010 1.33±0.33
Co-trimoxale 23.67±0.88
MW006 1.00±0.58
E012 1.93±0.07 Chloramphenicol 19.33±1.33
MW01 1.67±0.88
E015 1.33±0.67 Sulfamethoxazole 2.67±0.44
KB002 1.17±0.17 E017 1.67±0.33 Streptomycin 21.67±1.20
E020 2.67±0.67
E021 1.17±0.44 Kanamycin 20.67±0.67
Tamarind methanol fruit extracts that were active against B. subtilis were from Kibwezi
(KB001, KB002, KB003, KB004, KB005, KB006, KB007, KB008, KB009, KB011,
KB012, KB013, KB014, KB015, KB016 and KB017) and Embu (E003 and E005) (Fig
7.2 and Plate 7.2 B).

98
Figure 7.2: Inhibition of B. subtilis by tamarind fruits extracted using methanol
All fruit extracts from methanol as a solvent had inhibition zones less than the common
antibiotics. Leaf extracts from methanol showed some inhibition against B. subtilis
(Table 7.2).
Table 7. 4: Inhibition of B. subtilis with methanol fruit extracts from semi-arid
Eastern Kenya compared to standard antibiotics.
Fruit
samples
Mean
(mm)
Fruit
samples
Mean
(mm)
Common
antibiotics
Mean
(mm)
E003 0.23±0.03 KB010 1.00±0.06 Gentamycin 22.67±0.67
E005 0.50±0.06 KB011 1.00±0.15 Tetracyclin 22.33±0.33
KB001 1.33±0.49 KB012 1.00±0.12 Ampicillin 1.33±0.33
KB002 1.00±0.21 KB013 1.00±0.25 Co-trimoxale 23.67±0.88
KB003 1.33±0.27 KB014 1.33±0.24 Chloromphenical 19.33±1.33
KB004 1.33±0.24 KB015 0.67±0.09 Sulfamethoxazole 2.67±0.44
KB005 1.17±0.33 KB016 1.33±0.27 Streptomycin 21.67±1.20
KB006 1.00±0.12 KB017 0.30±0.06 Kanamycin 20.67±0.67
KB007
KB008
1.00±0.12
1.00±0.20
KB009 1.00±0.15

99
Plate 7. 1: Inhibition of B.subtilis by tamarind leaves (A) and fruits (B) extracted
using methanol
Tamarind water leaf extracts that were active against B. subtilis were from Embu (E003,
E005) and Kibwezi (KB001, KB002, KB003, KB004, KB005, KB006, KB007, KB008,
KB009, KB011, KB012, KB013, KB014, KB015, KB016 and KB017) (Fig 7.3).
Figure 7. 3: Inhibition of B. subtilis by tamarind leaves extracted using water
KT001
ML (B
subtilis)
KB004MF
(B. subtilis)
A B

100
Almost all tamarind leaves extracted using water had less inhibition zones compared to
common antibiotics (Table 7.3).
Table 7. 5: Inhibition of B.subtilis with tamarind water leaf extracts from semi-arid
Eastern Kenya compared with common antibiotics.
Inhibition zones
Leaf
samples
Mean(mm) leaf
samples
Mean (mm) Common
antibiotics
Mean (mm)
E003 0.23 ± 0.03 KB008 0.83±0.34 Kanamycin 20.67±0.67
E005 0.53 ± 0.03 KB009 1.00±0.5 Gentamycin 22.67±0.67
KB001 1.33±0.33 KB011 1.00±0.5 Tetracycline 22.33±0.33
KB002 1.07±.58 KB012 1.00±0.42 Ampicillin 1.33±0.33
KB003 1.33±0.33 KB013 1.00±0.29 Co-trimoxale 23.67±0.88
KB004 1.33±0.33 KB014 1.33±0.33 Chloramphenicol 19.33±1.33
KB005 1.17±0.44 KB015 0.67±0.17 Sulfamethoxazole 2.67±0.44
KB006 0.77±0.15 KB016 1.33±0.60 Streptomycin 21.67±1.20
KB007 1.17±0.17 KB017 0.30±0.10
Tamarind fruit extracted using water that were active against B. subtilis were from Kitui
(KT004, KT009, KT011, KT015, KT025), Embu (E003, E005, E006, E007, E008,
E010, E013, E014, E017, E018, E019, E021) and Kibwezi (KB007 and KB022). Fruits
extracted using water had less inhibition compared to common antibiotics except for
extracts from accessions E008, E014 that performed better than ampicillin (Fig 7.4,
Table 7.6 and plate 7.2)

101
Figure 7.4: Inhibition of B. subtilis by tamarind fruits from semi-arid Eastern
Kenya extracted using water
Table 7.6: Inhibition of B.subtilis with tamarind water extracts from semi-arid
Eastern Kenya compared to common antibiotics
Fruit
samples
Mean(mm) Common antibiotics Mean (mm)
KT015 1.33±0.17 Kanamycin 20.67±0.67
E003 1.33±0.33 Gentamycin 22.67±0.67
E004 1.33±0.44 Tetracycline 22.33±0.33
E007 1.33±0.33 Ampicillin 1.33±0.33
E008 4.00±0.58 Co-trimoxale 23.67±0.88
E013 1.67±0.33 Chloramphenicol 19.33±1.33
E014 2.67±0.33 Sulfamethoxazole 2.67±0.44
KB007 1.13±0.24 Streptomycin 21.67±1.20

102
Plate 7. 2: Inhibition of B.subtilis by tamarind fruits (A) and leaves (B) extracted
using water
7.3.2 Inhibition of P. aeruginosa by tamarind extracts from semi-arid Eastern
Kenya
Tamarind methanol leaf extracts from Kitui (KT005, KT007, KT0012, KT013, KT016,
KT022, KT023), Embu (E001, E002, E005, E006, E009, E010, E015, E016 and E020)
and Kibwezi (KB008, KB011, KB016 and KB017) were active against P. aeruginosa.
accessions (Fig 7.6). Tamarind fruits extracted using methanol were not active against P.
aeruginosa

103
Figure 7.5: Inhibition of P. aeruginosa by tamarind leaves extracted using methanol
from semi-arid Eastern Kenya
Methanol leaf extracts of accessions KT012, E001, KB008 and KB011 had inhibitions
greater than streptomycin, kanamycin and co-trimoxale (Table 7.7)
Table 7.7: Inhibition of P.aeruginosa by methanol leaf extracts from semi-Eastern
Kenya compared to common antibiotics
Leaf
samples
Mean(mm)
Leaf
samples
Mean
(mm)
Common
antibiotics
Mean(mm)
KT007 0.67±0.18 E009 0.53±0.15 Co-trimoxale 1.00±0.10
KT012 1.67±0.44 E010 0.67±0.12 Chloramphenicol 6.00±2.00
KT022 0.67±0.27 E020 0.67±0.13 Sulfamethoxazole 4.67±1.33
KT023 0.50±0.06 KB008 1.17±0.33 Streptomycin 1.00±0.12
E001 1.67±0.44 KB010 1.00±0.29 Kanamycin 1.00±0.23
E002 0.50±0.17 KB011 1.33±0.17 Ampicillin 1.87±0.23
E005 0.67±0.12 KB016 0.50±0.17 Gentamycin 1.67±0.33
Leaves extracted using water that were active against P. aeruginosa included extracts of
accessions; KT001, KT002, KT003, KT004,KT005, KT008, KT009, KT011, KT012,
KT013, KT014, KT015, KT016, KT017, KT018, KT019,KT020, KT022, KT023,

104
KT024, KT025, E001, E002, E003, E004, E005, E006, E007, E008,E009, E010, E011,
E012, E013, E015, E016, E019, E020, E021, MW001, MW003, MW004, MW006,
MW007, MW008, MS001, MS002, MS003, MS004, MS005, MS006, KB001, KB002,
KB003, KB004, KB005, KB006, KB008, KB009 KB010, KB011,KB012, KB013,
KB015, KB014, KB016, KB017, KB018, KB019, KB020, KB021, KB022,
KB023,KB024, KB025, KB026 and KB0027 (Fig7.6).
Figure 7.6: Inhibition of P. aeruginosa by tamarind leaves extracted using water
from semi-arid Eastern Kenya
Leaf Extracts of accessions KT001, KB004, KB005, KB011, KB012, KB014 and
KB016 had inhibition zones greater than kanamycin, gentamycin, streptomycin,
ampicillin, and co-trimoxale (Table 7.8).

105
Table 7.8: Inhibition of P. aeruginosa by tamarind leaves extracted using water
from semi-arid Eastern Kenya compared to common antibiotics.
Samples Mean(mm) Samples Mean (mm)
KT001 3.33±0.88 Chloramphenicol 6.00±2.00
KB004 3.67±0.23 Kanamycin 1.00±0.23
KB005 3.00±0.40 Sulfamethoxazole 4.67±1.33
KB011 3.33±0.57 Gentamycin 1.67±0.33
KB012 3.33±0.33 Streptomycin 1.00±0.12
KB014 3.00±0.25 Tetracycline 20.67±0.67
KB016 4.00±0.29 Ampicillin 1.87±0.23
Co-trimoxale 1.00±0.10
Tamarind fruits extracted using water that were active against P. aeruginosa were from
Kitui, Embu and Kibwezi which included KT011, KT012, KT024, E004, E005, E006,
E007, E011, E012, E013, E014, E015, KB010, KB017 and KB019 (Fig7.7).

106
Figure 7.7: Inhibition of P. aeruginosa by tamarind fruits extracted using water
from semi-arid Eastern Kenya.
Fruits extracted using water had less inhibition zones compared to the common
antibiotics except for extract of accession KT012 that performed better than
streptomycin, kanamycin and co-trimoxale (Table 7.9).
Table 7.9: Inhibition of P.aeruginosa by tamarind fruits extracted using water
compared to common antibiotics
Fruit
samples
Mean(mm)
Fruit
samples
Mean(mm)
Common
antibiotics
Mean(mm)
KT011 1.00±0.29 E015 0.60±0.12 Co-trimoxale 1.00±0.10
KT012 1.67±0.17 KB010 0.67±0.18 Chloramphenicol 6.00±2.00
KT024 0.27±0.12 KB017 0.67±0.13 Sulfamethoxazole 4.67±1.33
E004 1.27±0.18 KB019 0.50±0.17 Streptomycin 1.00±0.12
E005 1.00±0.31 E012 1.00±0.29 kanamycin 1.00±0.23
E006 0.23±0.03 E013 1.00±0.31 Ampicillin 1.87±0.23
E007 0.33±0.09 E014 0.33±0.17
E011 0.33±0.09

107
7.3.3 Inhibition activity of tamarind extracts from Kitui, Mwingi, Embu, Kibwezi
and Masinga), solvents (Water and methanol) and plant parts (leaves and fruits)
Tamarind extracts from Embu had high inhibition while the least inhibition was from
Mwingi (Fig 7.8A). Water extracts had higher inhibition than methanol (Fig 7.8B). The
leaves as plant parts had higher inhibition than fruits (Fig 7.8 C). Tamarind extracts
inhibited P. aeruginosa highly followed by B. subtilis and there was no inhibition of E.
coli and S. aureus (Fig 7.8D).
Figure 7.8: Inhibition zones of tamarind extracts: Study regions (A), extraction
solvent (B), plant parts (C) and study micro-organism (D)
7.4 Discussion
7.4.1 Inhibition of bacteria (B. subtilis, S. aureus, E. coli, P. aeruginosa) by
tamarind extracts
Plant extracts are considered active against micro-organisms when they have inhibition
zones of more than 6mm (Saadabi and Ayoub, 2009). In this study, both gram-positive
and negative were inhibited by the extracts but all the inhibitions were less than 6mm.

108
The five regions of the study had significant inhibition against B. subtilis and P.
aeruginosa with Embu having the highest inhibition, followed by Kibwezi, then Kitui,
Masinga and least inhibition in Mwingi which was attributed to the differences in soil
types, rainfall availability, temperatures and humidity as this factors contribute greatly to
the availability and different antimicrobial compounds in different plants (Yahia et al.,
2020).
Leaf extracts had higher inhibition compared to fruit extracts which was contrary to the
reports by Abdallah & Muhammad, (2018) who reported that fruits had a higher
inhibition than the leaves. Similarly, reports by Nwodo et al. (2011) showed that fruit
and bark which are storage organs had higher inhibition zones.
It was observed that fruits extracted using methanol had no inhibition while reports by
Ali et al. (2015) indicated high inhibition in fruits extracted using methanol against S.
aureus, B. subtilis, E.coli and P aeruginosa. Abdallah & Muhammad, (2018) also
indicated that tamarind fruits extracted using methanol were effective against E. coli.
Paul das and Banerjee, (2014) reported that tamarind fruits extracted using methanol
were effective against B. subtilis with an inhibition zone of 15.6 mm which was higher
compared to 1.66 mm from my study.
Aqueous fruit extracts exhibited insignificant zones of inhibition but a report by Ali et
al. (2015) revealed there was no inhibition. Aliyu et al. (2017) and Compean and
Ynalves, (2014) reported that aqueous fruit extracts of tamarind were active against S
.aureus and E.coli which was contrary to my findings where S. aureus and E. coli were
not inhibited at all. Aqueous leaf extracts were active against B. subtilis and P.
aeruginosa but the findings of Ali et al. (2015) revealed that the extracts were inactive
against all micro-organisms. Different inhibition abilities could be associated with

109
different compositions of antimicrobial compounds in different regions (Yahia et al.,
2020).
Water extracts had a significant inhibition compared to methanol. This is supported by
findings of the study by Hijazi et al. (2013) who reported that polar solvents had a
higher ability to extract more compounds though this would have a combination of high
numbers of impurities. This was in agreement with the findings by Esimone et al.,
(2012). Saadabi & Ayoub, (2009) also showed that water extracts inhibited seven strains
of S. aureus.
Water and methanol solvents were able to extract compounds that were active against
the microbes. In this study, water had significant inhibition compared to methanol. This
finding was in agreement with Obeidat et al. (2012) who reported that water extracts of
A. discondis had a high inhibition against P. aeruginosa. Conversely reports by
Mudzengi et al. (2017) showed that aqueous extracts of D. cinera, S. persica and C.
mpone inhibited E. coli higher than S. aureus. This could be associated with the polarity
of water to extract and dissolve more antimicrobial compounds than methanol (Thouri et
al., 2017).
Methanol extracts had the least inhibition against the pathogens. This finding was
contrary to the reports by Bacon et al. (2016) who revealed that most antimicrobial
compounds of Japapeno were extracted using methanol had a high inhibition against the
pathogens. Additionally, Alo et al. (2012) reported that Ocinum gratissimum and
Vernonia amygdalin extracted using methanol highly inhibited E. coli. Experiments by
Mariita et al. (2011) showed that methanol extracts of T. africanum, B. angustifolia, S.
multiflorus, A. nilotica and G. simi had high inhibition against S. aureus, E. coli and P.
aeruginosa.

110
Commercial antibiotics had higher inhibition than most of the extracts. These results
were similar to Abdallah & Muhammad, (2018) report. Tamarind extracts hardly
inhibited E. coli and S. aureus which indicates that these extracts could not be used in
treating diseases caused by the two micro-organisms. Extracts of KT001, KB004,
KB005, KB011, KB014, KB016, E008 and E014 could be exploited more as they were
effective against P. aeruginosa than K, Gen, S, Amp and COT.
7.4.2 Inhibition of plant fungal pathogens (P. digitatum, C. gloeosporioides, A.
solani) by tamarind extracts
Neither tamarind fruit nor leaf extracts showed inhibition against P. digitatum, similar
results were observed by Raju and Naik, (2006) who evaluated the effects of pre-harvest
sprays of fungicides and botanicals on storage diseases of onion. The authors observed
that all concentrations of 1%, 2.5% and 5% of tamarind extracts did not inhibit the
growth of mycelia. The results were closely similar to the findings by Necha et al.
(2002), where the authors evaluated the influence of leaf, fruit and seed powders and
extracts of P. dulce on the invitro vegetative growth of seven post-harvest fungi. The
results revealed that seed powders had higher inhibition compared to fruits and leaves.
Seed powders of P. dulce at 10mg/ml stimulated mycelial growth of P. digitatum when
extracted sequentially using hexane, dichloromethane, acetone, methanol and water. P.
digitatum was found to be the least sensitive fungi since it had only two fractions that
were fungistic. These results contradicted the findings Tequida-Meneses et al. (2002).
They reported that some wild plants extracted using methanol and ethanol had antifungal
activity against Penicillium spp.
Alternaria solani was not inhibited by any of the tamarind extracts. Similar results were
obtained by Necha et al. (2002). Their study showed that P. dulces seeds powder at
10mg/ml extracted using methanol and water significantly stimulated the growth of

111
Alternaria spp. This was contrary to Mishra et al. (2009) findings who reported that;
bark and leaf extracts of C. zeylanium inhibited 100% of the spore germination of
Alternaria spp. Methanol extracts of paper mint, ravandula and eucalyptus inhibited
mycelial growth as well as spore germination of Alternaria spp. Cabrera et al. (2009)
also reported contrary results from this study wherein their findings leaves of S.
officinalis and R. officinalis and the seed extracts of Salivia scolymus had higher
inhibition even compared to conventional fungicide captan and it could be used instead.
Colletotrichum gloeosporioides was not inhibited by any tamarind extracts. This was
contrary to the reports by Thangavelu et al. (2004). The authors reported that extracts of
S. torvum inhibited significantly the incidence of Colletotrichtricum spp in bananas and
extended the shelf life from 15-20 days which was much better than benomyl which is
the commercial fungicide. Chen & Dai, (2012) also reported that C. camphora extracts
exhibited great inhibition against Colletotrichum spp in cucumber which was better
compared to the commercial fungicide.
7.5 Conclusion
Tamarind extracts of KB004, KB005, KB011, KB012, KB014, KB015 E008 and E014
have antimicrobial activity against B. subtilis and P. aeruginosa. Tamarind extracts from
semi-arid Eastern Kenya are not effective against E. coli and S. aureus and horticultural
fungal pathogens of A. solani, P. digitatum and C. gloeosporioides
7.6 Recommendation
The activity of tamarind extracts against B. Subtilis and P. aeruginosa is important in
ethnobotany. However further study is necessary to identify antimicrobial compounds in
tamarind parts such as roots and bark using other extraction solvents. Additionally,
testing tamarind extracts against plant bacterial pathogens is recommended.

112
CHAPTER EIGHT
GENERAL CONCLUSION AND RECOMMENDATIONS
8.1 Conclusions
Tamarind was not produced as a main crop in the semi-arid Eastern Kenya. It was
intercropped with the other crops and majorly legumes and cereals which were
considered important. Tamarind occupied less acreage of the total farms because it was
not considered as the main crop. Management practices such as fertilizer application,
pruning and propagation were not carried out. Tamarind was not considered as the main
food, it was utilized as an ingredient in juices, sources and only considered as an
important vegetable during the lean periods. Tamarind production was constrained by
weevils and poor marketing channels.
There exists morphological and genetic diversity among tamarind accessions in semi-
arid Eastern Kenya. Significant variation was recorded in trunk diameter at the ground,
pod length, pulp color, pod color and seed shape of irregular and ovate across the
counties. Tamarind accessions clustered in 3 major groups and the clusters had a
variation of 66.12 within clusters and 33.18 among the clusters.
Genetic diversity was revealed among accessions from semi-arid Eastern Kenya. There
was high variation within populations and least among the population. Seven major
clusters revealed high genetic diversity. Furthermore, accessions from Embu were more
diverse they clustered in 10 sub-clusters. Loci ISSR17899B and ISSRHB11 revealed
high PIC and genetic diversity among the tamarind accessions.

113
Tamarind extracts of KB004, KB005, KB011, KB012, KB014, KB015, E008 and E014
showed antimicrobial activity against B. subtilis and P. aeruginosa. Tamarind extracts
were not effective against E. coli, S. aureus, A. solani, P. digitatum and C.
gloeosporioides.
8.2 Recommendations
Production data collected could be used in the improvement of tamarind yields by
developing crop management practices such as vegetative propagation, pruning, pest
control (tamarind weevil), and fertilization e.t.c. Utilization information could be
usedsensitize the public on the importance of tamarind and develop commercialization.
There is a need to develop proper marketing strategies so that the farmers can realize the
full potential of tamarind.
Morphological and genetic diversity observed among the Embu accessions will be
utilized in breeding programs for the improvement of tamarind using marker-assisted
programs. PIC information obtained will be used in building tamarind genetic banks and
breeding. Locus HB11 can be exploited further to determine the genes present in
tamarind and their functions. Extracts from accessions of Kibwezi (KB004, KB005,
KB011, KB012, KB014 KB015) and Embu (E008 and E014) can be explored in
ethnobotany against B. Subtilis and P. aeruginosa infections. There is need to evaluate
tamarind bark and bark extracts using other solvents and also evalauate the antimicrobial
activity of the tamarind extracts against plant bacterial pathogens. Additionally, further
work can be carried out on the evaluation of composition of tamarind seed powder.

114
REFERENCES
Abdallah, M. S., & Muhammad, A. (2018). Antibacterial activity of leaves and fruits
extract of Tamarindus indica against clinical isolates of Escherichia coli and
Shigella at Potiskum Yobe state, Nigeria. Journal of analytical and
pharmaceutical Research. 7(8), 606–609.
Abukakar. M.G., Ukwuani., A.N. & Shehu. R.A. (2008). Phytochemical Screening
and Antibacterial Activity of Tamarindus Indica Pulp Extract. Asian Journal
of Biochemistry 3(2.), 134–138.
Adeniyi, V. O., Olaifa, F. E., Emikpe, B. O., & Ogunbanwo, S. T. (2017).
Phytochemical components and antimicrobial activity of Tamarindus indica
extracts against some pathogens. BJI. 17(12), 1–9.
Adeola, A. A., & Aworh, O. C. (2012). A Comparative Evaluation of the Chemical
Properties of Wild Tamarind (Tamarindus indica L.) Fruits in Nigeria. 6(1),
49–57.
Alansi, S., Tarroum, M., Al-Qurainy, F., Khan, S., & Nadeem, M. (2016). Use of
ISSR markers to assess the genetic diversity in wild medicinal Ziziphus
spina-christi (L.) Willd. Collected from different regions of Saudi Arabia.
Biotechnology & Biotechnological Equipment, 30(5), 942–947.

115
Alcasid, C., Dimasingkil, S., Valencia, L. (2016). Evaluation of plant extracts against
anthracnose of mango (Mangifera indica L.) caused by Colletotrichum
gloeosporioides Penz. Journal of tropical plant pathology. 52(1), 51–59.
Algabal, A. Y., Papanna, N., & Simon, L. (2011). Amplified Fragment Length
Polymorphism Marker-Based Genetic Diversity in Tamarind (Tamarindus
indica). International Journal of Fruit Science. 11(1), 1–16.
Ali, B. A., Almagboul, Z. A., & Mohammed, M. O. (2015). Antimicrobial activity of
fruits, leaves, seeds and stems extracts of Ziziphus spina-christi. Arabian
journal of medicinal and aromatic plants. 1(2): pp 94–107.
Aliyu, A. M., Musa, F. M., & Abeku, R. (2017). Antibacterial activity of fruit and
bark extracts of Tamarindus indica against Escherichia coli and
Staphylococcus aureus. Bayero Journal of pure and applied science. 10(1),
184–187.
Allard, R. W. (2019). Plant breeding. Encyclopedia Britannica.
https://www.britannica.com/science/plant-breeding
Alo, M. M., Anyim, C., Igwe, J. C., Elom, M., & Uchenna, D. S. (2012).
Antimicrobial activity of water, Ethanol and methanol extracts of Ocimum
gratissimum, Vernonia amydalina and Afromomum mulaguet. Advances in
applied science research. 3(2), 844–848.

116
Altrafine. (2018). Tamarind Kernel powder: Application in food and pharmaceutical
industries. Indian Spices and Seeds.
https://www.altrafine.com/blog/tamarind-kernel-powder-application-in-
industries/. Accessed 6/8/2020
Al-Turki, T., & Basahi, M. (2015). Assessment of ISSR based molecular genetic
diversity of Hassawi rice in Saudi Arabia (Vol. 22).
Alvarez, H., Limongi, R., Pena, G., Navarrette, B., Zambrano, E., & Viera, W.
(2019). Agro-morphological characterization" In situ" of Tamarindus indica
L in dry forests of Ecuador. Journal of tropical agriculture science. 42(3),
pp1147–1156.
Anand, U., Herrera, N. J., Altemimi, A., & Lakhssassi, N. (2019). A Comprehensive
Review on Medicinal Plants as Antimicrobial Therapeutics: Potential
Avenues of Biocompatible Drug Discovery. Metabolites 9(11), 258–290.
Angiolella, L., Sacchetti, G., & Efferth, T. (2018). Antimicrobial and Antioxidant
Activities of Natural Compounds. PubMed ID 29977311
Aslam, B., Wang, W., Arshad, M. 1, Khurshid, M., Muzammil, S., Rasool, M. H.,
Nisar, M. A., Alvi, R. F., Aslam, M. A., Qamar, M. U., Salamat, M. K. F., &
Baloch, Z. (2018). Antibiotic resistance: A rundown of a global crisis. Infect
drug resist 2018(11), 1645–1658.

117
Askarne, L., Talibi, I., Serghini, M. A., Boubaker, H., Msanda, F., Ait Ben Aoumar,
A., & Boudyach, E. H. (2011). Antifungal activity of Moroccan plants
against Penicillium italicum, the causal agent of blue mold of citrus.
Laboratoire de Biotechnologies et Valorisation des Ressources Naturelles,
équipe de phytopathologie et lutte intégrée, Université Ibn Zohr, Faculté des
Sciences, B.P. 8106, Agadir, Maroc. Integrated control in citrus fruit crops.
62, 51–54.
Azad, S. (2018). Tamarindo—Tamarindus indica. In S. Rodrigues, E. De Oliveira
Silva, and E. De Brito (Eds.), Exotic Fruits. (pp. 403–412). Academic Press.
Ayala-Silver, T., Gubbuk, H., Winterstein, M., & Mustiga, G. (2016). Pomological
and physicochemical characterization of Tamarindus indica grown in Florida.
100(2), 141–154.
Bacon, K., Boyer, R., Denbow, C., O’Keefe, S., Neilson, A., & Williams, R. (2016).
Evaluation of different solvents to extract antibacterial compounds from
jalapeño peppers. Food Science and Nutrition. 5(3), 497–503. PubMed.
Bassetti, M, Merelli, M., Temperoni, C., & Astilean, A. (2013). New antibiotics for
bad bugs: Where are we? Ann Clin Microbiol antimicrob.12(22), 1-15.
Bautista-Baños, S., Hernández-López, M., Bosquez-Molina, E., & Wilson, C. L.
(2003). Effects of chitosan and plant extracts on growth of Colletotrichum

118
gloeosporioides, anthracnose levels and quality of papaya fruit. Crop
Protection. 22(9), 1087–1092.
Bekele, A., & Bekele, E. (2014). Overview: Morphological and Molecular Markers
role in Crop Improvement Programs. 3(3), 035–042.
Betser, L. (2009). Rapid Reconnaissance Market Survey on Tamarind in Kenya (pp.
1–11). ICRAF. Accessed 1/13/2020
Bhadoriya, S. S, Ganeshpurkar, A, Narwaria, J., Rai, G., & Jain, A. P. (2011).
Tamarindus indica: Extent of explored potential. 5(9), 73–81.
Bhardwaj, M., Singh, B. R., Sinha, D. K., Kumar, V., Vadhana, P. O. R., Singh, V.
S., Nirupama, K. R., Pruthvishree, & Saraj, B. S. A. (2016). Potential of
Herbal Drug and Antibiotic Combination Therapy: A New Approach to Treat
Multidrug-Resistant Bacteria. Pharm Anal Acta. 7(11), 253–267.
Bhatangar, P., Meena, C., Singh, J., Jain, M. O., Singh, B., & Dashora, L. K. (2013.).
Exploring the unexplored tamarind in Rajasthan. Environmental and
ecology. 31(4): 1739–1742.
Bilcke, N. V., Ghaffaripour, S., Alaerts, K., Simbo, D., & Samson, R. (2014).
Physico-chemical properties of tamarind (Tamarindus indica) fruits from
Mali: selection of elite trees for domestication. Genetic resources and crop
evolution. 61(2), 537-553

119
Biradar, B. P., & Kanduri, A. B. (2016). Utilization of Tamarind (Tamarindus indica
L.) Pulp as Feed Supplement in Layer Chicken [M.V.Sc]. Krish Kosh
Institutional Repository
Biswas, A., Melmaiee, K., Elavarthi, S., Jones, J., & Reddy, U. (2019).
Characterization of strawberry (Fragaria spp.) accessions by genotyping with
SSR markers and phenotyping by leaf antioxidant and trichome analysis.
Scientia Horticulturae. 256, 108561.
Bittman, S., Hunt, D., Grant, C., & Deen, W. (2019). Sustainable Cropping Systems.
In B. Fath (Ed.), Encyclopedia of Ecology (Second Edition) (pp. 200–208).
Elsevier.
Boakye, Y. D. (2019). Antimicrobial agents: Antibacterial agents, anti-biofilm
agents, antibacterial natural compounds, and antibacterial chemicals. In N.
Osafo (Ed.), & F. Adu (Trans.), Antimicrobials, Antibiotic Resistance,
Antibiofilm Strategies and Activity Methods (p. Ch. 5). IntechOpen.
Borba, E. L., Semir, J., & Shepherd, G. J. (2001). Self-incompatibility, Inbreeding
Depression and Crossing Potential in Five Brazilian Pleurothallis
(Orchidaceae) species. Annals of Botany. 88(1), 89–99.
Buchholz, F., Kostić, T., Sessitsch, A., & Mitter, B. (2018). The potential of plant
microbiota in reducing postharvest food loss. Microbial Biotechnology.
11(6): 971–975. PubMed.

120
Cabrera, A., Alem, D., Larranaga, P., Ferreira, F., & Rizza, D. M. (2011). Antifungal
activity of medicinal plant extracts against phytopathogenic fungus
Alternaria spp. Chitean Journal of Agricultural Research. 71(2): pp 231–
239.
Cai, K., Zhu, L., Zhang, K., Angiolella, L., Zhao, Z., Zeng, W., & Lin, X. (2019).
Development and Characterization of EST-SSR Markers from RNA-Seq
Data in Phyllostachys violascens. Frontiers in Plant Science. 10(50): 1-9
Centre of Disease Control (CDC). (2018). Antimicrobial resistance.
https://www.cdc.gov/drugresistance/about.html.Accessed 2/18/2020
Cervantes, E., & Diego, J. G. (2010). Morphological Description of Plants: New
Perspectives in Development and Evolution. International Journal of Plant
development. 4(1), 67–71.
Chatfield, C., & Collins, A. J. (1980). Principal component analysis. An Introduction
to Multivariate Analysis. Springer, Boston, MA.
Chatterjee, S., & Raval, I. H. (2019). Chapter 32—Pathogenic Microbial Genetic
Diversity with Reference to Health. In S. Das & H. R. Dash (Eds.), Microbial
Diversity in the Genomic Era (pp. 559–577). Academic Press.

121
Chawananorasest, K., Saengtongdee, P., & Kaemchantuek, P. (2016). Extraction and
Characterization of Tamarind (Tamarind indica L.) Seed Polysaccharides
(TSP) from Three Difference Sources. Molecules 21(6), 775–789.
Cheesman, M. J., Llanko, A., Blonk, B., & Cock, I. E. (2017). Developing New
Antimicrobial Therapies: Are Synergistic Combinations of Plant
Extracts/Compounds with Conventional Antibiotics the Solution. Journal of
pharmacogn review. 11(22), 57–72.
Chen, L., Chen, F., He, S., & Ma, L. (2014). High genetic diversity and small genetic
variation among populations of Magnolia wufengensis (Magnoliaceae),
revealed by ISSR and SRAP markers. Electronic Journal of Biotechnology.
17(6), 268–274.
Chen, Y., & Dai, G. (2012). Antifungal activity of plant extracts against
Colletotrichum lagenarium, the causal agent of anthracnose in cucumber.
Journal of the Science of Food and Agriculture. 92(9), 1937–1943.
Chesnokov, Yu. V., Kosolapov, V. M., & Savchenko, I. V. (2020). Morphological
Genetic Markers in Plants. Russian Journal of Genetics, 56(12), 1406–1415.
Christian, N. (2017). E. coli infection: Symptoms, causes, and treatment [Review of
E. coli infection: Symptoms, causes, and treatment, by F. Suzanne].
https://www.medicalnewstoday.com/articles/68511. Accessed 4/17/2019

122
Coates, D. J., Byrne, M., & Moritz, C. (2018). Genetic Diversity and Conservation
Units: Dealing with the Species-Population Continuum in the Age of
Genomics. Frontiers in Ecology and Evolution. 6: 165.
Compean, K. L., & Ynalves, R. A. (2014). A Review on Antimicrobial Activity of
Plant Secondary Metabolites. Research journal of medicinal plants. 8(5),
204–213.
Cushnie, T., Cushnie, B., & Lamb, A. J. (2014). Alkaloids: An overview of their
antibacterial, antibiotic-enhancing and anti-virulence activities. International
Journal of Antimicrobial Agents. 44(5), 377–386.
Das, B., & Patra, S. (2017). Chapter 1—Antimicrobials: Meeting the Challenges of
Antibiotic Resistance Through Nanotechnology. In A. Ficai and A. M.
Grumezescu (Eds.), Nanostructures for Antimicrobial Therapy (pp. 1–22).
Desai, S., Desai, D. G., & Kaur, H. (2009). Saponins and their biological activities.
Therma times. 41(3), 13–16.
Desmarchelier, P., & Fegan, N. (2016). Pathogens in Milk: Escherichia coli. In
Reference Module in Food Science. Elsevier.
Diallo, B. O., Mckey, D., Hossaert Mckey, M., & Chevallier, M. H. (2007). Genetic
diversity of Tamarindus indica populations: Any clues on the origin from the
current distribution. African journal of biotechnology. 6(7), 853–870.

123
Djouossi, M. G., Tamokou, J., Ngnokam, D., Kuiate, J., Tapondjou, L. A., Harakat,
D., & Voutquenne-Nazabadioko, L. (2015). Antimicrobial and antioxidant
flavonoids from the leaves of Oncoba spinosa Forssk. (Salicaceae). BMC
Complementary and Alternative Medicine. 15(1): 134.
Doehlemann, Okmen, B., Zihu, W., & Sharon, A. (2017). Plant pathogenic fungi.
American society of microbiology. 5(1), 703-704
Doughari, J. H. (2006). Antimicrobial activity of Tamarindus indica Linn. Tropical
Journal of pharmaceutical research. 5(2), 597–603.
Droby, S., Wisniewski, M., Macarisin, D., & Wilson, C. (2009). Twenty years of
postharvest biocontrol research: Is it time for a new paradigm? Postharvest
Biology and Technology. Tropical Journal of pharmaceutical research.
52(2), 137–145.
Du Preez, R. J. (2003). Fruits of tropical climates Lesser-known Fruits of Africa. In
B. Caballero (Ed.), Encyclopedia of Food Sciences and Nutrition (Second
Edition) (pp. 2800–2810). Academic Press.
Du, Y., Xu, Z., Yu, G., Liu, W., Zhou, Q., Yang, D., Li, J., Chen, L., Zhang, Y., Xue,
C., & Cao, Y. (2019). A Newly Isolated Bacillus subtilis Strain Named WS-1
Inhibited Diarrhea and Death Caused by Pathogenic Escherichia coli in
Newborn Piglets. Frontiers in Microbiology. 10: 1248.

124
Elisha, I. S., Botha, F. S., McGaw, L. J., & Eloff, J. N. (2017). The antibacterial
activity of extracts of nine plant species with good activity against
Escherichia coli against five other bacteria and cytotoxicity of extracts. BMC
Complementary and Alternative Medicine. 17(1), 133–133. PubMed.
Elshaghabee, F. M. F., Rokana, N., Gulhane, R. D., Sharma, C., & Panwar, H.
(2017). Bacillus as Potential Probiotics: Status, Concerns, and Future
Perspectives. Frontiers in Microbiology. 8,1490–1490. PubMed.
El-Esawi, M. A. (2019). Introductory Chapter: Assessment and Conservation of
Genetic Diversity in Plant Species. In Genetic Diversity in Plant Species (p.
Ch. 1). Intech Open.
El-Siddig, K., Gunesena, H. P. M., Prasad, B. A., Pushpukumara, D. K. N. G.,
Ramana, K. V. R., Vijayananand, P., & Williams, J. T. (2006). Fruits for the
future 1 –Tamarind (Tamarindus indica L.). Southampton center for
underutilized crops.
Engels, J. M. M., & Visser, L. (Eds.). (2003). A guide to effective management of
germplasm collections. IPGRI Handbooks for Genebanks. (Vol. 6).Rome
IPGRI
Escalona-Arranz, J. C., Péres-Roses, R., Urdaneta-Laffita, I., Camacho-Pozo, M. I.,
Rodríguez-Amado, J., & Licea-Jiménez, I. (2010). Antimicrobial activity of

125
extracts from Tamarindus indica L. leaves. Pharmacognosy Magazine. 6(23),
242–247. PubMed.
Esimone, C. O., Attama, A. A., Mundi, S. K., Ibekw, N. N., & Chah, F. K. (2012).
Antimicrobial activity of Psidium guajava Linn. Stem extracts against
methicillin-resistant Staphylococcus aureus. African journal of
biotechnology.11(89), 15556-15559
Eyong, K. O., Kuete, V., & Efferth, T. (2013). 10—Quinones and Benzophenones
from the Medicinal Plants of Africa. In V. Kuete (Ed.), Medicinal Plant
Research in Africa (pp. 351–391). Elsevier.
Fandohan, B., Salako, V. K., Assogbadjo, A. E., Diallo, B. O., Van Damme, P., &
Sinsin, B. (2015). Effect of climatic conditions on flowering and fruiting of
Tamarindus indica (Fabaceae) and Brice Sinsin2 1Groupe de Recherche en
Foresterie Agroforesterie et Biogéographie, Université d’Agricult. 7(8), 186–
192.
Fandohan, B., Assogbadjo, A. E., Glèlè Kakaï, R. L., Kyndt, T., & Sinsin, B. (2011).
Quantitative morphological descriptors confirm traditionally classified
morphotypes of Tamarindus indica L. fruits. Genetic resources and crop
evolution. 2011(58), 299–309.
Fandohan, B., Assogbadjo, A. E., Glèlè Kakaï, R. L., & Sinsin, B. (2011a).
Effectiveness of a protected areas network in the conservation of Tamarindus

126
indica (Leguminosae–Caesalpinioideae) in Benin. African Journal of
Ecology. 49(1), 40–50.
Fandohan, B., Assogbadjo, A. E., Kakaï, R. G., Kyndt, T., & De Caluwe, E. (2010a).
Women’s Traditional Knowledge, Use Value, and the Contribution of
Tamarind (Tamarindus indica L.) to Rural Households’ Cash Income in
Benin. Economic botany. 64(3), 248–259.
Fandohan, B., Assogbadjo, A. E., Kakaï, R. G., & Sinsin, B. (2010). Variation of
seed morphometric traits, germination and early seedling growth parameters
of Tamarindus indica L. Int J. Biol. Chem. 4(4), 112–119.
Farver, C. F. (2018). 10—Bacterial Diseases. In D. S. Zander C. F. Farver (Eds.),
Pulmonary Pathology (Second Edition) (pp. 163–200). Content Repository
Only!
Faust, S., Hanisch, S., Buerkert, A., & Joergensen, R. G. (2015). Soil Properties
Under Manured Tamarindus indica in the Littoral Plain of South-Western
Madagascar. Arid Land Research and Management: 29(2), 167–179.
Fawzi, N. M. (2011). Macro-and Micromorphological Seed Characteristics of some
Selected Species of Caesalpinioideae-Leguminosae. Research journal of
biology. 6(2), 68–77.

127
Forest, F., Goldblatt, P., Manning, J. C., Baker, D., Colville, J. F., Devey, D. S., &
Buerki, S. (2014). Pollinator shifts as triggers of speciation in painted petal
irises (Lapeirousia: Iridaceae). 113(2), 357–371.
Gajera, H. P., Domadiya, R. K., Patel, S. V., & Golakiya, B. A. (2014). Appraisal of
RAPD and ISSR markers for genetic diversity analysis among cowpea (Vigna
unguiculata L.) genotypes. Journal of Crop Science and Biotechnology.
17(2),79–88.
Garcia, L. C. (2011). A comparative study on the antifungal effects of tamarind
(Tamarindus indica ) and garlic ( Allium sativum ) extracts on banana
anthracnose}. Journal of nature studies.10(2), 96–107.
Gatan, M. G., & Jonnalexer, D. B. (2013). Antifungal Activity of Tamarind
(Tamarindus indica Linn.) Leaf Extract Against Colletotrichum
gloeosporioides. JPAIR. 11(1).
Gnanamani, A. (2017). Staphylococcus aureus: Overview of Bacteriology, Clinical
Diseases, Epidemiology, Antibiotic Resistance and Therapeutic Approach. In
P. Hariharan (Ed.), Frontiers in Staphylococcus aureus (p. Ch. 1).
IntechOpen.
Gomathi, A. C., Rathinam, X., & Sadiq, A. M. (2017). Phytochemical screening of
aqueous extracts of Tamarindus indica shell. International journal of basic
and applied research. 7(11), 65–70.

128
Gonelimali, F. D., Lin, J., Miao, W., Xuan, J., Charles, F., Chen, M., & Hatab, S. R.
(2018). Antimicrobial Properties and Mechanism of Action of Some Plant
Extracts Against Food Pathogens and Spoilage Microorganisms. Frontiers in
Microbiology. 9: 1639.
Goodwillie, C., Sargent, R., D., Eckert, C., G., Elle, E., Geber, M., A., Johnston, M.,
O., Kalisz, S., Moeller, D., A., Ree, R. H., Vallejo-Marin, M., & Winn, A. A.
(2010). Correlated evolution of mating system and floral display traits in
flowering plants and its implications for the distribution of mating system
variation. The New Phytologist, 185(1), 311–321.
Govindaraj, M., Vetriventan, M., & Srinvasan, M. (2015). A review article on
importance of genetic diversity in crop plants and its recent advances: An
overview of its analytical perspectives. Genetic research international. 2015,
1–14.
Government of Kenya (GoK). (2013). Makueni County First County Integrated
Development Plan 2013-2017.
Grover, A., & Sharma, P. C. (2016). Development and use of molecular markers:
Past and present. Critical reviews in biotechnology. 36(2), 290–302.
Guil-Guerrero, J. L., Ramos, L., Moreno, C., Zúñiga-Paredes, J. C., Carlosama-
Yepez, M., & Ruales, P. (2016). Antimicrobial activity of plant-food by-
products: A review focusing on the tropics. Livestock Science. 189, 32–49.

129
Gupta, A., Verma, S., Kushwaha, P., Srivastava, S., & AKS, R. (2015).
Phytochemical and antioxidant studies of Salvadora persica L. stem and twig.
IJPER, 49(null), 71.
Gupta, C., Prakash, D., & Gupta, S. (2014). Studies on the antimicrobial activity of
Tamarind (Tamarindus indica) and its potential as food bio-preservative.
International food research journal. 21(6), 2437–2441.
Havinga, R. M., Hartl, A., Putscher, J., Prehsler, S., Buchmann, C., & Vogl, C. R.
(2010). Tamarindus indica L. (Fabaceae): Patterns of use in traditional
African medicine. Journal of Ethnopharmacology. 127(3), 573–588.
PubMed.
Hayashi, M. A., Bizerra, F. C., & Da Silva, P. J. (2013). Antimicrobial compounds
from natural sources. Frontiers in Microbiology. 4, 195–195. PubMed.
Hemshekhar, M., Kemparaju, K., & Girish, K. S. (2011). Tamarind (Tamarindus
indica) Seeds: An Overview on Remedial Qualities. In V. R. Preedy, R. R.
Watson, V. B. Patel (Eds.), Nuts and Seeds in Health and Disease Prevention
(pp. 1107–1114). Academic Press. San Diego.
Hijazi, A., Bandar, H., Rammal, H., Hachem A, A., Saad, Z., & Badran, B. (2013).
Techniques for extraction of bioactive compounds from Lananese urtica
dioica. American journal of phytomedicine and clinical therapeutics. 1(6),
507–513.

130
Ho, V. T., & Tu, N. T. (2019). Genetic characterization of mango accessions through
RAPDs and ISSR markers in Vietnam. Sabrao journal of breeding genetics.
15(3), 252–265.
Hogbin, P. M., & Peakall, R. (1999). Evaluation of the conservation of genetic
research to the management of endangered plant Zieria prostrata.
Conservation biology. 13(3), 514–522.
Hosack, P., & Miller, L. (2017). Preventing and managing plant diseases. University
of Missouri Extension. pp 1–16.
Hua, L., Yong, C., Zhanquan, Z., Boqiang, L., Guozheng, Q., & Shiping, T. (2018).
Pathogenic mechanisms and control strategies of Botrytis cinerea causing
post-harvest decay in fruits and vegetables. Food Quality and Safety. 2(3),
111–119.
Hussain, G., Rasul, A., Anwar, H., Nimra, N., Razzaq, R., Wei, W., Ali, M., & Li, J.
(2018). Role of Plant-Derived Alkaloids and Their Mechanism in
Neurodegenerative Disorders. Molecules 14(3), 341–357.
Hussain, M., Debnath, M., Qasim, M., Bamisile, B. S., Islam, W., Hameed, M. S.,
Wang, L., & Qiu, D. (2019). Role of Saponins in plant defense against
specialist herbivores. Int J Biol Sci. 24(2067), 1–21

131
Indracanti, M., Mekonnen, D. T., & Tsegaw, M. (2019). Molecular characterization
of some landraces and varieties of Date palm (Phoenix dactylifera L.) from
Afar region of Ethiopia using ISSR markers (PPR128702).
Infonet Biovision (2019). https://www.infonet-
biovision.org/PlantHealth/MedicinalPlants/Tamarind.Accessed on 5/29/2019
Israel, S. K., Murthy, C., & Patil, B. L. (2019). Value addition of tamarind products
in Karnataka. Journal of pharmacognosy and photochemistry. 8(6), 726–730.
Israr, A., Muthukumar, M., Verma, J. P., Anju, B., & Rajan, S. (2019). Molecular
fingerprints and genetic relatedness of traditional mango cultivars using SSR
markers. Indian journal of horticulture. 76(1), 1–7.
Jain, A., Sarsaiya, S., Wu, Q., Lu, Y., & Shi, J. (2019). A review of plant leaf fungal
diseases and its environment speciation. Bioengineered. 10(1), 409–424.
Jain, A., Surana, S., Gokhale, S. B., Tatiya, A., & Bothara, R. (2010). Antimicrobial
Properties of Eranthemum roseum (Vahl) R.Br. Iranian Journal of
Pharmaceutical Research. 6 (2), 131–133.
Jamile da Silva Oliveiraet, Faleiro, F. G., Junqueira, N. T. V., Gracielle da Fonseca,
K., & Araya, S. (2019). Genetic variability of Passiflora spp based on ISSR
and RAPDs. Asian journal of science and technology. 10(01), 9375–9378.

132
Jiang, G. (2013). Plant Breeding from Laboratories to Fields. In Molecular Markers
and Marker-Assisted Breeding in Plants. IntechOpen.
https://www.intechopen.com/books/3060
Jo, I. K., Kim, Y. C., Kim, D. H., Kim, K. H., Hyun, T. K., Ryu, H., & Bang, K. H.
(2017). Applications of molecular markers in the discrimination of Panax
species and Korean ginseng cultivars (Panax ginseng). Journal of Ginseng
Research. 41(4), 444–449.
John, J., Joy, M., & Abhilash, E. K. (2004). Inhibitory effects of tamarind
(Tamarindus indica L.) on polypathogenic fungi. Allelopathy Journal. 14(1),
43–49.
Khanzada, S. K., Shaikh, W., Sofia, S., Kazi, T., Usmanghani, K., Kabir, A.,
Sheerazi, T. (2008). Chemical constituents of Tamarindus indica L.
medicinal plant in Sindh. Pak. J. Bot. 40(6), 2553–2559.
Khan, A. S., Ali, S., & Khan, I. A. (2015). Morphological and molecular
characterization and evaluation of mango germplasm: An overview. Scientia
Horticulturae. 194, 353–366.
Krawczyk, B., & Kur, J. (2018). Chapter 16—Molecular Identification and
Genotyping of Staphylococci: Genus, Species, Strains, Clones, Lineages, and
Interspecies Exchanges. In V. Savini (Ed.), Pet-To-Man Travelling
Staphylococci (pp. 199–223). Academic Press.

133
Kregiel D, Berlowska J, Witonska, I, Antolak H, Proestos C, Babic M, Babic L, &
Zhang L. (2017). Saponin-Based, Biological-Active Surfactants from Plants.
In Application and Characterization of Surfactant. IntechOpen, Rijeka.
https://www.intechopen.com/books/application-and-characterization-of-
surfactants/saponin-based-biological-active-surfactants-from-plants
Krzyzowska, M., Tomaszewska, E., Ranoszek-Soliwoda, K., Bien, K., Orlowski, P.,
Celichowski, G., & Grobelny, J. (2017). Chapter 12—Tannic acid
modification of metal nanoparticles: Possibility for new antiviral
applications. In E. Andronescu A. M. Grumezescu (Eds.), Nanostructures for
Oral Medicine (pp. 335–363). Elsevier.
Kumar, C. S., & Bhattacharya, S. (2008). Tamarind seed: Properties, processing and
utilization. Crit rev food. sci. nutr. 48(1), 1–8.
Kumar, D., Yadav, P., Priyanka, Yadav, A., Dwivedi, U. N., & Yadav, K. (2019).
Genetic Diversity Analysis among Papaya (Carica papaya L.) Varieties using
RAPD Markers. SAARC Journal of Agriculture. 1(1), 22–27.
Kumar, M., Ponnuswami, V., Rajamanickam, C., & Preethi, T. L. (2015).
Assessment of genetic diversity in tamarind (Tamarindus indica L.) using
random amplified polymorphic DNA markers. Int J trad med appl. 13(1), 27–
36.

134
Kumari, S., Arumugam, N., Singh, R., Banoth, S., Goswami, A. K., & Srivastav, M.
(2016). Analysis of molecular variance (AMOVA) and Principle coordinate
analysis (PCOA) of guava germplasm. International journal of agricultural
sciences. 8(59), 3288–3290.
Ksiazek-Mikenas, K., Fant, J. B., & Skogen, K. A. (2019). Pollinator-Mediated Gene
Flow Connects Green Roof Populations Across the Urban Matrix: A
Paternity Analysis of the Self-Compatible Forb Penstemon hirsutus.
Frontiers in Ecology and Evolution, 7, 29
Kwiatek, M. T., Kurasiak-Popowska, D., Mikołajczyk, S., Niemann, J., Tomkowiak,
A., Weigt, D., & Nawracała, J. (2019). Cytological markers used for
identification and transfer of Aegilops spp. Chromatin carrying valuable
genes into cultivated forms of Triticum. 13(1), 41–59.
Leakey, R. R. B. (2017). Chapter 7—Potential for Novel Food Products From
Agroforestry Trees: This chapter was previously published in Leakey,
R.R.B., 1999. Food Chemistry, 64, 1–14, with permission of Elsevier. In R.
R. B. Leakey (Ed.), Multifunctional Agriculture (pp. 71–86). Academic
Press.
Ledesma, N. (2013). Tamarindus indica.
Ledig, F. T. (1986). Heterozygosity, heterosis, and fitness in outbreeding plants”. In
Conservation biology. pp 77–104.

135
Lim, J. Y., Yoon, J., & Hovde, C. J. (2010). A brief overview of Escherichia coli
O157:H7 and its plasmid O157. Journal of Microbiology and Biotechnology,
20(1), 5–14. PubMed.
Liu, Q., Meng, X., Li, Y., Zhao, C., & Tang, G., Li, H. (2017). Antibacterial and
Antifungal Activities of Spices. Int. J. Mol. Sci. 8(6).
Loria, K. (2019). On-Farm Variety Improvement Part II: Selection and Plant
Breeding.https://smallfarms.cornell.edu/2019/10/on-farm-variety-
improvement-part-ii-selection-and-plant-breeding/
Lou, Y., Hu, L., Chen, L., Sun, X., Yang, Y., Liu, H., & Xu, Q. (2015). Association
Analysis of Simple Sequence Repeat (SSR) Markers with Agronomic Traits
in Tall Fescue (Festuca arundinacea Schreb.). PLOS ONE. pp 1-13
Ma, Z., Liu, S., Liang, Z., Xu, S., Hu, W. (2019). Analysis of Genetic Diversity of 45
Guava Germplasm Evaluated Using SSR Markers. International Journal of
Fruit Science. pp 1–9.
Machakos County. (2015). County Integrated Development Plan.
https://roggkenya.org/wpcontent/uploads/docs/CIDPs/Machakos-County-
Integrated-Development-Plan-CiDP-2015
Madappa, T. (2019). Escherichia coli (E. coli) infections. Drug and Disease.
Accessed 5/25/20

136
Mahlo, S. M., Chauke, H. R., McGaw, L., & Eloff, J. (2016). Antioxidant and
antifungal activity of selected medicinal plant extracts against
phytopathogenic fungi. African Journal of Traditional, Complementary, and
Alternative Medicines: AJTCAM. 13(4), 216–222. PubMed.
https://doi.org/10.21010/ajtcam.v13i4.28
Maluki, J. M., Kimiti, J. M., Nguluu, S., & Musyoki, J. K. (2016). Adoption levels of
agroforestry tree types and practices by smallholders in the semi-arid areas of
Kenya: A case of Makueni County. 8(9), 187–196.
Mariita, R. M., Ogol, C. K. P. O., Oguge, N. O., & Okemo, P. O. (2011). Methanol
Extract of Three Medicinal Plants from Samburu in Northern Kenya Show
Significant Antimycobacterial, Antibacterial, and Antifungal Properties.
Research journal of medicinal plants. 5(1), 54–64.
Martínez, B. I., Valdés de la Cruz, M., Riera Nelson, M., & Bertin, P. (2017).
Morphological characterization of traditional cacao (Theobroma cacao L.)
plants in Cuba. Genetic Resources and Crop Evolution. 64(1), 73–99.
Masumbuko, L., & Bryngelsson, T. (2006). Inter Simple Sequence Repeat (ISSR)
Analysis of Diploid Coffee Species and Cultivated Coffea arabica L. from
Tanzania. Genetic Resources and Crop Evolution. 53(2), 357–366.

137
Maundu, P. M., Tengnäs, B., Muema, N., & Birnie, A. (2005). Useful Trees and
Shrubs for Kenya. World Agroforestry Centre, Eastern and Central Africa
Regional Programme.
Mburu, S. W., Koskey, G., Kimiti, J. M., Ombori, O., Maingi, J. M., & Njeru, E. M.
(2016). Agrobiodiversity conservation enhances food security in subsistence-
based farming systems of Eastern Kenya. Agriculture and Food Security.
5(1), 19.
Mercado-Mesa, M., Álvarez-Osorio, V. M., Quiroz, J. A., & Muriel, S. B. (2018).
Phytophagous insects in tamarind crop (Tamarindus indica L.), with
emphasis on the greatest damage to the fruit, in five farms from the nearby
Western of Antioquia. Revista Facultad Nacional de Agronomía Medellín
71(3) pp 8553.
Mishra, A. K., Kehri, H. K., Sharma, B., & Pandey, A. K. (2010). Inhibitory activity
of Indian spice plant Cinnamon zeylanium extracts against A. solani and
Clunata the pathogenic dematiaceus moulds. Annals and clinical
microbiology and antimicrobials. 1(3), 134–139.
Mudzengi, C. P., Murwira, A., Tivapasi, M., Murungweni, C., Burumu, J. V., &
Halimani, T. (2017). Antibacterial activity of aqueous and methanol extracts
of selected species used in livestock health management. Pharmaceutical
Biology. 55(1), 1054–1060.

138
Mugo, J. W. (2014). Gis based multi-criteria analysis for identification of suitable
areas for green gram production: A case study of Kitui county, Kenya. South
Eastern University Kenya.
Nadeem, M. A., Nawaz, M. A., Shahid, M. Q., Doğan, Y., Comertpay, G., Yıldız,
M., Hatipoğlu, R., Ahmad, F., Alsaleh, A., Labhane, N., Özkan, H., Chung,
G., & Baloch, F. S. (2018). DNA molecular markers in plant breeding:
Current status and recent advancements in genomic selection and genome
editing. Biotechnology and Biotechnological Equipment. 32(2), 261–285.
BNandini, R., Telem, R., & Dhanapal, G. (2011). Morphometric and molecular
diversity studies in tamarind (Tamarindus indica Linn.). Plant molecular
biology and biotechnology 2(2), 26–33.
Narayanasamy, P. (2011). Detection of Fungal Pathogens in Plants. In P.
Narayanasamy (Ed.), Microbial Plant Pathogens-Detection and Disease
Diagnosis: Fungal Pathogens, 1, 5–199. Springer Netherlands.
Narina, S. S., Bhavani, S., Bhardwaj, H. L., Hamama, A. A., Iqbal, M. J., Parry, J.
A., Mamidi, S., Kameswari, P. L., & Catanzaro, C. J. (2019). A Mini Review
on Tamarind (Tamarindus indica L.) for Induction of Ornamental Phenotype
and Seedlessness. Acta scientific health. 3(11), 134–142.

139
Nasution, F., & Yapwattanaphun. (2017). Clustering of Five Sweet Tamarind Based
on Fruit. Characteristic. Agrivita journal of agricultural sciences. 39(1), 38–
44.
National Horticulture Board (NHB). (2017). Indian production of tamarind
(HSCOPEIII).
National Research Council (NRC). (2008). Lost Crops of Africa. Volume III. Fruits.
National academic press.
Nazir, A., Asghar, A., & Aslam Maan, A. (2017). Chapter 13—Food Gels: Gelling
Process and New Applications. In J. Ahmed, P. Ptaszek, S. Basu (Eds.),
Advances in Food Rheology and Its Applications (pp. 335–353). Woodhead
Publishing.
Necha, B., Leticia, L., Bautista Baños, Silvia, Jiménez Estrada, Manuel, Reyes
Chilpa, & Ricardo. (2002). Influence of Leaf, Fruit and Seed Powders and
Extracts of Pithecellobium dulce (Roxb.) Benth (Fabaceae) on the in vitro
Vegetative Growth of Seven Postharvest Fungi. Revista Mexican de
fitopatologia. 20(1), 66–71.
Ng, W. L., & Tan, S. (2015). Inter-Simple Sequence Repeat (ISSR) markers: Are we
doing it right? ASM Science Journal. 9(1), 30–39.

140
Nilkanta, H., Amom, T., Tikendra, L., Rahaman, H., & Nongdam, P. (2017). ISSR
Marker Based Population Genetic Study of Melocanna baccifera (Roxb.)
Kurz: A Commercially Important Bamboo of Manipur, North-East India.
Scientifica, 2017, 3757238–3757238. PubMed.
Nwodo, U. U., Obiiyeke, G. E., Chigor, V. N., & Okoh, A. I. (2011). Assessment of
Tamarindus indica extracts for antibacterial activity. International Journal of
Molecular Sciences. 12(10), 6385–6396. PubMed.
Nyadoi, P., Okori, P., Okullo, J. B. L., Obua, J., Burg, K., Fluch, S., Magogo, N.,
Saleh, H., Temu, A. B., Jamnadass, & Jamnadass, R. H. (2010). Variability of
East Africa tamarind (Tamarindus indica L.) populations based on
morphological markers. World Agroforestry Center. pp 1–28.
Nybom, H. (2017). DNA Fingerprinting☆. In Reference Module in Life Sciences.
Elsevier.
Obeidat, M., Shatnawi, M., Al-alawi, M., Al-Zu`bi, E., Hanee Al-Dmoor, H., Al-
Qudah, M., El-Qudah, J., & Otri, I. (2012). Antimicrobial Activity of Crude
Extracts of Some Plant Leaves. Research journal of microbiology. 7(1), 59–
67.
Obiero, J. P. O., & Onyando, J. O. (2013). Climate in Kenya. In Climate (Vol. 16,
pp. 39–50). Development in Earth processes.

141
Ojo, J. A., & Omoloye, A. A. (2015). Life History of the Tamarind Weevil,
Sitophilus linearis (Herbst) (Coleoptera: Curculionidae), on Tamarind Seed.
Journal of Insects, 2015, 429579.
Okello, J., Okullo, J. B. L., Eilu, G., Nyeko, P., & Obua, J. (2018). Morphological
Variations in Tamarindus indica LINN. Fruits and Seed Traits in the
Different Agroecological Zones of Uganda. International Journal of Ecology.
2018, 1–12.
Omari, H. (2016). Value chain analysis of Tamarind fruits in Kishapu district,
Tanzania. Sokoine University of Agriculture.
Orwa, C., Mutua, A., Kindt, R., Jamndass, R., & Simons, A. (2009). Agroforestry
Database: A tree reference and selection guide version 4.0 World
Agroforestry Centre, Kenya. Novella. Naturally African.
Osorio, V. A., Muriel, S. B., & Torres, J. M. C. (2018). Morpho agronomic
characterization of Tamarindus indica L. in orchards of tropical dry forest
from Antioquia (Colombia). Biodiversity int J. 2(5), 396–403.
Ouédraogo, L., Fuchs, D., Schaefer, H., & Kiendrebeogo, M. (2019). Morphological
and Molecular Characterization of Zanthoxylum zanthoxyloides (Rutaceae)
from Burkina Faso. Plants, 8(9).

142
Panche, A. N., Diwan, A. D., & Chandra, S. R. (2016). Flavonoids: An overview.
Journal of Nutritional Science, 5, e47–e47. PubMed.
Panesar, P. S., Joshi, V. K., Bali, V., & Panesar, R. (2017). Chapter 9—Technology
for Production of Fortified and Sparkling Fruit Wines. In M. R. Kosseva, V.
K. Joshi and P. S. Panesar (Eds.), Science and Technology of Fruit Wine
Production (pp. 487–530). Academic Press.
Parrotta, J. (1990). Tamarindus indica L. Tamarind.
Paškevičius, S., Starkevič, U., Misiūnas, A., Vitkauskienė, A., Gleba, Y., &
Ražanskienė, A. (2017). Plant-expressed pyocins for control of Pseudomonas
aeruginosa. PloS One, 12(10), e0185782–e0185782. PubMed.
Pal, D., & Mukherjee, S. (2020). Chapter 14—Tamarind (Tamarindus indica) Seeds
in Health and Nutrition. In V. R. Preedy and R. R. Watson (Eds.), Nuts and
Seeds in Health and Disease Prevention (Second Edition) (pp. 171–182).
Academic Press.
Paul das, A. N., & Banerjee, A. (2014). Extraction of tamarind pulp and its
antibacterial activity. Asian journal of plant science and research. 4(2), 47–
49.

143
Peakall, R., & Smouse, P. E. (2012). GenAlEx 6.5: Genetic analysis in Excel.
Population genetic software for teaching and research—An update.
Bioinformatics (Oxford, England), 28(19), 2537–2539. PubMed.
Pena, D. N., Moura, E. F., Rodrigues, S. M., Oliveira, M. S. P., Sanches, J. P., &
Moura, M. F. (2020). Molecular characterization of a germplasm bank of
Platonia insignis Mart.: A fruit tree. Genetic Resources and Crop Evolution.
67(2), 411–420.
Piglowski, M. (2019). Pathogenic and non-pathogenic micro-organisms in the rapid
alert system for food and feed. Int. J. Environ Res Public health 16(3), 477–
511.
Pinar, K. (2014). Tamarindus indica and its health-related effects. Asian Pacific
Journal of Tropical Biomedicine, 4(9), 676–681.
Piyasundura, J. H. N., Gunasekere, M. T. K., & Wikremasinghe. (2008).
Identification of discriminating morphological descriptors for
characterization of tea (Camellia sinensis L) germplasm in Sri Lanka. 20,
193–199.
Platten, J., D., Cobb, J. N., & Zantua, R. E. (2019). Criteria for evaluating molecular
markers: Comprehensive quality metrics to improve marker-assisted
selection.

144
Poolman, J. T. (2017). Escherichia coli. In S. R. Quah (Ed.), International
Encyclopedia of Public Health (Second Edition) (pp. 585–593). Academic
Press.
Pradeep, R. M., Sarla, N., & Siddiq, E. A. (2002). Inter simple sequence repeat
(ISSR) polymorphism and its application in plant breeding. Euphytica.
128(1), 9–17.
Predrag, L., Song, H., Cogan, U., Azaizeh, H., & Bomzom, A. (2005). The effects of
aqueous extracts prepared from the leaves of Pistacia lentiscus in
experimental liver disease. Journal of Ethnopharmacology. 100(1–2), 198–
204.
Qian, W., Ge, S., & Hong, D.-Y. (2001). Genetic variation within and among
populations of a wild rice Oryza granulata from China detected by RAPD and
ISSR markers. Theoretical and Applied Genetics. 102(2), 440–449.
Rachel R. (2019). What is E. coli.
Raju, K., & Naik, M. K. (2006). Effects of pre-harvest sprays of fungicides and
botanicals on storage diseases of onion. Indian phytopath. 59(2), 133–141.
Ranaivoson, T., Brinkmann, K., Rakouth, B., & Buerkert, A. (2015). Distribution,
biomass and local importance of tamarind trees in south-western Madagascar.
Global Ecology and Conservation. 4, 14–25.

145
Rao, A. S., & Kumar, A. A. (2015). Tamarind seed processing and by-products.
Agricultural engineering international. 17(2), 200–204.
Rao, S.Y., & Mary, M., M. (2012). Tamarind. In Handbook of Herbs and Spices.
Woodhead Publishing Limited.
Rashad, Y. M., & Moussa, T. A. A. (2020). Biocontrol Agents for Fungal Plant
Diseases Management. In N. El-Wakei, M. Saleh, M. Abu-hashim (Eds.),
Cottage Industry of Biocontrol Agents and Their Applications: Practical
Aspects to Deal Biologically with Pests and Stresses Facing Strategic Crops
(pp. 337–363). Springer International Publishing.
Rahayu, S. Y., Araki, T., & Rosleine, D. (2020). Factors affecting the use of herbal
medicines in the universal health coverage system in Indonesia. Journal of
Ethnopharmacology, 112974.
Reche, J., García-Martínez, S., Carbonell, P., Almansa, M. S., Hernández, F., Legua,
P., & Amorós, A. (2019). Relationships between physico-chemical and
functional parameters and genetic analysis with ISSR markers in Spanish
jujubes (Ziziphus jujuba Mill.) cultivars. Scientia Horticulturae. 253, 390–
398.
Reddy, V. K. R. (2017). High-yielding variety of tamarind was identified.
https://www.thehindu.com/news/national/andhra-pradesh/high-yielding-
variety-of-tamarind-identified/article19281119.ece

146
Reddy, J. (2015). Tamarind farming, planting, care yields and harvesting.
Agrifarming. https://www.agrifarming.in/tamarind-farming. Accessed
12/11/2019
Ribeiro, M., Simões, L. C., & Simões, M. (2018). Biocides. In T. M. Schmidt (Ed.),
Encyclopedia of Microbiology (Fourth Edition) (pp. 478–490). Academic
Press.
Richter, T. K. S., Michalski, J. M., Zanetti, L., Tennant, S. M., Chen, W. H., &
Rasko, D. A. (2018). Responses of the Human Gut <em>Escherichia
coli</em> Population to Pathogen and Antibiotic Disturbances. systems.
American society for microbiology. 3(4), 1-15.
Ruiz‐Cruz, S. (2017). Flavonoids: Important Biocompounds in Food. In S.
Chaparro‐Hernández (Ed.), L.A (Trans.), Flavonoids (p. Ch. 16). IntechOpen.
Saadabi, A. M. A., & Ayoub, S. M. H. (2009). Comparative bioactivity of Hydnora
abyssinica A. Braun against different groups of fungi and bacteria. Journal of
medicinal plants research. 3(4), pp 262–265.
Samantaray, S. (2017). Evaluation of Genetic Diversity in Chlorophytum
borivilianum (Santp. And Fernan.) Using Molecular Markers: An Endangered
Medicinal Plant. In U. Ngangkham (Ed.), Active Ingredients from Aromatic
and Medicinal Plants (p. Ch. 4). IntechOpen. Rijeka.

147
Samaké, O., Kalinganire, A., Koné, B., Doumbia, M., Dakouo, J. M., Mounkoro, B.,
Weber, J. C., Ky-Dembele, C., & Uwamariya, A. (2014). Growing Tamarind
Trees: A handbook for the Sahelian Horticulturist.: Vol. Technical manual
No 23. World Agroforestry Centre (ICRAF) West and Central African
Regional Program, Sahel Node.
Sanaa, O., Yagoub. (2008). Anti-Microbial Activity of Tamarindus Indica and
Adansonia digitata Extracts against E. coli Isolated from Urine and Water
Specimens. Research journal of microbiology. 3, 193–197.
Sandle, T. (2016). 14—Antibiotics and preservatives. In T. Sandle (Ed.),
Pharmaceutical Microbiology (pp. 171–183). Woodhead Publishing.Oxford
Sarmiento, L., Perez, I., Díaz, B., Álvarez, H., & Viera, W. (2017). Molecular
marker-based characterization of Ecuadorian dry forest tamarind plus trees.
Bioagro. 29, 153–162.
Schabel, G. H. (2004). Tamarindus indica species description.
Schiestl, F. P., & Johnson, S. D. (2013). Pollinator-mediated evolution of floral
signals. Trends in Ecology & Evolution, 28(5), 307–315.
Schultz, M., Burton, J. P., & Chanyi, R. M. (2017). Chapter 11—Use of Bacillus in
Human Intestinal Probiotic Applications. In M. H. Floch, Y. Ringel, W. Allan

148
Walker (Eds.), The Microbiota in Gastrointestinal Pathophysiology (pp. 119–
123). Academic Press.
Sharma, A. (2019). Morphological, Biochemical, and Molecular Characterization of
Orange-Fleshed Sweet Potato (Ipomoea batatas [L.] Lam) Germplasms. In
D. Jain (Ed.), R. Chaudhary (Trans.), Genetic Diversity in Plant Species (p.
Ch. 2). IntechOpen.
Sheeja, G., Jyotsna, S., & Vern, Y. L. (2009). Genetic diversity of the endangered
and narrow endemic piperia yadonii (Orchidaceae) assessed with ISSR
polymorphisms. American journal of botany. 96(11), 2022–2030.
Simpson, M. G. (2019). 13—Plant Reproductive Biology. In M. G. Simpson (Ed.),
Plant Systematics (Third Edition) (pp. 595–606). Academic Press.
Singh, A. P. (2020). Applications of Tannins in Industry. In Sunil Kumar ED1 -
Alfredo Aires (Ed.), Tannins (p. Ch. 7). IntechOpen. Rijeka
Singh, D., Wangchu, L., & Moond, S. K. (2007). Processed products of Tamarind.
Natural product radiance. 6(4), 315–321.
Soemardji, A. A. (2007). Tamarindus indica L. or “Asam Jawa”: The sour but sweet
and useful. Visit. Profr. Inst. Nat. Med. Univ.Toyama – Japan Toyama Japan
pp 1–20.

149
Soo-Rang, L., Ji-Eun, C., Byoung-Yoon, L., Jeong-Nam, Y., & Chae Eun, L. (2018).
Genetic diversity and structure of an endangered medicinal herb: Implications
for conservation. AoB PLANTS, 10(2), ply021.
Swenson, U., & Anderberg, A. A. (2005). Phylogeny, character evolution, and
classification of Sapotaceae (Ericales). 21(2), pp101–130.
Tacconelli, E., & Magrini, M. (2017). Global priority list of antibiotic-resistant
bacteria to guide research, discovery, and development of new antibiotics.
WHO. 18(3), 318–327.
Taha, S. A. B., Nour, A. E. A. M., & Elkhalifa, A. E. O. (2016). The value of
tamarind (Tamarindus indica L.) pulp and its potential use in vinegar
production. Journal of medical and biological sciences. 5(3), 1–8.
Ranaivoson T., Katja B., Bakolimalala R., & Andreas B. (2015). Distribution,
biomass and local importance of tamarind trees in south-western Madagascar.
Global ecology and conservation. 4, 14–25.
Taylor, T. A., Unakal, C. G. (2018). Staphylococcus Aureus. Stat Pearls Publishing.
Treasure Island.
Tequida-Meneses, M., Cortez-Rocha, M., Rosas-Burg, E. C., & Corrales, C. (2002).
Effect of alcoholic extracts of wild plants on the inhibition of growth of
Aspergillus flavus, Aspergillus niger, Penicillium chrysogenum, Penicillium

150
expansum, Fusarium moniliforme and Fusarium poae molds. Revista ibero
americana de micologia. 19(2), 84–88.
Thangavelu, R., Sundararaju, P., & Sathiamoorthy, S. (2004). Management of
anthracnose disease of banana caused by Colletotrichum musae using plant
extracts. The Journal of Horticultural Science and Biotechnology. 79(4), 664–
668.
Thouri, A., Chahdoura, H., Arem, A. E., Hichri, A. O., Hassin, R. B., & Achour, L.
(2017). Effect of solvents extraction on phytochemical components and
biological activities of Tunisian date seeds (var. Korkobbi and Arechti). BMC
complementary medicine and therapies. 17, 248-278
Tripp, R., Louwaars, N., & Eaton, D. (2007). Plant variety protection in developing
countries. A report from the field. Food policy, 32(3), 354-371.
Toungos, M. D. (2019). Tamarind (Tamarindus indica) fruit of potential value but
underutilized. International journal of innovative food, nutrition and
sustainable Agriculture. 7(1): pp 1–10.
Obulesu, M., & Bhattacharya, S. (2011). Color changes of Tamarind (Tamarindus
indica L.) Pulp During Fruit Development, Ripening, and Storage.
International Journal of Food Properties, 14(3), 538–549.

151
Uthayarasa, K., Surendran, S. N., Pathmanathan, M. K., & Jeyadevan, J. P. (2010).
Larvicidal efficacy of crude extracts of Emblica officinalis and Eucalyptus
citriodora against Aedes aegypti L. International journal of pharmaceutical
and biological archives. 1(4), 467–472.
Valadez-Moctezuma, E., Ortiz-VÃ, Q., & Samah, S. (2014). Molecular based
assessment of genetic diversity of xoconostle accessions (Opuntia
spp.). African Journal of Biotechnology, 13(2), 202-210.
Van der Stege, C., Prehsler, S., Hartl, A., & Vogl, C. R. (2011). Tamarind
(Tamarindus indica L.) in the traditional West African diet: not just a famine
food. Fruits, 66(3), 171-185.
Verma, K. S., Haq, S. U., Kachhwaha, S., & Kothari, S. L. (2017). RAPD and ISSR
marker assessment of genetic diversity in Citrullus colocynthis(L.) Schrad: A
unique source of germplasmhighly adapted to drought and high-temperature
stress. Biotech. 7(288), 1–24.
Wang, Z., Jiang, M., Chen, K., Wang, K., Du, M., Zalán, Z., Hegyi, F., & Kan, J.
(2018). Biocontrol of Penicillium digitatum on Postharvest Citrus Fruits by
Pseudomonas fluorescens. Journal of food quality. 2018, 1–10.
Wanjala, S. P. O. (2019). Scaling the production and commercialization of tamarind
fruit in Kenya.

152
Warda, A., Fathia, M., & Amel, A. (2007). Antibacterial Activity of Tamarindus
indica. Fruit and Piper nigrum Seed. Research Journal of Microbiology, 2,
824–830.
World Health Organization. (2018). Antibiotic resistance.
https://www.who.int/news-room/fact-sheets/detail/antibiotic-resistance.
Accessed 2/18/2020
Wu, W., Chen, F., Yeh, K., & Chen, J. (2018). ISSR Analysis of Genetic Diversity
and Structure of Plum Varieties Cultivated in Southern China. Gastroenterol
Res pract. 8(1), 1- 2. PubMed.
Wyatt, J. (2016). Grain and Plant Morphology of Cereals and How Characters Can
Be Used to Identify Varieties. In Reference Module in Food Science.
Elsevier.
Yahia, E. M., & Salih, N. K.-E. (2011). 22—Tamarind (Tamarindus indica L.). In E.
M. Yahia (Ed.), Postharvest Biology and Technology of Tropical and
Subtropical Fruits (pp. 442–458e). Woodhead Publishing.
Yahia, Y., Benabderrahim, M. A., TLili, N., Bagues, M., & Nagaz, K. (2020).
Bioactive compounds, antioxidant and antimicrobial activities of extracts
from different plant parts of two Ziziphus Mill. Species. PLOS ONE .15(5),
1-16

153
Yang, J., Hsiang, T., Bhadauria, V., Lin Chen, X., & Li, G. (2017). Plant Fungal
Pathogenesis. 2017, 1–2.
Zarei, A., Erfani-Moghadam, J., & Mozaffari, M. (2017). Phylogenetic analysis
among some pome fruit trees of Rosaceae family using RAPD markers.
Biotechnology and Biotechnological Equipment. 31(2), 289–298.
Zawko, G., Krauss, S. L., Dixon, K. W., & Sivasithamparam, K. (2001).
Conservation genetics of the rare and endangered Leucopogon obtectus
(Ericaceae). Molecular Ecology. 10(10), 2389–2396.
Zhang, S., Zheng, Q., Xu, B., & Lui, J. (2019). Identification of plant fungal
pathogens of post-harvest disease on peach fruit and control mechanisms of
B. subtilis JK-14. Toxins basel. 11(322), 1-15 E322.

154
APPENDICES
Appendix I: Questionnaire on production and utilization of tamarind in semi-
arid Eastern Kenya
AREA
County.............................................................................................................................
Subcounty.......................................................................................................................
Date.................................................................................................................................
HOUSEHOLD
Farmers’ name.....................................................................
Age of
farmer........................................Gender................................................................
TAMARIND PRODUCTION
Main crop grown.............................................................................................
Farm production: subsistence () subsistence + market () only market ()
Nature of farm production: Intercrop () Main crop () Abandoned ()
What proportion of tamarind do you sell 0-25% () 26-50% () 51- 75% () > 76%?
FARM DESCRIPTION

155
Size (Acreage) of farm 0-2 () 2.1-4 () 4.1 – 8 () > 8 ()
Proportion of farm under tamarind 0-2% () 2.1-4% () 4.1-8% () >8% ()
How is land prepared: By hand () animal () power machine ()
What is the source of planting material? Seeds () others specify ()
...........................................
Source of seeds used..................................................................................
Field management e.g. Weeding (), fertilizer application () Pruning ()
How long does tamarind take to mature? ..........................................
What are the maturity indices? ……………………………………………
Number of harvests per year: ones () 1-2 () continuous ()
Yields per plant. Not sure (), <180 Kg (), 181-270Kg (), >271kg ()
………..........................
Uses of tamarind plant...............................................................
Uses of tamarind fruit....................................................................................................
Medicinal uses of tamarind.........................................................................
Opinion on tamarind farming……………………………………………….
Other uses of tamarind
................................................................................................................

156
Major constraints of tamarind production
Pests ()
Major pests that affect tamarind production........................................................
Major pests that affect tamarind fruits........................................................
Control measures of the pests…………………………………………....
Disease ()
Major disease that affects tamarind production.....................................................
Major disease that affects tamarind fruits.............................................................
Market ()
Transport ()
Other challenges
i)
ii)

157
Appendix II: ANOVA table for trunk diameter at the ground variate
Source of variation d.f. s.s. m.s. v.r. F pr.
Sample 3 137256. 45752. 3.83 0.013
Residual 85 1014230. 11932.
Total 88 1151487.
Appendix III: ANOVA tables for trunk diameter at the neck variate
Source of variation d.f. s.s. m.s. v.r. F pr.
Sample 3 216197. 72066. 5.89 0.001
Residual 85 1039459. 12229.
Total 88 1255656. 14269.
Appendix IV: ANOVA table for height to the first branch variate
Source of variation d.f. s.s. m.s. v.r. F pr.
Sample 3 6046. 2015. 0.53 0.664
Residual 85 323821. 3810.
Total 88 329867. 3748.

158
Appendix V: ANOVA table for number of primary branches variate
Source of variation d.f. s.s. m.s. v.r. F pr.
Sample 3 0.6097 0.2032 1.41 0.246
Residual 85 12.2667 0.1443
Total 88 12.8764 0.1463
Appendix VI: ANOVA table for number of secondary branches variate
Source of variation d.f. s.s. m.s. v.r. F pr.
Sample 3 13.333 4.444 1.19 0.319
Residual 85 317.903 3.740
Total 88 331.236 3.764
Appendix i: ANOVA table for the number of seeds per pod variate
Source of variation d.f. s.s. m.s. v.r. F pr.
Sample 3 11.198 3.733 1.22 0.308
Residual 85 260.442 3.064
Total 88 271.640 3.087

159
AppendixVIII: ANOVA table for number of seeds per pod variate
Source of variation d.f. s.s. m.s. v.r. F pr.
Sample 3 67.233 22.411 3.12 0.030
Residual 85 611.006 7.188
Total 88 678.239 7.707
Appendix IX: ANOVA table for pod weight variate
Source of variation d.f. s.s. m.s. v.r. F pr.
Sample 3 71.57 23.86 0.52 0.671
Residual 85 3919.45 46.11
Total 88 3991.02 45.35
Appendix X: ANOVA table for pod width variate
Source of variation d.f. s.s. m.s. v.r. F pr.
Sample 3 282.5134 94.1711 127.82 <.001
Residual 85 62.6225 0.7367
Total 88 345.1359 3.9220

160
Appendix ii: ANOVA table for terminal shoot length variate
Source of variation d.f. s.s. m.s. v.r. F pr.
Sample 3 1581639. 527213. 5.22 0.002
Residual 85 8577113. 100907.
Total 88 10158753. 115440.
Appendix XII: ANOVA table for seed weight variate
Source of variation d.f. s.s. m.s. v.r. F pr.
Sample 3 0.11545 0.03848 1.11 0.350
Residual 85 2.94816 0.03468
Total 88 3.06360 0.03481

161
Appendix XIII: ANOVA table for pulp weight variate
Source of variation d.f. s.s. m.s. v.r. F pr.
Sample 3 0.4275 0.1425 1.29 0.284
Residual 85 9.3989 0.1106
Total 88 9.8264 0.1117
Appendix iii: Variance between morphological clusters
Absolute Percent
Within-class 7.258 66.12%
Between-classes 3.719 33.88%
Total 10.977 100.00%
Appendix XV: Distance between morphological clusters
1 2 3
1 0 2.494 5.513
2 2.494 0 5.712
3 5.513 5.712 0
Copyright © 2022 FDOKUMEN