Ammonia as an energy carrier: evaluation of the energetic efficiency of the...
6
Ammonia as an energy carrier: evaluation of the energetic efficiency of the production-transportation-utilization chain E. Biagini 1 , L. Tognotti 2 1. D. Energy and Environment - C. Pisa Ricerche, Pisa - ITALY 2. Chemical Engineering Department - Università di Pisa - ITALY 1. Introduction Some critical points in the hydrogen chain compromise the development of a hydrogen-based economy. Problems in storage and distribution systems, material choice and safety procedures can be overcome by the selection of ammonia as an energy carrier. Anhydrous liquid ammonia contains more hydrogen than pressurized or liquified hydrogen, can be easily stored and contains no carbon [1]. Ammonia produced from standard techniques (e.g., methane reforming) can be easily coupled with CCS (CO 2 capture and sequestration) option, while its use as an energy carrier will avoid the decentrated emissions of CO 2 . Ammonia is already distributed via pipelines, railroads, ships with standard safety procedures, while materials and large scale distribution systems for hydrogen require further investigation. Ammonia can be converted in energy directly (in dedicated engines) or indirectly (prior its dissociation into hydrogen). In this latter case, fuel cells guarantee a high performance. Utilization systems for ammonia, although studied since many decades require validation and demonstrative applications. The efficiency of the entire ammonia chain (production-transportation-utilization) should be evaluated and compared with that of hydrogen. Detailed process models are developed in this work considering the conventional production processes (methane reforming for hydrogen, an updated Haber-Bosch process for ammonia), the transportation (under high pressure for gaseous hydrogen, under moderate pressure for liquid ammonia) and the conversion- utilization systems (PEMFC for hydrogen, and three systems for ammonia: cracking-PEMFC, electrolysis-PEMFC, cracking-SOFC). The energetic efficiency of the ammonia-based chains is optimized varying the configuration and the operating conditions. In case the efficiency is comparable with that of hydrogen, the additional benefits (in storage and distribution, material choice and safety procedures) can make the ammonia based chain a successful option for a carbon free energy scenario. 2. Description of the processes Different processes (Tab. 1) are studied to allow one to compare the configurations and optimize the operating conditions. The feedstock for all processes is natural gas, so that pretreatments (e.g., desulfurization) are not considered. In each process a first block is represented by the production of the energy carrier, that is ammonia (processes 1 to 3) and hydrogen (process 4). The transportation of liquid ammonia is operated under low pressure (10-15 bar), while the gaseous hydrogen is transported under high pressure (700 bar). Hydrogen can be used directly in a Proton Exchange Membrane Fuel Cell (PEMFC), while ammonia have to be converted in a hydrogen stream by means of (process 1) electrolysis to be used in a PEMFC, (process 2) thermal cracking to be used in a PEMFC or (process 3) in a 1
Transcript of Ammonia as an energy carrier: evaluation of the energetic efficiency of the...

Ammonia as an energy carrier: evaluation of the energetic
efficiency of the production-transportation-utilization chain
E. Biagini1, L. Tognotti
2
1. D. Energy and Environment - C. Pisa Ricerche, Pisa - ITALY
2. Chemical Engineering Department - Università di Pisa - ITALY
1. Introduction
Some critical points in the hydrogen chain compromise the development of a hydrogen-based
economy. Problems in storage and distribution systems, material choice and safety procedures
can be overcome by the selection of ammonia as an energy carrier. Anhydrous liquid
ammonia contains more hydrogen than pressurized or liquified hydrogen, can be easily stored
and contains no carbon [1]. Ammonia produced from standard techniques (e.g., methane
reforming) can be easily coupled with CCS (CO2 capture and sequestration) option, while its
use as an energy carrier will avoid the decentrated emissions of CO2. Ammonia is already
distributed via pipelines, railroads, ships with standard safety procedures, while materials and
large scale distribution systems for hydrogen require further investigation. Ammonia can be
converted in energy directly (in dedicated engines) or indirectly (prior its dissociation into
hydrogen). In this latter case, fuel cells guarantee a high performance. Utilization systems for
ammonia, although studied since many decades require validation and demonstrative
applications.
The efficiency of the entire ammonia chain (production-transportation-utilization) should be
evaluated and compared with that of hydrogen. Detailed process models are developed in this
work considering the conventional production processes (methane reforming for hydrogen, an
updated Haber-Bosch process for ammonia), the transportation (under high pressure for
gaseous hydrogen, under moderate pressure for liquid ammonia) and the conversion-
utilization systems (PEMFC for hydrogen, and three systems for ammonia: cracking-PEMFC,
electrolysis-PEMFC, cracking-SOFC). The energetic efficiency of the ammonia-based chains
is optimized varying the configuration and the operating conditions. In case the efficiency is
comparable with that of hydrogen, the additional benefits (in storage and distribution, material
choice and safety procedures) can make the ammonia based chain a successful option for a
carbon free energy scenario.
2. Description of the processes
Different processes (Tab. 1) are studied to allow one to compare the configurations and
optimize the operating conditions. The feedstock for all processes is natural gas, so that
pretreatments (e.g., desulfurization) are not considered. In each process a first block is
represented by the production of the energy carrier, that is ammonia (processes 1 to 3) and
hydrogen (process 4). The transportation of liquid ammonia is operated under low pressure
(10-15 bar), while the gaseous hydrogen is transported under high pressure (700 bar).
Hydrogen can be used directly in a Proton Exchange Membrane Fuel Cell (PEMFC), while
ammonia have to be converted in a hydrogen stream by means of (process 1) electrolysis to be
used in a PEMFC, (process 2) thermal cracking to be used in a PEMFC or (process 3) in a
1
ragucci
Font monospazio
ISBN 978–88–88104–11-9 / doi : 10.4405/ptse2010.P2.16
Processes and Technologies for a Sustainable Energy
Solid Oxide Fuel Cell (SOFC). All units of the processes are modelled with a commercial
code (Aspen Plus® by Aspen Tech).
Efficiency parameters for the production process are adopted considering the large plant of
ammonia synthesis and natural gas reforming [2]. The total amount of carrier produced is
assumed to be transported over a 1000 km equivalent pipeline to a distribution site where n
utilization systems can be operated. Typical performance parameters for PEMFC and SOFC
are then considered for each system.
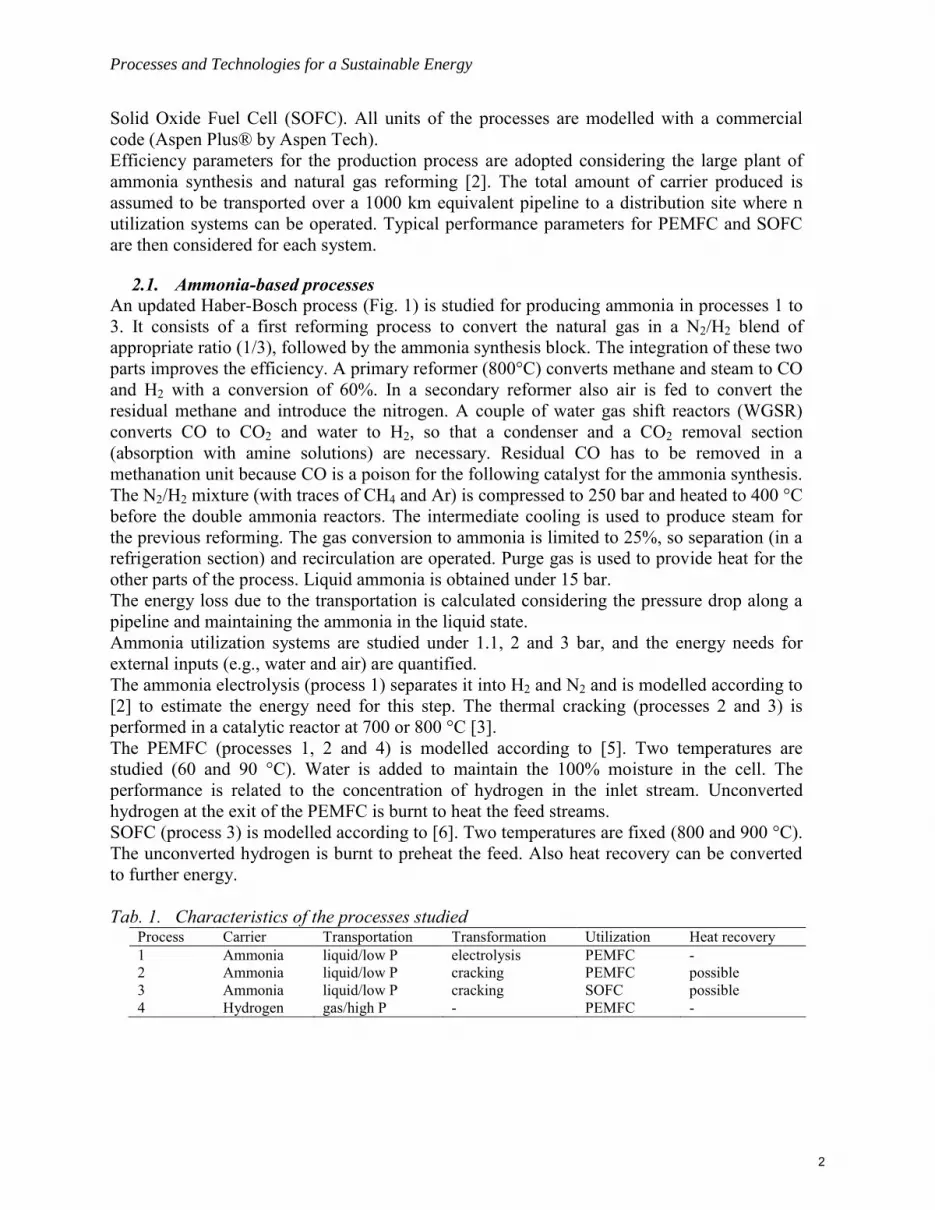
2.1. Ammonia-based processes
An updated Haber-Bosch process (Fig. 1) is studied for producing ammonia in processes 1 to
3. It consists of a first reforming process to convert the natural gas in a N2/H2 blend of
appropriate ratio (1/3), followed by the ammonia synthesis block. The integration of these two
parts improves the efficiency. A primary reformer (800°C) converts methane and steam to CO
and H2 with a conversion of 60%. In a secondary reformer also air is fed to convert the
residual methane and introduce the nitrogen. A couple of water gas shift reactors (WGSR)
converts CO to CO2 and water to H2, so that a condenser and a CO2 removal section
(absorption with amine solutions) are necessary. Residual CO has to be removed in a
methanation unit because CO is a poison for the following catalyst for the ammonia synthesis.
The N2/H2 mixture (with traces of CH4 and Ar) is compressed to 250 bar and heated to 400 °C
before the double ammonia reactors. The intermediate cooling is used to produce steam for
the previous reforming. The gas conversion to ammonia is limited to 25%, so separation (in a
refrigeration section) and recirculation are operated. Purge gas is used to provide heat for the
other parts of the process. Liquid ammonia is obtained under 15 bar.
The energy loss due to the transportation is calculated considering the pressure drop along a
pipeline and maintaining the ammonia in the liquid state.
Ammonia utilization systems are studied under 1.1, 2 and 3 bar, and the energy needs for
external inputs (e.g., water and air) are quantified.
The ammonia electrolysis (process 1) separates it into H2 and N2 and is modelled according to
[2] to estimate the energy need for this step. The thermal cracking (processes 2 and 3) is
performed in a catalytic reactor at 700 or 800 °C [3].
The PEMFC (processes 1, 2 and 4) is modelled according to [5]. Two temperatures are
studied (60 and 90 °C). Water is added to maintain the 100% moisture in the cell. The
performance is related to the concentration of hydrogen in the inlet stream. Unconverted
hydrogen at the exit of the PEMFC is burnt to heat the feed streams.
SOFC (process 3) is modelled according to [6]. Two temperatures are fixed (800 and 900 °C).
The unconverted hydrogen is burnt to preheat the feed. Also heat recovery can be converted
to further energy.
Tab. 1. Characteristics of the processes studied Process Carrier Transportation Transformation Utilization Heat recovery
1 Ammonia liquid/low P electrolysis PEMFC -
2 Ammonia liquid/low P cracking PEMFC possible
3 Ammonia liquid/low P cracking SOFC possible
4 Hydrogen gas/high P - PEMFC -
2

Ischia, June, 27-30 - 2010
Primaryreformer
Steam
Natural gas
Reforming air
Secondaryreformer
HT COshifter
LT COshifter
CO2absorption
Condensateseparator
CO2desorption
CO2
Methanationreactor
Refrigerationsection
Ammoniareactor1
Ammoniareactor2
Evaporator
Water
Flash1
Flash2 Ammonia
Furnace
Combustion air
AmmoniaCracking
N2, H2
PEMFC
electricity
Electrolyzer
N2H2
SOFC
electricity
PEMFC
electricity
Ammonia
storage
and
trans-
portation
Ammoniacracking
N2, H2
Fig. 1 Simplified scheme of the ammonia production process and the utilization options.
Steam
Natural gas
Methanereformer
HT COshifter
LT COshifter
CO2absorption
Condensateseparator
CO2desorption
CO2Evaporator
Water
Furnace
Combustion air
H2
PEMFC
electricity
Hyrogen
storage
and
trans-
portation
Hydrogencompression
Fig. 2 Simplified scheme of the hydrogen production/utilization process.
2.2. Hydrogen-based process
The hydrogen (process 4) is produced via methane reforming by using a part of the inlet fuel
in a furnace to produce steam and heat. High and low temperature WGSRs convert CO in
CO2 and water in H2. CO2 can be separated for an optional CCS unit (not studied here). A
multi-stage compression section raises the pressure of hydrogen to 700 bar. The energy loss
due to the transportation is calculated considering the pressure drop along a pipeline and
maintaining the hydrogen under high pressure. The PEMFC is modelled as described above.
3. Results
Based on 1 kg of methane, 1.88 kg of ammonia or 0.28 kg of hydrogen can be obtained. Mass
and energy streams are shown in the graphs of Fig. 3 (for utilization pressure of 1.1 bar) and 4
(for utilization pressure of 3 bar). Transportation, transformation and utilization needs are
quantified and global efficiency parameters are calculated:
44
.1
CHin LHVCH
powernetGE
44
..2
CHin LHVCH
needstransportpowernetGE
44
...3
CHin LHVCH
energyrecoevredneedstransportpowernetGE
3

Processes and Technologies for a Sustainable Energy
Natural gas pretreatment/ transportation
(1 kg CH4)
GE2 - 8.0%
3.2 kg H2Oreforming
0.85 kg CH4feedstock
0.15 kg CH4fuel
4.8 MJenergy needs
1.88 kg NH3
Heat generationand recovery
0.26 MJenergy needs
NH3transportation
16.3 MJenergy needs
NH3electrolysis
0.4 MJenergy needs
PEMFC
17.8 MJenergy production
NH3 electrolysis / PEMFC
NH3 syntesis and transportation
air
H2
GE2 13.5%
heat generation
NH3cracking
0.25 MJenergy needs
PEMFC
12.0 MJenergy production
NH3 cracking / PEMFC
air
H2 - N20.3
0.7
GE3 21.2 %
4.1 MJthermal energy
GE2 4.6%
heat generation
NH3cracking
0.36 MJenergy needs
SOFC
7.7 MJenergy production
NH3 cracking / SOFC
air
H2 / N2
GE3 18.7%
7.5 MJthermal energy
N2
2.3 kg H2O
reforming
1.2 MJenergy needs
0.28 kg H2
Heat generationand recovery
3.69 MJenergy needs
H2transportation
H2 syntesis and transportation
air
H2 compressionto 700 bar
2.15 MJenergy needs
GE2 17.9%
0.3 MJenergy needs
PEMFC
16.0 MJenergy production
PEMFC
air
H2
residual gas
Utilization assumptions:- NH3 electrolysis / PEMFC (1.1, 90, 60)- NH3 cracking / PEMFC (1.1, 700, 60)- NH3 cracking / SOFC (1.1, 700, 800)
- H2 / PEMFC (1.1, - , 60)
where (P, Tpr, Tfc) represents the pressure of the utilization line (atm), the temperature of the ammonia pretreatment (°C) and the temperature of the fuel cell (°C), respectively.
Fig. 3 Detailed results of process models: mass and energy balance along the production-
transportation-utilization chains (case of pressure 1.1 bar in the utilization systems).
Natural gas pretreatment/ transportation
(1 kg CH4)
GE2 1.3%
3.2 kg H2Oreforming
0.85 kg CH4feedstock
0.15 kg CH4fuel
4.8 MJenergy needs
1.88 kg NH3
Heat generationand recovery
0.26 MJenergy needs
NH3transportation
16.3 MJenergy needs
NH3electrolysis
3.3 MJenergy needs
PEMFC
25.3 MJenergy production
NH3 electrolysis / PEMFC
NH3 syntesis and transportation
air
H2
GE2 13.5%
heat generation
NH3cracking
1.1 MJenergy needs
PEMFC
15.7 MJenergy production
NH3 cracking / PEMFC
air
H2 - N20.3
0.7
GE3 21.2 %
10.7 MJthermal energy
GE2 13.9%
heat generation
NH3cracking
2.6 MJenergy needs
SOFC
14.6 MJenergy production
NH3 cracking / SOFC
air
H2 / N2
GE3 18.8%
7.1 MJthermal energy
N2
2.3 kg H2O
reforming
1.2 MJenergy needs
0.28 kg H2
Heat generationand recovery
3.69 MJenergy needs
H2transportation
H2 syntesis and transportation
air
H2 compressionto 700 bar
2.15 MJenergy needs
GE2 28.5%
1.65 MJenergy needs
PEMFC
21.3 MJenergy production
PEMFC
air
H2
residual gas
Utilization assumptions:- NH3 electrolysis / PEMFC (3, 90, 90)- NH3 cracking / PEMFC (3, 700, 90)- NH3 cracking / SOFC (3, 700, 900)
- H2 / PEMFC (3, - , 90)
where (P, Tpr, Tfc) represents the pressure of the utilization line (atm), the temperature of the ammonia pretreatment (°C) and the temperature of the fuel cell (°C), respectively.
Fig. 4 Detailed results of process models: mass and energy balance along the production-
transportation-utilization chains (case of pressure 3 bar in the utilization systems).
4

Ischia, June, 27-30 - 2010
The above parameters are used to remark the importance of the transportation step and the
energy obtainable from the heat recovery at high temperature in processes 2 and 3. All cases
are compared in Fig. 5. In general, the higher the pressure of the utilization systems, the
higher the efficiency of the process. This is verified even if the energy needs due to
compression of the inlet streams are accounted for in all cases. The increase in the efficiency
is due to the higher power obtained in the fuel cells for a higher partial pressure of the
hydrogen. Also the temperature of the transformation and utilization units influences the
efficiency, because of the dependence of the power production on the temperature in the
various contributions (electromotive force, activation, ohmic and concentration overvoltages).
The energy needs for transportation reduce the global efficiency more significantly for H2
based systems than those based on ammonia (see GE2 in Fig. 5). However, comparing only
the values of GE2, the ammonia based systems are still less efficient than the hydrogen based
systems for all conditions. Obviously further benefits will have to be considered for this step
(e.g., safety issues, material choice).
Power generation obtainable with the heat available at high temperature in processes 2 and 3
makes the efficiency of NH3 based systems to be comparable (and in some cases higher) to
that of H2 based systems. As a matter of fact this possibility makes more complex the
utilization systems, so further consdieration should be discusses (cost analysis).
GE1:
-0.2
-0.1
0
0.1
0.2
0.3
0.4
0.5
1.1 2 3
Pfc atm
Glo
bal
Eff
icie
ncy
NH3el-pem NH3cr-pem NH3cr-sofc H2-pem
T fc: 60 °C 60 °C 800 °C 60 °C
no transportationno heat recovery
-0.2
-0.1
0
0.1
0.2
0.3
0.4
0.5
1.1 2 3
Pfc atm
Glo
bal
Eff
icie
ncy
NH3el-pem NH3cr-pem NH3cr-sofc H2-pem
T fc: 90 °C 90 °C 900 °C 90 °C
no transportationno heat recovery
GE2:
-0.2
-0.1
0
0.1
0.2
0.3
0.4
0.5
1.1 2 3
Pfc atm
Glo
bal
Eff
icie
ncy
NH3el-pem NH3cr-pem NH3cr-sofc H2-pem
T fc: 60 °C 60 °C 800 °C 60 °C
including transportationno heat recovery
-0.2
-0.1
0
0.1
0.2
0.3
0.4
0.5
1.1 2 3
Pfc atm
Glo
bal
Eff
icie
ncy
NH3el-pem NH3cr-pem NH3cr-sofc H2-pem
T fc: 90 °C 90 °C 900 °C 90 °C
including transportationno heat recovery
GE3:
-0.2
-0.1
0
0.1
0.2
0.3
0.4
0.5
1.1 2 3
Pfc atm
Glo
bal
Eff
icie
ncy
NH3el-pem NH3cr-pem NH3cr-sofc H2-pem
T fc: 60 °C 60 °C 800 °C 60 °C
including transportationincluding heat recovery
-0.2
-0.1
0
0.1
0.2
0.3
0.4
0.5
1.1 2 3
Pfc atm
Glo
bal
Eff
icie
ncy
NH3el-pem NH3cr-pem NH3cr-sofc H2-pem
T fc: 90 °C 90 °C 900 °C 90 °C
including transportationincluding heat recovery
Fig. 5 Results of the process models: comparison of the global efficiency under different
operating conditions (of temperature and pressure in the utilization system) and
assumptions (with or without transportation and heat recovery).
5

Processes and Technologies for a Sustainable Energy
Natural gas pretreatment/ transportation
(1 kg CH4)
Ammonia synthesisand transportation
(1.88 kg NH3)
NH3 cracking/ PEMFC
NH3 cracking/ SOFC
NH3 electrolysis / PEMFC
global efficiency +9.7 / 26.6%
global efficiency -14.4 / +1.8%
global efficiency+ 4.6 / 23.0%
Natural gas
Hydrogen productionand transportation
(0.28 kg H2)
PEMFC
global efficiency + 12.3 / 35.9%
studied systems
Fig. 6 Summary of results of the process models: range of efficiency obtained in all cases.
4. Conclusion
Considering all configurations, all the operating conditions and the different definitions of the
global efficiency, the range of efficiency obtainable in the four processes studied are
summarized in Fig. 6. The global efficiency of the hydrogen-based process (4) varies between
12% and 36% in the range of conditions studied. The highest values are obtained when
neglecting the transportation needs. Among the ammonia-based processes, the electrolysis
step of process 1 is extremely costly, so that the global efficiency is mostly negative, that is
the energy needs are bigger than the power produced in the utilization system. The efficiency
of process 1 is slightly positive only in few cases (for pressure of 3 bar in the PEMFC). Also
processes 2 and 3 give lower values of the global efficiency with respect to the hydrogen base
process if transportation needs and heat recovery are not considered. Comparable values to
those of the hydrogen based process when including the transportation needs and the energy
obtainable from the heat recovery. Therefore, from an energetic point of view, the use of
ammonia as an energy carrier can be competitive with the use of hydrogen. The optimization
of the configuration and the operating conditions is indeed necessary.
Further benefits of ammonia as an energy carrier derive from the easy transportability (safety
standards, choice of materials, existing distribution systems) of ammonia with respect to
hydrogen. More confirmations are needed for the ammonia utilization systems.
Future work will be devoted to optimize alternative processes (for instance, starting from
renewable feedstocks, like the gasification of biomass fuels) for ammonia production, even
coupled with the CCS option.
5. References
1. Zamfirescu C., Dincer I. Fuel Processing Technology, 90:729 (2009).
2. Ullmann's Encyclopedia of Industrial Chemistry
3. Boggs B. K., Botte G. G. Journal of Power Sources, 192:573 (2009).
4. Choudhary T.V., Goodman D.W. Catalysis Today, 77:65 (2002).
5. Caux S., Hankache W., Fadel M., Hissel D. Energy Convers. Manage., 51:320 (2010).
6. Campanari S., Iora P. J. Power Sources, 132:113 (2004)
6