
One-Electron and Two-Electron Transfers in Electrochemistry and Homogeneous Solution Reactions
Upload
khangminh22Category
view
2download
0
Icarus 221 (2012) 116–134
Contents lists available at SciVerse ScienceDirect
Icarus
journal homepage: www.elsevier .com/ locate/ icarus
Energetic electron observations of Rhea’s magnetospheric interaction
E. Roussos a,⇑, P. Kollmann a,b, N. Krupp a, C. Paranicas b, S.M. Krimigis b, D.G. Mitchell b, A.M. Persoon c,D.A. Gurnett c, W.S. Kurth c, H. Kriegel d, S. Simon e, K.K. Khurana f, G.H. Jones g,h, J.-E. Wahlund i,M.K.G. Holmberg i
a Max Planck Institute for Solar System Research, Max-Planck-Str. 2, 37191 Katlenburg-Lindau, Germanyb Johns Hopkins University, Applied Physics Laboratory, 11100 Johns Hopkins Road, Laurel, MD 20723-6099, USAc Department of Physics and Astronomy, University of Iowa, Iowa City, IA 52242, USAd Institute for Theoretical Physics, TU Braunschweig, Mendelssohnstr. 3, D-38106 Braunschweig, Germanye Institute of Geophysics and Meteorology, University of Cologne, Albertus Magnus Platz, D-50923 Cologne, Germanyf Institute of Geophysics and Planetary Physics, 6863 Slichter Hall, Los Angeles, CA 90095-1567, USAg Mullard Space Science Laboratory, University College London, Holmbury St. Mary, Dorking RH5 6NT, UKh The Centre for Planetary Sciences at UCL/Birkbeck, Gower Street, London WC1E 6BT, UKi Swedish Institute of Space Physics, PO Box 537, SE-75121 Uppsala, Sweden
a r t i c l e i n f o
Article history:Received 29 February 2012Revised 6 July 2012Accepted 11 July 2012Available online 27 July 2012
Keywords:Saturn, MagnetosphereSaturn, SatellitesMoon
0019-1035/$ - see front matter � 2012 Elsevier Inc. Ahttp://dx.doi.org/10.1016/j.icarus.2012.07.006
⇑ Corresponding author.E-mail address: [email protected] (E. Roussos)
a b s t r a c t
Saturn’s moon Rhea is thought to be a simple plasma absorber, however, energetic particle observationsin its vicinity show a variety of unexpected and complex interaction features that do not conform withour current understanding about plasma absorbing interactions. Energetic electron data are especiallyinteresting, as they contain a series of broad and narrow flux depletions on either side of the moon’swake. The association of these dropouts with absorption by dust and boulders orbiting within Rhea’s Hillsphere was suggested but subsequently not confirmed, so in this study we review data from all four Cas-sini flybys of Rhea to date seeking evidence for alternative processes operating within the moon’s inter-action region. We focus on energetic electron observations, which we put in context with magnetometer,cold plasma density and energetic ion data. All flybys have unique features, but here we only focus onseveral structures that are consistently observed. The most interesting common feature is that of narrowdropouts in energetic electron fluxes, visible near the wake flanks. These are typically seen together withnarrow flux enhancements inside the wake. A phase-space-density analysis for these structures from thefirst Rhea flyby (R1) shows that Liouville’s theorem holds, suggesting that they may be forming due torapid transport of energetic electrons from the magnetosphere to the wake, through narrow channels.A series of possibilities are considered to explain this transport process. We examined whether complexenergetic electron drifts in the interaction region of a plasma absorbing moon (modeled through a hybridsimulation code) may allow such a transport. With the exception of several features (e.g. broadening ofthe central wake with increasing electron energy), most of the commonly observed interaction signaturesin energetic electrons (including the narrow structures) were not reproduced. Additional dynamical pro-cesses, not simulated by the hybrid code, should be considered in order to explain the data. For the smallscale features, the possibility that a flute (interchange) instability acts on the electrons is discussed. Thisinstability is probably driven by strong gradients in the plasma pressure and the magnetic field magni-tude: magnetometer observations show clearly signatures consistent with the (expected) plasma pres-sure loss due to ion absorption at Rhea. Another potential driver of the instability could have beengradients in the cold plasma density, which are, however, surprisingly absent from most crossings ofRhea’s plasma wake. The lack of a density depletion in Rhea’s wake suggests the presence of a local coldplasma source region. Hybrid plasma simulations show that this source cannot be the ionized componentof Rhea’s weak exosphere. It is probably related to accelerated photoelectrons from the moon’s negativelycharged surface, indicating that surface charging may play a very important role in shaping Rhea’s mag-netospheric interaction region.
� 2012 Elsevier Inc. All rights reserved.
ll rights reserved.
.
E. Roussos et al. / Icarus 221 (2012) 116–134 117
1. Introduction
Rhea is Saturn’s largest icy moon (radius: 1RRh = 764 km). It or-bits the planet on an equatorial and circular orbit at a distance ofabout 8.74Rs from its center (1Rs = 60,268 km). Recent studiesshowed that Rhea is surrounded by a tenuous exosphere composedof oxygen and carbon dioxide (Teolis et al., 2010). Despite that, themain interaction mode of Rhea with the magnetosphere wasshown to be plasma absorption. Magnetic field perturbations inRhea’s interaction region appear to be guided primarily by the for-mation of a plasma pressure cavity (wake) downstream of themoon and not from mass or momentum loading from the ionizedproducts of this weak exosphere (Simon et al., 2012; Khuranaet al., 2008; Roussos et al., 2008).
The interaction region of any plasma absorbing moon is typi-cally located downstream of the moon with respect to the directionof the bulk plasma flow. Depending of the upstream sonic Machnumber, Ms, the opening angle of the plasma wake can vary alongthe magnetic field direction (low/high for large/small Ms) (Samiret al., 1983). For very low Mach numbers (e.g. Saturn’s moons)the outer flanks of the plasma cavity tend to become tangentialto the surface of the plasma absorbing body (Khurana et al.,2008). Perpendicular to the magnetic field (or to the flux tubeenclosing the wake) the width of the cavity is approximately equalto the moon’s diameter.
The extension of the wake downstream of the moon also ap-pears to be associated with the sonic Mach number: for low Machnumbers, the cavity has a smaller extension than the typical,supersonic case of the lunar wake in the solar wind. Simulationsindicate that Rhea’s cold plasma wake should refill completelywithin a distance of about 10RRh downstream (Simon et al.,2012; Roussos et al., 2008).
The strongest electric and magnetic field disturbances existwithin the boundaries of the wake. Pressure gradient (diamag-netic) currents flowing along the wake boundaries or within thewake lead to a compression of the magnetic field, B, behind themoon. The requirement for the total pressure (magnetic and plas-ma) to remain constant is also an alternative (and equivalent)explanation for the presence of this B enhancement.
The same diamagnetic currents lead to magnetic field perturba-tions on the two sides of the flux tube corridor enclosing the plas-ma wake. Khurana et al. (2008) calls these features ‘‘expansionfans’’, which at Rhea extend up to several moon radii on either sideof the wake. The magnetic field magnitude (jBj) drops within theseregions (see also Fig. 5 of Roussos et al. (2008)).
While magnetometer data comply with this standard, lunar-type interaction concept, Cassini’s energetic charged particleobservations of the near-Rhea environment by MIMI/LEMMS(Krimigis et al., 2004) are rich in unusual interaction features(Jones et al., 2008). The first close downstream flyby on November26, 2005 (termed R1), revealed broad energetic electron (20–100 keV) flux dropouts extending almost 7–8 Rhea radii (RRh) oneach side of Rhea’s wake. Hints for a broad decrease in fluxes werealso present in a more distant 2007 downstream, non-targettedflyby of Rhea that took place on August 30, 2007 (informallytermed R1.5).
In addition to the broad regions of energetic electron flux drop-outs, Cassini’s MIMI/LEMMS detector recorded smaller scale drop-outs each of which was few tens of km across. These were detectedjust outside the wake boundaries (wake flanks), within 2RRh fromthe center of the moon, in both the saturnward and the antisaturn-ward sectors of the interaction region.
As the scale size of the broad depletion region was, for both fly-bys, comparable to the size of Rhea’s Hill sphere (the region wherethe moon’s gravity dominates that of Saturn), it was proposed that
Rhea was surrounded by a disk containing large grains. Thesegrains served as an energetic electron sink. In view of this interpre-tation it was also suggested that part of these trapped grain popu-lations were concentrated into one or more narrow ringlets aroundRhea, which could have been the source of the smaller scale drop-outs seen by MIMI/LEMMS. Other evidence, such as the broadeningof these small dips with increasing electron energy (gyroradius ef-fects) were not contrary to this possibility.
Subsequent analysis and optical observations, however, ruledout these scenarios (Tiscareno et al., 2010). Features such as thesimilar spatial scales of the broad depletion regions with the sizeof Rhea’s Hill sphere and the simultaneous presence of smallerscale dropouts near the moon appear to be coincidental. Since itappears unlikely that the explanation of the observations involvesany absorbing medium around Rhea, answers to the problemshould invoke plasma or magnetospheric processes.
Since the first two flybys in 2005 and 2007, two more have ta-ken place on March 2, 2010 (R2) and January 11, 2011 (R3). Thegoal of this work is to primarily review and describe MIMI/LEMMSenergetic electron observations from all Rhea close flybys, to putthem in context with observations and findings from other Cassiniinstruments and to focus on common interaction signatures thatcan be identified among the different flybys. We will then proposeinterpretations that will help us form a more clear picture aboutthe structure and the dynamics of the moon’s interaction regionand about the nature of the processes that drive some of the unu-sual energetic particle observations. Unique flyby features will notbe explicitly analyzed in this work, but they will be identifiedmostly for reference in future studies.
2. Flyby information
Table 1 contains basic information about the first four close Cas-sini flybys of Rhea to date. The first two (R1 and R1.5) were down-stream of Rhea, with R1.5 at a relatively large distance compared tothe other three. R2 was above the moon’s north pole, while R3 wasabove its south pole. A sketch of the equatorial projections of Cas-sini’s trajectories in Rhea’s Interaction System (RHIS) are shown inFig. 1.
The RHIS is centered at Rhea and has the positive x-axis alongthe plasma nominal corotation direction, the positive y-axis point-ing towards Saturn, while +z completes the right-hand system,pointing north and approximately antiparallel to the direction ofthe background B. The vertical offset from the xy-plane, given inFig. 1, was less than 1.5RRh in all cases. The average offsets are gi-ven in Table 1.
Here, the geometrical/corotational wake is defined on the basisof where energetic electron absorption may be observed. Becauseof the rapid bounce motion of energetic electrons, the energeticelectron wake is weakly limited by Cassini’s z-position and can ex-tend to very large distances, north and south of the moon. There-fore the condition for absorption is satisfied when Cassini isdownstream of Rhea’s volume or magnetically connected to themoon, namely when jyj 6 1RRh(x P 0) or
ffiffiffiffiffiffiffiffiffiffiffiffiffiffiffix2 þ y2
p6 1RRh (x < 0).
The region whereffiffiffiffiffiffiffiffiffiffiffiffiffiffiffix2 þ y2
p6 1 corresponds to Rhea’s flux-tube, a
term that may sometimes be used in this study instead of ‘‘wake’’.The aforementioned definition is valid for energetic electrons
that drift towards +x. Electrons with energies above the keplerianresonant energy drift towards �x and therefore the conditions gi-ven in the previous paragraph are reversed. The keplerian resonantenergy (Erk) is the kinetic energy at which the total drift rate ofenergetic electrons cancels the keplerian drift rate of a moon.
In various plots of this study we will indicate the wakeboundaries only for electrons with E < Erk, since most of theavailable data are in this energy regime (Section 3). When Erk
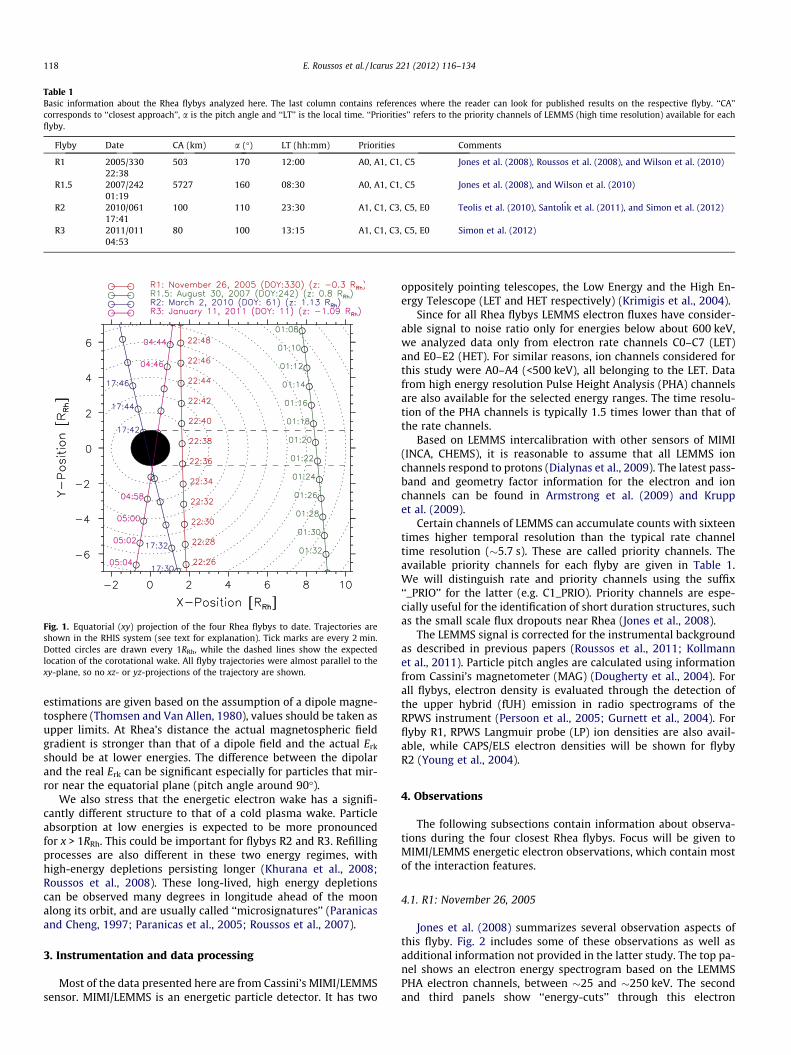
Table 1Basic information about the Rhea flybys analyzed here. The last column contains references where the reader can look for published results on the respective flyby. ‘‘CA’’corresponds to ‘‘closest approach’’, a is the pitch angle and ‘‘LT’’ is the local time. ‘‘Priorities’’ refers to the priority channels of LEMMS (high time resolution) available for eachflyby.
Flyby Date CA (km) a (�) LT (hh:mm) Priorities Comments
R1 2005/330 503 170 12:00 A0, A1, C1, C5 Jones et al. (2008), Roussos et al. (2008), and Wilson et al. (2010)22:38
R1.5 2007/242 5727 160 08:30 A0, A1, C1, C5 Jones et al. (2008), and Wilson et al. (2010)01:19
R2 2010/061 100 110 23:30 A1, C1, C3, C5, E0 Teolis et al. (2010), Santolı́k et al. (2011), and Simon et al. (2012)17:41
R3 2011/011 80 100 13:15 A1, C1, C3, C5, E0 Simon et al. (2012)04:53
Fig. 1. Equatorial (xy) projection of the four Rhea flybys to date. Trajectories areshown in the RHIS system (see text for explanation). Tick marks are every 2 min.Dotted circles are drawn every 1RRh, while the dashed lines show the expectedlocation of the corotational wake. All flyby trajectories were almost parallel to thexy-plane, so no xz- or yz-projections of the trajectory are shown.
118 E. Roussos et al. / Icarus 221 (2012) 116–134
estimations are given based on the assumption of a dipole magne-tosphere (Thomsen and Van Allen, 1980), values should be taken asupper limits. At Rhea’s distance the actual magnetospheric fieldgradient is stronger than that of a dipole field and the actual Erk
should be at lower energies. The difference between the dipolarand the real Erk can be significant especially for particles that mir-ror near the equatorial plane (pitch angle around 90�).
We also stress that the energetic electron wake has a signifi-cantly different structure to that of a cold plasma wake. Particleabsorption at low energies is expected to be more pronouncedfor x > 1RRh. This could be important for flybys R2 and R3. Refillingprocesses are also different in these two energy regimes, withhigh-energy depletions persisting longer (Khurana et al., 2008;Roussos et al., 2008). These long-lived, high energy depletionscan be observed many degrees in longitude ahead of the moonalong its orbit, and are usually called ‘‘microsignatures’’ (Paranicasand Cheng, 1997; Paranicas et al., 2005; Roussos et al., 2007).
3. Instrumentation and data processing
Most of the data presented here are from Cassini’s MIMI/LEMMSsensor. MIMI/LEMMS is an energetic particle detector. It has two
oppositely pointing telescopes, the Low Energy and the High En-ergy Telescope (LET and HET respectively) (Krimigis et al., 2004).
Since for all Rhea flybys LEMMS electron fluxes have consider-able signal to noise ratio only for energies below about 600 keV,we analyzed data only from electron rate channels C0–C7 (LET)and E0–E2 (HET). For similar reasons, ion channels considered forthis study were A0–A4 (<500 keV), all belonging to the LET. Datafrom high energy resolution Pulse Height Analysis (PHA) channelsare also available for the selected energy ranges. The time resolu-tion of the PHA channels is typically 1.5 times lower than that ofthe rate channels.
Based on LEMMS intercalibration with other sensors of MIMI(INCA, CHEMS), it is reasonable to assume that all LEMMS ionchannels respond to protons (Dialynas et al., 2009). The latest pass-band and geometry factor information for the electron and ionchannels can be found in Armstrong et al. (2009) and Kruppet al. (2009).
Certain channels of LEMMS can accumulate counts with sixteentimes higher temporal resolution than the typical rate channeltime resolution (�5.7 s). These are called priority channels. Theavailable priority channels for each flyby are given in Table 1.We will distinguish rate and priority channels using the suffix‘‘_PRIO’’ for the latter (e.g. C1_PRIO). Priority channels are espe-cially useful for the identification of short duration structures, suchas the small scale flux dropouts near Rhea (Jones et al., 2008).
The LEMMS signal is corrected for the instrumental backgroundas described in previous papers (Roussos et al., 2011; Kollmannet al., 2011). Particle pitch angles are calculated using informationfrom Cassini’s magnetometer (MAG) (Dougherty et al., 2004). Forall flybys, electron density is evaluated through the detection ofthe upper hybrid (fUH) emission in radio spectrograms of theRPWS instrument (Persoon et al., 2005; Gurnett et al., 2004). Forflyby R1, RPWS Langmuir probe (LP) ion densities are also avail-able, while CAPS/ELS electron densities will be shown for flybyR2 (Young et al., 2004).
4. Observations
The following subsections contain information about observa-tions during the four closest Rhea flybys. Focus will be given toMIMI/LEMMS energetic electron observations, which contain mostof the interaction features.
4.1. R1: November 26, 2005
Jones et al. (2008) summarizes several observation aspects ofthis flyby. Fig. 2 includes some of these observations as well asadditional information not provided in the latter study. The top pa-nel shows an electron energy spectrogram based on the LEMMSPHA electron channels, between �25 and �250 keV. The secondand third panels show ‘‘energy-cuts’’ through this electron

Fig. 2. R1 flyby observations, organized in several panels. Starting from top, we see a LEMMS PHA electron energy–time spectrogram, the second and third panels show fluxesof nine rate channels of LEMMS, the fourth panel shows the electron density from RPWS fUH emission, together with the ion density from the RPWS Langmuir Probe. Thebottom panel contains the magnetic field magnitude by MAG. The various legends include the necessary information about markups and annotations in the plot. LP iondensities have been manually divided by a factor of 3 to account for systematic errors in the calculation method. As discussed in Section 5.4, the reduced ion density in the LPdataset during the wake crossing is probably not real.
E. Roussos et al. / Icarus 221 (2012) 116–134 119
spectrogram at the energies of nine rate channels of LEMMS. Thefourth and fifth panels show the plasma density and the total mag-netic field measured by MAG, respectively. We note that MAG datafor all Rhea flybys (except R1.5) are extensively analyzed in a seriesof papers to which we refer the reader for more details (Simonet al., 2012; Khurana et al., 2008; Roussos et al., 2008).
We will now discuss some of the main features visible in thesefive panels.
4.1.1. Corotational wakeThe signature of the wake crossing is a large dropout in particle
fluxes of between one and four orders of magnitude, depending on
electron energy. The timings of the expected boundary crossings(dashed lines) agree well with predictions. Fluxes do not reachbackground levels immediately inside these boundaries, but dropgradually over a distance of about 0.3RRh within them. Fluxes arevery low at the wake center, although some channels (C0–C4) re-cord foreground with a weak signal to noise ratio of about 5–7.
The wake is also visible in the higher energy channels C6 and E2(third panel). Its edge-to-edge extension along the y-axis (RHISsystem) is about 3RRh wider than Rhea’s diameter. The profile ofchannel C7 (510–832 keV) features many flux dropouts. None ofthese is centered on the location of the expected wake crossing.Note that most C7 electrons have energies above the keplerian
1 For interpretation of color in Figs. 1–12, the reader is referred to the web versionf this article.
120 E. Roussos et al. / Icarus 221 (2012) 116–134
resonant energy at Rhea (Erk). They arrive from the nominal wake-side direction and have not yet encountered the solid body of themoon at the locations of the R1 flyby. Erk is �550 keV.
An unexpected result is the lack of a reduction of the RPWSelectron density (fourth panel from top). We note that the electrondensity is dominated by electrons below about �1 keV, which havedifferent drift properties from energetic electrons and also havedifferent source and loss processes. We also overplot the ion den-sity profile from the RPWS Langmuir Probe (LP), which appears toshow a density dropout in the wake. Furthermore, MAG data showan enhancement in the magnetic field magnitude, consistent witha loss of perpendicular plasma pressure in the wake. This pressureloss is typically associated to a plasma density dropout, not visiblein all datasets.
Since it is probably unreasonable to interpret MAG and RPWSfUH/LP observations as evidence of a large charge density in Rhea’swake (deviation from charge neutrality), one of the two densitymeasurements is probably problematic. The subject is discussedin Section 5.4.
4.1.2. Broad depletions and structuresAs ‘‘broad depletions’’ we refer to the electron flux dropouts
that do not appear to originate from absorption at the surface ofthe moon and have an extension larger than Rhea’s diameter.The distinction is not clear in all cases, as it depends also on howthe data are interpreted. For instance, the dropout seen in channelE2 of LEMMS appears too broad to be associated with absorption atRhea’s surface. However, as Roussos et al. (2007) found, this couldbe the result of a diffusive broadening of the actual electron deple-tion formed at Rhea’s surface, which is observed to occur much fas-ter at higher energies than at low energies. Alternative explanationfor such cases is given in Section 5.2.
The most obvious broad depletions exist below about 100 keV(channels C0–C4, e.g. second panel of Fig. 2). Their width is about�7RRh on each side (Jones et al., 2008). Excluding channel E2, theremaining electron channels have also some rather broad electronflux dropouts that are about 2RRh wide in channel C7 (22:28-22:34) and channel C6 (22:44-22:47).
The latter dropout seems to be associated with smaller scaledropouts at lower energy channels (see Section 4.1.3), a sharp in-crease of jBj centered around 22:45 and a shallow dropout in elec-tron density (marked between dotted-dashed lines). Thiscombination of signatures is typical of depleted flux tubes partici-pating in the centrifugal interchange process (André et al., 2007).Evidence that this may be the case is also visible in the CAPS/ELSelectron dataset, where an enhancement of 1–5 keV energetic elec-trons is seen (Fig. 2, Panel D of Jones et al. (2008)).
We also note a relatively sharp jump in electron densities at22:25 (dotted line) and a density decrease on either side of thewake (from about 6 cm�3 to 4 cm�3), occurring slowly over a dis-tance of 5RRh.
The significance of any of the features discussed here wouldalso depend on whether they appear in the other Rhea flybys,otherwise we cannot rule out that they are fluctuations of thebackground magnetospheric parameters, unconnected to themoon.
4.1.3. Small scale depletions and structuresThe term ‘‘small scale depletions’’ refers to the flux dropouts
that have a width that is significantly smaller that Rhea’s diameterand do not seem to be caused by electron absorption on the moon’ssurface. These features are usually visible closer to the wake. Fig. 3shows data in a time interval spanning a few minutes before andafter the wake crossing. The format is similar to Fig. 2, but the sec-ond and third panels show data from the priority channels C1_PRIOand C5_PRIO, respectively.
Small scale depletions are well visible in the PHA energy–timespectrogram (top) and the data of C1_PRIO. We use red1 arrowsto mark some of them. At the energy of C5_PRIO, small scale deple-tions are visible but less resolved than those of C1_PRIO. This ispartly attributed to the lower signal to noise ratio of that channeland partly to the fact that groups of small scale depletions at lowerenergies appear to coincide with a single, broader depletion abovethe energy of C5_PRIO.
Characteristic examples of merged low energy depletions athigh energies are the dropouts in C5_PRIO (or C5) after 22:40:30(last red arrow in the middle panel of Fig. 3). The same feature isalso visible in channels C6, C7 and E3 in Fig. 2. The broadeningand merging of small scale depletions appears to occur only atenergies above 130 keV, as inspection of the energy–time spectro-gram of Fig. 3 shows.
As mentioned in Section 4.1.1, fluxes do not drop sharply tobackground inside the wake boundaries. An interesting observa-tion is that the flux within the wake exists in the form of short-lived spikes (Fig. 3, blue arrows). The spikes are well resolved inC1_PRIO and C5_PRIO, although they are less regular in the latter.An interesting aspect is that peak fluxes in the spikes are close tothe flux lost in the small scale depletions, indicating a local trans-port process. A more careful analysis is presented in Section 5.1.
4.2. R1.5: August 30, 2007
Flyby R1.5 occurred while Cassini was in the outbound leg of itsorbit. Few aspects of it are discussed in Jones et al. (2008), whileWilson et al. (2010) provide thermal ion moments for the encoun-ter. Here we present LEMMS, RPWS and MAG data in the samemanner as for R1. One interesting element of R1.5 is that it oc-curred downstream of Rhea, with LEMMS and CAPS having similarorientations as in R1. In essence, the primary difference betweenR1 and R1.5 is the flyby distance.
4.2.1. Corotational wakeFig. 4 shows the overview of LEMMS, MAG and RPWS observa-
tions, as in Fig. 2. The corotational wake is again evident as a regionwith a large dropout in electron fluxes. Flux levels in the wake aremore recovered compared to the R1 case, since the distance of thisflyby is greater and some refilling occurred.
The center of the wake has a small antiplanetward offset fromthe expected location. Although this center cannot be exactly de-fined due to the variability of fluxes within it, we can detect a smalldifference in the offset between low energy channels (C0–C3:�0.5RRh) and C4 (�1RRh). This difference could exist because theC4 electrons drift more slowly than the C0–C3 ones and thereforeare exposed to the effect that causes this outward motion for moretime.
Quantification of this time-of-flight effect gives us an outwardradial velocity of about 5 km s�1, consistent in direction and orderof magnitude with the local radial velocity measured by CAPS (Wil-son et al., 2010). Our inferred radial velocity value is a factor of twolower than the one given in Wilson et al. (2010), but this could bedue to a series of factors affecting mainly our technique, such asthe uncertainties in determining the wake center or the assump-tion of constant radial velocity for all the time-of-flight interval.
As in R1, the wake becomes broader with increasing electronenergy. Channels monitoring energies above about 500 keV arefeatureless. The cold electron density from RPWS does not showa wake signature, although densities are much more variable with-in the wake boundaries compared to R1. The enhancement in jBj
o
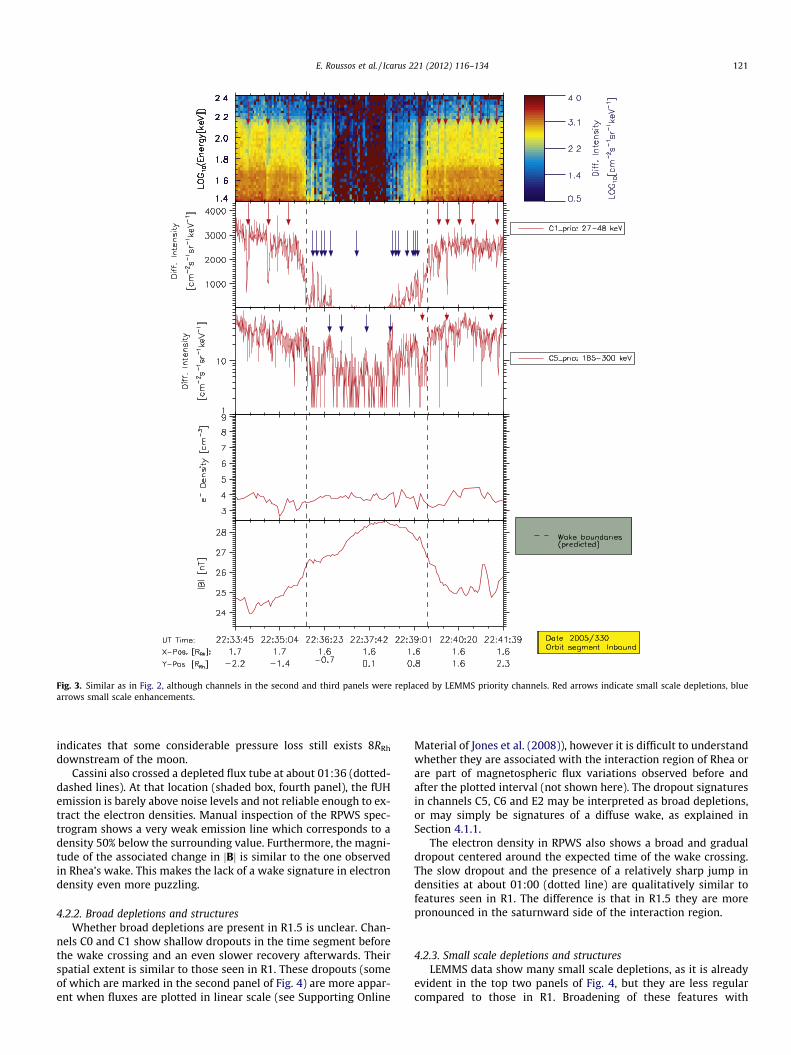
Fig. 3. Similar as in Fig. 2, although channels in the second and third panels were replaced by LEMMS priority channels. Red arrows indicate small scale depletions, bluearrows small scale enhancements.
E. Roussos et al. / Icarus 221 (2012) 116–134 121
indicates that some considerable pressure loss still exists 8RRh
downstream of the moon.Cassini also crossed a depleted flux tube at about 01:36 (dotted-
dashed lines). At that location (shaded box, fourth panel), the fUHemission is barely above noise levels and not reliable enough to ex-tract the electron densities. Manual inspection of the RPWS spec-trogram shows a very weak emission line which corresponds to adensity 50% below the surrounding value. Furthermore, the magni-tude of the associated change in jBj is similar to the one observedin Rhea’s wake. This makes the lack of a wake signature in electrondensity even more puzzling.
4.2.2. Broad depletions and structuresWhether broad depletions are present in R1.5 is unclear. Chan-
nels C0 and C1 show shallow dropouts in the time segment beforethe wake crossing and an even slower recovery afterwards. Theirspatial extent is similar to those seen in R1. These dropouts (someof which are marked in the second panel of Fig. 4) are more appar-ent when fluxes are plotted in linear scale (see Supporting Online
Material of Jones et al. (2008)), however it is difficult to understandwhether they are associated with the interaction region of Rhea orare part of magnetospheric flux variations observed before andafter the plotted interval (not shown here). The dropout signaturesin channels C5, C6 and E2 may be interpreted as broad depletions,or may simply be signatures of a diffuse wake, as explained inSection 4.1.1.
The electron density in RPWS also shows a broad and gradualdropout centered around the expected time of the wake crossing.The slow dropout and the presence of a relatively sharp jump indensities at about 01:00 (dotted line) are qualitatively similar tofeatures seen in R1. The difference is that in R1.5 they are morepronounced in the saturnward side of the interaction region.
4.2.3. Small scale depletions and structuresLEMMS data show many small scale depletions, as it is already
evident in the top two panels of Fig. 4, but they are less regularcompared to those in R1. Broadening of these features with
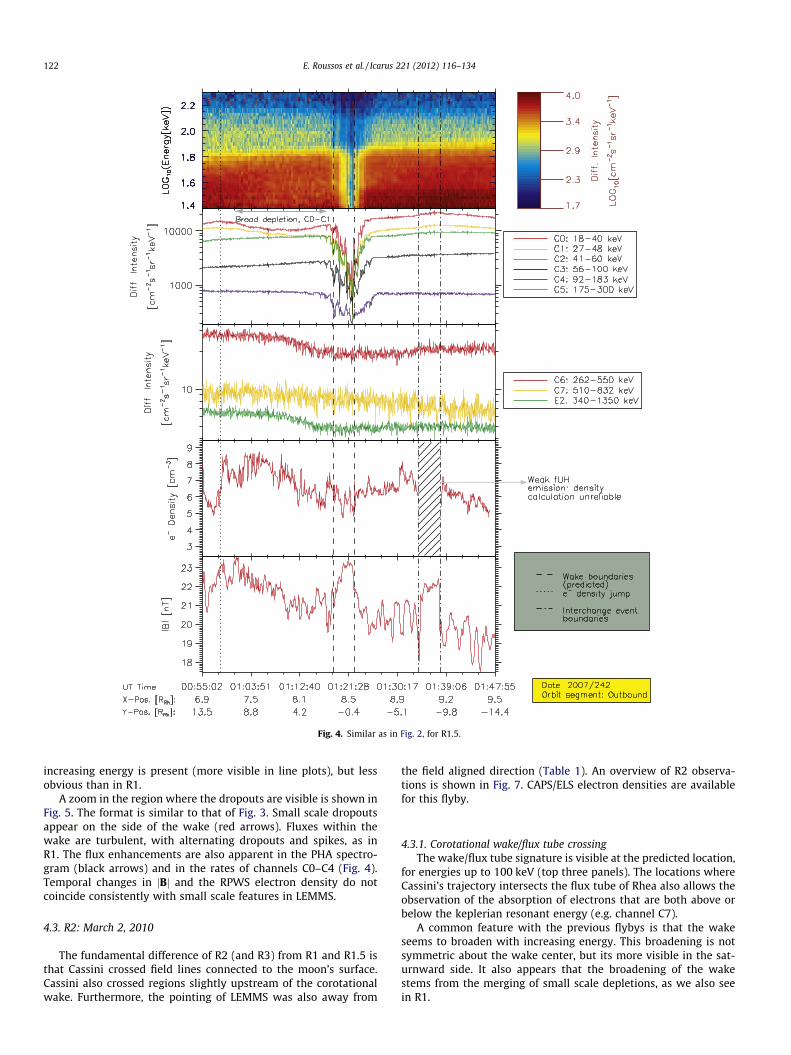
Fig. 4. Similar as in Fig. 2, for R1.5.
122 E. Roussos et al. / Icarus 221 (2012) 116–134
increasing energy is present (more visible in line plots), but lessobvious than in R1.
A zoom in the region where the dropouts are visible is shown inFig. 5. The format is similar to that of Fig. 3. Small scale dropoutsappear on the side of the wake (red arrows). Fluxes within thewake are turbulent, with alternating dropouts and spikes, as inR1. The flux enhancements are also apparent in the PHA spectro-gram (black arrows) and in the rates of channels C0–C4 (Fig. 4).Temporal changes in jBj and the RPWS electron density do notcoincide consistently with small scale features in LEMMS.
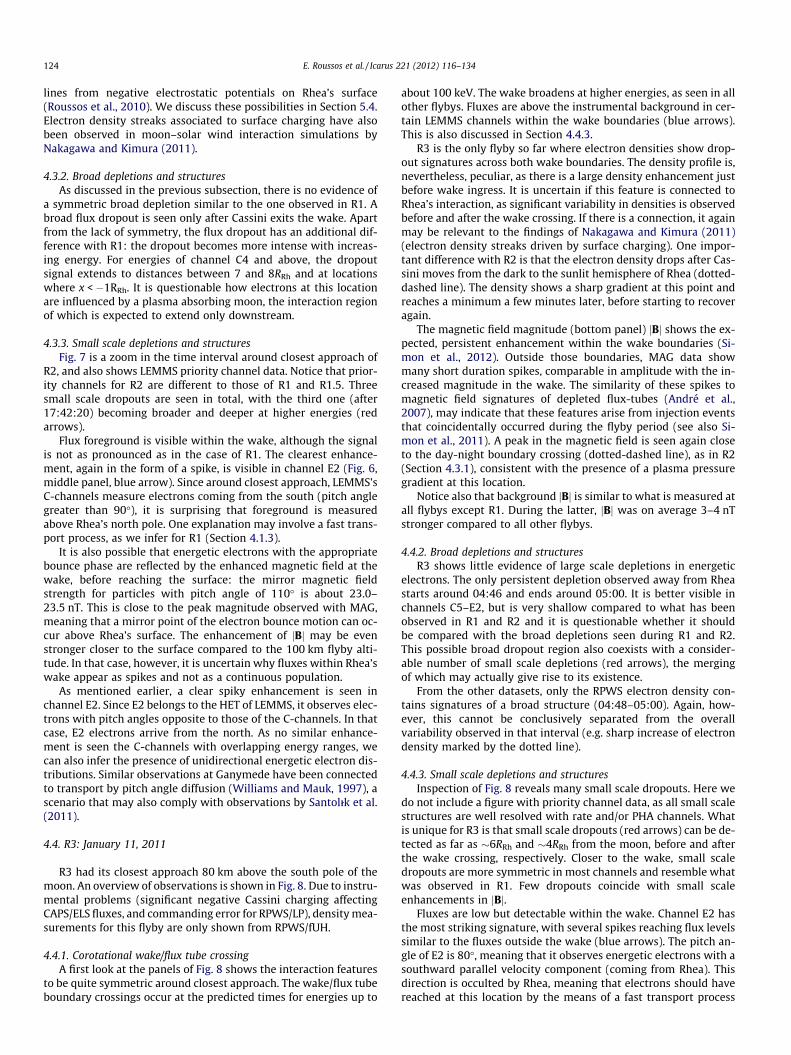
4.3. R2: March 2, 2010
The fundamental difference of R2 (and R3) from R1 and R1.5 isthat Cassini crossed field lines connected to the moon’s surface.Cassini also crossed regions slightly upstream of the corotationalwake. Furthermore, the pointing of LEMMS was also away from
the field aligned direction (Table 1). An overview of R2 observa-tions is shown in Fig. 7. CAPS/ELS electron densities are availablefor this flyby.
4.3.1. Corotational wake/flux tube crossingThe wake/flux tube signature is visible at the predicted location,
for energies up to 100 keV (top three panels). The locations whereCassini’s trajectory intersects the flux tube of Rhea also allows theobservation of the absorption of electrons that are both above orbelow the keplerian resonant energy (e.g. channel C7).
A common feature with the previous flybys is that the wakeseems to broaden with increasing energy. This broadening is notsymmetric about the wake center, but its more visible in the sat-urnward side. It also appears that the broadening of the wakestems from the merging of small scale depletions, as we also seein R1.
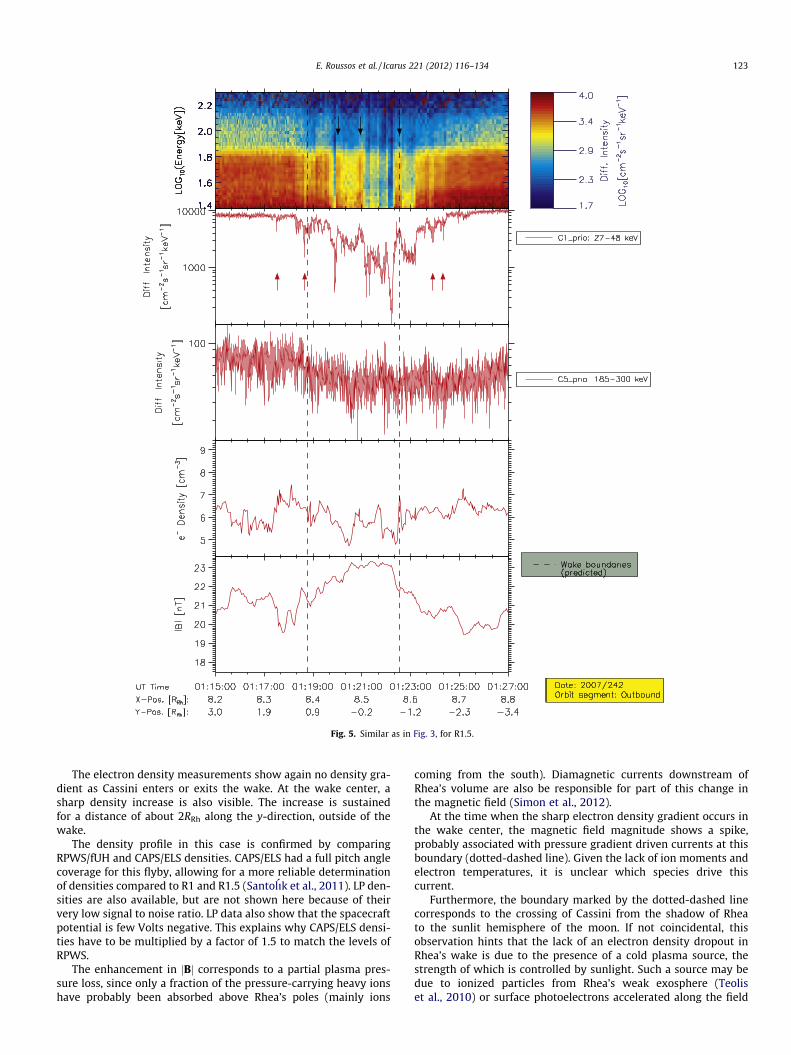
Fig. 5. Similar as in Fig. 3, for R1.5.
E. Roussos et al. / Icarus 221 (2012) 116–134 123
The electron density measurements show again no density gra-dient as Cassini enters or exits the wake. At the wake center, asharp density increase is also visible. The increase is sustainedfor a distance of about 2RRh along the y-direction, outside of thewake.
The density profile in this case is confirmed by comparingRPWS/fUH and CAPS/ELS densities. CAPS/ELS had a full pitch anglecoverage for this flyby, allowing for a more reliable determinationof densities compared to R1 and R1.5 (Santolı́k et al., 2011). LP den-sities are also available, but are not shown here because of theirvery low signal to noise ratio. LP data also show that the spacecraftpotential is few Volts negative. This explains why CAPS/ELS densi-ties have to be multiplied by a factor of 1.5 to match the levels ofRPWS.
The enhancement in jBj corresponds to a partial plasma pres-sure loss, since only a fraction of the pressure-carrying heavy ionshave probably been absorbed above Rhea’s poles (mainly ions
coming from the south). Diamagnetic currents downstream ofRhea’s volume are also be responsible for part of this change inthe magnetic field (Simon et al., 2012).
At the time when the sharp electron density gradient occurs inthe wake center, the magnetic field magnitude shows a spike,probably associated with pressure gradient driven currents at thisboundary (dotted-dashed line). Given the lack of ion moments andelectron temperatures, it is unclear which species drive thiscurrent.
Furthermore, the boundary marked by the dotted-dashed linecorresponds to the crossing of Cassini from the shadow of Rheato the sunlit hemisphere of the moon. If not coincidental, thisobservation hints that the lack of an electron density dropout inRhea’s wake is due to the presence of a cold plasma source, thestrength of which is controlled by sunlight. Such a source may bedue to ionized particles from Rhea’s weak exosphere (Teoliset al., 2010) or surface photoelectrons accelerated along the field
124 E. Roussos et al. / Icarus 221 (2012) 116–134
lines from negative electrostatic potentials on Rhea’s surface(Roussos et al., 2010). We discuss these possibilities in Section 5.4.Electron density streaks associated to surface charging have alsobeen observed in moon–solar wind interaction simulations byNakagawa and Kimura (2011).
4.3.2. Broad depletions and structuresAs discussed in the previous subsection, there is no evidence of
a symmetric broad depletion similar to the one observed in R1. Abroad flux dropout is seen only after Cassini exits the wake. Apartfrom the lack of symmetry, the flux dropout has an additional dif-ference with R1: the dropout becomes more intense with increas-ing energy. For energies of channel C4 and above, the dropoutsignal extends to distances between 7 and 8RRh and at locationswhere x < �1RRh. It is questionable how electrons at this locationare influenced by a plasma absorbing moon, the interaction regionof which is expected to extend only downstream.
4.3.3. Small scale depletions and structuresFig. 7 is a zoom in the time interval around closest approach of
R2, and also shows LEMMS priority channel data. Notice that prior-ity channels for R2 are different to those of R1 and R1.5. Threesmall scale dropouts are seen in total, with the third one (after17:42:20) becoming broader and deeper at higher energies (redarrows).
Flux foreground is visible within the wake, although the signalis not as pronounced as in the case of R1. The clearest enhance-ment, again in the form of a spike, is visible in channel E2 (Fig. 6,middle panel, blue arrow). Since around closest approach, LEMMS’sC-channels measure electrons coming from the south (pitch anglegreater than 90�), it is surprising that foreground is measuredabove Rhea’s north pole. One explanation may involve a fast trans-port process, as we infer for R1 (Section 4.1.3).
It is also possible that energetic electrons with the appropriatebounce phase are reflected by the enhanced magnetic field at thewake, before reaching the surface: the mirror magnetic fieldstrength for particles with pitch angle of 110� is about 23.0–23.5 nT. This is close to the peak magnitude observed with MAG,meaning that a mirror point of the electron bounce motion can oc-cur above Rhea’s surface. The enhancement of jBj may be evenstronger closer to the surface compared to the 100 km flyby alti-tude. In that case, however, it is uncertain why fluxes within Rhea’swake appear as spikes and not as a continuous population.
As mentioned earlier, a clear spiky enhancement is seen inchannel E2. Since E2 belongs to the HET of LEMMS, it observes elec-trons with pitch angles opposite to those of the C-channels. In thatcase, E2 electrons arrive from the north. As no similar enhance-ment is seen the C-channels with overlapping energy ranges, wecan also infer the presence of unidirectional energetic electron dis-tributions. Similar observations at Ganymede have been connectedto transport by pitch angle diffusion (Williams and Mauk, 1997), ascenario that may also comply with observations by Santolı́k et al.(2011).
4.4. R3: January 11, 2011
R3 had its closest approach 80 km above the south pole of themoon. An overview of observations is shown in Fig. 8. Due to instru-mental problems (significant negative Cassini charging affectingCAPS/ELS fluxes, and commanding error for RPWS/LP), density mea-surements for this flyby are only shown from RPWS/fUH.
4.4.1. Corotational wake/flux tube crossingA first look at the panels of Fig. 8 shows the interaction features
to be quite symmetric around closest approach. The wake/flux tubeboundary crossings occur at the predicted times for energies up to
about 100 keV. The wake broadens at higher energies, as seen in allother flybys. Fluxes are above the instrumental background in cer-tain LEMMS channels within the wake boundaries (blue arrows).This is also discussed in Section 4.4.3.
R3 is the only flyby so far where electron densities show drop-out signatures across both wake boundaries. The density profile is,nevertheless, peculiar, as there is a large density enhancement justbefore wake ingress. It is uncertain if this feature is connected toRhea’s interaction, as significant variability in densities is observedbefore and after the wake crossing. If there is a connection, it againmay be relevant to the findings of Nakagawa and Kimura (2011)(electron density streaks driven by surface charging). One impor-tant difference with R2 is that the electron density drops after Cas-sini moves from the dark to the sunlit hemisphere of Rhea (dotted-dashed line). The density shows a sharp gradient at this point andreaches a minimum a few minutes later, before starting to recoveragain.
The magnetic field magnitude (bottom panel) jBj shows the ex-pected, persistent enhancement within the wake boundaries (Si-mon et al., 2012). Outside those boundaries, MAG data showmany short duration spikes, comparable in amplitude with the in-creased magnitude in the wake. The similarity of these spikes tomagnetic field signatures of depleted flux-tubes (André et al.,2007), may indicate that these features arise from injection eventsthat coincidentally occurred during the flyby period (see also Si-mon et al., 2011). A peak in the magnetic field is seen again closeto the day-night boundary crossing (dotted-dashed line), as in R2(Section 4.3.1), consistent with the presence of a plasma pressuregradient at this location.
Notice also that background jBj is similar to what is measured atall flybys except R1. During the latter, jBj was on average 3–4 nTstronger compared to all other flybys.
4.4.2. Broad depletions and structuresR3 shows little evidence of large scale depletions in energetic
electrons. The only persistent depletion observed away from Rheastarts around 04:46 and ends around 05:00. It is better visible inchannels C5–E2, but is very shallow compared to what has beenobserved in R1 and R2 and it is questionable whether it shouldbe compared with the broad depletions seen during R1 and R2.This possible broad dropout region also coexists with a consider-able number of small scale depletions (red arrows), the mergingof which may actually give rise to its existence.
From the other datasets, only the RPWS electron density con-tains signatures of a broad structure (04:48–05:00). Again, how-ever, this cannot be conclusively separated from the overallvariability observed in that interval (e.g. sharp increase of electrondensity marked by the dotted line).
4.4.3. Small scale depletions and structuresInspection of Fig. 8 reveals many small scale dropouts. Here we
do not include a figure with priority channel data, as all small scalestructures are well resolved with rate and/or PHA channels. Whatis unique for R3 is that small scale dropouts (red arrows) can be de-tected as far as �6RRh and �4RRh from the moon, before and afterthe wake crossing, respectively. Closer to the wake, small scaledropouts are more symmetric in most channels and resemble whatwas observed in R1. Few dropouts coincide with small scaleenhancements in jBj.
Fluxes are low but detectable within the wake. Channel E2 hasthe most striking signature, with several spikes reaching flux levelssimilar to the fluxes outside the wake (blue arrows). The pitch an-gle of E2 is 80�, meaning that it observes energetic electrons with asouthward parallel velocity component (coming from Rhea). Thisdirection is occulted by Rhea, meaning that electrons should havereached at this location by the means of a fast transport process
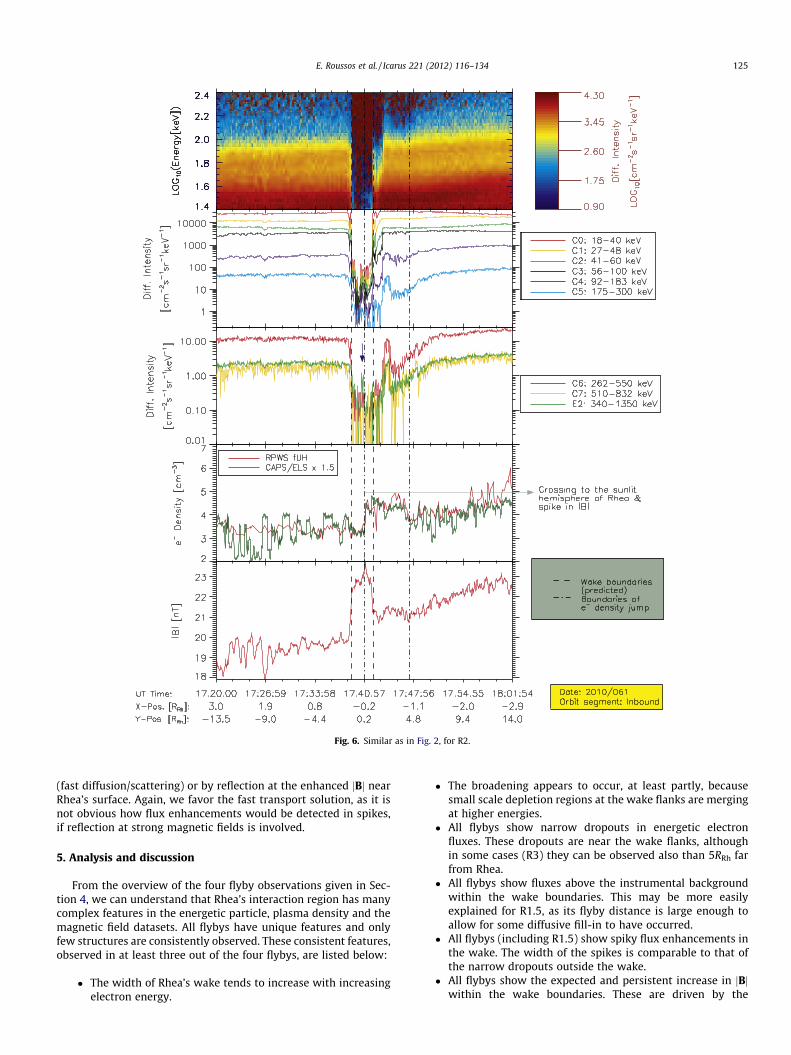
Fig. 6. Similar as in Fig. 2, for R2.
E. Roussos et al. / Icarus 221 (2012) 116–134 125
(fast diffusion/scattering) or by reflection at the enhanced jBj nearRhea’s surface. Again, we favor the fast transport solution, as it isnot obvious how flux enhancements would be detected in spikes,if reflection at strong magnetic fields is involved.
5. Analysis and discussion
From the overview of the four flyby observations given in Sec-tion 4, we can understand that Rhea’s interaction region has manycomplex features in the energetic particle, plasma density and themagnetic field datasets. All flybys have unique features and onlyfew structures are consistently observed. These consistent features,observed in at least three out of the four flybys, are listed below:
� The width of Rhea’s wake tends to increase with increasingelectron energy.
� The broadening appears to occur, at least partly, becausesmall scale depletion regions at the wake flanks are mergingat higher energies.
� All flybys show narrow dropouts in energetic electronfluxes. These dropouts are near the wake flanks, althoughin some cases (R3) they can be observed also than 5RRh farfrom Rhea.
� All flybys show fluxes above the instrumental backgroundwithin the wake boundaries. This may be more easilyexplained for R1.5, as its flyby distance is large enough toallow for some diffusive fill-in to have occurred.
� All flybys (including R1.5) show spiky flux enhancements inthe wake. The width of the spikes is comparable to that ofthe narrow dropouts outside the wake.
� All flybys show the expected and persistent increase in jBjwithin the wake boundaries. These are driven by the
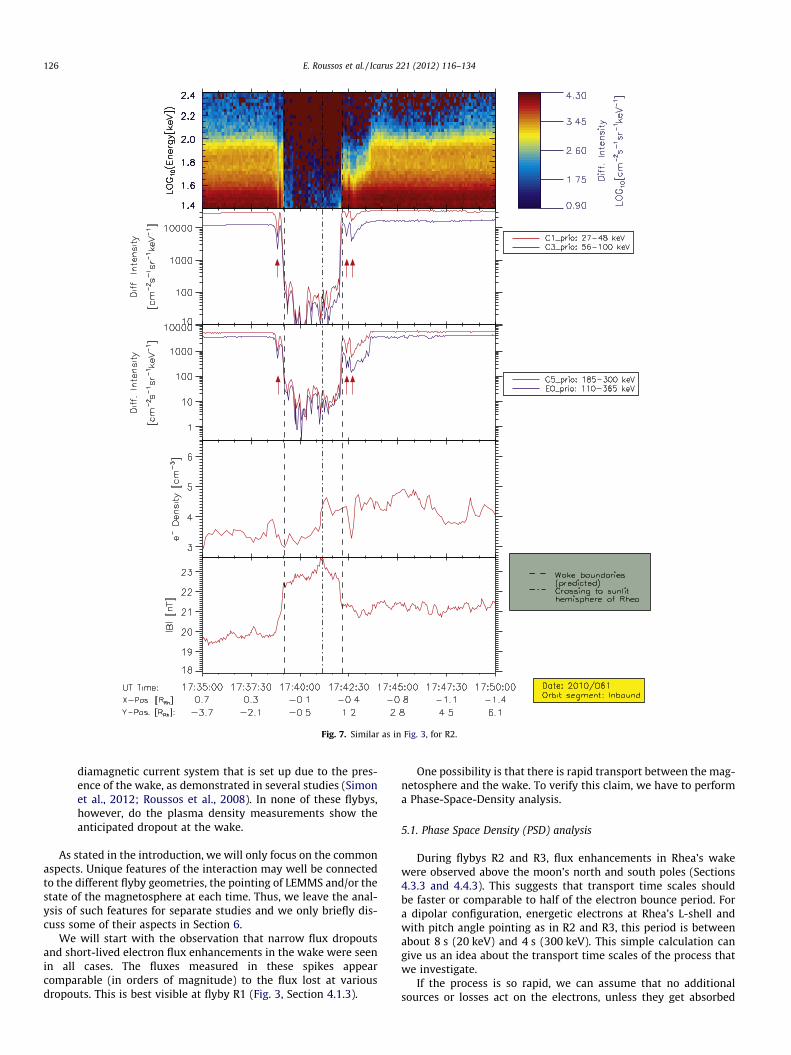
Fig. 7. Similar as in Fig. 3, for R2.
126 E. Roussos et al. / Icarus 221 (2012) 116–134
diamagnetic current system that is set up due to the pres-ence of the wake, as demonstrated in several studies (Simonet al., 2012; Roussos et al., 2008). In none of these flybys,however, do the plasma density measurements show theanticipated dropout at the wake.
As stated in the introduction, we will only focus on the commonaspects. Unique features of the interaction may well be connectedto the different flyby geometries, the pointing of LEMMS and/or thestate of the magnetosphere at each time. Thus, we leave the anal-ysis of such features for separate studies and we only briefly dis-cuss some of their aspects in Section 6.
We will start with the observation that narrow flux dropoutsand short-lived electron flux enhancements in the wake were seenin all cases. The fluxes measured in these spikes appearcomparable (in orders of magnitude) to the flux lost at variousdropouts. This is best visible at flyby R1 (Fig. 3, Section 4.1.3).
One possibility is that there is rapid transport between the mag-netosphere and the wake. To verify this claim, we have to performa Phase-Space-Density analysis.
5.1. Phase Space Density (PSD) analysis
During flybys R2 and R3, flux enhancements in Rhea’s wakewere observed above the moon’s north and south poles (Sections4.3.3 and 4.4.3). This suggests that transport time scales shouldbe faster or comparable to half of the electron bounce period. Fora dipolar configuration, energetic electrons at Rhea’s L-shell andwith pitch angle pointing as in R2 and R3, this period is betweenabout 8 s (20 keV) and 4 s (300 keV). This simple calculation cangive us an idea about the transport time scales of the process thatwe investigate.
If the process is so rapid, we can assume that no additionalsources or losses act on the electrons, unless they get absorbed
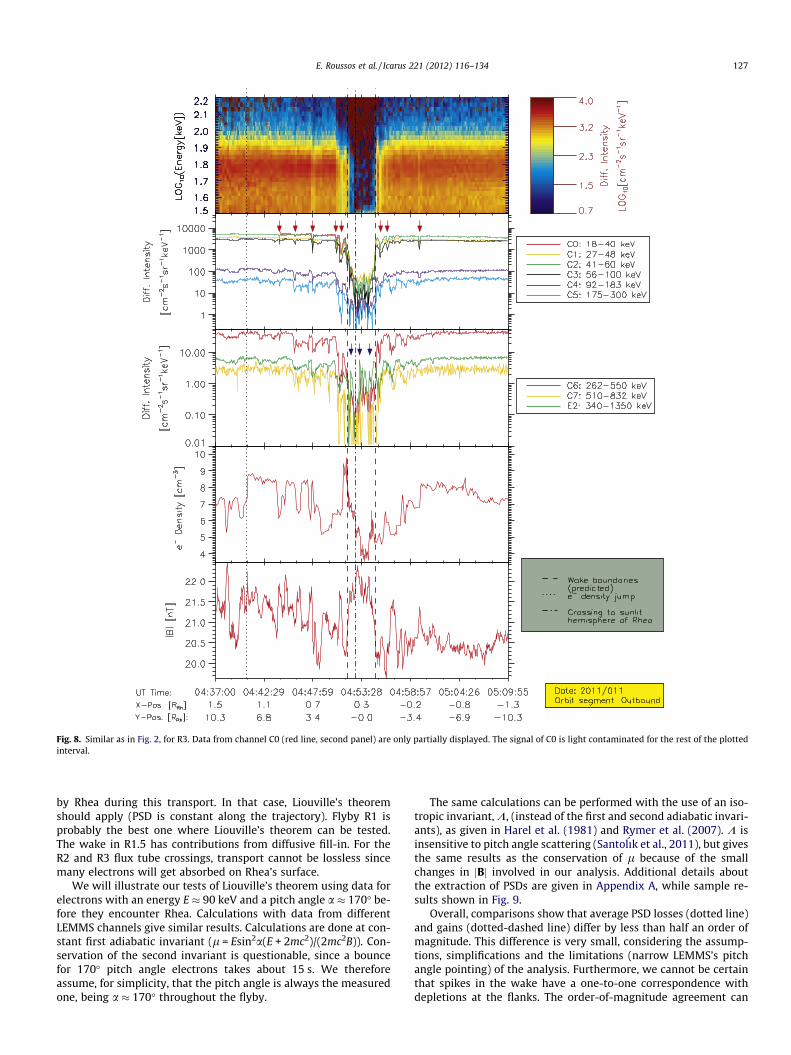
Fig. 8. Similar as in Fig. 2, for R3. Data from channel C0 (red line, second panel) are only partially displayed. The signal of C0 is light contaminated for the rest of the plottedinterval.
E. Roussos et al. / Icarus 221 (2012) 116–134 127
by Rhea during this transport. In that case, Liouville’s theoremshould apply (PSD is constant along the trajectory). Flyby R1 isprobably the best one where Liouville’s theorem can be tested.The wake in R1.5 has contributions from diffusive fill-in. For theR2 and R3 flux tube crossings, transport cannot be lossless sincemany electrons will get absorbed on Rhea’s surface.
We will illustrate our tests of Liouville’s theorem using data forelectrons with an energy E � 90 keV and a pitch angle a � 170� be-fore they encounter Rhea. Calculations with data from differentLEMMS channels give similar results. Calculations are done at con-stant first adiabatic invariant (l = Esin2a(E + 2mc2)/(2mc2B)). Con-servation of the second invariant is questionable, since a bouncefor 170� pitch angle electrons takes about 15 s. We thereforeassume, for simplicity, that the pitch angle is always the measuredone, being a � 170� throughout the flyby.
The same calculations can be performed with the use of an iso-tropic invariant, K, (instead of the first and second adiabatic invari-ants), as given in Harel et al. (1981) and Rymer et al. (2007). K isinsensitive to pitch angle scattering (Santolı́k et al., 2011), but givesthe same results as the conservation of l because of the smallchanges in jBj involved in our analysis. Additional details aboutthe extraction of PSDs are given in Appendix A, while sample re-sults shown in Fig. 9.
Overall, comparisons show that average PSD losses (dotted line)and gains (dotted-dashed line) differ by less than half an order ofmagnitude. This difference is very small, considering the assump-tions, simplifications and the limitations (narrow LEMMS’s pitchangle pointing) of the analysis. Furthermore, we cannot be certainthat spikes in the wake have a one-to-one correspondence withdepletions at the flanks. The order-of-magnitude agreement can
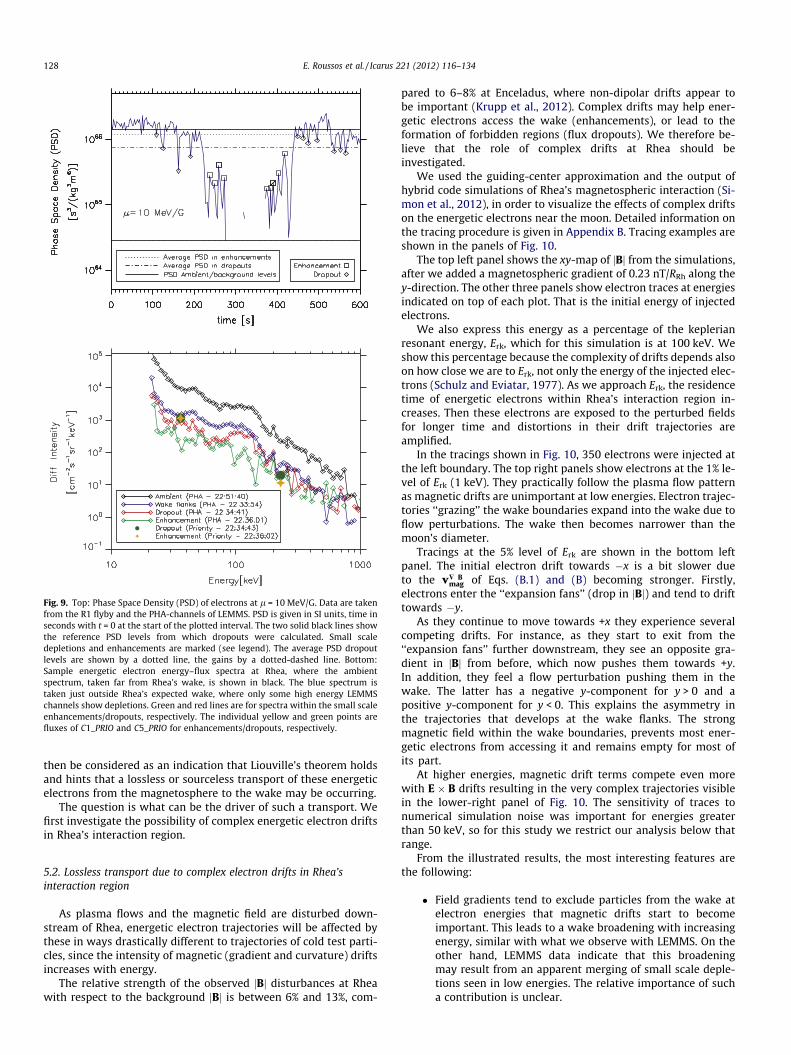
Fig. 9. Top: Phase Space Density (PSD) of electrons at l = 10 MeV/G. Data are takenfrom the R1 flyby and the PHA-channels of LEMMS. PSD is given in SI units, time inseconds with t = 0 at the start of the plotted interval. The two solid black lines showthe reference PSD levels from which dropouts were calculated. Small scaledepletions and enhancements are marked (see legend). The average PSD dropoutlevels are shown by a dotted line, the gains by a dotted-dashed line. Bottom:Sample energetic electron energy–flux spectra at Rhea, where the ambientspectrum, taken far from Rhea’s wake, is shown in black. The blue spectrum istaken just outside Rhea’s expected wake, where only some high energy LEMMSchannels show depletions. Green and red lines are for spectra within the small scaleenhancements/dropouts, respectively. The individual yellow and green points arefluxes of C1_PRIO and C5_PRIO for enhancements/dropouts, respectively.
128 E. Roussos et al. / Icarus 221 (2012) 116–134
then be considered as an indication that Liouville’s theorem holdsand hints that a lossless or sourceless transport of these energeticelectrons from the magnetosphere to the wake may be occurring.
The question is what can be the driver of such a transport. Wefirst investigate the possibility of complex energetic electron driftsin Rhea’s interaction region.
5.2. Lossless transport due to complex electron drifts in Rhea’sinteraction region
As plasma flows and the magnetic field are disturbed down-stream of Rhea, energetic electron trajectories will be affected bythese in ways drastically different to trajectories of cold test parti-cles, since the intensity of magnetic (gradient and curvature) driftsincreases with energy.
The relative strength of the observed jBj disturbances at Rheawith respect to the background jBj is between 6% and 13%, com-
pared to 6–8% at Enceladus, where non-dipolar drifts appear tobe important (Krupp et al., 2012). Complex drifts may help ener-getic electrons access the wake (enhancements), or lead to theformation of forbidden regions (flux dropouts). We therefore be-lieve that the role of complex drifts at Rhea should beinvestigated.
We used the guiding-center approximation and the output ofhybrid code simulations of Rhea’s magnetospheric interaction (Si-mon et al., 2012), in order to visualize the effects of complex driftson the energetic electrons near the moon. Detailed information onthe tracing procedure is given in Appendix B. Tracing examples areshown in the panels of Fig. 10.
The top left panel shows the xy-map of jBj from the simulations,after we added a magnetospheric gradient of 0.23 nT/RRh along they-direction. The other three panels show electron traces at energiesindicated on top of each plot. That is the initial energy of injectedelectrons.
We also express this energy as a percentage of the keplerianresonant energy, Erk, which for this simulation is at 100 keV. Weshow this percentage because the complexity of drifts depends alsoon how close we are to Erk, not only the energy of the injected elec-trons (Schulz and Eviatar, 1977). As we approach Erk, the residencetime of energetic electrons within Rhea’s interaction region in-creases. Then these electrons are exposed to the perturbed fieldsfor longer time and distortions in their drift trajectories areamplified.
In the tracings shown in Fig. 10, 350 electrons were injected atthe left boundary. The top right panels show electrons at the 1% le-vel of Erk (1 keV). They practically follow the plasma flow patternas magnetic drifts are unimportant at low energies. Electron trajec-tories ‘‘grazing’’ the wake boundaries expand into the wake due toflow perturbations. The wake then becomes narrower than themoon’s diameter.
Tracings at the 5% level of Erk are shown in the bottom leftpanel. The initial electron drift towards �x is a bit slower dueto the v$ B
mag of Eqs. (B.1) and (B) becoming stronger. Firstly,electrons enter the ‘‘expansion fans’’ (drop in jBj) and tend to drifttowards �y.
As they continue to move towards +x they experience severalcompeting drifts. For instance, as they start to exit from the‘‘expansion fans’’ further downstream, they see an opposite gra-dient in jBj from before, which now pushes them towards +y.In addition, they feel a flow perturbation pushing them in thewake. The latter has a negative y-component for y > 0 and apositive y-component for y < 0. This explains the asymmetry inthe trajectories that develops at the wake flanks. The strongmagnetic field within the wake boundaries, prevents most ener-getic electrons from accessing it and remains empty for most ofits part.
At higher energies, magnetic drift terms compete even morewith E � B drifts resulting in the very complex trajectories visiblein the lower-right panel of Fig. 10. The sensitivity of traces tonumerical simulation noise was important for energies greaterthan 50 keV, so for this study we restrict our analysis below thatrange.
From the illustrated results, the most interesting features arethe following:
� Field gradients tend to exclude particles from the wake atelectron energies that magnetic drifts start to becomeimportant. This leads to a wake broadening with increasingenergy, similar with what we observe with LEMMS. On theother hand, LEMMS data indicate that this broadeningmay result from an apparent merging of small scale deple-tions seen in low energies. The relative importance of sucha contribution is unclear.
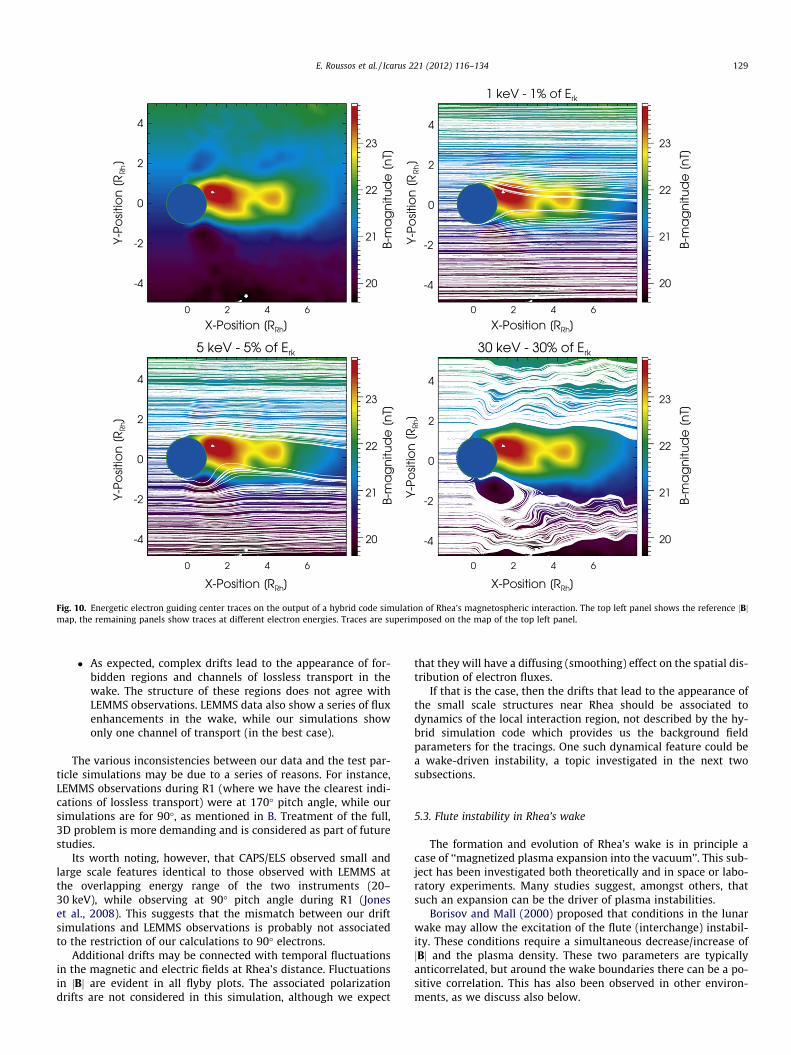
Fig. 10. Energetic electron guiding center traces on the output of a hybrid code simulation of Rhea’s magnetospheric interaction. The top left panel shows the reference jBjmap, the remaining panels show traces at different electron energies. Traces are superimposed on the map of the top left panel.
E. Roussos et al. / Icarus 221 (2012) 116–134 129
� As expected, complex drifts lead to the appearance of for-bidden regions and channels of lossless transport in thewake. The structure of these regions does not agree withLEMMS observations. LEMMS data also show a series of fluxenhancements in the wake, while our simulations showonly one channel of transport (in the best case).
The various inconsistencies between our data and the test par-ticle simulations may be due to a series of reasons. For instance,LEMMS observations during R1 (where we have the clearest indi-cations of lossless transport) were at 170� pitch angle, while oursimulations are for 90�, as mentioned in B. Treatment of the full,3D problem is more demanding and is considered as part of futurestudies.
Its worth noting, however, that CAPS/ELS observed small andlarge scale features identical to those observed with LEMMS atthe overlapping energy range of the two instruments (20–30 keV), while observing at 90� pitch angle during R1 (Joneset al., 2008). This suggests that the mismatch between our driftsimulations and LEMMS observations is probably not associatedto the restriction of our calculations to 90� electrons.
Additional drifts may be connected with temporal fluctuationsin the magnetic and electric fields at Rhea’s distance. Fluctuationsin jBj are evident in all flyby plots. The associated polarizationdrifts are not considered in this simulation, although we expect
that they will have a diffusing (smoothing) effect on the spatial dis-tribution of electron fluxes.
If that is the case, then the drifts that lead to the appearance ofthe small scale structures near Rhea should be associated todynamics of the local interaction region, not described by the hy-brid simulation code which provides us the background fieldparameters for the tracings. One such dynamical feature could bea wake-driven instability, a topic investigated in the next twosubsections.
5.3. Flute instability in Rhea’s wake
The formation and evolution of Rhea’s wake is in principle acase of ‘‘magnetized plasma expansion into the vacuum’’. This sub-ject has been investigated both theoretically and in space or labo-ratory experiments. Many studies suggest, amongst others, thatsuch an expansion can be the driver of plasma instabilities.
Borisov and Mall (2000) proposed that conditions in the lunarwake may allow the excitation of the flute (interchange) instabil-ity. These conditions require a simultaneous decrease/increase ofjBj and the plasma density. These two parameters are typicallyanticorrelated, but around the wake boundaries there can be a po-sitive correlation. This has also been observed in other environ-ments, as we discuss also below.
130 E. Roussos et al. / Icarus 221 (2012) 116–134
The flute instability is a Rayleigh–Taylor type of instability,where transport occurs quickly and in the form of narrow channelswith typical scales lower than the characteristic ion gyroradius, qi.At Rhea, we indeed observe that small scale structures have spatialscales much smaller than the ion gyroradius (by a factor of 20 atleast). The instability’s growth rate is also proportional to theintensity of the magnetic field and the plasma density gradients.It is also expected to develop more quickly along the field-aligneddirection. Borisov and Mall (2000) calculated a linear growth ratebetween 0.1 and 0.3 s�1 for Earth’s Moon wake.
Apart from moon wakes, this instability has also been observedin expanding plasma clouds, such as the magnetotail barium re-leases from the satellite AMPTE (Active Magnetospheric ParticleTracers Explorers) (Bernhardt et al., 1987). This expansion didnot occur on a smooth spherical shell. Many irregularities were ob-served on the shell’s surface. Wavelengths were smaller than40 km, about an order of magnitude smaller than the iongyroradius.
Among the proposed mechanisms considered in order to explainthe AMPTE results was the lower-hybrid drift instability (Bernhardtet al., 1987). Alternatively, Hassam and Huba (1987) proposed anew form of flute instability in order to explain the data. The growthrate of this instability increases rapidly if the ratio between the iongyroradius and the spatial scale of number density depletion ismuch greater than unity. This is also sometimes called ‘‘Large Lar-mor Radius Interchange Instability’’ (LLRII) (Ripin et al., 1987).
Using equations from Borisov and Mall (2000) and output fromthe hybrid simulations, we estimate that the flute instability has alinear growth rate of about 0.1–0.2 s�1 just behind Rhea, giving agrowth time of 5–10 s, comparable to the time scales inferred par-ticle transport in Rhea’s wake through the observed, narrow chan-nels (Section 5.1). The rate reduces by an order of magnitude 10RRh
downstream, and disappears at larger distances, since magneticfield and pressure gradients diminish.
If gyroradius effects are important (Hassam and Huba, 1987),the growth rate close to the moon may be even stronger. Smallscale depletions or enhancements seen at Rhea, may then repre-sent signatures of such a type of an interchange process. We alsonote that during R1, when Cassini was observing close to the fieldaligned direction, the number of the observed small scale struc-tures was the greatest from all four flybys.
Gyroradius effects may also explain the absence of such signa-tures at Tethys (Jones et al., 2008). Since at Tethys the magneticfield is stronger, the fraction between the scale of the ion gyroradi-us and the density gradients is smaller than it is at Rhea. The valuemaybe small enough to prevent the instability from growing, be-fore the wake refills.
Furthermore, magnetic field gradients are weaker at Tethys. Fora full plasma absorption it can be easily shown that the ratio of thejBj in the wake of Tethys with the value upstream is proportional toðffiffiffiffiffiffiffiffiffiffiffiffi1þ b
pÞ, where b is the plasma beta (Simon et al., 2012). The value
of b at Tethys (�0.01) is more than an order of magnitude lowerthan at Rhea (>0.5), meaning that the corresponding gradients injBj would be almost negligible, as also observed (Khurana et al.,2008), preventing a flute instability from developing.
From the above it is clear that critical for the formation of thisinstability are the strength of gradients in the various plasmaand field parameters in Rhea’s wake. In that context, observationsof cold plasma in Rhea’s wake have several puzzling elements thatneed to be carefully considered.
5.4. Cold plasma in Rhea’s wake and implications for the driver of theinstability
Data from most Rhea flybys show that the electron numberdensity profiles extracted from RPWS fUH observations do not
show an absorption signature during the wake or flux tube cross-ings. In the same time, magnetometer signatures are consistentwith the expected plasma pressure loss. As the observation in elec-trons is unexpected, we included, wherever that was possible, plas-ma density measurements from different Cassini sensors, namelythe Langmuir Probe (ion density during R1) and the CAPS/ELS(electron density during R2), in an attempt to verify themeasurements.
In the case of R1, LP measurements show that the ion density inthe wake experiences a decrease of at least 50% (fourth panel fromtop, Fig. 2). If that is valid, a significant electron–ion density imbal-ance is implied for Rhea’s wake. Numbers for this imbalance (�1–4 cm�3), would, however, be extreme: simulations hint that chargesuperabundances in moon wakes should be present mostly aroundthe wake flanks and their amplitude should be a negligible fractionof the upstream plasma density (Nakagawa and Kimura, 2011; Far-rell et al., 2008).
In addition, a large charge imbalance would lead to a very in-tense electrostatic potential in Rhea’s wake. Data from the lowestenergy proton channels of LEMMS (A0, A1 – 25–56 keV range)show flux enhancements in the vicinity of Rhea’s wake (Fig. 11)that could be consistent with large negative electrostatic potentials(tens of keV) that accelerate ions along the magnetic field direc-tion. Using a simple calculation scheme from Nishino et al.(2010), we calculated that the excess electron density is in the or-der of 10�4 cm�3. That is four orders of magnitude lower than thevalue inferred from RPWS and MAG data. The signal of higher en-ergy ion channels of LEMMS is featureless, indicating that this va-lue is an upper limit and the assumption for a macroscopic quasi-neutrality in the wake is reasonable.
The latter conclusion implies that one of the two RPWS plasmadensity measurements for the R1 wake crossing is more reliable.We believe that this is the fUH electron density dataset. Ion densityextraction from the LP has several systematic errors, large uncer-tainties (more than 50% relative error for the low plasma densitiesobserved at L-shells greater than 7) and its estimation is also basedon a series of assumptions (Jacobsen et al., 2009). Furthermore, theagreement between the fUH electron densities and the density pro-file of CAPS/ELS for flyby R2 (Fig. 6) adds further support to thevalidity of that specific density profile.
We therefore find that the cold plasma density in the wake isequal or comparable to the ambient magnetospheric plasma den-sity. This sets constraints on the exact nature of the instability thatis inferred from energetic electron observations (Section 5.3). Theinstability that drives the interchange motions cannot be con-trolled by density gradients. The flute instability, however, can alsobe driven by plasma pressure (or magnetic field) gradients (Boydand Sanderson, 2003). Magnetic field gradients were also proposedas one of the possibilities to explain the flute modes in the expand-ing AMPTE cloud (Bernhardt et al., 1987). MAG data from all flybysindicate that such gradients are indeed present and it is thereforereasonable to explore this concept in future studies.
Since density levels in the wake are comparable to the ambientones, lossless transport may alternatively occur through the a Kel-vin–Helmholtz (KH) instability, if velocity shear between the twodomains is significant. We still, however, do not believe that thesmall scale features in energetic electrons are signatures of sucha process, even if the KH instability occurs. The presence of thosesignatures almost upstream of Rhea and up to 6RRh from the moon(flybys R2 and R3) would imply the presence of KH vortices in arather unexpected location and with an unrealistically large scalecompared to the width of a region where velocity shear may poten-tially develop. Plasma velocity vectors available for R1 and R1.5also show nothing relevant (Wilson et al., 2010).
It is also important to understand how conditions in the wakeallow for a plasma pressure gradient, while the plasma density is
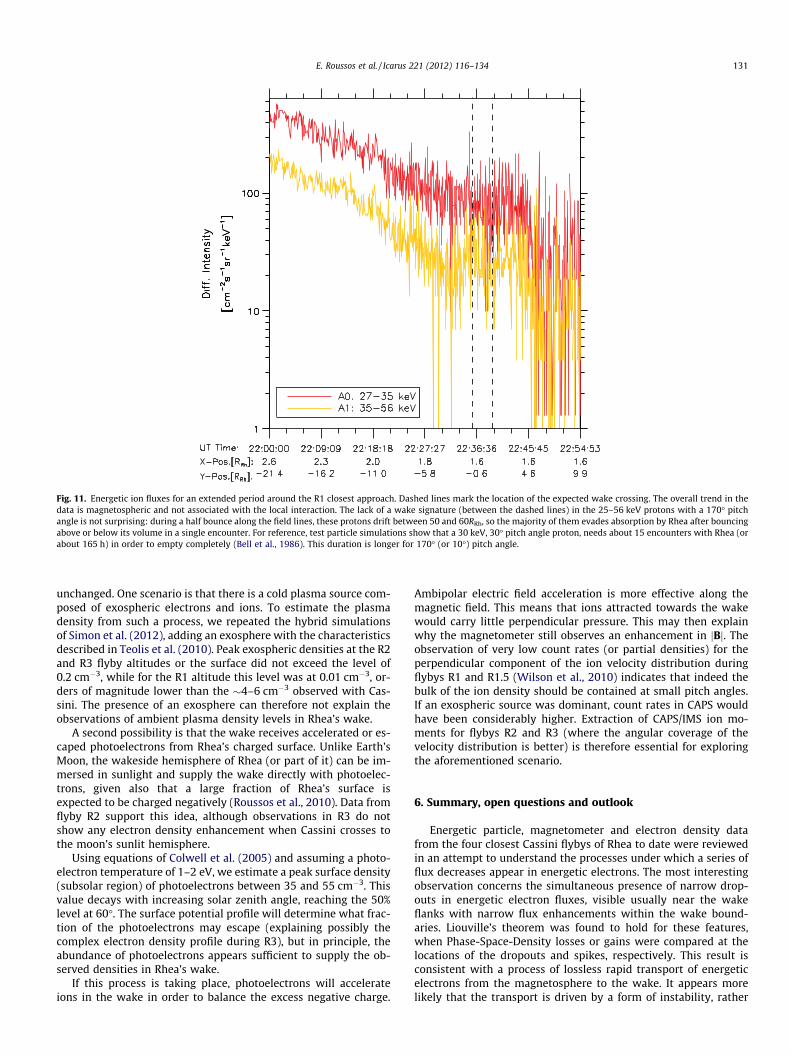
Fig. 11. Energetic ion fluxes for an extended period around the R1 closest approach. Dashed lines mark the location of the expected wake crossing. The overall trend in thedata is magnetospheric and not associated with the local interaction. The lack of a wake signature (between the dashed lines) in the 25–56 keV protons with a 170� pitchangle is not surprising: during a half bounce along the field lines, these protons drift between 50 and 60RRh, so the majority of them evades absorption by Rhea after bouncingabove or below its volume in a single encounter. For reference, test particle simulations show that a 30 keV, 30� pitch angle proton, needs about 15 encounters with Rhea (orabout 165 h) in order to empty completely (Bell et al., 1986). This duration is longer for 170� (or 10�) pitch angle.
E. Roussos et al. / Icarus 221 (2012) 116–134 131
unchanged. One scenario is that there is a cold plasma source com-posed of exospheric electrons and ions. To estimate the plasmadensity from such a process, we repeated the hybrid simulationsof Simon et al. (2012), adding an exosphere with the characteristicsdescribed in Teolis et al. (2010). Peak exospheric densities at the R2and R3 flyby altitudes or the surface did not exceed the level of0.2 cm�3, while for the R1 altitude this level was at 0.01 cm�3, or-ders of magnitude lower than the �4–6 cm�3 observed with Cas-sini. The presence of an exosphere can therefore not explain theobservations of ambient plasma density levels in Rhea’s wake.
A second possibility is that the wake receives accelerated or es-caped photoelectrons from Rhea’s charged surface. Unlike Earth’sMoon, the wakeside hemisphere of Rhea (or part of it) can be im-mersed in sunlight and supply the wake directly with photoelec-trons, given also that a large fraction of Rhea’s surface isexpected to be charged negatively (Roussos et al., 2010). Data fromflyby R2 support this idea, although observations in R3 do notshow any electron density enhancement when Cassini crosses tothe moon’s sunlit hemisphere.
Using equations of Colwell et al. (2005) and assuming a photo-electron temperature of 1–2 eV, we estimate a peak surface density(subsolar region) of photoelectrons between 35 and 55 cm�3. Thisvalue decays with increasing solar zenith angle, reaching the 50%level at 60�. The surface potential profile will determine what frac-tion of the photoelectrons may escape (explaining possibly thecomplex electron density profile during R3), but in principle, theabundance of photoelectrons appears sufficient to supply the ob-served densities in Rhea’s wake.
If this process is taking place, photoelectrons will accelerateions in the wake in order to balance the excess negative charge.
Ambipolar electric field acceleration is more effective along themagnetic field. This means that ions attracted towards the wakewould carry little perpendicular pressure. This may then explainwhy the magnetometer still observes an enhancement in jBj. Theobservation of very low count rates (or partial densities) for theperpendicular component of the ion velocity distribution duringflybys R1 and R1.5 (Wilson et al., 2010) indicates that indeed thebulk of the ion density should be contained at small pitch angles.If an exospheric source was dominant, count rates in CAPS wouldhave been considerably higher. Extraction of CAPS/IMS ion mo-ments for flybys R2 and R3 (where the angular coverage of thevelocity distribution is better) is therefore essential for exploringthe aforementioned scenario.
6. Summary, open questions and outlook
Energetic particle, magnetometer and electron density datafrom the four closest Cassini flybys of Rhea to date were reviewedin an attempt to understand the processes under which a series offlux decreases appear in energetic electrons. The most interestingobservation concerns the simultaneous presence of narrow drop-outs in energetic electron fluxes, visible usually near the wakeflanks with narrow flux enhancements within the wake bound-aries. Liouville’s theorem was found to hold for these features,when Phase-Space-Density losses or gains were compared at thelocations of the dropouts and spikes, respectively. This result isconsistent with a process of lossless rapid transport of energeticelectrons from the magnetosphere to the wake. It appears morelikely that the transport is driven by a form of instability, rather
132 E. Roussos et al. / Icarus 221 (2012) 116–134
than complex energetic electron drifts due to disturbed flows andmagnetic fields downstream of Rhea. These drifts may primarilyexplain better the broadening of the central wake with increasingenergy, although a contribution to this observed pattern may alsocome from the merging of small scale depletions at high electronenergies (typically above 60–100 keV, depending on the flyby).
The instability is probably driven by pressure and magneticfield gradients in the wake. Density gradients in the wake are sur-prisingly absent, a fact that we relate to the importance of surfacecharging for Rhea’s magnetospheric interaction. Deviation fromquasi-neutrality, is probably not more than 10�4 cm�3, based onenergetic ion observations in R1. Regardless of the explanation,we believe that the presence of a cold plasma source near Rheais implied from the observations. This aspect of the interaction ap-pears qualitatively similar to what was observed at the jovianmoon Callisto with the Galileo orbiter (Gurnett et al., 2000).
Simulating the evolution of plasma pressure gradients (expand-ing plasma clouds) using particle codes (Winske, 1989) would re-veal if for the conditions of Rhea’s plasma wake (plasma betanear unity, zero density gradient, strong parallel pressure compo-nent in the ‘‘wake’’) a fast growing instability develops, with char-acteristics described in previous sections. Alternatively, propertiesof the RPWS spectrograms may be compared to theoretical expec-tations for wake-driven instabilities as in Farrell et al. (1997).
The analysis presented in the previous sections was subject to aseries of limitations. The small number of Rhea flybys until nowmakes comparisons challenging, given that the flyby trajectory,the instrument pointing and the magnetospheric state are differentin almost each case. If the role of surface charging is important, ashinted by some observations, then also the magnetospheric localtime of the flyby may become a controlling parameter for the inter-action region’s structure and dynamics.
Equally interesting for future studies is the identification ofbroad energetic electron dropouts – an observation not extensivelyanalyzed in this study. These depletions are clearly seen only in fly-bys R1 and R2. A distinct difference between the dropouts in thetwo cases is the opposite energy dependence of the depletiondepth and the lack of symmetry in the depletion profile, for R2,with respect to the position of the wake. Less intense dropouts,but qualitatively similar to those in R1, are seen in flyby R1.5,and much weaker ones in R3.
Observed deviations from the typical, plasma-absorbing inter-action region profile may explain some differences. These devia-tions do not necessarily mean the main interaction mode at Rheais not plasma absorption. For instance, Simon et al. (2012) demon-strates that the combination of low magnetosonic Mach numberand the high plasma beta values of Rhea’s space environmentamplifies interaction features which for other plasma absorbers(e.g. Tethys, Dione, Earth’s Moon) are barely detectable. One ofthese features is a stronger, flow-aligned magnetic field compo-nent perturbation, which gives rise to mass-loading-like interac-tion signatures. Such structures may also complicate electrondrifts, but to what extent it is uncertain. Similarly, the high plasmabeta makes surface charging more important for Rhea compared tothe other Saturnian moons (Roussos et al., 2010). Furthermore, re-cent developments in the study of Earth’s Moon interaction withthe solar wind indicate that the standard picture for a lunar-typeinteraction may be too simplified: processes, such as the entry ofexospheric pick-up ions in the center of the wake, backscatteringon the surface and self-pick up of ambient plasma ions, appear toalso have an impact on the wake dynamics (Halekas et al., 2011).For instance, the self-pick up process has been shown to lead to en-hanced ULF wave activity in the lunar, at least 10% of the time(Nakagawa et al., 2012). Whether a similar process is importantthe inferred instability at Rhea is questionable, as the latter ap-pears to operate continuously.
Understanding the origin of the broad energetic electron fluxdropouts was also significantly limited by the narrow pitch anglepointing of LEMMS. So far, the only case where extended pitch an-gle coverage has been achieved was during the distant flyby ofVoyager 1 through Rhea’s absorption signature (microsignature),three degrees in longitude downstream of the moon. Observationsshowed that the flux dropouts are present in a broad region, muchgreater than Rhea’s diameter. In addition, that depletion was widerfor equatorial particles compared to that of the more field-alignedparticles. The pitch angle dependence observed with Voyager 1could be considered in order to explore whether the possibilitythat the decreases form due to scattering from whistler waves isapplicable (Santolı́k et al., 2011). The ideal pitch angle coverageof CAPS/ELS for flybys R2 and R3 may also be used to study pitchangle distributions at the 20–30 keV overlapping energy rangewith LEMMS. Furthermore, distant flybys of Cassini from Rheawithin few degrees from the moon should also be investigated,as the may contain additional information about the nature ofthe interaction.
Beyond these striking features identified in few flybys, therewas a large number of additional unique observations. For in-stance, energetic electron data in R1.5 confirm observations of Wil-son et al. (2010) of a local, radial velocity component in the moon’sinteraction region (also observed during R1). Signatures of fresh,interchange events were seen in R1 and R1.5, possibly also at R3.Furthermore, localized gradients in jBj were seen during the cross-ing from the shadowed to the sunlit hemisphere of Rhea (R2 andR3). What is unclear in most cases is why these features do not ap-pear consistently (or with consistent characteristics), and/orwhether they are related to Rhea’s interaction, or they are simplymagnetospheric. Additional, multi-instrument investigations andinteraction simulations are essential all possible scenarios andtheir implications for the structure dynamics of Rhea’s magneto-spheric interaction.
Acknowledgments
The German contribution of the MIMI/LEMMS Instrument wasin part financed by the German BMWi through the German SpaceAgency DLR under Contracts 50 OH 0103, 50 OH 0801, 50 OH0802, 50 OH 1101 and by the Max Planck Society. G.H.J. is sup-ported by UK Science and Technology Facilities Council Advancedand Postdoctoral Fellowships, respectively. H.K. acknowledgesfinancial support by the Deutsche Forschungsgemeinschaft (DFG)under Grant MO539/19-1. The hybrid simulations were performedon JUROPA supercomputers at the Jülich Supercomputing Centre,Forschungszentrum Jülich (Germany). We thank Andreas Laggand Markus Fränz (MPS) for extensive software support, MarthaKusterer and Jon Vandegriff (both JHUAPL) for reducing the MIMIdata, Gethyn Lewis and Lin Gilbert (both MSSL/UCL) for reducingthe CAPS/ELS data and Michelle Thomsen (LANL) for usefuldiscussions.
Appendix A. Details on the Phase Space Density calculations
Here we provide some additional details about conversion offluxes to Phase Space Densities, as this was required to test Liou-ville’s theorem for data collected near and within Rhea’s wake(Section 5.1). Since PSDs were calculated at constant first adiabaticinvariant, fluxes had to be evaluated at a different energy for eachpoint that we had Cassini observations.
In order to derive the electron intensity j(E(t), t) at the changedenergy, we used two methods. In the first, we used high energy res-olution spectral information from the PHA channels to extract theflux at the new energy E(t). A potential problem of this method
E. Roussos et al. / Icarus 221 (2012) 116–134 133
may arise from the relatively poor time resolution of the PHA chan-nels with respect to the few second duration of the small scaleenhancements and dropouts (the central features of this analysis).This could lead to undersampling and an underestimation of theenhancement or dropout amplitudes. For that reason, in the secondmethod we used measurements at the 36 and at 229 keV levels ofthe high time resolution LEMMS channels (channels C1_PRIO andC5_PRIO), and interpolated linearly between these energies on alog–log scale in order to find j(E(t), t). The disadvantage of thismethod is that the assumed power-law spectral shape is only arough approximation, given the shape of the energy–flux spectrataken with the PHA channels in that region (Fig. 9, bottom panel).
After we extract j(E(t), t) (with either of the two methods), weconvert the differential intensity j to Phase Space Density f = j/p2,with p the kinetic momentum. We then measure the amplitudeof the PSD losses/enhancements at the locations of the narrowdropouts/spikes. Comparison of the values is shown in Fig. 9 (toppanel). The indicated values were calculated using the first methoddescribed above. The second method gave nearly identical results,meaning that the influence of the channel effects discussed in theprevious paragraph is insignificant.
Appendix B. Details on the energetic electron tracings
Here we provide additional information regarding the calcula-tions presented in Section 5.2, where we show guiding center trac-ing of energetic electrons in a simulated interaction region of Rhea.
The use of the guiding center approximation is justified sincethe gyroradius of energetic electrons is much smaller than Rhea’sdiameter (15–35 km for electrons between 20 and 100 keV) orthe scale size of the various macroscopic interaction features(wake, expansion fans). Furthermore, field parameters in the sim-ulation are static.
The total drift velocity vector of equatorially mirroring electronsis given by the following equation:
v ¼ vE�Bcorot þ vE�B
Rhea þ v$ Bmag þ v$ B
Rhea ðB:1Þ
The first two terms are energy and charge independent E � Bdrifts, and represent the corotation and plasma flow perturbations,respectively. They dominate at energies below about 5–10 keV,depending on the percentage of subcorotation at Rhea and theintensity of local magnetic field gradients. The other two contribu-tions are energy dependent and represent drifts along the localrB � B direction. The third term represents drifts due to magneto-spheric field gradients and it is always opposing corotation (drifttowards �x). The last term may lead to drifts in all directions,depending on the location in Rhea’s interaction region. The sumof the last two components becomes dominant at energies aboveabout 80–100 keV for equatorially mirroring particles. For interme-diate energies, contributions from all terms are considerable. Wesolved Eq. (B.1) using numerical integration.
Numerical integration of Eq. (B.1) requires inputs for each of thefour terms. For the calculation of the third term, v$ B
mag, we require adescription of the equatorial magnetospheric field. For this pur-pose, we applied a linear fit to the magnetospheric jBj profile asa function of y-position in the RHIS. A linear fit is applicable sincethe region of interest is very narrow (�15RRh wide) compared tothe magnetospheric scales and at Rhea’s location jBj changesslowly with distance, as it is also visible in Figs. 2–8. The field gra-dient is between 0.19 and 0.27 nT/RRh in the y-direction. For refer-ence, in a dipole field the value is about 0.13 nT/RRh. From that, weused an average of 0.23 nT/RRh in the simulations.
Inputs for the magnetic field perturbations and the plasma flowat Rhea are extracted from new hybrid code simulations of Rhea’smagnetospheric interaction (Simon et al., 2012). These simulations
are similar to those of Roussos et al. (2008), utilizing an updatedversion of the hybrid simulation code, called AIKEF (AdaptiveIon-Kinetic Electron-Fluid) (Müller et al., 2011; Kriegel et al.,2011). The sum of the first two terms of Eq. (B.1) vE�B
corot;vE�BRhea
� �is
directly extracted from these simulations.The simulated magnetic field perturbations are important for
the last term of Eq. (B.1) vr BRhea
� �. Since gradient drift terms are pro-
portional to the electron energy, high energy electron tracings canbecome extremely sensitive even to weak numerical noise in thejBj output. To reduce the noise we averaged the output from the fi-nal steps of the simulation and also applied a Lee-filter in the xy-map of jBj. Derivatives in jBj were calculated numerically using athree-point interpolation. The spatial scales across which deriva-tives were estimated were at least three times greater than thescale size of noise features (�0.1RRh). This ensured that the residualnoise had the minimum possible effect in our tracings. Since wesimulated equatorial mirroring particle drifts, we also set Bx andBy to zero (Roussos et al., 2008).
After the jBj map is constructed, we calculate the two gradient
drift terms v$ Bmag;v$ B
Rhea
� �using a relativistically correct formula
(Northrop, 1963):
vrB ¼ðc2 � 1Þ
cmec2
2qjBj3ðB� $BÞ ðB:2Þ
Here, c is the Lorentz factor (containing information about the elec-tron energy), me is the electron mass, q is the electron charge and cis the speed of light. The use of relativistically adjusted equation forelectrons is necessary since for energies between 20 and 100 keV,for instance, b ¼ u
c (or c) gets values between 0.27 (1.17) and 0.55(1.48), respectively. This corresponds to a correction factor for theelectron kinetic energy between 5% (20 keV) and 22% (100 keV).
Integration of Eq. (B.1) was carried out with a fourth order Run-ge–Kutta method. A series of test runs were performed in order tofind the maximum allowed time step per electron energy. Integra-tion was done on the equatorial (xy) grid of the hybrid simulation.The hybrid code uses adaptive grid size, but output was interpo-lated on a uniform cartesian grid with a resolution of about0.084RRh in each direction. Field and flow values between the gridpoints were estimated by interpolation. At each time step, conser-vation of l was enforced, adjusting the initial energy of the elec-trons, when these moved across regions of different jBj.
Appendix C. Simulations of Rhea’s magnetospheric interaction,with the presence of an exosphere
These simulations were carried out in order to determine thepeak ionospheric densities in Rhea’s interaction region and under-stand whether the weak exosphere of Rhea is responsible for thelack of a plasma density dropout in the wake. For the simulation,the setup was similar to what is described in Simon et al. (2012),who, however, did not include an exosphere in the calculations.The neutral exosphere we added has a profile similar to that givenin Saur and Strobel (2005) and Simon et al. (2011) and its com-posed from molecular oxygen. Neutral densities are scaled by thetotal number of oxygen particles (N = 2.5 � 1029), given in Teoliset al. (2010), corresponding to a surface density of 3.4 � 105
cm�3. For the ionization of neutrals, we assumed that charge-ex-change dominates with a rate of 1.7 � 10�8 cm�3 s�1 (Simonet al., 2011). Photoionization was not included since the rate isnegligible compared to that of charge exchange. The simulationshows that since the ionospheric particle production rate is low,the ionosphere does not act as a barrier to the upstream plasmaflow. The corotation electric field penetrates down to the surfaceof Rhea and all exospheric particles are immediately picked-up,before they accumulate to large numbers around Rhea. At
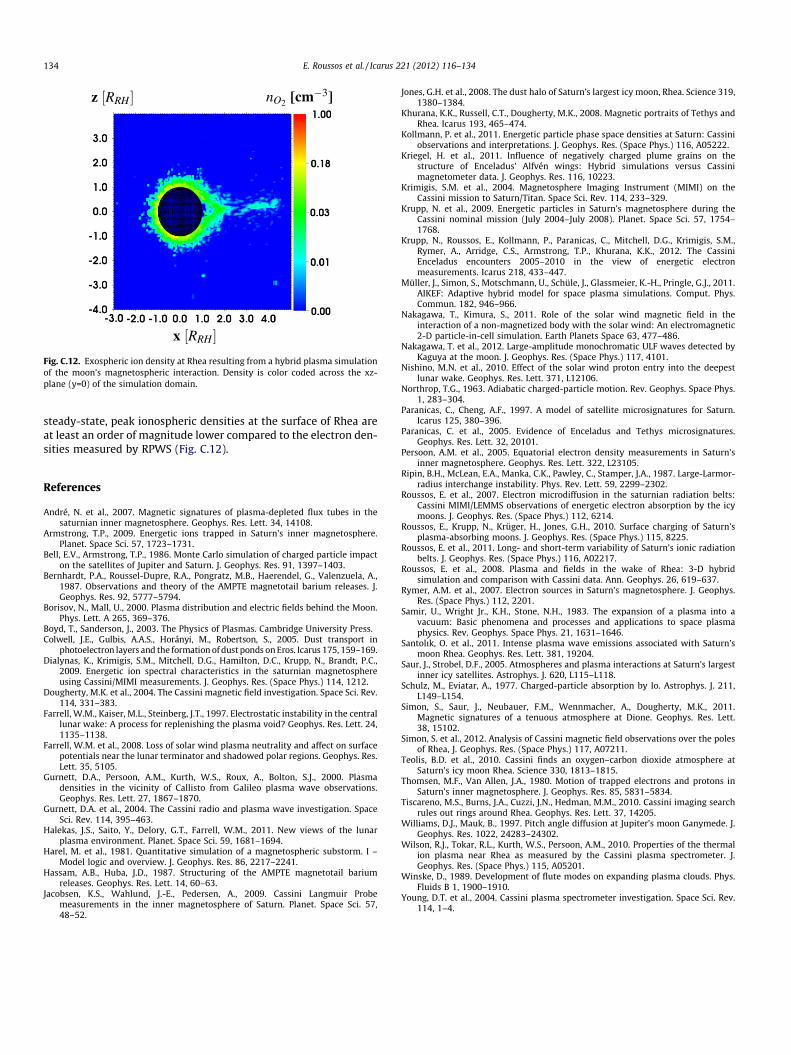
Fig. C.12. Exospheric ion density at Rhea resulting from a hybrid plasma simulationof the moon’s magnetospheric interaction. Density is color coded across the xz-plane (y=0) of the simulation domain.
134 E. Roussos et al. / Icarus 221 (2012) 116–134
steady-state, peak ionospheric densities at the surface of Rhea areat least an order of magnitude lower compared to the electron den-sities measured by RPWS (Fig. C.12).
References
André, N. et al., 2007. Magnetic signatures of plasma-depleted flux tubes in thesaturnian inner magnetosphere. Geophys. Res. Lett. 34, 14108.
Armstrong, T.P., 2009. Energetic ions trapped in Saturn’s inner magnetosphere.Planet. Space Sci. 57, 1723–1731.
Bell, E.V., Armstrong, T.P., 1986. Monte Carlo simulation of charged particle impacton the satellites of Jupiter and Saturn. J. Geophys. Res. 91, 1397–1403.
Bernhardt, P.A., Roussel-Dupre, R.A., Pongratz, M.B., Haerendel, G., Valenzuela, A.,1987. Observations and theory of the AMPTE magnetotail barium releases. J.Geophys. Res. 92, 5777–5794.
Borisov, N., Mall, U., 2000. Plasma distribution and electric fields behind the Moon.Phys. Lett. A 265, 369–376.
Boyd, T., Sanderson, J., 2003. The Physics of Plasmas. Cambridge University Press.Colwell, J.E., Gulbis, A.A.S., Horányi, M., Robertson, S., 2005. Dust transport in
photoelectron layers and the formation of dust ponds on Eros. Icarus 175, 159–169.Dialynas, K., Krimigis, S.M., Mitchell, D.G., Hamilton, D.C., Krupp, N., Brandt, P.C.,
2009. Energetic ion spectral characteristics in the saturnian magnetosphereusing Cassini/MIMI measurements. J. Geophys. Res. (Space Phys.) 114, 1212.
Dougherty, M.K. et al., 2004. The Cassini magnetic field investigation. Space Sci. Rev.114, 331–383.
Farrell, W.M., Kaiser, M.L., Steinberg, J.T., 1997. Electrostatic instability in the centrallunar wake: A process for replenishing the plasma void? Geophys. Res. Lett. 24,1135–1138.
Farrell, W.M. et al., 2008. Loss of solar wind plasma neutrality and affect on surfacepotentials near the lunar terminator and shadowed polar regions. Geophys. Res.Lett. 35, 5105.
Gurnett, D.A., Persoon, A.M., Kurth, W.S., Roux, A., Bolton, S.J., 2000. Plasmadensities in the vicinity of Callisto from Galileo plasma wave observations.Geophys. Res. Lett. 27, 1867–1870.
Gurnett, D.A. et al., 2004. The Cassini radio and plasma wave investigation. SpaceSci. Rev. 114, 395–463.
Halekas, J.S., Saito, Y., Delory, G.T., Farrell, W.M., 2011. New views of the lunarplasma environment. Planet. Space Sci. 59, 1681–1694.
Harel, M. et al., 1981. Quantitative simulation of a magnetospheric substorm. I –Model logic and overview. J. Geophys. Res. 86, 2217–2241.
Hassam, A.B., Huba, J.D., 1987. Structuring of the AMPTE magnetotail bariumreleases. Geophys. Res. Lett. 14, 60–63.
Jacobsen, K.S., Wahlund, J.-E., Pedersen, A., 2009. Cassini Langmuir Probemeasurements in the inner magnetosphere of Saturn. Planet. Space Sci. 57,48–52.
Jones, G.H. et al., 2008. The dust halo of Saturn’s largest icy moon, Rhea. Science 319,1380–1384.
Khurana, K.K., Russell, C.T., Dougherty, M.K., 2008. Magnetic portraits of Tethys andRhea. Icarus 193, 465–474.
Kollmann, P. et al., 2011. Energetic particle phase space densities at Saturn: Cassiniobservations and interpretations. J. Geophys. Res. (Space Phys.) 116, A05222.
Kriegel, H. et al., 2011. Influence of negatively charged plume grains on thestructure of Enceladus’ Alfvén wings: Hybrid simulations versus Cassinimagnetometer data. J. Geophys. Res. 116, 10223.
Krimigis, S.M. et al., 2004. Magnetosphere Imaging Instrument (MIMI) on theCassini mission to Saturn/Titan. Space Sci. Rev. 114, 233–329.
Krupp, N. et al., 2009. Energetic particles in Saturn’s magnetosphere during theCassini nominal mission (July 2004–July 2008). Planet. Space Sci. 57, 1754–1768.
Krupp, N., Roussos, E., Kollmann, P., Paranicas, C., Mitchell, D.G., Krimigis, S.M.,Rymer, A., Arridge, C.S., Armstrong, T.P., Khurana, K.K., 2012. The CassiniEnceladus encounters 2005–2010 in the view of energetic electronmeasurements. Icarus 218, 433–447.
Müller, J., Simon, S., Motschmann, U., Schüle, J., Glassmeier, K.-H., Pringle, G.J., 2011.AIKEF: Adaptive hybrid model for space plasma simulations. Comput. Phys.Commun. 182, 946–966.
Nakagawa, T., Kimura, S., 2011. Role of the solar wind magnetic field in theinteraction of a non-magnetized body with the solar wind: An electromagnetic2-D particle-in-cell simulation. Earth Planets Space 63, 477–486.
Nakagawa, T. et al., 2012. Large-amplitude monochromatic ULF waves detected byKaguya at the moon. J. Geophys. Res. (Space Phys.) 117, 4101.
Nishino, M.N. et al., 2010. Effect of the solar wind proton entry into the deepestlunar wake. Geophys. Res. Lett. 371, L12106.
Northrop, T.G., 1963. Adiabatic charged-particle motion. Rev. Geophys. Space Phys.1, 283–304.
Paranicas, C., Cheng, A.F., 1997. A model of satellite microsignatures for Saturn.Icarus 125, 380–396.
Paranicas, C. et al., 2005. Evidence of Enceladus and Tethys microsignatures.Geophys. Res. Lett. 32, 20101.
Persoon, A.M. et al., 2005. Equatorial electron density measurements in Saturn’sinner magnetosphere. Geophys. Res. Lett. 322, L23105.
Ripin, B.H., McLean, E.A., Manka, C.K., Pawley, C., Stamper, J.A., 1987. Large-Larmor-radius interchange instability. Phys. Rev. Lett. 59, 2299–2302.
Roussos, E. et al., 2007. Electron microdiffusion in the saturnian radiation belts:Cassini MIMI/LEMMS observations of energetic electron absorption by the icymoons. J. Geophys. Res. (Space Phys.) 112, 6214.
Roussos, E., Krupp, N., Krüger, H., Jones, G.H., 2010. Surface charging of Saturn’splasma-absorbing moons. J. Geophys. Res. (Space Phys.) 115, 8225.
Roussos, E. et al., 2011. Long- and short-term variability of Saturn’s ionic radiationbelts. J. Geophys. Res. (Space Phys.) 116, A02217.
Roussos, E. et al., 2008. Plasma and fields in the wake of Rhea: 3-D hybridsimulation and comparison with Cassini data. Ann. Geophys. 26, 619–637.
Rymer, A.M. et al., 2007. Electron sources in Saturn’s magnetosphere. J. Geophys.Res. (Space Phys.) 112, 2201.
Samir, U., Wright Jr., K.H., Stone, N.H., 1983. The expansion of a plasma into avacuum: Basic phenomena and processes and applications to space plasmaphysics. Rev. Geophys. Space Phys. 21, 1631–1646.
Santolı́k, O. et al., 2011. Intense plasma wave emissions associated with Saturn’smoon Rhea. Geophys. Res. Lett. 381, 19204.
Saur, J., Strobel, D.F., 2005. Atmospheres and plasma interactions at Saturn’s largestinner icy satellites. Astrophys. J. 620, L115–L118.
Schulz, M., Eviatar, A., 1977. Charged-particle absorption by Io. Astrophys. J. 211,L149–L154.
Simon, S., Saur, J., Neubauer, F.M., Wennmacher, A., Dougherty, M.K., 2011.Magnetic signatures of a tenuous atmosphere at Dione. Geophys. Res. Lett.38, 15102.
Simon, S. et al., 2012. Analysis of Cassini magnetic field observations over the polesof Rhea, J. Geophys. Res. (Space Phys.) 117, A07211.
Teolis, B.D. et al., 2010. Cassini finds an oxygen–carbon dioxide atmosphere atSaturn’s icy moon Rhea. Science 330, 1813–1815.
Thomsen, M.F., Van Allen, J.A., 1980. Motion of trapped electrons and protons inSaturn’s inner magnetosphere. J. Geophys. Res. 85, 5831–5834.
Tiscareno, M.S., Burns, J.A., Cuzzi, J.N., Hedman, M.M., 2010. Cassini imaging searchrules out rings around Rhea. Geophys. Res. Lett. 37, 14205.
Williams, D.J., Mauk, B., 1997. Pitch angle diffusion at Jupiter’s moon Ganymede. J.Geophys. Res. 1022, 24283–24302.
Wilson, R.J., Tokar, R.L., Kurth, W.S., Persoon, A.M., 2010. Properties of the thermalion plasma near Rhea as measured by the Cassini plasma spectrometer. J.Geophys. Res. (Space Phys.) 115, A05201.
Winske, D., 1989. Development of flute modes on expanding plasma clouds. Phys.Fluids B 1, 1900–1910.
Young, D.T. et al., 2004. Cassini plasma spectrometer investigation. Space Sci. Rev.114, 1–4.
Copyright © 2022 FDOKUMEN