Wave emissions at half electron gyroharmonics in the equatorial plasmasphere region: CLUSTER...
12
Wave emissions at half electron gyroharmonics in the equatorial plasmasphere region: CLUSTER observations and statistics F. El-Lemdani Mazouz a, * , J.L. Rauch a , P.M.E. De ´cre ´au a , J.G. Trotignon a , X. Vallie `res a , F. Darrouzet b , P. Canu c , X. Suraud a a Laboratoire de Physique et de Chimie de l’Environnement (LPCE), 3A Avenue de la recherche Scientifique, 45071 Orle ´ans Cedex 02, France b Belgian Institute for Space Aeronomy (IASB-BIRA), 3 Avenue Circulaire, 1180 Brussels, Belgium c Centre d’e ´tudes des Environnements Terrestres et Plane ´taires (CETP), 10–12 Avenue de l’Europe, 78140 Ve ´lizy-Villacoublay, France Received 16 November 2007; received in revised form 26 May 2008; accepted 6 June 2008 Abstract Intense (n + 1/2) f ce emissions are a common phenomenon observed in the terrestrial inner magnetosphere. One of their interests is their possible effect in the pitch angle scattering of plasmasheet keV-electron, leading to diffuse auroras. In this paper, we present CLUS- TER’s point of view about this topic, in the equatorial region of the plasmasphere, via a statistical study using 3 years of data. Spectral characteristics of these waves, which represent an important clue concerning their generation mechanism, are obtained using WHISPER data near perigee. Details on the wave spectral signature are shown in an event study, in particular their splitting in fine frequency bands. The orbit configuration of the four spacecraft offers a complete sampling on all MLT sectors. A higher occurrence rate of the emissions in the dawn sector and their confinement to the geomagnetic equator, pointed out in previous studies, are confirmed and described with additional details. The proximity of emission sites, both to the plasmapause layer and to the geomagnetic equator surface, seems to be of great importance in the behaviour of the (n + 1/2) f ce wave characteristics. Our study indicates for the first time, that both the inten- sity of (n + 1/2) f ce emissions, and the number of harmonic bands they cover, are increasing as the observation point is located further away outside from the plasmapause layer. Moreover, a study of the wave intensity in the first harmonic band (near 3/2 f ce ) shows higher amplitude for these emissions than previous published values, these emissions can play a role in the scattering of hot electrons. Finally, geomagnetic activity influence, studied via time series of the D st index preceding observations, indicates that (n + 1/2) f ce emission events are observed at CLUSTER position under moderate geomagnetic activity conditions, no specific D st time variation being required. Ó 2008 COSPAR. Published by Elsevier Ltd. All rights reserved. Keywords: Electron cyclotron harmonic waves; Plasmasphere; Diffuse aurora 1. Introduction Electron cyclotron harmonic (ECH) waves of various types have been observed in space since the advent of in situ measurements: in the Earth magnetosphere (Kennel et al., 1970; Christiansen et al., 1978; Olsen et al., 1987; Usui et al., 1999), as well as in the vicinity of other planets (Kurth and Gurnett, 1991). These emissions have been also observed in plasma laboratory (Krafft et al., 1992). Classi- fications of terrestrial ECH waves have been proposed, according to the available coverage of observations offered by the different spacecraft and their instrumentation (Hub- bard and Birmingham, 1978, on IMP 6; Gough et al., 1979, on GEOS 2). Main classification criteria are the intensity and the frequency range of the emissions. In parallel with observations, and sometimes in advance from those, a large number of theoretical studies have been produced, con- cerning both the generation mechanisms of ECH waves, and their effects on the magnetospheric electron popula- tion. Kennel and Ashour-Abdalla (1982) published a com- prehensive review of possible causes and effects. 0273-1177/$34.00 Ó 2008 COSPAR. Published by Elsevier Ltd. All rights reserved. doi:10.1016/j.asr.2008.06.007 * Corresponding author. E-mail address: [email protected] (F. El-Lemdani Mazouz). www.elsevier.com/locate/asr Available online at www.sciencedirect.com Advances in Space Research 43 (2009) 253–264
Transcript of Wave emissions at half electron gyroharmonics in the equatorial plasmasphere region: CLUSTER...

Available online at www.sciencedirect.com
www.elsevier.com/locate/asr
Advances in Space Research 43 (2009) 253–264
Wave emissions at half electron gyroharmonics in the equatorialplasmasphere region: CLUSTER observations and statistics
F. El-Lemdani Mazouz a,*, J.L. Rauch a, P.M.E. Decreau a, J.G. Trotignon a, X. Vallieres a,F. Darrouzet b, P. Canu c, X. Suraud a
a Laboratoire de Physique et de Chimie de l’Environnement (LPCE), 3A Avenue de la recherche Scientifique, 45071 Orleans Cedex 02, Franceb Belgian Institute for Space Aeronomy (IASB-BIRA), 3 Avenue Circulaire, 1180 Brussels, Belgium
c Centre d’etudes des Environnements Terrestres et Planetaires (CETP), 10–12 Avenue de l’Europe, 78140 Velizy-Villacoublay, France
Received 16 November 2007; received in revised form 26 May 2008; accepted 6 June 2008
Abstract
Intense (n + 1/2) fce emissions are a common phenomenon observed in the terrestrial inner magnetosphere. One of their interests istheir possible effect in the pitch angle scattering of plasmasheet keV-electron, leading to diffuse auroras. In this paper, we present CLUS-TER’s point of view about this topic, in the equatorial region of the plasmasphere, via a statistical study using 3 years of data. Spectralcharacteristics of these waves, which represent an important clue concerning their generation mechanism, are obtained using WHISPERdata near perigee. Details on the wave spectral signature are shown in an event study, in particular their splitting in fine frequency bands.The orbit configuration of the four spacecraft offers a complete sampling on all MLT sectors. A higher occurrence rate of the emissions inthe dawn sector and their confinement to the geomagnetic equator, pointed out in previous studies, are confirmed and described withadditional details. The proximity of emission sites, both to the plasmapause layer and to the geomagnetic equator surface, seems tobe of great importance in the behaviour of the (n + 1/2) fce wave characteristics. Our study indicates for the first time, that both the inten-sity of (n + 1/2) fce emissions, and the number of harmonic bands they cover, are increasing as the observation point is located furtheraway outside from the plasmapause layer. Moreover, a study of the wave intensity in the first harmonic band (near 3/2 fce) shows higheramplitude for these emissions than previous published values, these emissions can play a role in the scattering of hot electrons. Finally,geomagnetic activity influence, studied via time series of the Dst index preceding observations, indicates that (n + 1/2) fce emission eventsare observed at CLUSTER position under moderate geomagnetic activity conditions, no specific Dst time variation being required.� 2008 COSPAR. Published by Elsevier Ltd. All rights reserved.
Keywords: Electron cyclotron harmonic waves; Plasmasphere; Diffuse aurora
1. Introduction
Electron cyclotron harmonic (ECH) waves of varioustypes have been observed in space since the advent of insitu measurements: in the Earth magnetosphere (Kennelet al., 1970; Christiansen et al., 1978; Olsen et al., 1987;Usui et al., 1999), as well as in the vicinity of other planets(Kurth and Gurnett, 1991). These emissions have been alsoobserved in plasma laboratory (Krafft et al., 1992). Classi-
0273-1177/$34.00 � 2008 COSPAR. Published by Elsevier Ltd. All rights rese
doi:10.1016/j.asr.2008.06.007
* Corresponding author.E-mail address: [email protected] (F. El-Lemdani Mazouz).
fications of terrestrial ECH waves have been proposed,according to the available coverage of observations offeredby the different spacecraft and their instrumentation (Hub-bard and Birmingham, 1978, on IMP 6; Gough et al., 1979,on GEOS 2). Main classification criteria are the intensityand the frequency range of the emissions. In parallel withobservations, and sometimes in advance from those, a largenumber of theoretical studies have been produced, con-cerning both the generation mechanisms of ECH waves,and their effects on the magnetospheric electron popula-tion. Kennel and Ashour-Abdalla (1982) published a com-prehensive review of possible causes and effects.
rved.

254 F. El-Lemdani Mazouz et al. / Advances in Space Research 43 (2009) 253–264
In this paper, we present CLUSTER observations ofone type of terrestrial ECH waves, namely intense (n + 1/2) fce emissions, where fce is the local electron gyrofre-quency, such as those which have been reported to beobserved in the inner magnetosphere (radial distance below�12 RE), strongly confined to the geomagnetic equator(Gough et al., 1981). An important possible effect of theseintense emissions is to operate a pitch angle diffusion ofplasmasheet keV-electrons, and consequently their precipi-tation into the auroral ionosphere (Kennel et al., 1970;Lyons, 1974). Further studies (Belmont et al., 1983; Fon-taine et al., 1986) have questioned, without excluding it,the hypothesis of responsibility of (n + 1/2) fce emissionsto operate strong pitch angle diffusion. Other worksaddress the same question. Roeder and Koons (1989), froma statistical study using SCATHA and AMPTE IRMplasma wave data, drove a conclusion in agreement withBelmont et al. (1983). They show that amounts of intenseequatorial (n + 1/2) fce emissions are grossly insufficientto account for the diffuse auroral precipitation by quasi-lin-ear pitch angle diffusion. In contrast, Horne et al. (2003),analysing a weak substorm injection event, and exploringthe effects of propagation in a non homogeneous medium,find out that ECH waves resonate with electrons over awide range of energies (from hundred of eV to a fewkeV), producing probably the major contribution to diffuseauroral precipitation for this substrom event.
The first motivation to the present study is to completethe observational data sets accumulated from last century’sspacecraft, with CLUSTER wave data, in order to possiblyopen a new discussion of the questioned hypothesis. The sec-ond motivation deals with the origin of the waves, ratherthan with their consequences. We mainly describe the con-text of occurrence and intensity variations of the CLUSTERobserved (n + 1/2) fce emissions on a statistical basis. We dis-cuss also the possible role in the apparition of these emis-sions of cold to warm electrons density ratio, of gradientdensity and of free energy sources. We present in addition,from event studies, some details of the wave spectral signa-ture collected with WHISPER instrument on board CLUS-TER. Those signatures have been shown from theoreticalstudies to be of importance in the search of the generationmechanism. Let us precise that we exclude in this study thewaves at and above the upper hybrid frequency fuh, some-times associated to the lower frequency range of ECH emis-sions, but of different nature according to the shape ofBernstein mode dispersion relation (Bernstein, 1958).
The observations of the multi-satellite CLUSTER mis-sion offer a useful complement to observational data setsacquired in the past. One difficulty encountered by space-craft with low or moderate inclination has been their ten-dency to sample the emissions of interest, strongly confinedin magnetic latitude (<±2�), in an uneven way (see Hubbardet al., 1979, for IMP6 view; Gough et al., 1981, for GEOS 1and GEOS 2 view; Roeder and Koons, 1989, for SCATHAand AMPTE IRM view). Indeed, with spacecraft of higheccentricity, like IMP 6, the null magnetic latitude is often
reached at an inconvenient radial distance, outside of theradial range of the emissions (which are confined not far out-side the plasmasphere). With spacecraft of small eccentricitybut low inclination (SCATHA, GEOS 2), the maximumwave intensity can sometimes be missed, or sampled at anunknown part of the orbit, due to fluctuations in anunknown way of the real instantaneous magnetic configura-tion. In contrast, the polar orbit of CLUSTER (Escoubet etal., 1997), crosses the geomagnetic equator clearly andquickly around perigee (near 4 RE, with an orbital periodof 57 h) during the years 2002–2004 (period analysed). Thisproperty, combined with the good time resolution of theinstruments, allows to sort out orbits with or without equa-torial (n + 1/2) fce emissions and precisely measure theirequatorial intensity. The counter part is a quite limited radialexploration (less than 0.5 RE). The radial average position(around 4 RE) is, however, most of the time close to theplasmasphere boundary layer region (Carpenter and Lem-aire, 2004), not far from the inner edge of the plasmasheetelectrons (Horwitz et al., 1986), i.e. where the phenomenaof interest are taking place.
In this work, we show that the large majority of CLUS-TER orbits are able to observe equatorial (n + 1/2) fce
emissions. Moreover, the orbit evolution during 1 yearoffers a complete and regular MLT sampling, repeated dur-ing the 3 years analysed. Another useful complement ofCLUSTER data set is to offer a multipoint view, within ashort-time separation (of order 1 h), of the same event atsmall radial separation. This reveals the important role ofradial distance to sort out cases of multi-harmonic ECHemissions, at (n + 1/2) fce, from cases of single harmonic(monotonic) ones, at 3/2 fce only.
The data analysed and presented in this study are a setof electric field frequency spectra measured near the equa-torial plasmapause layer by the Wave of HIgh frequencyand Sounder for Probing of Electron density by Relaxation(WHISPER) instrument (Decreau et al., 1997) on boardthe 4 CLUSTER spacecraft. WHISPER instrumentenables the observation of various natural emissions inthe plasmasphere region (Canu et al., 2001), in particularthe (n + 1/2) fce emissions (El-Lemdani Mazouz et al.,2006). We begin in Section 2 with a presentation and a dis-cussion of the spectral properties of (n + 1/2) fce emissions,via an event study. In Section 3, we present statistics overthe 2002–2004 period. The occurrence rate of the equato-rial (n + 1/2) fce emissions and their MLT localization arestudied and discussed, as well as the intensity of the firstharmonic band of these waves. Finally, the time correlationof the apparition of these emissions with geomagneticactivity time variation is investigated via the Dst index. Sec-tion 4 summarizes the main findings from this study.
2. WHISPER observations of equatorial electron cyclotron
harmonics
Before studying the statistical properties of the intenseequatorial (n + 1/2) fce emissions recorded on CLUSTER,

F. El-Lemdani Mazouz et al. / Advances in Space Research 43 (2009) 253–264 255
we briefly show typical signatures of natural emissionsobserved in the plasmasphere, using an event study. Asmentioned above, the data analysed are electric field fre-quency spectra measured by the WHISPER instrument(Decreau et al., 1997, 2001) combined with the ElectricField and Wave (EFW) instrument (Gustafsson et al.,1997), the latter providing the sensors and antenna (a dou-ble sphere dipole), and the former the receiving and spec-tral analysis chain. In addition to the measurements ofnatural emissions, the WHISPER instrument yields a diag-nosis of the plasma frequency fp and of the gyrofrequencyfce using a sounding technique. In the inner magnetosphere,where the plasma is significantly magnetized (3 < fp/fce < 10), a careful analysis of the information containedin the frequency pattern of plasma resonances, triggeredlocally by the sounder, yields not only the total electrondensity, but also the density of the cold part of the electronpopulation. As an example, the analysis of an event takenin the noon sector, close to perigee (Trotignon et al., 2003),indicates a cold component equal to about 95% of the totalelectron component in the plasmasphere, and to about only60% in the region located just outside.
Natural waves measured by the WHISPER instrumentare presented in Fig. 1 for a perigee pass on August 7th,2003. A colour coded frequency–time spectrogram (leftpanel) displays the general wave behaviour along the orbitof the CLUSTER spacecraft, C4, and a frequency spec-trum (right panel) shows detailed spectral featuresobserved near the geomagnetic equator. From 06:15 to10:00 UT, the CLUSTER constellation crosses the outerplasmasphere, at �14 MLT, and between �55� and +55�magnetic latitude (LatSM). The latitude and MLT valuesare calculated in Solar Magnetic (SM) coordinates, usingthe model of Tsynanenko and Stern (1996). The plasmafrequency, plotted as a white solid line, rises and falls withtime, reaching a maximal value of �60 kHz near geomag-netic equator, crossed around 08:09 UT. The short increase
Fig. 1. Natural emissions measured on August 7th, 2003, by WHISPER on Celectric field. The white solid line follows the estimated plasma frequency. TheSolar Magnetic (SM) coordinate system. The top bar indicates data status: whsaturation. (Right panel) Detailed spectrum at 08:09 UT, frequency band 0–80and its harmonics.
of plasma frequency at 08:04 UT (before the equator cross-ing), from �60 to �70 kHz, indicates a short incursionearthward from a sharp plasmapause knee (or a local struc-ture), located at an L shell of about 4.5 RE. The otherwisesmooth variation of the plasma frequency along the orbit isquasi identical for the four spacecraft. Since they are con-figured in this case in a small formation (200 km averagespacecraft separation), and despite a constellation veryelongated along the orbit near perigee, it is possible to eval-uate spatial gradients of measured physical parameters(Darrouzet et al., 2006; De Keyser et al., 2007). The mag-nitude of the density gradient vector culminates near geo-magnetic equator, reaching a value of about 0.05 cm�3/km (De Keyser et al., 2007). Its direction points theretoward Earth, as expected for a regular plasmasphereshape, locally axi-symmetric.
Various types of natural emissions are observed duringthis plasmasphere crossing. We now briefly describe emis-sions related to the electron gyrofrequency fce (about9.4 kHz at equator) and observed below the plasma fre-quency fp. The first type of such waves is intense emissionsobserved near 08:05 UT, confined within a few degrees ofmagnetic latitude. These emissions are observed in a har-monic form at successive frequencies of, respectively,�15, � 26, �35 kHz and above, between harmonics offce, and are thus identified as (n + 1/2) fce emissions. Theyare also characterized by a large frequency bandwidth,defined as the full width at half the intensity maximum(FWHM). We will discuss this property further down inthis section. The second type of natural emissions belowfp is an emission existing over a larger magnetic latitudeinterval, LatSM varying from �15� to 15�. This spectral fea-ture is highlighted in the figure with a yellow arrow. Thisemission, well defined in frequency, with a narrow band-width (< 2 kHz), is observed exactly at 1.1 fce. The intensityof this emission is two order smaller than the intensity ofthe equatorial emissions. They are a common feature on
LUSTER C4. (Left panel) Frequency–time spectrogram of the measuredarrow indicates emission at 1.1 fce. Coordinates of the satellite are given inite for data gaps, black for nominal conditions, green for data affected bykHz in ordinate. Dotted green lines indicate the electron gyrofrequency fce

256 F. El-Lemdani Mazouz et al. / Advances in Space Research 43 (2009) 253–264
WHISPER spectrograms at perigee and can be associatedor not with equatorial emissions. Other emissions display-ing spectral feature related to fce, are observed both in thesouthern and in the northern hemisphere. Very faint(almost at noise level) in the equatorial region (fp > 30 kHzand jLatSMj < 30�), they reach significant levels further outthe plasmasphere body, for long-time intervals (�1 h). Thelast type of emissions we can mention is observed below fce
during several hours (from 07:00 to 10:00 UT). They areidentified as chorus (Parrot et al., 2003).
In this work, we focus on the electrostatic emissions at(n + 1/2) fce appearing within a few degrees of magnetic lat-itude. The right panel of Fig. 1 displays the frequency spec-trum measured at 08:09 UT, just before the spacecraftcrossed geomagnetic equator. We can clearly observe inthis spectrum emissions, observed between two electrongyroharmonic frequencies, represented by green dottedlines on the figure. Four harmonic bands are observed,their intensity decreasing with the order of harmonic, from1.7 10�5 Vrms Hz�1/2 for the first harmonic band to 810�7 Vrms Hz�1/2 for the fourth one. Note that the emissionat the upper hybrid frequency fuh (�65 kHz), is moreintense (> 5 10�5 Vrms Hz�1/2) than the (n + 1/2) fce bands.
Some intense emissions can cause a saturation (over-flow) of the instrument, leading to spurious frequency rep-licas. This is the case here around 08:08 UT as it isindicated in the figure by the green colour on the top barof the spectrogram. However, despite the presence of thesereplicas, we are able to characterize properly the naturalemissions at (n + 1/2) fce, because not all the spectra areaffected.
The measured raw signal, S, is expressed in Fig. 1 inunity of Vrms Hz�1/2, as is generally the case with WHIS-PER data. This quantity represents the electric field spec-tral density integrated along the effective length of theantenna, Leff. Since the Leff value depends significantly onthe plasma regime considered and on the frequency rangeanalysed (see Beghin et al., 2005, for a quantitative studyof the behaviour of CLUSTER antennas), it is convenientto introduce this value only when necessary, i.e. when weneed actual electric field values. This is the case here. Inorder to discuss possible contribution of (n + 1/2) fce emis-sions to pitch angle diffusion, we must convert the WHIS-PER spectral density (in Vrms Hz�1/2) to the amplitude (inVrms m�1, or V m�1 in short) of a sine electric field ofequivalent energy. This allows a comparison with thethreshold level, E0 � 1 to 2 mV m�1, reported by severalauthors to cause pitch angle diffusion (see for example Bel-mont et al., 1983). The conversion reads:
Esin eðV m�1Þ ¼ffiffiffiffiffiffiffi
DFp
ðHzÞLeffðmÞ
SðV rmsHz�1=2Þ ð1Þ
where DF is the useful frequency bandwidth.Leff is sometimes considered, for simplicity, to be equal
to the actual tip to tip length of the antenna, 88 m in thecase of CLUSTER. This would lead to an underestimation
of the electric field value. We shall here adopt a more rea-sonable estimation, Leff = 53 m, valid for plasmas of 1–5 mDebye length, typical values in the outer plasmasphere(Decreau et al., 1982), in accordance with Fig. 6 of Beghinet al. (2005). Another factor of importance is the spin mod-ulation coefficient, which affects the signal amplitudeaccording to the antenna angle with magnetic field, sincethe (n + 1/2) fce electric field is expected to be preferentiallydirected perpendicularly to magnetic field. As, near equa-tor, the magnetic field makes a small angle with spin axis,we can ignore this effect in a first approximation. Thiscould lead in any event to an underestimation of the elec-tric field amplitude. Finally, we must evaluate the usefulbandwidth DF. In the frame of theories involving mono-chromatic waves, we shall simply use the instrumentalequivalent bandwidth, i.e. the DF = 556 Hz value corre-sponding, in standard operation modes (324 Hz frequencyresolution), to the conversion of a pure sine wave, leadingfinally to:
Esin eðV m�1Þ ¼ 0:44SðV rmsHz�1=2Þ ð2ÞEq. (2) might underestimate the meaningful amplitude esti-mation, since the observed bandwidth is generally higher,as described below.
The electrostatic emissions at (n + 1/2) fce are observedbetween 08:04 UT and 08:10 UT with a total latitude exten-sion of 4� in the modelled LatSM value (from �3� to +1�).The study of the overall frequency bandwidth of theseemissions shows a maximum of the frequency bandwidthnear geomagnetic equator, up to 8 kHz, with a higher valueof the bandwidth for the first harmonic (the respective ratioof the bandwidth normalized to fce is �80% for the firstharmonic, 50% for the second one and 30% for the thirdone) in accordance with observations reported in previousworks (Kennel and Ashour-Abdalla, 1982). Maximum val-ues of intensity (2.7 � 10�5 Vrms Hz�1/2) and bandwidthare reached at 08:07 UT at modelled latitude LatSM = �1�,which we believe is the actual geomagnetic equator.
We can also point out that the good frequency resolu-tion of the WHISPER instrument (324 Hz in standardmode) allows the detection of interesting fine structuresthat are showing up in the detailed successive spectrarecorded. For this event, if we focus on the 3/2 fce band:starting at 08:04 UT, it displays a double peak (fpeak/fce
equal, respectively, to 1.5 and 1.7), which evolves into a tri-ple peak (fpeak/fce equal, respectively, to 1.25, 1.52 and 1.76)at 08:09 UT, as shown in right panel of Fig. 1, at a less than3� magnetic latitudinal distance. This evolution in thedetailed structure of the 3/2 band is not explained by achange in the magnitude of the magnetic field which is con-stant (within less than 0.5%) between the two observations.Alternatively, if we focus on the evolution of the spectralpattern with the order of harmonic band considered, wecan point out that the frequency of the maxima of intensityof each harmonic is shifted from the exact half of the band-width. This frequency increases from about 3/2 fce for thefirst harmonic band, to higher values in frequency for the

F. El-Lemdani Mazouz et al. / Advances in Space Research 43 (2009) 253–264 257
higher harmonics (5/2 fce, . . ..) up to 4.8 fce for the fourthharmonic band. Various positions in frequency could beexplained by the different instability mechanisms leadingto the apparition of these emissions, like a loss cone onefor emissions lower than the exact half and a thermalanisotropy for the emissions higher than the exact half(Kennel and Ashour-Abdalla, 1982). Moreover, as shownby Horne et al. (2003), (n + 1/2)fce waves are very sensibleto propagation effects, which could explain some of theobserved evolutions.
In summary, we show on this event study that (n + 1/2)fce waves are strongly collimated near the geomagneticequator. The ±2� latitudinal range is representative of allour observations. Another notable experimental result isthe observation of fine structures inside the harmonicbands, with a complex evolution with respect to magneticlatitude. The evolution noted here is specific to the ana-lysed event: other events show different behaviours, butmost of them display fine frequency structures, which havenot been, at this time, fully described (see Koons and Fen-nell, 1984; Paranicas et al., 1992, for examples of observedfine structures). It is outside the scope of this paper to dis-cuss any interpretation, but we wish to underline the factthat a significant wave activity is present over a large partof the 3/2 fce harmonic band, as well as, in many cases, inthe higher harmonic bands, as we will see in the nextsection.
3. Statistical study
In this part, we present a statistical study of (n + 1/2) fce
emissions. As mentioned before, we use WHISPER datacollected by the CLUSTER spacecraft near perigee, overthe years 2002–2004. At perigee (located around 4 RE geo-centric distance), we can monitor each crossing of the geo-magnetic equator and check the presence of the emissionswe are interested in. The 3 years duration of the data setanalysed, compared to the orbital period duration (57 h),leads to a significant number of perigee passes (461 events),covering all MLT sectors.
During years 2002–2004, the average size of CLUSTERconstellation varies from 100 to 6000 km. Because the con-stellation is elongated along the polar orbit at perigee, itsprojection onto the geomagnetic equator plane has a signif-icantly smaller size: the maximal separation distances atequator crossings is always less than 0.5 RE. Moreover,the crossings occur within 1 h at most. This delay is shorterthan characteristic durations involved in global dynamicsof the plasmasphere, i.e. in generation and corotation ofa large plasmapause structure: such durations are typicallyhigher than 3 h and less than 3 days (see for instance Pierr-ard and Cabrera, 2005). We can see that the four spacecraftwill generally observe no major changes from the first tothe last crossings at the same perigee pass, since they aregrouped together in space and time. In contrast, changesin the plasmasphere between two successive perigee passesare expected. For our statistical study, we have chosen to
treat data from a single satellite over a long period ratherthan to analyse observations from all spacecraft over ashorter period. We have selected the satellite CLUSTER3 (C3). In this way, a database of 461 perigee events, whichcan be considered as statistically independent, has beenconstructed. All MLT sectors are equally covered.
3.1. Analysis of perigee data
The detection and characterization of (n + 1/2) fce emis-sions near perigee have been performed by combining man-ual and automatic processing steps. In a first step, we haveexamined dynamic spectrograms near perigee, and haveidentified and listed the approximate times of geomagneticequator crossings as indicated by a standard model of mag-netic field. Our visual inspection allows distinguishing andlisting perigee passes with or without (n + 1/2) fce waves. Ithas been useful in particular to examine detailed spectro-grams over passes when WHISPER saturation level isreached, in order to distinguish actual (n + 1/2) fce eventsfrom frequency replica of the saturating signal. As we haveseen in Section 2, this is possible as, generally, not all indi-vidual spectra are affected by saturation during perturbedperigee events, thus these events are taken into account inour statistics. Lastly, we note the number of harmonicbands displaying (n + 1/2) fce emissions.
The series of approximate times at equator crossings, tin,have been used as an input for a second processing step,which performs an automatic analysis of each event withwaves. We make use of a tool, which localizes, in each indi-vidual WHISPER frequency spectrum, the most significantmaxima of signal intensity (Rauch et al., 2006). Frequencypeaks can then be followed over a given time and frequencyinterval. We have chosen to deal with a domain of 10 mintime duration, centerd at tin, and of 0.8 fce frequency width,centerd at 1.5 fce. Inside this time–frequency domain, thetool identifies and follows in time the peak of highest inten-sity. The gyrofrequency fce is derived for each spectrumfrom the magnetic field intensity measured by the FGMinstrument (Balogh et al., 2001). The complete operationis repeated over higher electron gyroharmonic bands. Thelowest frequency band, around 1.5 fce, is always presentwhenever higher harmonics are. A detailed analysis is con-ducted in this specific frequency band, whereby four quan-tities are calculated: the frequency and peak intensity of themain peak, its frequency bandwidth and its energy inte-grated over the frequency bandwidth. Their time variationsare monitored over the 10-min interval. In practice, thepeak is visible (i.e. above noise level) not over the wholeduration of the time interval, but only over a part of it.We note the time and latitude at the two extrema (one ineach hemisphere) between which the peak is visible.Finally, the time when the electric field amplitude reachesits maximal value determines the exact reference time ofthe event, tref.
Observations at perigee are sorted out according tothree event groups.

258 F. El-Lemdani Mazouz et al. / Advances in Space Research 43 (2009) 253–264
� No data: WHISPER is not operational at the time ofperigee crossing; 74 events (16% of the orbits) belongto this category.� No (n + 1/2) fce emissions present near geomagnetic
equator; 123 events (27% of the orbits) belong to thiscategory.� (n + 1/2) fce emissions present near geomagnetic equa-
tor; 264 events (57%) belong to this category. We cansort these equatorial events further, according to twosubclasses, mono-harmonic ones (i. e. only 3/2 fce waves)and multi-harmonic ones. Their relative proportion is,respectively, 18% and 82%.
We can note from this first analysis that the (n + 1/2) fce
waves are a common phenomenon in the equatorial regionaround the perigee altitude of CLUSTER, with a propor-tion of 68% of wave events among all crossings with data.
3.2. Latitudinal dependence
The analysis described above can be directly used tostudy the latitudinal dependence of the (n + 1/2) fce emis-sions. First, we examine latitudes at the times of reference,tref. All 264 events of our database indicate a latitude,obtained with the Tsynanenko and Stern (1996) model,close to 0� (0.2� in average, with a standard deviation of1.5�). Second, we examine the latitudinal extension of theevents, evaluated from the first and last detection of themain peak (belonging to the lowest harmonic band). Thosedetections are, for all events, located inside the [�3�, +4�]latitude interval. Third, we examine how the frequencybandwidth Df at half magnitude (FWHM) of the mainpeak of lowest harmonic band varies with latitude. Thisquantity reaches a maximum value near geomagnetic equa-tor, and behaves similarly in higher harmonic bands: itslargest value occurs at the same latitude than in the lowestband. In addition, the study of the ratios Df/fce indicates atypical value of 70% for the lowest harmonic band, anddecreasing ratio values for higher harmonic bands. Lastly,we analyse the frequency position of the main peak emis-sion, normalized to the local gyrofrequency value, fce. Thisparameter varies significantly with magnetic latitude, cru-dely symmetrically with respect to the true equator position(at maximal intensity). This behaviour could result frompropagation in a spatially non homogenous medium.
In any case, the geomagnetic equator position appearsto be of great importance in the detailed behavior of(n + 1/2) fce waves.
3.3. Magnetic local time dependence
3.3.1. Wave occurrence versus MLT
We concentrate now on the C3 perigee passes with WHIS-PER data (387 passes), analysed as described above. Theoccurrence of (n + 1/2) fce emissions as a function of theMLT sector is displayed in Fig. 2a. Twelve cells of dimension1 RE � 2 h MLT are drawn in polar coordinates. In each cell,
we show in colour code the number of passes with equatorial(n + 1/2) fce emissions, divided by the number of C3 cross-ings (with data available). The cells are centered at 4 RE,which is approximately the geocentric distance of C3 at thetime of geomagnetic equator crossing. Precise positions inR-MLT at equator crossings are indicated by the whitecrosses and black circles corresponding respectively to cross-ings with or without waves. We note that the occurrence ofthe waves is significant, 40% or more, in all MLT sectors.CLUSTER’s orbit configuration in years 2002–2004 appearsthus to be suitable for a statistical study of those waves.Clearly, (n + 1/2)fce emissions are observed with a higherprobability in the dawn sector (03–09 MLT) than in average,and, in contrast, with a lower probability in the dusk sector(16–18 MLT). This result agrees with previous studies (Roe-der and Koons, 1989; Christiansen et al., 1978). Moreover,such a dawn-dusk asymmetry looks roughly like that of theequatorial plasmapause, which leads us to study further apossible relationship between both phenomena. More pre-cisely: are (n + 1/2) fce emissions co-located with a plasma-pause layer? How closely? To evaluate this, we need toestimate the distance between C3 and the plasmapause layer.After discussing the above results in view of a global empir-ical modelled plasmapause, we will use WHISPER propermeasurements of equatorial densities, indicating where thespacecraft crosses the plasmasphere.
3.3.2. Evaluation of CLUSTER distance to plasmapause
The comparison of the position of C3 at perigee withCarpenter’s empirical model of the plasmapause position(Carpenter, 1970), represented in the bottom right of Fig.2a, shows that at the radial distance of 4 RE, the spacecraftis close to the plasmapause on all MLT sectors except forthe bulge (18–23 MLT). In this empirical model (basedon ground based noise whistler signatures), the plasma-pause is identified as a sharp knee in the density radial pro-file, the density jump going typically from 20 to 200 cm�3.A significant part (20– 80 cm�3) of this density jump corre-sponds to a plasma frequency band (40–80 kHz) within theWHISPER frequency range. Each plasmasphere crossingobserved by WHISPER (near CLUSTER perigee) can betranslated in a density profile versus radial distances above4 RE, and thus can be related to a modelled plasmapauseknee. Some of those profiles indicate that the plasmaspherecrossing includes the plasmapause knee, others that theknee is located below CLUSTER perigee. We can hencequalify the empirical position of the plasmapause in eachpass by the value of the equatorial plasma frequency fp-eq.
Values of fp-eq are obtained by visual inspection ofWHISPER perigee spectrograms. This frequency is evalu-ated, near geomagnetic equator crossing, with a precisionof ±5 kHz. One of the seven values (going from 30 to>80 kHz) is assigned: 30 kHz referring to actual fp-eq valuesbetween 25 and 35 kHz, 40 kHz to fp-eq values between 35and 45 kHz and so on, 80 kHz to fp-eq values between 75and 80 kHz. Finally, the value > 80 kHz refers to casesof equatorial plasma frequencies above WHISPER limit.
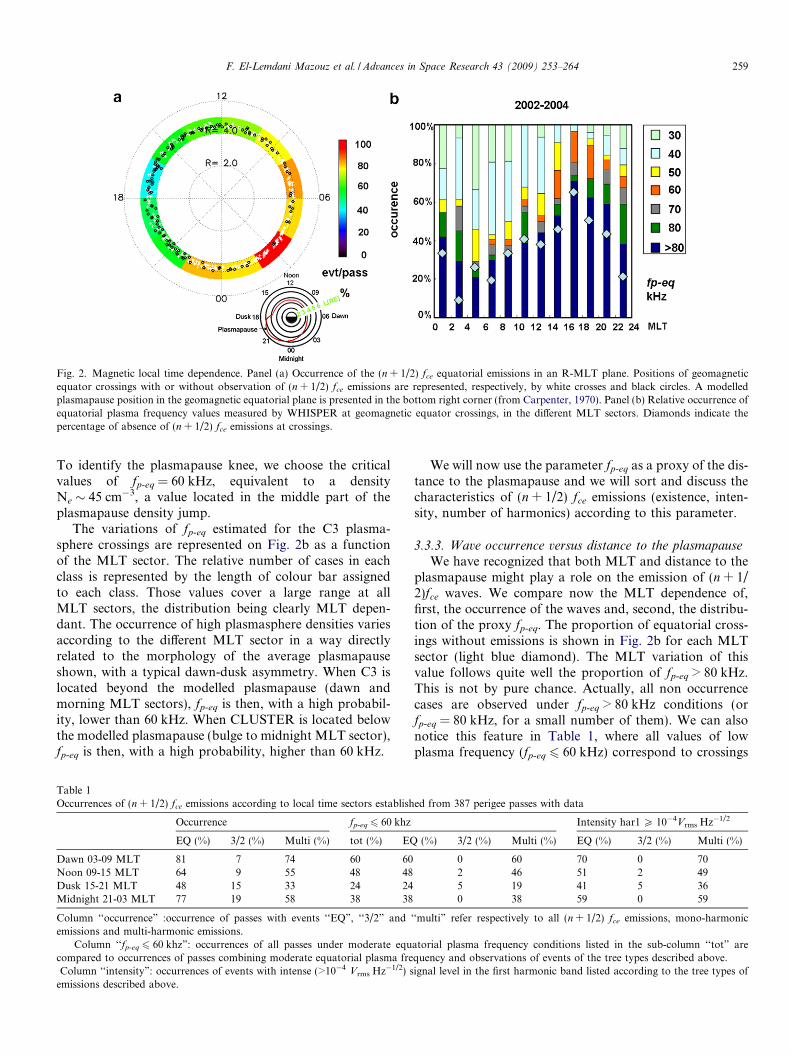
Fig. 2. Magnetic local time dependence. Panel (a) Occurrence of the (n + 1/2) fce equatorial emissions in an R-MLT plane. Positions of geomagneticequator crossings with or without observation of (n + 1/2) fce emissions are represented, respectively, by white crosses and black circles. A modelledplasmapause position in the geomagnetic equatorial plane is presented in the bottom right corner (from Carpenter, 1970). Panel (b) Relative occurrence ofequatorial plasma frequency values measured by WHISPER at geomagnetic equator crossings, in the different MLT sectors. Diamonds indicate thepercentage of absence of (n + 1/2) fce emissions at crossings.
F. El-Lemdani Mazouz et al. / Advances in Space Research 43 (2009) 253–264 259
To identify the plasmapause knee, we choose the criticalvalues of fp-eq = 60 kHz, equivalent to a densityNe � 45 cm�3, a value located in the middle part of theplasmapause density jump.
The variations of fp-eq estimated for the C3 plasma-sphere crossings are represented on Fig. 2b as a functionof the MLT sector. The relative number of cases in eachclass is represented by the length of colour bar assignedto each class. Those values cover a large range at allMLT sectors, the distribution being clearly MLT depen-dant. The occurrence of high plasmasphere densities variesaccording to the different MLT sector in a way directlyrelated to the morphology of the average plasmapauseshown, with a typical dawn-dusk asymmetry. When C3 islocated beyond the modelled plasmapause (dawn andmorning MLT sectors), fp-eq is then, with a high probabil-ity, lower than 60 kHz. When CLUSTER is located belowthe modelled plasmapause (bulge to midnight MLT sector),fp-eq is then, with a high probability, higher than 60 kHz.
Table 1Occurrences of (n + 1/2) fce emissions according to local time sectors establish
Occurrence fp-eq 6 60 khz
EQ (%) 3/2 (%) Multi (%) tot (%) EQ
Dawn 03-09 MLT 81 7 74 60 60Noon 09-15 MLT 64 9 55 48 48Dusk 15-21 MLT 48 15 33 24 24Midnight 21-03 MLT 77 19 58 38 38
Column ‘‘occurrence” :occurrence of passes with events ‘‘EQ”, ‘‘3/2” andemissions and multi-harmonic emissions.
Column ‘‘fp-eq 6 60 khz”: occurrences of all passes under moderate equcompared to occurrences of passes combining moderate equatorial plasma freColumn ‘‘intensity”: occurrences of events with intense (>10�4 Vrms Hz�1/2) s
emissions described above.
We will now use the parameter fp-eq as a proxy of the dis-tance to the plasmapause and we will sort and discuss thecharacteristics of (n + 1/2) fce emissions (existence, inten-sity, number of harmonics) according to this parameter.
3.3.3. Wave occurrence versus distance to the plasmapause
We have recognized that both MLT and distance to theplasmapause might play a role on the emission of (n + 1/2)fce waves. We compare now the MLT dependence of,first, the occurrence of the waves and, second, the distribu-tion of the proxy fp-eq. The proportion of equatorial cross-ings without emissions is shown in Fig. 2b for each MLTsector (light blue diamond). The MLT variation of thisvalue follows quite well the proportion of fp-eq > 80 kHz.This is not by pure chance. Actually, all non occurrencecases are observed under fp-eq > 80 kHz conditions (orfp-eq = 80 kHz, for a small number of them). We can alsonotice this feature in Table 1, where all values of lowplasma frequency (fp-eq 6 60 kHz) correspond to crossings
ed from 387 perigee passes with data
Intensity har1 P 10�4Vrms Hz�1/2
(%) 3/2 (%) Multi (%) EQ (%) 3/2 (%) Multi (%)
0 60 70 0 702 46 51 2 495 19 41 5 360 38 59 0 59
‘‘multi” refer respectively to all (n + 1/2) fce emissions, mono-harmonic
atorial plasma frequency conditions listed in the sub-column ‘‘tot” arequency and observations of events of the tree types described above.ignal level in the first harmonic band listed according to the tree types of

260 F. El-Lemdani Mazouz et al. / Advances in Space Research 43 (2009) 253–264
with observations of (n + 1/2) fce emissions in the differentMLT sectors. Consequently, it seems that high equatorialdensities, meaning that CLUSTER spacecraft is inwardof the plasmapause layer, are unfavorable to (n + 1/2) fce
emissions. We can also observe that the (n + 1/2) fce emis-sions are systematically observed for a large range of valuesof the equatorial plasma frequency, whatever MLT sectorconsidered. More precisely, in the dawn sector we see thatthe high occurrence of the observations correspond to lowvalues of the equatorial plasma frequency (CLUSTER out-ward the plasmapause layer) on most of the cases. In thebulge sector, the low occurrence of observations can beattributed to the high values of fp-eq prevailing in thisregion. Conversely, some cases with wave occurrence areobserved under high plasma frequency conditions, i.e.inward of the plasmapause layer, especially in the night sec-tor, as if the shielding of (n + 1/2) fce emissions by highdensities would be less efficient in the night sector. Thisbehavior could be explained by the higher occurrence ofsmall and local density structures in this part of the outerplasmasphere (Darrouzet et al., 2004). An event studyhas indeed shown that density depletions actually favor thistype of emissions. Another possible explanation is that thisMLT sector is crudely co-located with the plasmasheetinjection boundary of electrons (Horwitz et al., 1986), pos-sibly associated to (n + 1/2) fce emissions.
3.4. Spectral properties versus equatorial densities
The number of harmonics observed by WHISPER for the(n + 1/2) fce emissions varies from one to nine, with a higherproportion of multi-harmonic observations (82% of the totalnumber of equatorial observations). Monotonic (single har-monic) emissions are observed with different proportionsaccording to the MLT sector considered. The highest ratioof monotonic observations versus multi-harmonic observa-tions is found in the dusk sector and the lowest ratio is foundin the dawn sector (see Table 1).
A detailed statistical analysis of the monotonic emissionevents indicates that their presence is regulated by theradial distance to plasmapause (defined by the fp-eq param-eter proxy). All observations fit with the following sce-nario: an observer, moving from the inner plasmaspheretoward the outer region, would first find no equatorialemissions (in the inner plasmapause layer, i.e. atfp-eq P 80 kHz), then monotonic ones (fp-eq at intermediatevalues) then multi-harmonic ones (fp-eq at low values).Indeed, statistically, higher is the value of fp-eq, lower isthe value of the number of harmonics observed. As shownin Table 1, the proportion of fp-eq 6 60 kHz is no more than5% for mono-harmonic emissions, whereas it is 60% formulti-harmonic ones. We can also notice that all plasma-sphere crossings at values of fp-eq 6 60 kHz are associatedwith observations of equatorial events, in most cases ofmulti-harmonic emissions.
Furthermore, using event studies, El-Lemdani Mazouzet al. (2006) have compared observations from the four
spacecraft located at small geocentric distance from eachother. They show that radial distance to plasmapause isindeed a strict regulator of the number of harmonic bandsdisplaying (n + 1/2) fce waves: higher is the radial distance(lower is the fp-eq value), higher is the upper n value of theseries, within the limit (n + 1/2) fce < fp-eq. This finding canbe interpreted by considering that the ratio of warm to coldelectron plasma populations is an important factor of thegeneration mechanism. This ratio increases with radial dis-tance, as the ionospheric plasma source is progressivelysupplemented by plasmasheet source, thus favoring theapparition of a higher number of harmonics.
3.5. Intensity analysis
One of the drivers for studying the intensity of the(n + 1/2) fce emissions is the question mentioned in theintroduction section, related to the origin of diffuse auro-ras: are emissions sufficiently intense to cause particle pre-cipitations? In order to examine the situation fromCLUSTER point of view, we have performed a statisticalanalysis of the measured wave intensity level in the firstharmonic band (generally the most intense one).
To this end, we detect automatically, for each event, thetime and frequency of the main peak of intensity in the firstharmonic band, and record its intensity level. The normal-ized histogram shown in Fig. 3a displays the distribution ofintensities characterizing the events, as a function of theMLT sector of observation. We divide the intensity levelsin five ranges, going from 1.10�7 to 1.10�1Vrms Hz�1/2.The proportion of events with intensity higher than10�4 Vrms Hz�1/2 is around 57% of the total observed equa-torial events. The most intense emissions are present in thedawn sector, where the maximum amount of events withhigh intensity levels (I P 10�4 Vrms Hz�1/2) is about 70%of the total number of events detected in this sector. Theless intense emissions are present in the dusk sector, witha relative number of events with I P 10�4 Vrms Hz�1/2
amounting to about 41%. We can note that a high propor-tion of intense emissions corresponds to a high occurrenceof the events (shown in Fig. 2a).
We can relate the intensity levels of events with theequatorial plasma frequency value, by analyzing in parallelFigs. 2b and 3a. The proportion of events with I P 10�4
Vrms Hz�1/2 increases with the proportion of fp-eq 6 60 kHzin all MLT sectors. Globally, the scatter plot of intensityvalues versus the f
p-eqparameter, displayed in Fig. 3b, indi-
cates a clear anti-correlation between the two quantities ofinterest, as if the intensity would increase with the geocen-tric distance of observation (which globally increases asfp-eq decreases). Furthermore, case events analysis of multi-point measurements at large spacecraft separation indi-cates, systematically, the same behavior (see El-LemdaniMazouz et al., 2006): in a given MLT sector and undergiven geophysical conditions, the intensity of equatorialECH emissions increases with geocentric distance. In paral-

Fig. 3. Analysis of wave intensity. Panel (a) MLT distribution of wave intensities (expressed as the spectral density of a potential difference) at peak ofequatorial 3/2 fce emissions. Panel (b) Distribution of electric field intensities in the different classes of equatorial plasma frequency. Red stars indicatemedian values. Three different background colours underline three plasma frequency domains in which typical spectral behaviors are encountered, aslabelled at the bottom of the figure.
F. El-Lemdani Mazouz et al. / Advances in Space Research 43 (2009) 253–264 261
lel, the number of harmonic bands with emissionsincreases.
Fig. 3b shows a large dispersion in intensity valuesobtained for each assigned value of the equatorial plasmafrequency. This is likely due to different behaviors accord-ing to the MLT sector concerned. Compared occurrencesof large intensities and low equatorial plasma frequenciesversus MLT sectors are summarized in Table 1. When wecompare dawn and dusk MLT sectors, or dawn and noonMLT sectors, the occurrence of large intensities increaseswith the occurrence of low plasma frequencies (as in thegeneral behavior shown in Fig. 3b). An exception appearswhen we compare noon and midnight sectors, as the occur-rence of intensities at I P 10�4 Vrms Hz�1/2 increases from51% (noon sector) to 59% (midnight sector), whereas theoccurrence of fp-eq 6 60 kHz decreases from 48% to 38%.Lastly, Table 1 indicates that the first harmonic band ismore intense for multi-harmonic observations than formonotonic ones, the proportion of intense monotonicemissions being no more than 2% of the total emissionsof high intensity (I P 10�4 Vrms Hz�1/2). The highestoccurrence of intense monotonic observations is observedin the dusk sector.
Thus, we can say that the proximity to the plasmapauseposition plays a role in governing the intensity of thewaves, with an exception in the midnight sector. Such abehavior could be due to a comparatively higher densityratio of warm to cold populations in the sector populatedby the plasmasheet source. The WHISPER sounder is ableto estimate this ratio (Trotignon et al., 2003), but a statis-tical study of this quantity as a function of MLT sector andequatorial density is yet to be done.
Finally, we compare intensities of 3/2 fce emissions esti-mated from the GEOS perspective (Belmont et al., 1983)with intensities obtained from the CLUSTER perspective.The estimation of reference for GEOS is given in Fig. 2of Belmont et al. (1983), i.e. ‘‘the typical wave amplitudeof 1 mV.m�1 was exceeded during 15% of time”. The latterfigure is obtained at L = 6.6, a magnetic latitude of 0�, inthe night side MLT sector (22–6), assuming a 1 kHz wave
bandwidth. The conversion indicated in Eq. (2) leads toan intensity expressed in WHISPER units of I = 2.2510�3 Vrms Hz�1/2 being equivalent to 1 mV m�1, consider-ing in this case a �0.5 kHz bandwidth, a figure correspond-ing to monochromatic waves. Taking account of thedifference in geocentric distances (the minimum waveamplitude goes as L�1/2), the minimum intensity of refer-ence is finally � 3 10�3 Vrms Hz�1/2, a threshold exceededin about 32% of the night side observed events. This resultindicates that the intense 3/2 fce (I P 3 10�3 Vrms Hz�1/2)emissions are observed with higher proportions duringCLUSTER perigee passes in the night side sector compar-ing to GEOS and SCATHA statistical studies. This pro-portion is still insufficient to explain the scattering of hotelectrons, in the frame of theories implying monochromaticwaves, where higher proportions of intense emissions arerequired (Lyons, 1974).
However, the large spectral width of (n + 1/2) fce emis-sions observed in practice (�5 kHz) would increase thisproportion up to more than 50% of the night side eventsindicating that they could indeed play a role in the genera-tion of diffuse auroras.
3.6. Geomagnetic activity influence
In order to study the correlation between the geomag-netic activity and the presence of the equatorial emissions,we analyse the Dst index, characterizing the intensity of thering current, associated to observations. Values of Dst arefollowed in reverse chronology between the time of geo-magnetic equator crossing up to 24 h before. The reasonbehind this proceeding is the following: the plasmasphereresponse to a geomagnetic disturbance is quasi instanta-neous in the night sector, but happens with several hoursdelay in the dayside, since corotation has to propagatethe deformation from the night to noon sector (Decreauet al., 1982; Pierrard and Cabrera, 2005). A delay of 24 his thus a reasonable time interval to follow up variationsof Dst in correlation with observations. We define four dif-ferent classes of activity, each referring to a given Dst range,

Fig. 4. Role of geomagnetic activity. Time evolution of Dst indexassociated with the absence (top) or presence (bottom) of waves at(n + 1/2) fce.
262 F. El-Lemdani Mazouz et al. / Advances in Space Research 43 (2009) 253–264
from quiet geomagnetic activity to disturbed geomagneticactivity. The histograms plotted in Fig. 4 display the rela-tive occurrence of each Dst class measured in each of the24 one hour time intervals preceding the observation. Thevariation of class occurrences with respect to time delaysis shown respectively for equator crossings when we seeequatorial emissions, called EQ (bottom panel), and forthe crossings without equatorial emissions, called non EQ(top panel). We can note that EQ events are observed dur-ing low or moderate geomagnetic conditions (�60 < Dst <0), whereas non EQ events are observed during quiet to lowactivity conditions (�30 < Dst). The distribution over thedifferent activity classes is stable with time delays, exceptfor the non event cases, which displays a higher proportionof quiet conditions for longest delays. The difference ingeomagnetic conditions prevailing respectively for nonevents and for events can be interpreted as follow. Nonevents are preceded by a relatively long period of quiet con-ditions. It is known that under such situation, the plasma-sphere expands towards distances significantly larger thanCLUSTER geocentric distance at equator. Such situationwill drive high equatorial plasma frequencies, screeningthe waves (Section 3.3.3). On the other hand, our analysisshows that EQ events do not require any specific Dst timevariation, like for instance a substorm onset, to be trig-gered. They are observed during a variety of conditions,mostly moderate and likely stable, similar conditions thanthose which prevail during diffuse auroras.
4. Summary and conclusion
The observations described and analysed here are madewith the WHISPER instrument on board the CLUSTERconstellation, when the spacecraft cross the magnetic equa-tor at its perigee, i.e. at a geocentric distance of about 4 RE.
The value of the plasma frequency, fp-eq, measured at geo-magnetic equator crossings indicates if the plasmapauseboundary is located inward (fp-eq > 60 kHz) or outward(fp-eq 6 60 kHz) of the crossing position, and how deepinside or far outside of the plasmapause the satellites are.Statistically, it yields a qualitative estimation of the dis-tance between the observation and the plasmapauseboundary. The CLUSTER orbit gives a good MLT sam-pling and a clear localization of the geomagnetic equator,in contrast with previous studies, affected by gaps in theMLT sector coverage or in the latitude coverage. A 3 yearslong observational period has permitted to conduct ameaningful statistical analysis of the properties of (n + 1/2) fce emissions in function of magnetic latitude, MLT sec-tor and, for the first time, of qualitative distance to theplasmapause boundary. The main results obtained fromthis study can be listed as follows:
(1) WHISPER instrument detects (n + 1/2) fce emissionson all CLUSTER geomagnetic equator crossings,whatever MLT sector considered, under the conditionthat the crossing occurs in the outer plasmasphereregion. Quantitatively, a proportion of 68% of all peri-gee passes is associated with (n + 1/2) fce events, thecondition fp-eq 6 60 kHz insuring that emissions arepresent. Such a phenomenon seems thus to be a perma-nent feature of the outer plasmasphere region, notrestricted to any given MLT sector.
(2) The latitudinal extension of the phenomenon, evalu-ated from measurements of the main emission, i.e.near 3/2 fce, does not vary much from event to event.This extension, defined by the southern and northernlimits of a measurable emission intensity level (at orabove a threshold of 2 10�7 Vrms Hz�1/2) stays withinthe [ � 3� to 4�] magnetic latitude interval.
(3) The number of electron cyclotron harmonic bandswhere (n + 1/2) fce emissions are present is governedby the way CLUSTER crosses the plasmasphere. Itincreases with the radial distance of observation,from zero (no emission) deep inside the plasma-sphere, up to several bands in the outermost part ofthe geomagnetic equator surface explored by CLUS-TER. The single band case is generally observed justinside of a plasmapause layer. In addition, the inten-sity of (n + 1/2) fce emissions is generally decreasingwith the order of the band considered.
(4) The intensity in the main band (near 3/2 fce) is increas-ing with the radial distance of observation (Fig. 3b).Quantitatively, the median value of the intensityincreases from 6 10�6 Vrms Hz�1/2 within the plasma-sphere (when fp-eq is above WHISPER’s frequencyrange) by more than two order of magnitudes higher,i.e. up to 3 10�3 Vrms Hz�1/2 for the class of events cor-responding to the outermost region (fp-eq = 30 kHz).
(5) The MLT sector of observation has a significantinfluence on the occurrence of (n + 1/2) fce emissions(Fig. 2a), as reported in the past. Quantitatively, the

F. El-Lemdani Mazouz et al. / Advances in Space Research 43 (2009) 253–264 263
percentage of geomagnetic equator crossings withwave events observed from CLUSTER varies from90% in the 02–04 MLT sector down to 35% in the16–18 MLT sector. Such behaviour is mainly the con-sequence of the non axi-symmetric shape of theplasmapause boundary, observed here from a fixedradial distance perspective. This affects the MLT dis-tribution of cases placed respectively on each side ofthe plasmapause, hence, according to (3), the distri-bution of events and non events. Nevertheless, theMLT sector exerts a proper influence on wave events:almost no wave events are seen in the dayside whenfp-eq is above WHISPER’s frequency range, whereasa significant number of them is seen under the sameconditions in the night sector. Event studies haveshown that fine density structures, present in thisMLT sector, favour the (n + 1/2) fce emissions.
(6) The MLT sector of observation has a significantinfluence on the intensity of the 3/2fce emission(Fig. 3a). It is not easy to disentangle both influences,of MLT proper and of distance to plasmapause, onthe intensity, since the distribution of the fp-eq param-eter values measured during wave events displays adawn – dusk asymmetry (Fig. 2b) similar to the onedisplayed by the distribution of the wave intensityvalues (Fig. 3a). However, some facts indicate thatMLT has an influence of its own: (i) the occurrenceof intensities at I P 10�4 Vrms Hz�1/2 increases fromnoon to midnight sector, when at the same time theoccurrence of fp-eq 6 60 kHz decreases; (ii) thehighest occurrence of intense monotonic observationscorresponds to the dusk sector.
(7) Lastly, the influence of geomagnetic activity on thepresence of emissions is studied via the variation ofthe Dst index. Results show that the (n + 1/2) fce emis-sions are observed during periods of moderate andstable activity, similar to those prevailing during dif-fuse auroras.
It is important to add that the multipoint capability ofthe CLUSTER mission has been significant in order to testour statistical results concerning the influence of the dis-tance to plasmapause. Data sets of four spacecraft, cross-ing the geomagnetic equator surface at short distancesfrom each other, and within a short-time delay, have beencompared. Multipoint event studies have been able to con-firm the fine role of geocentric distance, revealed for thefirst time by our study, both on the number of electroncyclotron harmonic bands displaying emissions, and onthe wave intensity in the main band.
Concerning the question of the intensity of the emissionsleading to pitch angle diffusion, WHISPER measurementsshow that the highest intensities of the (n + 1/2) fce emis-sions are localized in the dawn sector. Our evaluation ofthe percentage of CLUSTER wave events exceeding thethreshold referred to as necessary to drive a significantpitch angle diffusion is 32%, a factor two higher than what
has been measured from GEOS 2 perspective (Belmont etal., 1983). This fact, combined with the clear increasingof intensity with distance to plasmapause (Fig. 3b) indi-cates that the ‘hottest’ region (where the ECH wave inten-sity is the highest) might be located in between radialdistances of CLUSTER perigee and of GEOS 2, and couldbe indeed sufficient to create diffuse auroras. Further stud-ies, including a larger CLUSTER data set and other datasets (about plasmasheet injections, other geomagneticactivity indices, diffuse aurora observations), could helpto conclude.
Regarding to which generation mechanism is the sourceof (n + 1/2) fce emissions, the limited study described hereprovides a few indications: (i) the emissions are not gener-ated in a plasma regime including the single dense coldelectron population prevailing in the inner plasmasphere;(ii) the exact position in frequency of the peak in intensityvaries within each harmonic band; (iii) it varies in additionwith geomagnetic latitude, together with intensity varia-tion; (iv) specific behaviours are observed, according towhich event is analysed. A fine analysis of wave features,associated to the context found in each event, and to wavelevel estimations, could help to shed a new light on thisquestion.
Acknowledgements
We thank the teams at ESOC (Darmstadt, Germany),JSOC (Oxford, UK) and Department of automatic controland systems engineering, University of Sheffield (UK) fortheir constant support of CLUSTER operations. We wantalso to thank the FGM team (Imperial College, UK) forproviding magnetic field data.
References
Balogh, A., Carr, C.M., Acuna, M.H., et al. The Cluster magnetic fieldinvestigation: overview of in-flight performance and initial results.Ann. Geophys. 19, 1207–1217, 2001.
Beghin, C., Decreau, P.M.E., Pickett, J., et al. Modeling of CLUSTER’selectric antennas in space: application to plasma diagnostics. RadioSci. 40, 1–18, 2005.
Belmont, G., Fontaine, D., Canu, P. Are equatorial electron cyclotronwaves responsible for diffusive auroral electron precipitation? J.Geophys. Res. 88, 9163–9170, 1983.
Bernstein, I.B. Waves in a plasma in a magnetic field. Phys. Rev. 109, 10–21, 1958.
Canu, P., Decreau, P.M.E., Trotignon, J.G., et al. Identification of naturalplasma emissions observed close to the plasmapause by the Cluster-Whisper relaxation sounder. Ann. Geophys. 19, 1697–1709, 2001.
Carpenter, D.L. Whistler evidence of the dynamic behavior of theduskside bulge in the plasmasphere. J. Geophys. Res. 75, 3837–3847,1970.
Carpenter, D.L., Lemaire, J. The plasmasphere boundary layer. Ann.Geophys. 22, 4291–4298, 2004.
Christiansen, P.J., Gough, M.P., Martelli, G., et al. GEOS-1 observationsof electrostatic waves and their relationship with plasma parameters.Space Sci. Rev. 22, 383–400, 1978.
Darrouzet, F., Decreau, P.M.E., De Keyser, J., et al. Density structuresinside the plasmasphere: cluster observations. Ann. Geophys. 22,2577–2585, 2004.

264 F. El-Lemdani Mazouz et al. / Advances in Space Research 43 (2009) 253–264
Darrouzet, F., De Keyser, J., Decreau, P.M.E., et al. Spatial gradients inthe plasmasphere from cluster. Geophys. Res. Let. 33, L08105, 2006.
De Keyser, J., Darrouzet, F., Dunlop, M.W., et al. Least-square gradientcalculation from multi-point observations of scalar and vector fields:methodology and applications with cluster in the plasmasphere. Ann.Geophys. 25, 971–987, 2007.
Decreau, P.M.E., Beghin, C., Parrot, M. Global characteristics of the coldplasma in the equatorial plasmapause region, as deduced from theGEOS 1 Mutual Impedance Experiment. J. Geophys. Res. 87, 695–712, 1982.
Decreau, P.M.E., Fergeau, P., Krasnoselskikh, V., et al. Whisper, aresonance sounder and wave analyser: performances and perspectivesfor the CLUSTER mission. Space Sci. Rev. 79, 157–193, 1997.
Decreau, P.M.E., Fergeau, P., Krasnoselskikh, V., et al. Early results fromthe Whisper instrument on CLUSTER: an overview. Ann. Geophys.19, 1241–1258, 2001.
El-Lemdani Mazouz, F., Grimald, S., Rauch, J.L., et al. Electrostatic andelectromagnetic emissions near the plasmasphere. A case event: 27May 2003, in: Proceedings of the Cluster and Double Star Symposium– 5th Anniversary of Cluster in Space, Noordwijk, The Netherlands,19–23 September 2005, ESA SP-598, 2006.
Escoubet, C.P., Russell, C.T., Schmidt, R. The Cluster and PhoenixMissions. Kluwer Academic Publishers, Dordrecht, The Netherlands,658 pp., 1997.
Fontaine, D., Perraut, S., Cornilleau-Wehrlin, N., et al. Coordinatedobservations of electron energy spectra and electrostatic cyclotronwaves during diffuse auroras. Ann. Geophys. 4, 405–412, 1986.
Gough, M.P., Christiansen, P.J., Martelli, G., et al. Interaction ofelectrostatic waves with warm electrons at the geomagnetic equator.Nature 279, 515–517, 1979.
Gough, M.P., Christiansen, P.J., Gershuny, E.J.E.S. Wave morphologynear the geostationary orbit. Adv. Space Res. 1, 337–343, 1981.
Gustafsson, G., Bostrom, R., Holback, B., et al. The electric field andwave experiment for the Cluster mission. Space Sci. Rev. 79, 137–156,1997.
Horne, R.B., Thorne, R.M., Meredith, N.P., et al. Diffuse auroral electronscattering by electron cyclotron harmonics and whistler mode wavesduring an isolated substorm. J. Geophys. Res. 108, 1290–1302, 2003.
Horwitz, J.L., Menteer, S., Turnley, J., et al. Plasma boundaries in theinner magnetosphere. J. Geophys. Res. 91, 8861–8882, 1986.
Hubbard, R.F., Birmingham, T.J. Electrostatic emissions between elec-tron gyroharmonics in the outer magnetosphere. J. Geophys. Res. 83,4837–4850, 1978.
Hubbard, R.F., Birmingham, T.J., Hones Jr., E.W. Magnetosphericelectrostatic emissions and cold plasma densities. J. Geophys. Res. 84,5828–5838, 1979.
Kennel, C.F., Scarf, F.V., Fredricks, R.W., et al. VLF electric fieldobservations in the magnetosphere. J. Geophys. Res. 75, 6136–6149,1970.
Kennel, C.F. and Ashour-Abdalla, M. Electrostatic waves and the strongdiffusion of magnetospheric electrons. In Magnetospheric plasmaphysics edited by A. Nishida, 245 pp., D. Reidel, Hingham, Mass.,1982.
Koons, H.C., Fennell, J.F. Fine structure in electrostatic emission bandsbetween electron gyrofrequency harmonics (from magnetosphericobservations). J. Geophys. Res. 89, 3015–3018, 1984.
Krafft, C., Matthieussent, G., Thevenet, P., et al. Simultaneous emissionsat nxc and (n + 1/2)xc in space and laboratory plasmas. J. Geophys.Res. 97, 14977–14987, 1992.
Kurth, W.S., Gurnett, D.A. Plasma waves in planetary magnetospheres. J.Geophys. Res. 96, 18977–18991, 1991.
Lyons, L.R. Electron diffusion driven by magnetospheric electrostaticwaves. J. Geophys. Res. 79, 575–580, 1974.
Olsen, R.C., Shawhan, S.D., Gallagher, D.L., et al. Plasma observationsat the Earth’s magnetic equator. J. Geophys. Res. 92, 2385–2407, 1987.
Paranicas, C., Hughes, W.J., Singer, H.J., et al. Banded electrostaticemissions observed by the CRRES plasma wave experiment. J.Geophys. Res. 97, 13889–13898, 1992.
Parrot, M., Santolik, O., Cornilleau-Wehrlin, N., et al. Source location ofchorus emissions observed by Cluster. Ann. Geophys. 21, 473–480,2003.
Pierrard, V., Cabrera, J. Comparison between EUV/IMAGE observationsand numerical simulations of the plasmapause formation. Ann.Geophys. 23, 2635–2646, 2005.
Rauch, J.L., Suraud, X., Decreau, P.M.E., et al. Automatic determinationof the plasma frequency using image processing on whisper data, in:Proceedings of the Cluster and Double Star Symposium – 5thAnniversary of Cluster in Space, Noordwijk, The Netherlands, 19-23September 2005, ESA SP-598, 2006.
Roeder, J.L., Koons, H.C. Survey of electron cyclotron waves in themagnetosphere and the diffuse auroral electron precipitation. J.Geophys. Res. 94, 2529–2541, 1989.
Trotignon, J.G., Decreau, P.M.E., Rauch, J.L., et al. The whisperrelaxation sounder onboard cluster: a powerful tool for spaceplasma diagnosis around the Earth. Cosmic Res. 41 (4), 369–372,2003.
Tsynanenko, N.A., Stern, D.P. Modeling the global field of the large-scale Birkeland current system. J. Geophys. Res. 101, 27187–27198,1996.
Usui, H., Matsumoto, H., Mukai, T., et al. GEOTAIL observation ofelectron cyclotron harmonic waves near the dayside magnetopause.Adv. Space Res. 24, 99–102, 1999.