A North Atlantic Geographical Information System: Mapping Social Coasts over Time and Space
26
A North Atlantic Geographical Information System: Mapping Social Coasts over Time and Space Charles Travis & Poul Holm Trinity College Dublin
Transcript of A North Atlantic Geographical Information System: Mapping Social Coasts over Time and Space

A North Atlantic Geographical Information System:
Mapping Social Coasts over Time and Space
Charles Travis & Poul Holm Trinity College
Dublin

HMGIS
• To map perceptions, representations, and responses to the fish revolution (1400-1700) a Historical Marine Geographical Information System will be built to: – Investigate the importance of international maritime
connections, which transcend national historical inquiries; – Undertake a review of historical archives and travelogues
to refine our understanding of the interconnectedness of the North Atlantic fisheries.
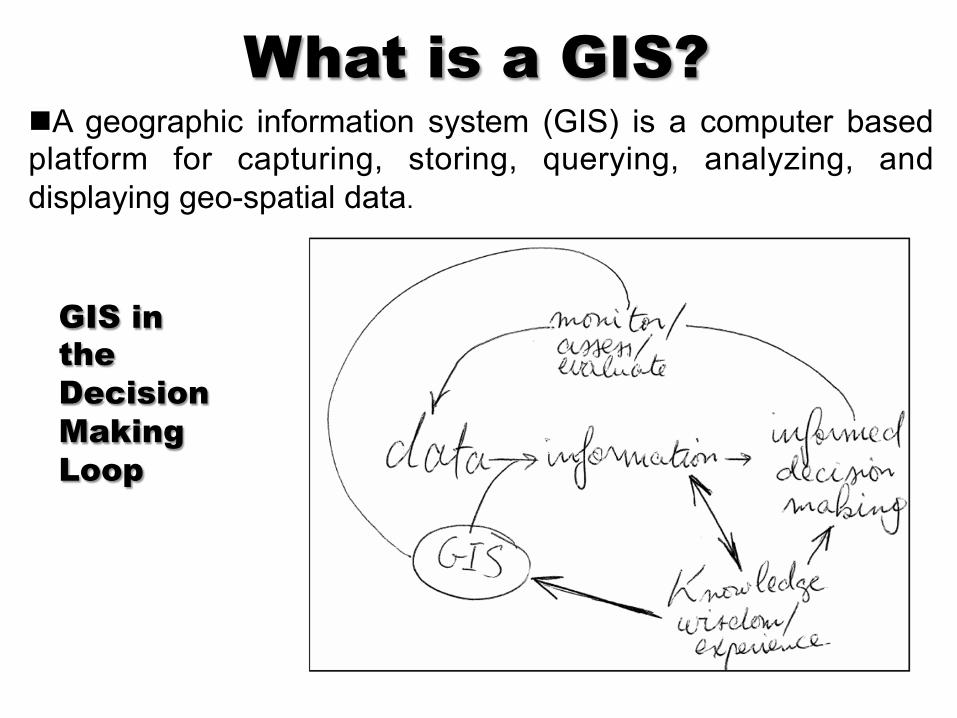
What is a GIS? n A geographic information system (GIS) is a computer based platform for capturing, storing, querying, analyzing, and displaying geo-spatial data.
GIS in the Decision Making Loop

In GIS, spatial data are represented as separate layers. Each layer contains spatial information about a particular type of feature. Features are linked to their geographic location, position and projection. Layers are visualized in Vector or Raster formats.
Image source: http://dpi.vic.gov.au
Concept of Layers
4

5
GIS Raster Data Model
GIS Vector Data Model

GIS Relational Database Vector Model
6

7
GIS as Database Visualizer

8
GIS as a Time-Space Modeller
Shuttle Radar Topography Mission

NorFishGIS Approach
• A satisfactory interpretation of the Fish Revolution must assess the relative importance of abiotic and biotic as well as human variables.
• While most of these factors would have been considered
unknowable 10 or 15 years ago, the breakthroughs in marine environmental history and historical ecology have moved them into the field of the knowable.
• These have not yet been subject to the systematic
interrogation that Mixed-Methods GIS and Digital Humanities methodologies and applications can offer.
.

Identifying Evidence and GIS Data Sources
• The Medieval and Early Modern maritime world of the North Atlantic is documented by a wealth of textual, archival, cartographic and archaeological data concerning the historical and social dimensions of ports and coastal communities (Holm, 2014)
• There is a host of landings and price series, travelogues,
correspondence, and fisheries-related documentation that have been transcribed and published in the public domain;
• Spatial analysis will be employed as a research tool on a variety of historical sources, spanning a wide chronological and thematic range

• Konrad Gesner’s contemporaneous compendium of sea fauna in the mid-sixteenth century;
• Poulsen’s (2008) study of the Dutch herring industry shows
the potential of extensive Dutch landings records of the seventeenth century;
• (Holm et al. 1996 and Starkey et al. 2009) English, French,
Spanish, German, Norwegian and Danish information; • Price data are available both in print (e.g. Bauernfeind
1993) and online (Medieval and Early Modern Data Bank)
Potential GIS Data Sources

Potential Sources & Models for HMGIS
• HMGIS models will be informed by large-scale multinational collaborative databases – Richard Hakluyt’s ‘Principal Navigations’ and the
Hakluyt Society’s Online Collections – Sound Toll Records – Medieval and Early Modern Data Bank – The Trans-Atlantic Slave Trade Database – Trading Consequences database which enables
historically traded volumes of commodities to be filtered by geographical location.

1. Gulf of Maine 2. Newfoundland / Grand Banks 3. Icelandic cod 4. North Norwegian 5. Dutch herring 6. Danish herring 7. English, Irish, Spanish French, Portuguese

Map of North Pole Willem Barentsz (1598)
Netherlands

Mixed Methods / Mixed Platforms
• Quantitative and Qualitative GIS; • Integrating multiple forms of knowledge; • Repositioning GIS away from solely positivistic frame-
work; • Marine / Fishery GIS and Historical / Archaeological GIS; • Spatial Statistics and ‘Sense of Place’; • Dynamic visualization of agency, network analysis, flows
and time; and, • Proprietary GIS (Esri ArcGIS) and Opensource (Google
Earth, QGIS, etc.)
15

16
Adapted from: MacDonald and Black 2000, 510. (From Ian Gregory: A Place in History: A Guide to Using GIS in Historical Research (2002); Ude Shankar: 2008.
§ Landing records § Price data § Consumption patterns § Urban and rural fishing
settlements § Investments and political behavior § International trade records § Abiotic and biotic conditions
during the period (hindcasting) § Digitized historical terrestrial &
nautical cartography § Ship log data, etc. § Archival material

Qualitative GIS Methodology • CAQDA (computer aided qualitative data analysis) and
GIS visualization greatly facilitates the task of identifying and interpreting the attitudes, events, and narrative patterns contained in archival documents. 1. Text recognition (transforming documents into
searchable formats); 2. Units of Evidence: ports, witnesses, records,
archeological data, etc.; 3. Word frequencies / Key words; and, 4. Text codes / Geocodes.
(Schwartz, 2015)

§ Witness Estimates of Fish stocks at UK fishing sites, 1893-1894
§ Report from the select commi t tee on sea fisheries
§ House of Commons Parliamentary Papers
(Schwartz: 2014)
CAQDA GIS

“HINDCASTING”
§ Re-creation of Pabuç Burnu journey, circa 300 B.C. (Leidwanger: 2013)
§ Mean wind speed estimate
raster (using Inverse Distance Weighing in GIS)
§ Sourced from 2001-2009 coastal readings and Wave Atlas of The Mediterranean Sea (2004)

§ Maps of His tor ica l Kingdoms in Southern Asia
§ Associated trade routes,
and other information
§ Constructed as geo-registered layers by time in Google Earth
(Blundell & Zernecke: 2014)
Open-Source Google Earth
ELECTRONIC CULTURAL ATLAS INITIATIVE EARLY AUSTRONESIAN HISTORICAL VOYAGING
IN MONSOON ASIA

21
Hiberniae Delineatio (1685) Ballybetagh Boundaries
William Pe;y (1623 – 1687)
Historical Data Visualization

22
Books of Survey and Distribution 1676-78

23

24

Portugal by Waghenaer (1584). The publication of Waghenaer's De Spieghel der Zeevaerdt (1584) is widely considered as one of the most important developments in the history of
nautical cartography.

Conclusion: Aim of the NorFish GIS
a) Create a series of geo-databases to store North Atlantic fishery and maritime information (landings, prices and indices of CPUE, climate and ecosystem productivity), collected in the first and second steps of the project.
b) Create terrestrial / bathymetric, sealife and human agent based models sourced from fishery and maritime geo-databases, digitized historical cartography and pre-and-early modern archaeological settlement studies.
c) Visualize integrated North Atlantic fishery / maritime geo-data and terrestrial/bathymetric agent-based models in an open-source geographical information and timeline software digital atlas platform.