THE GEOGRAPHICAL JOURNAL OF NEPAL - Central ...
190
Volume 14 March 2021 THE GEOGRAPHICAL JOURNAL OF NEPAL THE GEOGRAPHICAL JOURNAL OF NEPAL Central Department of Geography Faculty of Humanies and Social Sciences Tribhuvan University Kirpur, Kathmandu, Nepal Central Department of Geography Faculty of Humanies and Social Sciences Tribhuvan University Kirpur, Kathmandu, Nepal Volume 14 March 2021 THE GEOGRAPHICAL JOURNAL OF NEPAL Volume 14 March 2021 ISSN 0259-0948 (Print) ISSN 2565-4993 (Online) Assessment of urban heat island in Kathmandu valley (1999-2017) Dipendra Salami Magar, Ramesh Kumar Salami Magar, Chhabi Lal Chidi DOI: hps://doi.org/10.3126/gjn.v14i0.35544 What is an instuon? An ontological debate illustrang community forestry of Nepal Dilli Prasad Poudel DOI: hps://doi.org/10.3126/gjn.v14i0.35547 Assessment of denudaon rate and erosion suscepbility in the upper Tamakoshi basin in the higher Himalayas, Nepal Niroj Timalsina, Molal Ghimire DOI: hps://doi.org/10.3126/gjn.v14i0.35548 Territorial mobility in tradional sociees of Bhojpur, Majhkirant Dhyanendra Bahadur Rai, Bhim Prasad Subedi, Hriday Lal Koirala DOI: hps://doi.org/10.3126/gjn.v14i0.35552 Policy issues in informal market place and markeng system in Nepal: Experiences from the cies of Kathmandu Valley Puspa Sharma DOI: hps://doi.org/10.3126/gjn.v14i0.35555 Impact of vegetable farming on farmers livelihood paerns in Dhankuta, Nepal Kishor Bhandari, and Basanta Paudel DOI: hps://doi.org/10.3126/gjn.v14i0.35556 Assessment of climate change vulnerability in Chi area of Lamjung district, Nepal Sher Bahadur Gurung DOI: hps://doi.org/10.3126/gjn.v14i0.35557 People, place, and space: Theorecal and empirical reflecons in studying urban open space Krishna Prasad Timalsina DOI: hps://doi.org/10.3126/gjn.v14i0.35558
-
Upload
khangminh22 -
Category
Documents
-
view
3 -
download
0
Transcript of THE GEOGRAPHICAL JOURNAL OF NEPAL - Central ...

Volume 14 March 2021
THE GEOGRAPHICALJOURNAL OF NEPAL
THE GEOGRAPHICALJOURNAL OF NEPAL
Central Department of GeographyFaculty of Humanities and Social Sciences
Tribhuvan UniversityKirtipur, Kathmandu, Nepal
Central Department of GeographyFaculty of Humanities and Social Sciences
Tribhuvan UniversityKirtipur, Kathmandu, Nepal
Volume 14 March 2021 THE GEOGRAPHICAL JO
URNAL O
F NEPAL Volum
e 14 March 2021
ISSN 0259-0948 (Print)ISSN 2565-4993 (Online)
Assessment of urban heat island in Kathmandu valley (1999-2017)Dipendra Salami Magar, Ramesh Kumar Salami Magar, Chhabi Lal ChidiDOI: https://doi.org/10.3126/gjn.v14i0.35544
What is an institution? An ontological debate illustrating community forestry of NepalDilli Prasad Poudel DOI: https://doi.org/10.3126/gjn.v14i0.35547
Assessment of denudation rate and erosion susceptibility in the upper Tamakoshi basin in the higher Himalayas, NepalNiroj Timalsina, Motilal GhimireDOI: https://doi.org/10.3126/gjn.v14i0.35548
Territorial mobility in traditional societies of Bhojpur, MajhkirantDhyanendra Bahadur Rai, Bhim Prasad Subedi, Hriday Lal KoiralaDOI: https://doi.org/10.3126/gjn.v14i0.35552
Policy issues in informal market place and marketing system in Nepal: Experiences from the cities of Kathmandu ValleyPuspa SharmaDOI: https://doi.org/10.3126/gjn.v14i0.35555
Impact of vegetable farming on farmers livelihood patterns in Dhankuta, NepalKishor Bhandari, and Basanta PaudelDOI: https://doi.org/10.3126/gjn.v14i0.35556
Assessment of climate change vulnerability in Chiti area of Lamjung district, NepalSher Bahadur GurungDOI: https://doi.org/10.3126/gjn.v14i0.35557
People, place, and space: Theoretical and empirical reflections in studying urban open spaceKrishna Prasad TimalsinaDOI: https://doi.org/10.3126/gjn.v14i0.35558

About the journalThe Geographical Journal of Nepal is an annual publication of the Central Department of Geography (CDG), Tribhuvan University (TU), Nepal. It is the ONE STAR journal rated by AJOL/INASP Journal Publishing Practices and Standards (https://www.nepjol.info/index.php/index). The CDG, located in the University Campus, Kirtipur is one of the leading Departments of Tribhuvan University. CDG is one of the seven central departments established with the establishment of Tribhuvan University in 1959. Since then, it has been actively serving the country in higher education and research.
The Geographical Journal of Nepal is designed to stimulate scholars by providing them a platform for contributing in the field of geography. It welcomes articles, research papers, and book reviews with focus on themes of geographical significance. The paper should be well researched and documented, and clearly described methodology, results based on sound facts, scientific procedures and well-founded arguments; be embedded in the relevant national or international debate; refer to the most recent academic literature on the issues discussed; be presented in a clearly structured and comprehensible manner within the given format.
The history of The Geographical Journal of Nepal dates back to 1978 when the first volume was published with six papers and Mr. Chandra Bahadur Shrestha, Dr. Mangal Siddhi Manandhar and Dr. Bal Kumar K.C. were the executive editors. The same editors continued for volume 2 in 1979 and volume 3-4 in 1980-81. Volume 5 of the journal came into existence only in 1996 with seven papers and Dr. Mangal Siddhi Manandhar as the chief editor together with Dr. Chandra Bahadur Shrestha, Dr. Soorya Lal Amatya, Dr. Nanda Gopal Ranjitkar and Dr. Bhim Prasad Subedi as the editors. However, it took a long time for volume 6 of the journal that came in 2008 with Dr. Bhim P. Subedi as the chief editor and Dr. Pushkar K. Pradhan, Dr. Padma C. Poudel, Dr. Narendra R. Khanal, Dr. Hriday L. Koirala and Mr. Prem S. Chapagain as the members of the editorial board. The consecutive volumes 7 and 8-9 were published in 2009 and 2010-2011 with Dr. Pushkar K. Pradhan as the chief editor together with Dr. Narendra R. Khanal and Dr. Hriday L. Koirala as editors. The volume 10 was delayed that only published in March 2017 with Dr. Narendra R. Khanal as the chief editor together with Dr. Pushkar K. Pradhan, Dr. Bhim P. Subedi, Dr. Hriday L. Koirala and Dr. Pashupati Nepal as editors. The same team including Dr. Umesh K. Mandal published volume 11 in next year 2018. The volume 12 was published in 2019 with Dr. Hriday L. Koirala as the chief editor together with Dr. Pashupati Nepal, Dr. Umesh K. Mandal and Dr. Shobha Shrestha as editors.
From the volume 13 in 2020 onwards, The Geographical Journal of Nepal has been credited to honour Dr. Narendra R. Khanal from Nepal, Dr. Abani K. Bhagabati from India and Dr. Donhhong Xiong from P. R. China as the editors together with Dr. Pashupati Nepal, and Dr. Shobha Shrestha as editors as well as Dr. Hriday L. Koirala as the chief editor..
Guidelines and instructions for authorsAuthors are expected to submit the original papers in clear and concise English. Papers should be written in the third person and impersonal style. Maximum length of paper should not exceed 30,000 characters including spaces (excluding the references). Abstracts should not exceed 300 words (one paragraph only) together with 4 to 6 Keywords. All measurements should be in metric units (SI units), or state metric equivalents. Words in other than English language should be in italics. Citation in the text and list of reference should be in American Psychological Association (APA) style. Entries of the references should be in alphabetical and chronological order of authors (DOI preferred). The manuscript must be in 12 point font in Times New Roman, with margins of at least 1 inch and with an initial capital letter for any proper noun.
All authors should appear with their full names, affiliations and email addresses. One author should be identified as the corresponding author. The manuscript should contain introduction to conclusion and the list of references. Equations, figures and tables must be referred to in the text in numerical order. Footnotes and endnotes are not entertained. The figures are published in gray scale and make sure the lines and shades used in the figure are distinctly visible. The number of figure and table must not exceed 7.
All contributors must assume full responsibility for the contents and opinions expressed in their writings. Before submission of a manuscript, the corresponding author must ensure that all co-authors have seen the version of the paper that will be submitted. Plagiarism will not be tolerated.
Review processesThe Geographical Journal of Nepal is a double blind peer-reviewed journal. The review criteria for the acceptance of the article are whether the paper is a unique/important and useful contribution to the relevant national/international debate; effectively communicate ideas and concept; the content is technically correct with the general statement adequately referred and cited; conclusions are derived based on the results and discussion appeared in the paper.
All the submitted manuscripts are screened by the editorial board at first and are sent to two independent experts in concerned field of specialization for review process. A standard guideline based on the review criteria mentioned above will be circulated to the reviewer with three options for the decision i) accepted unconditionally, ii) accepted after revisions, and iii) rejected. Those manuscripts which are marked as accepted after revisions are sent again to the corresponding author for improvement with addressing all the comments and suggestions made by the peer reviewers. The editorial board of the journal will check the revised version of the manuscript and may ask corresponding author again to make necessary modifications. The manuscripts which fulfill the processes and found OK are accepted for publication in the journal. The manuscripts marked as rejected by any one of the reviewer will be rejected by the editorial board for the publication and authors will be informed. The submitted articles if not published in the journal will not be returned to the author.

1
The Geographical Journal of NepalVol. 14: 1-20, 2021DOI: https://doi.org/10.3126/gjn.v14i0.35544Central Department of Geography, Tribhuvan University, Kathmandu, Nepal
Assessment of urban heat island in Kathmandu valley (1999-2017)
Dipendra Salami Magar1, Ramesh Kumar Salami Magar1, Chhabi Lal Chidi1*
1Central Department of Geography, Tribhuvan University, Kathmandu*Corresponding author: [email protected]
Received: 03 October, 2020; Accepted: 28 October, 2020; Published: March 2021
AbstractGrowing urbanization results built up surfaces converting from agriculture land, forest and other natural land cover surfaces. Increasing built up surfaces, means of transport and industrial activities are major results for increasing temperature in the city area as compared to other areas. Increasing heat is a concern to human health of the people living in urban areas. Increasing temperature in the city area in developing countries is being a growing concern. Kathmandu Valley is one of the most rapidly growing urbanized region in Nepal. The present study aims to assess the changing Land Surface Temperature (LST) in Kathmandu valley using LANDSAT 7 images. Similarly, Urban Heat Island (UHI) effect was evaluated in land use categories which were derived from Google Earth images. Study revealed that built up area contributed highly to increase land surface temperature. New built up with compact settlement area has higher land surface temperature as compare to other land use/land cover surfaces. City core has higher LST as compared to less urbanized and surrounding parts. The LST has highly increased during 1999 to 2017 with increasing urbanization. However, the ecological condition of UHI effect is not so bad till date but the study result indicated the continuous increasing urbanization may result worse ecological condition in Kathmandu Valley in the future.
Keywords: Ecological condition; land surface temperature; urban heat island, urbanization
IntroductionMost of the large cities in the world have higher temperature at the center of the city as compared to its surrounding areas is known as Urban Heat Island (UHI) (Adinna et al., 2009; Nuruzzaman, 2015). Dense built-up areas, concrete zones and high concentration

2
Dipendra Salami, Ramesh Kumar, Chhabi Lal / Assessment of urban ...Vol. 14: 1-20, 2021
of anthropogenic activities lead to the development of urban micro-climates which is associated to generate UHI. Extensive urbanization transforms the land use/land cover (LULC) modifying the energy balance, which makes cities warmer than their hinterland and surroundings. Urban growth is characterized by the transformation of natural land use/land cover into artificial human induced built up surfaces and concentration of population activities. These transformations cause the depletion the proportion of greenery and subsequent increase of impervious surface and causes structural shift of employment from primary to tertiary activities. Increasing industrialization and transport activities add to greenhouse gases in the atmosphere and they also absorb the outgoing terrestrial long wave radiation and contribute to increase temperature in the city. Thus, the city center is heated up leading to the creation of UHI (Grover and Singh, 2015). Thus, growing urbanization has adverse effect on land surface properties with their thermal capacity. Increasing potential thermal storage creates UHI effect in the city center and its effect decreases to outer side (Stewart and Oke, 2012). As UHI emerges, through the modification of land surface characteristics in favor of heat storage, heat trapping and anthropogenic heat release which is being a growing concern of environmental risk (Grimmond, 2007; Li et al., 2020). Growing heat degrades air quality influencing local climate and increase ground level ozone production, which effects on quality of life (Lo and Quattrochi, 2003). Urban population is growing in the world and more than half of the total populations live in urban area and its increasing rate will continue until 2050 (Leeson, 2018; United Nations, 2014). At present, ninety percent increase of world urban population is in the developing countries. There are rapid changes in the urban environment as a result of urban growth among which urban climate particularly rapid increase in temperature under the city area creating UHI as compared to its surrounding areas (Alfraihat, et al., 2016). The UHI affects urban quality of life through the impact on human health, ecosystem function and local weather and climate (Wienert and Kuttler, 2005). Therefore, the issue of UHI is being a crucial issue in various disciplines whether they are natural or social sciences because of the multiple implications on climatic system and human welfare (Gao et al., 2019). Remote sensing technology has made possible to monitoring UHI creation of urban areas more efficiently and cost effective due to freely available thermal images (Jeevalakshami et al., 2017) and its application is growing with urbanization process in the world.
Nepal is a developing country where the urbanization process is very fast. In the last few decades, Kathmandu valley is the largest and fastest growing city. Some studies have revealed the factors causing the creation of UHI in Kathmandu city. Nepal is mountainous country and Kathmandu valley is in the middle hill having high elevation differences with an effect on lapse rate of temperature but past studies has neglected this aspect. The main city area lies in the low altitude valley floor surrounded by higher

3
Dipendra Salami, Ramesh Kumar, Chhabi Lal / Assessment of urban ...Vol. 14: 1-20, 2021
hill. Lapse rate is the decreasing temperature with increasing altitude (Kattel et al., 2013). Thus, temperature generally decreases in the surrounding areas of foot hills and hill slope as compared to lowland city area. Thus, it should be clear that the increasing temperature in the valley floor (city area) is due to the effect of lapse rate because of elevation change or due to the urbanization. Therefore, there is urgent need of studies to identify and address the change by lapse rate and/or heat created by urbanization. In this context, the present study aimed to assess the real situation of UHI in Kathmandu valley due to urbanization process during 1999 to 2017.
The study area
The total area of Kathmandu valley is 670 km². The geographical extension is 27°32'13"N to 27°49'10"N latitude and 85°11'31" E to 85°31'38" E longitude. This valley includes whole area of Kathmandu and Bhaktapur districts and northern part of Lalitpur district. The elevation ranges from 1095 m to 2785 m from the average mean sea level. The average elevation of valley plain is 1300 m.
Figure 1: The study area (Kathmandu Valley)

4
Kathmandu valley is surrounded by high hills composed of schist, gneiss and granitic rock in the north and slightly metamorphosed sedimentary rocks in the south, east and west. Lacustrine soil is common in the lowland areas of the valley because this valley was developed due to the drying up of a lake. Sandy and red soils are prevalent in the hillsides. Most part of the valley is under the warm temperate climatic region and some higher surrounding hills are under cool temperate. Average temperature ranges from 3ºc in winter to 30ºc in summer hot season. The average rainfall is 1500 mm in which 80% of them fall in summer monsoon season (DHM, 2015).
Kathmandu is the largest city and the capital city of Nepal. Most of the central level government headquarters, and commercial centers of the country are located in the valley. It has different heritage sites. Kathmandu valley occupies less than one percent of the total area of the country but it has 31% urban population of Nepal. Urban growth of valley accelerated since 1980 and growth rate was quite high during 1990 decade (Subedi, 2014). The annual growth rate of population in Kathmandu valley was 4.34% and 4.87 during 1991 to 2001 and 2001 to 2011 respectively. The built-up area was 5.1% in Kathmandu Valley in 1989 and reached 26.06% in 2016 (Ishtiaque et al., 2017), which is quite higher than four times increase built-up area during this period.
Methods and materialsMethodology consists of two major steps to fulfill the objectives of the study. One is land use/land cover area extraction and another is computation of LST and UHI. Land use and land cover data was derived by digitized from Google Earth image. LST was derived from satellite image and UHI was derived from LST data. Finally, spatial variability of LST and UHI were analyzed to derive conclusion. The concise process flow of methods has been given in figure 2.
Figure 2: Workflow of the study
Dipendra Salami, Ramesh Kumar, Chhabi Lal / Assessment of urban ...Vol. 14: 1-20, 2021

5
Data source
Topographic map, remote sensing image and Google Earth images were major data sources of the study. Topographic map of scale 1:25000 of Kathmandu valley was collected from Survey Department of Nepal, which was used to derive boundary of Kathmandu valley. Google earth image was used to derive land use data, identify the location and area for field observation. SRTM Digital Elevation Model (DEM) data of 90 m spatial resolution that are freely available in website http://srtm.csi.cgiar.org/srtmdata was used to calculate altitude of land surface where land surface temperatures were calculated. LANDSAT 7 images of 1999 and 2017 are freely available in website https://earthexplorer.usgs.gov. These data were processed by NASA to generate radiometric and atmospheric correction algorithms to the Level 1 products. The further description of LANDSAT 7 data has been given in Table 1.
Table 1: Description of LANDSAT image
Image name Acquired date Time Path/Row ProjectionLandsat7 1999/11/04 04:41:12 141/041 WGS 84UTM ZONE45Landsat7 2017/11/21 04:50:54 141/041 WGS 84UTM ZONE45
Several published and unpublished documents were collected from different available sources. Those were PhD Dissertations, Master theses, reports, books, and various national and international journals related to the urban heat island. Similarly, various documents of heat stress, heat mitigation, report of ADB/ICIMOD and published by different organization.
Data processingLand use/land cover data preparation, calculating land surface temperature and identifying ecological condition through Urban Heat Island are the data processing steps of the study.
Land use/land cover data
Land use/ land cover maps were derived from the Google earth image of 1999 and 2017. Land use/land cover features were categorized into three classes. Compact urban built-up areas were categorized into Inner City Zone, surrounding cultivated area with dispersed and agglomerated settlement were categorized into Outer City Zone and remaining forest, shrub and grass covered areas including sparsely distributed cultivated lands were categorized into Forest Zone. Identification of these three zonal boundaries
Dipendra Salami, Ramesh Kumar, Chhabi Lal / Assessment of urban ...Vol. 14: 1-20, 2021

6
was based on prior knowledge of local reality of Kathmandu valley. Average altitudes of three zones were derived by SRTM DEM of 90m spatial resolution.
LST calculation
Land surface temperature (LST) is a key parameter in the physics of the earth surface through the process of energy and water exchange with the atmosphere, which plays an important role in a wide variety of scientific studies, such as ecology, hydrology, and global change studies (Liang et al., 2012; Zhang and He, 2013). In the present day, advancement of satellite data has widely used in environmental related studies and climate change. Thermal bands (band 6) of LANDSAT 7 images of November were used to calculate the land surface temperature (Suresh et al., 2016). Similarly, metadata of corresponding images were used for the calculation of LST. An equation is used to calculate land surface temperature using information given by thermal sensor of satellite and it is used by several scientists (Artis and Carnahan, 1982; Das, 2015; S.V. and K., 2016) is given below:
LST = BT/ 1+ ( ) ( ){ }w BT p L en* */
where,
LST = Land surface temperature
BT = At satellite temperature
W=Wavelength of emitted radiance (11.5µm)
p = h*C/S (1.438*10ʌ-2mk)
h = Planck’s Constant (6.626*10 ʌ-34JS)
s = Boltzmann Constant (1.38*10 ʌ-23J/K)
C = Velocity of light (2.998 *10 ʌ8 m/s)
p = 1.4380
To find the satellite temperature, TIRS data can also be converted from spectral radiance to brightness temperature, which is effective temperature reviewed by the satellite under an assumption of unit emissivity. The conversion formula is follows (USGS, 2015):
T = K
L KLn
2
1 1λ
+
where,
Dipendra Salami, Ramesh Kumar, Chhabi Lal / Assessment of urban ...Vol. 14: 1-20, 2021

7
T = top of atmospheric brightness temperature in Kelvin
Lλ = Spectral radiance (watts/m² *sr*µm)
K1= Thermal conversion constant for the band
K2= Thermal conversion constant for the band
Here, the output is in Kelvin unit of top of atmospheric brightness temperature which can be converted into degree centigrade by subtracting 272.15 (Das, 2015; S.V. and K., 2016). It is satellite temperature. Spectral radiance ( Lλ is calculated using digital number (DN) of TIRS data using the formula given below (USGS, 2015):
L M Q AL calλ = +* 1
where,
Lλ = spectral radianceML= Radiance multiplicative scaling factor for the band A1= Radiance additive scaling factor for the band Qcal= Level 1-pixel value in DN
Emissivity (e) is calculated using the following equation (Carlson and Ripley, 1997).
e = 0.004*Pv +0.986Where, e = emissivity and Pv = Proportion of vegetation Proportion of vegetation (Pv) is calculated using the following formula:
Pv =NDVI NDVINDVI NDVI
−−
min
max min
Whereas, NDVI is calculated using the following formula (Lillesand et al., 2008):
NDVI = NIR dNIR d
−+ReRe
LST validation
Dipendra Salami, Ramesh Kumar, Chhabi Lal / Assessment of urban ...Vol. 14: 1-20, 2021

8
As calculated LST of November in both years of 1999 and 2017, the lapse rate of temperature in Nepal is 5.3°c/1000m altitude (Kattel et al., 2012) which means 5.3°c temperature decreases with increasing altitude of 1000 m. The average LST of Inner City Zones, Outer City Zone and Forest Zone were calculated. Average altitudes of these three separate zones were derived from SRTM DEM. Then, corrected average LST values on the basis of lapse rate of changing average altitude were derived. Average calculated values of LST of Outer City Zone and Forest Zone were deduced on the basis of average altitude increased on the basis of lowest altitude zone (Inner City Zone). Thus, new average land surface temperatures of same altitude of three different zones were derived which validated the calculated LST derived from thermal image. Calculated LST from thermal image has been defined as actual mean and adjusted LST on the basis of lapse rate has been defined as corrected mean of LST.
UHI calculation
For evaluating UHI impacts on the urban quality of life, several thermal comfort indices are available (Zhang, 2006). This study adopted Urban Thermal Field Variance Index (UTFVI) which has been used in several past studies in the world. The UTFVI values are classified into five categories, each having corresponding interpreted ecological valuations and the UHI phenomenon (Liu and Zhang, 2011). The thermal environment in urban areas is characterized by HI phenomenon also called UHI/UFTVI which is used to quantitatively describe urban heat island effect. It is calculated by the formula:
UFTVI = (Ts – Tmean) /Ts
Where,
UFTVI is Urban Field Temperature Variance Index.
Ts is actual land surface temperature
Tmean is mean value of land surface temperature
From the ecological evaluation, five ecological conditions can be identified like worse, bad, normal, good and excellent on the basis of UHI values (Table 2).
Dipendra Salami, Ramesh Kumar, Chhabi Lal / Assessment of urban ...Vol. 14: 1-20, 2021

9
Table 2: Interpretation of ecological condition based on UTFVI and UHI hierarchy
UTFVI UHI phenomenon Ecological evaluation indexMore than 0.3 Strongest Worse
From 0.2 to 0.3 Strong Bad
From 0.1 to 0.2 Middle Normal
From 0 to 0.1 Weak Good
Less than 0 None Excellent
Results and discussions
The situation of land use/ land cover in the year 1999 and 2017 and their changes were analyzed. Pattern and area changes of three land use/land cover zones were analyzed with its driving factors. Distribution patterns of LST in both years were analyzed separately with their determining factors. The relation between land use/ land cover and LST were analyzed with the help of derived value and field observation. Calculated LST were corrected on the basis of lapse rate of Nepal (Kattel et al., 2012). Local level variation of LST was also analyzed. Ecological conditions of three zones were analyzed on the basis of UTFVI values which indicate the level of extremities of UHI creation. Finally, evaluation was done to identify how much extremities of UHI have emerged due to the urbanization in Kathmandu valley.
Results
Land use/land cover
Rapid urbanization in Kathmandu valley resulted rapid land use/land cover changes during 1999 to 2017. The Outer City zone was mostly plain and gently slope land (scatter settlement and cultivated land). Due to the increasing urbanization Outer City Zone was encroached by Inner City Zone. Large part of the Outer City Zone was covered by cultivated land in 1999 which was highly encroached by inner city in 2017. Even forest land of periphery was encroached by Outer City zone due to the urbanization process even in surrounding slope land. There was higher rate of increase of Inner-City Zone in Kathmandu district as compared to Bhaktapur and Lalitpur districts (Figure 3).
Figure 3: Land use/land cover in Kathmandu valley
Dipendra Salami, Ramesh Kumar, Chhabi Lal / Assessment of urban ...Vol. 14: 1-20, 2021

10
Area of Inner City Zone was only 10% of the total area of the valley in 1999 but it reached 36% of the total in 2017 while Outer City Zone became 45.25% to only 21% during same period. Area of Forest Zone slightly decreased. The Inner-City Zone increased more than three and half times during 1999 to 2017 which is nearly similar rate of population growth of 1981 to 2011. The Outer City Zone decreased more than 50% and forest also slightly decreased more than 3% even in the steeply sloping hill sides. These data indicate the rapid urban expansion increasing the area of Inner City Zone encroaching Outer City Zone and Forest Zone decreased to the encroachment of Outer City Zone.
Table 3: Land use and land cover in 1999 and 2017
Land use/ land cover1999 2017 Change
(%)Area km² % Area km² %Inner City 70.87 10% 254.02 36% 158.43Outer City 326.13 45.25% 152.67 21% -53.19
Forest 319.92 44.75% 310.23 43% -3.03
Land surface temperature (LST)
The spatial pattern of LST in Kathmandu valley shows that the central part of the valley has the higher value. Higher value is because of the presence of compact built-up surface such as buildings, roads and other concrete area while the vegetation areas are directly related to lower value of LST which is responsible for generating the cooling effect in the urban micro climate. Some concrete built-up areas add to the existing high temperature even in the outer parts of the valley. However, in some small part of the land, the LST has reached maximum 35.60°c due to the presence of concrete and brick industries. The concrete areas in Kathmandu district are more than in Lalitpur and Bhaktapur districts. The increment of LST outside the city core in 2017 is because of the expansion of urban built up area encroachment to Outer-City Zone.
Dipendra Salami, Ramesh Kumar, Chhabi Lal / Assessment of urban ...Vol. 14: 1-20, 2021

11
Figure 4: Distribution of LST in 1999 and 2017
The average LST values of Inner and Outer City Zones in 1999 were similar while maximum and minimum range was quite high. The range of Outer City Zone and Forest zone were similar. The range of Forest and Outer City Zone were quite high because of the altitudinal variation and variation of land use/land cover. Standard deviation also indicates the higher variation on LST in these two zones as compared to Inner City. However, the average LST was the highest in Inner City Zone and the lowest in the Forest Zone which indicates the creation of heat island in the urban one (Table 4). Corrected mean in the Outer City zone and Forest Zone is higher as compared to actual mean by which it can be expected that to have lower temperature in comparison to calculated values of LST in the Inner City Zones. This is the clear indication of creation of urban heat in Kathmandu valley due to urbanization.
The average LST values of Inner and Outer City Zones in 1999 were similar while maximum and minimum range was quite high. The range of Outer City Zone and Forest Zone were similar. The range of Forest and Outer City Zones were quite high because of the altitudinal variation and variation of land use/land cover. Standard deviation also indicates the higher variation on LST in these two zones as compared to Inner City Zone. However, the average LST was the highest in Inner City Zone and the lowest in the Forest Zone which indicates the creation of heat island in the urban one (Table 4). Corrected mean in the Outer City zone and Forest Zone is higher as compared to actual
Dipendra Salami, Ramesh Kumar, Chhabi Lal / Assessment of urban ...Vol. 14: 1-20, 2021

12
mean by which it can be expected that to have lower LST as compared to calculated values of LST in Inner City Zones. This is the clear indication of creation of urban heat in Kathmandu valley due to urbanization in 1999.
Table 4: Land surface temperature (°C) in 1999
LST Forest Outer city Inner city Valley totalMinimum 8.7 12.9 16.4 8.7Maximum 34.1 38.5 34.2 38.5
Range 25.4 25.6 17.8 29.8Actual mean 18.6 23.7 24.5 23.52
Corrected mean 21.9 24.1 24.5 23.52STD DEV 2.89 1.60 1.23 2.86
The highest value of LST was in the Inner City Zone followed by Outer City Zone in which the lowest value was in the Forest Zone in 2017. The ranges and standard deviation indicate the lower heterogeneity of land use/land cover in the Inner City Zone as compared to Outer City and Forest Zones. Standard deviation indicated the higher proportion of diversity in land cover in the Outer City zone as compared to the Forest zone. Both corrected and actual mean values of LST increased in all three zones in 2017 as compared to 1999 (Table 5). It indicates the effect of urbanization but further validation is needed to clarify it. However, the increasing area and average value of LST in 2017 as compared to 1999 further validated increasing LST in Kathmandu valley.
Table 5: Land surface temperature (°C) of Kathmandu valley 2017LST Forest Outer city Inner city Whole study area
Minimum 11.2 13.6 18.2 11.2Maximum 35.6 35.6 32.2 35.6
Actual mean 21.3 25.1 25.6 22.10Corrected mean 23.1 25.2 25.6 22.10
Range 24.4 22.0 14.0 24.4STD DEV 2.61 2.69 1.53 3.47
Dipendra Salami, Ramesh Kumar, Chhabi Lal / Assessment of urban ...Vol. 14: 1-20, 2021

13
Urban heat island (UHI) and ecological conditionDistribution patterns of UHI values in both years were similar but the intensity of the highest value extended to Outer City Zone in 2017 as compared in 1999. The higher values of UHI were increasing in the Inner City and Outer City Zones. Higher increase of intensity was extended more in Bhaktapur area. It indicated the extension of UHI outside of Inner City Zone. The highest value of UHI at the airport was similar in both years (Figure 5).
Figure 5: Distribution pattern of UHI index values
Only two ecological conditions were identified in Kathmandu valley. The vegetation area reflected the excellent ecological condition and built up surface reflects the good ecological condition. The distribution pattern of average ecological condition in both years was similar but higher proportion of the area was covered by excellent ecological condition in 2017 as compared in 1999. It was because of the extension of Inner City Zone toward the outer part in 2017 (Figure 6).
The higher proportion of excellent ecological condition was in outer parts in both years but higher proportion of excellent ecological condition was in 2017 as compared in 1999. It was because of the extension of this Outer City Zone to the vegetated area and high-altitude areas. Some parts were covered more vegetated area than built up surface in 2017. There was the highest intensity of excellent ecological conditions in the northeast, southwest and northeast parts in 2017 (Figure 6 and 7). It was because of the higher proportion of forest coverage and open spaces.
Dipendra Salami, Ramesh Kumar, Chhabi Lal / Assessment of urban ...Vol. 14: 1-20, 2021

14
Figure 6: Distribution pattern of ecological condition in Kathmandu valley
Most of the Forest Zone was covered with the forest in both 1999 and 2017. Therefore, most of the areas had excellent ecological condition in 2017 because of the lower parts of Forest zone of 1999 was converted into Outer City Zone in 2017. Furthermore, Forest Zone in 2017 was mostly steep hill slope with high altitude region in which most of the forest in 1999 remained constant even in 2017. Thus, the average proportion of excellent ecological condition was more in 2017 as compared in 1999 (Figure 7) because of the conversion of Forest zone to Outer City Zone rather than actual land cover change.
Figure 7: Distribution pattern of ecological condition in different zones
Dipendra Salami, Ramesh Kumar, Chhabi Lal / Assessment of urban ...Vol. 14: 1-20, 2021

15
The area proportion of excellent ecological condition in the Inner City Zone was very low in both years but proportion had slightly increased in 2017 because of the extension of area of Inner City Zone outside the city core and more open spaces in the extended area in 2017. The area of good ecological condition slightly decreased. However, the proportion of good ecological condition was the dominant in Inner City Zone. The area proportion of good ecological condition was decreasing toward Outer City Zone and Forest zones and excellent ecological condition was increasing (Table 6).
Table 6: Area percentage of ecological condition by zones
Ecological condition
1999 2017
Inner city Outer city Forest Inner city Outer city Forest
Excellent 3.3 15.79 75.95 4.4 26.3 94.8
Good 96.7 84.21 24.05 95.6 73.7 5.2
Total 100.0 100.0 100.0 100.0 100.0 100.0
Due to high rate of urbanization in Kathmandu valley, there is high rate of increase in the number of vehicles and brick factories resulting air pollution on the one hand, increasing proportion of the alphas and concrete road, high buildings, less greenery and less movement of air is on the other. These factors directly affected to the land surface temperature of the valley. The Inner-City Zone of Kathmandu valley is more likely to heat stress than the surrounding areas. Studies have revealed that the land surface temperature in the world is increasing due to global warming. Mountainous country like Nepal is highly affected by global warming especially in highland areas (Chaudhary and Aryal, 2009). The rate increment of LST in per decade in Nepal is quite lower than that of our finding of LST of 1999 and 2017. The data of this study is one time in a single year and it might have been affected by various factors to compare the temporal change in LST of Kathmandu valley during this period. Land surface temperature is varying with land use/land cover. The land surface temperature of urban built up area contains strong micro scale pattern that are relative to land categories like street, vertical walls, roofs, trees and albedo (Roth et al., 1989). Thus, the local variability of land surface temperature of Shivapuri to Dhapasi is highly variable due to the presence of forest, built-up area, agriculture land and open space area. Similar variability was also found in the airport area having variability of LST. Forest area had lowest LST value and runway of airport has the highest LST value. Other factors such as emission of air heating agents, air traffic and other infrastructure may also affected in increasing land surface temperature in the airport area which need further verification. This study
Dipendra Salami, Ramesh Kumar, Chhabi Lal / Assessment of urban ...Vol. 14: 1-20, 2021

16
also found the high value of LST in the brick industry areas. Neighboring houses and buildings also presented high value of LST. But this may be due to the use of number of air cooler machines which help to increase the temperature. So, the land use/land cover play vital role to increase land surface temperature. But there are so many causes to affect the LST. These are the subject matter for the further studies. Proportion of land surface temperature is increasing from 1999 to 2017 in all areas. The altitude of a land has also prominent role to affect the land surface temperature. Even after the correction of land surface temperature on the basis of seasonal variation of lapse rate of Nepal, land surface temperature of inner city is more than outer city and the forest areas. It revealed that land surface temperature in the urban area is really higher as compared to surrounding area of outer city and the forest in Kathmandu valley.
UHI effect has multiple implications to living condition of human life. UHI condition of Kathmandu Valley is not so bad but the increasing trend shows that it is going to be increase further in the future. Increasing UHIE can have adverse health effects occurring by significantly increasing air temperatures above average values, impeding the body’s ability to adapt and stay cool (Forkes, 2010). Thus, regular monitoring of land surface temperature is required for better health of the people of increasing urban area of Kathmandu Valley.
Conclusion
Rapid urbanization in Kathmandu valley contributed increasing land surface temperature during 1999 to 2017. Increasing road, vehicles, built up surfaces, and decreasing open surfaces such as cultivated land, forest and opens spaces were the major factors of increasing land surface temperature. According to the analysis of thermal pattern of the study area, the temperature of inner city is more than outer city, and the temperature of outer city is more than the forest. It is evident that higher the urbanization more increment of temperature and high UHI effect. Interpretation of index quantitative evaluating of ecological effects was excellent and good in Kathmandu valley. However, the UHI indicated that increasing built up surface and other urban activities have an effect on increasing temperature in city area rather than newly un-urbanized part. Thus, in the future the ecological condition may be worse if this situation remain the same. Unplanned urbanization and lack of sufficient open spaces at present indicated the critical future in Kathmandu valley which may take long time to manage the residential and urbanization area to overcome the urban growth and UHI effect.
Dipendra Salami, Ramesh Kumar, Chhabi Lal / Assessment of urban ...Vol. 14: 1-20, 2021

17
References
Adinna, E., Christian, E. I. and Okolie, A. T. (2009). Assessment of urban heat island and possible adaptations in Enugu urban using landsat-ETM. Journal of Geography and Regional Planning, 2 (2): 030-036.
Alfraihat, R., Mulugeta, G. and Gala, T. S. (2016). Ecological evaluation of urban heat island in Chicago City, USA. Journal of Atmospheric Pollution, 4 (1): 23-29. doi:10.12691/jap-4-1 -3.
Artis, D.A. and, Carnahan, W. H. (1982). Survey of emissivity variability in thermography of urban areas. Remote Sensing and Environment, 12: 313–329.
Carlson, T. and Ripley, D. A. (1997). On the relation between NDVI, fractional vegetation cover, and leaf area index. Remote Sensing of Environment, 62 (3):241-252. doi: 10.1016/S0034-4257(97)00104-1
Chaudhary, P. and Aryal, K. (2009). Global warming in Nepal: Challenges and policy imperatives. Journal of Forest and Livelihood, 8 (1): 4-14.
Das, A. (2015). Estimation of land surface temperature and its relation to land cover land use: A case study on Bankura District, West Bengal, India.
DHM (2015). Study of climate and climatic variation over Nepal. Kathmandu: Department of Hydrology and Meteorology (DHM), Government of Nepal.
Forkes, J. (2010). Urban heat island mitigation in Canadian communities. Toronto: Clean Air Partnership.
Gao, Z., Hou, Y. and Chen, W. (2019). Enhanced sensitivity of the urban heat island effect to summer temperatures induced by urban expansion. Environment Research Letters, 14 094005.
Grover, A. and Singh, R. B. (2015). Analysis of urban heat island (UHI) in relation to normalized difference vegetation index (NDVI): A comparative study of Delhi and Mumbai. Environments, 2: 125-138. doi: 10.3390/environments2020125.
Dipendra Salami, Ramesh Kumar, Chhabi Lal / Assessment of urban ...Vol. 14: 1-20, 2021

18
Grimmond, S. (2007). Urbanization and global environmental change: Local effects of urban warming. The Geographical Journal. https://doi.org/10.1111/j.1475-4959.2007.232_3.x
Ishtiaque, A., Shrestha, M. and Chhetri, N. (2017). Rapid urban growth in the Kathmandu Valley, Nepal: Monitoring land use land cover dynamics of a Himalayan city with Landsat imageries. Environments, 4, 72.doi:10.3390/environments4040072.
Jeevalakshmi, D., Reddy, S. N. and Manikiam, B. (2017). Land surface temperature retrieval from LANDSAT data using emissivity estimation. International Journal of Applied Engineering Research, 12 (20):9679-9687.
Kattel, D. B., Yao, T., Yang, K., Tian, L., Yang, G.,andJoswiak, D. (2013). Temperature lapse rate in complex mountain terrain on the southern slope of the Central Himalayas. Theoretical and Applied Climatology, 113:671-682. doi: 10.1007/s00704-012-0816-6.
Leeson, G. W. (2018). The growth, ageing and urbanisation of our world. Population Ageing, 11: 107–115. https://doi.org/10.1007/s12062-018-9225-7
Liang, S.; Li, X. and Wang, J. (2012). Advanced remote sensing: Terrestrial information extraction and applications. Elsevier Science: Amsterdam, Netherlands.
Lillesand, T. M., Kiefer R. W. and Chipman, J. W. (2011). Remote sensing and image interpretation (6th Edition). New Delhi: John Wiley and Sons, Inc.
Liu, L. and Zhang, Y. (2011).Urban heat island analysis using the Landsat TM data and ASTER Data: A case study in Hong Kong. Remote Sensing, 3 (12):1535-1552. doi: 10.3390/rs3071535.
Li, Y., Schubert, S., Kropp, J. P. and Rybski, D. (2020). Urban canopy parameterization data for urban climate simulation using CCLM/DCEP and hourly 2m temperature output. PANGAEA. https://doi.org/10.1594/PANGAEA.914906
Lo, C. P. and Quattrochi, D. (2003). Land-use and land-cover change, urban heat island phenomenon, and health Implications: A remote sensing approach.
Dipendra Salami, Ramesh Kumar, Chhabi Lal / Assessment of urban ...Vol. 14: 1-20, 2021

19
Photogrammetric Engineering and Remote Sensing, 69 (9):1053-1063. doi: 10.14358/PERS.69.9.1053.
Nuruzzaman, M. (2015). Urban heat island: Causes, effects and mitigation measures - A review. International Journal of Environmental Monitoring and Analysis, 3(2): 67-73.
Roth, M., Oke, T. R., & Emery, W. J. (1989).Satellite-derived urban heat island from three coastal cities and the utilization of such data in urban climatology. International Journal of Remote Sensing, 10: 1699–1720
S. S.; V, A. S. and K, M. (2016), Estimation of land surface temperature of high range mountain landscape of Devikulam Taluk using Landsat 8 data. International Journal of Research in Engineering and Technology, 4 (1): 92-96. doi:10.1016/j.agrformet.2008.06.001
Stewart, I. D. and Oke, T. R. (2012).Local climate zones for urban temperature studies. Bulletins of American Meteorological Society (BAMS), 93 (12): 1879–1900.doi.org/10.1175/BAMS-D-11-00019.1.
Subedi, B. P. (2014). Urbanization in Nepal: Spatial pattern, social demography and development. Population Monograph of Nepal, III: 95-154. Kathmandu: Central Bureau of Statistics (CBS), Government of Nepal.
Suresh, S., Ajay S. V. and Mani, K. (2016).Estimation of land surface temperature of high range mountain landscape of Devikulam Taluk using Landsat 8 data. International Journal of Research in Engineering and Technology, 5(1): 92-96.
United Nations (2014). World urbanization prospects: 2014 revision. New York: Department of Economic and Social Affairs, Population Division,
USGS (2015), Landsat 8 (L8) Data Users Handbook, LSDS 1574, Version 1.Sioux Falls: Department of the Interior, U.S. Geological Survey.
Wienert, U. and Kuttler, W. (2005).The dependence of the urban heat island intensity on latitude - A statistical approach. Meteorologische Zeitschrift, 14 (5): 677-686. doi: 10.1127/0941-2948/2005/0069.
Dipendra Salami, Ramesh Kumar, Chhabi Lal / Assessment of urban ...Vol. 14: 1-20, 2021

20
Zhang, Y. (2006). Land surface temperature retrieval from CBERS-02 IRMSS thermal infrared data and its applications in quantitative analysis of urban heat island effect. Journal of Remote Sensing, 10: 789-797.
Zhang, Z. & He, G. (2013).Generation of Landsat surface temperature product for China, 2000–2010.International Journal of Remote Sensing, 34, 7369–7375.
Dipendra Salami, Ramesh Kumar, Chhabi Lal / Assessment of urban ...Vol. 14: 1-20, 2021

21
What is an institution? An ontological debate illustrating community forestry of Nepal
Dilli Prasad Poudel, Ph.D.Southasia Institute of Advanced Studies (SIAS)
Corresponding Email: [email protected]: 21 November, 2020; Accepted: 01 December, 2020; Published: March 2021
AbstractIllustrating Community Forestry (CF) of Nepal, this article discusses the concept of ‘institution’ through the perspectives of the phenomenology of Peter Berger & Thomas Luckmann (1966), the structuration theory of Anthony Giddens (1984), and the conception of institution as people-nature relations. Phenomenologists concentrate on the structures of consciousness as individuals experienced and expressed while turning an objective world or phenomenon into a subjective one through objectivation, internalization and externalization/ institutionalization process. The structuralist holds that the creation of an institution is a reproduction of interaction between structures and actors. And other theorists (e.g., Leach et al., 1999; Ostrom 2005, 2009; Gupta et al., 2010; Young, 2010) consider that institutions for natural resources conflate with social institutions and mediate their relations. Although these theories are not explicit epistemologically in a pragmatic sense, they have indicated language, rules, (embedded) practices and knowledge are the referential artifacts of institutions. These theories are found applicable in the institutionalization/socialization history of CF as it had gone through the social rejection (i.e, objectivation) during the 1970s, internalization during the 1980s, and socialization of it during and after the 1990s. The socialization of CF after the 1990s was due to the formation of CF as a social space (a ‘structure’ or ‘institution’) to discuss social and environmental issues into one place where forest dependent users (‘actors’) rationalize the use of forest and its conservation for local environment in a more pragmatic sense (i.e., mediate people-nature relations). An institution for natural resources is, therefore, the combined perspectives of phenomenologists, structuralists, and those who think institutions as a mediator of people-nature relations. Thus, an institution is political (i.e., relations and interactions) and ecological/economic (i.e., access to natural resources, livelihood practices).
The Geographical Journal of NepalVol. 14: 21-40, 2021DOI: https://doi.org/10.3126/gjn.v14i0.35547Central Department of Geography, Tribhuvan University, Kathmandu, Nepal

22
Keywords: Institution, practice, agency, phenomenology, social relation, community forestry
IntroductionThe success of community forestry (CF) in Nepal is nationally and internationally acknowledged as a suitable method not only to sustain the livelihood of forest-dependent communities but also to manage and conserve local biodiversity. Community participation in forest management in Nepal was initiated in the 1970s, which, after the coming of the Forest Act of 1993, decentralization of power and resources management became a regular and widespread (especially in the mid-hills region) practice through the Community Forest User Groups (CFUGs). Subsequently, CF (UG) has been considered as a mechanism to protect forests, conserve biodiversity, enhance economic situation of many villagers, and to establish local level institutions (Jackson et al., 1998; Gautam et al., 2002; Springate-Beginski et al., 2010). The formation and implementation of a CF is an example of an institution that exists in our society. There are several other socio-economic institutions which we express through various practices, relations and activities in the society.
A short description of the forestry institution reveals that an institution comprises mainly of four components, namely an object/subject (e.g., forest, relation, culture, tradition or parampara) to institutionalize, a technique to manage that object/subject (i.e., norms and rules – forest regulations and operation plan, religious codes), actors to involve in the management and practice (i.e., social beings, users – forest dependent communities), and interaction among them (e.g., activities to use, protect, manage, and distribute forests, and practice of socio-cultural norms and codes). These components are discussed differently, diversely and dispersedly in the philosophy of science. This article, based on the review of literature, attempts to analyse how ontologically and epistemologically phenomenologists, structuralists and those who deal with institution as a people-nature relation have expressed and experienced the institution of society.
In what follows, the next section analyses definitions of an institution. Subsequently, three conceptually different ontologies of institutions (i.e., institution as ‘reciprocal typifications’, ‘embedded practices’, and ‘people-nature relation’) are explained and analysed separately. Attempt was made to analyse the potential epistemological implication of an institution. Finally, the theories are discussed to relate the institutionalization history of CF in Nepal and conclusion is drawn at the end.
Dilli Prasad Poudel/ What is an institution? ...Vol. 14: 21-40, 2021

23
Definition of InstitutionThe emergence, existence, persistence and function of institutions have been variously defined and understood in the relevant literature. There is no single universal definition of institution and thus, confusion regarding institution may persist (Ostrom, 1986; Martin, 2004; Searle, 2005; Vatn, 2005). In the simplest way, an institution is a regular habit, action or behaviour which functions without explaining to other those who live in same social context or share the same language; for instance, a greeting (e.g., Namaskar). When you greet someone you do not explain that you greeted her/him because of some reason (i.e., for respect or courtesy). It is naturally understood by other people who you have greeted or those who have seen your act of greeting. Such actions and habits function like a natural order. Any activity and action of human that is repeated frequently orient to form a social pattern and, therefore, is a subject to habitualization (Berger and Luckmann, 1966). According to these authors, during the course of time, individuals develop shared concepts, actions, and mental maps in the form of language, which establish shared meanings of their actions and shared cooperation among individuals. Then, any behavioural expressions and regular actions become understandable in society. Berger & Luckmann regard such shared concepts, actions and understandings as ‘reciprocal typification’.
To encompass various definitions of institution, it has been grouped them into three broad categories. First is the concept of institution as a facilitator of individual agents or actors that is also facilitated by those actors. Second is the concept of institution as a constraint of individual agents which also determines the opportunities to establish other ways to get benefits (social, materials etc.). And third is an institutional concept for people-nature relations, which combine both the above ideas and activate constellations of institutions to facilitate and constrain agents for natural resource management. The following definitions crystalize the above categories:
“Institutionalization occurs whenever there is a reciprocal typification of habitualized actions by types of actors. Put differently, any such typification is an institution” (Berger and Luckmann, 1966: 72).
An institution is established practices of the society (Giddens, 1984: 17).
Institutions are the rules of the game in a society or, more formally, are the humanly devised constraints that shape human interaction (North, 1990: 1)
Dilli Prasad Poudel/ What is an institution? ...Vol. 14: 21-40, 2021

24
[I]nstitutions mediate people-environment relation and regularize pattern of behaviour between individuals and groups in the society (Leach et al., 1999: 226).
All humanly used resources are embedded in complex, social-ecological systems (SESs) (Ostrom, 2009: 419).
Institutions are the prescriptions that humans use to organize all forms of repetitive and structured interactions including those within families, neighbourhoods, markets, firms, sports leagues, churches, private associations, and govern ments at all scales (Ostrom, 2005: 3).
The above definitions indicate multiple concepts of an institution. Berger & Luckmann consider institutions as regular actions which are subject to habitualization in society and are understood by those who share the actions. They believe human is a social product. These authors focus more on social ‘structure’ – norms, rules and regulation to facilitate human actions.
Giddens (1984) focuses on human ‘practices’ as a medium and production of social structures. ‘Structure’ and ‘action’ enable and constrain each other through regular ‘practices’. During the course of exchanging behavioural practices in society, they create social relations and routines, which establish social systems comprising several institutions, such as marriage.
In contrary to Berger & Luckmann and Giddens, North (1990) considers established social institutions as constraints for the material and social benefits of individuals. But he agrees that institutions reduce uncertainty by providing a structure to everyday life, such as how to greet someone, borrow money from a bank, to participate in meetings, etc. But institutions also contain rules and regulations which prohibit or permit human actions, thus, limiting individual’s choices. He considers that the purpose of rules of institutions is to define the way the game is played. Then, this also denotes how to win the game. So, people use their skills, strategies and techniques ‘to win the game’ or to gain benefits from the established institutions. To mould these tasks, people establish organizations, such as political body, economic body, social body and educational body.
Leach, Mearns et al. (1999) and Ostrom (2009) emphasize interactive relations between human and nature and incorporate environmental dimensions on human roles and actions while extracting natural resources. In the context of natural resource management, institutions rather mediate human-environmental relationships and activate social as
Dilli Prasad Poudel/ What is an institution? ...Vol. 14: 21-40, 2021

25
well as environmental institutions to get access to resources. It is so because when an individual gets access to natural resources it activates a constellation of institutions, such as his/her social status, gender, power, networks, etc. So, institutions are complex and they mould multifaceted socio-economic and environmental relations.
Finally, Ostrom’s (2005) definition indicates diversity and various understanding of institutions in various social contexts. It also indicates elongated use of the term ‘institution’ in literature. The reason behind the diverse understanding of institution, as she says, is due to ‘structured situations’ of human relation. Structured situations denote market, elections, regular activities, hierarchies, sports, various social contexts, etc. These situations are guided by regularized behaviour of interaction, which are constructed by institutions.
Ontology of institutionA brief introduction of an institution in the above section can hardly convince a reader without knowing about the ontology of an institution. Taking insights from the phenomenology of Peter Berger & Thomas Luckmann (1966), the structuration theory of Anthony Giddens (1984) and those dealing with people-nature relation as institutions, this section tries to answer 'what is an institution?'. Phenomenology concentrates on the structures of consciousness as individuals experienced and expressed (Smith, 2016). The structuration theory holds that the creation of a social system is a reproduction of interaction between structures and actors (Giddens, 1984). And others believe that institutions related to natural resources conflate with social institutions and mediate their relationships.
Institution as reciprocal typificationsAs mentioned earlier, Berger and Luckmann (1966) consider institution as the ‘reciprocal typifications’ which means an exchange of different types of actions between individuals in a meaningful manner. They argue that every individual is born into an objective social structure, which turns into subjective social structure through comprehensive and consistent induction of shared concepts and situations during internalization of shared habits. For instance, when we perform a certain type of action, let’s say greeting or doing Namaste, it becomes habitualized in our regular social practice, and it becomes commonly recognizable (subjectively understandable). These actions generalize habits and become sources of knowledge for other individuals in the society. Thus, such generalized actions are institutionalized in the society. When a newcomer, let’s say a child, observes such habitualized or generalized action, s/he objectively understands the action first, and when s/he internalizes it during the process of socialization (see
Dilli Prasad Poudel/ What is an institution? ...Vol. 14: 21-40, 2021

26
below) it becomes subjective, for instance, when children see parents greeting someone, they ‘take for granted’. They don’t understand (the meaning) why their parents need to do that particular act in such a specific situation and manner. On this level, children objectively understand the practice of their parents. When children internalize those practices, then they understand the subjective meaning of ‘greeting’ and perform exactly how their parents had done in course of their life. When generalized actions crystallize in consciousness, a symmetrical relationship is established between objective and subjective reality (Berger and Luckmann, 1966). Therefore, institutions function similar to natural instincts and they also provide relief by facilitating decision making process.
According to Berger & Luckmann (1966), there are three phases in the process of institutionalization for an objective reality to become a subjective reality to human beings.
Objectification/objectivation:
This is the phase where others observe actions, events and behaviours objectively or without knowing the subjective meaning of those actions, events and behaviours. An observer does not know the history of these events or behaviours; he/she considers them as ‘things’ or just as existing ‘facts’ outside them. For instance, children see the parents ‘greeting’ others as an objective fact and they just understand how the thing should be done. In other words, the subjective fact for parents becomes objective fact to the children. Later, these objective facts become habitualized during the process of internalization.
Internalization:
In this phase, an observer subjectively understands the objective fact of actions, events and behaviours. During the life course, children consciously understand the subjective meaning of an action, event and behaviour they have seen how their parents used to do/practice. The process of understanding subjective meaning of an objective fact is called socialization. During socialization, an individual becomes a member of his/her society through ‘reciprocal typification’ of shared situations and s/he will understand the social structures as subjective facts. These reciprocal typifications are the enduring facts of society, such as language, marriage, livelihood earning practices, etc. These are the institutions of the society. Then we not only understand each other’s definitions of shared situation but also define them reciprocally (Berger and Luckmann, 1966).
Dilli Prasad Poudel/ What is an institution? ...Vol. 14: 21-40, 2021

27
Externalization:
In this phase, individuals perform practices subjectively. Such practices contain meanings which are understandable among those who share the same language. Individuals know how to do a certain action in a meaningful manner, such as greeting someone or collecting a specific type of herb from the forest. These shared practices are habitualized in society in a form of established institutions, such as livelihood earning activities, marriage, agricultural activities, forest management, ritual practices, etc. In this phase, individuals know the history of practice of their actions, which makes it easier for them to express a type of action in a certain social context.
Externalization of objectivated actions, events and situations through internalization/socialization is a continuous process. This continuous process of society is an institution, and that’s why an individual is considered as a social product (Berger and Luckmann, 1966). If a society does not properly internalize/socialize objectivated facts, these cannot be established in society and thus they cannot be institutions in that society. Although these authors indirectly include influence of material and political interest in the institutional change, they argue that institutions are socially constructed templates for action, generated and maintained through continuous interaction (Barley and Tolbert, 1997).
Although Bergen & Luckman provide us a way to observe an institution and institutionalization process of a society, several questions come up: Do institutions have a sole role to form social relation of individuals? Or individuals also form and customize established institutions? What do regular human practices comprise of during institutionalization process? How do practices influence social structures? These issues also need to be added to have a better understanding of an institution. In this context, Giddens’s notion of human ‘practice’ as a medium and production of social ‘structures’ may provide further insights to understand an institution.
Institution as embedded practicesAnthony Giddens (1984) views that embedded practices which persist in society are the institutions, such as marriage, funerals, greetings, (or regular practices). Importantly, instead of giving priority to either action or structure, he prioritises both and emphasizes human practice, as a medium, to see the reciprocal relationship between structure and action. Structures are the rules and resources and actions of actor that become the practices and behaviours of individuals. He also emphasizes that human social practices, relations and activities vary with time-space context and they are ‘recursive’ in nature.
Dilli Prasad Poudel/ What is an institution? ...Vol. 14: 21-40, 2021

28
Here 'recursive' should be understood as ‘human activities and practices which are not brought into being by any social actors but continually recreated by them via the very means whereby they express themselves as actors’ (Giddens, 1984: 2). On the basis of interactive nature of structure and actor/agent, Giddens develops the ‘duality of structure’, which is the core of structuration theory. Structuration is the process where, on the one hand, human practices are constrained and facilitated by structures; on the other hand, structures are also produced by human practices. It (social structure) simultaneously enters into the constitution of the actors (memory traces) and social practices, and exits manifesting the social actions of agent or actor. Thus, these two facets of social structure, as medium and outcome, are conceived as ‘duality of structure’ in the structuration process. Structure and interaction are the structural properties of the social system. And each structural property leads us to an institution, and clustering of institutions lead us to different social systems (Craib, 1992). Since embedded practices are the most important aspects of an institution, the actions of actors can be understood through an institutional perspective.
Structures are situated in human actions and do not exist externally. They remain in a form of memory traces and human ability (biological and physical) of knowledgeability, and are executed during social interaction by the actors. These social structures contain the rules and resources, but Giddens implicitly opines that these are not the rules like in the game (cf. North, 1990). In the game, we cannot change rules, we just follow them. However, the rules implied during social interaction are more like habitual and actors follow them routinely without openly expressing. These rules are the procedure of action and contain the characteristic of transformation during the course of social interaction. Social rules constitute the meaning and the sanctioning of social conduct (Giddens, 1984). Resources are the structure of domination (e.g., leadership), which is the foundation of power. Resources can be further categorized as allocative and authoritative. The former constitutes the ability to control economic resources and social relations leading to formation of economic institutions, whereas the later constitutes the ability to control people leading to formation of political institutions (Craib, 1992).
The embedded practices are rooted in the actors’ day-to-day activities and performed through their livelihood earning practices in the material world. The embedded practices (e.g., actions of forest users) perform through an ‘action’ (of actor) which is the basis of Giddens’ structuration process of social institutions. Giddens states that action is a continuous process and a flow that an actor executes during the course of social practice. Actor’s execution of action may produce intended or unintended consequences. But the actions are the consequences of ‘reflexive monitoring’ of actors. It means an actor not only monitors his/her actions and other actions, but also monitors the social and physical
Dilli Prasad Poudel/ What is an institution? ...Vol. 14: 21-40, 2021

29
aspects of the society where they execute actions. In addition, an actor rationalizes his/her action, e.g., community involvement in forest management (i.e., action) because their livelihoods rely on forest resources (i.e., rationalization). The most important aspect of action is that it contains the transformative power or ability of change through monitored actions.
The conceptualization and formation of CFUG in Nepal is influenced by monitoring and transformative potentiality of community members (i.e., actions). Because the actual users of the local common resources (i.e., forest) have full information (i.e., knowledge) of the carrying capacity of resources, which (i.e, knowledge) guides users to monitor not only their own actions but also of others for the optimal use of available resources.
Actor (agent) executes the action discursively rationalizing the reason for his/her conduct. We know what we do. Giddens (1984) distinguishes motivation of action from rationalization and reasoning of action (i.e., reflexive monitoring). Because much of our day-to-day conducts are not directly motivated. Unconscious motivation (behavioural slips; slip of the tongue, spilling the coffee is an action of a person even though it has not done intentionally) is a significant feature of human conduct (Giddens, 1984: 6). Thus, practical action (practical consciousness) of an actor is the centre of an institution or structuration process. However, Giddens has not distinguished between discursive consciousness action and practical consciousness action rigidly. As he formulated, it is like the difference between what can be said and what is characteristically simply done (Giddens, 1984: 7). Importantly, an actor’s ability for action (or agency) relies on as much knowledge and power as s/he has. The social structure, thus, enables action of actor and contains the transformative power during the production and reproduction of social practices.
An institution, thus, initiated through ‘reciprocal typification’ of an action meaningfully among the individuals becomes ‘established practices’ of society, such as language, marriage, ritual activities, forest using practices. Yet, institution can also be understood as spatially and temporally varying structured social activities. Enduring practice and persistence of institutions in society also permit them to have flexibility with uncommitted potentiality to adapt to new changes, that is, environmental and social (Aase et al., 2010). So, the reciprocal relation of structure and action through practice within institution, as explained by Anthony Giddens, helps to analyse society more closely than relying on Berger & Luckmann only. However, since human interact with and rely on natural resources for various reasons (e.g., sustaining livelihood) (see Poudel, 2018; 2019) institutions for natural resource management conflate people-nature relation with social institutions and mediate their relationships (Leach et al.,
Dilli Prasad Poudel/ What is an institution? ...Vol. 14: 21-40, 2021

30
1999; Gupta et al., 2010; Young, 2010), so all humanly used resources are embedded in complex social-ecological systems (Ostrom, 2009). The following section deals with these aspects of the institution.
Institution as people-nature relationsIn a country like Nepal, natural resources such as forest is not only the source of livelihood earning but also the foundation of local environment (Poudel, 2014). Managing natural resources, such as forest, is, therefore, not only like regularizing human social behaviours as expressed by Burger & Luckman and Anthony Giddens. Rather an institution for natural resources mediates people-nature relation and regularizes pattern of behaviour between individuals and groups in society (Leach et al., 1999; Young, 2010). A constellation of institutions, such as social status, role, gender, economic power, networks, political power, etc. guide his/her access to natural resources. This may be the reason why politically oriented leaders, elite dominancy (Malla, 2001; Lama and Buchy, 2002; Timsina and Paudel, 2003) and gender inequality (Agarwal, 2001) determine access to forest resources in Nepal. Because in an agrarian society, an individual’s social identity and status are the objects as well as instruments of investment to get access to natural resources (Berry, 1989).
North (1990) critically says that institutions are the rules of the game. In a practical setting, institutions determine the opportunities in the society and actors take advantage of those opportunities. How and how much resources one can accumulate are determined by his/her social position. For instance, among the members of a Community Forest Users Group or CFUG, poor villagers are still not getting as much access as they need for the subsistence in spite of equal institutional rights (Adhikari et al., 2004). This may be due to their weak social as well as economic status or weak agency.
At present, an institution designed for the management of natural resources, such as CFUG, is beyond the conventional understanding like a small spatial unit, a homogeneous social structure, and as a shared norm (Agrawal and Gibson, 1999). Rather, these institutions should be viewed as the involvement of differentiated actors with contested interests. Strategic actors can bypass the constraints of existing institution and create new institutions that match their interest (Agrawal and Gibson, 1999). Networks of powerful and well-connected (political) actors are able to control flow of knowledge and information (Yates, 2012). Thus, a growing number of intra - and inter-institutional relations should also be considered when conceptualizing institutions for natural resource management. This is so because an institution for natural resource management can have trickle down impacts on social, environmental and economic institutions of society.
Dilli Prasad Poudel/ What is an institution? ...Vol. 14: 21-40, 2021

31
The global environment changes and the way communities adapt to the change can only be understood by the adaptive capacity of institutions (Eakin and Lemos, 2010). Unlike other institutions, resource institutions should have the ability to manage socio-environmental challenges, which are non-linear in nature (Young, 2010). In the Nepal Himalaya, for instance, a farmer’s adaptation to change is largely conditioned by the household’s innovative capacity (Aase et al., 2013) and the institutions that facilitate innovation are central for building the adaptive capacity of farmers (Chhetri et al., 2012). Thus, at present, an institution – especially for natural resources - must be viewed in its dynamic ability.
In addition, institutions have ability to enable social actors to continuously learn and improve their institutions, allow and motivate social actors to adjust their behaviour, and institutions can also have ability to mobilize leadership qualities (Gupta et al., 2010). Thus, these diverse abilities of institutions guide individuals to customize behaviours in specific situations and lead individuals to make a conscious decision to form a new institution in a changing context. Institutional change takes place when existing institution’s rules, norms and practices conflict with day-to-day functional needs of participants, become incompatible with and unresponsive to changing socio-economic environments, and no longer serve interest of local people who enact the rules and norms (Seo and Creed, 2002).
Referential artefacts of institution – an epistemological implicationUnlike animals, human do not have any instinct by birth. Instead, they develop institutions, which are their instincts. These institutions facilitate them to learn social norms through reciprocal typifications throughout their life course (Berger and Luckmann, 1966). This is how individuals know their surroundings and environment and are able to exceed the geographical limit. Unlike human, non-human animals have their geographic limit. For instance, a polar bear cannot survive in the Sahara Desert. On the contrary, human can adjust in both kinds of natural environments. So, institutions facilitate, permit, and capacitate human to engage in different activities (e.g., knowledge production, role, status, professionalism) and environments (e.g., physical space, natural resource management), which enable them to form modern society at present. Although both (human and non-human animals) were alike at the time of origin, human, in terms of social progress, transcend animal-like society to the modern one through social and material institutionalizations. Figure 1, although it is hypothetical, illustrates the social progress of human and other animals from the hunter and gatherers to modern beings.
Dilli Prasad Poudel/ What is an institution? ...Vol. 14: 21-40, 2021

32
Figure 1: Institution – an instinct - makes human different than other animals
The figure implies that institutions have made possible human to appropriate resources, place and society, and render them for making their living in the material world.
The ontologies of institution presented in the above sections, that is, institution as (1) ‘reciprocal typifications’, (2) ‘embedded practices’, and (3) ‘people-nature relation’ are not explicit epistemologically in pragmatic sense, they, however, have indicated language, rules, (embedded) practices and knowledge are the referential artefacts of institutions. To activate institutions empirically these indicators facilitate to conceptualize an institution of a society.
Human language is an inherited referent of an institution. Because if one presupposes language, s/he has already presupposed institutions (Searle, 2005). Language provides a meaning of a phenomenon (object, organism, event etc.). Language continuously coordinates humans to convert objective knowledge in to subjective knowledge (Berger and Luckmann, 1966). If community members share a common language, they also share common practices and habits, and a performance of similar acts. According to Searle, (1) language has the ability to communicate meaning. For instance, a national flag could be just a piece of cloth if it has no institutional value as a symbol of nationality/unity
Dilli Prasad Poudel/ What is an institution? ...Vol. 14: 21-40, 2021

33
in society. (2) Language contains the deontic power, such as rights, duties, obligations, authorizations, permissions, empowerments, requirements, and certification. For instance, unlike animals, humans can distinguish persons by their status (e.g, president, teacher, researcher, ordinary person), although all are human beings. (3) Recognition of meaning of status remains continuous through language. And, (4) language is the only medium through which other institutions, such as marriage, money, government, market, property, and forest management, etc. can be recognized. Language is also a mechanism to motivate groups of individuals collectively, which is called collective intentionality1. Language, therefore, has a primary role to constitute an institution in any society.
Ostrom (1986) considers rule as a concept to refer to an institution. She conceptualizes prescriptive nature of rules to understand an institution. A prescription refers to commonly known and used actions by individuals, such as required, prohibited, or permitted. These rules are the result of repetitive actions and implicit or explicit efforts of practitioners in defined/structured situations. A defined situation can be markets, committees, elections etc. (Ostrom, 1986). For her, rules differ from laws, because rules are well understood and acknowledged by the users whereas enforcement is required for a law to become a rule. Rules can be changed by the practitioners whereas laws cannot be changed by practitioners themselves. In addition, rule contains prescriptive force, which means knowledge and acceptance of a rule leads individuals to recognize that if they break the rule other individuals may hold them accountable (Harre, 1974; cited in Ostrom, 1986). Since a rule structures an action of an individual in a situation through obligation, prohibition and permission, individuals select actions from a set of allowable actions in any particular situation. Thus, rules attribute institutions.
Considering practice and interaction as a medium to transfer rules and norms into human actions, Crawford et al. (1995) try to develop the syntax of an institution, which includes attribute, deontic, aim, condition, and or else. All these components are applicable for a group or an individual. ‘Attribute’ component of an institution includes the characteristics of a group or an individual, for instance, size of membership, geographic location, resource availability, etc. for a group, and age, gender, caste-ethnicity, position, residence, etc. for an individual. The ‘deontic’ component of an institution consists of the rules of permission, obligation and forbidden for a group or an individual for particular actions. All the actions of an individual or a group, which are regularized by an institution, can be considered as an ‘aim’ of the institution. For instance, forbidding the felling of rare species of certain types of trees within particular CFUG’s boundary is the
1 Intentionality is the directedness of the mind with belief, desire, hope, fear, love, hate, pride, shame, perception digest etc. (Searle 2005: 6).
Dilli Prasad Poudel/ What is an institution? ...Vol. 14: 21-40, 2021

34
aim of that CFUG. The fourth component of an institution, namely ‘condition’ indicates the set of variables that define when, where and how certain conditions or rules apply for a particular action. For instance, determination of the day or month for the collection of firewood and timber by CFUGs is a kind of a condition. The fifth component, ‘or else’, consists of sanctioning nature of an institution, which must be backed by certain rules (Crawford and Ostrom 1995). This includes threat and punishment, e.g. imposing fine, physical punishment, confiscating timber cutting instruments by CFUG institutions etc. Thus, embedded practices attribute rules.
Knowledge as resource of institution is another referent of an institution. Individuals acquire knowledge during the process of socialization (Berger and Luckmann, 1966). The inherent characteristics of an institution, such as rules, norms, and beliefs empower society (individuals, organizations and networks) to cope with new social and environmental changes (Gupta et al., 2010) through the flow of knowledge and information (Yates, 2012). Thus, it encourages actors to find solutions to problems. Institutions continuously enable social actors to learn, improve and adjust their institutions. Institutions define leadership capacity, can mobilize resources, and have the principles of fair governance (Gupta et al., 2010).
ConclusionThis article presents an institution through the perspectives of the phenomenology of Peter Berger & Thomas Luckmann (1966), the structuration theory of Anthony Giddens (1984), and the conception of an institution as people-nature relations. As institution is regular habits or actions of human, a continuous change is the rule rather than the exception in an institution. Berger & Luckmann (1966) focus more on social structure – norms, rules and regulation to facilitate individual’s actions whereas Giddens balances the role of actors (or individuals) and structure through regular practices to form social institutions (which is recursive). Actors are also rational (social and economic) and reflexive (monitor activities). In addition, domination of power (social and economic) is apparent while considering people-nature relations, especially in natural resource-dependent society. So, all these facets comprise an institution of a society.
While analyzing the relationships between ‘community’ and ‘forest’ in Nepal historically, phenomenologists’ process of socialization of a phenomenon (i.e., objectivation, internalization and socialization/extranalization of an objective world into subjective one) seems applicable. When the idea of Community Forestry (CF), a phenomenon, was initiated through the promulgation of the National Forestry Plan in 1976, communities were reluctant to accept it as it was not only top-down and centrally imposed, but local
Dilli Prasad Poudel/ What is an institution? ...Vol. 14: 21-40, 2021

35
communities were also provided limited use rights. The early CF was primarily guided by the conservationist motives and it did not consider the existing traditional practices of forest users (Collett et al., 1998; Malla, 2001; Gautam et al., 2004). Although the Plan was less strict compared to the Private Forest Nationalization Act of 1957, which sufficiently scared communities with the centrally imposed forestry rules, the implementation of the Plan did not please communities one more time. Consequently, communities did not internalize and socialize the early CF.
In the 1980s, the government realized the importance of communities’ roles in local forest management and started transferring use rights to them. This was reflected in the 25-year Master Plan of Forestry Sector in 1989 (Gautam et al., 2004). This Plan was guided by two goals, that is, conserving forests and enhancing users’ livelihood. It relinquished substantial amount of power and authority to community in the use and management of forests through forming forest user groups at local level. Although the promulgation of the Master Plan is considered as a paradigmatic shift in forestry policy making in Nepal (Gautam et al., 2004), villagers did not generally believe that the promise of decentralization of forest management would be effective (Malla, 2001). However, as the forest user groups were already started forming at the local level and communities were also enjoying some degree of use rights, the process of internalizing CF by communities through their regular actions and practices of forest use started after the implementation of this master plan.
Finally, after the promulgation of the Forest Act 1993 and Forest Regulation 1995, communities were not only authorized to use, manage and sell forest products but CF was also developed as a grassroots institution to drive local economy and development, thereby to enhance local livelihoods, which further encouraged communities to institutionalize and socialize CF subjectively. At present, CF is considered as the most successful local-level forest management institution (Agrawal and Ostrom, 2001; Ojha et al., 2008; Thoms, 2008) in terms of protecting forest, conserving biodiversity, enhancing economic situation of many villagers, and establishing local level institutions (Jackson et al., 1998; Gautam et al., 2002; Springate-Beginski et al., 201;, Oldekop et al., 2019).
The above subjectivation/socialization history of CF was due to the formation of CF as a social space to bring and discuss social and environmental issues into one place where forest dependent users rationalize the use of forest and its conservation for local environment in a more pragmatic sense. This is the place where structure and actions of actors, as Giddens (1984) proposes through the structuration theory, recursively interact, thereby the structure of CF is monitored, guided and restructured by the actions
Dilli Prasad Poudel/ What is an institution? ...Vol. 14: 21-40, 2021

36
of actors (i.e., community, forest users). Although the power relations in terms of access to and control/claim over forest resources and policy making vary among users on the basis of their social positionalities and agencies (i.e., ability of actors) (Nightingale and Ojha, 2013), CF is the most accepted forest management institution compared to other community-based forest management institutions of Nepal at present (Poudel, 2019).
Structuration or institutionalization process, thus, denotes structural influences on regular behavioural practice and decision making of actors and they also affect formal rules and laws as presented in the above case of CF subjectivation history. It evokes constructive and interactive relation between individual (i.e., actor) and structure (i.e., rules/institution) in a specific socio-environmental context which vary in space and time. As individual actors are creative and skilful, their regular practices also influence the structuration process (e.g., changes in forestry policies). Social structures and individual’s actions are therefore recursively associated as Giddens (1984) argued. To understand these relations epistemologically in a pragmatic sense, an understanding of community’s language, existing norms and rules, (embedded) practices and knowledge repository of existing institutions are quintessential.
Ontologically, an institution of society can, therefore, be conceptualized through the following prerequisites. (1) Formation, existence and persistence of institutions are due to a continuous practice of actions and behaviours of actors for societal needs, e.g., sustaining livelihoods. (2) It grows at all stages of the social relation of actors leading to institutional change varyingly in time-space context. (3) As society depends on natural resources for several purposes (e.g., livelihood, climate, environment), understanding an institution designed for natural resources demand social, economic and ecological perspectives. Finally, (4) institutions change when actors affect norms and when existing institutions do not match societal needs and interests in the context of external change. These four prerequisites or conditions suggest that an institution is the combined perspective of phenomenologists, structuralists and those who think institutions as a mediator of people-nature relations. Thus, an institution is a politically (i.e., relations and interactions) and ecologically/economically (i.e., access to natural resources and their managements, livelihood practices) established social practice.
AcknowledgementsI would like to thank Professor Tor Halfdan Aase for his comments, suggestions and continuous encouragement during different phases of understanding theory and philosophy. I extend my thanks to Professor Ram Chhetri for his comments which help to increase the quality of this paper. I would also like to extend my thanks to Professor
Dilli Prasad Poudel/ What is an institution? ...Vol. 14: 21-40, 2021

37
Emeritus Arild Holt-Jensen for sharing his encouraging opinion regarding this paper. Thanks also go to the reviewers for providing constructive comments.
References
Aase, T. H., Chapagain, P. S. and Tiwari, P. C. (2013). Innovation as an expression of adaptive capacity to change in Himalayan farming. Mountain Research and Development, 33:4-10.
Aase, T. H., Chaudhary, R. P. and Vetaas, O. R. (2010). Farming flexibility and food security under climatic uncertainty: Manang, Nepal Himalaya. Area, 42:228-238.
Adhikari, B., Falco, S. D and Lovett, J. C. (2004). Household characteristics and forest dependency: Evidence from common property forest management in Nepal. Ecological Economics, 48:245-257.
Agarwal, B. (2001). Participatory exclusions, community forestry, and gender: An analysis for south Asia and a conceptual framework. World Development, 29:1623-1648.
Agrawal, A., and Gibson, C. C. (1999). Enchantment and disenchantment: The role of community in natural resource conservation. World Development, 27:629-649.
Agrawal, A., and Ostrom, E. (2001). Collective action, property rights, and decentralization in resource use in India and Nepal. Politics & Society, 29:485-514.
Barley, S. R., and Tolbert, P. S. (1997). Institutionalization and structuration: Studying the links between action and institution. Organization Studies, 18:93-116.
Berger, P., and Luckmann, T. (1966). The social construction of reality: A treatise in the sociology of knowledge (Reprint edition). New York: Anchor Books,
Berry, S. (1989). Social institutions and access to resources. Africa, 1:41-55.
Chhetri, N., P. Chaudhary, Tiwari, P. R. and. Yadaw, R. B (2012). Institutional and technological innovation: Understanding agricultural adaptation to climate change in Nepal. Applied Geography, 33:142-150.
Collett, G., R. Chhetri, Jackson, W. J.and. Shepherd, K. R. (1998). Nepal Australia Community Forestry Project: Socio-economic Impact Study. ANUTECH, Canberra, Australia.
Craib, I. (1992). Anthony Giddens. London and New York: Routledge.
Dilli Prasad Poudel/ What is an institution? ...Vol. 14: 21-40, 2021

38
Crawford, S. E. S., and Ostrom, E. (1995). A grammer of institutions. The American Political Science Review, 89:582-600.
Eakin, H., and Lemos, M. C. (2010). Institutions and change: The challenge of building adaptive capacity in Latin America. Global Environmental Change, 20:1-3.
Gautam, A. P., Shivakoti, G. P. and Webb, E. L. (2004). A review of forest policies, institutions, and changes in the resource condition in Nepal. International Forestry Review, 6:136-148.
Gautam, A. P., Webb, E. L. and Shivakoti, G. P. (2002). Local participants' perceptions about socio-economic and environmental impacts of community forestry in the Middle Hills of Nepal. Asia-Pacific Journal of Rural Development, 12:60-81.
Giddens, A. (1984). The consitution of society: Outline of the theory of structuration. Berkeley and Los Angeles:University of California Press.
Gupta, J., Termeer, C., Klostermann, J., Meijerink, M. v. d. B.,. Jong, P, Nooteboom, S. and Bergsma, E. (2010). The adaptive capacity wheel: a method to assess the inherent characteristics of institutions to enable the adaptive capacity of society. Environmental Science & Policy, 13:459-471.
Jackson, W. J., Tamrakar, R. M., Hunt, S. and Shepherd, K. R. (1998). Land-use changes in two middle Hills districts of Nepal. Mountain Research and Development, 18:193-212.
Lama, A., and Buchy, M. (2002). Gender, class, caste and participation: The case of community forestry in Nepal. Indian Journal of Gender Studies, 9:27-41.
Leach, M., Mearns, R. and Scoones, I. (1999). Environmental entitlements: Dynamics and institutions in community-based natural resource management. World Development, 27:225-247.
Malla, Y. B. (2001). Changing policies and the persistence of patron-client relations in Nepal: Stakeholders' responses to changes in forest policies. Environmental History, 6:287-307.
Martin, P. Y. (2004). Gender as social institution. Social Forces, 82:1249-1273.
Nightingale, A. J., and Ojha, H. R. (2013). Rethinking power and authority: Symbolic violence and subjectivity in Nepal's Terai forests. Development and Change, 44:29-51.
North, D. C. (1990). Institutions, institutional change and economic performance. New York: Cambridge University Press.
Dilli Prasad Poudel/ What is an institution? ...Vol. 14: 21-40, 2021

39
Ojha, H. R., Timsina, N., Kumar, C., Belcher, B., Banjade, M. R., Chheri, R. and Nightingale, A. (2008). Community-based forest management programmes in Nepal: An overview of contexts, policies, practices and issues. Pages 25-54 in H. R. Ojha, N. P. Timsina, C. Kumar, M. R. Banjade, and B. Belcher, editors. Communities, Forests and Governace: Policy and Institutional Innovations from Nepal. New Delhi: Adroit.
Oldekop, J. A., Sims, K. R. E.,. Karna, B. K, Whittingham, M. J. and Agrawal, A. (2019). Reductions in deforestation and poverty from decentralized forest management in Nepal. Nature Sustainability, 2:421-428.
Ostrom, E. (1986). An agenda for the study of insitutions. Public Choice, 48:3-25.
Ostrom, E. (2005). Understanding the diversity of structured human interactions. Pages 3-31 New Jersey: Princeton University Press.
Ostrom, E. (2009). A general framework for analyzing sustainability of social-ecological systems. Science, 325:419-422.
Poudel, D. P. (2014). REDD+ comes with money, not with development: An analysis of post-pilot project scenarios from the community forestry of Nepal Himalaya. International Journal of Sustainable Development & World Ecology, 21:552-562.
Poudel, D. P. (2018). Are traditional and modern forestry institutions complementary or do they prescribe contradictory rights in Trans-Himalayan Nepal? A lesson to be learned for REDD+ implementation. Norsk Geografisk Tidsskrift - Norwegian Journal of Geography, 72:13-26.
Poudel, D. P. (2019). Migration, forest management and traditional institutions: Acceptance of and resistance to community forestry models in Nepal. Geoforum, 106:275-286.
Searle, J. R. (2005). What is an institution? Journal of Insitutional Economics, 1:1-22.
Seo, M. G., and Creed, W. E. D. (2002). Institutional contradictions, praxis, and institutional change: A dialectical perspective. Academy of Management Review, 27:222-247.
Smith, D. W. (2016). Phenomenology.in E. N. Zalta, editor. The Stanford Encyclopedia of Philosophy. https://plato.stanford.edu/archives/win2016/entries/phenomenology/. Accessed on October 16,2020.
Dilli Prasad Poudel/ What is an institution? ...Vol. 14: 21-40, 2021

40
Springate-Beginski, O., Bhatta, B. and Booker, F. (2010). Nepal.in O. Springate-Beginski and E. Wollenberg, editors. REDD, Forest Governance and Rural Livelihoods: The Emerging Agenda. Bogor, Indonesia: CIFOR.
Thoms, C. A. (2008). Community control of resources and the challenge of improving local livelihoods: A critical examination of community forestry in Nepal. Geoforum, 39:1452-1465.
Timsina, N., and Paudel, N. S. (2003). State versus community: A confusing policy discourse in Nepal's forest management. Journal of Forest and Livelihood, 2:8-16.
Vatn, A. (2005). Instituions and the environment. Northampton, USA: Edward Elgar.
Yates, J. S. (2012). Uneven interventions and the scalar politics of governing livelihood adaptation in rural Nepal. Global Environmental Change, 22:537-546.
Young, O. R. (2010). Institutional dynamics: Resilience, vulnerability and adaptation in environmental and resource regimes. Global Environmental Change, 20:378-385.
Dilli Prasad Poudel/ What is an institution? ...Vol. 14: 21-40, 2021
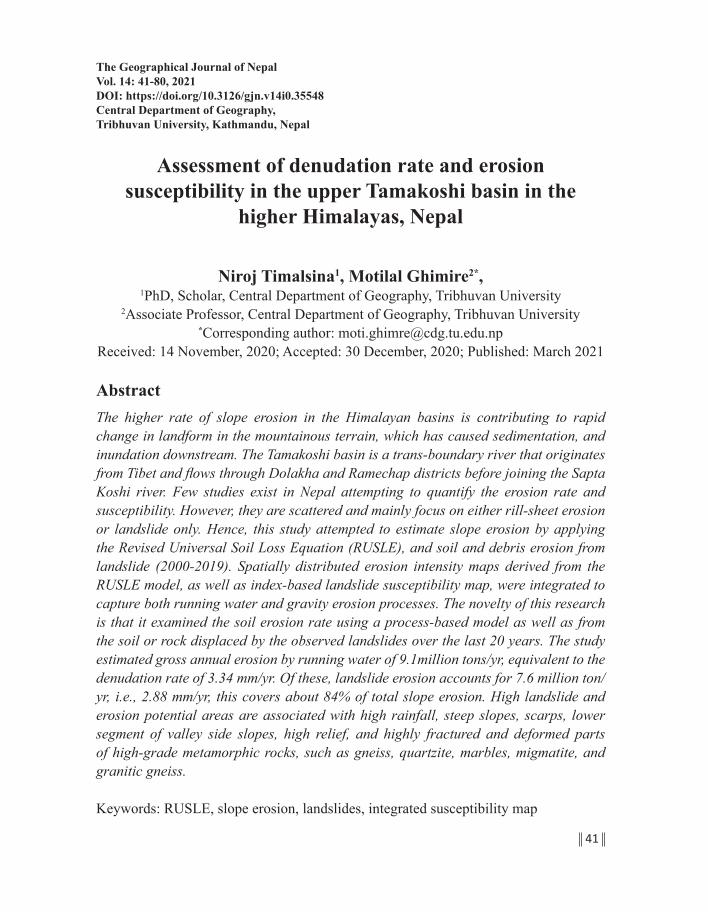
41
Assessment of denudation rate and erosion susceptibility in the upper Tamakoshi basin in the
higher Himalayas, Nepal
Niroj Timalsina1, Motilal Ghimire2*,1PhD, Scholar, Central Department of Geography, Tribhuvan University
2Associate Professor, Central Department of Geography, Tribhuvan University*Corresponding author: [email protected]
Received: 14 November, 2020; Accepted: 30 December, 2020; Published: March 2021
AbstractThe higher rate of slope erosion in the Himalayan basins is contributing to rapid change in landform in the mountainous terrain, which has caused sedimentation, and inundation downstream. The Tamakoshi basin is a trans-boundary river that originates from Tibet and flows through Dolakha and Ramechap districts before joining the Sapta Koshi river. Few studies exist in Nepal attempting to quantify the erosion rate and susceptibility. However, they are scattered and mainly focus on either rill-sheet erosion or landslide only. Hence, this study attempted to estimate slope erosion by applying the Revised Universal Soil Loss Equation (RUSLE), and soil and debris erosion from landslide (2000-2019). Spatially distributed erosion intensity maps derived from the RUSLE model, as well as index-based landslide susceptibility map, were integrated to capture both running water and gravity erosion processes. The novelty of this research is that it examined the soil erosion rate using a process-based model as well as from the soil or rock displaced by the observed landslides over the last 20 years. The study estimated gross annual erosion by running water of 9.1million tons/yr, equivalent to the denudation rate of 3.34 mm/yr. Of these, landslide erosion accounts for 7.6 million ton/yr, i.e., 2.88 mm/yr, this covers about 84% of total slope erosion. High landslide and erosion potential areas are associated with high rainfall, steep slopes, scarps, lower segment of valley side slopes, high relief, and highly fractured and deformed parts of high-grade metamorphic rocks, such as gneiss, quartzite, marbles, migmatite, and granitic gneiss.
Keywords: RUSLE, slope erosion, landslides, integrated susceptibility map
The Geographical Journal of NepalVol. 14: 41-80, 2021DOI: https://doi.org/10.3126/gjn.v14i0.35548Central Department of Geography, Tribhuvan University, Kathmandu, Nepal

42
IntroductionSoil and bedrock erosion, i.e., slope erosion, is a primary geomorphic process in the Himalayan watershed, causing soil and rocks loss in mountain slopes and sedimentation in the valleys and lowland plains (Burbank, et al., 2012). The steep slopes, depleted forest cover, unsustainable agricultural practices, intense monsoon rainfall, and active tectonics, make the Himalayan region highly susceptible to slope erosion (Jain, Kumar, and Varghese, 2001).
There exists a wealth of anecdotal information, but quantitative studies on current rates of soil and bedrock erosion in Nepal are still few. Understanding slope erosion and its role in landscape development has been an essential task in geomorphology. Erosion processes are the agents of landform changes both in the short and long run. Nevertheless, they cause land degradation, disruption of land uses and ecology (Schuster and Highland, 2007), and damage to life and property.
In recent decades, the erosion process in Nepalese mountains has intensified due to growing development activities, including haphazard road construction (Leibundgut, et al., 2016; McAdoo, et al., 2018). At this backdrop, quantification of slope erosion and spatially distributed erosion susceptibility map is crucial to prioritize the soil and forest conservation efforts in the upper watershed and provide information for developing hydropower projects, irrigation, and disaster-resilient urban development downstream.
Various studies have estimated the erosion rate in the Himalayas using a broad spectrum of approaches. Thiede, et al. (2004) measured exhumation rates along the Himalayan front in India and found that the highest rates were in the region of highest precipitation. In contrast, others (Burbank, et al., 2003) have suggested that at the time-scale of 105 –106 yr, erosion rates in the Himalayas are driven primarily by tectonic rates. Gabet, et al., (2008) measured sediment load and proposed a rapid but intermittent erosion by glaciers in the Marshyangdi watershed of the Himalayas. This glacial erosion balances the more steady erosion in the landslide-dominated southern watersheds such that, over time, the entire region is being eroded at approximately the same rate.
Similarly, Morin, et al. (2018) used doppler current profiler measurements with depth profiles and daily surface samplings of the suspended load to determine sediment flux and erosion rate. Also, some study has estimated the erosion rate using the field measurement techniques (Ghimire, Higaki, and Bhattarai, 2013). Likewise, several studies exist on soil erosion using the Universal Soil Loss Equation model and revised version and landslide susceptibility, but these studies were done individually that lacked
Niroj Timalsina, Motilal Ghimire/ Assessment of denudation ...Vol. 14: 41-80, 2021

43
integration in approach to provide an overall perspective and understanding of erosion of a basin (Shrestha, 1997; Thapa, 2020). Therefore, this study attempts to integrate the results of two different approaches to evaluate and estimate the Himalayan river basin's erosion susceptibility and rate. It intends to bring different approaches together in a common framework and findings, which was not much practiced in the Himalayan terrain study.
GIS and RS based erosion models are being used for assessing soil erosion, among which revised universal soil loss equation (RUSLE) is common worldwide (Angima, et al., 2003; Kouli, Soupios, and Vallianatos, 2009; Ban, Yu, and Jeong, 2016; Teng, et al., 2018; Sigh and Singh, 2020) and Nepal is no exception (Uddin, Martin, and Maharjan, 2018; Bastola, et al., 2019; Chalise and Kumar, 2020; Koirala, et al., 2019; Thapa, 2020). RUSLE is generally efficient to predict the water-induced rill and sheet soil erosion. Soil loss in the Himalayas and tectonically active mountains elsewhere is contributed mainly by mass movement processes (Korup, Densmore, and Schlunegger, 2010; Gabet et al., 2008; Morin et al., 2018) and should consider the erosion due to the mass movement process as well. Mass movement is the down slope movement of the soil and/or rock (Cruden and Varnes, 1996). It is a gravity erosion process that contributes to a huge amount of sediment with or without the action of water and ice (Selby, 1993).
Study area The area drained by the Tamakoshi River was selected for the study. It is a tributary basin of the Saptakoshi river basin, which originates from Tibet, China. It extends from 27° 48′ 55″ to 28° 19′ 32″ in the north and from 86° 04′ 41″ to 86° 33′ 26″ in the east. The basin's outlet constitutes the site of the proposed Tamakoshi V Hydro-electricity project, which is a cascade project of the national pride Upper Tamakoshi hydro project. Similarly, other projects are also being constructed or planned. Quite a large population lives in rural and urban areas downstream, which can be affected by the flood, bank erosion, and sedimentation. It is also assumed that sediment load has increased after April 2015 Earthquake and aftershock (max Mw 7.8-6.9) in the basin.
The trans-boundary part (Tibetan Part) of the Upper Tamakoshi basin comprises Neo proterozoic to Eocene sedimentary rocks deposited in the Tethys basin that separated the Indian and Eurasian plates before their collision (Hagen 1968; Dhital, 2015). These rocks are strongly folded and imbricated , weakly metamorphosed. The surface geology of this part is primarily modified by snow and glacier, and frost action. These processes have sculptured the landform. The geology of the southern part of Nepal's basin
Niroj Timalsina, Motilal Ghimire/ Assessment of denudation ...Vol. 14: 41-80, 2021

44
belongs to the Higher Himalayan Tectonic unit of eastern Nepal. Rock mass in this unit characterizes Precambrian high-grade metamorphic rocks such as gneiss, quartzite, marbles, migmatite , and granitic gneiss (Schelling 1987; Basnet and Panthi, 2017). Due to active tectonics, this region is subject to compression and accumulation of energy, which is being released through the rapture of tectonic faults and fractures during earthquakes. As a result, the southern part of the study area has a complex tectonic stress regime. The southern part of the basin's rock mass has three distinct joint sets, including foliation joints (Panthi, 2019). This geological situation indicates a fragile terrain.
About 67% of the study area is located in Tibet. The Tamakoshi basin extends from the High Mountain to the High Himalayan range, ranging from 1096 to 7315 masl with a total area of 2159.3 km2. Almost 54% of the basin is located at an elevation higher than 5000masl. The worldclim data showed that the annual average temperature varies from -11.8 to 11.55 °C (Fick and Hijmans, 2017). However, the temperature recorded in the nearest station at Jiri ranges from -2 to 25 °C (Shrestha, Bajracharya, and Babel, 2016). Similarly, the annual average rainfall ranges from 249-2454 mm (Fick and Hijmans, 2017), and higher rainfall is concentrated in the river valley in the Nepalese part (Figure-3).
About 80% of the total land is either covered with snow or barren rocky land. Most of the barren land is covered with snow in winter. Similarly, grassland, shrub/bushes, and forest account for 7.3%, 3.7%, and 5.3%, respectively. Only 0.5% of the land is cultivated, which is localized in the lower part of the basin (Figure-5). Settlements, as well as housing patterns, are scattered in the lower region in Nepal (Figure-1). However, in the upper region, settlements are scattered characterizing traditionally compact spacing of houses to adapt to cold alpine conditions and a fragmented resource base caused by the High Himalayan terrain. Tamang and Sherpas in Nepal, and Tibetans in the Chinese part are the major ethnic groups adhering to Tibetan Buddhism traditions living in this basin. These people are engaged in agro-pastoral farming as well as partly in tourism and trading activities. In this connection, this study attempts to estimate the slope erosion rate and produce a spatially distributed erosion susceptibility map of the area, where human intervention is comparatively low. However, the sediments yield from this basin could impact development projects and human life and activities downstream.
Niroj Timalsina, Motilal Ghimire/ Assessment of denudation ...Vol. 14: 41-80, 2021

45
Figure 1: Location map of the Tamakoshi basin showing with altitudinal distribution
Methods and materials Rationale of models and a short review
The basic underlying principle of determining soil and landslide erosion and susceptibility of the terrain is that these processes do not occur randomly or by chance (Crozier, 1986; Guzzetti et al., 1999). Slope failures and erosion in space and time are the results of the strength and interplay of physical processes and mechanical laws against the controlling and triggering factors, which determine erosivity, erodibility, stability, or failure of a slope (Aleotti and Chowdhury, 1999; Varnes, 1984; Wischmeier and Smith, 1978; Selby 1993; Ghimire and Timalsina, 2020). These physical phenomena, which control the incidences and intensity of erosion and landslide occurrence in various sizes and types in space and time, can be modeled to determine erosion and landslide susceptibility. Numerous processes based on physical soil erosion models are developed for predicting soil erosion. These models represent detachment, transport, and deposition processes.
Niroj Timalsina, Motilal Ghimire/ Assessment of denudation ...Vol. 14: 41-80, 2021

46
A few popular such models are USLE (Wischmeier and Smith, 1978); RUSLE (Renard et al., 1991); SWAT (Arnold et al., 1998); WEPP (Nearing, Ascough, & Chaves, 1989); EUROSEM (Morgan, et al., 1998) and others. The recent trend of publication using soil erosion models indicates that researchers rely on erosion models' capacity to estimate soil loss rates and sediment yields and simulate erosion responses to land use and climate change (Batista, et al., 2019). However, various studies have evaluated that un-calibrated erosion models' predictive accuracy is often limited (de Vente et al., 2013; Jetten, de Roo, and Favis-Mortlock, 1999; Van Rompaey et al., 2003). Still, these erosion models with calibration or customized to local biophysical conditions are applied to influence decision-making in matters of erosion control and watershed management. Erosion contributed by landslides in the Himalayas have done recently by several authors have reaffirmed that throughout the Himalayas, mass wasting is the dominant erosional processes on hill slopes and the main source of sediment to rivers (Burbank et al., 1996; Hovius et al., 1997; Densmore and Hovius, 2000; Gabet et al., 2004; Struck, et al., 2015; Morin et al., 2018; Marc et al., 2019). Erosion studies carried out on the mountains, undermining landslides' erosion will only reflect the partial state of the erosion. Hence, the estimation of erosion through the volume of soil and bedrock loss from the inventory landslides needs to be integrated with the RUSLE erosion map. Similarly, several deterministic or statistical models are increasingly used for landslide susceptibility assessment in recent times (Felicísimo et al., 2013). Deterministic models are process-based, which rely on the geotechnical property of slope, soil, lithology, and subsurface hydrology that either represents driving or resisting force (Montgomery and Dietrich, 1994; Formetta et al., 2016). The result is more accurate and predictive, but surveyed data usually is not available, and field data collection is expensive and takes time to assess spatially distributed susceptibility over a large region.
Statistical models are based on evidence represented by landslide occurrences (Van Westen, 1997; Ghimire et al., 2001; Reichenbach, et al., 2018), which are related to causative geo-environmental factors, whose layers can be generated from maps and imageries. The weights for these factors are assigned based on statistically calculated values. Weight of evidence, frequency ratio, or multivariate statistics are popularly used statistical models in determining landslide susceptibility. In the absence of geotechnical data, this approach is a better alternative, as they have provided reliable results with easily available data (Eeckhaut et al., 2012; Piacentini et al., 2012; Cui, Lu, & Li, 2017; Van Westen, 2000; Ghimire et al., 2011).
Niroj Timalsina, Motilal Ghimire/ Assessment of denudation ...Vol. 14: 41-80, 2021

47
Materials and methodsEstimation of slope erosion and susceptibility assessment was done by three-step approaches. The first step is represented by the RUSLE model which estimates spatially distributed surface erosion. The second approach is the estimation of soil and bedrock loss from the inventoried landslides and landslide susceptibility assessment. The third step is the integration of RUSLE erosion map with the landslide susceptibility map to produce an integrated slope erosion map.
GIS & RS technology was applied to generate the layers representing the factors determining erosion and influencing the terrain's susceptibility. GIS-based RUSLE model and statistically derived landslide index are the main tools used in the study.
The overall methodology adopted in the study is summarized in Figure 2.
Figure 2: Flow charts showing the method adopted in the study.
Niroj Timalsina, Motilal Ghimire/ Assessment of denudation ...Vol. 14: 41-80, 2021

48
RUSLE model
Several empirical models have been developed for estimating soil erosion in watersheds; among these, the most used during the past 30 years is the Universal Soil Loss Equation (USLE). Its revised version, i.e., Revised Universal Soil Loss Equation (RUSLE), has been employed in this study. The RUSLE is an empirical model for the prediction of the long-term average annual rate of soil erosion (expressed in tons/ha/yr), by combining several factors having a bearing on the erosion rate, namely; rainfall erosivity, soil erodibility, steepness and length of the slope (topography), vegetation cover and conservation support practices. The input parameters were generated in the GIS platform in various thematic maps used in equation (1) (Figure-5) (Renard et al., 1997).
A = R * K * L S * C * P eq (1)
Where A: computed annual soil loss per unit area [ton/ha/year]
R: Rainfall erosivity factor, an erosion index for the given storm period in [MJ mm·ha−1·hr−1·year−1]
K: Soil erodibility factor
LS: Topographic factors
C: Cover-management factor-ratio of soil loss P: Support practice factor-ratio of soil loss with a support practice contour tillage, strip cropping, terracing to soil loss with row tillage parallel to the slope.
Rainfall erosivity factor (R): The rainfall-runoff erosive factor, R, is calculated from the following relationship (Morgan, 1984):
ʌ = 79 + 0.363ʌ
Where p is the average annual rainfall, mm. The annual rainfall was obtained from the WorldClim database that provided 1 km spatial resolution climatic data (Fick and Hijmans, 2017). The study area's average annual rainfall ranges from249-2454 mm (Figure-3).
Niroj Timalsina, Motilal Ghimire/ Assessment of denudation ...Vol. 14: 41-80, 2021
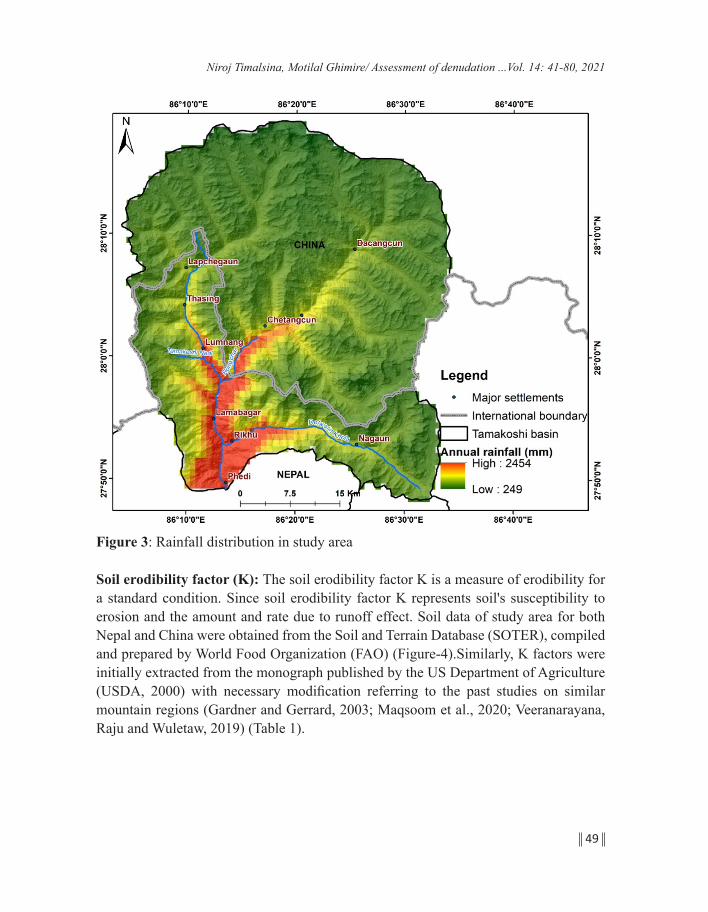
49
Figure 3: Rainfall distribution in study area
Soil erodibility factor (K): The soil erodibility factor K is a measure of erodibility for a standard condition. Since soil erodibility factor K represents soil's susceptibility to erosion and the amount and rate due to runoff effect. Soil data of study area for both Nepal and China were obtained from the Soil and Terrain Database (SOTER), compiled and prepared by World Food Organization (FAO) (Figure-4).Similarly, K factors were initially extracted from the monograph published by the US Department of Agriculture (USDA, 2000) with necessary modification referring to the past studies on similar mountain regions (Gardner and Gerrard, 2003; Maqsoom et al., 2020; Veeranarayana, Raju and Wuletaw, 2019) (Table 1).
Niroj Timalsina, Motilal Ghimire/ Assessment of denudation ...Vol. 14: 41-80, 2021

50
Figure 4: Soil types in study area
Table 1: Distribution of K factors on soil types
Soil types (FAO system)
Subunits Characteristics K (tons ha h ha−1
MJ−1mm−1)
Justification for K value
Leptosols Eutric Leptosols
Strongly, gravelly, and/or stony and has formed a relatively deeper horizon then Gelic Leptosols
0.34 Low vegetation cover owing to the limited thickness of the soil, exposed the soil for erosion
Gelic Leptosols
Soils have a shallow layer over the bedrock and generally covered with snow
0.26 This thin layered soil on the rocks of the alpine area favors low erodibility
Niroj Timalsina, Motilal Ghimire/ Assessment of denudation ...Vol. 14: 41-80, 2021

51
Soil types (FAO system)
Subunits Characteristics K (tons ha h ha−1
MJ−1mm−1)
Justification for K value
Gleysols Soils are formed under waterlogged conditions and closely associated with the glacier in the study area
0.2 Soil particles normally stick together in frozen soil and thus are more resistant to erosion
Cambisols Gelic Cambisols
Found in semi humid and/or partially humid on sub-alpine to alpine regions with sub percolative hydrological regime (Goryachkin & Targulian, 1990)
0.25 A moderate rate of erosion is expected as soils contain some silt and sand fractions
Humic Cambisols
Composed of medium to fine-textured materials derived from a wide range of rocks, mostly in alluvial, colluvial and aeolian deposits (FAO, 2015)
0.48 A higher rate of erosion is expected as agriculture is practiced the steep terraces in the study area
Regosols Eutric Regosols
Very weakly developed mineral soils in unconsolidated materials (ISRIC, 2020b)
0.5 Regosols are well recognized for their high erodibility in mountainous terrain
Luvisols Haplic Luvisols
Higher clay content and composed of unconsolidated materials including glacial till, andaeolian, alluvial and colluvial deposits (FAO, 2015)
0.35 Luvisols in the study area is having a high silt content, which may be affected by a moderate rainfall and, therefore, are vulnerable to soil erosion
Topographic factors (LS): The topographical factor constitutes two factors named slope length (L) and slope steepness (S). Slope length (L) is the effect of slope length on erosion. The slope length is a function of flow accumulation that is defined as the distance from the point of origin of overland flow to the point where either the slope decreases to the extent that deposition begins or runoff water enters a well-defined channel. Slope steepness (S) represents the effect of slope steepness on erosion (Smith
Niroj Timalsina, Motilal Ghimire/ Assessment of denudation ...Vol. 14: 41-80, 2021

52
and Wischmeier, 1957). The effects of slope steepness have a greater impact on soil loss than slope length. Steeper the slope, the greater is the erosion. Thus, the LS is calculated as (Ganasri and Ramesh, 2016):
LS QaM Sg Sgy
=
= +( )∧
22 130 065 0 045 0 005 2
.* . . * . *
Where, LS = Topographical factor; Qa = Flow Accumulation grid; Sg = Grid slope in percentage; M =Grid size (x X y), y = dimensionless exponent which depends on slope steepness, being 0.5 for slopes exceeding 4.5%, 0.4 for 3-4.5% slopes, 0.3 for 1-3%, and 0.2 for slopes less than 1% (Wischmeier and Smith, 1978). Topographic slope factor (SL) was computed from Shuttle Radar Topographic Mission (SRTM) digital elevation model (DEM) having 30 m resolution.
Land cover: Land cover was derived from Google Earth image of 2018-2019 depending upon the quality of the image and cloud cover condition. Land cover classes were visually interpreted using interpretation keys such as tone, color, texture, pattern, shape, size, and association.
The land cover factor, C, affects the erosion rate through vegetation cover, cropping, and management practices. Table-2 summarizes the C factor for the different land cover classes, which is assigned according to Koirala, et al., 2019. However, C factor for snow was assigned as 0.2 as snow-covered parts in the basin experience seasonal freezing and melting processes that trigger soil erosion. This erosion can also be attributed to seasonally thawed soils by snow- and ice-melting runoff in the study basin's high altitude (Ban et al., 2016).
Table 2: Land cover and their C factors
Land cover Area (Sq Km) Percentage (%) C FactorBarren land 467.5 21.7 0.45Built-up area 0.3 0.0 0.001Cultivated land 10.0 0.5 0.21Forest 115.2 5.3 0.01Glacier & Moraine 153.6 7.1 0.01Grassland 156.9 7.3 0.03Lake 14.2 0.7 0.001River & riverbed 11.1 0.5 1Shrub/bushes 79.8 3.7 0.03Snow 1150.6 53.3 0.2
Niroj Timalsina, Motilal Ghimire/ Assessment of denudation ...Vol. 14: 41-80, 2021

53
Figure 5: Land cover (2019), Upper Tamakoshi basin
Support practice factor (P): P factor accounts for control practices that reduce the erosion potential of runoff by their influence on drainage patterns, runoff concentration, runoff velocity, and hydraulic forces exerted by the runoff on the soil surface (Renard et al., 1991). In the present study, no information concerning such practices is available. Hence, the P factor was assigned a value equal to 1 throughout the watershed area by assuming that virtually no conservation measures are taken.
Estimation of slope erosion rate The overall slope erosion rate was estimated by summing up the RUSLE's erosion model and the landslide evacuated soil and rock debris mass.
Total slope erosion = RUSLE soil loss + Soil and bedrock erosion from landslide
Niroj Timalsina, Motilal Ghimire/ Assessment of denudation ...Vol. 14: 41-80, 2021

54
The RUSLE estimates the total mass of the soil erosion, which is converted into a volume using the equation:
Mass (Kg) = Volume (m3) / Density (Kg/m3), where, Mass = RUSLE soil loss in Kg & Density = Soil density of landslide =1260 Kg/m3(Yang & Gao, 2018)
Similarly, the volume of soil and rock debris evacuated by landslide events was used to estimate the erosion rate from landslide between 2000 - 2019. Landslides were classified into shallow or bedrock types depending on their material, mechanism of failure, and dimension. Subsequently, scars of the landslide were converted into a volume using the formula (Larsen, et.al, 2010):
, where, V = Volume of landslide (m3) and = Area of individual landslide scar (m2)
For shallow landslide:
log 10 α = -0.649 ±0.021 & ¥= 1.262 ± 0.009
For bed rock landslide
log 10 α = -0.63 ±0.06 & ¥= 1.41 ± 0.02
Finally, denudation rate is evaluated as Erosion rate = Volume/Total area of basin and reflect in mm/yr.
Landslide susceptible assessmentLandslide inventory
Inventory of landslide is the first step to analyze the landslide susceptibility, and this was performed from the Google Earth images of the years between 2000-2019 and LANDSAT 8 images. Altogether 262 landslides were inventoried, including shallow and bedrock slides, with total coverage of 1237.5 ha (Table 3). Subsequently, inventoried landslides were segregated into pre-and post-situation of the 2015 April earthquake (Figure-6).
Niroj Timalsina, Motilal Ghimire/ Assessment of denudation ...Vol. 14: 41-80, 2021

55
Table 3: Landslide distribution in the Tamakoshi basinInventoried landslide
Number of landslides Area in haShallow Bedrock Total Total area
(ha)Minimum Maximum Mean
Before earthquake (2000-2014)
114 25 139 838.2 0.23 104.5 6.03±11.02
After earthquake (2015-2019)
111 12 123 399.4 0.04 49.9 3.25±6.8
Total 225 37 262 1237.5 0.04 104.5 4.7±9.4
Figure 6: Distribution of landslide in pre-post April 2015 earthquake
Before the April-2015 earthquake, debris flow was the dominant failure type, followed by rock fall and cliff erosion. More than 80% of such debris flow were shallow types. The other landslides include typical landslides such as debris slides, complex slides,
Niroj Timalsina, Motilal Ghimire/ Assessment of denudation ...Vol. 14: 41-80, 2021

56
wedge failure, slump, shallow landslides, river undercut failures. Widespread rocky cliff and steep slopes exposed to frost action and weathering trigger rock fall and cliff erosion, debris flow, avalanche or slides. Many debris flows in higher altitudes seem to originate from snow-melt water carrying a massive load of debris. Typically steep slopes, scarps, high relief, and toe slopes dominated the location of landslides, which indicate past earthquake failures, river incision in addition to rainfall effect.
Post-earthquake landslide inventory revealed the higher occurrence of rock fall or rockslides, debris flow, which originated from the upper slopes as compared to other types of failures were detected. Post-earthquake landslides are primarily located on high scarp slopes close to sharp ridgelines, slope breaks, and steep V-shaped slopes. Many debris flows seem to originate from the colluvialor earlier landslide deposits stored at the slope-breaks. Many landslides evolved into channelized debris flow on the slopes.
Although the post-earthquake landslides are small in size, their numbers are quite greater than the pre-earthquake situation. This indicates that episodic events like earthquake increase the susceptibility of terrain to widespread shallow to moderate landslides events. These landslide events have contributed to a large amount of sediment load in the Tamakoshi River. A perceptible rise in siltation was seen close to the Tamakoshi Hydropower Project. Hence, the integration of a landslide susceptibility map to evaluate soil erosion in the basin becomes relevant and justified.
Figure 7: Post-earthquake landslide scars seen on imageries covering the southern part of the basin
Niroj Timalsina, Motilal Ghimire/ Assessment of denudation ...Vol. 14: 41-80, 2021

57
Landslide susceptibility indexLandslide susceptibility is the likelihood of a landslide occurring in an area based on local terrain conditions (Brabb, 1985). It predicts “where” landslides are likely to occur (Guzzetti et al., 2005).
Landslide index, a bivariate technique, is used to evaluate the landslide susceptibility. For this, seven landslide influencing parameters were prepared in the ArcGIS environment (Table-4).
Table 4: Landslide susceptibility mapping parameters and their justification
Parameters Descriptions & JustificationsSlope Aspect Aspect plays an important role in controlling landslides' spatial
distributions by influencing several factors such as radiation intensity, soil temperatures, and humid conditions. In some cases, aspect effects on triggering landslide by intense wetting and drying cycles.
Slope gradient Slopes in combination with the slope material cohesion, angle of repose, and moisture conditions normally determine slope stability conditions. It is a very important parameter in the slope stability analysis, and it is frequently used in preparing landslide susceptibility maps (Pradhan and Kim, 2014; Nepal et al., 2019; Shrestha, Kang and Choi, 2019).
Elevation-relief ratio The elevation-relief ratio is defined as mean elevation minus minimum elevation divided by relief. This variable can capture the overall morphology of an area, which is also good descriptors of landslide terrain (Carrara, 1983; Carrara et al., 1995; Pachauri, Gupta, and Chander, 1998; Kayastha, Dhital, and Smedt, 2013)
Stream power index SPI was calculated using DEM in GIS. The Stream Power Index (SPI) is a measure of the erosive power of flowing water. SPI is calculated based upon the slope and contributing area. SPI approximates locations where gullies might be more likely to form on the land and cause erosion (Finlayson and Montgomery 2003; Devkota, et al., 2013)
Niroj Timalsina, Motilal Ghimire/ Assessment of denudation ...Vol. 14: 41-80, 2021

58
Parameters Descriptions & Justifications
Geomorphic landscape unit
Geomorphic landscape unit was identified based on the evidence of landslides scars both old and new and footprints of erosion such as highly dissected or degraded bare slope. Based on the frequency and extent of the evidence of the geomorphic processes, the whole study area was divided into five categories, i.e., very high, high, moderate, low, or very low. The inclusion of this layer in the analysis will increase the predictability of the landslide susceptibility.
Vegetation density Vegetation is widely accepted to stabilize slopes against landslides. Therefore, obtaining information about land use and land cover dynamics is for assessing landslide susceptibility. Various studies suggest that the vegetation cover creates an important stabilizing effect against landslides and that forested areas are less prone to slope failure than other vegetation types. Vegetation density is represented by the Normalized Difference Vegetation Index (NDVI) using red and infrared satellite imageries of the area.
Land use/Land cover Land use and land cover influence the incidences of landslides in various ways. Barren area or degraded area, and unscientific cultivation on steep slopes are prone to landslides occurrence. The role of the forest is described in the preceding row.
In the Landslide index method, the roles of each landslide influencing parameter were analyzed with inventoried landslides. Accordingly, landslide susceptibility weights for each parameter class were calculated. This method assumes that landslides will occur in the future in a similar condition as they occurred at present and in the past. A weight-value for a parameter class, such as a certain lithological unit or a certain slope class, is defined as the natural logarithm of the landslide density in the class divided by the landslide density in the entire map (Van Westen, 1997):
ln Wi = ln Density classDensitymap
Where,
Wi = Calculated weight of certain factor class.
Density Class = the landslide density of each factor class.
Density Map = the landslide density within the entire map.
Ln= Natural logarithm.
Niroj Timalsina, Motilal Ghimire/ Assessment of denudation ...Vol. 14: 41-80, 2021

59
The method is based on the map crossing of the landslide map with a certain factor map. Map crossing results in a cross-table that can be used to calculate the density of landslides per factor class. Landslide susceptibility index (LSI) is determined by the summation of each factor’s ratings using the equation (Lee and Pradhan, 2006).
LSI Wii
N
=−∑
1
Where Wi = Calculated weight to each i factor
N = Total number of factors
Integrated erosion susceptibilityBoth indexes computed from RUSLE and Landslide susceptibility assessment are transferred into common scale 0-1, using maximum-minimum transformation. Subsequently, overall erosion susceptibility was calculated as:
Erosion susceptibility =RSULEindex LSIindex+
2
Finally, natural break classification was used in ArcGIS to show spatial variation of erosion susceptibility in the study area.
Results and discussionsOverall soil loss potentiality
The waters induced erosion included splash, sheet, rill, and gully whereas gravity caused mass movement involved slides, flow, and fall. These both phenomena are causing massive soil erosion in the Nepal Himalayas. Thus, overall erosion is estimated by integrating the estimation from RUSLE and erosion by the landslide.
Characteristics of soil erosion factors considered in RUSLE models
Five parameters contributing to soil erosion were prepared in ArcGIS environment and the annual rate was estimated using the equation-1.
Rainfall erosivity factor (R)
The amount and intensity of rainfall in a particular area determine factors in soil detachment from the earth's surface (Shrestha, 1997). The average rainfall is 537.3 mm with a range of 249-2454mm. Consequently, the estimated mean erosivity of the study
Niroj Timalsina, Motilal Ghimire/ Assessment of denudation ...Vol. 14: 41-80, 2021

60
area is 433.6 ±76.3 MJ mm/ha/hr/year (Figure-8). The higher erosivity with the mean of 730.7±96.5MJ mm/ha/hr/year is concentrated in the lower segment of the valley side slopes, which includes Lumnang, Lambagar, and Phedi area. The altitude of this area is less than 3000m which covers less than 5% of the total area of the basin. Similarly, about 40% of the basin is located at the altitude of 3000-5000m, having an average erosivity of 352.1±106.4 MJ mm/ha/hr/year. The land above the 5000 m, receives the less amount of rainfall with an average of 358.9 ± 46 mm.
Consequently, the average erosion rate is estimated 217.3±32.7MJ mm/ha/hr/year. The decreasing trend of rainfall with altitude in the study area can be attributed to less moisture content in the cloud in the summer and an increase in solid precipitation in winter at the higher elevation. A similar trend was found in the Chenab basin in the western Himalayas, India (Singh, Ramasastri, and Kumar, 1995) and Annapurna region of Nepal (Putkonen, 2004).
Figure 8: Rainfall erosivity factors of the Upper Tamakoshi BasinTopographic factors (LS)
Niroj Timalsina, Motilal Ghimire/ Assessment of denudation ...Vol. 14: 41-80, 2021

61
Normally, soil erosion is expected to increase with an increase in steepness and length of slope due to an increase in surface runoff volume and velocity (Chalise, Kumar, and Kristiansen, 2019; Holz et al, 2015). In the Tamakoshi watershed, LS ranges from 0.06 to 65.74 (Figure-9), with an average of 0.3±0.56. More than 90% of the basin has LS value ranging from 0.06-1.1 indicate a moderate level of erosion susceptibility (Maqsoom et al., 2020). Moreover, mean LS is found as 0.63±0.82, 0.43±0.62, and 0.38±0.5 for the altitudinal distribution of less than 3000m, 3000-5000m, and more than 5000 m, respectively. This indicates that both the ruggedness and steepness of terrain are decreasing with altitude, thereby decreasing erosion susceptibility.
Figure 9: Distribution of topographic factor (LS)
Soil erodibility factor
The soil textures, and other soil characteristics, affect its susceptibility to erosion. Therefore, K factors are determined considering their inherent properties to resist the erosion stress (Table-1). The K factors are higher for the soil types such as Eutric
Niroj Timalsina, Motilal Ghimire/ Assessment of denudation ...Vol. 14: 41-80, 2021

62
Regosols, Humic Cambisols, Eutric Leptosols, and Haplic Luvisols, found along lower hill slope of the Tamakoshi and its tributaries. These soils normally have coarser textures and are higher susceptible to water-induced erosion (Gardner and Gerrard, 2003). Moreover, Eutric Regosols contained more than 75% of the cultivated land with an average slope of 25.6±10.7 degrees in the study area. This condition and the low coherence of the matrix materials make the Regosols in a sloping area prone to severe erosion (Mul et al., 2015). Similarly, the average slope of Humic Cambisols is 36.1 ±12.6 degrees, and the area is receiving the highest rainfall in the basin with an annual average of 1514.05 ±418.9 mm. The transitional stage of soil development, from young to mature on steep terrain receiving higher rainfall, this soil formation is also susceptible to intensive erosion.
The lower hill slope in and around Chentagcun, Qiase, Cangmujiancun, Long Muri, and Kaer of Tibet are composed of Haplic Luvisols, which has a mean slope of 36.5±12.9 degree and receiving an average annual rainfall of 897.4±294.6 mm. About 32% of this soil is on a barren surface, easily eroded (Nikolic, et al., 2008). Similarly, Eutric Leptosols has a moderate level of erodibility whereas that of Gelic types of soil is less. Figure-10 shows the soil erodibility map of the study area.
Figure 10: Soil erosibility in upper Tamaksohi basin
Niroj Timalsina, Motilal Ghimire/ Assessment of denudation ...Vol. 14: 41-80, 2021

63
Cover-management factor-ratio of soil loss
Higher the value in C factors showed the area is more susceptible to soil loss. Land cover in combination with the slope of the area plays an important role to cause or resist the slope erosion process.
Table 5: Land cover verses slope
Land cover
Barren land
Grass land
Glacier & Moraine
Snow Lake River & riverbed
Shrub/ bushes
Cultivated land
Forest Built up area
Mean Slope (Degree)
31.9 33.0 17.6 29.4 12.6 20.4 35.2 25.6 34.4 15.5
Standard deviation
14.0 13.1 11.9 14.5 10.3 14.5 12.2 10.7 11.6 9.2
Support practice factor (P)
For this study, human intervention is low and information on support practice factor is virtually absent. Therefore, P factor is assigned as1 throughout the basin.
Soil loss and denudation rate in the upper Tamakoshi basin
The RUSLE model, estimated annual soil loss of the area ranges between 0.023 -101.01 tons/ha/yr with an average of 6.8 tons/ha/yr (Figure-11). Therefore, soil loss of the basin estimated by RUSLE is 1.5 million tons/yr which is equivalent to the denudation rate of 0.54 mm/yr.
The modeled soil losses also confirm the data obtained from the direct methods using field plots in the Likhu Khola valley (Likhu Khola Project, 1995). Soil erosion was monitored in field plots, under different land uses and management types. Soil loss on non-cultivated land is estimated at 11tons/ha/year. Under rain fed cultivation, soil losses range from 2.7 to 8.2 tons/ha from 1993 to 1995. Since the study belongs to the high Himalaya area, the erosion rate is expected higher than that estimated from the Likhu Khola valley in the Middle mountain.
Likewise, soil losses are comparatively lower (less than 10 tons/ha/yr) under land use types, such as forest, grazing land, and rice cultivation. Annual soil loss rates are maximum (up to 56tons/ha/yr) in areas under rain fed cultivation.
Niroj Timalsina, Motilal Ghimire/ Assessment of denudation ...Vol. 14: 41-80, 2021

64
Figure 11: Erosion rate (RUSLE model)
On the other hand, the average denudation rate from landslides for the last 20 years was found as 2.8 mm/yr, whereas that of pre and post-earthquake (2015) is estimated as 1.7 mm/yr and 3.0 mm/yr respectively (Table 6).
Niroj Timalsina, Motilal Ghimire/ Assessment of denudation ...Vol. 14: 41-80, 2021

65
Table 6: Landslides and soil loss from erosion
Period Soil and rock Volume (m3/yr) Denudation rate (mm/yr)Minimum Maximum Average Minimum Maximum Average
Pre-earthquake (2000-2014)
2764570.0 4604790.7 3684680.4 1.28 2.13 1.7
Post-earthquake (2015-2019)
6565369.8 12334507.0 9449938.4 3.0 5.7 4.4
Over all (2000-2019)
4405912.4 7688417.5 6047165.0 2.04 3.56 2.80
The landslides dominated part of the watershed receives precipitation over 2300 mm, i.e., one of Nepal's highest precipitation regions, which makes the area susceptible to high incidences of erosion and landslide. Similarly, twenty-four-hour maximum rainfall recorded at nearby Jiri station during the last 20 years shows an increasing trend in recent decades with a peak of 71-136 mm. This rainfall intensity indicates a threshold for initiating landslides in the last two decades. Post-earthquake 24-hour maximum rainfall between 2015-2019 AD was 136, 103, 85, and 95 mm in the respective years (DHM, 2020). The recurrence period of these extreme rain events was of the order of 25, 8, 5, and 6 years (DHM, 2020). The large volume of soil loss by landslides in the post-2015 earthquake era with subsequent aftershocks was attributed to the coupling of higher intensity rainfall with tremor shattered slopes. Since mega earthquakes-like Gorkha are rare, which may occur once in 100 years, the average denudation rate calculated for the pre-earthquake situation can be expected as a normal erosion rate in the long term.
The soil and rock loss from the landslide in the last 20 years is estimated as 7.6 million tons/year, and thus, overall slope erosion is estimated as 9.1 million tons/yr, out of which contribution by landslides is 83.7%. Similarly, the overall denudation rate is estimated at 3.34 mm/yr. This contributes to the development of natural slopes of the Himalayas and the source of high sediment load in the rivers. Pioneering studies carried out by William, 1977; Caine and Mool, 1982; Kienholz et al., 1983; Fort et al., 1984; Carson, 1985 and Zimmerman et al., 1986 conclude that mass wasting is the dominant process in the evolution of natural slopes throughout much of the Nepalese Himalaya. William (1977) estimated that large landslides contributed to 31% of the sediment load of the Sapta Koshi, with a further 64% coming from small slides, surface erosion, and gullying. The enormous contribution of sediments by landslides in this basin (including the Tibetan part) can be argued that the whole basin is steep and rugged (average slope =29.5±14.4 degree).
Niroj Timalsina, Motilal Ghimire/ Assessment of denudation ...Vol. 14: 41-80, 2021

66
Caine and Mool (1982) gave an estimated surface lowering rate of 12 mm/yr by landslide events. Similarly, Gabet et al., 2008,based on measurement of sediment load estimated a denudation rate which ranged from 0.2–1.1 mm/yr in the Marsyangdi watersheds of western Nepal Himalaya, which is comparatively lower than other estimates, i.e., 2-5mm/year (Wobus et al., 2005, 2006; Hermann et al., 2010; Thiede and Ehlers, 2013; Burbank et al., 2003).
Landslide susceptibility and terrain factors The weight or index value of the landslide on different classes of each parameter is summarized in Figure-12. Among seven parameters, the effect of all parameters on the occurrence of landslides was seen. With regards to aspects, the south and east-facing slopes demonstrated a higher likelihood of landslides. These slope aspects were more vulnerable to mass-wasting events, as they received more rainfall in a lower altitude (<3000) and freeze and thaw cycle in high altitudes. Similarly, the landslides were more likely in the steeper slopes, higher elevation-relief ratio, stream power index, and erosion sensitive landscape unit. Several studies in the Himalaya have confirmed this finding (Ghimire, 2011; Dahal et al., 2008; Regmi et al., 2014). In tectonically active Himalayas, the basin with stronger relief is prone to rock falls, debris slide, debris flow, and deep-seated gravitational failures (Gabet et al., 2008; Roback et al., 2018).
In case of land cover, areas under snow, glacier-moraine, and lake have revealed negative weight, i.e., which could mean less likelihood for landslides to occur. But it should be noted that mass movement in the form of snow avalanches and snowmelt debris flow and treat-retreat of glacier and moraine, are prominent hazards in the elevation above 4500m. These processes were not included due to their complex nature, different process and mechanism that required a different approach to understand.
Finally, a bivariate analysis was performed in ArcGIS environment to construct a landslide susceptibility index map (Figure-12 and 13).
Niroj Timalsina, Motilal Ghimire/ Assessment of denudation ...Vol. 14: 41-80, 2021

67
Figure 12: Landslide susceptibility map
Niroj Timalsina, Motilal Ghimire/ Assessment of denudation ...Vol. 14: 41-80, 2021

68
Figure 13: Calculated landslide index values (weight) for classes of the parameters
Figure 14: Distribution of landslide susceptibility (top left) and erosion susceptibility (top right) index and Relation between landslide susceptible index and soil erosion index (n= 200) (bottom left).
Spatial correlation and integrated soil erosion, slope erosion susceptibility map
Both RUSLE soil erosion and Landslide susceptibility indices were converted into common scale 0-1, through maximum-minimum transformation. By examining the spatial relationship between these two indices map, it was found that there exists a significant correlation between soil erosion and landslide susceptibility index map (r=0.56; p<0.01) (Figure-14). This indicates that similar terrain conditions have more or less similar effects on both surface and landslide erosion. Finally, both maps were
Niroj Timalsina, Motilal Ghimire/ Assessment of denudation ...Vol. 14: 41-80, 2021

69
integrated to produce an overall slope erosion susceptibility map, which was classified into very low, low, moderate, high, and very high susceptibility zone, using Jenk’s natural break method. The distribution of high susceptible slope erosion areas is represented by steep slopes, scarp slopes, high elevation relief ratio, low vegetation cover, and the corridor slopes of the V-shaped river valleys against highly deformed high-grade metaphoric rocks with a rainfall regime of 2000-2700 mm. Recent studies in the High Himalayas agree with this result (Tsou et al., 2018; Tian et al., 2020).
Figure 15: Integrated slope erosion susceptibility in Tamakoshi basin
Conclusion The study has integrated the RUSLE’s soil loss with soil and rocks debris erosion by landslides and finally calculated the overall slope erosion of soil loss of 9.1 million tons/yr for last 20 years. This loss is equivalent to the denudation rate of 3.34 mm/yr. Out of
Niroj Timalsina, Motilal Ghimire/ Assessment of denudation ...Vol. 14: 41-80, 2021

70
this, the contribution of denudation by landslides erosion was 2.8 mm/yr. The denudation rate from the landslides after the 2015 earthquake, the five years which experienced rainfall above normal (both annual and 24-hour maximum events) was estimated to be 4.4 mm/year. The calculated denudation rate seems to match with the earlier estimates in the higher Himalayan areas. The contribution of landslides to total sediment yield was about 84%, which implies that landslides in the hill slope development and sediment delivery are outstanding in the higher Himalayas.
Using landslide index method, the study has produced a landslides susceptibility map. The study also combined the erosion susceptibility map with the landslide susceptibility map to create an integrated slope erosion map. A significant spatial correlation exists between soil erosion and landslide susceptibility index map (r=0.55; p<0.001). This indicates that similar terrain conditions have more or less similar effects on both surface and landslide erosion. Spatially distributed integrated slope erosion map reveals the high slope erosion potential is associated with high rainfall, steep slopes, scarps, lower segment valley side slopes, and high relief. Geologically potentially high erosion is associated with highly fractured and deformed parts of high-grade metamorphic rocks, such as gneiss, quartzite, marbles, migmatite, and granitic gneiss. The study contributed to estimate the overall erosion map combining rill and sheet erosion with landslide erosion. In conclusion, the erosion issue in Higher Himalaya in Nepal seems to be more related to nature than human influence.
Acknowledgments We are thankful to Tractebel Engineering GmbH, Germany, for providing an opportunity to conduct soil erosion assessment, which is one of the essential components of this paper. Our special gratitude goes to Mr. Klaus Moeller and Prof. Dr. Hari Krishna Shrestha for their support. We also thank Ms. Nabina Maharjan for proof reading of the manuscript and for her valuable feedback.
ReferencesAleotti, P., & Chowdhury, R. (1999). Landslide hazard assessment: Summary review
and new perspectives. Bulletin of Engineering Geology and the Environment, 58(1), 21-44.
Angima, S. D., Stoot, D. E., O'Neill, M. K., Ong, C. K., & Weesies, G. A. (2003). Soil erosion prediction using RUSLE for central Kenyan highland conditions. Agriculture, Ecosystems & Environment, 97(1-3), 295-308.
Niroj Timalsina, Motilal Ghimire/ Assessment of denudation ...Vol. 14: 41-80, 2021

71
Arnold, J. G., Srinivasan, R., Muttiah, R. S., & Williams, J. R. (1998). Large area hydrologic modeling and assessment part I: Model development. J Am Water Resour As, 34(1), 73-89.
Ban, J. K., Yu, I., & Jeong, S. (2016). Estimation of soil erosion using RUSLE model and GIS techniques for conservation planning from Kulekhani reservoir catchment, Nepal. J. Korean Soc. Hazard Mitig, 16(3), 323~330.
Basnet, C. B., & Panthi, K. K. (2017). 3D in-situ stress model of upper Tamakoshi hydroelectric project area. Hydro Nepal, (21), 34-41.
Bastola, S., Seong, Y. J., Lee, S. H., Shin, Y., & Jung, Y. (2019). Assessment of soil erosion loss by using RUSLE and GIS in the Bagmati basin of Nepal. Journal of the Korean Geo-Environmental Society, 20(3).
Batista, P. V., Davies, J., Silva, M. L., & Quinton, J. N. (2019). On the evaluation of soil erosion models: Are we doing enough? Earth-Science Reviews, 197.
Brabb, E. E. (1985). Innovative approaches to landslide hazard mapping. Proceedings of IVth International Conference and Field Workshop in Landslides. Tokyo, Japan: Japan Landslide Society.
Burbank, D. W., Blythe, A. E., Putkonen, J., Pratt-Sitaula, B., Gabet, E., Oskin, M., & et al. (2003). Decoupling of erosion and precipitation in the Himalayas. Nature, 652-655.
Burbank, D. W., Bookhagen, B., Gabet, E. J., & Putkonen, J. (2012). Modern climate and erosion in the Himalaya. C.R. Geoscience, 344, 610-626.
Burbank, D. W., Leland, J., Fielding, E., Andeson, R. S., Brozovic, N., Reid, M. R., & Duncan, C. (1996). Bedrock incision, rock uplift and threshold hillslopes in the northwestern Himalayas. Nature, 379, 505–510.
Caine, N., & Mool, P. K. (1982). Landslides in the Kolpu Khola drainage, Middle Mountains, Nepal. Mountain Res. and Dev., 2(2), 157-173.
Carrara, A. (1983). Multivariate models for landslide hazard evaluation. Journal of the International Association for Mathematical Geology, 15, 403–426.
Carrara, A., Cardinali, M., Guzzetti, F., & Reichenbach, P. (1995). GIS technology in mapping landslide hazard. Geographical Information Systems in Assessing Natural Hazards, 135-175.
Carson, B. (1985). Erosion and sedimentation processes in the Nepalese Himalaya. Kathmandu: International Centre for Integrated Mountain Development.
Niroj Timalsina, Motilal Ghimire/ Assessment of denudation ...Vol. 14: 41-80, 2021

72
Chalise, D., & Kumar, L. (2020). Land use change affects water erosion in the Nepal Himalyas. PLOS ONE.
Chalise, D., Kumar, L., & Kristiansen, P. (2019). Land degradation by soil erosion in Nepal: A review. Soil Syst., 3(12).
Chigira, M., Wang, G., & Wu, X. (2012). 31 - Landslides induced by the Wenchuan earthquake. In J. J. Clague, Landslides: Types, Mechanisms and Modeling (pp. 383-392). British Columbia: Cambridge University Press.
Crozier, M. J. (1986). Landslides: Causes, consequences and environment. London: Croom Helm Australia Pvt. Ltd.
Cruden, D. J., & Varnes, D. J. (1996). Landslide types and process. In A. K. Turner, & R. L. Schuster (Eds.), Landslides: Investigations and mitigation (pp. 36-75). , Washington: Transportation Research Board, US National Academy of Sciences.
Cui, K., Lu, D., & Li, W. (2017). Comparison of landslide susceptibility mapping based on statistical index, certainty factors, weights of evidence and evidential belief function models. Geocarto International, 32(9).
Dahal, R., Hasegawa, S., Nonomura, A., Yamanaka, M., Masuda, T., & Nishino, K. (2008). GIS-based weights-of-evidence modelling of rainfall-induced landslides in small catchments for landslide susceptibility mapping. Environmental Geology, 54(2), 311-324.
de Vente, J., Poesen, J., Verstraeten, G., Govers, G., Vanmaercke, M., Rompaey, A. V., Boix-Fayos, C. (2014). Corrigendum to “Predicting soil erosion and sediment yield at regional scales: Where do we stand?”. Earth-Science Reviews, 133, 16-29.
Densmore, A. L., & Hovius, N. (2000). Topographic fingerprints of bedrock landslides. Geology, 28(4), 371–374.
Devkota, K. C., Regmi, A. D., Pourghasemi, H. R., Yoshida, K., Pradhan, B., Ryu, I. C., . . . Althuwaynee , O. F. (2013). Landslide susceptibility mapping using certainty factor, index of entropy and logistic regression models in GIS and their comparison at Mugling–Narayanghat road section in Nepal Himalaya. Natural Hazards, 65, 135-165.
Dhital, M. R. (2015). Geology of the Nepal Himalaya, Regional Perspective of the Classic Collided Orogen. (R. Oberhänsli, M. J. de Wit, & F. M. Roure, Eds.) Springer.
Niroj Timalsina, Motilal Ghimire/ Assessment of denudation ...Vol. 14: 41-80, 2021

73
DHM. (2020). Meteorological Forecasting Division: Jiri. Retrieved from http://mfd.wscada.net/city?id=39
Eeckhaut, M. V., Hervás, J., Jaedicke, C., Malet, J., Montanarella, L., & Nadim, F. (2012). Statistical modelling of Europe-wide landslide susceptibility using limited landslide inventory data. Landslides, 9, 357-369.
Felicísimo, Á. M., Cuartero, A., Remondo, J., & Quirós , E. (2013). Mapping landslide susceptibility with logistic regression, multiple adaptive regression splines, classification and regression trees, and maximum entropy methods: a comparative study. Landslides, 10, 175-189.
Fick, S. E., & Hijmans, R. J. (2017). WorldClim 2: new 1km spatial resolution climate surfaces for global land areas. International Journal of Climatolog, 37(12), 4302-4315.
Finlayson, D. P., & Montgomery, D. R. (2003). Modeling large-scale fluvial erosion in geographic information systems. Geomorphology, 53(1-2), 147-164.
Formetta, G., Capparelli, G., & Versace, P. (2016). Evaluating performance of simplified physically based models for shallow landslide susceptibility. Hydrol. Earth Syst. Sci., 20, 4585–4603.
Fort, M. B. (1987). Sporadic morphogenesis in a continental subduction setting: an example from the nnapurna Range, Nepal Himalaya. Z. Geomorph. N.F., Suppl.-Bd, 63, 9-36.
Gabet, E. J., Burbank, D. W., Pratt-Sitaula, B., Putkonen, J., & Bookhagen, B. (2008). Modern erosion rates in the High Himalayas of Nepal. Earth and Planetary Science Letters, 267(3-4), 482-494.
Gabet, E. J., Burbank, D. W., Putkonen, J. K., Pratt-Sitaula, B. A., & Ojha, T. (2004). Rainfall thresholds for landsliding in the Himalayas of Nepal. Geomorphology, 63(3-4), 131-143.
Ganasri, P. B., & Ramesh, H. (2016). Assessment of soil erosion by RUSLE model using remote sensing and GIS - A case study of Nethravathi Basin. Geoscience Frontiers, 953-961.
Gardner, R. M., & Gerrard, A. J. (2003). Runoff and soil erosion on cultivated rainfed terraces in the Middle Hills of Nepal. Applied Geography, 23, 23–45.
Ghimire, M. (2001). Geo-hydrological hazard and risk zonation of Banganga watershed using GIS and remote. J Nepal Geol Soc, 23, 99-110.
Niroj Timalsina, Motilal Ghimire/ Assessment of denudation ...Vol. 14: 41-80, 2021

74
Ghimire, M. (2011). Landslide occurrence and its relation with terrain factors in the Siwalik Hills, Nepal: case study of susceptibility assessment in three basins. Natural Hazards, 56, 299–320.
Ghimire, M., & Timalsina, N. (2020). Landslide Distribution and Processes in the Hills of Central Nepal:Geomorphic and Statistical Approach to Susceptibility Assessment. Journal of Geosciences and Environment Protection (GEP), In press.
Ghimire, S. K., Higaki, D., & Bhattarai, T. P. (2013). Estimation of soil erosion rates and eroded sediment in a degraded catchment of the Siwalik Hills, Nepal. Land, 2, 370-391.
Guzzetti, F., Carrara, A., Cardinali, M., & Reichenbach, P. (1999). Landslide hazard evaluation: A review of current techniques and their application in a multi-scale study, Central Italy. Geomorphology, 31(1-4), 181-216.
Guzzetti, F., Reichenbach, P., Cardinali, M., Galli, M., & Ardizzone, F. (2005). Probabilistic landslide hazard assessment at the basin scale. Geomorphology, 72, 272-299.
Hagen, T. (1968). Report on the Geological survey of Nepal, 2. Geology of Thak khola including adjacent areas. Denkschrifiten der Schweizerschennaturforschen Gesellschaft.
Herman, F., Copeland, P., Avouac, J.P., Bollinger, L., Mahéo, G., Fort, P. L., Henery, P. (2010). Exhumation, crustal deformation, and thermal structure of the Nepal Himalaya derived from the inversion of thermochronological and thermobarometric data and modeling of the topography. Journal of Geophysical Research, 115.
Holz, D. J., Williard, K. W., Edwards, P. J., & Schoonover, J. E. (2015). Soil erosion in humid regions: A review. J. Contemp., 48–59.
Hovius, N., Stark, C. P., & Allen, P. A. (1997). Sediment flux from a mountain belt derived by landslide mapping. Geology, 25(3), 231-234.
Hussain, I., & Misra, K. U. (2018). Soil loss estimation in GIS framework: A case study in Champabati watershed. International Journal of Innovative Research in Advanced Engineering (IJIRAE), 5(5), 187-196.
Jain, K. S., Kumar, S., & Varghese, J. (2001). Estimation of soil erosion for a Himalayan watershed using GIS technique. Water Resources Management, 15, 41-54.
Niroj Timalsina, Motilal Ghimire/ Assessment of denudation ...Vol. 14: 41-80, 2021

75
Jetten, V., de Roo, A., & Favis-Mortlock, D. (1999). Evaluation of field-scale and catchment-scale soil erosion models. CATENA, 37(3-4), 521-541.
Kayastha, P., Dhital, M. R., & Smedt, F. D. (2013). Evaluation of the consistency of landslide susceptibility mapping: a case study from the Kankai watershed in east Nepal. Landslides, 10, 785–799.
Kienholz, H., Hafner, H., Schnieder, S., & Tamrakar, R. (1983). Mountain hazards mapping in Nepal's Middle Mountains: maps of land use and geomorphic damages (Kathmandu-Kakani area). Mountain Res. and Dev., 3(3), 195-220.
Koirala, P., Thakuri, S., Joshi, S., & Chauhan, R. (2019). Estimation of soil erosion in Nepal using a RUSLE modeling and geospatial tool. Geosciences, 9(147). doi:http://dx.doi.org/10.3390/geosciences9040147
Korup, O., Densmore, A. L., & Schlunegger, F. (2010). The role of landslides in mountain range evolution. Geomorphology, 120(1-2), 77-90.
Kouli, M., Soupios, P., & Vallianatos, F. (2009). Soil erosion prediction using the Revised Universal Soil Loss Equation (RUSLE) in a GIS framework, Chania, Northwestern Crete, Greece. Environmental Geology, 57, 483-497.
Larsen, I. J., Montgomery, D. R., & Korup, O. (2010). Landslide erosion controlled by hillslope material. Nature Geosicence, 3, 247-251.
Lee, S., & Pradhan, B. (2006). Probabilistic landslide hazards and risk mapping on Penang Island, Malaysia,. Earth System Science, 115(6), 661-672.
Leibundgut, G., Sudmeier-Rieux, K., Devkota, S., Jaboyedoff, M., Derron, M., Penna, I., & Nguyen, L. (2016). Rural earthen roads impact assessment in Phewa watershed, Western region, Nepal. Geoenvironmental Disasters, 3(13).
Li, D., Nian, T., Wu, H., Wang, F., & Zheng, L. (2020). A predictive model for the geometry of landslide dams in V-shaped valleys. Bulletin of Engineering Geology and the Environment, 4595–4608.
Maqsoom, A., Aslam, B., Hassan, U., Kazmi, Z. A., Sodangi, M., Tufail, R. F., & Farroq, D. (2020). Geospatial Assessment of Soil Erosion Intensity and Sediment Yield Using the Revised Universal Soil Loss Equation (RUSLE) Model. International Journal of Geo-Information, 9(356). doi:10.3390/ijgi9060356
Marc, O., Behling, R., Andermann, C., Turowski, J. M., Illien, L., Roessner, S., & Hovius, N. (2019). Long-term erosion of the Nepal Himalayas by bedrock landsliding: the role of monsoons, earthquakes and giant landslides. Earth Surf. Dynam, 7, 107–128.
Niroj Timalsina, Motilal Ghimire/ Assessment of denudation ...Vol. 14: 41-80, 2021

76
McAdoo, B. G., Quak, M., Gnyawali, K. R., Adhikari, B. R., Devkota, S., Rajbhandari, P. L., & Sudmeier-Rieux, K. (2018). Roads and landslides in Nepal: how development affects environmental risk. Nat. Hazards Earth Syst. Sci., 3203–3210.
Montgomery, D. R., & Dietrich, W. E. (1994). A physically based model for the topographic control of shallow landsliding. Water Resour. Res., 30(4), 1153–1171.
Morgan, R. C., Quinton, J. N., Smith, R. E., Govers, G., Posen, J. A., Auerswald, K., Styczen, M. E. (1998). The European soil erosion model (EUROSEM): A dynamic apprach for predicting sediment transport form field and small catchments. Earth Surf. Process. Landforms, 23, 527-544.
Morgan, R. P., Morgan, D. D., & Finney, H. J. (1984). A predictive model for the assessment of soil erosion risk. Journal of Agricultural Engineering Research, 30, 245-253.
Morin, G. P., Lavé, J., France-Lanord, C., Rigaudier, T., Gajurel, A. P., & Sinha, R. (2018). Annual sediment transport dynamics in the Narayani basin, central Nepal: Assessing the impacts of erosion processes in the annual sediment budget. Journal of Geophysical Research: Earth Surface, 2341-2376.
Mul, M., Obuobie, E., Appoh, R., Kankam-Yeboah, K., Bekoe-Obeng, E., Amisigo, B., McCartney, M. (2015). Water resources assessment of the Volta river basin. Colombo, Sri Lanka: IWMI Working Paper.
NEA. (2020, 11, 15). Nepal electricity authority. Retrieved from Tenders/Prequalification: https://www.nea.org.np/tender_prequalification?page=2
Nearing, M. A., Ascough, L. D., & Chaves, H. M. (1989). WEPP Model sensitivity analysis (Chapter 14). In L. J. Lane, & M. A. Nearing, USDA-Water Erosion Prediction Project: Hillslope Profile Model Documentation. West Lafayette, Indiana: USDA-ARS National Erosion Research Laboratory .
Nepal, N., Chen, J., Chen, H., Wang, X., & Sharma, T. P. (2019). Assessment of landslide susceptibility along the Araniko highway in Poiqu/Bhote Koshi/Sun Koshi Watershed, Nepal Himalaya. Progress in Disaster Science, 3.
Nikolic, N., Schultze-Kraft, R., Nikolic, M., Bocker, R., & Holz, I. (2008). Land degradation on barren hills: A case study in northeast Vietnam. Environmental Management, 42, 19-36.
Pachauri, A. K., Gupta, P. V., & Chander, R. (1998). Landslide zoning in a part of the Garhwal Himalayas. Environmental Geology, 36, 325-334.
Niroj Timalsina, Motilal Ghimire/ Assessment of denudation ...Vol. 14: 41-80, 2021

77
Panthi, K. K., & Basnet, C. B. (2019). Evaluation of earthquake impact on magnitude of the minimum principal stress along a shotcrete lined pressure tunnel in Nepal. Journal of Rock Mechanics and Geotechnical Engineering, 11, 920-934.
Piacentini, D., Troiani, F., Soldati, M., Notarnicola, C., Savelli, D., Schneiderbauer, S., & Strada, C. (2012). Statistical analysis for assessing shallow-landslide susceptibility in South Tyrol (south-eastern Alps, Italy). Geomorphology, 151-152, 196-206.
Pradhan, A. M., & Kim, Y.-T. (2014). Relative effect method of landslide susceptibility zonation in weathered granite soil: a case study in Deokjeok-riCreek, South Korea. Nat Hazards, 72, 1189–1217.
Putkonen, J. K. (2004). Continuous snow and rain data at 500 to 4400 m altitude near Annapurna, Nepal, 1999–2001. Arctic, Antarctic, and Alpine Research, 36(2), 244-248.
Regmi, A. D., Devkota, K. C., Yoshida, K., Pradhan, B., Pourghasemi, H. R., Kumamoto , T., & Akgun, A. (2014). Application of frequency ratio, statistical index, and weights-of-evidence models and their comparison in landslide susceptibility mapping in Central Nepal Himalaya. Arabian Journal of Geosciences, 7, 725-742.
Reichenbach, P., Rossi, M., Malamud, B. D., Mihir, M., & Guzzeti, F. (2018). A review of statistically-based landslide susceptibility models. Earth-Science Reviews, 180, 60-91.
Renard, K. G., Foster, G. R., Weesies, G. A., & Porter, J. P. (1991). RUSLE: Revised universal soil loss equation. Journal of Soil and Water Conservation, 46(1), 30-33.
Renard, K. G., Foster, G. R., Weesies, G. A., McColl, D. K., & Yoder, D. C. (1997). Predicting soil erosion by water: a guide to conservation planning with the Revised Universal Soil Loss Equation (RUSLE). Agriculture Handbook No. 703, USDA-ARS.
Schelling , D. (1987). The geology of the Rolwaling—Lapchi Kang Himalayas, east-central Nepal: Preliminary findings. J Nepal Geol Soc, 4, 1-19.
Schuster, R. L., & Highland, L. M. (2007). Overview of the effects of mass wasting on the natural environment. Environmental & Engineering Geoscience, XIII(1), 25-44.
Selby, M. J. (1993). Hill slope materials and processes. Oxford: Oxford University Press.
Niroj Timalsina, Motilal Ghimire/ Assessment of denudation ...Vol. 14: 41-80, 2021

78
Shrestha, D. P. (1997). Assessment of soil erosion in the Nepalese Himalaya, A case study in Likhu khola valley, middle mountain Region. Land Husbandry, 2(1), 59-80.
Shrestha, S., Bajracharya, A. R., & Babel, M. S. (2016). Assessment of risks due to climate change for the UpperTamakoshi Hydropower Project in Nepal. Climate Risk Management, 14, 27-41.
Shrestha, S., Kang, T.-S., & Choi, J. C. (2018). Assessment of co-seismic landslide susceptibility using LR and ANCOVA in Barpak region, Nepal. J. Earth Syst. Sci., 127(38).
Sigh, J., & Singh, O. (2020). Assessing rainfall erosivity and erosivity density over a western Himalayan catchment, India. Journal of Earth System Science volume, 129.
Singh, P., Ramasastri, K. S., & Kumar, N. (1995). Topographical influence on precipitation distribution in different ranges of western Himalayas. Nordic Hydrology, 26, 259-284.
Struck, M., Andermann, C., Hovius, N., Korup, O., Turowski, J. M., Bista, R., Dahal, R. K. (2015). Monsoonal hillslope processes determine grain size-specific suspended sediment fluxes in a trans-Himalayan river. Geophysical Research Letter, 42(7), 2302-2308.
Teng, H., Liang, Z., Chen, S., Liu, Y., Rossel, R. A., Chappell, A., Shi, Z. (2018). Current and future assessments of soil erosion by water on the Tibetan Plateau based on RUSLE and CMIP5 climate models. Science of the Total Environment, 635, 673-686.
Thapa, P. (2020). Spatial estimation of soil erosion using RUSLE modeling: a case study of Dolakha district, Nepal. Environ Syst Res, 9(15).
Thiede, R. C., & Ehlers, T. A. (2013). Erratum to “Large spatial and temporal variations in Himalayan". Earth Planet. Sci. Lett., 371–372.
Thiede, R. C., Bookhagen, B., Arrowmith, J. R., Sobel, E. R., & Strecker, M. R. (2004). Climatic control on rapid exhumation along the Southern Himalayan Front. Earth and Planetary Science Letters, 222(3-4), 791-806.
Tian, Y., Owen, L. A., Xu, C., Ma, S., Li, K., Xu, X., Maharjan , S. B. (2020). Landslide development within 3 years after the 2015 Mw 7.8 Gorkha earthquake, Nepal. Landslides, 17, 1251-1267.
Niroj Timalsina, Motilal Ghimire/ Assessment of denudation ...Vol. 14: 41-80, 2021

79
Tsou, C.-Y., Chigira, M., Higaki, D., Sato, G., Yagi,, H., Sato, H. P., . .Yatagai, A. (2018). Topographic and geologic controls on landslides induced by the 2015 Gorkha earthquake and its aftershocks: an example from the Trishuli Valley, central Nepal. Landslides, 15, 953-965.
Uddin, K., Martin, M. A., & Maharjan, S. (2018). Assessment of land cover change and its impact on changes in soil erosion risk in Nepal. Sustainability, 10(12).
USDA. (2000). Predicting soil erosion by water: A guide to conservation planning with the Revised Universila Soil Loss Equation (RUSLE). (K. G. Renard, G. R. Foster, G. A. Weesies, D. K. McCool, & D. C. Yoder, Eds.) Washington: Agriculture Reserach Service, United States Department of Agriculture.
Van Rompaey, A. J., Vieillefont, V., Jones, R. J., Montanarella, L., Verstraeten, G., Bazzoffi, P., . . . Poesen, J. (2003). Validation of soil erosion estimates at European scale. European Soil Bureau Research Report No.13, EUR 20827 EN. Luxembourg: European Communities.
Van Westen , C. J. (2000). The modelling of landslide hazards using GIS. Surveys in Geophysics, 21, 241-255.
Van Westen, C. (1997). Statistical landslide hazard analysis ILWIS 2.1 for Windows application guide. Enschede: ITC Publication.
Varnes, D. (1984). IAEG Commission on landslides (1984) Landslide hazard zonation—A review of principles and practices (Vol. 3). Paris: UNESCO, Natural Hazard Series.
Veeranarayana, B., Raju, R. P., & Wuletaw, M. (2019). Integrated remote sensing and GIS-based Universal Soil Loss Equation for soil erosion estimation in the Megech River catchment, Tana Lake Sub-basin, northwestern Ethiopia. American Journal of Geographic Information System, 8(4), 141-157.
Williams, V. S. (1977). Neotectonic implications of the alluvial record in the Sapta Kosi drainage basin, Nepalese Himalayas. Seattle, USA: PhD Thesis, Dept. of Geology, Univ. of Washington.
Wischeimer, W. H., & Smith, D. D. (1978). Predicting rainfall erosion loses – a guide to conservation planning. Washington: USDA: Agriculture Handbook No. 537.
Wobus, C. W., Whipple, K. X., & Hodges, K. V. (2006). Neotectonics of the central Nepalese Himalaya: Constraints from geomorphology, detrital 40Ar/39Ar thermochronology, and thermal modeling. Techtonics, 25.
Niroj Timalsina, Motilal Ghimire/ Assessment of denudation ...Vol. 14: 41-80, 2021

80
Wobus, C., Heimsath, A., Whipple, K., & Hodges, K. (2005). Active out-of-sequence thrust faulting in the central Nepalese Himalaya. Nature, 434, 1008–1011.
Yang, G., & Gao, Y. (2018). Changes in physical properties of soil on forest floors as a result of landslides caused by the Wenchuan earthquake. In N. Timalsina, N. Agrawal, N. Bhattarai, J. Chand, T. Bhandari, & S. Amatya (Ed.), BMUB-ICIMOD expert consultation workshop on Hindu Kush Himalayan Mountain Soils (pp. 63-69). Kathmandu: International Centre for Integrated Mountain Development (ICIMOD).
Zimmerman, M., Bischel, M., & Kienholz, H. (1986). Mountain hazards mapping in the Khumbu Himal, Nepal, with a prototype map, scale 1:50,000. Mountain Res. and Dev, 6(1), 29-40.
Niroj Timalsina, Motilal Ghimire/ Assessment of denudation ...Vol. 14: 41-80, 2021

81
Territorial mobility in traditional societies of Bhojpur, Majhkirant
Dhyanendra Bahadur Rai 1*, Bhim Prasad Subedi 2, Hriday Lal Koirala 1
1Central Department of Geography, Tribhuvan University2Chairman, University Grants Commission, Kathmandu
*Corresponding author: [email protected]: 15 November, 2020; Accepted: 28 December, 2020; Published: March 2021
AbstractTerritorial mobility is an inherent element for survival and it is a common feature of rural area. It reflects the whole life style and livelihood pattern of a community. Therefore, territorial mobility could be an important aspect of living and coping with external world particularly in the traditional communities of rural Nepal. This paper seeks to explore the changing territorial mobility among the Rai people from Sampang area of Bhojpur district in Majhkirant region. The mixed method, both quantitative and qualitative is adopted for data collection. The formal instruments such as household survey, focus group discussion, mobility register, and the folk sources such as folk songs, local sayings, proverbs, local events were used to generate the data together with the observation method as well. Findings indicate that all forms of mobility of Majhkirant people in which they participate can be summarized into two categories i.e. basai sarai and ghumphir. The long-term moves such as Muglan bhasine, Madhesh jharne, ghar khana jane, desh nikala hune are the specific types of basai sarai. On the other hand all types of short-term mobility normally of short distance are part of ghumphir which are common forms of movement among the people of this area. The feature and frequency of various types of moves vary among Rai and non-Rai community and it also differs over time and space. For example, pitri garna jane, nwagi garna jane, mang garna jane, kaliya jane are more noticeable among Rai community while tirthayatra, chardham jane, astu selauna jane, puranma jane, katha sunna jane are commonly found among non-Rai (Brahmin community). Similarly, moves such as, Lahur jane, phukna jane, ghar banauna jane are associated with Rai people whereas moves like jajamani garna jane, puranma jane, katha bhanna jane are primarily confined to Brahmin community. Many other forms of localized moves were also noticed and all of them had their linkages with participation in socio-cultural, professional, political and economic spheres of rural life. Some moves associated with kinship and neighborhood network as well as
The Geographical Journal of NepalVol. 14: 81-112, 2021DOI: https://doi.org/10.3126/gjn.v14i0.35552Central Department of Geography, Tribhuvan University, Kathmandu, Nepal

82
obligatory are commonly found in all community. In addition, many of these move are age-sex specific, others are associated with occupation of the person and with changing aspiration of people including changing geography of development activities.
Keywords: Territorial mobility, moves, migration, traditional society, Rai community
IntroductionTerritorial mobility refers to all forms of movement by people and such movement takes place at different spatial and temporal scales and reflects a wide range of underlying factors and motivations (Alexiades, 2009). Mobility is an intrinsic element in human life as a continuous and enduring process from the very beginning together with human history in different forms (Lemos, 2010). It is also a way of life-style and life pattern in a traditional society (Subedi, 1993). So, it has become as the regular activities of common people. Mobility remains as an important elements of diversified and flexible strategies of an individual and group of people (Alexiades, 2009). Most of the mobility are carried out for maintaining social process; relationships, responsibility, interaction and social identity (Memmott, Long, Bell, Taylor & Brown, 2004). Various studies (Young & Doohan, 1989; Memmott, Long, Bell, Taylor & Brown, 2004) to date have considered the mobility aspirations of indigenous people. Territorial mobility can be understood from different perspectives. The major perspectives are caste/ethnic, socio-cultural, economic, historical, spatial, and so on. Human mobility has different forms with reference to, for example, distance, duration, and frequency (Bell & Ward, 2000), and various forms of mobility may have different implications for people’s daily activities including sense of territorial belonging. It is true that people are mobile on their life trajectory continuous over space and time while they settle down and become non-movers and vice-versa. Movers refer to all people who travel between places for short or long periods and for a number of reasons via numerous channels and mechanisms and who may fall under various administrative regions.
Demographers usually consider to the complex interplay “push-pull” factors from one place to another as the mechanism causing the decision to move. The push-pull factors work at different levels of social organization: personal, familial, communal and regional (Alexiades, 2009). Neo- classical economists suggest differential status of wage between countries and cost of migration while it depends upon personal decision after perceiving (Sirkeci and Cohen, 2016). Basically, macro level forces are influential and widespread for migration. World system theory addresses international migration as the result of economic globalization. Processes of globalization, along with an increasing awareness of such process further highlight the importance of different forms of mobility, and several academics argue that practices and representations of
Dhyanendra, Bhim, Hriday Lal/ Territorial mobility ...Vol. 14: 81-112, 2021
83
mobility are crucial for understanding contemporary societies (Cresswell, 2006; Sheller & Urry, 2006; Urry, 2000). Mobility has increased excessively now-a-days due to the globalization and modernization everywhere in every community (Heide, 2001).
In the context stated above, the present paper attempts to shed light on the traditional rural society considering the history and socio-cultural aspects focusing on native Rai community in comparison with other social groups such as Brahmin, Tamang, Dalits etc. The research focuses on Rai community due to its special and unique type of cultural practices and customary life style, particularly with a changing situation of the whole social milieu as well as the change in political power relation of the nation.
The study areaThe study area, Sampang lies within ward number seven of Shadananda Municipality of Bhojpur district covering an area 21.82 km2. It has a rugged topography, elevation ranging from 635 to 2570 meters within a short physical distance. Historically, this region is associated with Majhkirant which is known as ancestral land of Kirant Rai people.
The study is mainly concentrated in Chhaplegaun within Sampang in which Khordanda, Toribar, Tarbar, Bakchhama are encompassed as small hamlets or Tole in Nepalese context. The total population of this area is 496 with 254 male and 242 female. Kirant Rai people are the dominant population in this village which occupies about 82 percent population followed by Tamang, Dalit, Brahmin, Bhujel and Sherpa communities. Almost 74 percent people follow Kirant religion and all of them understand and speak Nepali language. Most of the people (79 percent) of Sampang are engaged in agriculture with livestock farming as their primary occupation. Major cereal crops are rice, maize and millet while cash crops are orange, cardamom and rudraksha (eloecarpus sphaericus). Presently, people are motivated towards cash crop farming and other sources of cash earning such as petty business, vendor, small enterprises, semi-skilled labor in the village as well as foreign employment particularly in Gulf Countries and Malaysia. Recruitment in British army was traditional occupation as prevalent practice especially in Rai community in the past but this trend has decreased now.
Dhyanendra, Bhim, Hriday Lal/ Territorial mobility ...Vol. 14: 81-112, 2021

84
Figure 1: Location of Sampang area in Bhojpur district
Methods and materialsThe research methodology, adopted in this study, is a mix of qualitative and quantitative methods. Interpretivism, one of the methods of qualitative research is helpful for gathering data in the research that allows opportunity to study the possibility of multiple realities of participants in the settings. Apart from information collected from formal instruments such as household survey, mobility survey and focus group discussion, the folk sources such as collecting myths, legends, local sayings, and local events obtained from senior citizen, with the help of long and deep interview plus observation and interpretation of different events have been main sources of information in this research. A total of 126 households were surveyed for this study. This included households currently living in Sampang (91) and those as part of tracer households in Tarai area and Kathmandu valley (35). Apart from survey instrument, informal discussions and interactions were carried out. The intention of these informal instruments was to obtain insights so that perception associated with mobility and its meanings of socially constructed realities of traditional
Dhyanendra, Bhim, Hriday Lal/ Territorial mobility ...Vol. 14: 81-112, 2021

85
society are drawn and interpreted logically. A mobility register was established to record the movement of people which gives a real picture of the mobility of people within a certain distance over time and space. Moreover, it presents causes, purposes, and frequencies of movement from home and reach. Mobility registers were prepared in twenty households in Sampang area. The registers were established for ten months, considering both seasons (winter and summer) from October to July. Registers were maintained by the normally educated members of the households. The register recorded all moves of the household members age 15 and above within the specified period.
Results and discussionTypology of territorial mobility within Sampang area of Majhkirant
Mobility has different meanings in different perspectives. It is a way of life style and life pattern in a traditional society. So, mobility is determined by the socio-economic, cultural, and political condition of any community. There are various types of rural territorial mobility in the context of Nepal where many castes and ethnicities are found in traditional lifestyle from the very beginning. Mobility is a continuous process of lifelong phenomena of traditional society that is directly and indirectly linked with their daily activities.
Nepali typology of rural population movement was originally developed by Subedi (1993). He acknowledges that territorial mobility in traditional societies is often complex and confusing and that an analysis of short-term mobility needs to adopt a working definition based on local reality. For this, he takes a minimum duration of one night away from home to identify short-term mover. This one night stay was primarily based on the local people's view that it is the minimum duration of absence to which the household members feel the absence of their members. This study adopts the same criteria and considers absence of at least one night away from home as criteria for identifying movers of the households. The identification was based on the recorded moves of all family members in the household mobility register.
Subedi (2000) identified two forms of Nepali mobility namely Basai sarai (relocation) and Ghumphir (circulation). Several types of mobility within basai sarai and ghumphir were identified from eastern Nepal. The present study by adopting the framework of Subedi (1993) further explores additional categories and elaborates similar the categories as they mirror in the traditional societies of Bhojpur, Majhkirant.
Dhyanendra, Bhim, Hriday Lal/ Territorial mobility ...Vol. 14: 81-112, 2021

86
Figure 1: Typology of rural territorial mobility (after Subedi, 1993)
The basic characteristics of territorial mobility in the rural societies and in the traditional communities are analogous with Subedi (1993). However, the natures of mobility are clearly different on the basis of time and space, the intensity of certain mobility has increased, some has decreased, and some has disappeared recently. Similarly, various kinds of mobility are appeared in a modified form in the context of destination, duration, frequency, participants, volume, and so on. For example there is no desh nikala (exile) type of basai sarai (permanent relocation) now which were common in the past.
Dhyanendra, Bhim, Hriday Lal/ Territorial mobility ...Vol. 14: 81-112, 2021

87
Similarly, in the latter days, it has flourished the moves such as bides jane (move to abroad) in Nepal. The moves related to economic, professional, political, educational and livelihood have been expanded in terms of volume and distance in the present days. Some of the sociocultural and religious moves may be distinct due to caste or ethnic background of the study area. The typology of territorial mobility within Sampang area of Manjhkirat is categorized as the followings:
Basai Sarai (permanent migration)
Basai sarai includes those forms of mobility that primarily involve permanent relocation of households and individuals from particular place to other new place (Subedi, 1993). Relocation may be within a national political boundary or may be beyond it. It has also several meanings and dimensions over the years depending upon time and situation. The main feature of basai sarai is in its permanency. Basai jane (relocation), Muglan bhasine (movement out of social out casting), and ghar khana jane (marriage migration) are a permanent type of basai sarai having no possibility of reversibility (Figure 1). Similarly, bhagne (escaping), Madhesh jharne (migration to Madhesh) and bideshine (migration to beyond the country) are also basai sarai but those have the reversible nature. In the distant past, basai sarai was often taken as a negative connotation. But now, it is not taken as in the past and it has become a common phenomenon in Nepalese society.
Literature is the mirror of society, it reflects not only present but also past event of the society. In Nepalese literature, there are several examples that represent the basai sarai prevailing in our society from very beginning (Bangdel, 2005; Bhattarai, 2031; Chhetri, 2014). The passage extracted from famous social novel written by Chhetri (1957) in Basai has referred to the real causes and consequences of basai in Nepalese society, especially in five to six decade ago. It is the real story of emigrants resulting from a contemporary socioeconomic condition of eastern hill regions of Nepal. A small piece here, expressed convincingly by Dhane, a prominent character of the novel Basai, to his wife Maina during the miserable moment of relocation:
Prepare a kumlo-kuturo (package) now. We should go out tomorrow in jhismise (dawning). How to leave this ancestral place? It has wetted from sweat of own forefathers who have been living here from generation to generation. There is no meaning of weeping and no meaning of crying. What are our means and what is our way? What to do, if it is written by God in the head. (p. 59)
Dhyanendra, Bhim, Hriday Lal/ Territorial mobility ...Vol. 14: 81-112, 2021

88
The whole story of this novel describes the real picture of a painful situation of migrants as the result of feudal exploitation in the village. The landless and homeless condition after the exploitation by landlords in the Nepalese rural society was the cause of the mass migration towards Assam of India. It was the common phenomena in the Nepalese rural society. The main character of Basai novel, Dhane, represents the situation of migration and migrant people in the rural areas of Nepal. Similarly, Rane, Dal Bahadur, Myauchi, Masini, and Bhujel Mahila of Muluk Bahira written by Bangdel (2005) and Sutar, Pakhe Shahila, and Karki of Muglan written by Bhattarai (2031) are the representative characters of emigrants from Arun Khola (Arun Valley) who are compelled to migrate for livelihoods in different parts of India. Such moves were called Muglan jane, Aasam jane (move to Assam), kaman jane (move to tea estate), ara kaatna jane (move to eastern part of India for sawing timber), bagada khana jane (move to rice producing area). Wandering of them to different places like Assam, Gumpahad, Bhutan, Darjeeling to Burma for searching works reflect to the real situation of movers in new places. Along with the written Nepalese literature, songs and folksongs also carry real meaning of rural society at that time. The song always humming in the rural areas about thirty years ago—basai hidneko tantile, basneko mana ruwaunchha, lakhaunko laagi ujaad chha yo desh, muththi bharlai ta swarga chha (seeing the caravans of migrants makes heart break of stayers, this place seems like desert for millions of people and is heaven for a few people who can be counted in fingers) indicates the mass migration of Nepalese rural people due to the over exploitation and unbearable tyranny of limited persons upon poor common people in the village (see, Rai 2017). Such events are common in the eastern hilly region of Nepal. The former context of the Basai novel and its main character Dhane, and the second context of the Nepalese popular song basai hidneko tantile, clearly points out the enforced circumstances for migration. Similarly, it was never matter of a comfortable and pleasant moment for migrant people. Thus, migration is the result of injustice, over tyranny and exploitation and it was viewed as the Marxist point of view in Nepalese society.
Different kinds of a forceful situation create sometimes the cause of migration to a person. This form of migration falls in Muglan bhasine/pasne/jane (migration to unknown places due to serious social accusation. This word is used in the context of fleeing away by king. In the latter days, it is experienced that the demonstration of un-apologized misconduct of a person is responsible for this. So, it gives a negative meaning. This type of movement of people is the starting point of deserting life from long-rooted history of an individual as well as whole family. Such kinds of migration encompass an individual or a group departure. An extreme frustration in practical life also compels people to leave their own place. When one cannot see any alternative ways of their livelihood sustaining and living situation in the place, individuals make a plan to
Dhyanendra, Bhim, Hriday Lal/ Territorial mobility ...Vol. 14: 81-112, 2021

89
move towards an unknown and distant place, called Muglan bhasine in a local language. Various contextual events of Muglan bhasine are presented in the research of Subedi (1993) in the eastern hill of Nepal. This term, Muglan bhasine, has now been used less frequently. However, the researcher has found one such case in a Rai community in Chhaplegaun, Sampang where a woman, Suryawati Rai (aged 46) narrated her family situation as follows:
Suddenly one night, my husband left home. He was escaped (Muglan bhasiyo) with a woman (aunt) in our own clan whose husband had died. The fact is that the woman (kaki) became pregnant. I did not enquire about him. I suffered many difficulties in this period. My daughter died of heart problem. Some people said that he is now living in Darjeeling by getting remarried with a Tamang girl. Suddenly, he came last year in this home. I first of all asked, why did you come here after such a long time? A real thing is that he has come here remembering Kul Pitra, not me. His child from Tamang girl was sick. He has been informed by bijuwa in Darjeling to do kul pitra (praying ancestral god). And he did pitra, stayed fifteen days in my home, and then returned to Darjeeling.
Such events occur rarely and unexpectedly in the villages which makes villagers surprise and sometimes sad. It is the serious matter of prestige and dignity of whole family and relatives not only a related person. Some of the migrant people are lost and mislaid in the foreign land. Some return home after long time while it is supposed that people forget the event.
Many people who moved to Muglan in the past for sustaining livelihoods disappeared for many years in the external land. Disappearing sons for long time in foreign land is considered as a common phenomenon in Nepalese society, but the situation is not same in the case of daughter. Walking in the alien land is necessary for sons to make themselves more practical and clever. The person, who has wide and varied knowledge of external world, is known as desh khai sesh bhayako means experienced through high mobility.
Another type of territorial movement is ghar khana jane (marriage migration) remains as a common practice in Nepalese society as well as in India. Bride is sent to groom's house as a daughter in law, called ghar khana jane in a pure Nepalese term. The movers are especially at the young age below ten in the past, but now this age is growing up around twenty and above. Despite departure of bride permanently, the cultural ties remains inalienable with natal home through frequent visit. The popular songs buzzing
Dhyanendra, Bhim, Hriday Lal/ Territorial mobility ...Vol. 14: 81-112, 2021

90
in our ears also express this meaning. The songs "maiti ghar timro hoina, parai ghar jau, bida lii kahilekahi janma ghara aau" also indicates the compulsion of girls' departure through marriage—meaning that parents home is not their real home; go to others' homes; and come birth home repeatedly taking permission. Getting marriage is the responsibility of baau-maiti (guardian) and maintaining a relation through their visits in festival and social ceremonies is the duty of married chelibeti (sisters).
The term bhagne (escaping) is a kind of a territorial movement as the result of social misconduct, such as, marriages without parents' consent, and police case in the events like a murder, sexual abuse, fighting and theft. Among the different types of marriage, bhagne is prevalent in the Nepalese society particularly in ethnic community. The person who participate in bhagne, may disappear from the sight of community for short period to long, it depends on nature of misconduct. Bhagne is similar to Muglan bhasine but not at the same scale. The society gradually forgets the case and event; the bhaguwa (one who escapes) may return home and may settle in the society. The people moving from home as an escaping often reached different places of India and work as kulli bharti (wage labor). They reached Assam working in gaigoth (cowshed), tori kheti (mustard farming), and kuyanr kheti means sugarcane farming (see Muluk Bahira written by Bangdel, 2005 and Muglan written by Bhattarai, 2031). The word Tori Lahure (workers of tori farming in Assam) became popular from that time till now. The context of Tori Lahure came into practice when the workers of mustard farming returned to the village in a stylish way like a Lahure of India and Malaya (British). Later on, this word became popular in the society used in the ridiculous sense for showing over smartness tendency of a person. Some of the youths leave the village to fulfill their curiosity of outside world in allare-ballare (teen agers) age without any concrete purpose. Some of the youths of Brahmin family escaped from village by taking a purpose of education in Banaras if the family does not agree on this. It indicates a strong desire towards Sanskrit education in Brahmin community at that time while there was no opportunity of taking education in the village. During the fieldwork, a Kaphle, Brahmin aged 72 told how he started his life by escaping from village. He says:
I had heard many things about Banaras when I was about eleven and twelve years old. I told my desire to my parents regarding my study on Sanskrit in Banaras frequently. However, I did not see any sign of fulfilling my desire. I was thinking of how to escape from home. One day, I went to Ahale to carry potato with my mother. We returned from Ahale taking potato in the sack. I was following mother on the way. Mother was a little far from me. At the same time, I put my sack in chautara (resting platform). Then, I ran through the jungle being
Dhyanendra, Bhim, Hriday Lal/ Territorial mobility ...Vol. 14: 81-112, 2021

91
invisible from the eye of mother. I reached Dharan in three days on foot. I had only ten rupees picked from my father's pocket. I went to Banaras after one month. I returned from Banaras after studying Uttar madhyama (equivalent with certificate level of education).
Another common typology of migration, Madhesh jharne, is migration to Tarai area. It has a regional dimension of migration. Tarai was a major destination place from mountain and hill because of fertile land and other economic possibilities. So, Tarai migration was mainly motivated to the place from the economic point of view, as also reflected on Nepalese folk song such as Madhesai jaunla ni dhan kamai lyaunla ni lallauri billauri (moving to lowland, for earning money in hand). In the past, Tarai migration was male specific particularly for an agricultural purpose. But today, the migration has multipurpose and multidimensional aspect. Basically, the mass migration from hill and mountain to Tarai took place after the eradication of malaria in Tarai (Kansakar, 1974).
The next form of migration is bidesine (move to foreign land), can be categorized into desh nikala (banishment) and bidesh palayan (brain drain). Desh nikala was in practice in the past due to the political cause especially during the Rana and Panchayat periods when autocratic system was established (Kansakar, 2005). The punishment of banishing was used for opponent political leader. Opponent political leaders were exiled for many years especially in India as a political refugee. Some got punishment for banishing and some made self-decision for banishment due to the danger of entrapping in false case and danger in life too. Basically, the politicians who engage in opponent politics, participate in such moves. Similarly, bidesh palayan/bideshine is self-motivated moves abroad for good opportunities there. The movers are especially high educated, Green card, and PR holders, as well as UK armies and their children. In this regard, an ex-British Lahure says openly as following;
“British government has made a provision of settling in UK for ex-British armies and their dependents. After that provision, majority of the ex-servicemen with their offspring, have left the country. It is not our eagerness but we are compelled to leave home country (bidesh palayan) for the children’s desire. Today’s new generation feels happy there but we don’t feel so.”
A large number of families of ex-British in Sampang, participated in bidesh palayan moves as a new trend of migration in Rai community. Basically, new generation is interested for this migration but their parents feel happy to stay in Nepal and want to die here.
Dhyanendra, Bhim, Hriday Lal/ Territorial mobility ...Vol. 14: 81-112, 2021

92
A popular moves bidesh palayan, is in ascending trend in Nepalese society especially well-educated youths in the recent days. A large number of young educated people of new generation are interested towards external world for earning money and getting knowledge and skills as well as for grabbing new opportunities there. America, Europe and Australia have become as new destination countries for this purpose. In another term, the moves of educated people in this category is called “brain drain” means flow of capable person which is not good sign for the future development of the country. In this migration, there is maximum chance of permanent relocation of a person in abroad.
Ghumphir (short-term mobility)
The term ghumphir means the movement of people within a certain distance and a period of time for different purposes. Dulghum, ghumgham, and ghumai phirai are some of the synonyms of the ghumphir used in Nepalese rural society. Its main feature is circulation. Mostly, circulation takes place within home territory. There are varieties of ghumphir, such as socio-cultural, religious, economic, educational, political, obligatory, reciprocal, gaunbensi garne (transhumance), baraline (walkabouts), ghar phirne (back home) and so on. The forms of mobility captured by the concept of ghumphir can be subcategorized into other various forms on the basis of their nature and characteristics, experiences from traditional society of Sampang area.
Table 1: Categories of movement based on purpose
Purposes Activities At past At present
Socio-cultural and religious events
Wedding, death ceremony, Chhewar, Sakela, Mang garna jane, Panchawali, Kaliya jane, festival, Puranma/Sharadma jane, chardham, astu selauna jane etc.
30.5 20.0
Economic Khelo phadko garne, Bank/IME jane, pension lina jane, bhari bokne etc.
13.8 16.5
Political/official/administrative
Party meeting, delegation, mass meeting, training, workshop, Adda/office jane (making citizenship, passport, revenue paying, land registration), Adalat jane (court case etc.)
10.0 14.5
Livelihood/occupation Lahur jane, bidesh jane, jagirma jane, wage labour, lek-bensi/gaun-bensi garne (transhumance) etc.
12.0 12.2
Education/health/communication
Kharcha puryauna/ketaketi padhauna jane, move for schooling, move for exam, hospital jane and phone garna jane etc.
8.0 16.0
Entertainment Hunting, fishing, gambling, playing, dancing, Mela/ jatra jane etc.
5.7 2.0
Based on daily necessity Sauda garna/kinmelma jane, bajar jane, mal lina jane, etc. 9.0 14.8Obligatory Maita jane, Aspatal jane, janta jane, Jhara tirna jane,
Marimarauma jane etc.11.0 4.0
Total 100 100
Source: Mobility registers, 2014; Field Survey 2014 and 2019
Dhyanendra, Bhim, Hriday Lal/ Territorial mobility ...Vol. 14: 81-112, 2021

93
Moves related to socio-cultural and religious purpose
This type of moves includes the movement motivated by socio-cultural and religious reasons called ghumphir in the local context. About 31 percent people were involved in it at past and 20 percent in the present (Table 1). Most of the socio-cultural and religious moves are related with birth, death, wedding as well as festivities and are performed within a short distance and short period. The research conducted by Taylor (1998) has suggested the same situation of moves in aboriginal society in Australia. Mela bharna/herna jane (participate in fair), tika launa jane (move for putting tika), cheli puryauna/lyauna jane (move to reach/bring sisters), bhikshya dina jane (move for giving alms in thread wearing ceremony), and mari marauma jane (participate in dead ceremony) belongs to some sociocultural moves within about all caste and ethnicity. Similarly, these terms—pitri garna jane (ancestral worship), raksi khana jane (move for engagement process), rit puryauna jane (move for carrying essential things on bride asking moment), kaliya jane (move for marriage proposal as mediator), and maganima jane (move for asking bride as formal way) are related particularly to Rai community. Mela bharna/herna jane (participate in carnival) is also an important movement for a sociocultural life in the village. Various purposes are fulfilled through mela-jatra (carnival) in the rural life. Earning merit by worshiping god and goddess may be a main aim in most visitors of Brahmin-Chhetri community. Most of the people visit mela as said in Nepalese proverb: Pashupatiko jatra, sidrako bepar, means to kill two birds with one stone. K. Adhikari, aged 56 of Sampang found during Balachaturdashi Mela at Dingla says:
I have been continuously visiting Dingla, especially in mela. I do not miss every Balachaturdashi and Ramnawami mela. I departed at 7 o'clock from home in the morning without having anything. I came here at 10 o'clock and prayed in the temple. I met relatives and purchased clothes for children.
This shows the multiple purposes of visiting for movers in mela. The purpose depends on people’s interest, age, sex, social background and so on. Taking entertainment was one of the major purposes of participating in mela in the past especially for young people while there was not available other mode of entertainment. Its importance is great for maintaining customary life-styles and life process. Most of the mela which are regularly observed at the confluence of the river, well-known hill tops, and historical and religious sites.
Dhyanendra, Bhim, Hriday Lal/ Territorial mobility ...Vol. 14: 81-112, 2021

94
Various kinds of socio-cultural moves have distinct types of features. Some moves are associated with a certain time, months, season, and geographical boundary. And some are wider in its dimension. For instance, season-specific ritual activities have limited geographical expansion and social periphery. Likewise, wedding ceremonies have a wider geographical boundary and but a specific time. But the moves, related with death, illness and causal events, have no limitation of season and geographical limitation. Regular annual activities such as Ubhauli/Udhauli (Sakela/Kirant festival) and Mang (ancestral god) have no wider participation.
Various religious deeds such as Mang garne (ancestral worshiping) and Nwagi (offering of new harvest) are performed by Rai community which are based on Mundhum (Veda of Kirant), known as a main ritual work on the basis of seasonal cycle. Performing mang is main duty of each Kirant's descendants. So, people of Sampang also come home for performing mang wherever they live and work for earning livelihood. Those moves are known as different terms like, mang garna jane/pitra garna jane and nwagi garna jane in Rai community. These types of moves have central values in Rai community. Such kinds of mobility are associated with a calendar of annual indigenous social/ religious and ceremonial events which are also identified by Memmott, Long, Bell, Taylor & Brown (2004) as well.
The terms, Tirtha yatra garne (moves as pilgrimage), Char dham jane (pilgrimage to four main Hindu shrines), Shradha garna jane (moves for ancestral praying), Astu selauna jane (moves for religious purpose), are especially related to Brahmin/Chhetri community. Such moves are characterized by single and several visits of religious places, temples, shrines in a group or individually within country, and beyond. People visit Chardham for getting psychological satisfaction, purification, and performing moral obligation to earlier generation (Subedi, 1993). Its main goal is attaining salvation after death as per the assumption of Hindu philosophy. Generally, the elder persons are participated in those activities. Rai community is not associated with Hindu religion, so the people of this community do not get involved in such kind of visits. But in the recent days, some people of Rai community even participate as the result of influence of Aryan culture and Hindu religion on other ethnic communities in Nepal (see, Rai 2017).
Moves related to economic purpose
All the moves, related to economic activities for livelihoods of the household, include economic movement which is in increasing trend at present (Table 1). Basically, the household economy was self-dependent type based on agriculture in the past but it is going to be dependent. The terms—such as kulli bharti jane (moves for porter
Dhyanendra, Bhim, Hriday Lal/ Territorial mobility ...Vol. 14: 81-112, 2021

95
and labor), aara katna jane (moves for sawing timber), bhari bokna jane (moves for carrying loads as porters), suntala/alainchi bechna jane (moves for selling orange and cardamom), paisa lina jane (moves for taking money from financial institutions), rin tirna/uthauna jane (moves for paying off and taking money back) and kamauna jane (moves for earning) are included in economic moves. The mobility motivated by economic activities was not so higher than other movements in the past. However, it is expanding day by day due to the influences of globalization and a decreasing position of self-depended economic activities of the household. Of course, it is also more visible than other moves.
Kulli bharti jane (wage labor migration), koila khani jane (move for working at coal mine) and aara katna jane (move for sawing) also include the regular territorial mobility for earning livelihood in Nepalese villages. The people in the rural areas had limited sources of cash income as well as inadequate sources of livelihood in the past. Hence, people were compelled to migrate to India for earning cash and sustaining their households (IOM, 2019). Those opportunities opened while the construction works and resource extraction were common during British India rule in India (Subedi, 1993). Being involved in kulli bharti, koila khand and aara katna jane are not only matter of compulsion; those are also related to the desire for a visit beyond and refreshment purpose in a leisure period, especially in the winter. The term bagada khana jane (move for rice meal) was also used for those whole activities. This context indicates the scarcity of rice meal in the hilly region in the past. The proverb desh pani herine mukh pani pherine refers to the strong intention of movers for getting chance taste new food items and entertainment. This saying is very popular in Nepalese society, especially in the hilly region for visiting outside of home. The risk of movers in the new place and new works is also represented by this popular progressive song: aara katna bhani gako mero jetha dai, rukha dhali kichi maryo suna sathibhai. This song is loosely translated this way: The elder brother of someone had gone for sawing a timber but died due to the falling of a tree upon him in the distant land. Movers were badly affected by several events, such as death, injuries and sickness frequently in the alien land. The painful situation of movers to Muglan is portrayed nicely in the novel Muglan by Bhattarai (2031). The pithy saying, prevalent in the village, bagada khana gaako, langada bhayara aako also refers to the vulnerable condition of life in pardesh (distant land) and a real picture of Nepalese society from the very beginning till now.
Khelo phadko garne (engage in small business for earning) has become an important economic activity as the result of the increasing transportation facility, growing interest towards earning cash, beginning of cash crop farming, and the establishment of market center in the village which are recently amplified as territorial mobility especially in
Dhyanendra, Bhim, Hriday Lal/ Territorial mobility ...Vol. 14: 81-112, 2021

96
rural areas of Nepal. Khelo phadko garne means a petty business that needs no large investment. Local small vendors are involved in this activity in their leisure time the season from harvesting orange, cardamom, and rudraksha (eloecarpus sphericus) collection. Agricultural products are taken to the market by such small businessmen through collecting them from farmers. Manufactured goods are bought in the wholesale market and resold by the local businessmen in the local market. Some of the vendors collect piglets, chickens, chicken eggs, goats, grains and vegetables and sell in the weekly market (bazar) by taking some profits. A short excerpt from a conversation with a local small businessman Mr. K. Ramtel (aged 28 years) is as follows:
In the season, I purchase orange from the tree in the village and sometimes purchase whole orange tree in the season. Then, I take them to Tumlingtar and sometimes to Khadbari. Sometimes, I take goats and chickens to the market by collecting them from the village for earning profit. There are others friends like me who are also involved in petty business of fruits, vegetables and grains and some in merchandise goods. Some local businessmen are involved in the business of cardamom and rudrakshya (eloecarpus sphericus) or dana (in local term) at a large scale. They take their goods to Dharan by loading them in the mini truck. Vendor is our part time and a seasonal job for sustaining livelihoods.
Now-a-days, the work, paisa lina jane (taking money) has become a prominent mobility in the rural areas of Nepal. The other terms, such as bank jane (move to bank) and IME jane (move to IME), are also used for paisa lina jane in local term. In the later days, foreign employers send money through IME and Bank located mostly in the district headquarter and regional market centers. It needs whole single day or more for commuting. A large number of households are depended upon remittances for their livelihood in the rural areas of Nepal. It has become a main basis of Nepalese economy. Daily transaction of an IME located in Tumlingtar also shows the over increasing role of remittance in the rural areas, which also hints at more mobility of people between village and district headquarters and regional market centers. An IME proprietor informed that about one hundred people come daily for remittance purpose in Tumlingtar. A widespread movement in the rural areas, especially in Rai community of ex-Lahures families, is pension lina jane (movement for taking pension from Welfare Centre and Soldier Board). They used to go to Purnia of Bihar state of India in the distant past for this purpose. But now in the case of Sampang, ex-Lahures of British and India visit Welfare Centre and Soldier Board for taking pension located in district headquarters of
Dhyanendra, Bhim, Hriday Lal/ Territorial mobility ...Vol. 14: 81-112, 2021

97
Bhojpur. Nowadays, taking time distance to bank and IME has been decreased due to construction of local roads and establishment of banks and IME offices (see, Rai 2017).
Rin pan (money borrowing and lending) was a very common phenomena in the past for sustaining a practical rural life because there were no formal financial institutions and organizations like banks and finances. Most of the common people living in the rural areas used to depend on sahu mahajan (local money lenders) for loan. So, the terms rin tirna jane and rin uthauna jane (paying and taking money) were common activities related with mobility. Local landlords and money lenders used to invest money not only in the village but also in neighboring village and distance apart. However, the mobility within village related with rin pan has decreased in the recent days.
Bhari bokna jane (move for carrying loads) as a porter, is a kind of mobility driven by for their livelihood sustaining in the rural areas of Majhkirant when the road transportations were not available in the hilly region. Merchandised goods were brought from Dharan to eastern hill and mountain districts by only one of the means. It took ten to twenty days to carry loads. A large number of poor people's livelihood in this area was made as porters. Life seemed very painful when one sees them as a caravan with heavy load with not such feeling in their real life. This reality is proved by expressing their views this way: dhakreko jiban ek sok, ek bhog (porters' life without pain and strain). Some of the households had lived on portering as a side job and some as a main occupation. Kattel (2000) has explained the clear picture of the portering occupation by Kumal community of Tumlingtar of Arun valley.
Moves related to political and administrative activities
There are different moves related with political activities such as baithakma jane (moving for meeting), aamsabhama jane (journey for mass meeting), delegation jane (moves for delegation), prasikshanma jane (move for instructions), chunab pracharma jane (moves for election campaigning), bhumigat hune (move for political activities as underground), and bhot dina jane (move for casting vote). Such types of mobility have excessively increased after the restoration of democracy in Nepal (see, Rai 2017). The first four moves are directly related to committed politicians who are always engaged in politics. Those all mobility are mainly centralized in the district headquarters. The term bhumigat hune became prevalent when CPN (Maoist) started an armed rebel in 1995 and in Panchayat period as well. This territorial mobility is uncertain in terms of duration of mobility and a range of distance. A young person, B. Rai of 32, expressed his experience of bhumigat jiban (underground life) in this way:
Dhyanendra, Bhim, Hriday Lal/ Territorial mobility ...Vol. 14: 81-112, 2021

98
I got involved in Maoist party in 1995 and became bhumigat from that time. First of all, I took training in Sindhuli and we controlled police post of Sindhuli in April, 1995. It was my first experience of an armed war. I was arrested in 1996 in Boya and held captive for one month in police custody. After being bailed, I stayed in the village for some time. The contact with party was maintained and again, I became underground. We did action in various police post and district headquarters as well. We achieved success in most of the wars. After lokatantra (people's democracy), I returned home appointed as a district committee member (DCM) of the party but now I am DCM of NCP (Maoist/Vaidya).
About a dozen of youth participated in People's Liberation Army (PLA) in the conflict period from Sampang. Among them, most involved in open politics and frequently move to the district headquarters and regional market centers as political activist. Some moves as party cadres such as; meetingma jane (move for meeting), delegation jane (move for delegation), amsabhama jane (move for mass meeting), prasikshanma jane (participation in instruction) and andolan garna jane (move for agitation) are common phenomena in this area. Bhot dina jane (move for vote casting) is also a political move of mass population within village in a democratic system but it appears occasionally within five years.
Citizenship certificate is compulsory to every citizen of Nepal. It is necessary to show citizenship certificate to prove a national identity in any formal occasion. So, people go to District Administration Office to obtain the citizenship certificate. In the same way, the people who would like to go to foreign countries need to obtain passport. These both types of works involves travels of rural residents as obligatory type of territorial mobility. These phenomena have been increased recently while the trends of labor migration and abroad studies have been increased in rural areas of Nepal. Such kind of move is called nagarikta banauna jane and passport banauna jane (move for getting citizenship and passport) in Nepalese terms. Bill tirna jane (moves for paying bill) is a kind of regular moves of rural people in monthly basis to the electricity office. Electrification has been done in rural areas without expanding branch office of Nepal Electricity Authority (NEA) for paying bill. So, rural people need to walk a long distance for billing there. People of Sampang go to Tumlingtar branch office to pay electricity bill on a regular basis in each month. People move to Tumlingtar not only for single reason but also for multiple purposes including purchasing something for the household. When movement occurs for Tumlingtar by multiple reasons, it is called Tumlingtar jane in local term.
Dhyanendra, Bhim, Hriday Lal/ Territorial mobility ...Vol. 14: 81-112, 2021

99
Moves related to livelihood and occupation
The terms—such as Lahur jane (moves for recruiting British-Gorkha Army), Arab jane (moves to Gulf country for labor migration), bidesh jane (moves for foreign employment), jagir khana jane (moves for professional service) are related with livelihood and occupational movement. Lahur jane is a popular move among Rai community of Sampang. In other words, such as Bharti jane and Paltan jane are also used for this move. It is also age specific, eighteen to twenty one, and gender specific limited in male. The words “Lahur jane” were frequently uttered in this community. Blessing was given by elders to sons to be Lahure and to daughters to be Lahureni (wife of Lahure), especially during wish making occasions. It was the matter of grief when somebody gets hurt and spot in the face as well as fracturing of hand and leg in small age, not able to be Lahure in the future. The importance of Lahure was clearly reflected by the question raised to the candidate of groom in this community during putting marriage proposal with parents, especially in an arranged marriage: Lahure ki chaure (either Lahure or other). The saying, like padhilekhi ke kam, Lahure bhaya damaidaam (Lahure earns money more than what an educated person earns), also indicates the priority towards Lahure in Rai community for earning money (see, Rai 2017). The status of British Lahure was higher than Indian one. British-India recruited only certain Nepalese ethnic group, Rai and Limbu in the eastern Nepal and Magar and Gurung in the western from 1815/16 AD. The reason for recruiting only a certain group is still unclear. Good health and attractive physique were the prerequisites for recruiting army. A British Lahure gets a leave in every three years for three months. Family (spouse and kids) also can go with Lahure after first leave. The word Paltan jane (move to Platoon with husband) is used for family context too. Recruitment was done in a large number till two decade ago. But the number has declined recently by a curtailing policy of the British government on Gurkhas. The criteria of recruitment have also changed: emphasis on education over body that has become a difficult task for youths living in the village recruiting in British army. However, the situation was totally different in the past. In the contrary, young boys were taken for recruitment forcefully if not convinced easily in the period of the world war, first and second.
The social prestige and dignity of Lahure was great in Rai community. Not only Rai community, this tendency is commonly found in other Mangolian community like Gurung which is reflected in Gurung (2011) research. Since every parents had a sweet dream of making Lahure to their sons and making Lahureni to their daughters. The practice of different items, such as hanging, pull up, set-up, and running for the exercise of Lahure recruitment, starts after getting fifteen years. The desire to become Lahure was great. Earlier, Ghumpahad Kuna of India was the place of recruitment for British-
Dhyanendra, Bhim, Hriday Lal/ Territorial mobility ...Vol. 14: 81-112, 2021

100
Gurkha regiment. Many youths moved to Ghumpahad Kuna for recruiting Lahure in the past. The folk song, sung especially by the youths in the village such as salko pat duna, kun bato jane Gumpahad kuna, also vividly shows their strong desire and goal to become a Lahure in their life.
However, Lahures’ life always remains in uncertain and critical situation as well in the foreign land though they have sweet imagination of meeting in the future with family and friends. The song, chiththi aayo dhagole bandhera…, also gives the real meaning of the risky life of Lahures. It is also said that Lahureko jiban khukuriko dhaarma means Lahures' life is teetering on the edge of khukuri (sharp weapon). The war between Argentina and British in the history, a war in Falkland Island together with India and Pakistan, and a war in Kashmir also remind one of an uncertain situation of Lahure's life. Similarly, ex-Lahures are known as very experienced in different practical knowledge and skills they learn in the foreign countries during the service period (see, Rai 2017). The village gets various benefits directly and indirectly from sharing such skill and knowledge. So, the life of ex-Lahures is accepted as a suitable example of this proverb in the village: desh khai ses bhayako.
The term bidesh jane (move to foreign land) has become widespread in Nepalese society in these days. Due to lack of employment and different kinds of opportunities, most of the youths have been moving towards foreign land like Gulf countries (Saudi Arab, Qatar, Kuwait, UAE) and Malaysia as foreign migrant workers. The tendency of women migration has also increased as a domestic labor but it is still male dominated (IOM, 2019). The word Arab jane is also used easily by common people in the village. The term new Lahure is also found in some literature. However, the term Arabe Lahure (Lahure of Arab) is also used locally for the persons who move to Arab countries. The term Dori Lahure is also heard elsewhere for foreign employees. This term is related to them considering wrapping style of their baggage by ropes while coming from Arab and Malaysia. Their real situation is not so good due to low salary and an unfavorable climatic condition of destination places for Nepalese migrant workers. Likewise, a lot of events of family break are found in the case of Arabe Lahure in the rural community including Sampang. So, the saying Arab ki dharap (Arab as a danger place) is becoming popular in the mouth of the villagers. The report of IOM further states that;
Nepal’s low-skilled migrant workers are also subject to dangerous working conditions and poor living and working conditions, increasing their risk of work-place accidents. Poor living and working conditions can also lead to the spread of infectious diseases. Women migrant workers are particularly at risk of physical and sexual abuse, particularly those who have been trafficked. (p. 99)
Dhyanendra, Bhim, Hriday Lal/ Territorial mobility ...Vol. 14: 81-112, 2021

101
Nevertheless, this activity has become both compulsive and fashionable among the Nepalese youths. Beside gulf countries and Malaysia, the Nepalese youths' visit South Korea as a labor migrant is regarded as an attractive destination due to high salary.
Table 2: Caste/ethnic dimension of territorial mobility
Category of moves
Caste/ethnic based movesRai Brahmin
Socio-cultural Kaliya jane, Koseli liyara jane, Maganima jane, Pasnima jane, Chhewarma jane, Nwaranma jane, Panchawalima jane
Puranma jane, katha sunna jane, Saptahama jane, Kanyartha jane, Barakhima jane, Bratabandhama jane, cheli lina jane
Religious Pitri/Mang garna jane/Nwagi garna jane
Tirthayatra garne, Chardham jane, Deudham jane, Pashupati darsan garna jane, Astu selauna jane
Professional Lahur jane/Paltan jane/Bharti jane, aara katna jane,
Puran/Puja launa jane, Paath garna jane, Jagir khana jane
Recreation/entertainment
Sikar garna jane, machha marna jane, juwa/tash khelna jane, nachna jane, khelna jane
Mela bharna/herna jane, Jatra herna jane
Source: Field survey, 2014 and 2019
Jagir (government service) makes a person more mobile because of its transferable nature. Furthermore, jagir is usually not available in the home territory. One should leave home to get a government service. The old but popular proverb—uttam kheti, madhyam byapar and adham jagir (best farming, medium business and worst service)—also carries the meaning of low preference for government services. Despite such condition in the past, the recent notion has totally changed in the society. So, participation and attraction in jagir varies on the basis of Nepalese society. The importance of jagir is great in Brahmin/Chhetri society from very beginning due to their access to education. The tendency towards jagir has been developed as culture. Therefore, education attainment is a prerequisite for jagir. It is called white collar job. Jagir is not only money (salary), it is also power, prestige, and access to different sectors and levels of state. Therefore, this generation is interested to move a long distance in inaccessible and remote areas of the country for government job. Comparatively, this move is male dominated still now because of low participation of women in this sector. This context matches with ethnic community including Rai of Sampang. But recently, the situation is in increasing trend after commencement of reservation system in Nepal for the government service. A certain age group may be eligible for government service. Such kinds of movers are generally adults, such as those aged 20 to 60 years.
Dhyanendra, Bhim, Hriday Lal/ Territorial mobility ...Vol. 14: 81-112, 2021

102
All kinds of moves motivated by economic purpose comprise several kinds of mobility. Such mobility is directly related with occupation. Most of the occupations in the past were based on caste and ethnicity. So, the prevalent moves—such as siuna jane (walk for sewing), bajauna jane (walk for playing musical instrument), saan launa jane (walk for sharpening weapons), puja launa jane (walk for praying), phukna jane (walk for healing), and ghar banauna jane (move for constructing house) comprise those territorial mobility mostly based on a traditional occupation in the rural area (Table 2). The first three moves (siuna jane, bajauna jane and saan launa jane) are related to Dalit castes within short distance for short period. Those phenomena were more common in the past. Over the time, these movements are declining due to the fall in the caste based occupation. The term puja launa jane is also a short term movement related to a ritual work for Brahmin society in which purohit (Brahmin priest) participates. The moves, phukna jane, is also common in rural community (see, Rai 2017). This was widespread in the past when there were no medical facilities for treatment in the rural areas and common people were dependent completely on local healer. The term ghar banauna jane is also a local movement of skilful people within village and market centers for some days and weeks. Basically, such types of moves occur in winter and agriculture off-season. Similarly, majdurima jane (labor work) has become extensive in the recent days as the result of increasing local development works especially road construction and government building such as school, hospital, rural municipality office etc. after commencement of federalism in Nepal. Various reconstruction works in the rural areas are also associated with Gorkha earthquake- 2015.
Moves related to educational and skill development
Moving for getting education is called padhna jane (moves for study) in a customary sense. The system of education was maintained in gurukul (traditional system of education) in the beginning. Relation of education was directly associated with religious and cultural context. So, it was primarily confined to religious teaching and text only for men of Brahmin families. In other words, it was felt that education was necessary for the sons of Brahmin to perform religious and cultural activities which are based on Sanskrit text. Brahmin people used to go to Banaras of India for taking education because there were no facilities for education in the village. Therefore, the term Banarash jane is also used for the moves padhna jane especially in the Brahmin community. The name and fame of Banaras was great for obtaining Sanskrit education in India including Nepalese people. Some Brahmins sons moved there for education by escaping homes if they were not allowed by parents. They returned home after taking education up to purba madhyama (equivalent to SLC), uttar madhyama (equivalent to proficiency certificate level), shastri (equivalent to Bachelors level), and up to aacharya (equivalent to Master's Level).
Dhyanendra, Bhim, Hriday Lal/ Territorial mobility ...Vol. 14: 81-112, 2021

103
Subedi (1993) discussed the mobility related to padhna jane especially Sanskrit education in India. However, the sphere and importance of education has recently increased excessively. So, the mobility pertaining to education appears in different forms within local, national, and global level. The value of education has changed. It has become essential things for making a living. Occupations are determined by the quality of education. Education attainment is not only limited to certain sex, caste/ethnicity, and region. Educational institutions related to the school level are established in the village but there are no institutions on higher education till now. So, people should move elsewhere in city area for higher education. So today, many terms are associated with educational moves in the society: padhna jane/adhyanma jane (move for study), ketaketi padhauna jane (move for children’s education), campus jane/college jane (move for higher education), janch dina jane, (move for taking examination) and kharcha puryauna jane (carrying logistics to children), and so on. The mover going somewhere beyond the village for any kind of education is called padhna jane and adhyanma jane, which are recently known as campus jane or college jane. The person returns homes after getting two to four years of education. In the present days, the attractions towards private boarding schools have been increased in the rural areas but are not available there in Sampang. Therefore, some people keeps their children with guardians (mostly with mother) in the district headquarters and other urban centers where boarding schools are established. Such moves associated with children’s education are called ketaketi padhauna jane and kharcha puryauna jane in local terms. So, the mobility has been increased in the rural areas with the purpose of educational activities (Table 1). The role of international remittance is great as major motivational factor for investing in quality education of both son and daughter in the rural area of Nepal (see IOM, 2019).
The dimension of education has now been changed drastically in the Nepalese society. Higher education is not bounded within national boundary. A large number of Nepalese youths are also moving as student to foreign countries including India every year. Basically, girls move India for taking technical education especially nursing. Those kinds of moves are called adhyan garna jane or bidesh padhna jane in Nepalese terms. A large numbers of young people disappear in abroad for the purpose of higher education and very small portion return back in the country. This trend is on the rise. It has become a sweet dream of Nepalese youths getting visa of America, Australia, Europe and so on. Not only study purpose, but also Nepalese youths move to America for settling down there after getting PR and TR visa. Diversity visa (DV) system has become a process for entering America to Nepalese people.
Dhyanendra, Bhim, Hriday Lal/ Territorial mobility ...Vol. 14: 81-112, 2021

104
Moves for recreation or entertainment
In addition to religious importance, mela and jatra provide great opportunities to maintain social relation, to make a social network, and to choose marriage partners for taruni (teenage girl) and tanneri (teenage boy), as expressed pithy saying—jaun bazar paisako nash/kharab, najaun bazar taruniko aash/shrap (if I go to bazar money is wasted; if not, beautiful girls are missed)—and a popular folk song—ekadashi bajaraima phanke roti thalma, kasko chhora kaski chhori paryo maya jalma (in Ekadashi bazar, round bread is served on the plate; unfamiliar boys and girls fall in love at the first meeting). The popular mela—such as Balachaturdashi and Ramnawami Mela of Dingla, Ekadashi Mela of Manakamana, Dabali Mela of Bhojpur and Pakhuwa Mela of Tintale—are famous for a good place for love partners to make their love a success in their marriage in this area. The mela and jatra in Rai community is taken as enjoyment and entertainment for leisure period in rural life. Such types of event is found in aboriginal mobility patterns of Central Australia which is illustrated in the research of Memmott, Long, Bell, Taylor & Brown (2004). Singing and dancing activities with drinks are a common phenomena of such melas in this Majhkirant region. Dohori geet, such as Hakpare (folk song especially sung in Arun Valley), used to sing songs continuously till seven days and nights between tanneri (young boy) and taruni (young girl) sitting under the bar-pipal tree (Chautara is the resting platform). Many boys and girls fall in love and some get married by putting a witness to bar-pipal tree. Most of the participants in such kinds of recreational activities were related to the young boys and girls of Rai community especially in winter season. Various moves—such as khel khelna jane (moves for playing), sikar garna jane (moves for hunting), machha marna jane (moves for fishing) and nachna/gauna jane (moves for dancing and singing), and so on—are some of the important ones relating to youths' entertainment in the rural areas, especially in Rai community of Majhkirant including Sampang (Table 2). In the latter days, such moves as entertainment are in declining trend (Table 1).
Moves based on obligation and reciprocal relationship
The obligatory move is an important territorial mobility in the rural as well as in urban areas because it is associated with state rule and regulation over the people by the government. It is also connected with facilities and services provided by the government to people. In the past, jhara tirna jane (movement to compulsory labor) especially during the Rana rule in Nepal, used to forcefull participation of people in developmental activities such as road, buildings, temple, and canal construction etc. People even used to move one or two days of walk from home for jhara tirna by carrying khaja-samal (foodstuffs). However, after the dawn of democracy in Nepal such types of moves disappeared.
Dhyanendra, Bhim, Hriday Lal/ Territorial mobility ...Vol. 14: 81-112, 2021

105
The terms adda jane (move to government office) concerning to territorial mobility is common in rural society. In the society, a statement Ja pachhi Jha aaunchha is very popular. It has a symbolic meaning, or it means that jagga liyapachhi jhagada suru hunchha (dispute starts after land purchasing). The social and economic value of land, as being a major property of a household, was very high in the past. For this reason, cases (disputes) were more likely to arise during and after the land purchasing process get completed. There were many cases in the court related land and this situation is still now to some extent. Therefore, moving to court, also an important work of people residing in rural areas, is called adda adalat jane. The next important move, related to land is called rakam bujhauna jane/tirna jane (to pay land tax) and mal adda jane (move to land revenue office). Jagga paas garna jane (move for land registration) and naamsaari garna jane (move for land ownership change) are also associated with jagga-jamin (land i.e. farming land). Most of the movements relate to adda jane were related with land in the past however, decreased in the present time due to the decrease in land transaction in the villages.
Moves based on kinship and neighborhood network
The short-period of moves based on kinship and neighborhood network are maita jane (move to natal home), janta jane (to participate in a marriage ceremony), kanyartha jane (movement for seeking bride), kadkal jane (move for escorting), rit puryauna jane (move for bringing articles in marriage), nimto manna jane (movement for participating in social events), birami herna jane (movement for meeting sick person), birami liyera jane (movement for bringing sick person), saghauna jane (moving for helping), parma tirna jane (moving for labor exchange), kaliya jane (participate as mediator in marriage ceremony), maganima jane (movement for seeking bride), and nwaranma jane (participating in name giving ceremony). Such types of moves help keeping neighborhood linkages and inter-household relationships as well as maintaining a kinship relation in the rural communities. These types of moves are even mentioned by Young and Doohan (1989) in relation to the aboriginals of Central Australia. However, the above mentioned moves are not common in all caste and ethnic groups, nor do in all age group and sex. The moves—such as rit puryauna jane, maganima jane, kaliya jane, and nwaranma jane and so on—are related especially to Rai community (see, Rai 2017). Of them, the former three (rit puryauna jane, maganima jane and kaliya jane) are concerned with the marriage ceremony and the last one (nwaranma jane) with name-giving ceremony, respectively. Kanyartha jane (movement to seek bride) is mainly used by Brahmin-Chhetri community as parallel terms maganima jane of Rai community (Table 1). The rest of the other words used for short-term movement often belong to all castes and ethnicities. But the two items, saghauna jane (moves for helping) and parma
Dhyanendra, Bhim, Hriday Lal/ Territorial mobility ...Vol. 14: 81-112, 2021

106
tirna jane (moves for labor exchange), mainly prevail in Rai community residing in this Sampang area because these practices are more common for this community from very beginning. Mostly, senior persons or the family heads are involved in the moves such as birami herna jane (moves for meeting sick person), kanyartha jane, and kaliya jane etc.
Moves based on daily necessities
Most of the moves based on daily necessities for rural life cover short period of time and short distance. The major types of territorial mobility based on daily necessities in the rural areas of Majhkirant region are bazar jane (move for marketing), sauda garna jane (move for purchasing), aspatal jane (move for treatment), bijuwama phukna jane (move for healing to shaman), mal lina jane (move for bringing chemical fertilizer), tel pelna jane (move for making oil in the mill), bill tirna jane (walking for paying bill), and phone garna jane (walking for phone), and gai/goru/bhaisi/khasi/sungur kinna jane (walking for purchasing animals) etc.
Most of the consumers of the urban areas are dependent on the market for their daily necessary goods and services. This trend has also been increasing day by day in the rural areas due to the changing pattern of consumer behavior (see Koirala, 2006) and even major activities of the people living in the rural areas. The term, bazar jane includes various types of marketing activities for different purposes in the rural community. Sauda garna jane and saman kinna jane terms are also used for this purpose.
The next prominent move of the rural people in this region is aspatal jane (walking to hospital for medical treatment) that has been common types of territorial mobility. Upachar garna jane and ausadhi garna jane are some synonymous words used for this mobility. However, dhamima phukna jane and bijuwalai dekhauna jane (consult witch doctor) were the terms more prevalent in the past. Now-a-days, people of Sampang area visit health posts located in the village in normal case and go to Tumlingtar, Dharan, Biratnagar, and Kathmandu for serious cases of medical treatment.
As agriculture is the main occupation of rural livelihoods in Nepal, the practice of purchasing chemical fertilizer (bikashe mal) from the district headquarter or regional market center is known as mal lina jane in Nepalese terms. Such move is more apparent especially at the beginning of two seasons—summer and winter of the year. Tel pelna jane (crushing oilseed in mill) is also a short time and short-distanced mobility connected to seasonal cycles after immediate harvesting of mustard seed and the beginning of main festival.
Dhyanendra, Bhim, Hriday Lal/ Territorial mobility ...Vol. 14: 81-112, 2021

107
Hulak jane/chiththi pathauna jane (moves for sending letters in post-office) and phone garna jane are also local types of short time and short-distanced movement to exchange information with family members living outside home. However, the mail exchange through post-office has been replaced due to increasing access to landline phone and cell phone nowadays.
The moves related to buying or purchasing of cattle, buffalos, goats, and pigs are also important territorial mobility in the rural areas of Majhkirant region. The transaction of such kinds of livestock takes place in the village for meat, milk, and ploughing oxen. Basically, Rai people search pigs and buffaloes for meat on the occasion of festivals and wedding ceremonies, mostly in the winter season which is known as leisure period. Similarly, Brahmin people seek goats, milky cows and buffaloes for meat and milk. Somebody moves out of village and spends more than one day for such purpose.
Baralina jane (Walk about)
Baralina jane refers to walking rudderless (walkabouts). This type of territorial mobility includes ramit herna jane (visit for sightseeing), sathi bhetna jane (move for meeting mate), parcel puryauna jane (move for handing over gift), nachna jane (move for dancing), khelna jane (move for playing), juwa/tas khelna jane (move for gambling). The last one juwa/tas khelna jane was very noticeable in the past. Those types of moves are often confined to younger age in male group. This tendency is mostly found in Rai community of young age, called allare umer (teen age). However, baralina jane (in the sense of time killing) is neither taken as a positive aspect nor does it have any certain destination and any achievement. Ramit herna jane (move for taking enjoyment) is concerned to recreational activities after long busy work as well as in winter season in the rural areas. Similarly, youths of the village sometime participate in volleyball and football match organized by local clubs and different organizations and Sakela naach (Sakela dance) in the neighboring village. The range of duration and distance of baralina jane moves remains uncertain in such territorial mobility in rural community. Parcel puryauna jane (visit for passing goods) and saathi bhetna jane (visit to meet friend) also belong to Lahures and Arabe Lahures who come home on leave and participate in such moves. These kinds of moves (walkabouts) are common especially in Rai community of Sampang.
Gaun-bensi garne (Transhumance)
The term gaun-bensi garne or lek-bensi garne (moving highland and low land) is a seasonal movement in the upper and lower part of the hill is also known as transhumance system in the whole hill region of Nepal. It is a back and forth movement of households
Dhyanendra, Bhim, Hriday Lal/ Territorial mobility ...Vol. 14: 81-112, 2021

108
with their livestock within a considerable distance between two places. The purpose of movement is to rear livestock along with agriculture. It is common to spend six months in lek (upper land) and bensi (lower land) with livestock as well as performing agriculture activities. These regular activities of rural people are always determined by the seasonal cycles.
Ghar phirne (back home)
Ghar phirne (returning home), an important component of ghumphir (short-term mobility) refers to returning home by absent members of the family to fulfill obligation and commitment towards household members, kin network, neighbors, and relatives. Ghar phirne (back home) is known as the important duty of movers. Most of the absent members come back home, especially in the festival, ritual works, and traditional ceremonies in the rural community.
Mobility patterns of people living in any place are also influenced by seasonal events. The calendar is determined on the basis of a climatic condition of a place (Smith, 2004). Most of the customary and ritual activities belong to different communities and are directly and indirectly related with seasonal calendar. Seasonal calendar includes events from busy life to leisure type of life pertaining to entertainment and recreational activities. Mostly, the people of agrarian society in rural areas of Nepal move outside home for different purposes especially in the winter season due to the leisure period in this season. This context is more suitable in the case of married women. This pithy saying always uttered in this area also covers these circumstances: paiyou phul phuldaa maiti ghar samjhanu, aaru phul phulda aaphnu ghar samjhanu. This saying indicates the two suitable seasons for meeting and taking enjoyment and being busy for agricultural works, such as taking enjoyment in winter from aaru (peach) flowering and from paiyu (prunus cerasoides) flowering and engaging in work in summer. The findings of Smith (2004) also have shown clear seasonal patterns of mobility in Cape York, especially in the dry and wet season.
The beginning of the agricultural season and harvesting period are the prime factor for returning home by movers from beyond in the rural community. The household head, especially man, returns home in the sowing periods for ploughing which was a mandatory work related solely to man. However, this situation has now been changed where people have started to focus for cash crops such as orange, cardamom, and rudrakshya etc. Similarly, woman also started ploughing in the fields which were not common in the past.
Dhyanendra, Bhim, Hriday Lal/ Territorial mobility ...Vol. 14: 81-112, 2021

109
ConclusionTerritorial mobility is not only part of survival and common feature of rural living it also reflects whole life style and life pattern of the community. Therefore, caste ethnic dimension of territorial mobility is an important aspect of traditional community of rural area. Basically, there are two forms of mobility: basai sarai and ghumphir in the rural context. Basai sarai includes those forms of mobility that primarily involve permanent relocation of households and individuals from the place of origin to another destination place. Ghumphir is the people's movement within short distance and short period of time for different purposes. The nature of ghumphir varies on the basis of caste and ethnicities in the rural context. The people of Sampang have been participating in various forms of mobility for their daily livelihood from the very beginning. Their movements are not only confined within home territories but also to foreign countries as Lahur jane (Gurkha recruit) and recent labor recruits as wage workers particularly in Gulf countries and Malaysia.
Mobility in the eastern hills of Nepal have many similarities as the forms and types are the same when compared with studies accrued out more than two decade ago (see, Subedi 2000). However, in the case of Manjhkirant the tendency to lahur jane or paltan jane, naach gaan ma jane, koila khani jane, ketaketi padauna jane, sikar jane, pitri garna jane appeared more common. This example also signifies that the nature and degree of different kinds of moves differs according to space and time. These variations reflect the socio-cultural, religious, and economic difference in Sampang as this area is predominantly settled by Rai community and is part of Majhkirant. Over time some types of moves have expanded, while others have disappeared. Likewise, some moves have taken modified form and some have continued in their original form. Furthermore, the moves related with economic, political, professional, educational and awareness, have become more extensive and common than ever before.
ReferencesAcharya, B. (1968). Shree Panch Badamaharajdhiraj Prithvinarayan shahko sankshipta
jibani [A short biography of His Majesty Pirthvinarayan Shah]. Kathmandu: Chief Press Secretariat of His Majesty.
Alexiades, M. N. (2009). Mobility and migration in indigenous Amazonia: Contemporary ethnoecological perspectives. New York: Berghahn Books.
Bangdel, L. S. (1948). Muluk bahira [Beyond the country]. Kathmandu: Ratna Pustak Bhandar.
Dhyanendra, Bhim, Hriday Lal/ Territorial mobility ...Vol. 14: 81-112, 2021
110
Bell, M. and Ward, G. (1998). Patterns of temporary mobility in Australia: Evidence from the 1991 Census. Australian Geographical Studies, 36 (1): 58-81.
Bhattarai, G. R. (1974). Mugalan [Abroad]. Kathmandu: Oriental Publication.
Cresswell, T. (2006). On the move: Mobility in the modern Western world. New York: Routledge.
Gurung S. (2011). British Gurkha recruitment and higher education of Gurung young men. Dhaulagiri Journal of Sociology and Anthropology, 5: 143 144.
Heide, S. V. (2001). Some aspects of migration, mobility and the democratic movement among the Thkalis: Effects of cultural change and the danger of cultural change and the danger of cultural loss. In S. V. Heide, & T. Hoffman (Eds.). Aspects of migration and mobility in Nepal. Kathmandu: Ratna Pustak Bhandar.
HMG (2032 B.S.). Divyopadesh: An enlightening sermon, Kathmandu: His Majesty's Government of Nepal.
IOM (2019). Migration in Nepal: A country profile- 2019. Kathmandu: International organization for migration (IOM).
Kansakar, V. B. S. (1974). History of population migration in Nepal. The Himalayan Review, VI: 58-68.
Kansakar, V. B. S. (2005). International migration in Nepal for livelihood. B. P. Subedi & P. C. Poudel (Eds.).Geography and geographers' work in Nepal: Reflection on mountain environment and human activities. CDG, NGS and NCCR.
Chhetri, L. B. (1957). Basain [Migration]. Lalitpur: Sajha Prakashan.
Kattel, S. P. (2000). Development and its victims (From pottery makers to porters: The changing life world of the Kumals of the Arun Valley, Eastern Nepal) (Unpublished M. Phil Thesis). University of Bergen, Department of Social Anthropology, Bergen, Norway.
Kelly, R. L. (1992). Mobility/sedentism: Concepts, archaeological measures, and effects. Annual Review of Anthropology, 21: 43-66.
Koirala, H. L. (2007). Livelihood pattern, adaptive strategy and sustainability of communities in Southern Arun Valley of Nepal Himalayas. Unpublished PhD Dissertation. Gauhati University, India.
Lemos, A. (2010). Post−mass media functions, locative media, and informational territories: New ways of thinking about territory, place, and mobility in contemporary society. Space and Culture http://sac.sagepub.com/content/13/4/403: DOI: 10.1177/1206331210374144 2010 13: 403
Dhyanendra, Bhim, Hriday Lal/ Territorial mobility ...Vol. 14: 81-112, 2021

111
Memmott, P., Long, S., Bell, M., Taylor J. & Brown, D. (2004). Between places: Indigenous mobility in remote and rural Australia. Aboriginal environments research centre, and Queensland centre for population research. Paper presented at the annual meeting of University of Queensland, Autralia.
Rai, D. B. (2017). Sense of place and its reflection on territorial mobility in Rai community of Sampang village of Majhkirant. (Ph.D Dissertation), Faculty of Humanities and Social Science, Tribhuvan University.
Rai, K. J. (2074 BS) [2017]. Sakkhewa sily- ek adhyan [Sakkhewa method-a study]. Lalitpur: Aadibasi Janajati Uththan Rastriya pratisthan.
Shah, P. N. (2032 B.S.). Divyopadesh: An enlightening sermon, Kathmandu: His Majesty's Government of Nepal.
Sheller, M., & Urry, J. (2006). The new mobilities paradigm. Environment and Planning, 38: 207-226.
Sirkeci, I. and Cohen, H. J. (2016). Cultures of migration and conflict in contemporary human mobility in Turkey. European Review, 24 (3): 381 - 396 DOI: 10.1017/S1062798716000119.
Smith, B. R. (2004). The social underpinnings of an outstation movement in Cape York Peninsula, Australia. In Taylor, J. & Bell, M. (Eds). Population Mobility and Indigenous Peoples in Australasia and North America. London: Routledge, 239-261.
Subedi, B. P. (1993). Continuity and change in population movement: From inside a rural Nepali community (Ph.D. dissertation). University of Hawaii, Department of Geography.
Subedi, B. P. (2000). Conceptualizing territorial mobility through language of those who move and the dimension of caste and ethnicity: From inside a rural Nepali community. The Himalayan Review, 31: 1-36.
Subedi, B. P. (2007). Migration and tourism in the Trans-Himalayan Region: Studies on changing livelihood patterns of Upper Manang Community in Nepal. In R. P. Chaudhary, T. H. Aase, O. R. Vetaas & B. P. Subedi. (Eds), Local effects of global changes in the Himalayas: Manang, Nepal, UNIFOB.
Taylor, J. (1998). Measuring short-term population mobility among indigenous Australians: Options and implications. In Australian Geographer, 29 (1) 125-37.
Dhyanendra, Bhim, Hriday Lal/ Territorial mobility ...Vol. 14: 81-112, 2021
112
Urry, J. (2000). Sociology beyond societies: Mobilities for the twenty-first century. London: Routledge.
Young, E. and Doohan, K. (1989). Mobility for survival: A process analysis of aboriginal population movement in central Australia. Darwin: Australian National University.
Znawali, S. (2033 BS) [1976]. Prithvinarayan Shah (2nd Ed.). Darjeeling: Shyam Brothers.
Dhyanendra, Bhim, Hriday Lal/ Territorial mobility ...Vol. 14: 81-112, 2021

113
Policy issues in informal market place and marketing system in Nepal: Experiences from the cities of
Kathmandu Valley
Puspa Sharma, PhDAssociate Professor, Central Department of Geography, Tribhuvan University
Corresponding Email: [email protected]: 29 December, 2020; Accepted: 12 January, 2021; Published: March 2021
AbstractInformal market places and marketing systems are important sectors in providing employment and income to the poor residents of Kathmandu Valley, the largest urban agglomeration of Nepal. The informal marketing system is a traditional system and has been operated in the valley since the long. This sector shows unique features in terms of marketing, spatial location, and transformation. In this paper, the salient features of the informal market places and marketing systems prevailing in the cities of Kathmandu valley are portrayed and based on these, five major policy issues are explored and suggested for consideration to the urban government for the better management of the informal market places and marketing systems.
Keywords: Informal sector, market place, street traders, employment, income generation
IntroductionLike most of the large cities of developing countries, Nepal’s large cities exhibit unprecedented growth of population and influx of migrant labour. For instance, the Kathmandu Valley with its all 20 urban areas is the largest urban agglomeration in Nepal.1 Having nearly 1.5 million, the valley’s urban population in the last census of 2011 shared over 58% of the country’s total urban population (CBS, 2012). Over the past six decades (1952-2011), a great transformation has occurred in the physical area of the
1They include five large cities, viz Kathmandu and Lalitpur Metropolitan cities, Bhaktapur, Kirtipur, and Madhyapurthimi and 15 recently inducted municipalities after 2011. The valley occupies 475 km2.
The Geographical Journal of NepalVol. 14: 113-130, 2021DOI: https://doi.org/10.3126/gjn.v14i0.35555Central Department of Geography, Tribhuvan University, Kathmandu, Nepal

114
urban Kathmandu Valley. One of the crucial factors to this change has been the growth of population mainly due to the influx of migrants into the valley. Along with these, there has also been increased in the expenditure on urban utility facilities, government administration functions, health, education, banking, tourism, industries, and expansion of road networks in the valley, as well as to the change in political system (Pradhan, 1988). During the same decades, the valley’s urban population grew by over 8 times (from 181,082 to 1,465,000) to which migrants contributed approximately 70%. This overwhelming flow of migrants included both Nepalese and foreigners, particularly Indians (Kansakar, 1984; Skeldon, 1985; Pradhan, 2003; CBS, 2003, 2012; Pradhan, Sharma & Pradhan, 2020). Also the number of informal or squatter settlements in the valley grew from 17 to 45 along with their population from 3,000 to 13,300 during the years: 1985-2008 (Rabenau, 1990; CARE Nepal, 2008). The recent trend is that when people migrate, they choose larger cities instead of small towns. Thus, bigger cities continue to grow at faster rate than the small towns, creating more challenges to employment in the large cities (ADB, 2010). And there has been so huge magnitude of influx of migrants into the valley cities that the existing formal employment sectors could not absorb most of them. Despite this, however, the migrants’ inflow has been continued, creating surplus labour force. Thus, the surplus labour force has no other way but to engage in a variety of jobs related to the informal sector by own means. On the other hand, the small towns suffer from the minimal investments, resulting into inadequate development of physical infrastructure (MoUD/GoN, 2017).
This paper attempts to examine and analyze major critical issues in the informal market places and marketing, primarily based on experiences of the cities of Kathmandu Valley. It also suggests possible measures for better planning of the cities of the valley considering the importance and scope of the informal market place and marketing system. Similarly, it deals with concepts and problems of the informal sector in general as well.
Methods and materialsThe paper is based on the data collected during the field survey of 2015. In addition, information has also been acquired from other urban informal sector studies carried out in Kathmandu Valley, as well as from the governmental organizations particularly on the policies and programmes related to informal sector activities. Relevant analysis of the data and information has been carried out to fulfill the objective of this paper.
Puspa Sharma, PhD/ Policy issues in informal market place ...Vol. 14: 113-130, 2021

115
Results and discussionThe informal market place: Concepts, features and problems
Urban informal sector could be loosely defined to include activities related to the production and services existing in the cities and towns. In a more rigorous sense, it comprises persons, households and organizations engaged in the production, distribution and giving out of goods and services and thus includes activities related specifically to trade, manufacturing, construction-building, transport, and services-personal (hairdressing, laundry, tailoring, repairing, ornaments, carpenter, mason, metal workshops and the like) and professional (fortune teller, traditional healer, herbal medicine).
The term 'informal sector' was in fact originated with W. Arthur Lewis in 1954 to describe employment or livelihood generation primarily in the developing world (Lewis, 1955). It came into limelight with the name of ‘informal economy’ after the work of Keith Hart in Ghana in 1971 (Hart, 1973) and the work of the International Labour Organization in Kenya in 1972 (ILO, 2002). Since then several scholars have used it with different names such as traditional sector, unorganised sector, invisible market, shadow economy, grey market and so on in different countries across the world to refer to marginal but productive, small-scale and self-employed activities (Sethuraman, 1976, 1981; Souza and Tokman, 1976; Harris, 1978; Moser, 1978; Bromely and Gerry, 1979; Harper and Soon, 1979; Hussmann, 2004). This sector serves as a source for promoting growth, employment and equity objectives and thus one of the means of creating somewhat equitable distribution of income among the urban poor communities.
In Kathmandu Valley lying in the central hills of Nepal (Figure 1), the characteristics and developments of the informal sector are shaped by a range of factors: the growth and urbanization of cities, migration of labour from rural areas, location dynamic, growth of informal enterprises, and municipal authorities’ concerns, among many others (Sharma, 2018). In fact, all these features of the informal sector offer measurement and analysis of their relative importance for further planning and development particularly to the municipal governments.
Puspa Sharma, PhD/ Policy issues in informal market place ...Vol. 14: 113-130, 2021

116
Figure 1: Location of Kathmandu Valley, Nepal
In the cities of the valley, informal market indeed is the largest sector in terms of number, employed population and service provision. One of the principal elements of the valley’s urban informal market place is the change of local marketing systems. Over the years, the local marketing systems dealing with the local products have evolved remarkably, which can be attributed primarily to the urban growth. In earlier times, the marketing systems
Puspa Sharma, PhD/ Policy issues in informal market place ...Vol. 14: 113-130, 2021
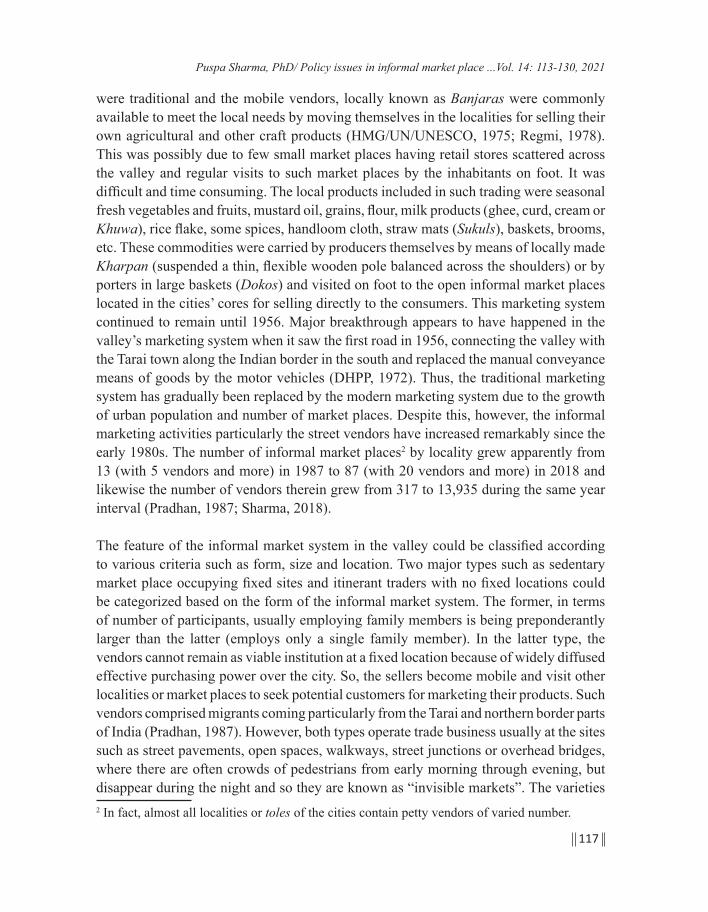
117
were traditional and the mobile vendors, locally known as Banjaras were commonly available to meet the local needs by moving themselves in the localities for selling their own agricultural and other craft products (HMG/UN/UNESCO, 1975; Regmi, 1978). This was possibly due to few small market places having retail stores scattered across the valley and regular visits to such market places by the inhabitants on foot. It was difficult and time consuming. The local products included in such trading were seasonal fresh vegetables and fruits, mustard oil, grains, flour, milk products (ghee, curd, cream or Khuwa), rice flake, some spices, handloom cloth, straw mats (Sukuls), baskets, brooms, etc. These commodities were carried by producers themselves by means of locally made Kharpan (suspended a thin, flexible wooden pole balanced across the shoulders) or by porters in large baskets (Dokos) and visited on foot to the open informal market places located in the cities’ cores for selling directly to the consumers. This marketing system continued to remain until 1956. Major breakthrough appears to have happened in the valley’s marketing system when it saw the first road in 1956, connecting the valley with the Tarai town along the Indian border in the south and replaced the manual conveyance means of goods by the motor vehicles (DHPP, 1972). Thus, the traditional marketing system has gradually been replaced by the modern marketing system due to the growth of urban population and number of market places. Despite this, however, the informal marketing activities particularly the street vendors have increased remarkably since the early 1980s. The number of informal market places2 by locality grew apparently from 13 (with 5 vendors and more) in 1987 to 87 (with 20 vendors and more) in 2018 and likewise the number of vendors therein grew from 317 to 13,935 during the same year interval (Pradhan, 1987; Sharma, 2018).
The feature of the informal market system in the valley could be classified according to various criteria such as form, size and location. Two major types such as sedentary market place occupying fixed sites and itinerant traders with no fixed locations could be categorized based on the form of the informal market system. The former, in terms of number of participants, usually employing family members is being preponderantly larger than the latter (employs only a single family member). In the latter type, the vendors cannot remain as viable institution at a fixed location because of widely diffused effective purchasing power over the city. So, the sellers become mobile and visit other localities or market places to seek potential customers for marketing their products. Such vendors comprised migrants coming particularly from the Tarai and northern border parts of India (Pradhan, 1987). However, both types operate trade business usually at the sites such as street pavements, open spaces, walkways, street junctions or overhead bridges, where there are often crowds of pedestrians from early morning through evening, but disappear during the night and so they are known as “invisible markets”. The varieties 2 In fact, almost all localities or toles of the cities contain petty vendors of varied number.
Puspa Sharma, PhD/ Policy issues in informal market place ...Vol. 14: 113-130, 2021

118
of goods and services for selling can be grouped into: (i) perishable: vegetables, fruits, live animals and their products, (ii) grocery, (iii) clothes, (iv) food and beverages, (v) durable goods, and (vi) personal and repairing services. Varieties of these goods vary by time shift and choice of consumers. For instance, perishable, foods and beverages are traded often in the morning and evening shifts, while marketing of other items occur during the day shift. Further, daily marketing of fresh vegetables in the morning or early evening is very common, which indeed appears to have continued since the long. This may be due to the lack of storing or refrigerator particularly among the poor consumers. Another change in the informal market is the entry of consumer goods produced by home-based enterprises due to mainly the emergence of supermarkets and departmental stores in the recent years.
The rapid urban growth has given rise to a number of other types of informal activities, besides informal marketing. They include informal activities related to building construction (mason, contractor, carpenter, painter, plumber, electrician and the like), transportation (pushcart, rickshaw, porter), personal service (hairdresser, laundry, tailoring, repairing, metal scraper, wastes collector) and home-based industry or craft works (blacksmith, goldsmith, silversmith, iron/aluminum, straw, bamboo, cotton, wool, herbs, and agri and dairy produce). The employment provided by these activities is estimated to be substantial, though the information on them is extremely lacking.
However, the informal market places often face problems in operating business. For most of the vendors, the main problem is the harassment by the municipal authorities who either often used to drive out them from the traditional or recent marketing sites or to confiscate their goods and charge them heavy penalty. Other problems relate to environment such as congestion, scattered litters, noise, lacking of sanitation, dusty and muddy, and cluttering. Since the traditional marketing systems have been existed since the long and have employed mostly the urban poor, all those problems of the informal market places need to be improved and managed by the municipal authorities by designing and initiating plans such as operation of vending through certain accessible localities across the cities with providing basic sanitation and pavement facilities, norms and standards, time allocation, litters management, and levying reasonable amount for occupancy of the site by vendors, as well as by regular monitoring.
Based on these unique features of the urban informal market places and marketing systems, the following five major issues could be forwarded for the urban government’s policy consideration in order to further improving of the management of the informal market place and marketing systems in the cities of the Valley.
Puspa Sharma, PhD/ Policy issues in informal market place ...Vol. 14: 113-130, 2021

119
Policy issues in the informal market place and marketing systems
Informal activities particularly market places and marketing systems are an essential and unavoidable sectors in the cities of developing countries. In Nepal, they are even more important as the large cities continue to grow primarily due to migrants in search of jobs and other opportunities and facilities and a weak industrial base. The government has made some efforts to address the issues in the informal marketing systems. For instance, now-a-days the municipal government has started to allow the traders to operate trading activities at the public places within the municipal boundary to generate income. Provision has also been made for the municipal authorities to regulate the temporary market places and vendors for operation upon levying certain fees according to time shift, occupancy of site-area, etc. (MLD, 1999). The National Urban Policy, 2007 and the National Plan, 2008 incorporated efforts to include the informal activities into urban development mainstream and to identify locations for operating informal trading activities through encouraging them by providing essential facilities such as skill training, credit, and the like (DUDBC, 2007; NPC, 2007). Following these policies and acts, Kathmandu metropolis has made guidelines to regulate the informal market places and street vendors (KMC, 2007). However, despite these efforts, studies so far available indicate that the informal market places and marketing systems have not been improved so far, but rather they are disorganized and haphazard due to mainly weak implementation of the regulations and often change in the rules and regulations (Pradhan, 1987; Sthapit, 1999; CIUD, 2006; Dawadi, 2008; Sharma and Pradhan, 2017; Sharma, 2018).
It is argued that there is no way but to think of further planning, management and regulation of the informal marketing activities in the cities of the Kathmandu Valley. The importance of the informal sectors of the Kathmandu Valley could be pointed out as below and hence there is a urgent need to devise policy measures for further strengthening and management of the informal market places and marketing systems (Sharma, 2018).
Employment generation
According to ILO (2000), employment in the informal sector is defined to include all jobs of the persons being employed in at least one of the informal sector enterprises, for instance the private unincorporated enterprises owned and operated by individual, or a group of members of the same household. It is argued that the urban informal sector is for providing employment among the urban poor and equity distribution of income. Urban poverty is a crucial problem of developing countries. Poverty is caused by lack of employment opportunities or inadequate incomes. Employment creation
Puspa Sharma, PhD/ Policy issues in informal market place ...Vol. 14: 113-130, 2021

120
is thus perceived as the main goal of most poor countries. Small enterprises display a remarkable capacity to absorb labour in full or part time and it is reasonable for government to promote them, or to desist from destroying them. Of several informal sector activities, informal trading is the main and largest sector to employ petty traders and contribute significantly to the functioning of the urban economy (Sanyal, 1988).
In Nepal, the informal sector has predominant role in its economy. It employs over 70% of the economically active population and contributes around 52% to the national GDP (CBS, 2008). The Tenth Plan (2002-2007) has recognised its importance in employment generation and poverty alleviation in the country (NPC, 2002). However, there is lack of exhaustive data with the public source to describe features and status of the urban informal sector in the country, except the Nepal Labor Force Survey that made first attempt to gather some data on this sector across the country in 1998 (CBS, 1999).
Available studies exhibit that the people living in slums of the Kathmandu Valley have adopted various types of the informal activities (petty traders, tailoring, weaving, craftsmen, daily wage workers, transport workers, sand and gravel miners, rag pickers, hotel and restaurant workers, teachers) as a means of livelihood and these activities have employed over 90% of the working population (Dawadi, 2008; Raut, 2008; Pradhan, 2010). A recent study showed over 87% of the street vendors, mostly migrants being engaged in the informal marketing (Sharma, 2018). Also found were that those involved in these activities were mostly illiterate, semi-skilled or no formal education and training. They learned skills required for their job through apprenticeship system from their elders. They have been the most vulnerable to the lockdown adopted by the government as a measure to control the dissemination of current upsurge of COVID-19 virus and badly affected their livelihood due to lost of their informal activities and finance, capacity building are to be undertaken by the municipal government particularly the marketing activities, which are a major source of employment.
Employment for women
Women across Nepal often remain without job and mostly engage in farming and household chores. Informal marketing is a valuable alternative source of income and employment opportunities for urban poor, including women in the cities of Kathmandu Valley. The informal marketing is found encouraging women to engage to produce goods based on home-cottage industries, sewing, food preparation, handicrafts and so on (ILO, 2005). Evidence shows that there is an increasing trend of women employed in the informal activities including particularly the street vendors. In the cities of the valley, women employees have out-numbered the women employees in the informal
Puspa Sharma, PhD/ Policy issues in informal market place ...Vol. 14: 113-130, 2021

121
market places (Sharma, 2018). The main reason was social security for women, mainly because mobile vendors required special skills such as riding bi-cycles or driving push carts (Thelas) to move from localities through localities until evening as there is no street light in the most parts of the cities. In addition, the women also often needed to look after their families or household chores such as preparing foods and other works at home in the morning and evening. Women were often found in larger number over males in trading of seasonal produce and the goods during special occasions such as festivals, cultural events, etc. around the temples.
Slowly and gradually it is evident that informal trading has reduced dominance of men in work-employment by engaging women. It is also an important sector to empower women by earning on their own. To encourage more women to this sector, the municipal government needs to create amicable working environment for women in the market places, provision of credit often at below market interest rate, skill training, sanitation facility, street lights and market access and creation of women informal sector workers association to speak and raise concerns on their behalf.
Use of local products and meeting of basic needsThe goods of the informal activities are originated mainly from local area and indigenous craft traditions to satisfy the needs of the people. In earlier times, the traders for the local products such as agricultural and other craft products were made available to meet the local needs by moving themselves from place to place in the Kathmandu Valley (HMG/UN/ UNESCO, 1975; Regmi, 1978). This system still persists today in most cases. The main features are that they use local indigenous technology, skill, resources and equipment. The localised products such as mustard oil, milk cream and purified butter (ghee), rice flake, etc. were made by indigenous technology and skill of the local inhabitants. Further, locally produced straw, bamboo products (mats, baskets, chairs, tables, etc.) or handloom cloth are aesthetically more pleasing at least to an outsider’s eye. As such, they create backward linkage for utilising local resources available in the surrounding rural areas, as well as from other places within the country and forward linkage for exporting their products in the towns and cities, where there is demand.
Puspa Sharma, PhD/ Policy issues in informal market place ...Vol. 14: 113-130, 2021

122
Figure 2: Spatial distribution of informal market places and population density (Source: Sharma, 2018)
The local products of the informal petty enterprises are more likely to satisfy the needs of low-income people. A large part of the basic needs of the poor, including the provision of consumer goods, is provided through street vendors due to mainly two reasons. One is the number of small size market places being scattered across the valley. The price of the basic goods and services of such market places is generally cheaper and small vendors are comparably in large number. Another is that the street vendors carrying goods (comparably small volume and few varieties) by themselves tend to visit house to house for selling them. In doing so, the travel time or cost of the poor people is saved. Evidence is that the distribution of the informal market places is random or scattered at distance apart of approximately 340 meters (Sharma, 2018).
However, there are two distinct patterns of spatial distribution of these market places, such as concentration in the core areas and dispersion in the periphery areas, depending on the population distribution or density in the valley (Figure 2). It gives us an
Puspa Sharma, PhD/ Policy issues in informal market place ...Vol. 14: 113-130, 2021

123
opportunity to assess whether the existing locational pattern of the informal market places is appropriate for further planning. Thus, it is argued that potential informal market places are to be developed with providing essential basic market development facilities by the municipal government in view of considering support to grow local products.
Managing urban environmentThe urban expansion and the emergence of the informal activities in the Kathmandu Valley’s cities have elevated the concern for environment management in a number of ways. For instance, the cities have shown deteriorating urban environment owing to rapid increase in population growth and density; availability of relatively greater opportunities in employment and social care facilities, change in city life styles and consumption patterns, yet lacking of awareness or habits among the inhabitants with regard to dumping wastes in the containers or at the designated sites, haphazard dumping corners scattered over the cities, limited waste disposal containers in the cities, and the municipalities’ irregularity in the collection of wastes. There is also lack of regular awareness raising efforts and notice boards about prohibition of waste disposals anywhere on the part of municipalities.
One of the virtues of the informal sector is its participants to engage in recycling waste materials generated in the cities into productive use. It is found that quite large number of the informal workers are engaged in the collection of waste materials such as scrap metals, used bottles, waste paper, spent batteries, used tyres/tubes, wires and the like (CIUD, 2006; CARE Nepal, 2008). Such recycling of materials, besides contribution to employment and physical environment, also lead to conservation of resources. One major concern of wastes management is to reduce volume of wastes at sources before dumping them into the main dumping sites. The rag pickers pick and sort the wastes for selling to the scarp-metals collect centres/traders for recycling. Since most of these activities are carried out without municipal governments’ intervention or support, explicit incentives to them can enhance their contribution to the environment. Note that this sector has employed mostly poor adults and young migrants from rural and other areas from within the countries (CARE Nepal, 2008).
One of the problems facing by the street vendors is dust pollution during the dry months and muddy streets during the rainy months. It is seen that there are many dusty and unpaved roads and potholes across the valley’s cities due to the snail paced road expansion works as well as lack of regular maintenance of ruined streets. Another problem is that the public toilets are extremely limited and their sanitation condition in terms of cleanliness
Puspa Sharma, PhD/ Policy issues in informal market place ...Vol. 14: 113-130, 2021

124
and hygiene is awfully poor. It is essential that the municipal authorities should think for providing solutions to these problems and also need to imparting awareness among the street vendors about maintaining hygienic condition of their living and surroundings. Furthermore, most of the street traders have often encroached upon public uses such as pavements, walkways, parks, alleys, traffic intersections or road junctions in the cities of valley. So, such petty traders are often being harassed by the municipal authorities or by traffic police, creating the feeling of security lapse to them. Such activities, however, can be regularised by providing license, credit facilities, and other incentives to them. This is mainly due to the idea that the municipal authorities should not think ‘street vendors’ as problems or burden in urban planning and management, but they should think them as ‘opportunities’.
The complex nexus of linkages described above seem to pose some conflicts between urban policy measure to improve the urban environment on the one hand and those aimed at improving employment and income in the informal sector, particularly the market places and marketing systems on the other. One consequence of this is that any effort to improve the urban environment by revering the linkages could affect the income and employment situation of the informal sector.
Managing informal market places sites
One major concern of the city planning is the improper location of the informal market places, which often occupy public space or street sides. The fact is that they have been operating at such sites since the historic time, which however were manageable and essential for marketing service considering the population size of the cities during that time. The number of the market places and vendors has grown substantially along with the rapid growth of population in the cities due to mainly migration. Another feature is the change in location of the market places from old ones to new sites or some tend to disappear due to expansion of streets and other public works.
Available studies indicate that the market places show two basic problems: one refers to encroachment of public space, creating congestion to pedestrians and another is the lack of pavement and drainage system at the sites of the market places, creating problem of dust and mud during the winter and summer rainy season respectively, as well as un-drained waste or rainwater impoundment due to lack of outlets causing stint smell (Dawadi, 2008; Sharma, 2018). Managing and planning of the informal market places should be an essential work and duty of the municipal authorities, as they are the traditional sites for meeting between petty sellers and buyers or consumers. As such, they are unavoidable as well as an essential element of the city landscape. Provisions
Puspa Sharma, PhD/ Policy issues in informal market place ...Vol. 14: 113-130, 2021

125
of street drainage facility for storm water and pavement of floor of the market place sites to avoid dust and mud should be an important priority of the city planning and development. Efforts from the private sector to provide market place facility to the vendors to operate trading of perishable goods and other services to local inhabitants in some places of the cities are praiseworthy, but there is also lack of proper pavement of the floor and paths within the market places, which is due to lack of supervision and monitoring or lack of regulations of the municipal authorities.
Conclusion Like in most large cities of the developing countries, there is also a growing concern in Nepal about the role and existence of the informal sector with respect to economic, social and spatial development in the cities. According to the ILO (2005), registered economic units are also considered informal when they display characteristics similar to the unregistered economic units in terms of indicators like small size enterprise, adherence to the social security, size of investment, working structure such as tiny space, etc. On the other hand, the informal sector activities including mainly the street vendors tend to create many problems such as environment pollution, congestion, and haphazard throwing of litters. The municipal authorities often regard them as a nuisance and a reason for ugly appearance of the cityscape. Anyway, the working condition in the informal sector is generally poor and therefore it requires for improvement.
It is evident from the above analysis that the role of the informal market places in terms of providing employment and income opportunities among the poor, migrants and disadvantaged groups including women appears to be undoubtedly important in reducing the extent and intensity of poverty, as well as in providing basic goods and services to the local inhabitants of the cities. Because the cities have become major destinations of the most migrants and as a result, change in the spatial, economic, social and environmental settings in the cities is apparent. From the critical geographic perspective, there is a danger with the urban poor, particularly the street vendors in terms of economic, social and cultural livelihoods possibly due to adaptation of urban structural planning adjustments such as land use, road expansions and traffic congestion management by the local governments, though the market place locations are often expressed in terms of the economic and spatial accessibility to the residents of the cities.
The informal market places and marketing of the Kathmandu Valley show unique features. But they also offer a challenge to the urban policymakers with regard to the issues such as improvement of the working conditions and legal and social protection of the persons employed in the informal sector; training and skills development; organization
Puspa Sharma, PhD/ Policy issues in informal market place ...Vol. 14: 113-130, 2021

126
of informal sector producers and workers, and development of appropriate regulatory frameworks. Since the street vendors play crucial role in the positive contributions to the urban economy, some policy measures and strategic interventions are needed on the part of the municipal government for managing street vendors into organized market and dignified street vendors. In case of large cities of the country, the plans and policies so far initiated for managing the informal market places and associated aspects are inadequate. Some of the policy measures and acts including local self-governance act, urban policy, town development act, and the street and footpath business guidelines are appropriate and encouraging towards managing or regulating the informal economic activities such as street vendors and also towards the revenue generation from this sector in the cities. On the other hand, the acts described in the environment protection do not allow operating any such activities in open spaces of historical and cultural importance and likewise the public road act and traffic and transportation management act also do not allow to operating any trading activities in the public places or foot-paths from the vehicular and pedestrians flow perspective. Thus, it appears that there are conflicts in the acts and regulations among the different public agencies in regard to manage and regulate the street vendors in public places. There is a question of implementation of all these acts and regulations responsibly and honestly by the concerned stakeholders.
Location dynamics of the informal market places and their participants are important for understanding the spatial distribution, growth and transformation of the market places in the cities. In this paper, effort has been made to analyse the informal market places and street vendors in terms of various aspects such as spatial location of the market places and their attributes, types, size, problems and prospects and historical account in the Kathmandu Valley’s cities from the geographical perspective. As there are extremely limited studies on the location structure of the informal economic activities, the number of trading firms and their significance in terms of spatial and temporal planning perspectives in the cities in an exhaustive manner, they can be issues for future research. However, the five major policy issues described in the paper can be helpful to the valley’s municipal authorities for consideration in order to formulate and undertake appropriate policies and legal and regulatory frameworks for managing the informal market places and marketing systems. All these would be a complement to contribute to the existing body of literature on the informal market places and marketing systems.
ReferencesADB (2010). Unleashing economic growth: Region-based urban development strategy
for Nepal. Philippines: Asian Development Bank.
Puspa Sharma, PhD/ Policy issues in informal market place ...Vol. 14: 113-130, 2021

127
Bromley, R. & Gerry, C. (1979). Who are the casual poor? In R. Bromely and C. Gerry (Eds.), Casual work and poverty in Third World cities, 3-23. New York: John Wiley and Sons.
CARE Nepal (2008). Study on status of unemployed slum youths and their possible linkages with job market in greater Kathmandu. Kathmandu: CARE Nepal.
CBS (1999). Nepal labor force survey 1998/99 statistical report. Kathmandu: Central Bureau of Statistics.
CBS (2003). Population monograph of Nepal. vol. II, 121-168. Kathmandu: Central Bureau of Statistics.
CBS (2008). Nepal labor force survey 2008 statistical report. Kathmandu: Central Bureau of Statistics.
CBS (2012). National population and housing census 2011. Kathmandu: Central Bureau of Statistics..
CIUD (2006). Study of street vendors in Greater Kathmandu. Kathmandu: Centre for Integrated Urban Development (CIUD).
Dawadi, G. S. (2008). Efficiency measures in informal street vendors of urban core area of Kathmandu metropolitan city (Unpublished masters’ thesis). Institute of Engineering, Tribhuvan University, Nepal.
DHPP (1972). Inventory report of Kathmandu Valley. Kathmandu: Department of Housing and Physical Planning, Ministry of Public Works, Transport and Communications, His Majesty’s Government of Nepal.
DUDBC (2007). National urban policy, 2064. Kathmandu: Department of Urban Development and Building Construction (DUDBC), Ministry of Physical Planning and Constructions, Government of Nepal.
Harper, M., & Soon, T. T. (1979). Small Enterprises in Developing Countries: Case Studies and Conclusions. I.T. Publication, London.
Harris, B. (1978). Quasi-formal employment structures and behaviour in the unorganized urban economy, and the reverse: some evidence from south India. World Development, 6(9/10), 1077-1086.
Hart, J. K. (1973). Informal income opportunities and urban employment in Ghana. Journal of Modern African Studies, 11(1), 61-89. doi:10.1017/s0022278x00008089. JSTOR 159873.
Puspa Sharma, PhD/ Policy issues in informal market place ...Vol. 14: 113-130, 2021

128
HMG/UN/UNESCO (1975). Kathmandu valley: The preservation of physical environment and cultural heritage protective inventory, Vol 1. Kathmandu: Department of Housing and Physical Planning, His Majesty’s Government of Nepal.
Hussmanns, R. (2004). Measuring the informal economy: From employment in the informal sector to informal employment, Working Paper No. 53 (December), Geneva: International Labour Office.
ILO (2000). Current international recommendations on labour statistics. Geneva: International Labour Office.
ILO (2002). Women and men in the informal economy. International Labour Organization. ISBN 978-92-2-113103-8. Retrieved 2006-12-18.
ILO (2005). A report on micro and small enterprise policy review in Nepal. Series 7. Kathmandu, Nepal: International Labour Organization (ILO).
Kansakar, V. B. S. (1985). Indo-Nepal migration: Problems and prospects. Contribution to Nepalese Studies, 11(2): 49-69.
KMC (2007). Street and footpath business management guidelines, Kathmandu: Kathmandu Metropolitan City.
Lewis, W.A. (1955). The theory of economic growth. London: Allen and Unwin.
MLD (1999). Local self-governance act, 2055. Kathmandu: Ministry of Local Development, HMG, Nepal.
Moser, C. N. (1978). Informal sector or petty commodity production: Dualism or independence in urban development. World Development, 6: 1041-1064.
MoUD/GoN (2017). National urban development strategy. Ministry of Urban Development, Government of Nepal, Kathmandu.
NPC (2002). Tenth national plan (2002-2007). Kathmandu: National Planning Commission, the Government of Nepal.
NPC (2007). Three years interim plan (2008-2010). Kathmandu: National Planning Commission, the Government of Nepal.
Pradhan, P. K. (2003). Population growth, migration and urbanisation, and environmental consequences in Kathmandu Valley, Nepal. In: Unruh J, Krol, M and Kliot, N (Eds.), Environmental Change and Its Implications for Population Migrations. The Netherlands: Kluwer Academic Publishers B.V. Dordrecht,.
Puspa Sharma, PhD/ Policy issues in informal market place ...Vol. 14: 113-130, 2021

129
Pradhan, S. M. (1988). Kathmandu: Metropolitan development and conservation issues. Regional Development Dialogue. 9(3): 203-221.
Pradhan, B., Sharma, P., & Pradhan, P. K. (2020). Urban growth and environment and health hazards in Kathmandu Valley, Nepal. In: Singh, R. B., Srinagesh, B. and Anand, S. (Ed.), Advances in Geographical and Environmental Sciences: Urban Health Risk and Resilience in Asian Cities. Springer Nature Singapore (e-book): 293–326, doi.org/10.1007/978-981-15-1205-6
Pradhan, P. K. (1987). Fresh vegetables marketing system in Kathmandu City. Tribhuvan University Journal, XIII (2): 69-76.
Pradhan, P. K. (2010). Living condition and livelihoods of the urban poor: Case from greater Kathmandu. Mountain areas and Globalization, (1-16). Switzerland: IGU/UGI July 4-10.
Rabenau, B.V., (1990). Issues in housing development. Kathmandu: Urban Development through local efforts.
Raut, U. B. (2008). Urban agriculture for sustainable urban development in Kathmandu (Unpublished masters’ thesis). Institute of Engineering, Tribhuvan University, Kathmandu.
Regmi, M. C. (1978). A study of Nepali economic history (1768-1846). New Delhi: Manjushree Publications.
Sanyal, B. (1988). The urban informal sector revisited: Some notes on the relevance of the concept in the 1980s. Third World Planning Review, 10(1): 65-83.
Sethuraman, S. V. (1976). The urban informal sector: Concept, measurement and policy. International Labour Review, 114(1): 69-81.
Sethuraman, S. V. (Ed.). (1981). The urban informal sector in developing countries: Employment, poverty and environment. Geneva: ILO.
Sharma, P. (2018). Urban informal sector: street trading and service activities in greater Kathmandu. PhD dissertation, Central Department of Geography/Faculty of Humanities and Social Sciences of Tribhuvan University, Kathmandu.
Sharma, P., & Pradhan, P. K. (2017). The petty street vendors and their livelihoods of the Kathmandu Valley cities, Nepal. In: Ainong Li, Wei Deng & Wei Zhao (Eds.), Land Cover Change and Its Eco-environmental Responses in Nepal. Springer Geography. DOI 10.1007/978-981-10-2890-8_1: 359-379.
Puspa Sharma, PhD/ Policy issues in informal market place ...Vol. 14: 113-130, 2021

130
Skeldon, R. (1985). Population pressure, mobility, and socio-economic change in mountainous environments: regions of refuge in comparative perspective. Mountain Research and Development, 5(3): 233-250.
Souza, P. R., & Tokman, V. E. (1976). The urban informal sector in Latin America. International Labour Review, 355-365.
Sthapit, D. (1999). Urban information sector in Kathmandu city: A case study of commercial vendors (Unpublished masters' dissertation). Kathmandu: Department of Architecture and Urban Planning, Institute of Engineering.
Puspa Sharma, PhD/ Policy issues in informal market place ...Vol. 14: 113-130, 2021

131
Impact of vegetable farming on farmers livelihood patterns in Dhankuta, Nepal
Kishor Bhandari1, and Basanta Paudel2*
1Jalapa Devi Campus, Tribhuvan University, Pakhribas, Dhankuta, Nepal.2Geo Planet Research Centre, Kathmandu 44619, Nepal.
*Corresponding author: [email protected]: 04 October, 2020; Accepted: 01 December, 2020; Published: March 2021
Abstract This paper deals with the livelihood pattern and the socio-economic condition of vegetable farmers of Chhathar Jorpati rural municipality, which lies in the eastern part of Dhankuta district of Nepal. The study applied household questionnaire survey, focus group discussion and field observation to collect information of vegetable farming and the impact of vegetable farming on farmers’ livelihood. The study conducted 45 households questionnaire survey in total using simple random sampling in ward number six of Chhathar Jorpati rural municipality. The statistical analysis of collected field survey data was preformed through correlation test and standard deviation. The result shows that the socio-economic condition and the livelihood of the vegetable farmers is improving in recent years. Before doing commercial vegetable farming, farmers cultivated potatoes and used to exchange their production with cereal crops to the neighboring villages. Farmers used to cultivate maize in their farmland, but due to the climatic and the topographic condition it took almost nine months (from January to October) for production. Among the total households, 24.4 percent farmers have seven members in their family and the average family size is 6.3. The Chhetri is the dominant ethnic group of the study area. Among educated groups, the majorities have completed secondary level of education. Most of the farmers are (35.5%) holding land size between 16 and 20 Ropani (0.82-0.10ha.). The majorities of the farmers cultivated high valued vegetables i. e., cauliflower, cabbage, tomato, pea, radish, carrot and green leafy vegetables. The average income from vegetable farming is NRs. 250000/household per year. Primarily, farmers use their income to manage foods, clothes, children education and daily-required goods. Further, due to the lack of sufficient human resources, improved seeds and fertilizer, the majorities of the farmers are facing challenges in
The Geographical Journal of NepalVol. 14: 131-150, 2021DOI: https://doi.org/10.3126/gjn.v14i0.35556Central Department of Geography, Tribhuvan University, Kathmandu, Nepal

132
their vegetable farming. In addition to this, the vegetable farmers are utilizing their capabilities and are devoted to enhance their livelihood through vegetable farming.
Keywords: Vegetable farming, livelihood, market, fertilizer, improved seed
IntroductionFarming is the activity or business of growing crops and raising livestock (Shaikh, 2017). Farming system is the organization of the farm and all the enterprises in relationship to each other; and it is widely differing resource based, enterprise patterns, household livelihoods and constraints (Giller, 2014). Farming is growing crops or keeping animals by people for food and raw materials. It is an integrated land based activity. Farming sector and its actors are much influenced by the spatial variation because of the need to stay contact with the market and other services (Bhatta, 2010). It is the complex arrangement of several components such as land, labor, livestock, market; and other resources that household mobilize for production in accordance with the household’s preference, capabilities and available technologies in the existing environmental (bio-physical and socio-cultural) setting (Shaner et al., 1981; Turner & Brush, 1987). Any methods of farming may be seen as an integral part of an agriculture system. Agriculture is the most comprehensive word used to denote the many ways in which crop plants and domestic animals sustain the global human population by providing food and other products (David et al., 2014). The process of producing food, feed, fiber; and other desired product by the cultivation of certain plants and the raising of domestic animals or livestock (Mckenzie, 2005). Agriculture ‘inputs’ include the seeds, water, pesticides, herbicides, fertilizer, and the livestock which are introduced to the ‘plant’: the building, machinery, and land; and the ‘output’ is the produce of the form (Ganesan et al., 2017).
From the beginning of human civilization, agriculture has become the main source of people's livelihood. However, the term livelihood can be used in many different ways. A livelihood in its simplest sense is a means of gaining a living. Livelihood patterns are changing rapidly in the world with respect to time and space. A livelihood comprises the capabilities, assets (including both material and social resources) and activities required for a means of living. A livelihood is sustainable when it can cope with and recover from stress and shocks and maintain or enhance its capabilities and assets both now and in the future, while not undermining the natural resource base (Carney 1998). Livelihood strategies include how people combine their income generating activities; the way in which they use their assets; which assets they chose to invest in; and how they manage to preserve existing assets and income (Chambers and Conway, 1991). By following different activities and strategies people want to spend their life in a sustainable way.
Kishor Bhandari, and Basanta Paudel/ Impact of vegetable farming ...Vol. 14: 131-150, 2021

133
The history and development of agriculture is intimately related to the development of human civilization. Agriculture is the main sector, which fulfils the demand of hunger of growing population (OECD/FAO 2019). Agriculture is an important source of income and the world’s largest business; one-third of the economically active population obtains its livelihood from agriculture (GA, 2019). Vegetable is the main source of minerals, vitamins and protein, which are the most important constituents of human diet. Vegetables supply essential micro-nutrient in human nutrition that acts as preventive agents to several ailments. Increased vegetable production may improve food security and offer employment opportunities to the populace, especially women who form a substantial proportion (Mlozi, 2003). In order to fulfill the demand of such nutrients commercial vegetable farming is increasing. Vegetables are considered very important crops both from the point of food and economic value in providing cheap source of nutrients and vitamins. At the same time, they are also considered as a high valued cash crops as they provide almost 5 to 10 times higher economic value (Gurung et al., 2016).
Agriculture is one of the major sectors of Nepalese economy (Paudel et al., 2019). There is 60.4 percent of the total population involved in this sector and contributes about 27 percent in the GDP (NPC, 2019). Agriculture in Nepal is labor intensive and farmers use their family labor in agricultural activities. Vegetable farming is a traditional custom in the Nepalese community, particularly for culinary purpose. Vegetable is the most important short seasonal and major components of Nepalese agricultural system. Because of the cash crop nature farmers pay their attention towards the commercial vegetable farming. Vegetable crop is an integral part of the farming system in Nepal and the sector has been growing rapidly in recent years (CASA, 2020). The area of vegetable farming has been continuously increasing since 1991/92 in Nepal and the production of vegetable is increasing at faster rate than increment in area (Pandey, et al. 2017). It is necessary to grow cash crops for income generation and better livelihood (Amatya, 1975). Till the mid-March of the fiscal year 2018/19, the food and livestock exports have declined by 9.9 percent and Rs.12.67 billion compared to the export during the fiscal year 2017/18; and this period, exports of oil and fat based on vegetable and animal product has been increased to Rs.5.8 billion (MOF, 2019). Now, there are different pocket areas declared by the government to get more benefit from vegetable farming in Nepal.
The farming system, production and productivity differ from place to place and season to season depending upon the terrain of the country ranging from the Tarai, the Hill and the Mountain. People of each and every pocket area have been taking different livelihood strategies. Being a rural area in Chhathar Jorpati rural municipality, the people have been adopting their own livelihood strategy by utilizing their capital assets and local resources of the area. Agricultural production is famous in this area and the
Kishor Bhandari, and Basanta Paudel/ Impact of vegetable farming ...Vol. 14: 131-150, 2021

134
large numbers of people are involved in agricultural activities particularly in commercial vegetable farming. Production of the vegetable from this area is being supplied to the international market like India and Bangladesh. Many researchers and scholars have paid their attention towards agriculture, livelihood strategy, and economic condition of other area but there are limited researches in Chhathar Jorpati rural municipality from the perspective of livelihood. In this context the present research seeks to understand the livelihood patterns of vegetable farmers of the hill area particularly to evaluate the strength of the farmers involved in agricultural practices. Therefore, this study evaluates the scenario of changing farming system of the study area. It will be an important guideline for the policy makers and fruitful for the planners to formulate future plans to promote people's livelihood and livelihood strategies in the rural areas.
Methods and materialsThe study area
Chhathar Jorpati rural municipality is well-known as the area of commercial vegetable farming and milk production in Dhankuta district. On the basis of some major characteristics, this area has been selected as the study site. First, it is the highly occupied with the commercial vegetable farmers. Second, the vegetable farmers have been improving their livelihood due to the intensive commercial vegetable farming. This study site lies in the eastern part of the district. This rural municipality is ranging from 296 meter to 2645 meter above mean sea level. The total area of Chhathar Jorpati rural municipality is 103.5 square kilometer (Khanal et al., 2018). The total households are 4232 and the total population of the rural municipality is 18322 where male population is 8346; and female is 9976 as of census report of Nepal 2011 (CBS, 2011). There are total six wards in this rural municipality and ward number six was selected for the study area. The given figure 1 shows the location, altitudinal variation and the land use patterns of the study area.
Kishor Bhandari, and Basanta Paudel/ Impact of vegetable farming ...Vol. 14: 131-150, 2021

135
Figure 1: Location of the study area
Sources of dataThis study is based on both qualitative and quantitative data. The primary data were collected from the field survey through questionnaires, focus group discussion and observation. Before conducting the field, a reconnaissance survey was conducted to get information about the areas as well as vegetable farmers. The questionnaire survey was used to generate data of the detail information about the livelihood aspect of the vegetable farmers, i. e. socio-economic condition of the farmers, income and expenditure. Further, two focus group discussion have been conducted with local farmers to get details information about vegetable farming in the study site. The secondary data were gathered from the 15th periodic plan, National Planning Commission and various publications of Central Bureau of Statistics. Land use land cover data of the study area have been adapted from Uddin et al (2015).
Kishor Bhandari, and Basanta Paudel/ Impact of vegetable farming ...Vol. 14: 131-150, 2021

136
Data analysis and toolsAfter completing the field survey, the task of data processing was done. All the completed questionnaires were transformed to the data code sheet. The tabulated data were processed and analyzed based on its results. The location map of the study area was generated using ArcGIS 10.5 (Environmental Systems Research Institute, Redlands, CA, USA). Correlation analysis was done between the education level of the respondents and the income level of the households by using the equation 1.
rn xy x y
n x x n y y=
( ) − ( )( )− ( )
− ( )
Σ Σ Σ
Σ Σ Σ Σ2 2 2 2 (1)
where, r is the correlation coefficient between education level of the male respondents and the female respondents; x indicates the education level of the male respondents and y indicates the education level of the female respondents. Simple mean was also calculated in order to find out the average family size of the study area. Likewise, standard deviation was calculated to analyze land holding pattern by using the equation 2.
σ=√∑fx2/N (2)
where, σ is standard deviation, f is the number of the households in different categories (frequency), x2 is the squire of difference between the land holding status and the mean value of the land holding size; and N is the total number of households of the study area.
Results and discussionSocial condition of the vegetable farmers
Major social condition in this section includes age and sex composition; family size and household population, caste/ethnic status; and level of education of the study. The concept of social status or social condition has two primary usages. One is a person's position in the pattern of social relations among members of the social system. The next one is a person's status evaluative ordering of members in regard to honor or prestige (Fararo, 2007). Therefore, the social status is in all socio-economic studies are very important.
Kishor Bhandari, and Basanta Paudel/ Impact of vegetable farming ...Vol. 14: 131-150, 2021

137
Age and sex composition of the vegetable farmer households
The age group of the family members' shows the likelihood of the age group in the productive age as well as non-productive age group in the family. The total population of the 45 households is 283. Where the male population is 46.6 percent and the female is 53.4 percent. The sex ratio is 87.42 in the study area; and the sex ratio of Nepal in 2011 is 94.2 (CBS, 2011). According to the national data, the sex ratio of Dhankuta district in 2011 is 88.1 which is quite similar to the study area. The highest number of population in terms of age group is 71 within 21-30 years age group whereas the age group of 51–60 years is found to be the lowest number (Table 1). Active population of the study area is less than the overall country data according to the census data 2011. The old population above 60 years is 10.9 percent in the study area which is higher than the overall country data (8.14%).
Table 1: Age and sex composition of family members of vegetable farmer households
Age Group Male Percentage Female Percentage Total Percentage<10 Years 30 10.6 40 14.2 70. 24.8
11 – 20 27 9.5 26 9.2 53 18.721 – 30 33 11.7 38 13.4 71 25.131 – 40 14 4.9 15 5.3 29 10.241 – 50 9 3.2 12 4.2 21 7.451 – 60 5 1.8 3 1.1 8 2.961 – 70 8 2.8 7 2.5 15 5.3
>70 6 2.1 10 3.5 16 5.6Total 132 46.6 151 53.4 283 100
Source: Field Survey, 2019.
Family size and the household population
The family size is an important in respect to the person available for field-work and participation in vegetable farming because vegetable farming is labor intensive work. The study carried in Kirtipur area of Kathmandu by Rai (2017) found that the participation of women in vegetable production is essential. This work allows women to be self-sufficient, independent, increases their capabilities and improves their social status in their families and communities. Women's role is important for the different activities of vegetable farming; planting, weeding, collecting and selling. In this study of Chhathar Jorpati among the total 45 sampled households, majority of the families have 7 members. There is a family where 12 members live together; which is the largest size family of this area. There are 9 households having the family size of 4 members.
Kishor Bhandari, and Basanta Paudel/ Impact of vegetable farming ...Vol. 14: 131-150, 2021

138
There are 3 to 12 members in the families (Table 2). More than 50 percent households have less than 6 members. The average family size of the study area is 6.3.
Table 2: Family size of vegetable farmers household
No. of Family Member No. of Households Percentage3 3 6.74 9 20.05 8 17.96 6 13.37 11 24.48 2 4.49 1 2.210 3 6.711 1 2.212 1 2.2
Total 45 100Source: Field Survey, 2019.
Caste/Ethnic composition of the vegetable farmers
Ethnicity is a social component of population. It reflects socio-cultural characteristics of the population. According to the census report of 2011, there are 125 ethnic groups found in Nepal. The Chhathar Jorpati rural municipality is not diverse in terms of ethnicity. There are only six castes found in the study area. Chhetri dominated this area; where among 45 households 33 are Chhetries. Among 33 Chhetri households Thapa, Bista and Basnet households are found 18, 12 and 3, respectively. According to the census data of 2011 the population of Chhetries is 16.6 percent, which is the highest percent among all ethnic groups. There are 4 and 3 households of Newar and Limbu respectively. In the study of livelihood strategy of Rai community in two different location representing different altitudinal zone in Arun Valley, namely Sitalpati and Makalu, Subedi and Pandey (2002) revealed that land utilization pattern was changed from Bari (non-irrigated land) towards Khet (irrigated land) in lower elevated area and changed from Khoria (slash and burn) to Bari (non-irrigated land) in higher elevated area. This study illustrated that how people's response to environmental and economic pressure can differ in two different environments. Although the caste and ethnicity background is different the finding of both studies is similar in terms of land resource utilization.
Kishor Bhandari, and Basanta Paudel/ Impact of vegetable farming ...Vol. 14: 131-150, 2021

139
Level of education of the respondents
Education plays a vital role in the socio-economic development of the society. Educated persons can easily take any decision quicker and better than uneducated persons. In the study out of 45 respondents, 29 respondents feel education is important for the better knowledge of vegetable cultivation. The positive aspect of education is that the farmers give their introduction as a farmer without any hesitation. Educated farmers respect their work. There are 18 male and 27 female respondents in the study. In the comparison of male and female respondents, the level of education of the male is better than the female. The literate and illiterate percentage of the respondents in both sex groups is 77.8 and 22.2, respectively (Table 3). Among the educated groups, larger numbers (29%) completed secondary level of education. Only 7.76 percent of the people passed secondary level in the overall country (CBS, 2011). The average literacy rate of the study area is more than the national data. Among the 45 respondent farmers only one male has passed bachelor level. According to the calculation of correlation between the male education and the female education level, there is a positive correlation between these two variables. The result of the correlation between these two variables is 0.044.
Table 3: Level of education of household heads
Educational StatusMale Female TotalNo. Percentage No. Percentage No. Percentage
Illiterate 0 0.0 10 37.1 10 22.2Literate 6 33.34 4 14.8 10 22.2Primary 3 16.63 4 14.8 7 15.6Secondary 6 33.34 7 25.9 13 29Higher Secondary 2 11.12 2 7.4 4 8.8Bachelor 1 5.57 0 0.0 1 2.2Total 18 100 27 100 45 100
Source: Field Survey, 2019.
Economic condition and the livelihood patterns of the vegetable farmers
‘Struggle for existence’ as envisaged by Darwin is still regarded as the central concept of livelihood strategy. Anyone, who cannot adjust himself/herself in a changing environment, cannot survive in this Earth. Being a social creature, human should perform group activities to do struggle with the natural change as well as with different natural calamities. Because of the introduction of modern technology, human has brought tremendous change in the use of natural resources. But in the context of the farmers of Chhathar Jorpati, they have been using their local resources in traditional way for their livelihood.
Kishor Bhandari, and Basanta Paudel/ Impact of vegetable farming ...Vol. 14: 131-150, 2021

140
The people of this area are changing their way of life due to the development of road and electricity facilities. Almost all households have given the top priority in vegetable farming. Vegetables like cabbage, cauliflower, radish, bean and pea, chilly and green leafy vegetable are grown in this area. Cereal crop production gets second priority. Some farmers grow cereal crop for subsistence needs only. It was found that after the construction of road and the supply of electricity facility have drastically changed in the livestock keeping, services, business and industry etc. Different types of cooperative institutions such as saving and credit, milk collection, consumer etc. are supporting commercial agriculture in the study area. As a result, the livelihood patterns of the farmers in different parts have been changed from subsistence farming to commercial vegetable farming (Rai et al., 2019a in Kathmandu; Chapagain, 2006 in Ilam).
There was different conclusion in the study of livelihood strategies of people living in Karnali region. Karnali, being located in the northern Himalayan region and having rugged terrain, low productivity and no accessibility in terms of road connectivity bears very hard circumstance for the people to seek their livelihood (Bishop, 1990). Livestock ranching is the most important activity characterized by seasonal movement to higher elevation areas in summer to lower areas in winter. Due to lower temperature in long winter season, agricultural activities require long growing season. Lack of diversification of livelihood activities in the area is very common. Therefore, the researcher advocates for the need of more activities to strengthen the livelihoods of the people that enables them to improve their livelihood security. The situation of Chhathar Jorpati rural municipality is different because of road access and good educational status. Therefore, they are able to adopt vegetable based livelihood strategy.
Mountain environment is changing perceptibly in their natural and economic setting. Bringing example from southern Arun Valley, Koirala (2006) has undertaken spatio- temporal analysis of resource utilization since 1984 to 2004. According to the study, the major livelihood strategies included agro based activities characterized by several distinct types such as cereal crop farming, horticulture, cash crop farming. Better connectivity of the road changed traditional food crop production to horticulture and cash crops; and has helped to improve household income. The result of the study done by Koirala and the situation of the vegetable farmers of Chhathar Jorpati is both similar.
Land holding pattern of the vegetable farmer
Land holding is also the major component for the vegetable production. Production depends upon the size and the types of available land. The agrarian structures in Nepal are characterized by a very small land holding scattered to different plots. As an agrarian
Kishor Bhandari, and Basanta Paudel/ Impact of vegetable farming ...Vol. 14: 131-150, 2021

141
economic country such as Nepal, land ownership is the most important source of food security and household income as land being the important economic assets in the rural area (Gauchan, 2008). There is no problem of land for vegetable farming in this rural area. Among 45 households, 35.5% possesses 16 – 20 Ropani of land. Likewise, five households have more than 30 Ropani land but they do not utilize all land to grow vegetable. Thus, only three households have less than 5 Ropani land. According to the data of CBS 2011, small landholders and marginal farmers predominate in Nepalese agriculture with the average holding size of 0.8 hector. Nearly half of all farms have less than 0.5 hectare (less than ten Ropani) of land. In the study area, only 15.6 percent of the farmers have less than 10 Ropani land (Table 4). Likewise, land tenure system also plays a vital role in agriculture production; dual land tenure has been hampering for agriculture development. With the comparison of the national data the situation of land holding pattern of the vegetable farmers is better. The standard deviation of land holding pattern data is 7.95. It shows that there is no vast difference among farmers in terms of land holding pattern.
Table 4: Land holding pattern
Land (In Ropani) No. of Households PercentageBelow 5 3 6.7
6-10 4 8.911-15 10 22.216-20 16 35.521-25 4 8.926-30 3 6.7
Above 30 5 11.1Total 45 100
Source: Field Survey, 2019.
Annual Income from vegetable farming occupation
All vegetable farmers do not have equal access to land, labor, capital and other opportunities. As a result the socio-economic status is not the same. In 2015, vegetable worth of NRs. 370 million was sold from Sidhuwa Agriculture Store, Chhathar Jorpati Rural Municipality, Dhankuta (Gahatraj, et al., 2019). According to his study, out of the sold vegetables cabbage had the largest shares of 2500 tons. The study found that within Chhathar Jorpati Rural Municipality, majority of (16 vegetable farmers) households are earning NRs. 100000 –200000 in a year.
Kishor Bhandari, and Basanta Paudel/ Impact of vegetable farming ...Vol. 14: 131-150, 2021

142
Figure 2: Annual income from vegetable farming occupation.
The yearly average income of vegetable farmers is NRs. 247000. Most households earn between Rs.100000-300000 annually. Only 5 households earn less than Rs.100000 annually (Figure 2). The study on vegetable farming and farmers’ livelihood in Kathmandu Valley by Rai et al. (2019a) also found minimum earning of a vegetable farmer ranging from NRs.50,000 to NRs.500,000 which is similar to the annual income of vegetable farmers of Chhathar Jorpati municipality as well.
A study on the garden pea production and financial profitability of Chhathar Jorpati rural municipality and Mahalaxmi municipality was done by Gahatraj and Uprety, (2019). In the study, they found that the garden pea production is the most important source of income of the farmers of the study area. In another study on the same area, the finding was that the vegetable had a significant contribution in the total income of the farmers; while cabbage was a major contributor (Gahatraj et al., 2019). These studies also prove that the vegetable farming is the profitable occupation in Chhathar Jorpati area.
Utilization of vegetable income
Primarily, farmers are utilizing their income in food, clothes, children education and daily required goods. These are common sectors of expenditure. As their earning increased, they utilize it in other sectors, such as in purchasing cultivated land, improving the housing conditions, building toilet and in other luxury things. The survey revealed that food, clothing, and the daily use; and education activities are the common areas of expenditure of all vegetable farmers. All vegetable farmers are conscious to their
Kishor Bhandari, and Basanta Paudel/ Impact of vegetable farming ...Vol. 14: 131-150, 2021

143
children’s education and they realize that education is an integral part of the social life. Of the total 45 households 82.2 percent utilized their income in additional social functions, improvement of the housing condition, health and sanitation. Here, social function means economic participation in social activities such as temple construction, rural road construction, donation to the school etc. Health and sanitation include checking up at the time of illness, spending money to buy medicine, to make toilet etc. Of the total 44.4 percent farmers utilize the income in land purchase for cultivation; 33 percent farmers use this income to both livestock purchase and bank balance; and 11 percent farmers invest to purchase land in urban area (Table 5).
Table 5: Utilization of vegetable income
Area of Expenditure No. of Household PercentageFood and daily use goods 45 100Land purchase for cultivation 20 44.4House construction / improvement 37 82.2Health and sanitation 37 82.2Children education 45 100Land purchase in urban area 5 11.1Bank balance 15 33.3Livestock purchase 15 33.3Social function 20 44.4
Source: Field Survey, 2019.
Impact of the commercial agriculture farmingPositive impact
Vegetable is considered to be a very important crop both from the point of food and economic value in providing cheap source of nutrients and vitamins. Demand of quality vegetable is going to increase so the attraction of farmers goes towards the vegetable farming. Before doing commercial vegetable farming, people of Chhathar Jorpati rural municipality produced potatoes and they used to exchange their production with cereal crop to the neighboring villages. They used to give double units of potatoes for a single unit of paddy. They used to grow maize in their land but it took about nine months (from January to September) to prepare. On the other hand, the productivity was very low. A project lunched through Sindhuwa Multipurpose Cooperative Limited inspired to do commercial vegetable farming in 2051 B.S. There were different programs in the project i.e. small group making program, vitamin A program, seed distribution & awareness program etc. The project was launched with the joint association of Pakhribas
Kishor Bhandari, and Basanta Paudel/ Impact of vegetable farming ...Vol. 14: 131-150, 2021

144
Agriculture Centre. People were being shifted towards commercial vegetable farming gradually. Now, this area produces about 20 trucks vegetable per day. One to two truck vegetable is being consumed in Nepal and the rest of vegetable is being supplied to India and Bangladesh. The vegetable farmers of Chhathar Jorpati area have changed meadow and pasture land into agriculture land and they are farming vegetable which is as similar as the findings of Shrestha (1975) on land use change.
Because of increasing income rate of the farmers, they are now able to get quality health and education facility. The great achievement is that the farmers are succeeding to break up the traditional culture to see farming as a low level occupation in the society. The farmers do not hesitate to give their identity proudly as farmer. They are now becoming united in different cooperatives. So they have developed the concept of institutional development. According to the three interlink concepts for sustainable livelihood namely capability, equity and sustainability, the vegetable farmers are able to build up their capability by farming experience and different training. Likewise there is not any restriction of doing vegetable farming, so they have equal access to the resources as a result they are able to sustain their lives.
In the study of Kaski and Kapilvastu districts on the basis of commercial vegetable farming for poverty reduction in Nepa1, Gurung et al. (2016) concluded that there has been a significant improvement in the production of vegetables after ten years in both the studied area. The result clearly shows that there was a continuous production and supply of vegetables from the farms and which indicates that farmers are shifting towards commercialization. Commercial vegetable farming is fruitful for poverty reduction in the study area. The situation of the vegetable farmers of Chhathar Jorpati rural area is not an exception to it.
Negative impact
Human empowerment is an important aspect of livelihood. Education plays a vital role to be empowered. In Chhathar Jorpati rural area, farmers start their occupation before they complete education. Therefore, the educational status is low. Because of the low level of educational status, the rural area may be lagging behind in the human development index. All farmers are not conscious to the protection of their environment. As a result, environment will be polluted in future. Because of the busy life, it is very difficult for them to give time for social work as well.
Kishor Bhandari, and Basanta Paudel/ Impact of vegetable farming ...Vol. 14: 131-150, 2021

145
Problems associated with the commercial vegetable farmingDefinitely, every occupation has some sorts of problems. Different types of diseases and shortage of marketing are common and major problems of vegetable farming. Most of the commercial vegetable growing areas of Chhathar Jorpati rural municipality have been already infested by Clubroot Pathogen (Plasmodiophora brassicae). Productivity has been drastically reduced for few years after field got infested with Pathogen (Gahatraj et al., 2019). Karkee et al. (2016) found that Clubroot Pathogen has been emerged as one of the most harmful diseases of cabbage and cauliflower in Dhankuta and Terathum. In the study of the commercial vegetable farming in Kirtipur, Rai et al. (2019b) observed that frequent price fluctuation of market price was the first major problem, and high margin of profit taken by middlemen was another crucial constraint in commercial vegetable farming. The disease in vegetable is also notable. The study of Ellis (1999) on poverty, land care and sustainable livelihoods in hillside and mountain region concluded that the area are particularly vulnerable for livelihood due to their inaccessibility, fragility, marginality and land degradation. In an comparative study of of farm in Kavrepalanchok, Sindhupalchok and Kaski districts, Pokhrel (2010) found diseases and pests severities, fluctuating prices, deteriorating soil environment, lack of year-round irrigation and poor quality of seed and fertilizer materials as well as the poor marketing facilities to hinder vegetable farmers from optimum benefits. The problems in Chhathar Jorpati area are not an exception from the problems of the farmers of other areas of Nepal (Table 6).
Table 6: Problems of the commercial vegetable farming
General Problems Specific problemsMarket related problems
Uncertainty of market. Market depending upon the middlemen and determination of
the market price by them. Frequent fluctuation of vegetable price. Lack of concern in market from the local government.
Seed and fertilizer related problems
Lack of proper knowledge to produce seed of all kinds of vegetable.
Lack of distribution of adequate seeds by the concern agencies. Unavailability of improved qualitative seed. Unavailability of qualitative fertilizer in local market.
Labor related problems
Difficulty to find sufficient and skilful labour in local area.
Productivity diminishing
Imbalance use of chemical fertilizer productivity decrease. Productivity decrement by top soil erosion, gully erosion etc. Lack of sufficient extra land for rotation farming for some
farmers.
Kishor Bhandari, and Basanta Paudel/ Impact of vegetable farming ...Vol. 14: 131-150, 2021

146
Expectation of the commercial vegetable farmers
Commercial agriculture is a major characteristic of Chhathar Jorpati rural municipality as such there is necessary to promote and motivate the farmer for their contribution. Nevertheless, agriculture friendly economic policy and effective implementation is required from government sector to promote it. Sustainable economic growth can be achieved through agriculture development avoiding deforestation, and land degradation. Therefore, the government should make the policy of local governance effectively both in terms of strategy and implementation aspects (Chaudhary, 2018). It would be better if the government would undertake responsibility to marketing of the product. It is necessary to develop agro tourism to the area so that they could get double benefit. The farmers want to get new innovation training about how to do more profitable farming and how to use new technology in this field.
ConclusionFarming in Nepal is labor intensive and it is mainly based on family labor. From the beginning of human civilization, agriculture has been the main source of people’s livelihood. Vegetable farming is a traditional custom in the Nepalese community, particularly for culinary purpose. Being an economic activity, it is closely related to the livelihood, employment and semi-employment. The present work has attempted to explore and analyze the socio-economic condition of vegetable farmers of Chhathar Jorpati rural municipality area and impacts of vegetable farming on their livelihood. The majority of farmers cultivate high valued vegetables such as cauliflower, cabbage, tomato, pea, radish, carrot and green leafy vegetables. Better utilization of available resources in the area, establishment of cooperatives to support it and good transportation facility help in flourishing the vegetable farming. However, awareness program is urgently necessary to control improper use and handling of chemical fertilizer and pesticides for the enhancement of vegetable farming and fertility of the soil in the area.
AcknowledgementsWe are thankful to all the field enumerators for their help during field survey. Special thank goes to all the farmers who provided their valuable time to share local knowledge on this study. We extend our sincere gratitude to the editors and anonymous reviewers for their valuable comments on our paper.
Kishor Bhandari, and Basanta Paudel/ Impact of vegetable farming ...Vol. 14: 131-150, 2021

147
ReferencesAmatya, S. L. (1975). Cash crop farming in Nepal. Kathmandu: Ratna Pustak Bhandar.
Bishop, B. C. (1990). Karnali under stress: Livelihood strategies and seasonal rhythms in a changing Nepal Himalaya. Illinois: University of Chicago.
Bhatta, G. D., & Doppler, W. (2010). Socio-economic and environmental aspect of farming practice in the peri-urban hinter land of Nepal. The Journal of Agriculture and Environment l (11): 26-39.
Carney, D. (1998). Sustainable rural livelihoods: What contributions can we make? London: DFID.
CASA, (2020). Vegetable sector strategy – Nepal. Commercial Agriculture for Smallholders and Agribusiness. Kathmandu: CASA Nepal Country Team, Nepal
CBS, (2011). National population and housing census 2011. Kathmandu: National Planning Commission Secretariat, Government of Nepal.
Chambers, R. and Conway, G. (1991). Sustainable rural livelihoods: Practical concepts for the 21st century. IDS Discussion Paper 296. University of Sussex: Institute for Development Studies.
Chapagain, P. S. (2006). Involution or evolution? Conceptualizing the changes in farming system of eastern Nepal. The Himalayan Review. xxxvii: 1-17.
Chaudhary, D. (2018). Agricultural policies and rural development in Nepal: An overview. Research Nepal Journal of Development Studies, 1(2): 34-46. https://dx.doi.org/10.3126/rnjds.v1i2.22425
David R. H. and Dorian Q. F. (2014). Agriculture: Definition and overview, University College London State of Knowledge and Current Debates.https://www.researchgate.net/publication/301345493
Ellis, J. (1999). Poverty, land care and sustainable livelihood in Hillside and Mountain regions. Mountain Research and Development, 19(3): 179-190.
Fararo, T. J. (2007). Encyclopedia of law & society: American and global perspectives social status. Sage Publications Thousand Oaks. http://dx.doi.org/10.4135/9781412952637.n637
Kishor Bhandari, and Basanta Paudel/ Impact of vegetable farming ...Vol. 14: 131-150, 2021

148
GA. (2019). Industrial agriculture and small-scale farming. Global Agriculture: Foundation on Future Farming. Marienstr. 19-20 D-10117 Berlin, German.
Gahatraj, S. Rai, H. H., & Uprety, R. (2019). Assessment of contribution of cabbage in rural livelihood and constraints of production in Dhankuta, Nepal. International Journal of Agriculture, Environment and Food Science, 3(3): 150-154.https://dx.doi.org/10.31015/jaefs.2019.3.6
Gahatraj, S. and Uprety, R. (2019). Financial profitability and resource productivity analysis of garden pea (Pisum Sativum L.) production in Dhankuta, Nepal. SAARC J. Agric., 17 (2): 165-172. https://doi.org/10.3329/sja.v17i2.45303
Ganesan, L. and Karuppaiyan, K. P. (2017). Utilization of agriculture input and it’s outcome in Indian agriculture. Shanlax International Journal of Economics, 5(4): 65-79.
Gauchan, D. (2008). Agricultural development in Nepal: Contribution to economic growth, food security and poverty reduction. Socio Economic Development Panorama, 1 (3): 49-64
Giller, K. (2014). Guest editorial can we define the term ‘farming systems’? A question of scale. Outlook on agriculture, 42(3): 149-153.https://dx.doi.org10.5367/oa.2013.0139
Gurung, B., Thapa R. B., Gautam, D. M., Karki, K. B., &Regmi, P.P.(2016). Commercial vegetable farming: an approach for poverty reduction in Nepal. Agronomy Journal of Nepal, 4: 92-106.
Karkee, A., Timila, R. D., Paudel, K. & Mandal, D. L. (2016). Current status and management practice of clubroot (Plasmodiophorabrassicae) Disease in Eastern Hills of Nepal. Journal of Environment Science, 2: 121-129. https://www.researchgate.net/publication/329640980
Khanal, S., Acharya, A. K. & Kharal, D. K. (2018). Province – 1, Dhankuta Chhathar Jorpati Rural Municipality. https://www.researchgate.net/publication/325542516
Koirala, H. L. (2006). Livelihood pattern, adaptive strategy and sustainability of communities in southern Arun valley of Nepal. Unpublished Ph.D. Thesis: Gauhati University.
Kishor Bhandari, and Basanta Paudel/ Impact of vegetable farming ...Vol. 14: 131-150, 2021

149
Mckenzie, S. (2005). A brief history of agriculture and food production: The rise of industrial agriculture: Johns Hopkins Bloomberg: School of Public Health.
Mlozi, M.R.S. (2003). Urban Agriculture: Vegetable production in Metropolitan Greater Vancouver District in Lanans Sokoine University of Agriculture Morogoro, Tanzania.
MOF. (2019). Economic survey 2018/19. Kathmandu: Government of Nepal, Ministry of Finance.
NPC. (2019). Fifteenth plan 2076/77-2080/81. Kathmandu: National Planning Commission, Nepal.
OECD/FAO. (2019). Agricultural outlook 2019-2028, OECD Publishing, Paris/Food and Agriculture Organization of the United Nations, Rome. https://doi.org/10.1787/agr_outlook-2019-en
Pandey, G., Basnet, S., Pant, B., Bhattarai, K., Gyawali, B., & Tiwari, A. (2017). An analysis of vegetables and fruits production scenario in Nepal. Asian Research Journal of Agriculture 6(3): 1-10. https://doi.org/10.9734/ARJA/2017/36442
Paudel, B., Zhang, Y., Yan, J., Rai, R., & Li, L. (2019). Farmers' perceptions of agricultural land use changes in Nepal and their major drivers. Journal of Environmental Management, 235: 432- 441. https://doi.org/10.1016/j.jenvman.2019.01.091
Pokhrel, D. M. (2010). Comparison of farm production and marketing cost and benefit among selected vegetable pockets in Nepal. The Journal of Agriculture and Environment, 11: 10–25
Rai, D. B. (2017). Vegetable gardening and marketing in Kirtipur area of Kathmandu. Nepalese Journal of Development and Rural Studies, 14 (1&2):28-35. DOI: 10.3126/njdrs.v14i1-2.19645
Rai, M. K., Paudel, B., Zhang, Y., Khanal, N. R., Nepal, P., & Koirala, H. L. (2019a). Vegetable farming and farmers’ livelihood: Insights from Kathmandu Valley, Nepal. Sustainability, 11(3): 889. https://doi.org/10.3390/su11030889
Rai, M. K., Nepal, P., Rai, D. B., & Paudel B (2019b). Commercial vegetable farming: Constraints and opportunities of farmers in Kirtipur, Nepal. The Geographical Journal of Nepal, 12: 101-118.http://dx.doi.org/10.3126/gjn.v12i1.23418
Kishor Bhandari, and Basanta Paudel/ Impact of vegetable farming ...Vol. 14: 131-150, 2021

150
Shaner, W.W., Philipp, P.F., and Schmell, W.R. (1981). Farming system research and development : Guideline for developing countries. Colorado, Baulder: West view press.
Shaikh, M. R. (2017). Farming system. Doctoral Seminar: Gauhati University. https://www.researchgate.net/publication/340429050
Shrestha, S.H. (1975). A review of land use pattern in Nepal. The Himalayan Review, 7. Nepal Geographical Society, Kathmandu, Nepal.
Subedi, B. P. and Pandey, R. (2002). Livelihood strategies of Rai community in Arun valley: Continuity and change. In Vegetation and Society: Their Interaction in the Himalayas.Tribhuvan University, Nepal and University of Bergen, Norway.
Turner, B.L., and Brush, S. B. (1978). Comparative farming system. New York: The Gulford Press.
Uddin, K., Shrestha, H. L., Murthy, M. S. R., Barjracharya, B., Shrestha, B., Gilani, H., Pradhan, S. & Dangol, B., (2015). Development of 2010 national land cover database for Nepal. J. Environ. Manang. 148: 82-90. https://doi.org/10.1016/j.jenvman.2014.07.047.
Kishor Bhandari, and Basanta Paudel/ Impact of vegetable farming ...Vol. 14: 131-150, 2021

151
Assessment of climate change vulnerability in Chiti area of Lamjung district, Nepal
Sher Bahadur GurungCentral Department of Geography, Tribhuvan University
Corresponding Email: [email protected]: 24 October, 2020; Accepted: 05 November, 2020; Published: March 2021
AbstractClimate change issue is the global concern of the present day. The present study attempts to assess the vulnerability of the community due to climate change for which Chiti area of Besisahar Municipality from Lamjung district of Nepal was selected as the study area. The climate change vulnerability was assessed using the Long Term Research Program (LTRP). The long term climate change vulnerability household surveys from 2013 baseline data to 2016, 2017 and 2019 data were analysed in this study. This study adapted IPCC (2001) methodology i.e. also used by C4 EcoSolutions on their baseline climate change vulnerability assessment. This is a bottom-up, integrative approach that considers both physical and social dimensions at a local level. Consequently, vulnerability is best understood as a function of three components: exposure, sensitivity and adaptive capacity. Exposure to climate change vulnerability is calculated with sum of changes in temperature, changes in rainfall patterns, changes in rainfall intensity, drought episodes and flooding events. Sensitivity is calculated based on slope failures, soil fertility, changes in natural environment (i) soil cover; ii) levels of river sedimentation; iii) water salinity; iv) river ecosystems; v) forest size; and vi) the presence of invasive species), economic dependency level, irrigation facilities and livelihood sources. The major finding is that Chiti has been facing climate change since last decade and it is found severely vulnerable due to climate change. There is an urgent need of improvement on climate change adaptive capacity which could result of awareness, information on climate change and adaptation, surplus production and change in agricultural practices. The present study has used awareness score based on conceptual awareness, experiential awareness, and engagement of household to talk about climate change and adaptation. The Long Term Research Approach is appropriate to assess climate change vulnerability in community level. Climate change awareness is
The Geographical Journal of NepalVol. 14: 151-170, 2021DOI: https://doi.org/10.3126/gjn.v14i0.35557Central Department of Geography, Tribhuvan University, Kathmandu, Nepal

152
one of the major components to reduce vulnerability to climate change in the research area. This is a post adaptation vulnerability analysis of local community which supports climate change vulnerability adaptation policy.
Keywords: Chiti, climate change vulnerability, exposure, sensitivity and adaptation
IntroductionClimate change refers to a change of climate that is attributed directly or indirectly due to human activities and vulnerability is the degree to which a system is susceptible to, or unable to cope with, adverse effects of climate change, including climate variability and extremes (IPCC, 2001). According to IPCC report 2018, the organization's strategic concern on limiting global warming to 1.50C compared with projected 20C based on the world temperatures have increased by 1°C over the last century. Consequently, extreme occurrences have been increased in Asian region, including floods, droughts, forest fires, and tropical cyclones, as a result decreasing in agricultural productivity, runoff and water availability may decrease, human health would be threatened, sea-level rises, increased intensity of rainfall would increase flood risks, climate change would increase energy demand, decrease tourism attraction, and influence transportation in some regions of Asia, climate change would exacerbate threats to biodiversity due to land-use and land-cover change and population pressure in this region (Hijooka, Lin, Pereira, Corlett, Cui, Insarov, Lasco, Lindgren and Surjan, 2014).
However, in the case of Nepal since 1971 to 2014, the annual maximum and minimum temperature increased 0.0560C, 0.0020C respectively and the mean annual rainfall decreased 1.333 mm per annum (DHM, 2017). There is increasing trend of climate change magnitude with altitude in western Himalaya and that is linked with bio-diversity, ecosystem functioning, ecosystem services, drivers of change and human well-being. This region is vulnerable to climate change due to ecological fragility, economic marginality, habitat loss and fragmentation, colonization of invasive species, over exploitation of resources, pollution, nutrient loading and global climate change (Tsering, Sharma, Chettri and Shrestha, 2010). Similarly, the social-ecosystem of low, middle and high mountain of Kaligandaki valley of Nepal Himalaya experienced significant levels of exposure to climate change and are sensitive to change and extreme weather events, but limited capacities to adapt across all spatial scales results in very high social-ecological vulnerability (Pandey & Bardsley, 2015). In the case of Lamjung district, climate change has differential impact which varies according to location of communities, occupation, general household head, the overall vulnerability largely varies according to well being-status of households (Gentle, Thwaites, Race and Alexender, 2014).
Sher Bahadur Gurung/ Assessment of climate change vulnerability ...Vol. 14: 151-170, 2021
153
Over the entire Himalaya region of Nepal, it is expected that agriculture and food security, climate-induced disasters, forest and biodiversity, caste/ethnic group, livelihoods and governance public health, tourism, natural and cultural heritage, urban settlements and infrastructure and water resources etc. are vulnerable to climate change (MoPE, 2017). Therefore, the climate change vulnerability assessment is essential to cope with climate change impacts. Most of the Himalayan region studies were focused on pre-adaptation vulnerability and national to global scale. There is lacking post adaptation vulnerability and local to global scale climate change vulnerability analysis. In these context, the present study attempts to assess the vulnerability of the community to climate change selecting Chiti area of Lamjung district of Nepal which is also site for the Ecosystem-based Adaptation through South-South Cooperation (EbA South) under the title "Enhancing Capacity, Knowledge and Technology Support to Build Climate Resilience of Vulnerable Developing Countries".
Methods and materialsConceptual consideration
Vulnerability is the function of exposure, sensitivity and adaptive capacity to climate change (IPCC, 2001). The present study used long term research program (LTRP) approach and adapted IPCC methodology to analyse climate change vulnerability assessment. This methodology was also adopted by C4 EcoSolutions on their baseline assessment for EBA South project which is bottom-up and integrative approach that considers both physical and social dimensions at a local level. The present research has adopted post vulnerability assessment approach. Altogether, 27 households are selected as respondent who are directly benefited by EbA south project intervention. Almost 27 percent of the respondents were women and 17.2 percent was from highly marginalized Dalit and Chepang community. Two field surveyors were deputed for interview and before survey permission from local authorities such as mayor of Besisahar municipality and chairperson of the 11 ward (Chiti) were taken. Prior to each survey the interviewers introduced themselves politely with a brief introduction to the EBA South project and explained why the survey is being undertaken. The interviewer assured that all the personal information will be kept confidential and no respondent should be forced to answer the questions.
In Nepal, the EbA South Project was implemented in 2013–2019 for which Chiti, Jita and Taksar villages in Lamjung district were selected as piloting sites. One of the project components was to monitor the climate change. The second household survey was carried out during July 21-27, 2016 in Chiti. The same households were surveyed in 2013 for baseline which are used here. Two households who were interviewed from
Sher Bahadur Gurung/ Assessment of climate change vulnerability ...Vol. 14: 151-170, 2021

154
Chiti during baseline survey were permanently migrated to Chitwan district which was replaced with similar socio-economic status households. The third household survey was conducted on August 10-21, 2017 and fourth household surveyed during April 4 - 11, 2019.
Vulnerability is best understood as a function of three components exposure, sensitivity and adaptive capacity (IPCC, 2014). Each of these components is described below.
Exposure is the nature and degree to which a system is exposed to significant climate variations.
Sensitivity is the responsiveness of a system to climatic influences which is shaped by both socio-economic and environmental conditions.
Adaptive capacity is the ability of local communities to cope with a hazard, reorganize their resources and minimize loss at different levels. The main determinant of adaptive capacity is access to resources/capital.
Selection of climate change vulnerability assessment indicators
This present survey followed the guidelines developed by the project on concept of vulnerability, methods of data collection and calculation of vulnerability index which was also used in baseline survey. Figure 1 shows the conceptual framework and indicators used in assessing the vulnerability mentioned in the guideline.
Figure 1: Indicators of climate change vulnerability and their inter-linkages
Sher Bahadur Gurung/ Assessment of climate change vulnerability ...Vol. 14: 151-170, 2021

155
Major indicators and their scoring methods used under three different vulnerability components are given in Table 1. Similarly, the indicators and their scoring methods for preparing awareness index are given in Table 2.
The vulnerability index was calculated using the following equations:
The exposure index was calculated as the sum of five indicator scores .
Exposure Scoreindicator ni
v
=∑ / Σ
Exposure to climate change vulnerability is calculated with sum of changes in temperature, changes in rainfall patterns, and changes in rainfall intensity, drought episodes and flooding events. The exposure score is ranges from 0 to 2. The households or community experiences no changes in temperature, rainfall patterns and intensity, no experiences of drought and flooding are assigned the value 0. The households felt changes but experienced no noticeable climate change impact are assigned as 1. The households with increasing climate change exposure value with negative impact are assigned as 2. The average value of assigned score in exposure index of climate change vulnerability is shown in see table 1.
The sensitivity index was expressed as the sum of six indicator scores.
Sensitivity nvi
vxi
=∑ scoreindicator / Σ
Sensitivity is calculated based on Slope failures, Soil fertility, Changes in natural environment: (i) soil cover; ii) levels of river sedimentation; iii) water salinity; iv) river ecosystems; v) forest size; and vi) the presence of invasive species), Economic dependency level, Irrigation facilities and Livelihood sources. In Table 5, the household experiences no slope failure event, no changes in soil fertility and natural vegetations, less than three family members are dependent on household, 100 percent irrigation facility, livelihood dependent on non-agriculture and agriculture was scored 0. Similarly, households experience slope failure, changes in soil fertility and natural vegetation but there is no negative impact on household, 4-9 family members dependent, partly irrigation and livelihood dependent on more than one crop and livestock were assigned as 1. Households perceive slope failure, changes in soil fertility and natural vegetation and also experienced negative impact on household, more than 9 family members are dependent, 100 percent rain fed situation and livelihood dependent on single crop or livestock were assigned as 2. The average value of assigned score is sensitivity index.
Sher Bahadur Gurung/ Assessment of climate change vulnerability ...Vol. 14: 151-170, 2021

156
The adaptive capacity index was expressed as the sum of four indicator scores.
AdaptiveCapacity nxv
xii
=∑ scoreindicator / Σ
Climate change adaptive capacity is a result of awareness, information on climate change and adaptation, surplus production and change in agricultural practices. Households with climate change awareness from 0 to 30 percent, they never received information of climate change and adaptation, 100 percent consumed the production, and no remedial action taken for climate change adaptation was scored as 0. The household climate change awareness is 30 to 60 percent, intermittently receive information of climate change and adaptation, 30 percent surplus production sold, and perceived climate change effect on agricultural production but no changes in agricultural practices were assigned as 1. The household with 60 to 100 percent awareness household, consistently received the information of climate change and adaption, more than 30 percent surplus production sold and climate change responded by adapting new agricultural practices scored as 2. The average score of assigned value is adaptive capacity index.
The vulnerability index was expressed as the product of sensitivity and exposure minus adaptive capacity.
Vulnerability = (Exposure x Sensitivity) – Adaptive capacity
Awareness assessmentAwareness score is measured based on conceptual awareness, experiential awareness, and engagement of household to talk about climate change and adaptation. The households were never heard about climate change, did not feel it and never talked about the climate change scored 0. The households with limited understanding of climate change, personally, they felt effect of climate change and gave some examples and talked about climate change once a month was assigned as 1. The household understood about drivers of climate change but they were not known the effects and they could give basic examples of personal feeling on climate change relation to weather and hazards and talked about climate change once a week assigned as 2.They understood about drivers of climate change and its effect in depth, gave in-depth examples and talked about climate change more than once a week scored 3. The average score of awareness index is change into the percent.
Similarly, the climate change awareness was calculated as a composite index of three indicators: i) conceptual awareness; ii) experiential awareness; and iii) engagement (Table 2). Scores for climate change awareness were further normalized to range between
Sher Bahadur Gurung/ Assessment of climate change vulnerability ...Vol. 14: 151-170, 2021

157
0–100% by dividing the scores with the largest possible score (9) and multiplying the quotient by 100.
Table 1: Indicators of vulnerability included in the household survey
Index Component indicator
Unit of measurement Score
0 1 2Exposure i) Changes in
temperature.Household. No change. Has increased with no
noticeable negative effects on household.
Has increased with negative effects on household.
ii) Changes in rainfall patterns.
Household. No change. Shift in seasons with no impact on household.
Shift in seasons with negative impact on household.
iii) Changes in rainfall intensity.
Household. No change. Increased/decreased impact of rainfall with no impact on household.
Increased/decreased impact of rainfall with negative effects on household.
iv) Drought episodes.
Household. Has not experienced drought events in the recent past.
Has experienced frequent droughts episodes in recent past with no negative effects on household.
Has experienced frequent droughts episodes in recent past with negative effects on household.
v) Flooding events.
Household. Has not experienced flooding events in the recent past.
Has experienced frequent flooding events in recent past with no negative effects on household.
Has experienced frequent flooding events in recent past with negative effects on household.
Sensitivity vi) Slope failures.
Household/ local community.
Household members reported no slope failures around their village.
Household members reported slope failures around their village with no negative impact on local community.
Household members reported slope failures around their village with negative impact on local community.
vii) Soil fertility. Household. Household members report no change.
Household members perceive soil fertility to have decreased with no negative impact on family.
Household members perceive soil fertility to have decreased with negative impact on family.
viii) Changes in natural environment1.
Household. Household members report no change.
Experience change with no negative impact on household.
Experience change with negative impact on household.
ix) Dependency level2 .
Household. Household size is less than three members.
Household size ranging from four to nine members.
Household size of over nine members.
x) Irrigation. Household. 100% Irrigation. Part irrigation, part rain fed.
100% rain fed.
xi) Livelihood sources.
Household. Household members utilise both non-agricultural and agricultural livelihoods.
Household members rely on more than one crop type and/or livestock product for their livelihoods (agricultural diversification).
Household members rely on only one crop type and/or livestock product for their livelihoods.
Adaptive capacity
xii) Awareness3. Household. Household representative has awareness index of 0–30%.
Household representative has awareness index of 30–60%.
Household representative has awareness index of 60–100%.
Sher Bahadur Gurung/ Assessment of climate change vulnerability ...Vol. 14: 151-170, 2021

158
xiii) Information.
Household. Household representative never receives information on climate change and adaptation.
Household representative receives information on climate change and adaptation intermittently.
Household representative consistently receives information on climate change and adaptation.
xiv) Surplus production.
Household. Household’s total food production is used for own consumption (100% own consumption).
Less than 30% of household’s total food production is sold.
More than 30% of household’s total food production is sold.
xv) Response: change in agricultural practices.
Household. Household members have not perceived any changes in the climate and have not taken any remedial action.
Household members have perceived climate variability and its related effects on production and income but have not changed their agricultural practices.
Household members have perceived climate variability and its related effects on production and income and have therefore responded by adopting new agricultural practices (e.g. seed change).
Table 2: Scores used to calculate climate change awareness
Component indicator
Unit of measurement
Question Score
0 1 2 3i) Conceptual awareness
Individual What is climate change?
Never heard of it
Heard of it, but have limited understanding
Understand the drivers but not the effects
Understand the drivers (human) and the effects (on sectors) in depth
ii) Experiential awareness
Individual Have you personally felt the effect of climate change?
No/not sure
Possibly, gives examples relating to weather and hazards
Yes, gives basic examples relating to weather and hazards
Yes, gives in-depth examples of long term changes impacting on numerous sectors
iii) Engagement
Individual Do you talk about climate change often?
Never Rarely (maybe once a month)
Sometimes (maybe once a week)
Often (more than once a week)
Sher Bahadur Gurung/ Assessment of climate change vulnerability ...Vol. 14: 151-170, 2021
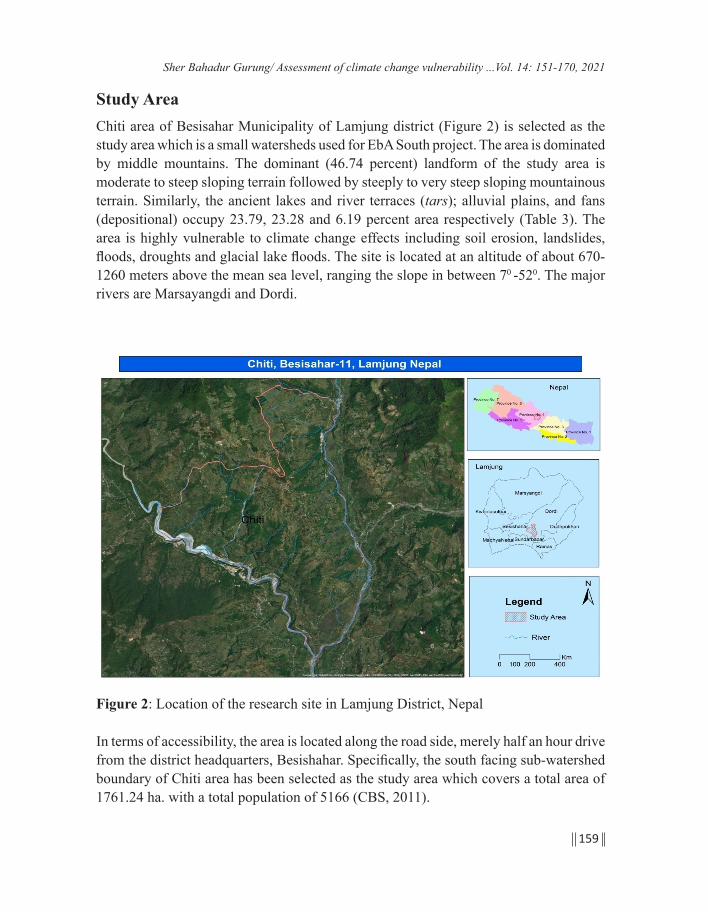
159
Study AreaChiti area of Besisahar Municipality of Lamjung district (Figure 2) is selected as the study area which is a small watersheds used for EbA South project. The area is dominated by middle mountains. The dominant (46.74 percent) landform of the study area is moderate to steep sloping terrain followed by steeply to very steep sloping mountainous terrain. Similarly, the ancient lakes and river terraces (tars); alluvial plains, and fans (depositional) occupy 23.79, 23.28 and 6.19 percent area respectively (Table 3). The area is highly vulnerable to climate change effects including soil erosion, landslides, floods, droughts and glacial lake floods. The site is located at an altitude of about 670-1260 meters above the mean sea level, ranging the slope in between 70 -520. The major rivers are Marsayangdi and Dordi.
Figure 2: Location of the research site in Lamjung District, Nepal
In terms of accessibility, the area is located along the road side, merely half an hour drive from the district headquarters, Besishahar. Specifically, the south facing sub-watershed boundary of Chiti area has been selected as the study area which covers a total area of 1761.24 ha. with a total population of 5166 (CBS, 2011).
Sher Bahadur Gurung/ Assessment of climate change vulnerability ...Vol. 14: 151-170, 2021

160
Figure 3: Landforms of the study area
Table 3: Characteristics of the landforms in the study area
Landforms Area in ha. PercentModerately to steeply sloping mountainous terrain 823.72 46.74Steeply to very steeply sloping mountainous terrain 419.25 23.79Ancient lakes and river terraces (tars) (erosional) 410.19 23.28Alluvial plains and fans (depositional) 109.08 6.19Total 1762.24 100.00
Sher Bahadur Gurung/ Assessment of climate change vulnerability ...Vol. 14: 151-170, 2021
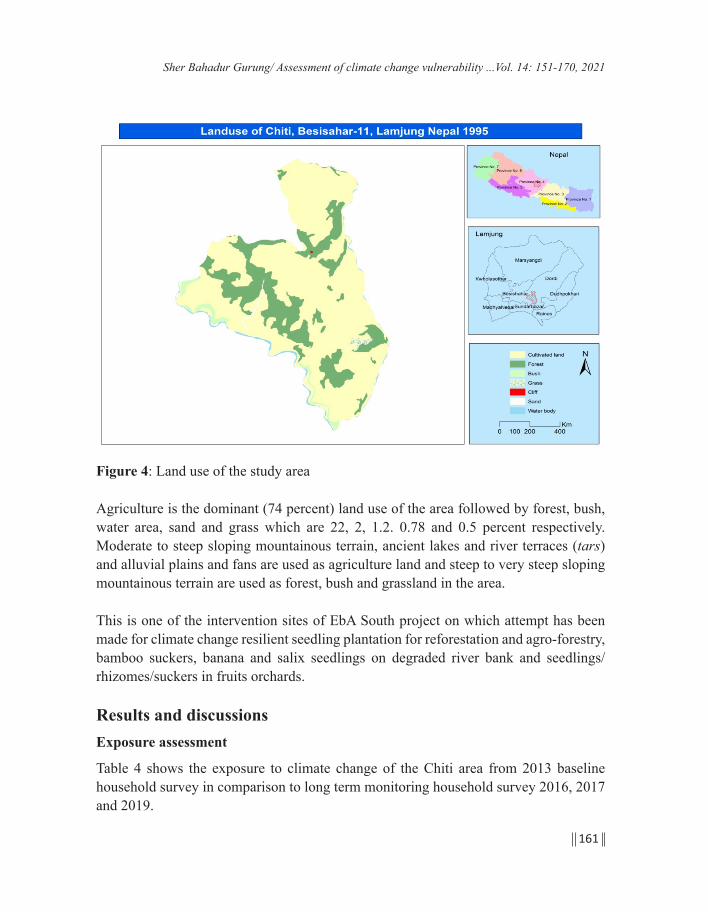
161
Figure 4: Land use of the study area
Agriculture is the dominant (74 percent) land use of the area followed by forest, bush, water area, sand and grass which are 22, 2, 1.2. 0.78 and 0.5 percent respectively. Moderate to steep sloping mountainous terrain, ancient lakes and river terraces (tars) and alluvial plains and fans are used as agriculture land and steep to very steep sloping mountainous terrain are used as forest, bush and grassland in the area.
This is one of the intervention sites of EbA South project on which attempt has been made for climate change resilient seedling plantation for reforestation and agro-forestry, bamboo suckers, banana and salix seedlings on degraded river bank and seedlings/rhizomes/suckers in fruits orchards.
Results and discussionsExposure assessment
Table 4 shows the exposure to climate change of the Chiti area from 2013 baseline household survey in comparison to long term monitoring household survey 2016, 2017 and 2019.
Sher Bahadur Gurung/ Assessment of climate change vulnerability ...Vol. 14: 151-170, 2021

162
Table 4: Exposure index of climate change vulnerability
Exposure 2019 2017* 2016** 2013***Minimum 0.50 0.50 0.6 0.20Maximum 1.00 1.00 1.00 1.00Average 0.77 0.86 0.53 0.67
Source: Field Study, 2019, * Rai, 2017; ** CDG, 2016; *** C4 EcoSolutions, 2013
The average index of exposure to climate change seems in increasing pattern from 2013 to 2019 with difference of 0.10 whereas it was highest (0.86) in 2017. Similarly, minimum was also rising and falling in all four study years. However, maximum exposure of climate change seems equal (1.00). The study of MoE, 2010 found that the exposure value of Lamjung district ranges from 0.580 to 1.0 and categorized it as very high exposure to climate change. The exposure value of MoE, 2010 is close to long term monitoring exposure value. The DHM, 2016 data from 1985 to 2014 (Figure 5) also correspond with the changes in temperature and rainfall. The mean annual temperature was increased 0.037 degree Celsius per annum and average annual rainfall was decreased by 5.319 mm per year. The increasing trend of temperature is close to national figure of the country and the rainfall trend is severe than national situation.
Figure 5: Exposure to Climate Change. Source: DHM, 2016
Sher Bahadur Gurung/ Assessment of climate change vulnerability ...Vol. 14: 151-170, 2021
Temperature and Rainfall 1985-2014

163
Sensitivity assessmentSensitivity is calculated based on slope failures, soil fertility, changes in natural environment (i) soil cover; ii) levels of river sedimentation; iii) water salinity; iv) river ecosystems; v) forest size; and vi) the presence of invasive species), economic dependency level, irrigation facilities and livelihood sources. The average value of assigned score is sensitivity index.
Table 5: Sensitivity index of climate change vulnerability
Sensitivity 2019 2017* 2016** 2013***Minimum 0.23 0.13 0.56 0.21Maximum 0.71 0.79 0.81 0.86Average 0.46 0.56 0.51 0.53
Source: Field Study, 2019, * Rai, 2017; ** CDG, 2016; *** C4 EcoSolution, 2013
The average sensitivity index was observed 0.53 in 2013 and 0.46 in 2019 which shows slightly improved situation in 2019. Similarly, the minimum index was 0.21 in baseline year 2013 and it is 0.23 in 2019. Maximum sensitivity index was observed better in 2019 than 2013. The sensitive score of the Lamjung district was ranged from 0.21 to 0.301 (MOE, 2010). The minimum value is similar to baseline household survey and long term household survey but the maximum score is higher in Chiti area than the district. It shows that the household and community of this area experienced changes on natural resources by climate change and impact on it (see Figure 6 a and b).
a. Slope failure view taken from UAV 2017
b. Invasive species Banmara on degraded forest
Figure 6: Sensitivity to climate change
Sher Bahadur Gurung/ Assessment of climate change vulnerability ...Vol. 14: 151-170, 2021

164
Adaptive capacity assessmentClimate change adaptive capacity is a result of awareness, information on climate change and adaptation, surplus production and change in agricultural practices. The average score of assigned value is adaptive capacity index. The household with 60 to 100 percent awareness; updated with the information of climate change and adaption; selling more than 30 percent surplus production; and responding climate change by adapting new agricultural practices has been scored as 2.
Table 6: Adaptive capacity index of climate change
Adaptive Capacity 2019 2017* 2016** 2013***Minimum 0.25 0.25 0.00 0.00Maximum 1.00 1.00 0.75 0.67Average 0.63 0.6 0.12 0.13
Source: Field study, 2019, * Rai, 2017; ** CDG, 2016; *** EcoSolution, 2013
The table 6 shows that the average adaptive capacity index for climate change has been improved in 2019 in compared to 2013 and 2016. It is assumed that it could be due to the result of EbA south supported agro forestry high value plantation. Minimum index was 0.00 in 2013 and 0.25 in 2019. Likewise, maximum was 0.67 in 2013 and it is 1.00 in 2019 which has been increased due to the adaptive capacity. The adaptive capacity of the Lamjung district was ranged from 0.167 to 0.336. These values are almost close to the baseline household survey and less than long term monitoring household survey of Chiti area. It is also assumed as the result of enhancement of climate change adaptive capacity through awareness and adaptation through new agricultural practices (Figure 7 a, b, c, d, e, and f).
Sher Bahadur Gurung/ Assessment of climate change vulnerability ...Vol. 14: 151-170, 2021

165
a. Nursery for agro-forestry and horticulture b. Planting mango and litchi
c. Ginger cultivation for income generation d. Bamboo and banana plantation for income generation and slope protection
e. Agro-forestryf. Agro-forestry with cardamom
Figure 7: Climate change adaptation practices in the study area
Sher Bahadur Gurung/ Assessment of climate change vulnerability ...Vol. 14: 151-170, 2021

166
Awareness assessmentAwareness score has been calculated based on conceptual awareness, experiential awareness, and engagement of household to talk about climate change and adaptation. They understood about drivers of climate change and its effect in depth, gave in-depth examples and talked about climate change more than once a week scored 3. The average score of awareness index is changed into the percent.
Table 7: Awareness score of climate change
Awareness 2019 2017* 2016** 2015*** 2013****
Minimum 44.44 11.11 0.00 - 0.99Maximum 100.00 77.78 77.78 - 78.00Average 72.02 39.56 34.16 28.00 16.00
Source: Field study, 2019, * Rai, 2017; ** CDG, 2016; *** Kaplan and Mills, 2015; ****EcoSolution, 2013
The data in table 7 shows average awareness score of climate change which is in increasing trend during four study periods. It has been increased more than four times in 2019 than 2013. It could be due to the reason of frequent visit and asking same questions by researchers with the same respondents. Similarly, the Hariyoban program of WWF support had lunched three months long climate change training program in 2018 side by side for the local people in the study area. As a result, the minimum and maximum score have also been observed in improving trend.
Vulnerability assessmentVulnerability is calculated based on EbA South 2013 i.e. Vulnerability = (Exposure * Sensitivity) – Adaptive capacity
Sher Bahadur Gurung/ Assessment of climate change vulnerability ...Vol. 14: 151-170, 2021

167
Table 8: Vulnerability index of climate change
Vulnerability 2019 2017* 2016** 2013***
Minimum -0.68 -0.61 -0.18 -0.47
Maximum 0.32 0.29 0.73 0.77
Average -0.27 -0.16 0.34 0.25
Source: Field study, 2019, * Rai, 2017; ** CDG, 2016; *** Ecosolution, 2013
The average vulnerability index of climate change is -0.27 in 2019 whereas it was 0.25 in 2013 which shows the improving condition of vulnerability in 2019 (Table 8). Even the minimum value was in good condition during all the study years. Maximum index was 0.77 in 2013 and it is 0.32 in 2019 which ranged from 0.787 to 1.0 (MoE, 2010) which is very high in comparison to the baseline 2013 and long term monitoring index because of improvement of climate change adaptive capacity in the study area (See Figure 7).
ConclusionChiti area of Lamjung has been experiencing climate change vulnerability. The paper dealt with serious environmental problems (climatic change phenomena) and its impact on the community in the area. IPCC methodology has been used to analyse the variables such as exposure, sensitivity, and adaptive capacity in relation to the short-term and long-term effects of EbA South interventions on climate change impact within the area. In short-term, climate change awareness among the households has been increased in the area which reduced the climate change vulnerability consequently. However, for the long term impact study requires longer monitoring. The study findings based on post adaptation vulnerability analysis of local community could be useful for national climate change vulnerability adaptation policy.
AcknowledgementsThis article is based on the information collected from the field work supported by Ecosystem Based Adaptation through South-South Cooperation (EbA South) project funded by the Global Environment Facility, implemented by the United Nations Environment Program and executed by the National Development and Reform Commission of China through the Institute of Geographic Science and Natural Resources Research, Chinese Academy of Sciences. The author is grateful to all the institutions and persons for their valuable support.
Sher Bahadur Gurung/ Assessment of climate change vulnerability ...Vol. 14: 151-170, 2021

168
ReferencesAdhikari, B. (2016). Climate change and its impact on livelihood (A case study of Chiti,
Jita and Taksar VDC of Lamjung district). Unpublished Dissertation, Tribhuvan University.
C4 EcoSolitions (2013). Baseline assessment for project: Enhancing capacity, knowledge and technology Support to build climate resilience of vulnerable developing countries, Ecosystem-based Adaptation through South –South Cooperation (EBA SSC). C4 EcoSolitions, Captown, South Africa.
CBS (2012). National population and household census 2011: Village Development Committee/Municipality, Volume 02. Kathmandu: Central Bureau of Statistics, Nepal.
CDG (2016). Climate change awareness and vulnerability assessment in Chiti and Jita/Taksar Pilot sites of Ecosystem-based Adaptation through South-South Cooperation, EbA South: Enhancing Capacity, Knowledge and Technology Support to Build Climate Resilience of Vulnerable Developing Countries. Kathmandu: Central Department of Geography, Nepal.
DHM (2017). Observed climate trend analysis of Nepal (1971-2014). Kathmandu: Department of Hydrology and Metrology, Ministry of Population and Environment, Government of Nepal.
Gentle, P., Thwaites, R., Race, D. & Alexander, K. (2014). Differential impacts of climate change on communities in the middle Hills region of Nepal. Nat Hazards. 74 PP.815-836.
Hijioka, Y., Lin, E., Pereira, J.J., Corlett, R.T., Cui, X., Insarov, G.E., Lasco, R.D., Lindgren, E. & Surjan, A. (2014). Asia in climate change 2014: Impacts, adaptation, and vulnerability. Part B: Regional Aspects. Contribution of Working Group II to the Fifth Assessment Report of the Intergovernmental Panel on Climate Change [Barros, V.R., C.B. Field, D.J. Dokken, M.D. Mastrandrea, K.J. Mach, T.E. Bilir, M. Chatterjee, K.L. Ebi,Y.O. Estrada, R.C. Genova, B. Girma, E.S. Kissel, A.N. Levy, S. MacCracken, P.R. Mastrandrea, and L.L. White (eds.)]. New York: Cambridge University Press, pp. 1327-1370.
IPCC (2018). Summary for policy makers. In: Global Warming of 1.5°C. An IPCC Special Report on the impacts of global warming of 1.5°C above pre-industrial
Sher Bahadur Gurung/ Assessment of climate change vulnerability ...Vol. 14: 151-170, 2021

169
levels and related global greenhouse gas emission pathways, in the context of strengthening the global response to the threat of climate change, sustainable development, and efforts to eradicate poverty [Masson-Delmotte, V., P. Zhai, H.-O. Pörtner, D. Roberts, J. Skea, P.R. Shukla, A. Pirani,W. Moufouma-Okia, C. Péan, R. Pidcock, S. Connors, J.B.R. Matthews, Y. Chen, X. Zhou, M.I. Gomis, E. Lonnoy,T. Maycock, M. Tignor, and T. Waterfield (eds.)]. Geneva: World Meteorological Organization, pp. 32
IPCC (2014). Summary for policymakers. In: Climate Change 2014: Impacts, Adaptation, and Vulnerability.Part A: Global and Sectoral Aspects. Contribution of Working Group II to the Fifth Assessment Report of the Intergovernmental Panel on Climate Change [Field, C.B., V.R. Barros, D.J., Dokken, K.J., Mach, M.D., Mastrandrea, T.E., Bilir, M. Chatterjee, K.L., Ebi, Y.O., Estrada, R.C., Genova, B., Girma, E.S., Kissel, A.N. Levy, S., MacCracken,P.R., Mastrandrea, T. E. & White, L.L. (2013). New York: Cambridge University Press, pp. 1-32.
IPCC (2001). Climate change 2001: Impacts, adaptation, and vulnerability. Intergovernmental Panel on Climate Change, IPCC, Edinburg: Cambridge University Press.
Kaplan, B. and Mills A. (2015). Rapid assessment report for the EBA South Project for Lamjung District Nepal. Captown: C4 EcoSolitions.
MoE (2010). Climate change vulnerability mapping for Nepal. Kathmandu: Ministry of Environment, MoE.
MoPE (2017). Vulnerability and risk assessment framework and indicators for national adaptation plan (NAP) formulation process in Nepal. Kathmandu: Ministry of Population and Environment.
Rai, K. (2017). Assessing the changes in vulnerability condition in EbA project site, Lamjung district, Nepal. Unpublished Dissertation, Tribhuvan University.
Tsering, K., Sharma, E., Chettri, N., & Shrestha, A. (2010). Climate change impact and vulnerability in the eastern Himalaya. Synthesis report on climate change vulnerability of mountain ecosystem in the eastern Himalayas. Kathmandu: International Centre for Integrated Mountain Development.
Sher Bahadur Gurung/ Assessment of climate change vulnerability ...Vol. 14: 151-170, 2021

170
(Footnotes)
1. Changes in natural environment are related to the household-survey questionnaire. This indicator is estimated by households reporting changes in: i) soil cover; ii) levels of river sedimentation; iii) water salinity; iv) river ecosystems; v) forest size; and vi) the presence of invasive species.
2. Dependency level is measured by household size.
3. See this section for details on the calculation of the awareness index.
Sher Bahadur Gurung/ Assessment of climate change vulnerability ...Vol. 14: 151-170, 2021
171
People, place, and space: Theoretical and empirical reflections in studying urban open space
Krishna Prasad TimalsinaPh.D. Student, Central Department of Geography, Tribhuvan University
Corresponding Email: [email protected]: 20 November, 2020; Accepted: 02 December, 2020; Published: March 2021
AbstractPeople, place, and space are the main domain of spatial research which is widely discussed in the geographic discipline. Geographers always focus on the meanings related to space and human interactions to explain people, place, and space. The concept was explained by Richard Harsthrone (1959), Fred E Lukermann (1964), David Harvey (1969), Henri Lefebvre (1974), Yi-fu Tuan (1974), Edward Relph (1976) and Doreen Massey (2005), etc. As a human geographer, Yi.fu Tuan has a great contribution to explain people-place relations and further explained by Relph, Massey, and other scholars. Grounding on the geographic research traditions, this paper presents the concept of people, place, and space reviewing the historiographical literatures and some empirical research studies on people-space relations. Theorists have argued that people and space are deep-rooted in studying place attachment creating people’s sense of place. People’s actions and behaviors create meaning through their individual and communal behaviors in that space where they live and interact. Moreover, theoretical perspectives argue that placemaking is always associated with the social and cultural dimensions of a society. Empirically, as an indigenous society, people from the core area of Kathmandu Metropolitan City (KMC) have been perceiving urban open space as a commonplace for social and cultural life activities whereas migrants’ people living in the newly growing settlements have been perceiving the open space as a place for recreation and social capital enhancement.
Keywords: People, place, space, place attachment, public place, urban open space
The Geographical Journal of NepalVol. 14: 171-188, 2021DOI: https://doi.org/10.3126/gjn.v14i0.35558Central Department of Geography, Tribhuvan University, Kathmandu, Nepal

172
IntroductionThe study of people, place, and space is the major focus within the field of geographical research. Geographers always focus on the meanings of space and human interactions to explain people, place, and space relations. Space itself will have no meaning unless people create meaning to it. Space and human interactions create meaning for any space through human behavior and actions on that space (Relph, 1976; Tuan, 1977). The meaning of space is also associated with social, cultural, and geographical contexts. The meaning of space to different societies may have different because society uses spaces differently in their different social and cultural contexts. Space in the urban areas has a different meaning and has more value than rural areas as urban planners and urban authorities always give attention to public space management in the urban context. To some, space is a social place for sharing people’s feelings, experiences, knowledge, interaction between them; and to others. It is a place for physical exercises and places for health improvement. Moreover, some others have discussed the importance of space as disaster risk management and enhancing societal well-being (UN-Habitat, 2018; MoHA, 2019) in urban contexts. However, space value is closely associated with the decreasing open space with respect to the demand of land for different urban uses in the cities. But space as a place should be looked at through how people utilize space in different social and cultural contexts. This paper explores the space as a locational extent to which urban communities value it for different functions of urban life, and the place is the human attachment to a space created by the behaviour of people reflecting their everyday social, cultural, recreational, and health-related life activities. So, the debate of people place relations is always related to human attachment through their life activities.
Terminologies in the academic discussions about open space and public open space have been found interchangeably used. To define, public open spaces are those spaces that are available to urban residents without any restriction for social, cultural, environmental, economic, and political uses (UN-Habitat, 2018). Therefore, the public open spaces are shared resources, which are not closed or blocked up and provide access for people and express conditions of public life, civic culture, and everyday social life activities (Woolley, 2003). But the open spaces are all types of open spaces that may be public or private but these spaces have contributed to urban society for environmental benefit and shaping the urban physical form. Both public open space and open space underpin many social, cultural, ecological, and economic activities that are essential to the healthy functioning of urban life and the environment although they may have different implications and values for the urban residents.
Krishna Prasad Timalsina/ People, place, and space: ...Vol. 14: 171-188, 2021

173
There are different uses of open spaces in KMC. Residents in the core area have been using open spaces for their cultural events and recreational place whereas some other new settlements have been using open spaces for recreation, community activities such as yoga, physical exercise, sports, etc. and sometimes for economic activities to earn livelihoods (Shrestha and Shrestha, 2006; Chitrakar, 2015). There is still a significant number of populations earning on the open space in the informal sectors for their livelihoods (Timalsina, 2011). Although the open space implications in the urban contexts are diverse, there is a knowledge gap in studying how open space contributes to people, place, and space relations, and it needs to be a major concern among the urban authorities and professionals who are working in the field of urbanism.
Open space in the academic discourses has mostly been discussed urban designing perspectives as architects and urban planners have focused on it as a design component (Madanipour, 2003; Pradhan, 2003; Low and Smith, 2005; Shrestha and Shrestha, 2006; Chitrakar, 2015 and 2006). They give attention to allocate open space in the urban settlements to keep city greenery, healthy, and to maintain spacious city space. Enhancement of city environment, city sustainability, landscape morphology would be their major concern of designs. Therefore, open space for them is to make cities more resilient and sustainable keeping the city’s landscape natural. It means their concern is always associated to retain the city’s landscape lively and natural and therefore, their concern mainly focuses on the landscaping and the city’s morphology rather than looking at through the space-human relational perspectives. But people-space relations and place building concepts are yet to integrate into the academic discourses.
Human geographers take open spaces as social creation arguing in the humanistic perspectives of ‘human-space’ interactions. The humanistic perspectives propose a definite but complex relationship between the character of specific places and the cultural identities of those who inhabit them (Campbell, 2018). The place is the creation of human-space interactions and it is always associated with people who behave in that space. As the city is a produced space for human settlement, diverse social, cultural aspects are bound within it. It means open space in the urban context is closely related to place identity as any public space reflects the social and people’s attachment to it. This paper, therefore, presents some theoretical concepts about people, place, and space to describe how open spaces have been functioning as places and how people are closely associated to create meaning through human geographic perspectives. Therefore, theoretical review on people, place, and space first then followed by the empirical research on how open spaces have been functioning as a socio-cultural place in KMC, and how the process of transformation of sites may change the meaning of space over time has been reviewed through the human geographical perspectives. These concepts
Krishna Prasad Timalsina/ People, place, and space: ...Vol. 14: 171-188, 2021

174
were discussed through the different social and cultural contexts taking historical open spaces from indigenous residents of core urban settings and newly emerging open spaces from migrants’ society of KMC as these spaces are common resources to urban inhabitants. The review findings provide to develop a conceptual framework for studying the dynamics of public open spaces in KMC.
Methods and materialsThis is a review paper prepared based on reviewing the historiographical literature on people, place, and space worked out by scholars with a special focus on humanistic geographic perspectives. Scholarly works by Richard Harsthrone (1959), Fred E Lukermann (1964), David Harvey (1969), Henri Lifebvre (1974), Yi-fu Tuan (1974), Edward Relph (1976), and Doreen Massey (2005) were reviewed to get insights into humanistic perspectives of people-place debate. The literature was collected through an online search from different publications available on web surfing from August to October 2020. Similarly, empirical literature in the field of architectural planning and geography was collected through the online search from August to October 2020 and other published articles and books. The focus of such reviews was done to look at how space has been viewed as a place in architectural planning and geographic research in Nepal. To relate the theoretical concepts in the ground, two different open space sites (one pubic open space-Yatakha Bahal, ward no 25 from the core area and one open space-Suryamukhi Garden, ward no 32 from the fringe area of KMC) were observed. The non-participant observation1 was carried out in both spaces to see the people’s behaviours how they have been using the space and creating a place to open spaces. Such non-participant observation was conducted to observe people’s behavour in space and relate it with a theoretical understanding of people, place, and space debate in geography.
The focus of the theoretical review was to see how the people, place, and space concept was used to see the relations of people and spaces for the creation of place. Empirical research works on open spaces under urbanism were reviewed to get how public spaces were considered as a place from the different academic discourses, particularly from urban planning and geography. So, the methodology of this research paper is based on constructive criticism on the literature available on people, place, and space under
1 Non-Prticpant observation was carried out at the purposively selected sites to validate the empirical findings of the review. The researcher visited the sites three times a day (morning, afternoon and evening) to observe actitvied going on at the selected open spaces. During the observation, various uses of the open space, different functions going on over the open space, purpose of people’s visit, space morphology, social and cultural reflections of the space, etc. were observed to get insights of the spaces to relate human-space interactions.
Krishna Prasad Timalsina/ People, place, and space: ...Vol. 14: 171-188, 2021

175
the scholarly works with a special focus on human geography. Similarly, reflective constructivism was employed to look into different forms of place-making in the different urban settings from core and fringe areas through the observation methods. This method has been combined to get insights into how people in different contexts view space as a place in Kathmandu Metropolitan City. Methodologically this paper, therefore, is based on qualitative interpretivism.
Results and discussionsPlace and space
Much discussions on the concepts of place and space throughout the history of geographical research have been done in literature. As space and place together define the nature of geography, spatial analysis is at the forefront of geographical research locating space and place at the centre. Places are natural laboratories for the study of complex relationships among processes and phenomena (NRC, 1997) which human geographers have been focusing more on it. Geographers are confident of both the meaning of space and the methods suited to its analysis and therefore, a place like space lies at the core of geographical discipline which Tuan explains that modern analysis derives its substance from man’s interactions with space which he has termed as ‘sense of place’ (Tuan, 1977). In the geographical literature, the place has been given several meanings; as a location, the place is one unit among other units to which it is linked by a circulation net, and it has more substance than the word location suggests. The place is thus a unique entity that has a history and meaning (Lukermann, 1964). The place embodies the experiences and aspirations of a people which is not only a fact to be explained in the broader frame of space, but it is also a reality to be clarified and understood from the perspectives of the people who have given it meaning (Campbell, 2018). The creation of meaning by the human interactions on space is a place that is therefore associated with human interactions with space.
In the early nineteenth century, geographical analysis was characterized by environmental determinism and historicism. In 1959 Hartshorne published ‘Nature of Geography’ which had turned geographical research in spatial distribution rather than the time which focus turned into social interests (Hartshorne, 1959). However, in the 1960s, geography was overcome by technical, statistical, and quantitative study and did not return to qualitative methods and humanistic focus until the 1970s (Compbell, 2018). In the 1970s, scholars such as Karl Marx described the importance of space as socially produced and consumed rooting geographical research on social dimensions of relating space-human interactions (Hubbard and Kitchen, 2011). Space and place then came into more discussions in human geography as the main discourse. People, place,
Krishna Prasad Timalsina/ People, place, and space: ...Vol. 14: 171-188, 2021

176
and space, therefore, matter in geographical analysis after 1970s as human geographic perspectives.
Lefebvre in 1974 published ‘The Production of Space’ which introduced space as perceived space- ‘activities through which society develops and reproduces its spatiality’; conceived space- ‘defined by planners, architects and other specialists’; and endured space- ‘users’ space experienced lived every day’. According to Lefebvre, space changes over time, and its symbolic associations with it are always changeable (Lefebvre, 1974). Lefebvre’s concern was of how the spatial experience has changed over time depending upon social circumstances. Meanwhile, Hubbard shifted the analytical focus of human geography from social space to lived-in space then followed by Yi-fu Tuan who adds that space does not have an inherent scale but instead is created by emotional attachment through fields of care (Tuan, 1977; Hubbard and Kitchen, 2011). Now spatial analysis in geography inherently came into social processes and human attachments giving attention to ‘place’ which is emphasized by Adams (2016) ‘the geographic tradition of trying to understand the meanings and processes of place – their material and symbolic qualities – as well as the range of peoples and social relations that continuously define and create social and spatial contexts’ (Adams, 2016). People in space, therefore, create social relations and dynamics in studying human space relations.
Similarly, David Harvey interpreted Marxist’s theory pointing out the paradox as globalization depends on a sense of place because history, culture, and landscape are crucial in perpetuating special processes of capital accumulation (Harvey, 1969; Goheen, 1998; Campbell, 2018). Capital formation is closely related to people-space relations and cultural associations. Edward Relph (1976) argues that human geographers need to seek a more human-centric approach and an empathetic understanding of the lived experience of place. Relph stresses that there can only be a sense of place when the bond between people and place is deep-rooted (Relph, 1976). Describing the place from a humanistic perspective, Phil Hubbard and Ras Kitchin, 2011 have explained place as;
Places are fundamental in providing a sense of belonging for those who live in them, humanistic perspectives propose a definite but complex relationship between the character of specific places and the cultural identities of those who inhabit them. Against this, materialist perspectives propose that cultural battles create explicit inequalities in the way that space is occupied and used by members of different groups (Hubbard and Kitchin., 2011)
In the 1990s, human geography turned into a postmodern age which has focused its inquiry that tied the study of geography with social justice and focused on pluralities,
Krishna Prasad Timalsina/ People, place, and space: ...Vol. 14: 171-188, 2021

177
binaries, positionalities, and deconstruction (Peet, 1998; Pieterse, 2002; Campbell, 2018). Focusing on the spatial dimension of society, postmodernists argue that realities are socially constructed; the way people think and talk about, social realities affects agendas, policies, laws (Pieterse, 2002). Meanwhile, the geographical analysis turned into the ‘geographic representations’ as a Geographical Information System (GIS) focused on the analysis of how spatial meaning is constructed and how spatial dynamics are represented visually. Human geography exports the concept and study of space to other disciplines in the social sciences and humanities (Campbell, 2018). Human geographers are now looking at spatial analysis parallelly to social dimensions of space and mapping social phenomena into the visualization of the geographic world. Therefore, geographers are giving attention to spatial representation and integrate the concepts and methods from many other disciplines and interact with other fields, including computer science, statistics, mathematics, geodesy, civil engineering, cognitive science, formal logic, cognitive psychology, semiotics, and linguistics (NRC, 1997). The goal is to produce a unified approach to spatial representation and to devise practical tools for representing the complexities of the world and for facilitating the synthesis of diverse kinds of information and diverse perspectives. Integrations of diverse disciplines now have been the popular approach in the field of geographic analysis.
Massey (2005) in her book ‘For Space’ discusses the political implications of the ongoing privatization of space. She has argued of place stating that place has importance as; i) places do not have single identities but multiple ones; a product of interrelations, ii) places are not frozen in time, they are processes; space as the existence of plurality, iii) places are not enclosures with a clear inside and outside; space is as always under constructions. The idea is that space and time are intimately connected to each other. Her contributions specifically framed a relational approach to understanding the debates on space and place in regional studies as she explains;
One way of thinking about a place is as particular moments in … intersecting social relations, nets of which have over time been constructed, laid down, interact with one another, decayed and renewed. Some of these relations will be, as it were, contained within the place; others will stretch beyond it, tying any particular locality into wider relations and processes in which other places are implicated too. … The global is in the local in the very process of the formation of the local (Massey, 2005).
Her argument indicates three key sayings for understanding space; first, as the product of interrelations, which constituted through interactions; second, as a sphere of multiplicity in which distinct trajectories and heterogeneity co-exist; and third, as always in the process of being made or produced (Massey, 2005).
Krishna Prasad Timalsina/ People, place, and space: ...Vol. 14: 171-188, 2021

178
Therefore, space according to her is the understanding as an ongoing production that may change over time. She puts her thoughts that space inflects our understandings of the world, our attitudes to others, our politics which is also argued by Harvey in 2006 (Harvey, 2006). It affects the way we understand globalization, the way we approach cities, the way we develop, and practice, a sense of place (Massey, 2005). The argument is strongly connected to society in space which means to relate people in space and also with the political economy of space as argued by Harvey (Harvey, 2006).
Summarizing the review of the historical perspective of space and place in human geography, it is concluded that geography has a long tradition of attempting to understand how different processes and phenomena interact at global, regional, and local levels, including an understanding of how these interactions give places their distinctive character (NRC, 1997). Therefore, space and place have different dimensions of understanding human behaviour on different scales. Space and place interaction thus, are a focused area of research within human geography. Within studies of urban open space, perspectives of place and space could be linked to see how people create meaning to any space reflecting their culture, identity, and how they are bound to that space. The shift of human geographic trend of analysis scene was moving from physical dimensions to more socio-spatial dimensions. Scholars like Richard Harshrone, Fred E Lukermann, Edward Relph, had focused more on physical aspects of spatial distribution rather than as a process and time. However, Yi-fu Tuan, Henri Lefebvre, David Harvey, Doreen Massey focused more on patterns and processes that are more relevant to the time factor and argued how the social process is determined to changing the spatial process over time. The commonalities among the scholars are that people, space, and place are interlinked to each other that may shape and reshape the social process and are varied according to the social and cultural practice of society although the earlier geographers had focused on physical aspects of analysis rather than human-space interactions.
Sense of place and place-makingComing to this point of looking at place and space theoretically, people, place, and space are interconnected to each other. Space without human actions and attachments has no significant meaning. People with space attachment are what sense of place is all about which has been discussed more in human geography. Subjective human reactions to spaces may vary according to the socio-cultural and environmental contexts. The idea of a sense of place has been much discussed
Krishna Prasad Timalsina/ People, place, and space: ...Vol. 14: 171-188, 2021

179
in the domain of human geography and then in other fields. Defining the sense of place, Walkie (2016) has explained as;
With roots in early forms of humanistic geography, the concept appears in various forms in a considerable body of works expanding on human experience, memory, imagination, emotion, and meaning; accordingly, it is a core value in a broad and varied range of endeavors from theory to practice. In sum, the sense of place contributes depth and understanding to what it means to be human (Walkie, 2016).
A sense of place therefore describes the human relationship with space, expressed in different dimensions of human life: emotions, biographies, imagination, stories, and personal experiences (Basso, 1996). Place attachment reflects a bond between people and space, and place reflects symbolic meanings people ascribe to spaces (Adam, 2016). The sense of place varies among people, communities, cultures, and throughout one’s lifetime. This means people may attribute various meanings to the same place in relation to its ecological, social, economic, cultural, aesthetic, historical, or other aspects which may change over time (Basso, 1996; Massey, 2005; Stanley et al., 2014; Adam, 2016). A sense of place evolves through personal experiences and defines how people view, interpret, and interact with their world (Russ et al., 2015). The sense of place differs in cities and rural settlements. The sense of place in the cities echoes the intersections of culture, environment, history, politics, and economics, and is impacted by mobility, and blurred boundaries between the natural and built environment (Adam, 2016). People residing in some place may have a different sense of that place than those living in another place and environment. People traveling from one geographic region to another region may have different perceptions and understandings of that place. Therefore, the sense of place varies according to time spent at a particular space and geography he/she belongs to.
People’s actions and behaviors create/give meaning to any space. People create meaning to any space through their individual and communal behaviors in that space where they live and interact. A community develops a place which is closely related to its culture, communal behaviour, and practices. Therefore, dimensions of open space in the urban contexts may vary according to social, cultural behaviors that society develops. Looking at urban open space through human geographic perspectives, it helps to build a sense of community, civic identity, and culture and it facilitates to bond social capitals, cultural development, and community revitalization (Anderson, 2016). Soja (1996), argues that space is understood as a physical and social landscape that is imbued with meaning in everyday place-bound social practices and emerges through processes that operate over
Krishna Prasad Timalsina/ People, place, and space: ...Vol. 14: 171-188, 2021

180
varying spatial and temporal scales (Saar and Palang, 2009). Therefore, society creates a place for any space through social practices in everyday interactions with it.
Studying place attachment has been a growing concern among urban planners and architects in recent decades as open spaces in the cities are meant to place building for city dwellers (Chitrakar, 2015). This has also been a major concern among human geographers as the place has special meaning to human geographers while analyzing the dynamics of human-space relations (Tuan, 1977; Harvey, 1969; Ralf, 1979; Massey, 2005). Urban planners and architects have argued the built environment as the most significant designs that affect our daily lives and therefore in the same way public spaces; such as parks, public squares, open plaza, green areas affect our daily life (Anderson, 2016). Their concern seems to be objective space as architects and urban planners deal with designed space to urban open space. Contemporary urbanists have been studying human behavior and have presented their findings of social life and urban spaces as placemaking in different urban studies. This indicates urbanists have also trying to integrate social actions and behaviors in designing the city in line with humanistic perspectives. Their concerns seem to be ‘city for people’ meant to connect humanistic perspectives in the design elements of open space within a city; however, the depth of relating ‘people in a space’ is still lacking.
The discussion above on the sense of place is linked to give a picture of how urban spaces play important role in designing a city and how people are associated with place attachment. Theoretical understanding of people, place, and space in studying urban open space can be considered as a place in the urban context that could be looked through the place making perspectives. As different socio-cultural contexts reflect different perspectives of placemaking, it is imperative to look into how people in the urban areas of KMC have been creating and assembling the meaning to the public space in their daily life activities. Open spaces in KMC are decreasing rapidly through the process of encroachment, uses change, and rapid urbanization. Data reveals that from 1980 to 2019, the built-up area in KMC is increased by 40.02% whereas agriculture and open area is decreased by 52.85 percent and 1.76 percent respectively (Timalsina, 2020a). The figure presents how open spaces in the city are decreasing limiting public open space. There are different patterns of functional uses of open spaces in KMC in the different social settings; however, public open spaces are well recognized socially as these provide a place for physical and social well-being and these vary according to social and cultural settings (Timalsina, 2020b). Some empirical studies on open space have been reviewed to see how people have been perceiving open space as a place in different urban settings (among the indigenous and migrants communities of KMC).
Krishna Prasad Timalsina/ People, place, and space: ...Vol. 14: 171-188, 2021

181
Empirical studies
Various scholars have discussed in their research works about people, place, and space. Spreiregen in 1965 has pointed out that traditional urban spaces are simply the creation of their times. Open spaces form simply follow nature and respect the culture of their society. The argument is that urban spaces are the creation of times reflecting social process and cultural practices and pose how community actions and behavior inherently create meaning to the spaces where they live in. The concept is that people in the society have been giving meaning to their space in different patterns not only in designing but in the whole sets of physical, social, cultural landscapes of space. Spaces have gradually been turning into place through human actions, behaviors, socialization, and development of the society itself. The empirical studies on open spaces and public spaces have focused on the design sides of open spaces in the field of urban planning and architecture. Recently, some of the studies on urban space have highlighted the typology, functions, and locational advantages of how these can be implied in urbanism (Pokhrel and Khanal, 2015). An inventory study has identified that there are different types of open spaces in KMC including private, government, institutional, public, and Guthi, etc. (KVDA, 2015). Although the categories of open spaces were defined, its functional uses and implications were not elaborated much. These typologies of open spaces have different uses and functions in different social and cultural settings which has not been explored through people-space perspectives.
The historical open spaces are examples of successful urban open spaces that have excellent physical design and succeeded in making a built environment (Chitrakar, 2015; Maharjan, 2018). Bahas and courtyards are the major public open spaces which have been critical sites of cultural, political, and economic life from early civilizations to the present day in core urban settings in Kathmandu (RECPHEC, 2016). Baha is a Buddhist Monastery and derives its name from the Sanskrit word Bihara, meaning joy or enchantment and thus is a place of religious bliss (Tiwari, 2001 and Chitrakar, 2006 and 2015). The Bahas are generally constructed by a family and their descendants reside in it for generations (Maharjan, 2018). A community is formed to use and protect the Bahas as these are surrounded by the local residents and they have common rights to use them. These Bahas are having characteristics of a square or rectangular space bounded by buildings on all sides, surrounding buildings built on a raised platform called Falcha, ground paved with brick or stone, generally centrally placed Chaitya, often the presence of a well, the building opposite to the main entrance houses a Guthi with idols of deities in the ground floor (Shrestha, 1981; Chitrakar, 2015 and 2006; Maharjan, 2018). The characteristics are also the reflections of Newari place identity as cultural practices from the historic Malla regime of Nepal.
Krishna Prasad Timalsina/ People, place, and space: ...Vol. 14: 171-188, 2021

182
The Bahas as the open spaces in the core city present local communities’ identity and their cultural, architectural, and historical representations. Keeping Bahas in the traditional settlements of Kathmandu Valley was the historical practice of placemaking as society feels to have their sense of place and their identity would be reflected in them. The Bahas of KMC shows the unique place created by local communities giving their sense of place and cultural identity among the Newar communities. There are several such courtyards which are historical assets that reflect the typical Newari culture and pose their cultural identity. These open spaces in the urban core area of Kathmandu are being dedicated mostly for cultural activities and the people have given some cultural meaning to it. While looking at the uses of these public spaces, these spaces are being used for cultural activities e.g. Jatra, and other cultural events; for social activities e.g. Bhoj, social gathering, interactions; and for grain processing, drying when there was dominant agriculture base economy of Kathmandu (RECPHEC, 2016; Maharjan, 2018). Architectural layout planning at that time of such open spaces therefore, would be more focused on cultural reflections on them. Later on, architects and urban planners have been trying to connect places with people while designing it. However, the historic examples and the contemporary trend of open space design in the valley are found unsatisfactory as the built environment is not conducive to creating a better public realm (Chitrakar, 2015). It implies the changing scenario and practice of open space development in the emerging settlements of Kathmandu.
Open spaces in newly growing settlements in KMC have implicitly linked to community identity reflecting their sense of place. Development of open space as an embedded concept with temples, churches, mosques, parks, playgrounds, recreational places, etc. on the premises of new settlement and planned developed areas is not only the architectural design but reflects community identity. However, the open space development in the fringe areas of KMC is more dynamic than the core area as these newly growing settlements are more diverse and heterogeneous in social structures. Uses of open spaces in these societies have been different than those of core areas as the spaces have been mostly using open space as a place for recreation, interaction, community networking, health improvement through yoga, sports, and physical exercises. Besides, the morphology of open spaces among the newly planned development areas poses spacious planning for sports activities such as badminton, table tennis, football, volleyball, etc. Besides, walking routes, rest places, recreational parks, fountains, ponds, temples, greenery, etc. are also considered within such open space development (ADB, 2017). Therefore, the physical attributes and morphology of such public open space in the traditional and new settlements area of KMC are visibly distinct patterns of uses and functions according to social and cultural settings.
Krishna Prasad Timalsina/ People, place, and space: ...Vol. 14: 171-188, 2021

183
Empirical data collected through the field observation from two sites reveals that the uses of public open spaces in core urban areas (dominantly indigenous residents) and fringe areas (dominantly migrants residents) reveal a different scenario. Developing social capital through networking, interactions, communications, and organizing communities’ social and cultural events as well as physical health enhancement through sport, run, walk, yoga, meditations, etc. are the forms of using open space in both settings. Observational data2 reveals that there were 152 visitors encountered at the selected open space from core urban open space and 290 visitors at the selected open space in the fringe urban area. The observational result is that visitors in the core area have been using public open spaces for cultural and religious activities (36.2%), organizing community meetings (21.1%), walk/run/yoga and exercises (18.4%), recreational and entertainment (14.5%) and sports (9.9%). Similarly, people from the fringe area visit open spaces for o r g a n i z i n g c o m m u n i t y meetings (6.9%), walk, run and yoga (41.4%) recreation and entertainment (31%), sports (20.7%). It reveals that there are different patterns of visiting for the use of open spaces in different urban settings in the city (Table 1). The patterns of visit and uses of open space are therefore closely associated with the social and cultural settings of the particular community.
Architects and urban planners have been focusing on the layout designing to open spaces in the newly emerging settlements from a recreational point of view. Their main concerns seem to protect biodiversity, environmental conservation, maintain greenery, and heritage conservation upholding the physical morphology and local cultural
2 Observational data presents the number of visitors per day encountered at the selected sites during the field observation. The researcher was visited these places three times a day (morning, afternoon and evening) to observe the details of visitors' activities and averaged to get the total number of three consecutive days visitors’ data. The number of visitors may vary according to the seasons and the cultural and ritual purposed of the indigenous Newar community because the frequency of cultural and religious activities is more in some specific seasons of Newar communities.
Table 1: Activities Observed at the Urban Open Space
S.No. Used for Core Area Percent Fringe
Area Percent
1 Cultural and religious activities 55 36.2 - -
2Organizing community events and meetings)
32 21.1 20 6.9
3 Walk/run/Yoga and exercises 28 18.4 120 41.4
4 Recreation/entertainment 22 14.5 90 31.0
5 Sport related (Badminton) 15 9.9 60 20.7
Total 152 100 290 100
Source: Field Observation, 2020
Krishna Prasad Timalsina/ People, place, and space: ...Vol. 14: 171-188, 2021

184
landscape of the society. They always care about the urban landscape, morphology, and spacious planning for city dwellers. But it is very important that people have always been giving their root knowledge to create meanings to space and therefore they wish to get a reflection of their cultures, identities, aspirations in the space where they live in. Therefore, the design of open space within the city is also needed to look at social aspects and their identity to be reflective in them. Though there are significant differences in the forms and process of creating places on space between two different urban settings (Core urban settings and new urban settings), these practices are always inherently coming culturally. Bahas and courtyards of core urban areas best illustrate the cultural reflections of the people whereas outer areas reflect some recreational aspects that people prefer to see the open space in the long run.
Conclusion This is a review-based article prepared by reviewing the literature on people, place, and space. The main objective of this paper is to assess urban space through perspectives of people, place, and space by reviewing the major scholarly works. The literature on people, place, space, and sense of place has been reviewed to get insights into how these terminologies are interrelated and how people reflect their behaviors on space. Major works on space and place by the scholars such as Richard Harsthrone (1959), Fred E Lukermann (1964), David Harvey (1969), Henri Lefebvre (1974), Yi-fu Tuan (1974), Edward Relph (1976), and Doreen Massey (2005), etc. who have primarily worked on human-space interactions have been reviewed. Reviews on empirical literature on urban space were done in the urban context to see how people have been creating meaning to space as a place in different settings and contexts (indigenous and migrants) taking the case of KMC. Moreover, the review finding was linked to the ground through the non-participant observation to see how the concepts are reflected in different urban settings. One each public open space from both urban settings (core urban area representing indigenous community and a fringe urban area representing the migrants' community) was observed in three consecutive days to get insights into the public uses and behaviour to create space to place.
The theoretical literature on people, place, and space was discussed much under human geography emphasizing human-space relationships and their dynamics. Theorists have argued that people and places are deep-rooted with place attachment creating a sense of place. People’s actions and behaviors create meaning to any space through their individual and communal behaviors in that space where they live and interact. This interaction creates deep-rooted relationships between people and space to create meaning of space and the meaning varies according to the socio-cultural dynamics of
Krishna Prasad Timalsina/ People, place, and space: ...Vol. 14: 171-188, 2021

185
the society. Society gives meaning to space through its social and cultural contexts. It has been found that communities have been giving meaning to space from the historical period in KMC as the Bahas of core urban areas reflect the cultural identities of local communities (Newar communities). Open spaces in the core urban area of KMC have a typical Newari identity with their cultural sense of place whereas newly growing settlements have been viewing a diverse sense of place focusing on recreation and well-being. But the trend of creating meaning from space into place has been changing over time and it varies according to the social and cultural contexts. Open spaces within the core urban areas have been reflecting as cultural spaces whereas outer areas pose more physical and social reflections. Uses patterns vary in both settings as the core area mostly reveals the cultural uses and fringe areas for physical and social uses. The finding is that people have always been giving their social knowledge to create meanings to space according to their social, cultural settings and it changes over time.
ReferencesADB. (2017). Land pooling projects in Nepal: A consolidated Document. Regional -
Capacity Development Technical Assistance (R-CDTA), ADB/OIE, Kathmandu
Adams, J. D. (2016). Sense of place. The nature of cities. New York: Thunder Bay, Seattle and Ithaca.
Anderson, C. (2016). Public space and the new urban agenda. The journal of public space, Un-habitat-III. I, 1.
Basso, K.H. (1996). Wisdom sits in places: Notes on a Western Apache landscape. In Feld, S. and Basso, K.H. (Eds.), Senses of place (pp. 53-90). Santa Fe: New Mexico.
Campbell, C.J. (2018). Space, place and scale: Human Geography and spatial history. Past and Present. Volume 239, Issue 1, May 2018, Pages e23–245. https://doi.org/10.1093/pastj/gtw006
Chitrakar, R. M. (2006). A study of historic urban squares of Kathmandu Valley. (MUD Dissertation), The University of Hong Kong, Hong Kong.
Chitrakar, R.M. (2015). Transformation of public space in contemporary urban neighborhoods of Kathmandu valley, Nepal: an investigation of changing provision, use and meaning. (Ph.D. Thesis), School of Civil Engineering and Built Environment Faculty of Science and the Engineering Queensland University of Technology.
Krishna Prasad Timalsina/ People, place, and space: ...Vol. 14: 171-188, 2021

186
Goheen, P.G. (1998). Public space and the geography of the modern city. Progress in Human Geography, 22 (4), 479-496.
Hartshorne, R. (1959). Perspective on the nature of geography. Chicago: Rand McNally and Company.
Harvey, D. (1969). Explanation in geography. London: Edward Mold.
Harvey, D. (2006). The political economy of public space. In S. M. Low and N. Smith (Eds), The Politics of Public Space. New York, NY: Rutledge.
Hubbard, P. and Kitchen, R. (eds). (2011). Key thinkers on space and place. London/Thousand Oaks/ Singapore/New Delhi: Sage publication.
KVDA. (2015). Atlas of open space. Kathmandu: Kathmandu Valley Development Authority, Kathmandu.
Lefbvre, H. (1974). The production of space. UK, USA: Blackwell Publishing.
Low, S. and Smith, N. (2005). Introduction: The imperative of public space. In Low, S. and Smith, N. (Eds.), The politics of public space. London: Rutledge.
Lukermann, F. E. (1964). Geography as a formal intellectual discipline and the way in which it contributes to human knowledge. Canadian Geographer 8, 167–172.
Madanipour, A. (2003). Public and Private Spaces of the City. London; New York: Routledge.
Maharjan, S. (2018). How open spaces in Kathmandu Valley are shrinking? Centre for Investigative Journalism (CIJ), retrieved from https://cijnepal.org.np/open-spaces-kathmandu-valley-shrinking/
Massey, D. (2005). For space. London/New Delhi: Sage.
MoHA. (2019). Nepal disaster report. Kathmandu: GoN, Ministry of Home Affairs.
NRC-National Research Council. (1997). Rediscovering geography: new relevance for science and society. National Academic Press.
Peet, R. (1998). Modern geographical thought. London/Thousand Oaks: Wiley-Blackwell Publication.
Pieterse, J. N. (2002). Development theory: deconstruction/reconstruction. London/Thousand Oaks/New Delhi: Sage Publication.
Pokharel, R. P. and Khanal, N. R. (2018). Open space: Typology and distribution in Pokhara Lekhnath metropolitan city. The Geographical Journal of Nepal, 11:
Krishna Prasad Timalsina/ People, place, and space: ...Vol. 14: 171-188, 2021

187
25-44. Central Department of Geography, Tribhuvan University, Kathmandu, Nepal
Pradhan, M. G. (2003). Urban Open Spaces in Kathmandu – Problems and Prospects. Vaastu, 5, 45-46.
Relph, E. (1976). Place and placelessness. London: Pion.
RECPHEC-Resource Centre for Primary Health Care. (2016). A study on public spaces of Kathmandu Metropolitan City for policy revision. Kathmandu: RECHPEC.
Russ, A., Peters, S.J., Krasny, M.E. and Stedman, R.C. (2015). Development of ecological place meaning in New York City. Journal of environmental education, 46(2), 73-93.
Shrestha, B. K., & Shrestha, S. (2006). To Whom It May Concern – Privatization of Public Spaces: A Case of Dharahara – Sundhara Square, Kathmandu. Scitech Nepal, 9(2), 3-22.
Shrestha, M. N. (1981). Nepal's Traditional Settlement: Pattern and Architecture. Journal of Cultural Geography, 1(2), 26-43.
Spreiregn, P.D. (2009). Urban Design, the architecture of towns and cities. Pennsylvania State University: R.E. Krieger Publishing Company.
Stanley, B. W.; Stark, B.L.; Johnston, K.L. and Smith, M.E. (2014). Urban open spaces in historical perspective: a transdisciplinary typology and analysis. E-Journal of Research Gate. Retrieved from https://www.researchgate.net/publication/268208067.
Timalsina, K. P. (2011). Struggling for livelihood: making a living in the urban informal sector. Germany: VDM Vorlag Publisher.
Timalsina, K.P. (2020a). Public open space in crises: Appraisal and observation from metropolitan Kathmandu. Journal of Geography and Regional Planning, 13 (4): 77-90. DOI: 10.5897/JGRP2020.0797.
Timalsina, K.P. (2020b). Urban Open Space as a Place for Social and Physical Well-being: Narratives from two Different Urban Settings of Kathmandu, Nepal. Journal of Geographical Research, (upcoming).
Tiwari, S.R. (2001). The ancient settlements of Kathmandu Valley. Kathmandu: Centre for Nepal and Asian Studies.
Tuan, Y.-F. (1977). Space and place: The perspective of experience. University of Minnesota Press.
Krishna Prasad Timalsina/ People, place, and space: ...Vol. 14: 171-188, 2021

188
UN-Habitat. (2018). Developing public space and land values in cities and Neighborhoods (discussion paper). Kathmandu: UN-Habitat.
Walkie, R. and George, F.R. (2016). Sense of Place. In Warf, B. (eds). Encyclopedia of Geography, DOI: http://dx.doi.org/10.4135/9781412939591.n1022.
Wooley, H. (2003). Urban open space. London and New York: Tailor and Francis.
Krishna Prasad Timalsina/ People, place, and space: ...Vol. 14: 171-188, 2021