GCSE Geography - Supporting the delivery of geographical ...
10
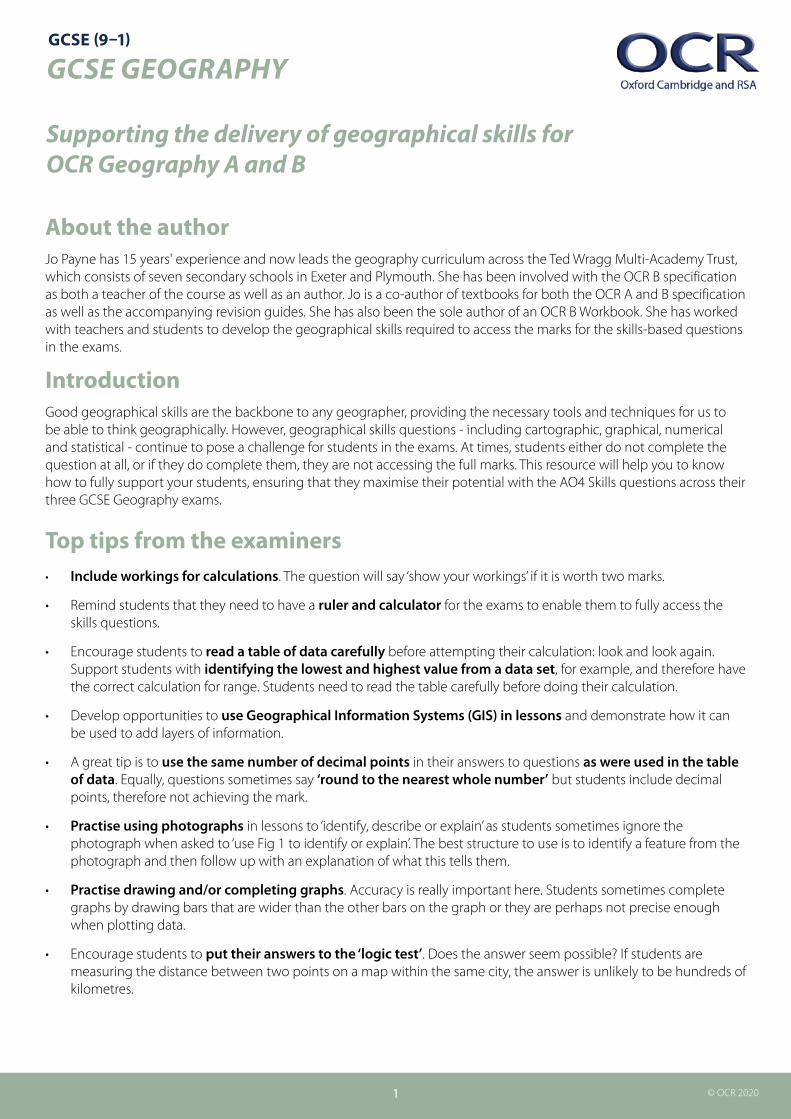
1 © OCR 2020 GCSE (9–1) GCSE GEOGRAPHY Supporting the delivery of geographical skills for OCR Geography A and B About the author Jo Payne has 15 years' experience and now leads the geography curriculum across the Ted Wragg Multi-Academy Trust, which consists of seven secondary schools in Exeter and Plymouth. She has been involved with the OCR B specification as both a teacher of the course as well as an author. Jo is a co-author of textbooks for both the OCR A and B specification as well as the accompanying revision guides. She has also been the sole author of an OCR B Workbook. She has worked with teachers and students to develop the geographical skills required to access the marks for the skills-based questions in the exams. Introduction Good geographical skills are the backbone to any geographer, providing the necessary tools and techniques for us to be able to think geographically. However, geographical skills questions - including cartographic, graphical, numerical and statistical - continue to pose a challenge for students in the exams. At times, students either do not complete the question at all, or if they do complete them, they are not accessing the full marks. This resource will help you to know how to fully support your students, ensuring that they maximise their potential with the AO4 Skills questions across their three GCSE Geography exams. Top tips from the examiners • Include workings for calculations. The question will say ‘show your workings’ if it is worth two marks. • Remind students that they need to have a ruler and calculator for the exams to enable them to fully access the skills questions. • Encourage students to read a table of data carefully before attempting their calculation: look and look again. Support students with identifying the lowest and highest value from a data set, for example, and therefore have the correct calculation for range. Students need to read the table carefully before doing their calculation. • Develop opportunities to use Geographical Information Systems (GIS) in lessons and demonstrate how it can be used to add layers of information. • A great tip is to use the same number of decimal points in their answers to questions as were used in the table of data. Equally, questions sometimes say ‘round to the nearest whole number’ but students include decimal points, therefore not achieving the mark. • Practise using photographs in lessons to ‘identify, describe or explain’ as students sometimes ignore the photograph when asked to ‘use Fig 1 to identify or explain’. The best structure to use is to identify a feature from the photograph and then follow up with an explanation of what this tells them. • Practise drawing and/or completing graphs. Accuracy is really important here. Students sometimes complete graphs by drawing bars that are wider than the other bars on the graph or they are perhaps not precise enough when plotting data. • Encourage students to put their answers to the ‘logic test’. Does the answer seem possible? If students are measuring the distance between two points on a map within the same city, the answer is unlikely to be hundreds of kilometres.
-
Upload
khangminh22 -
Category
Documents
-
view
7 -
download
0
Transcript of GCSE Geography - Supporting the delivery of geographical ...
1 © OCR 2020
GCSE (9–1)
GCSE GEOGRAPHY
Supporting the delivery of geographical skills for OCR Geography A and B
About the authorJo Payne has 15 years' experience and now leads the geography curriculum across the Ted Wragg Multi-Academy Trust, which consists of seven secondary schools in Exeter and Plymouth. She has been involved with the OCR B specification as both a teacher of the course as well as an author. Jo is a co-author of textbooks for both the OCR A and B specification as well as the accompanying revision guides. She has also been the sole author of an OCR B Workbook. She has worked with teachers and students to develop the geographical skills required to access the marks for the skills-based questions in the exams.
IntroductionGood geographical skills are the backbone to any geographer, providing the necessary tools and techniques for us to be able to think geographically. However, geographical skills questions - including cartographic, graphical, numerical and statistical - continue to pose a challenge for students in the exams. At times, students either do not complete the question at all, or if they do complete them, they are not accessing the full marks. This resource will help you to know how to fully support your students, ensuring that they maximise their potential with the AO4 Skills questions across their three GCSE Geography exams.
Top tips from the examiners• Include workings for calculations. The question will say ‘show your workings’ if it is worth two marks.
• Remind students that they need to have a ruler and calculator for the exams to enable them to fully access the skills questions.
• Encourage students to read a table of data carefully before attempting their calculation: look and look again. Support students with identifying the lowest and highest value from a data set, for example, and therefore have the correct calculation for range. Students need to read the table carefully before doing their calculation.
• Develop opportunities to use Geographical Information Systems (GIS) in lessons and demonstrate how it can be used to add layers of information.
• A great tip is to use the same number of decimal points in their answers to questions as were used in the table of data. Equally, questions sometimes say ‘round to the nearest whole number’ but students include decimal points, therefore not achieving the mark.
• Practise using photographs in lessons to ‘identify, describe or explain’ as students sometimes ignore the photograph when asked to ‘use Fig 1 to identify or explain’. The best structure to use is to identify a feature from the photograph and then follow up with an explanation of what this tells them.
• Practise drawing and/or completing graphs. Accuracy is really important here. Students sometimes complete graphs by drawing bars that are wider than the other bars on the graph or they are perhaps not precise enough when plotting data.
• Encourage students to put their answers to the ‘logic test’. Does the answer seem possible? If students are measuring the distance between two points on a map within the same city, the answer is unlikely to be hundreds of kilometres.
Supporting the delivery of geographical skills for OCR Geography A and B
2
GCSE Geography A and B
© OCR 2020
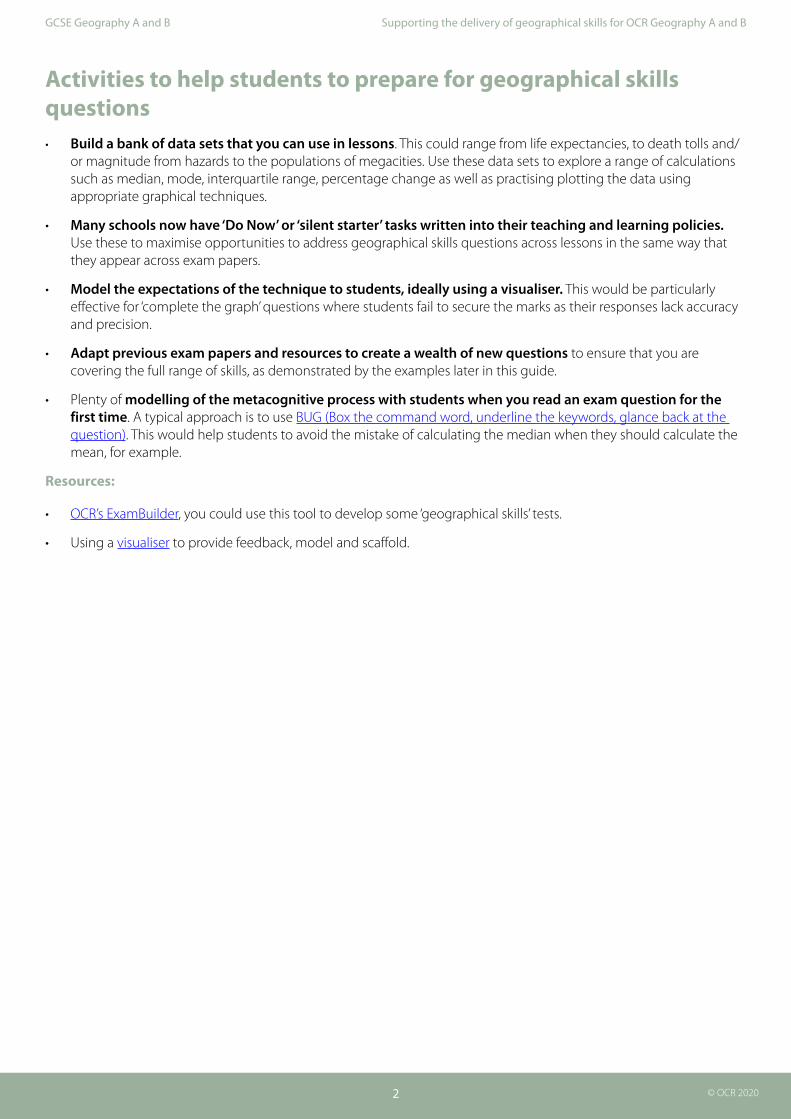
Activities to help students to prepare for geographical skills questions• Build a bank of data sets that you can use in lessons. This could range from life expectancies, to death tolls and/
or magnitude from hazards to the populations of megacities. Use these data sets to explore a range of calculations such as median, mode, interquartile range, percentage change as well as practising plotting the data using appropriate graphical techniques.
• Many schools now have ‘Do Now’ or ‘silent starter’ tasks written into their teaching and learning policies. Use these to maximise opportunities to address geographical skills questions across lessons in the same way that they appear across exam papers.
• Model the expectations of the technique to students, ideally using a visualiser. This would be particularly effective for ‘complete the graph’ questions where students fail to secure the marks as their responses lack accuracy and precision.
• Adapt previous exam papers and resources to create a wealth of new questions to ensure that you are covering the full range of skills, as demonstrated by the examples later in this guide.
• Plenty of modelling of the metacognitive process with students when you read an exam question for the first time. A typical approach is to use BUG (Box the command word, underline the keywords, glance back at the question). This would help students to avoid the mistake of calculating the median when they should calculate the mean, for example.
Resources:
• OCR’s ExamBuilder, you could use this tool to develop some ‘geographical skills’ tests.
• Using a visualiser to provide feedback, model and scaffold.
Supporting the delivery of geographical skills for OCR Geography A and B
3
GCSE Geography A and B
© OCR 2020
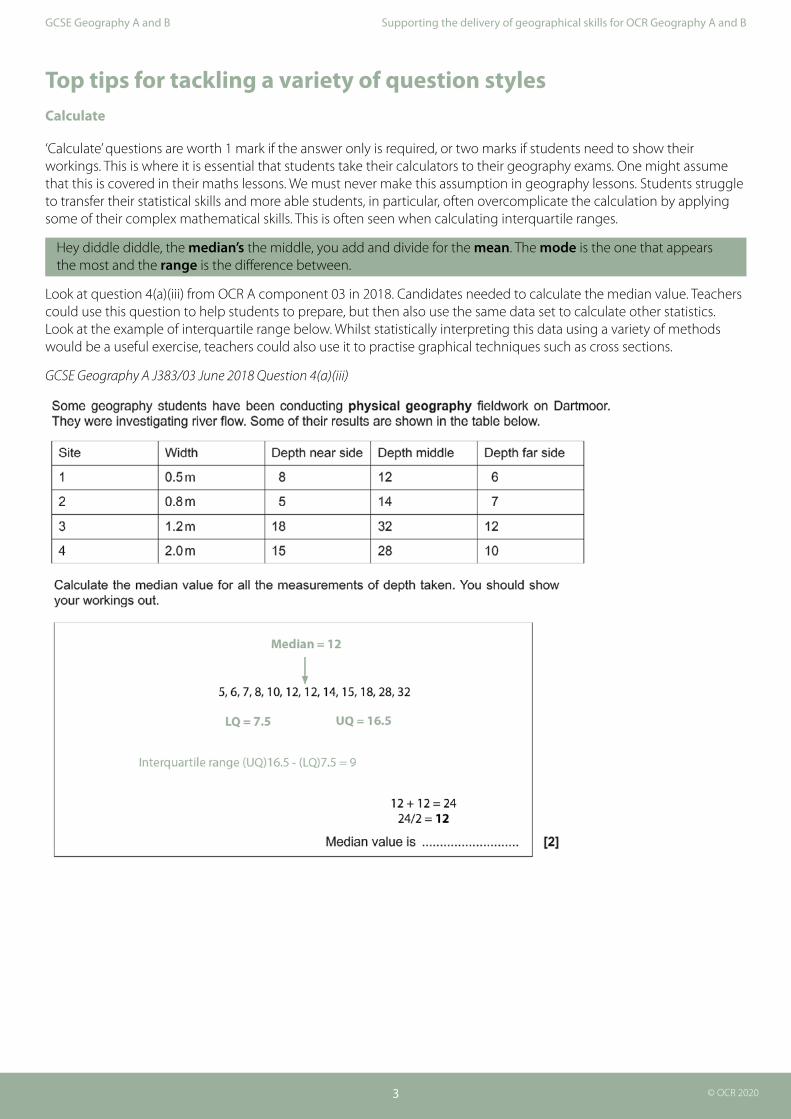
Top tips for tackling a variety of question stylesCalculate
‘Calculate’ questions are worth 1 mark if the answer only is required, or two marks if students need to show their workings. This is where it is essential that students take their calculators to their geography exams. One might assume that this is covered in their maths lessons. We must never make this assumption in geography lessons. Students struggle to transfer their statistical skills and more able students, in particular, often overcomplicate the calculation by applying some of their complex mathematical skills. This is often seen when calculating interquartile ranges.
Hey diddle diddle, the median’s the middle, you add and divide for the mean. The mode is the one that appears the most and the range is the difference between.
Look at question 4(a)(iii) from OCR A component 03 in 2018. Candidates needed to calculate the median value. Teachers could use this question to help students to prepare, but then also use the same data set to calculate other statistics. Look at the example of interquartile range below. Whilst statistically interpreting this data using a variety of methods would be a useful exercise, teachers could also use it to practise graphical techniques such as cross sections.
GCSE Geography A J383/03 June 2018 Question 4(a)(iii)
Supporting the delivery of geographical skills for OCR Geography A and B
4
GCSE Geography A and B
© OCR 2020
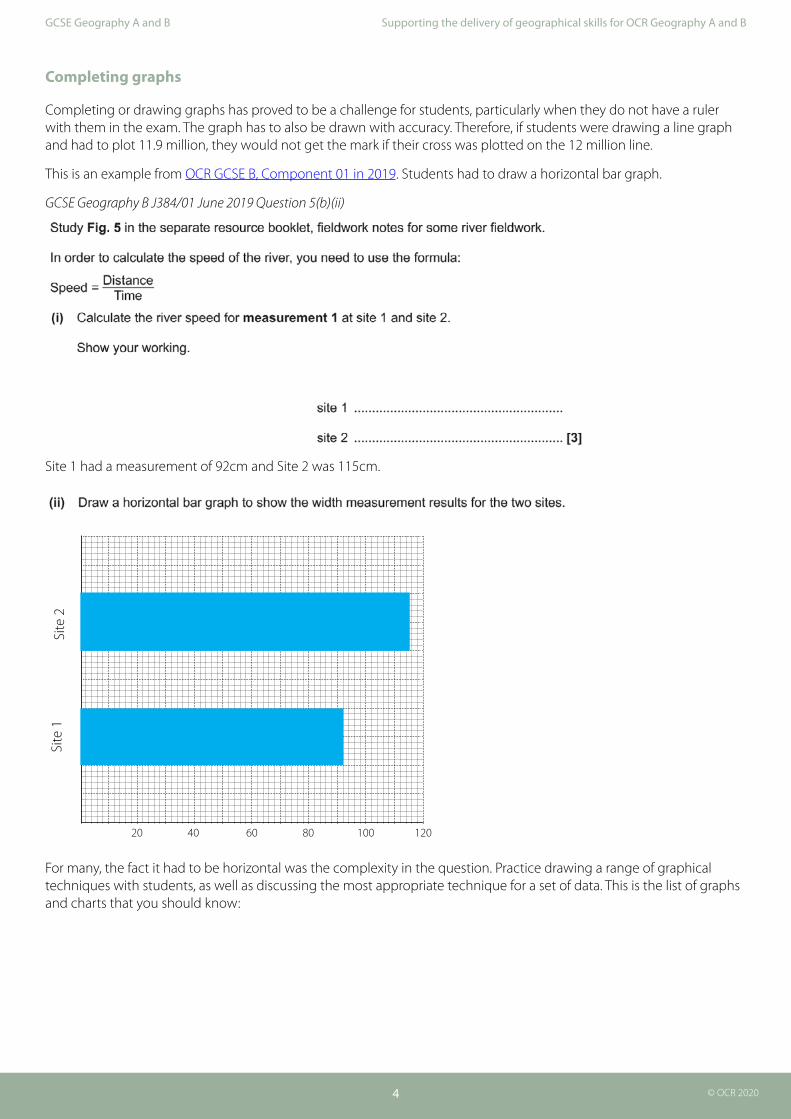
Completing graphs
Completing or drawing graphs has proved to be a challenge for students, particularly when they do not have a ruler with them in the exam. The graph has to also be drawn with accuracy. Therefore, if students were drawing a line graph and had to plot 11.9 million, they would not get the mark if their cross was plotted on the 12 million line.
This is an example from OCR GCSE B, Component 01 in 2019. Students had to draw a horizontal bar graph.
GCSE Geography B J384/01 June 2019 Question 5(b)(ii)
Site 1 had a measurement of 92cm and Site 2 was 115cm.
For many, the fact it had to be horizontal was the complexity in the question. Practice drawing a range of graphical techniques with students, as well as discussing the most appropriate technique for a set of data. This is the list of graphs and charts that you should know:
20 40 60 80 100 120
Site
1Si
te 2
Supporting the delivery of geographical skills for OCR Geography A and B
5
GCSE Geography A and B
© OCR 2020
Graphs and charts students need to study for both OCR A and OCR B:
• Bar graphs (horizonal, vertical and divided)
• Histograms (with equal class interval)
• Line graphs
• Scatter graphs (including best fit line)
• Dispersion graphs
• Pie charts
• Climate graphs
• Proportional symbols
• Pictograms
• Cross-sections
• Population pyramids
• Radial graphs
• Rose charts
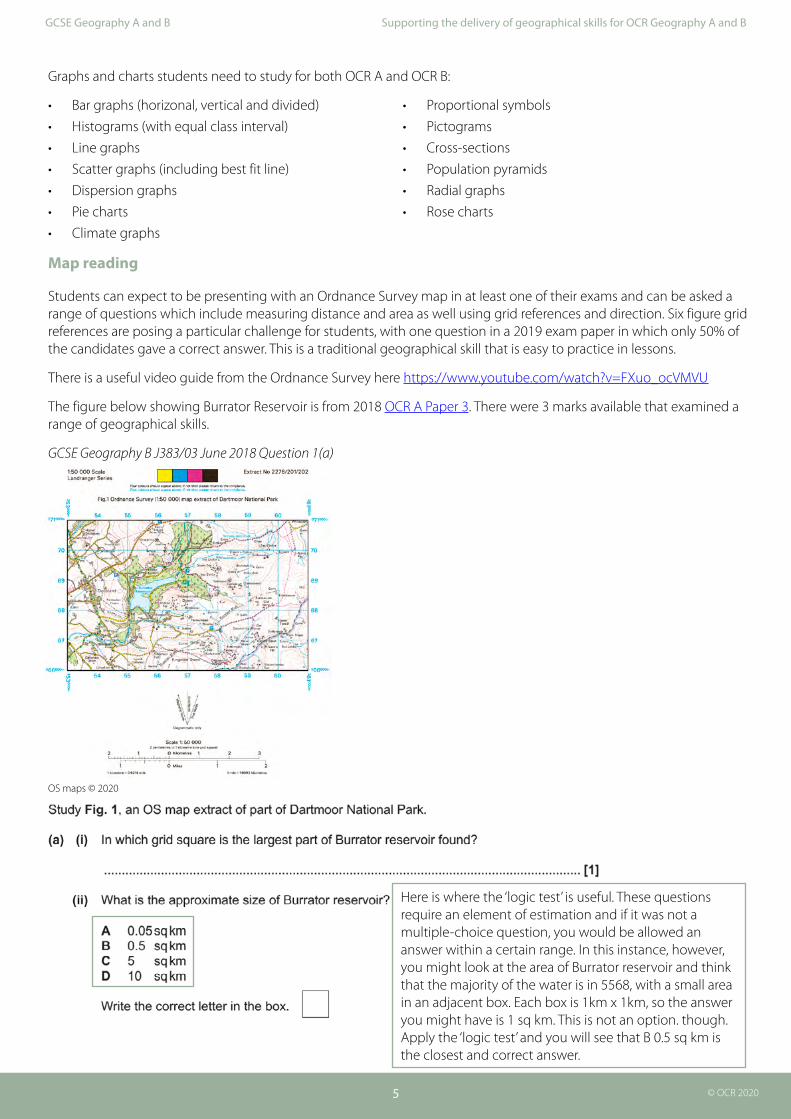
Map reading
Students can expect to be presenting with an Ordnance Survey map in at least one of their exams and can be asked a range of questions which include measuring distance and area as well using grid references and direction. Six figure grid references are posing a particular challenge for students, with one question in a 2019 exam paper in which only 50% of the candidates gave a correct answer. This is a traditional geographical skill that is easy to practice in lessons.
There is a useful video guide from the Ordnance Survey here https://www.youtube.com/watch?v=FXuo_ocVMVU
The figure below showing Burrator Reservoir is from 2018 OCR A Paper 3. There were 3 marks available that examined a range of geographical skills.
GCSE Geography B J383/03 June 2018 Question 1(a)
OS maps © 2020
Here is where the ‘logic test’ is useful. These questions require an element of estimation and if it was not a multiple-choice question, you would be allowed an answer within a certain range. In this instance, however, you might look at the area of Burrator reservoir and think that the majority of the water is in 5568, with a small area in an adjacent box. Each box is 1km x 1km, so the answer you might have is 1 sq km. This is not an option. though. Apply the ‘logic test’ and you will see that B 0.5 sq km is the closest and correct answer.

Supporting the delivery of geographical skills for OCR Geography A and B
6
GCSE Geography A and B
© OCR 2020
Although these were the questions in the exam, make use of old resource booklet material as an opportunity to practice more skills. You could add the following questions:
a) What is the six-figure grid reference of the church at Meavy?
b) What is the height of the land at Crazy Well Pool at 582705?
c) Draw a cross section from (choose two points on the map)?
d) Measure the distance from Down Tor to Sheeps Tor
e) Identify one human and one physical feature on the map
f ) What is the four-figure grid reference for Eastern Tor?
g) Describe how the shape of the land changes from Sheeps Tor to Down Tor
h) How high is the spot height in 5766?
Ordnance Survey resources: https://www.ordnancesurvey.co.uk/education/teacher-resources
Interpreting photographs and graphs
Practising annotating photographs will help students to identify key pieces of geographical evidence and to apply their knowledge to a real place. This will give students the best chance of securing full marks when they have a question that says ‘identify and explain’ for 4 marks in relation to a figure. They secure 1 mark for identifying a feature in the photograph and another for explaining what it means. Look at the photograph below with some possible annotations you could use. This could also be done with an OS maps extract.
Study Figure 1 showing Old Harry Rocks in Dorset. Identify and explain the erosion processes involved in it formation (4 marks)
Limestone or chalk headland – react with seawater to erode through solution (corrosion)
Loose, eroded rock material can be used as ammunition being hurled at the cliff face by waves, known as abrasion
Arch is likely to have been formed by hydraulic action, with air being forced and compressed into cracks and crevices by the waves, breaking fragments away.
Supporting the delivery of geographical skills for OCR Geography A and B
7
GCSE Geography A and B
© OCR 2020
Links to other resources on geographical skillsThe OCR Geography website has some excellent interactive resources (ArcGIS – Storymaps) to support students with geographical skills, including:
• Maps to be studied at GCSE http://ocr.maps.arcgis.com/apps/MapJournal/index.html?appid=b56d896f39194809b47f233ba89f9271
• Graphs and charts to be studied at GCSE https://ocr.maps.arcgis.com/apps/MapSeries/index.html?appid=fa44b6cbad7c41ea95675f46669502d8
Teaching resources and student activities which can be embedded to support the delivery of geographical skills:
https://www.ocr.org.uk/Images/554157-embedding-geographical-skills-activities.docx
https://www.ocr.org.uk/Images/557847-embedding-geographical-skills-os-maps-learner-activity.docx
GCSE Geography skills handbook. This resource works through the geographical skills in the geography specifications and includes student activities throughout.
BBC Bitesize - geographical skills: https://www.bbc.co.uk/bitesize/topics/zpdrbk7
A range of free resources to download and use with students (registration required) https://www.teachitgeography.co.uk/skills
Data sets to use for geographical skills activities:
• Office of National Statistics https://www.ons.gov.uk
• Hydrology/River flow data from the Environment Agency https://environment.data.gov.uk/hydrology/landing
• Human Development Data from the UN http://hdr.undp.org/en/data
• World Bank development data on countries https://data.worldbank.org/country
• 10 free GIS Data Sources https://gisgeography.com/best-free-gis-data-sources-raster-vector/
Supporting the delivery of geographical skills for OCR Geography A and B
8
GCSE Geography A and B
© OCR 2020
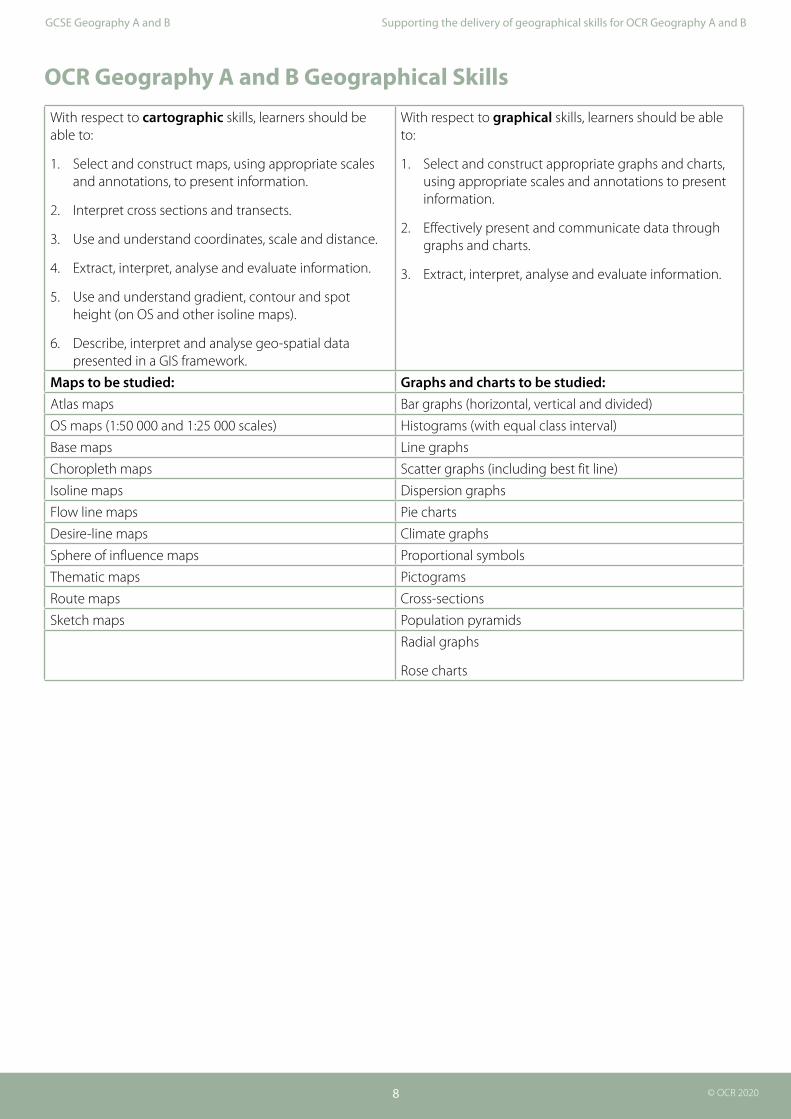
OCR Geography A and B Geographical Skills
With respect to cartographic skills, learners should be able to:
1. Select and construct maps, using appropriate scales and annotations, to present information.
2. Interpret cross sections and transects.
3. Use and understand coordinates, scale and distance.
4. Extract, interpret, analyse and evaluate information.
5. Use and understand gradient, contour and spot height (on OS and other isoline maps).
6. Describe, interpret and analyse geo-spatial data presented in a GIS framework.
With respect to graphical skills, learners should be able to:
1. Select and construct appropriate graphs and charts, using appropriate scales and annotations to present information.
2. Effectively present and communicate data through graphs and charts.
3. Extract, interpret, analyse and evaluate information.
Maps to be studied: Graphs and charts to be studied:Atlas maps Bar graphs (horizontal, vertical and divided)
OS maps (1:50 000 and 1:25 000 scales) Histograms (with equal class interval)
Base maps Line graphs
Choropleth maps Scatter graphs (including best fit line)
Isoline maps Dispersion graphs
Flow line maps Pie charts
Desire-line maps Climate graphs
Sphere of influence maps Proportional symbols
Thematic maps Pictograms
Route maps Cross-sections
Sketch maps Population pyramids
Radial graphs
Rose charts
Supporting the delivery of geographical skills for OCR Geography A and B
9
GCSE Geography A and B
© OCR 2020
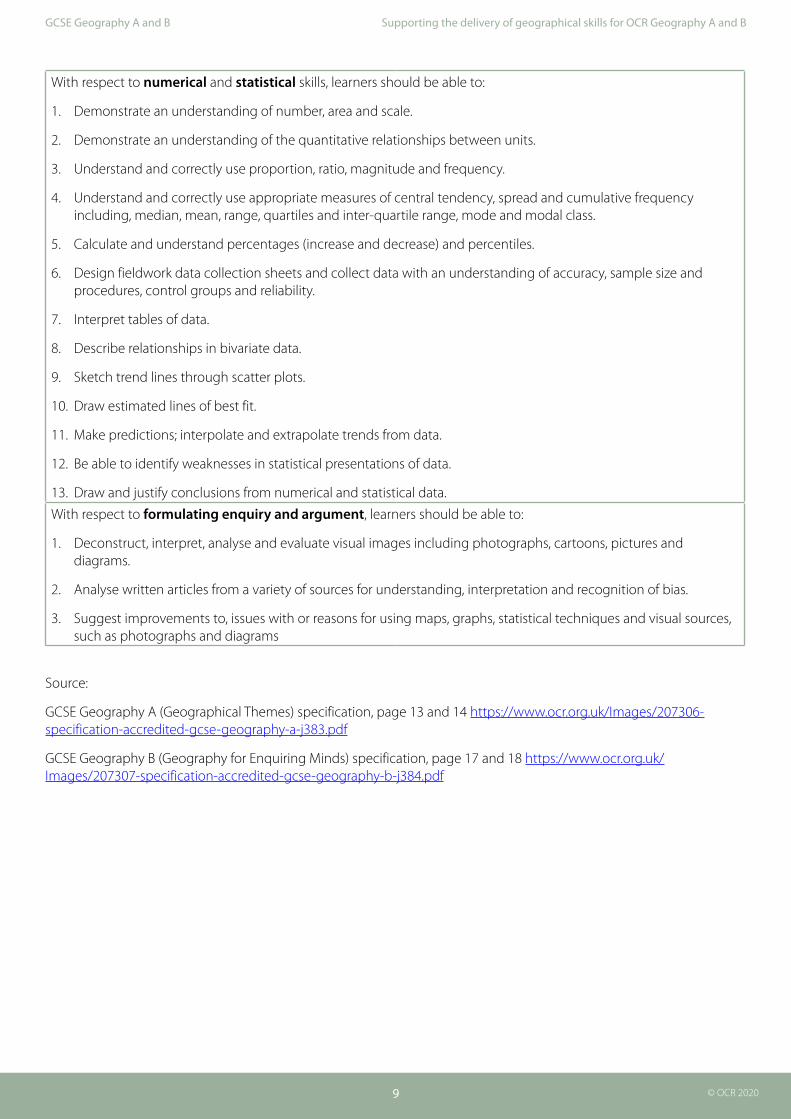
With respect to numerical and statistical skills, learners should be able to:
1. Demonstrate an understanding of number, area and scale.
2. Demonstrate an understanding of the quantitative relationships between units.
3. Understand and correctly use proportion, ratio, magnitude and frequency.
4. Understand and correctly use appropriate measures of central tendency, spread and cumulative frequency including, median, mean, range, quartiles and inter-quartile range, mode and modal class.
5. Calculate and understand percentages (increase and decrease) and percentiles.
6. Design fieldwork data collection sheets and collect data with an understanding of accuracy, sample size and procedures, control groups and reliability.
7. Interpret tables of data.
8. Describe relationships in bivariate data.
9. Sketch trend lines through scatter plots.
10. Draw estimated lines of best fit.
11. Make predictions; interpolate and extrapolate trends from data.
12. Be able to identify weaknesses in statistical presentations of data.
13. Draw and justify conclusions from numerical and statistical data.
With respect to formulating enquiry and argument, learners should be able to:
1. Deconstruct, interpret, analyse and evaluate visual images including photographs, cartoons, pictures and diagrams.
2. Analyse written articles from a variety of sources for understanding, interpretation and recognition of bias.
3. Suggest improvements to, issues with or reasons for using maps, graphs, statistical techniques and visual sources, such as photographs and diagrams
Source:
GCSE Geography A (Geographical Themes) specification, page 13 and 14 https://www.ocr.org.uk/Images/207306-specification-accredited-gcse-geography-a-j383.pdf
GCSE Geography B (Geography for Enquiring Minds) specification, page 17 and 18 https://www.ocr.org.uk/Images/207307-specification-accredited-gcse-geography-b-j384.pdf
OCR Resources: the small print
OCR’s resources are provided to support the delivery of OCR qualifications, but in no way constitute an endorsed teaching method that is required by OCR. Whilst every effort is made to ensure the accuracy of the content, OCR cannot be held responsible for any errors or omissions within these resources. We update our resources on a regular basis, so please check the OCR website to ensure you have the most up to date version.
This resource may be freely copied and distributed, as long as the OCR logo and this small print remain intact and OCR is acknowledged as the originator of this work.
Our documents are updated over time. Whilst every effort is made to check all documents, there may be contradictions between published support and the specification, therefore please use the information on the latest specification at all times. Where changes are made to specifications these will be indicated within the document, there will be a new version number indicated, and a summary of the changes. If you do notice a discrepancy between the specification and a resource please contact us at: [email protected].
OCR acknowledges the use of the following content: Page 7 Old Harry Rocks, Dorset, sannawicks/Getty Images.com
Whether you already offer OCR qualifications, are new to OCR, or are considering switching from your current provider/awarding organisation, you can request more information by completing the Expression of Interest form which can be found here: www.ocr.org.uk/expression-of-interest
Please get in touch if you want to discuss the accessibility of resources we offer to support delivery of our qualifications: [email protected]
Looking for a resource?There is now a quick and easy search tool to help find free resources for your qualification:
www.ocr.org.uk/i-want-to/find-resources/
OCR is part of Cambridge Assessment, a department of the University of Cambridge. For staff training purposes and as part of our quality assurance programme your call may be recorded or monitored.
© OCR 2020 Oxford Cambridge and RSA Examinations is a Company Limited by Guarantee. Registered in England. Registered office The Triangle Building, Shaftesbury Road, Cambridge, CB2 8EA. Registered company number 3484466. OCR is an exempt charity.
Need to get in touch?If you ever have any questions about OCR qualifications or services (including administration, logistics and teaching) please feel free to get in touch with our Customer Support Centre.
General qualificationsTelephone 01223 553998Facsimile 01223 552627Email [email protected]
www.ocr.org.uk
Did
you
kno
w?