Geography - OCR
41
GCSE 2012 Geography B Exemplar Candidate Work Settlement Version 1 October 2013 www.ocr.org.uk/gcse2012 Geography
-
Upload
khangminh22 -
Category
Documents
-
view
0 -
download
0
Transcript of Geography - OCR
GCSE 2012
Geography B Exemplar Candidate Work Settlement
Version 1 October 2013
www.ocr.org.uk/gcse2012
Geography
CONTENTSQuestion 3
Exemplar Candidate Work 4
Assessor Comments 39
OCR Resources: the small printOCR’s resources are provided to support the teaching of OCR specifications, but in no way constitute an endorsed teaching method that is required by the Board and the decision to use them lies with the individual teacher. Whilst every effort is made to ensure the accuracy of the content, OCR cannot be held responsible for any errors or omissions within these resources.
© OCR 2013 - This resource may be freely copied and distributed, as long as the OCR logo and this message remain intact and OCR is acknowledged as the originator of this work. OCR acknowledges the use of the following content:Page 5 and 6 maps: 2013 Google maps
To give us feedback on, or ideas about the OCR resources you have used, email [email protected]
3WWW.OCR.ORG.UK
GCSE GEOGRAPHY B EXEMPLAR CANDIDATE WORK
Settlement:
How and why has the provision of goods and retail services in Bath City Centre changed over time?
4 WWW.OCR.ORG.UK
GCSE GEOGRAPHY B EXEMPLAR CANDIDATE WORK
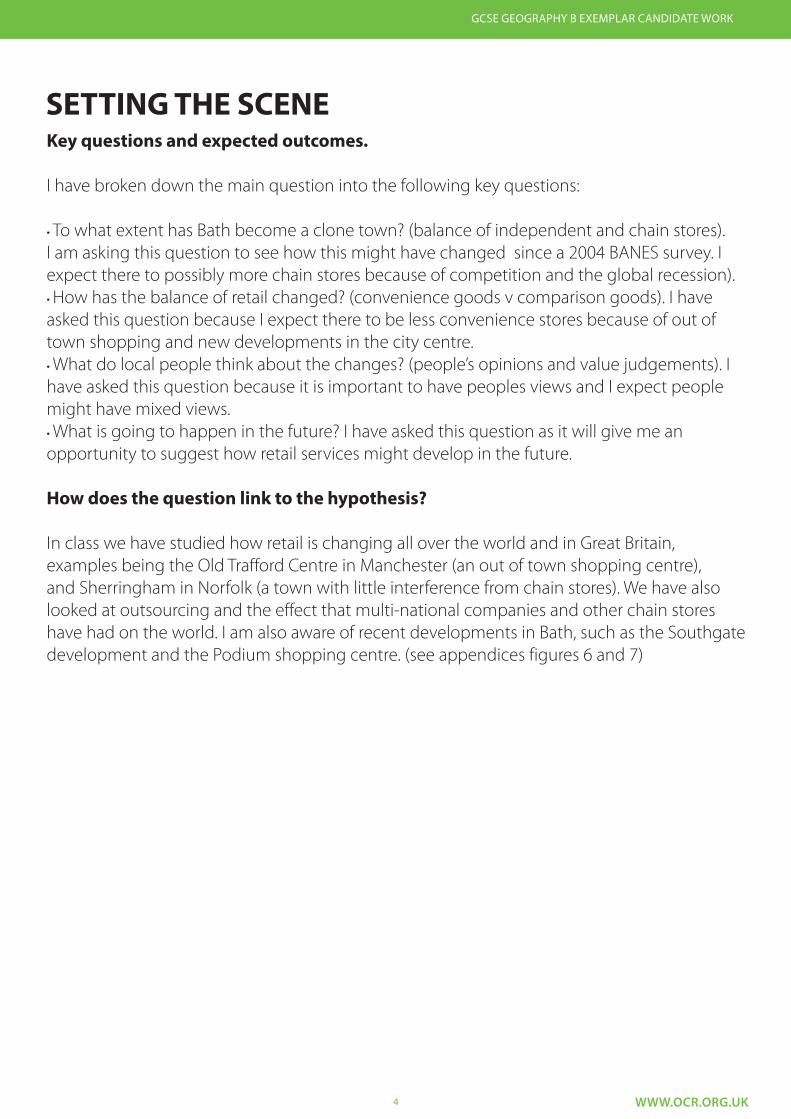
SETTING THE SCENEKey questions and expected outcomes.
I have broken down the main question into the following key questions:
• To what extent has Bath become a clone town? (balance of independent and chain stores). I am asking this question to see how this might have changed since a 2004 BANES survey. I expect there to possibly more chain stores because of competition and the global recession).• How has the balance of retail changed? (convenience goods v comparison goods). I have asked this question because I expect there to be less convenience stores because of out of town shopping and new developments in the city centre.• What do local people think about the changes? (people’s opinions and value judgements). I have asked this question because it is important to have peoples views and I expect people might have mixed views.• What is going to happen in the future? I have asked this question as it will give me an opportunity to suggest how retail services might develop in the future.
How does the question link to the hypothesis?
In class we have studied how retail is changing all over the world and in Great Britain, examples being the Old Trafford Centre in Manchester (an out of town shopping centre), and Sherringham in Norfolk (a town with little interference from chain stores). We have also looked at outsourcing and the effect that multi-national companies and other chain stores have had on the world. I am also aware of recent developments in Bath, such as the Southgate development and the Podium shopping centre. (see appendices figures 6 and 7)
5WWW.OCR.ORG.UK
GCSE GEOGRAPHY B EXEMPLAR CANDIDATE WORK
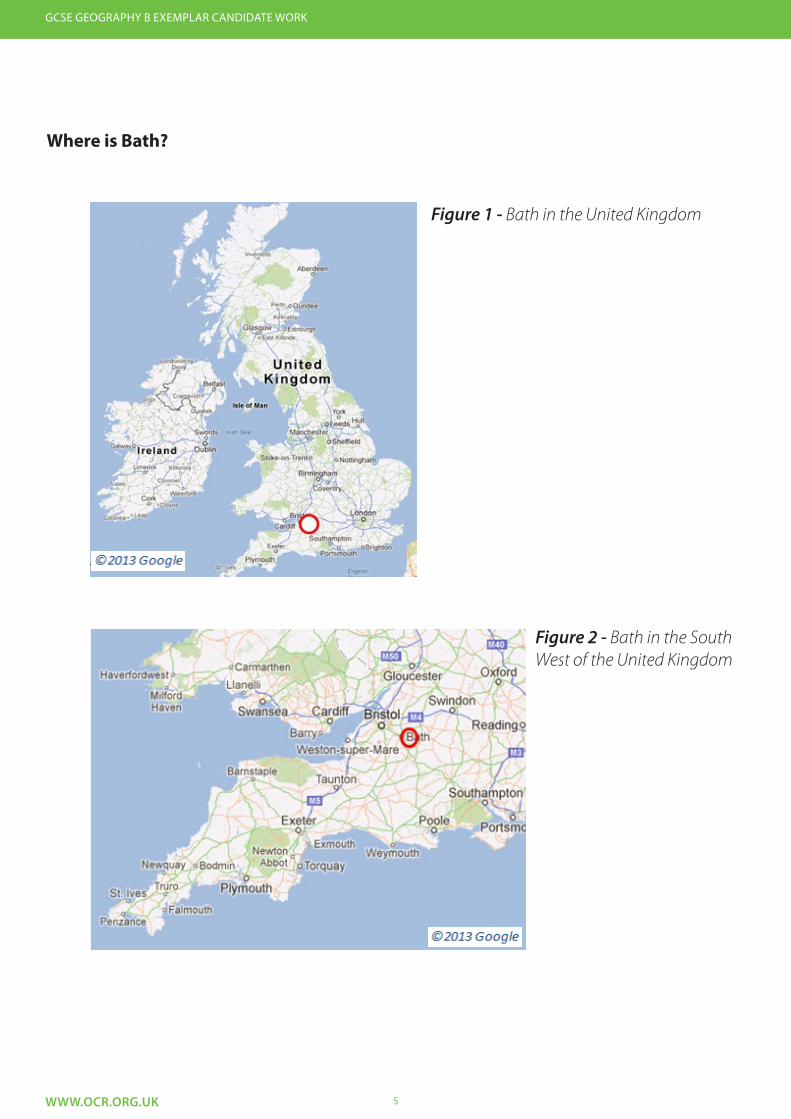
Where is Bath?
Figure 1 - Bath in the United Kingdom
Figure 2 - Bath in the South West of the United Kingdom

6 WWW.OCR.ORG.UK
GCSE GEOGRAPHY B EXEMPLAR CANDIDATE WORK
Where is Bath?
Figure 3 - Bath and the surrounding rural area
Figure 4 - Bath’s CBD
Figure 5 - Study area
7WWW.OCR.ORG.UK
GCSE GEOGRAPHY B EXEMPLAR CANDIDATE WORK
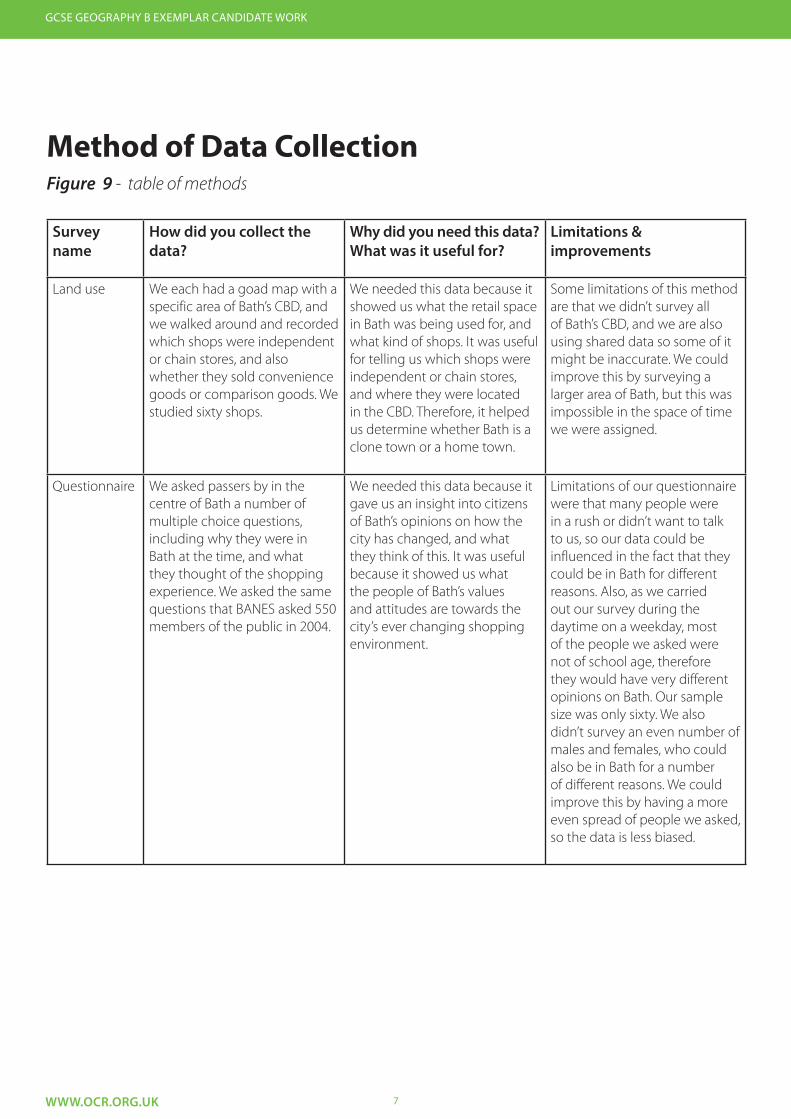
Method of Data CollectionFigure 9 - table of methods
Survey name
How did you collect the data?
Why did you need this data? What was it useful for?
Limitations & improvements
Land use We each had a goad map with a specific area of Bath’s CBD, and we walked around and recorded which shops were independent or chain stores, and also whether they sold convenience goods or comparison goods. We studied sixty shops.
We needed this data because it showed us what the retail space in Bath was being used for, and what kind of shops. It was useful for telling us which shops were independent or chain stores, and where they were located in the CBD. Therefore, it helped us determine whether Bath is a clone town or a home town.
Some limitations of this method are that we didn’t survey all of Bath’s CBD, and we are also using shared data so some of it might be inaccurate. We could improve this by surveying a larger area of Bath, but this was impossible in the space of time we were assigned.
Questionnaire We asked passers by in the centre of Bath a number of multiple choice questions, including why they were in Bath at the time, and what they thought of the shopping experience. We asked the same questions that BANES asked 550 members of the public in 2004.
We needed this data because it gave us an insight into citizens of Bath’s opinions on how the city has changed, and what they think of this. It was useful because it showed us what the people of Bath’s values and attitudes are towards the city’s ever changing shopping environment.
Limitations of our questionnaire were that many people were in a rush or didn’t want to talk to us, so our data could be influenced in the fact that they could be in Bath for different reasons. Also, as we carried out our survey during the daytime on a weekday, most of the people we asked were not of school age, therefore they would have very different opinions on Bath. Our sample size was only sixty. We also didn’t survey an even number of males and females, who could also be in Bath for a number of different reasons. We could improve this by having a more even spread of people we asked, so the data is less biased.
8 WWW.OCR.ORG.UK
GCSE GEOGRAPHY B EXEMPLAR CANDIDATE WORK
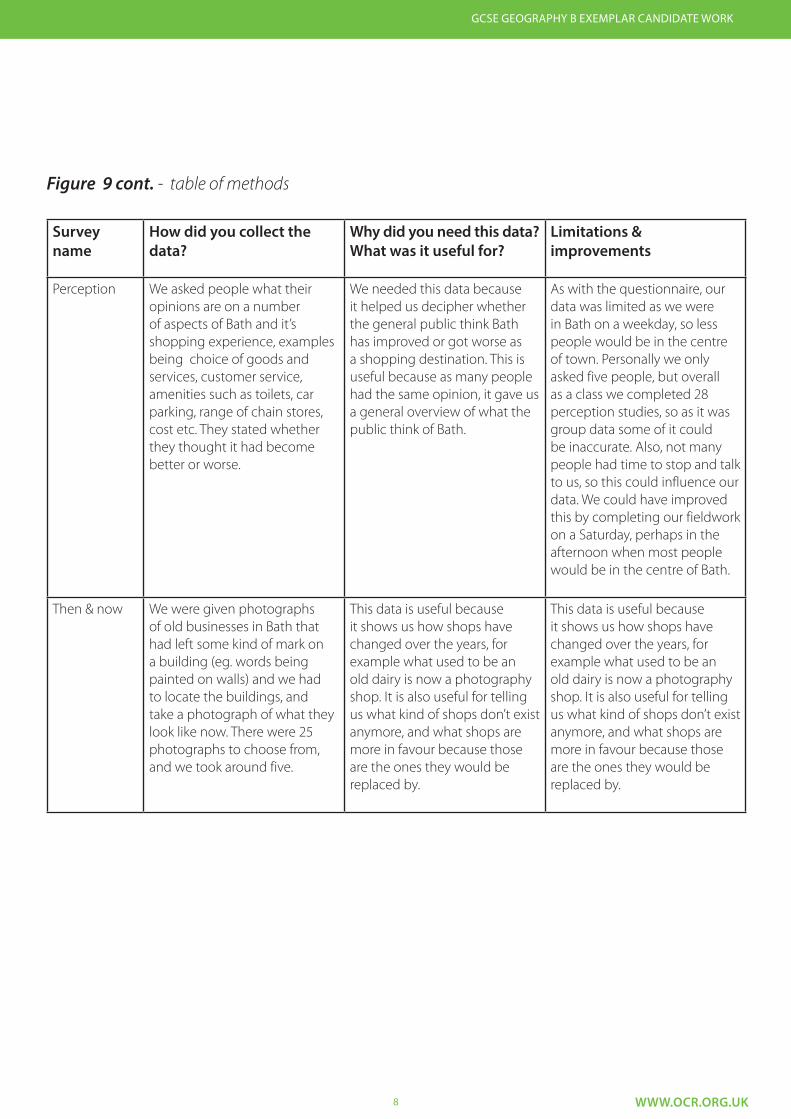
Figure 9 cont. - table of methods
Survey name
How did you collect the data?
Why did you need this data? What was it useful for?
Limitations & improvements
Perception We asked people what their opinions are on a number of aspects of Bath and it’s shopping experience, examples being choice of goods and services, customer service, amenities such as toilets, car parking, range of chain stores, cost etc. They stated whether they thought it had become better or worse.
We needed this data because it helped us decipher whether the general public think Bath has improved or got worse as a shopping destination. This is useful because as many people had the same opinion, it gave us a general overview of what the public think of Bath.
As with the questionnaire, our data was limited as we were in Bath on a weekday, so less people would be in the centre of town. Personally we only asked five people, but overall as a class we completed 28 perception studies, so as it was group data some of it could be inaccurate. Also, not many people had time to stop and talk to us, so this could influence our data. We could have improved this by completing our fieldwork on a Saturday, perhaps in the afternoon when most people would be in the centre of Bath.
Then & now We were given photographs of old businesses in Bath that had left some kind of mark on a building (eg. words being painted on walls) and we had to locate the buildings, and take a photograph of what they look like now. There were 25 photographs to choose from, and we took around five.
This data is useful because it shows us how shops have changed over the years, for example what used to be an old dairy is now a photography shop. It is also useful for telling us what kind of shops don’t exist anymore, and what shops are more in favour because those are the ones they would be replaced by.
This data is useful because it shows us how shops have changed over the years, for example what used to be an old dairy is now a photography shop. It is also useful for telling us what kind of shops don’t exist anymore, and what shops are more in favour because those are the ones they would be replaced by.
9WWW.OCR.ORG.UK
GCSE GEOGRAPHY B EXEMPLAR CANDIDATE WORK
Figure 9 cont. - table of methods
Survey name
How did you collect the data?
Why did you need this data? What was it useful for?
Limitations & improvements
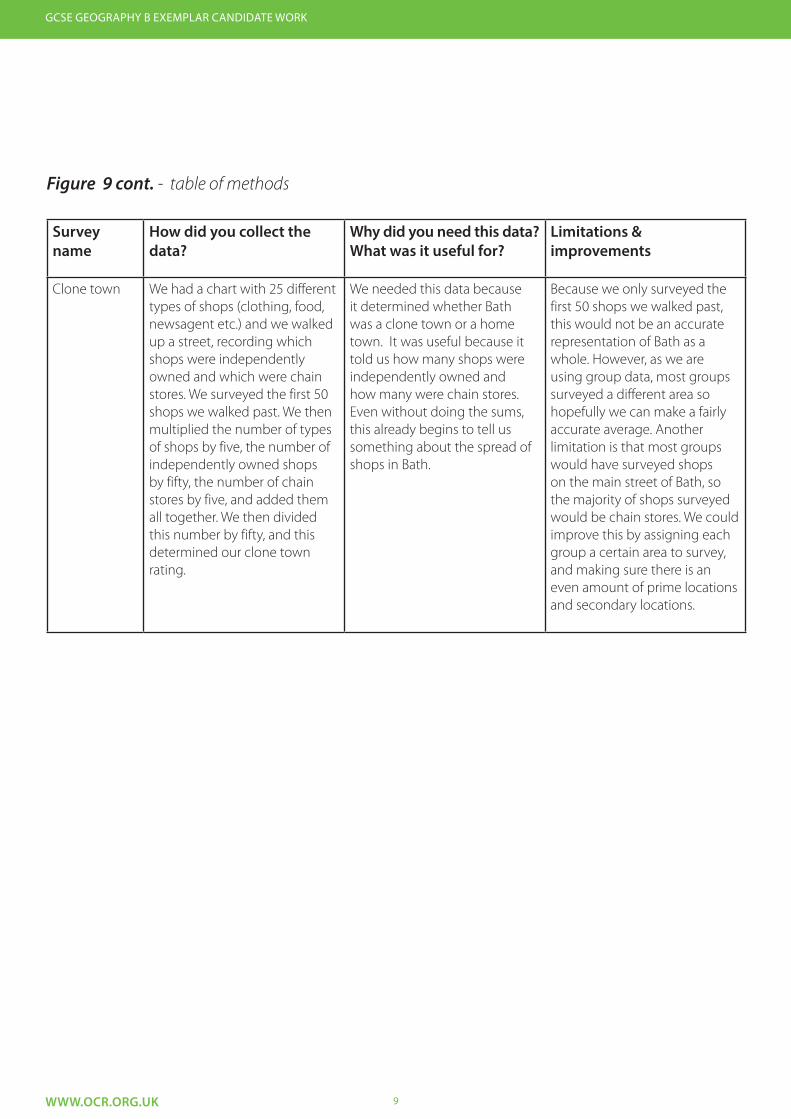
Clone town We had a chart with 25 different types of shops (clothing, food, newsagent etc.) and we walked up a street, recording which shops were independently owned and which were chain stores. We surveyed the first 50 shops we walked past. We then multiplied the number of types of shops by five, the number of independently owned shops by fifty, the number of chain stores by five, and added them all together. We then divided this number by fifty, and this determined our clone town rating.
We needed this data because it determined whether Bath was a clone town or a home town. It was useful because it told us how many shops were independently owned and how many were chain stores. Even without doing the sums, this already begins to tell us something about the spread of shops in Bath.
Because we only surveyed the first 50 shops we walked past, this would not be an accurate representation of Bath as a whole. However, as we are using group data, most groups surveyed a different area so hopefully we can make a fairly accurate average. Another limitation is that most groups would have surveyed shops on the main street of Bath, so the majority of shops surveyed would be chain stores. We could improve this by assigning each group a certain area to survey, and making sure there is an even amount of prime locations and secondary locations.
10 WWW.OCR.ORG.UK
GCSE GEOGRAPHY B EXEMPLAR CANDIDATE WORK
Figure 9 cont. - table of methods
Survey name
How did you collect the data?
Why did you need this data? What was it useful for?
Limitations & improvements
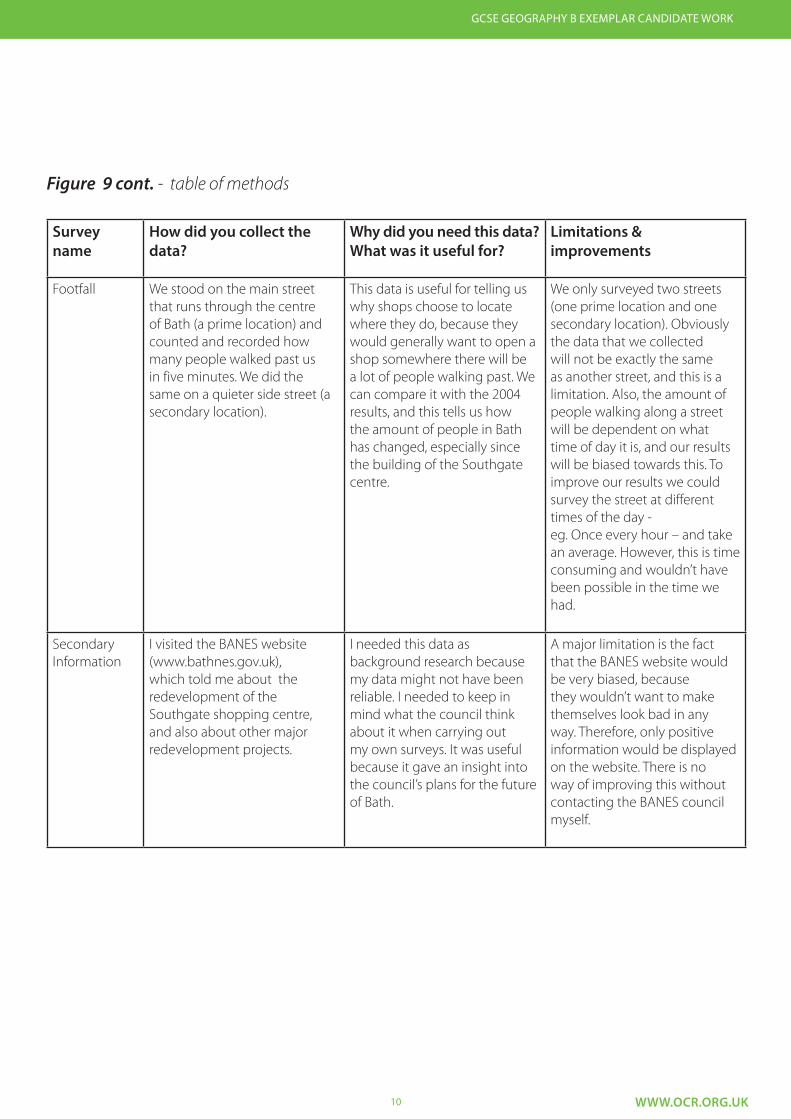
Footfall We stood on the main street that runs through the centre of Bath (a prime location) and counted and recorded how many people walked past us in five minutes. We did the same on a quieter side street (a secondary location).
This data is useful for telling us why shops choose to locate where they do, because they would generally want to open a shop somewhere there will be a lot of people walking past. We can compare it with the 2004 results, and this tells us how the amount of people in Bath has changed, especially since the building of the Southgate centre.
We only surveyed two streets (one prime location and one secondary location). Obviously the data that we collected will not be exactly the same as another street, and this is a limitation. Also, the amount of people walking along a street will be dependent on what time of day it is, and our results will be biased towards this. To improve our results we could survey the street at different times of the day -eg. Once every hour – and take an average. However, this is time consuming and wouldn’t have been possible in the time we had.
Secondary Information
I visited the BANES website (www.bathnes.gov.uk), which told me about the redevelopment of the Southgate shopping centre, and also about other major redevelopment projects.
I needed this data as background research because my data might not have been reliable. I needed to keep in mind what the council think about it when carrying out my own surveys. It was useful because it gave an insight into the council’s plans for the future of Bath.
A major limitation is the fact that the BANES website would be very biased, because they wouldn’t want to make themselves look bad in any way. Therefore, only positive information would be displayed on the website. There is no way of improving this without contacting the BANES council myself.

11 WWW.OCR.ORG.UK
GCSE GEOGRAPHY B EXEMPLAR CANDIDATE WORK
Data Presentation and AnalysisFigure 10 - map to show the spread of independent and chain stores in our survey area
Analysis of Figure 10This map tells us that the majority of shops surveyed were chain stores. This is because our map section was in the centre of town so chain stores tend to be able to pay the high rents better than independent stores can.
SurveyArea 4: South of Westgate Street and Kingsmead Street, West of Stall Street and North of Lower Borough Walls.
Key
chain store
independent store
not surveyed
12 WWW.OCR.ORG.UK
GCSE GEOGRAPHY B EXEMPLAR CANDIDATE WORK
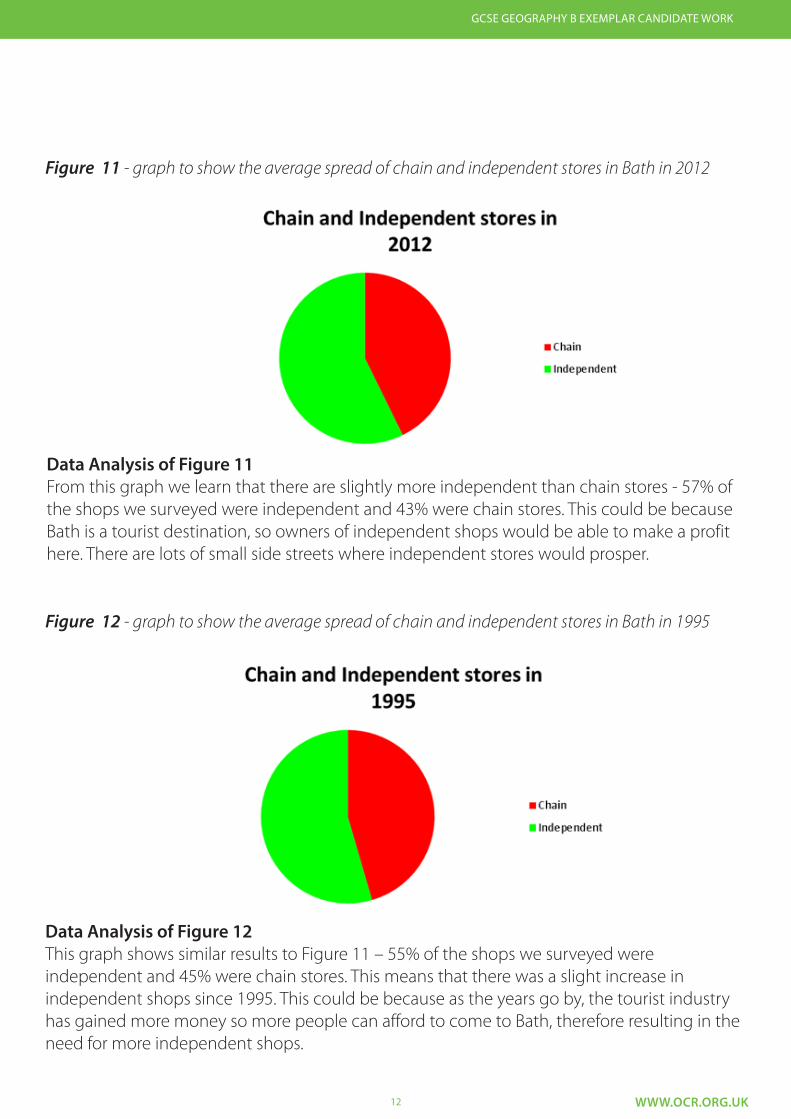
Figure 11 - graph to show the average spread of chain and independent stores in Bath in 2012
Figure 12 - graph to show the average spread of chain and independent stores in Bath in 1995
Data Analysis of Figure 11From this graph we learn that there are slightly more independent than chain stores - 57% of the shops we surveyed were independent and 43% were chain stores. This could be because Bath is a tourist destination, so owners of independent shops would be able to make a profit here. There are lots of small side streets where independent stores would prosper.
Data Analysis of Figure 12This graph shows similar results to Figure 11 – 55% of the shops we surveyed were independent and 45% were chain stores. This means that there was a slight increase in independent shops since 1995. This could be because as the years go by, the tourist industry has gained more money so more people can afford to come to Bath, therefore resulting in the need for more independent shops.
13 WWW.OCR.ORG.UK
GCSE GEOGRAPHY B EXEMPLAR CANDIDATE WORK
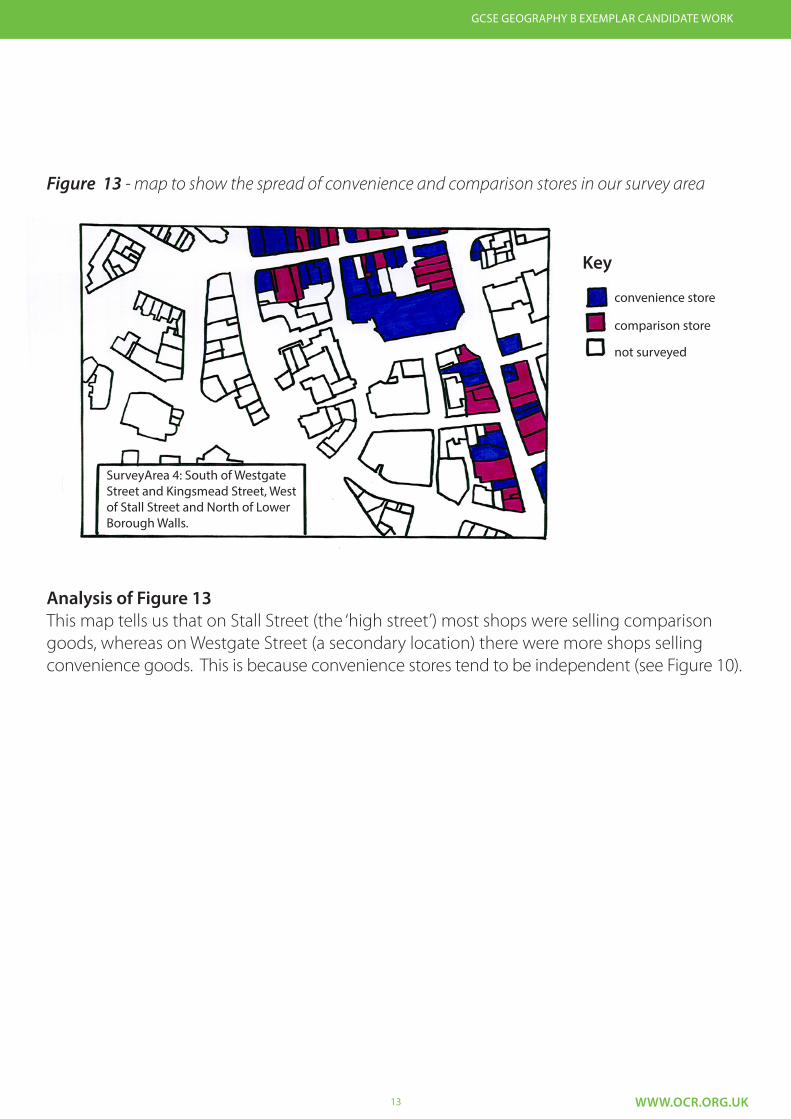
Figure 13 - map to show the spread of convenience and comparison stores in our survey area
Analysis of Figure 13This map tells us that on Stall Street (the ‘high street’) most shops were selling comparison goods, whereas on Westgate Street (a secondary location) there were more shops selling convenience goods. This is because convenience stores tend to be independent (see Figure 10).
Key
convenience store
comparison store
not surveyed
SurveyArea 4: South of Westgate Street and Kingsmead Street, West of Stall Street and North of Lower Borough Walls.
14 WWW.OCR.ORG.UK
GCSE GEOGRAPHY B EXEMPLAR CANDIDATE WORK
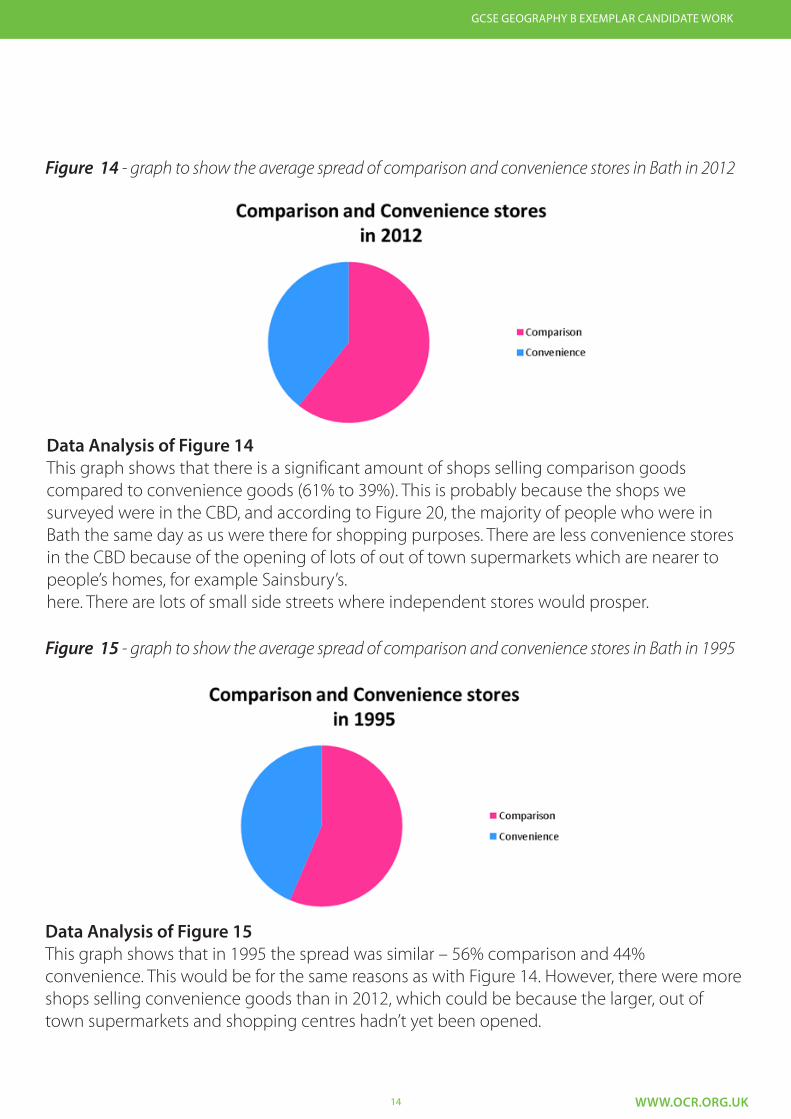
Figure 14 - graph to show the average spread of comparison and convenience stores in Bath in 2012
Figure 15 - graph to show the average spread of comparison and convenience stores in Bath in 1995
Data Analysis of Figure 14This graph shows that there is a significant amount of shops selling comparison goods compared to convenience goods (61% to 39%). This is probably because the shops we surveyed were in the CBD, and according to Figure 20, the majority of people who were in Bath the same day as us were there for shopping purposes. There are less convenience stores in the CBD because of the opening of lots of out of town supermarkets which are nearer to people’s homes, for example Sainsbury’s.here. There are lots of small side streets where independent stores would prosper.
Data Analysis of Figure 15This graph shows that in 1995 the spread was similar – 56% comparison and 44% convenience. This would be for the same reasons as with Figure 14. However, there were more shops selling convenience goods than in 2012, which could be because the larger, out of town supermarkets and shopping centres hadn’t yet been opened.
15 WWW.OCR.ORG.UK
GCSE GEOGRAPHY B EXEMPLAR CANDIDATE WORK
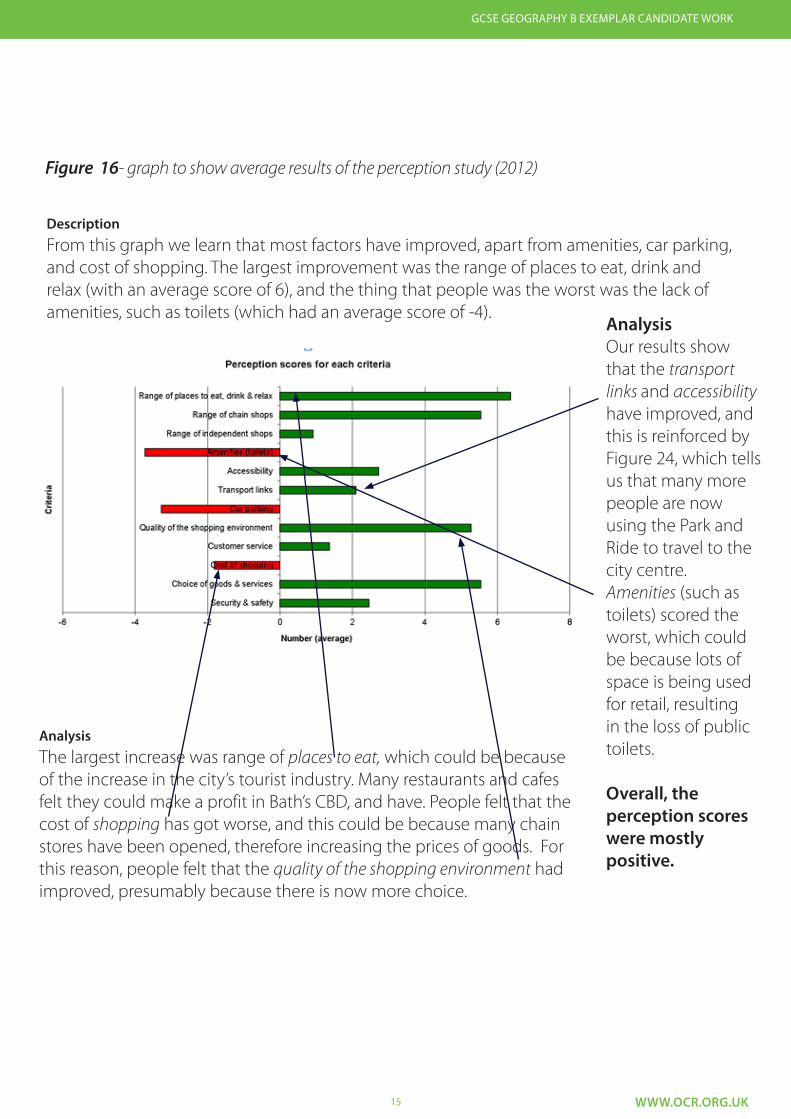
Figure 16- graph to show average results of the perception study (2012)
DescriptionFrom this graph we learn that most factors have improved, apart from amenities, car parking, and cost of shopping. The largest improvement was the range of places to eat, drink and relax (with an average score of 6), and the thing that people was the worst was the lack of amenities, such as toilets (which had an average score of -4).
AnalysisThe largest increase was range of places to eat, which could be because of the increase in the city’s tourist industry. Many restaurants and cafes felt they could make a profit in Bath’s CBD, and have. People felt that the cost of shopping has got worse, and this could be because many chain stores have been opened, therefore increasing the prices of goods. For this reason, people felt that the quality of the shopping environment had improved, presumably because there is now more choice.
AnalysisOur results show that the transport links and accessibility have improved, and this is reinforced by Figure 24, which tells us that many more people are now using the Park and Ride to travel to the city centre. Amenities (such as toilets) scored the worst, which could be because lots of space is being used for retail, resulting in the loss of public toilets.
Overall, the perception scores were mostly positive.
16 WWW.OCR.ORG.UK
GCSE GEOGRAPHY B EXEMPLAR CANDIDATE WORK
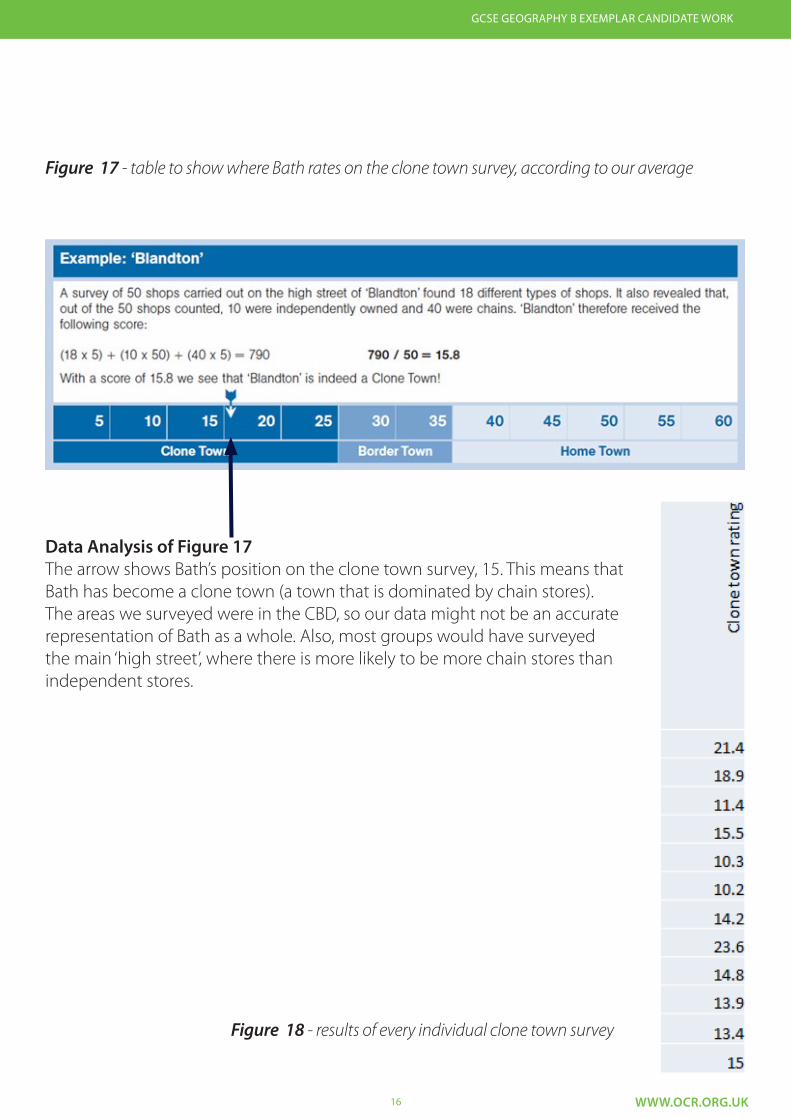
Figure 17 - table to show where Bath rates on the clone town survey, according to our average
Data Analysis of Figure 17The arrow shows Bath’s position on the clone town survey, 15. This means that Bath has become a clone town (a town that is dominated by chain stores). The areas we surveyed were in the CBD, so our data might not be an accurate representation of Bath as a whole. Also, most groups would have surveyed the main ‘high street’, where there is more likely to be more chain stores than independent stores.
Figure 18 - results of every individual clone town survey
17 WWW.OCR.ORG.UK
GCSE GEOGRAPHY B EXEMPLAR CANDIDATE WORK
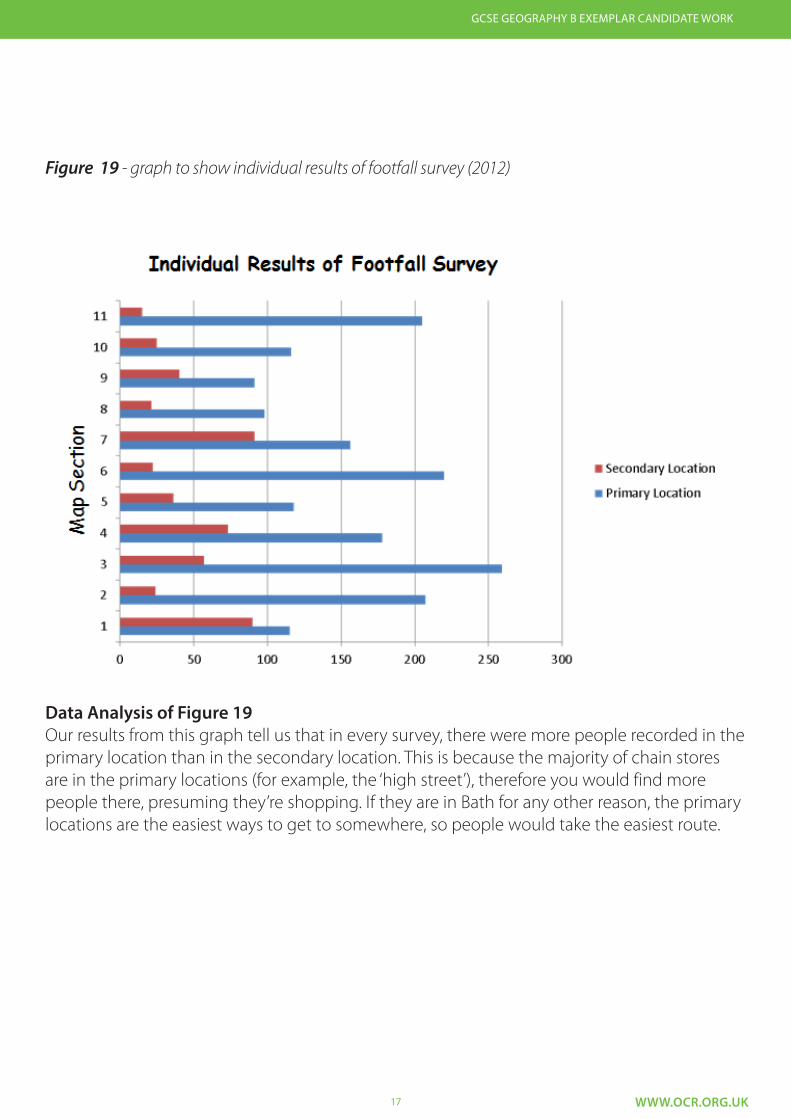
Figure 19 - graph to show individual results of footfall survey (2012)
Data Analysis of Figure 19Our results from this graph tell us that in every survey, there were more people recorded in the primary location than in the secondary location. This is because the majority of chain stores are in the primary locations (for example, the ‘high street’), therefore you would find more people there, presuming they’re shopping. If they are in Bath for any other reason, the primary locations are the easiest ways to get to somewhere, so people would take the easiest route.
18 WWW.OCR.ORG.UK
GCSE GEOGRAPHY B EXEMPLAR CANDIDATE WORK
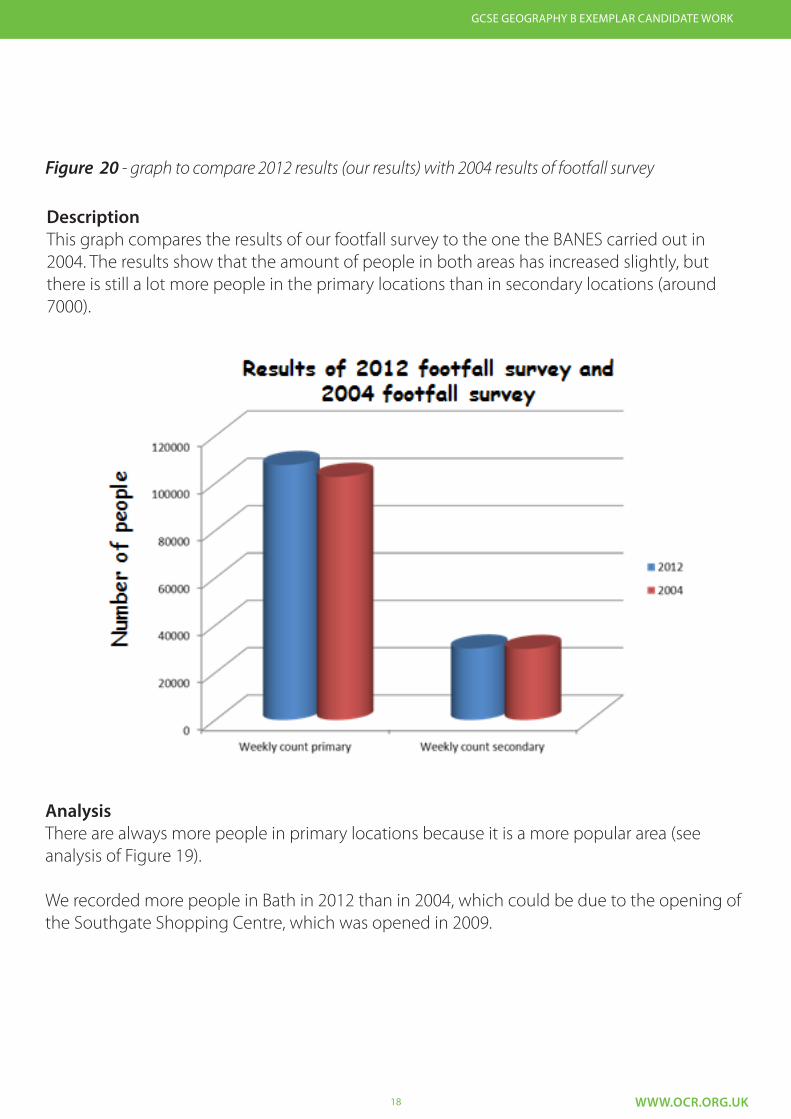
Figure 20 - graph to compare 2012 results (our results) with 2004 results of footfall survey
AnalysisThere are always more people in primary locations because it is a more popular area (see analysis of Figure 19).
We recorded more people in Bath in 2012 than in 2004, which could be due to the opening of the Southgate Shopping Centre, which was opened in 2009.
DescriptionThis graph compares the results of our footfall survey to the one the BANES carried out in 2004. The results show that the amount of people in both areas has increased slightly, but there is still a lot more people in the primary locations than in secondary locations (around 7000).
19 WWW.OCR.ORG.UK
GCSE GEOGRAPHY B EXEMPLAR CANDIDATE WORK
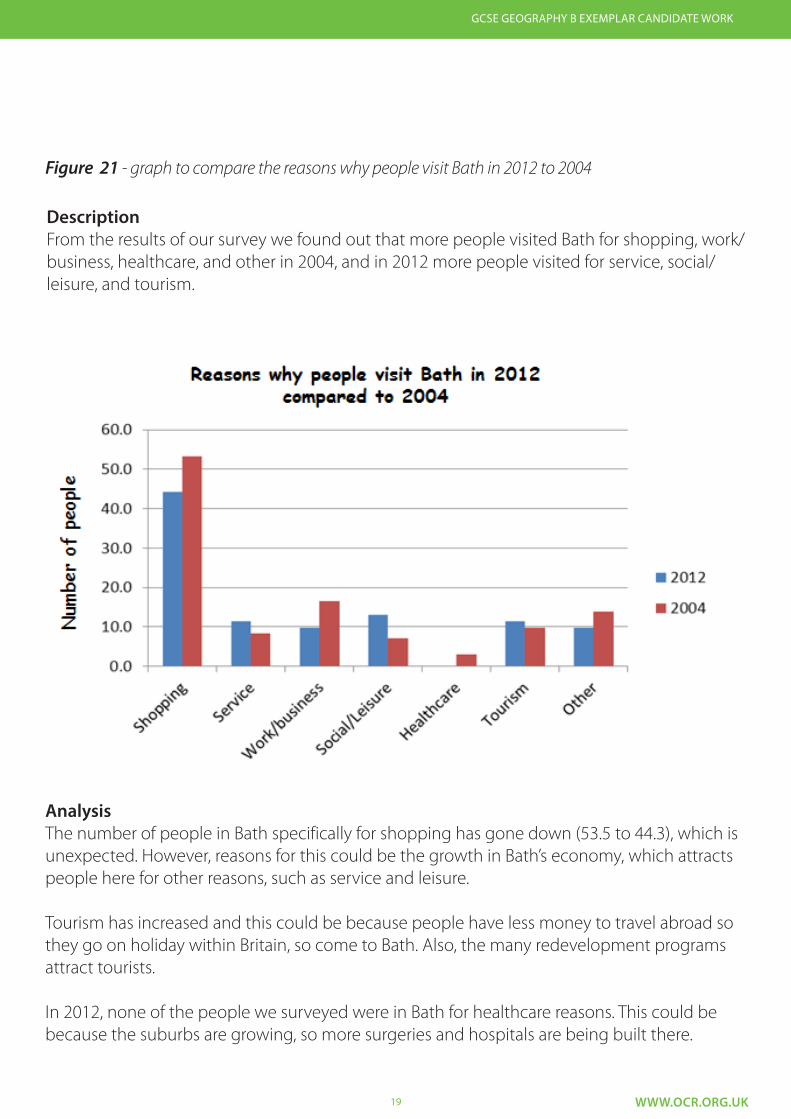
Figure 21 - graph to compare the reasons why people visit Bath in 2012 to 2004
AnalysisThe number of people in Bath specifically for shopping has gone down (53.5 to 44.3), which is unexpected. However, reasons for this could be the growth in Bath’s economy, which attracts people here for other reasons, such as service and leisure.
Tourism has increased and this could be because people have less money to travel abroad so they go on holiday within Britain, so come to Bath. Also, the many redevelopment programs attract tourists.
In 2012, none of the people we surveyed were in Bath for healthcare reasons. This could be because the suburbs are growing, so more surgeries and hospitals are being built there.
DescriptionFrom the results of our survey we found out that more people visited Bath for shopping, work/business, healthcare, and other in 2004, and in 2012 more people visited for service, social/leisure, and tourism.
20 WWW.OCR.ORG.UK
GCSE GEOGRAPHY B EXEMPLAR CANDIDATE WORK
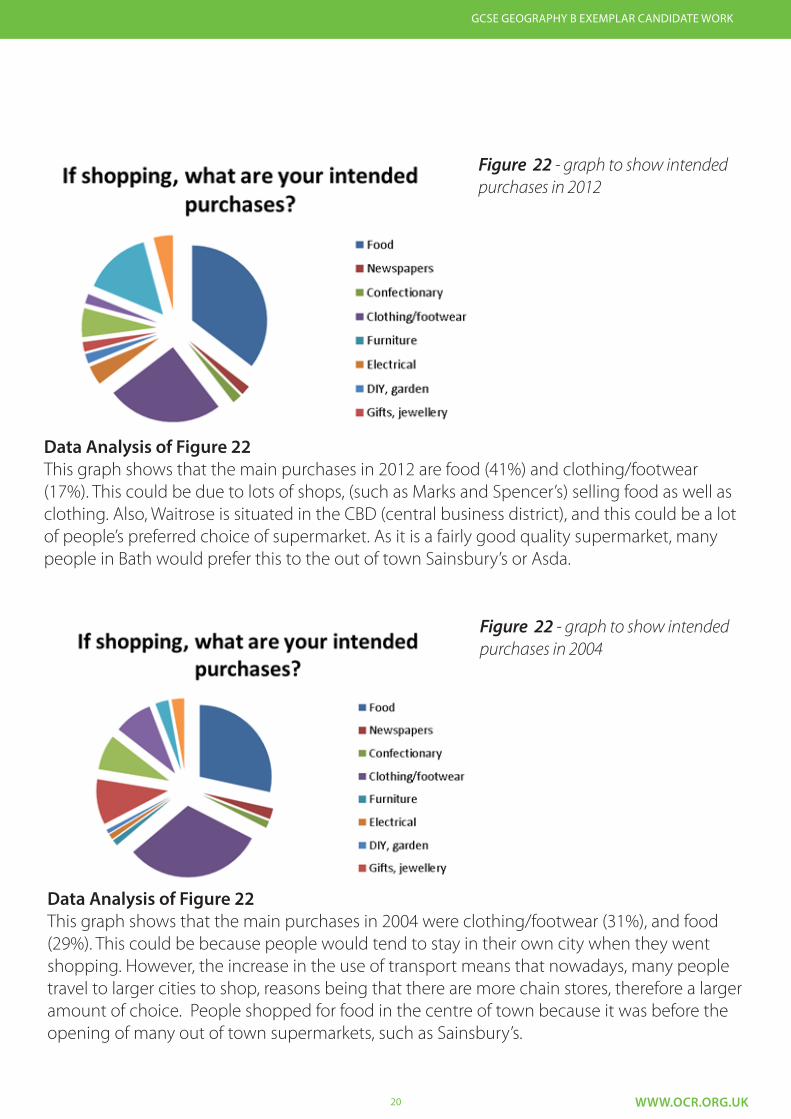
Figure 22 - graph to show intended purchases in 2012
Data Analysis of Figure 22This graph shows that the main purchases in 2012 are food (41%) and clothing/footwear (17%). This could be due to lots of shops, (such as Marks and Spencer’s) selling food as well as clothing. Also, Waitrose is situated in the CBD (central business district), and this could be a lot of people’s preferred choice of supermarket. As it is a fairly good quality supermarket, many people in Bath would prefer this to the out of town Sainsbury’s or Asda.
Data Analysis of Figure 22This graph shows that the main purchases in 2004 were clothing/footwear (31%), and food (29%). This could be because people would tend to stay in their own city when they went shopping. However, the increase in the use of transport means that nowadays, many people travel to larger cities to shop, reasons being that there are more chain stores, therefore a larger amount of choice. People shopped for food in the centre of town because it was before the opening of many out of town supermarkets, such as Sainsbury’s.
Figure 22 - graph to show intended purchases in 2004
21 WWW.OCR.ORG.UK
GCSE GEOGRAPHY B EXEMPLAR CANDIDATE WORK
Figure 24 - graph to compare the ways people travel to Bath in 2012 to 2004
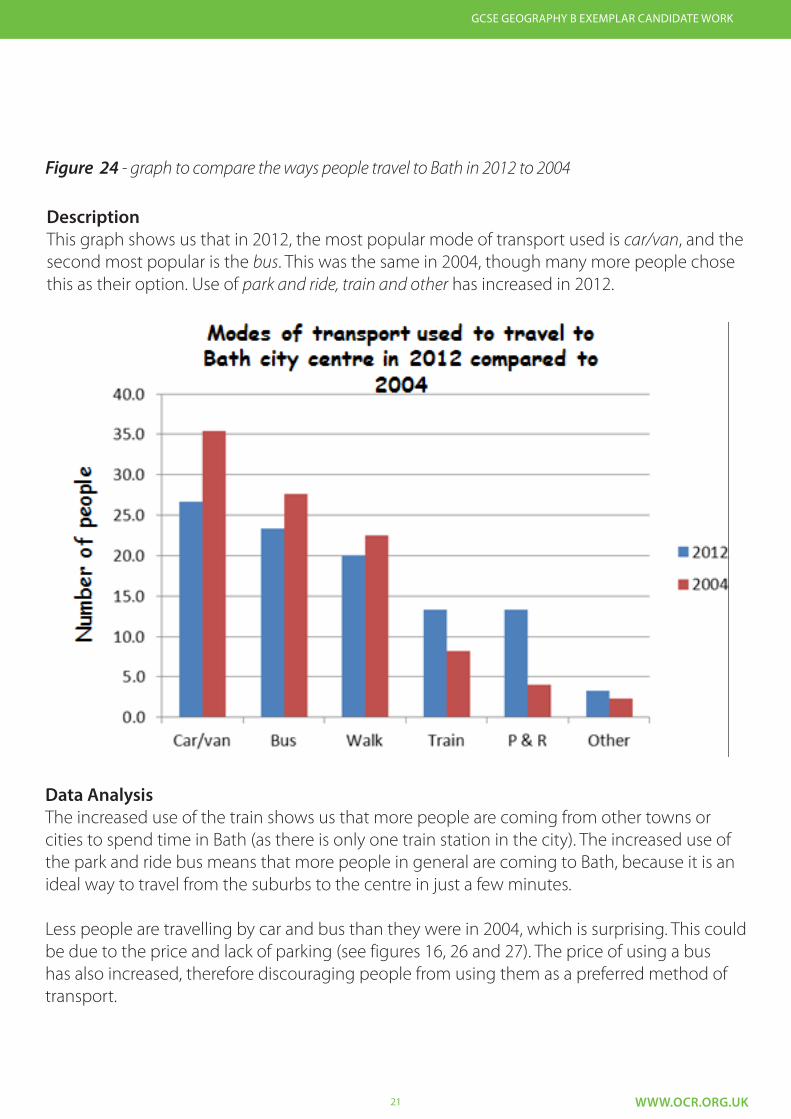
Data AnalysisThe increased use of the train shows us that more people are coming from other towns or cities to spend time in Bath (as there is only one train station in the city). The increased use of the park and ride bus means that more people in general are coming to Bath, because it is an ideal way to travel from the suburbs to the centre in just a few minutes.
Less people are travelling by car and bus than they were in 2004, which is surprising. This could be due to the price and lack of parking (see figures 16, 26 and 27). The price of using a bus has also increased, therefore discouraging people from using them as a preferred method of transport.
DescriptionThis graph shows us that in 2012, the most popular mode of transport used is car/van, and the second most popular is the bus. This was the same in 2004, though many more people chose this as their option. Use of park and ride, train and other has increased in 2012.
22 WWW.OCR.ORG.UK
GCSE GEOGRAPHY B EXEMPLAR CANDIDATE WORK
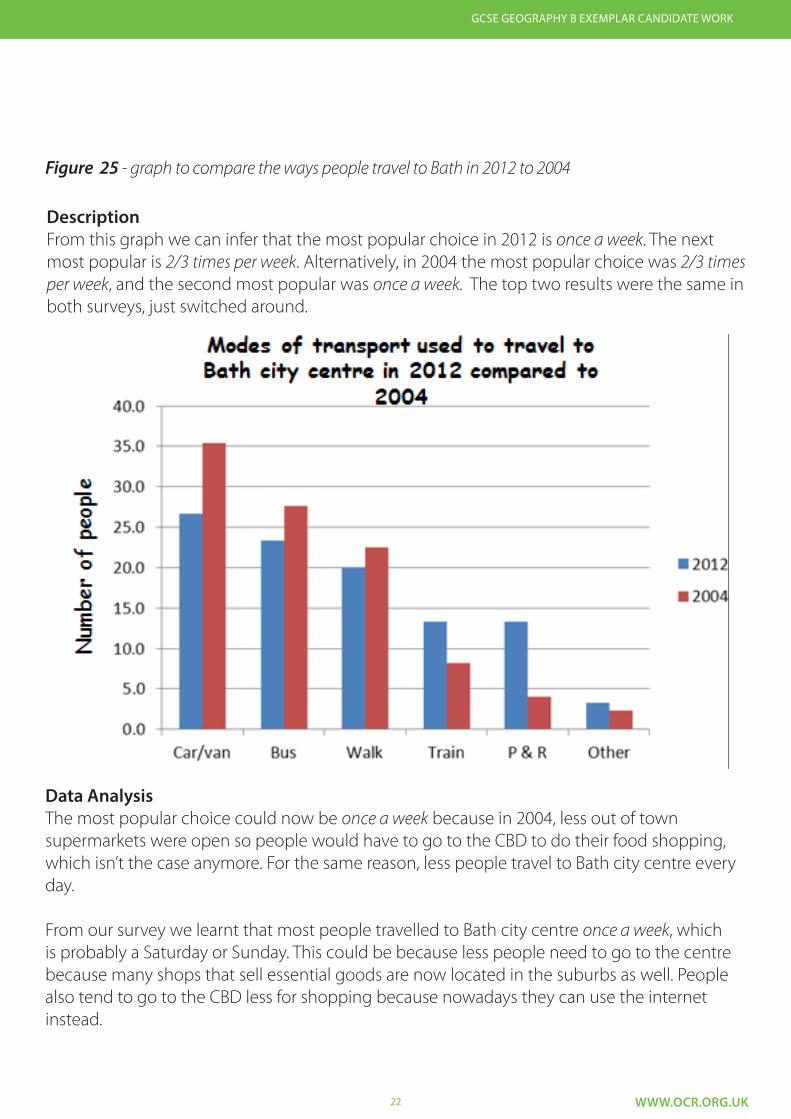
Figure 25 - graph to compare the ways people travel to Bath in 2012 to 2004
Data AnalysisThe most popular choice could now be once a week because in 2004, less out of town supermarkets were open so people would have to go to the CBD to do their food shopping, which isn’t the case anymore. For the same reason, less people travel to Bath city centre every day.
From our survey we learnt that most people travelled to Bath city centre once a week, which is probably a Saturday or Sunday. This could be because less people need to go to the centre because many shops that sell essential goods are now located in the suburbs as well. People also tend to go to the CBD less for shopping because nowadays they can use the internet instead.
DescriptionFrom this graph we can infer that the most popular choice in 2012 is once a week. The next most popular is 2/3 times per week. Alternatively, in 2004 the most popular choice was 2/3 times per week, and the second most popular was once a week. The top two results were the same in both surveys, just switched around.
23 WWW.OCR.ORG.UK
GCSE GEOGRAPHY B EXEMPLAR CANDIDATE WORK
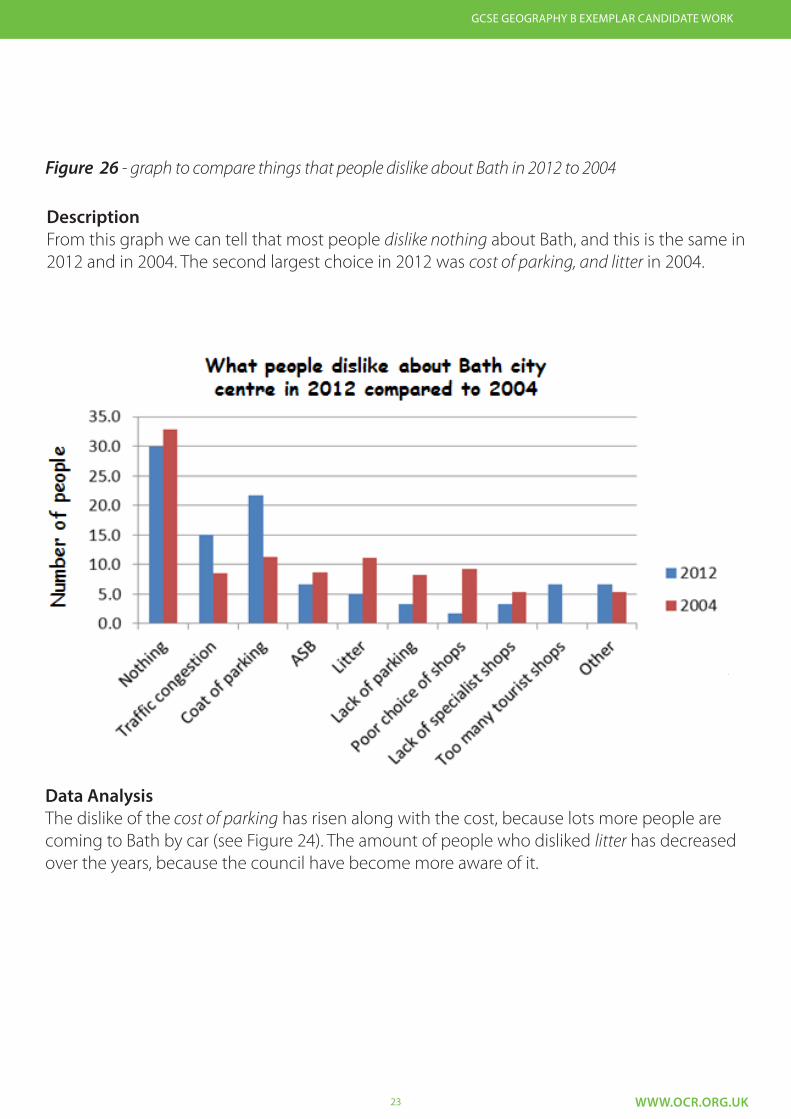
Figure 26 - graph to compare things that people dislike about Bath in 2012 to 2004
Data AnalysisThe dislike of the cost of parking has risen along with the cost, because lots more people are coming to Bath by car (see Figure 24). The amount of people who disliked litter has decreased over the years, because the council have become more aware of it.
DescriptionFrom this graph we can tell that most people dislike nothing about Bath, and this is the same in 2012 and in 2004. The second largest choice in 2012 was cost of parking, and litter in 2004.
24 WWW.OCR.ORG.UK
GCSE GEOGRAPHY B EXEMPLAR CANDIDATE WORK
Figure 27 - graph to compare reasons why people chose Bath over other cities in 2012 and
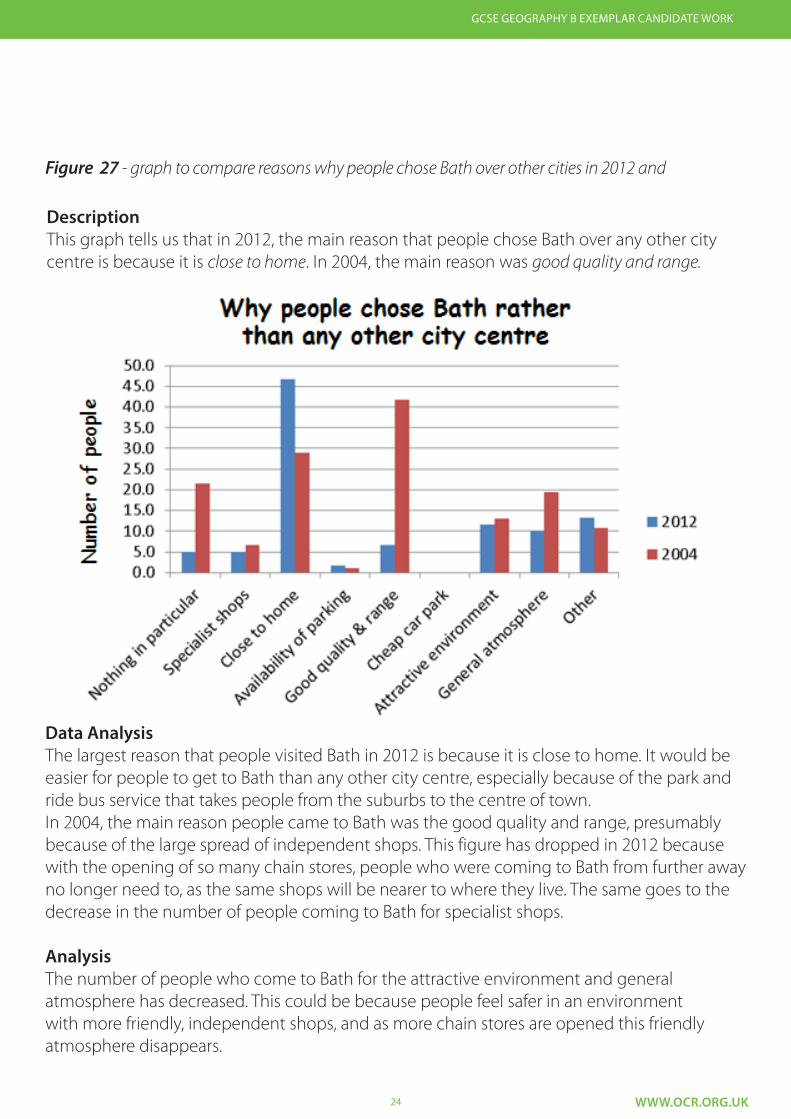
Data AnalysisThe largest reason that people visited Bath in 2012 is because it is close to home. It would be easier for people to get to Bath than any other city centre, especially because of the park and ride bus service that takes people from the suburbs to the centre of town.In 2004, the main reason people came to Bath was the good quality and range, presumably because of the large spread of independent shops. This figure has dropped in 2012 because with the opening of so many chain stores, people who were coming to Bath from further away no longer need to, as the same shops will be nearer to where they live. The same goes to the decrease in the number of people coming to Bath for specialist shops.
AnalysisThe number of people who come to Bath for the attractive environment and general atmosphere has decreased. This could be because people feel safer in an environment with more friendly, independent shops, and as more chain stores are opened this friendly atmosphere disappears.
DescriptionThis graph tells us that in 2012, the main reason that people chose Bath over any other city centre is because it is close to home. In 2004, the main reason was good quality and range.
25 WWW.OCR.ORG.UK
GCSE GEOGRAPHY B EXEMPLAR CANDIDATE WORK
Figure 28 - graph to show opinions on the southgate shopping centre
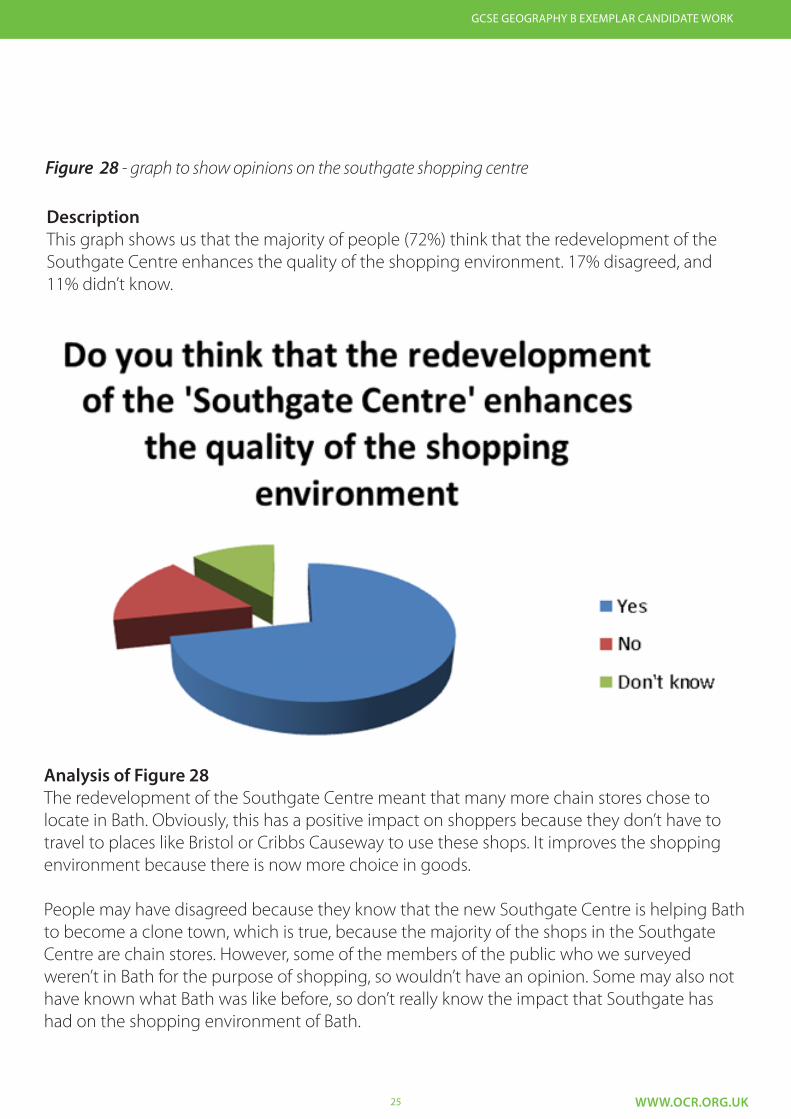
Analysis of Figure 28The redevelopment of the Southgate Centre meant that many more chain stores chose to locate in Bath. Obviously, this has a positive impact on shoppers because they don’t have to travel to places like Bristol or Cribbs Causeway to use these shops. It improves the shopping environment because there is now more choice in goods.
People may have disagreed because they know that the new Southgate Centre is helping Bath to become a clone town, which is true, because the majority of the shops in the Southgate Centre are chain stores. However, some of the members of the public who we surveyed weren’t in Bath for the purpose of shopping, so wouldn’t have an opinion. Some may also not have known what Bath was like before, so don’t really know the impact that Southgate has had on the shopping environment of Bath.
DescriptionThis graph shows us that the majority of people (72%) think that the redevelopment of the Southgate Centre enhances the quality of the shopping environment. 17% disagreed, and 11% didn’t know.

26 WWW.OCR.ORG.UK
GCSE GEOGRAPHY B EXEMPLAR CANDIDATE WORK
Student sourced image from: http://www.bathintime.co.uk/image/202462/argyle-
street-shop-front-c-1900 . This image has been removed for copyright reasons.
Analysis of Figure 29The shop shown in 1900 is a dairy. Most shops such as dairies, butchers and grocers have shut down because supermarkets sell everything under one roof, therefore making it easier for shoppers to buy what they need. They also tend to sell them at a cheaper price too.
Figure 30 - Thai by the weir, taken in 2012
Analysis of Figure 30The retail space is now a Thai restaurant. This is a visible sign of globalisation, and it shows how our attitudes towards what we would prefer to buy have changed.
Figure 29 - Norton Dairies, taken in c. 1900

27 WWW.OCR.ORG.UK
GCSE GEOGRAPHY B EXEMPLAR CANDIDATE WORK
Student sourced image from: http://www.bathintime.co.uk/image/374815/sk-fruits-
westgate-street-6-april-1989 . This image has been removed for copyright reasons.
Analysis of Figure 31The shop shown is a grocery. Similarly to Figure 29, supermarkets have put small shops such as these out of business because they sell the same goods at a cheaper price, and all in one place.
Figure 32 - Gamestation, taken in 2012
Analysis of Figure 32The shop has now become a branch of Gamestation, a chain store selling video games and consoles. This reflects the development of ICT over the years, and also is a visible sign of Bath becoming a clone town.
Figure 31 - S.K. Fruits, taken in April 1989

28 WWW.OCR.ORG.UK
GCSE GEOGRAPHY B EXEMPLAR CANDIDATE WORK
Student sourced image from: http://www.bathintime.co.uk/image/318624/pickfords-
travel-agents-abbeygate-street-c-1960s . This image has been removed for copyright reasons.
Analysis of Figure 33The shop shown is Pickfords, a removal company. This was probably one of their offices, but due to the internet it may not have been needed anymore. Alternatively, larger and more successful removal companies may have cause them to lose customers, and eventually put them out of business.
Figure 34 - Abbey Gate Street and Thomas Cook, taken in 2012
Analysis of Figure 34From the photograph you can tell that the building where Pickfords was has been rebuilt, and also extended further down the street. The shop on the corner is now Thomas Cook, a travel agent, which marks the growth of tourism and outsourcing in the world.
Figure 33 - Abbey Gate Street and Pickfords house removals, taken in 1986
29 WWW.OCR.ORG.UK
GCSE GEOGRAPHY B EXEMPLAR CANDIDATE WORK
Student sourced image from: http://www.bathintime.co.uk/image/248567/lower-
borough-walls-1963 . This image has been removed for copyright reasons.
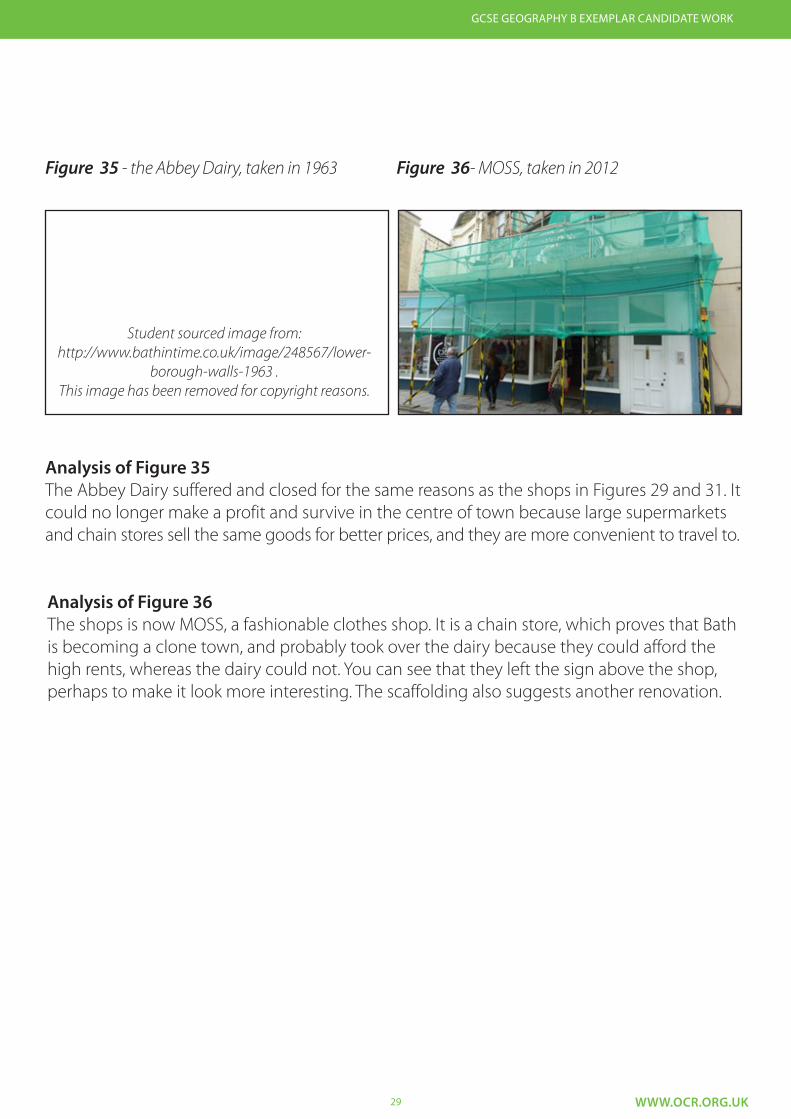
Analysis of Figure 35The Abbey Dairy suffered and closed for the same reasons as the shops in Figures 29 and 31. It could no longer make a profit and survive in the centre of town because large supermarkets and chain stores sell the same goods for better prices, and they are more convenient to travel to.
Figure 36- MOSS, taken in 2012
Analysis of Figure 36The shops is now MOSS, a fashionable clothes shop. It is a chain store, which proves that Bath is becoming a clone town, and probably took over the dairy because they could afford the high rents, whereas the dairy could not. You can see that they left the sign above the shop, perhaps to make it look more interesting. The scaffolding also suggests another renovation.
Figure 35 - the Abbey Dairy, taken in 1963
30 WWW.OCR.ORG.UK
GCSE GEOGRAPHY B EXEMPLAR CANDIDATE WORK
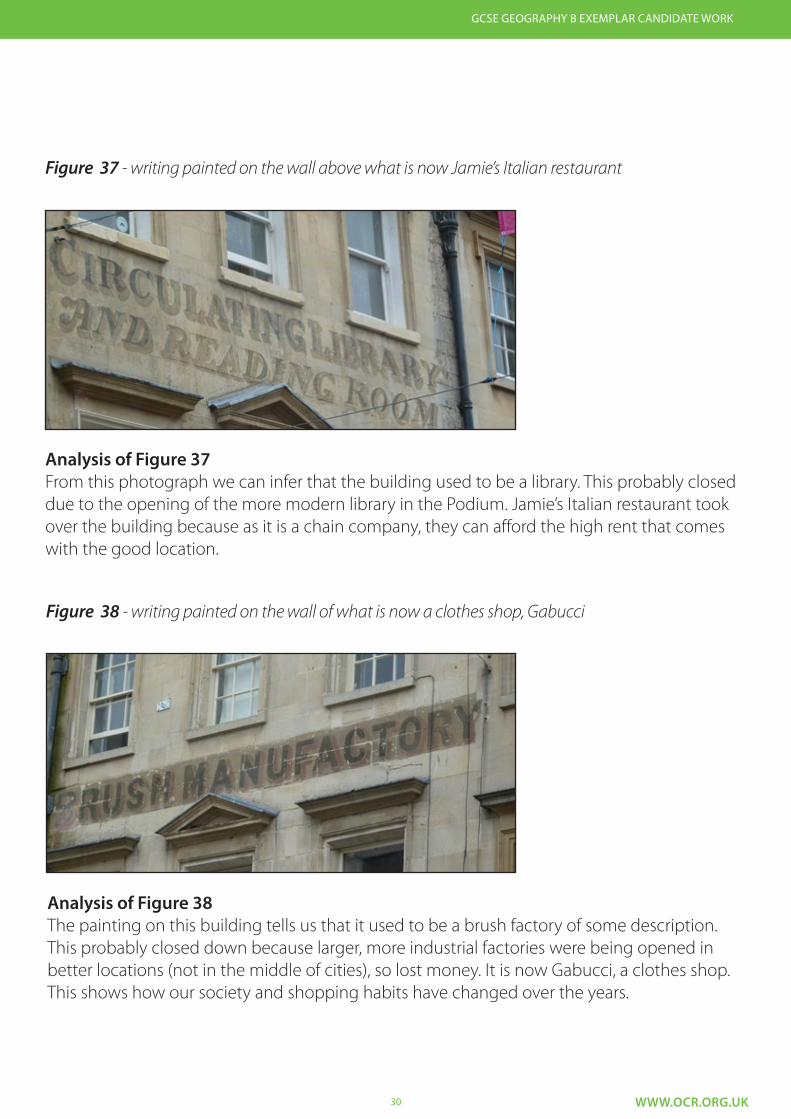
Analysis of Figure 37From this photograph we can infer that the building used to be a library. This probably closed due to the opening of the more modern library in the Podium. Jamie’s Italian restaurant took over the building because as it is a chain company, they can afford the high rent that comes with the good location.
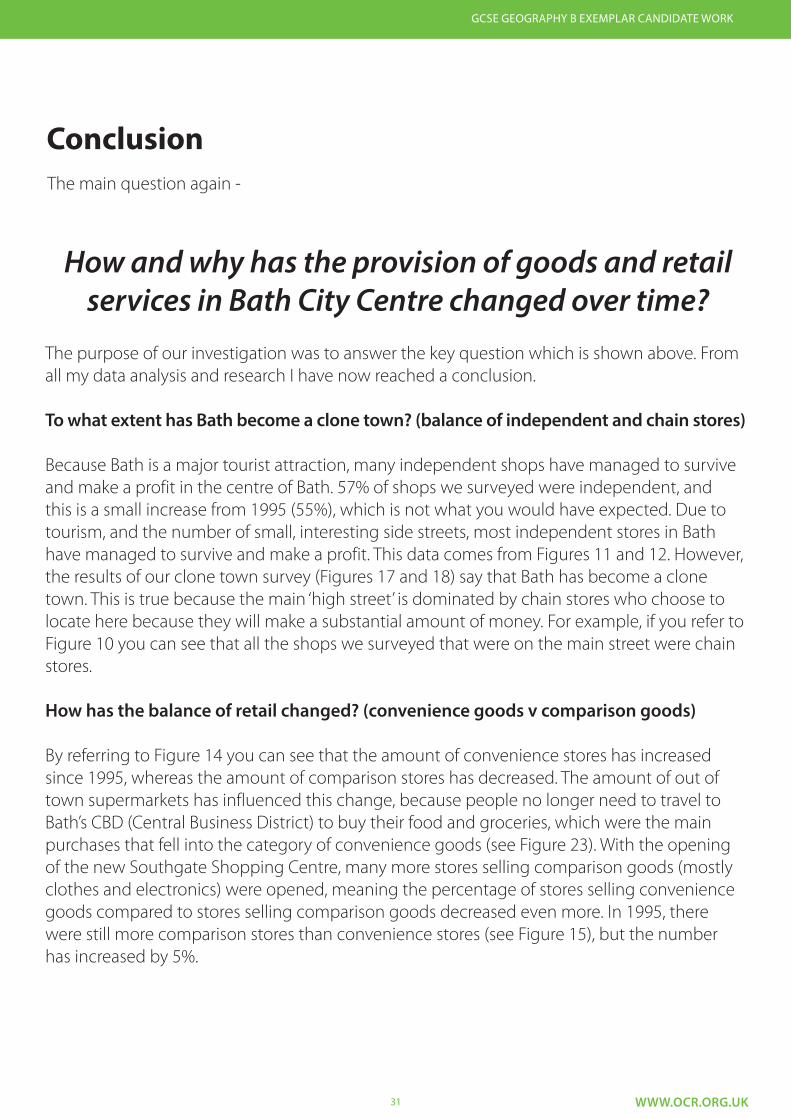
Figure 38 - writing painted on the wall of what is now a clothes shop, Gabucci
Analysis of Figure 38The painting on this building tells us that it used to be a brush factory of some description. This probably closed down because larger, more industrial factories were being opened in better locations (not in the middle of cities), so lost money. It is now Gabucci, a clothes shop. This shows how our society and shopping habits have changed over the years.
Figure 37 - writing painted on the wall above what is now Jamie’s Italian restaurant
31 WWW.OCR.ORG.UK
GCSE GEOGRAPHY B EXEMPLAR CANDIDATE WORK
ConclusionThe main question again -
How and why has the provision of goods and retail services in Bath City Centre changed over time?
The purpose of our investigation was to answer the key question which is shown above. From all my data analysis and research I have now reached a conclusion.
To what extent has Bath become a clone town? (balance of independent and chain stores)
Because Bath is a major tourist attraction, many independent shops have managed to survive and make a profit in the centre of Bath. 57% of shops we surveyed were independent, and this is a small increase from 1995 (55%), which is not what you would have expected. Due to tourism, and the number of small, interesting side streets, most independent stores in Bath have managed to survive and make a profit. This data comes from Figures 11 and 12. However, the results of our clone town survey (Figures 17 and 18) say that Bath has become a clone town. This is true because the main ‘high street’ is dominated by chain stores who choose to locate here because they will make a substantial amount of money. For example, if you refer to Figure 10 you can see that all the shops we surveyed that were on the main street were chain stores.
How has the balance of retail changed? (convenience goods v comparison goods)
By referring to Figure 14 you can see that the amount of convenience stores has increased since 1995, whereas the amount of comparison stores has decreased. The amount of out of town supermarkets has influenced this change, because people no longer need to travel to Bath’s CBD (Central Business District) to buy their food and groceries, which were the main purchases that fell into the category of convenience goods (see Figure 23). With the opening of the new Southgate Shopping Centre, many more stores selling comparison goods (mostly clothes and electronics) were opened, meaning the percentage of stores selling convenience goods compared to stores selling comparison goods decreased even more. In 1995, there were still more comparison stores than convenience stores (see Figure 15), but the number has increased by 5%.
32 WWW.OCR.ORG.UK
GCSE GEOGRAPHY B EXEMPLAR CANDIDATE WORK
What do local people think about the changes? (people’s opinions and value judgements)
Our survey suggested that many local people like the changes, especially the redevelopment of the Southgate Centre. Figure 28 tells us that 72% of the people we surveyed thought that it has enhanced the shopping experience in Bath. Our perception study came out with mostly positive scores, and an overall positive score as well (Figure 26). Figure 27 tells us that in both our survey and the survey carried out by BANES council in 2004, the most popular choice was nothing, when asked what they disliked about Bath. Therefore, we can infer that the majority of local people like the changes that have been made.
What is going to happen in the future?
I think that in the future, the amount of chain stores is going to increase, even though this differs from our data collection. I think this because Bath has become a clone town, and in other cities around Britain, the amount of independent shops there are is decreasing rapidly. Also, as the Podium is being turned into John Lewis this means the closure of lots of independent shops that are currently there. However, our surveys show that more people are coming to Bath than before, so this could have a positive effect on the independent shops. We learnt that there is a lot more that people dislike about Bath now than in 2004, so if this happened to get worse it could have an effect on the amount of people who visit Bath’s CBD, therefore the amount of income that shops receive.
33 WWW.OCR.ORG.UK
GCSE GEOGRAPHY B EXEMPLAR CANDIDATE WORK
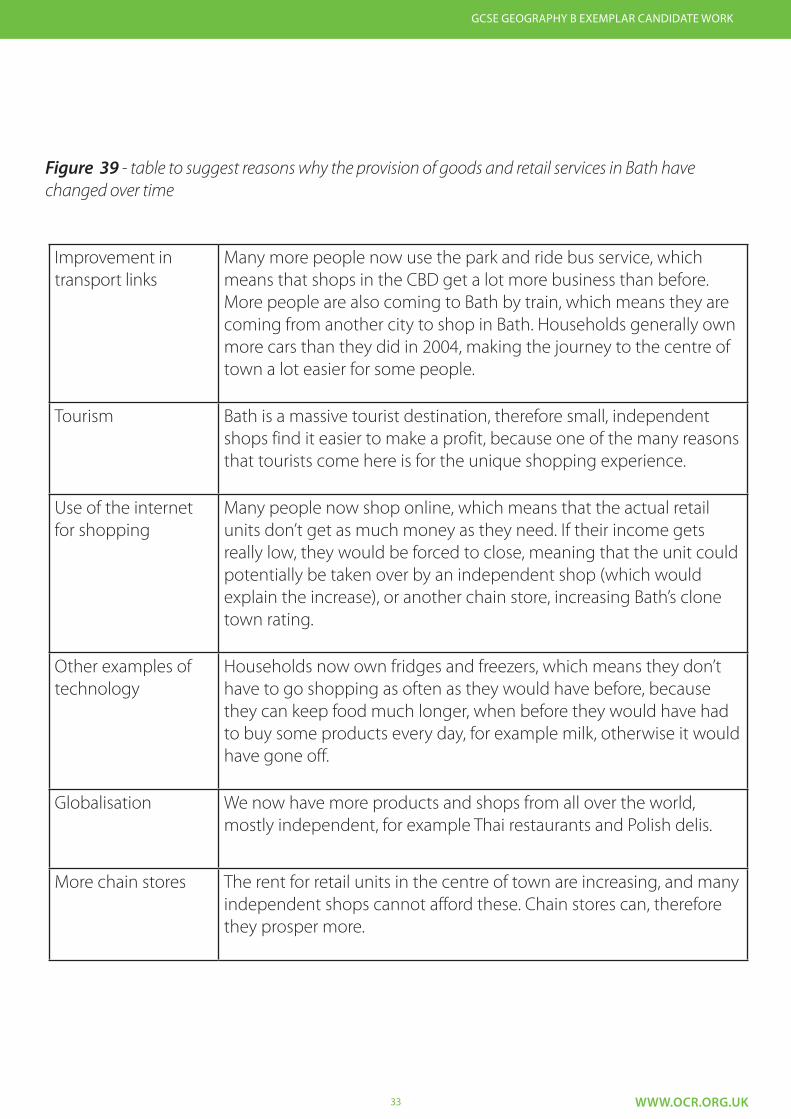
Figure 39 - table to suggest reasons why the provision of goods and retail services in Bath have changed over time
Improvement in transport links
Many more people now use the park and ride bus service, which means that shops in the CBD get a lot more business than before. More people are also coming to Bath by train, which means they are coming from another city to shop in Bath. Households generally own more cars than they did in 2004, making the journey to the centre of town a lot easier for some people.
Tourism Bath is a massive tourist destination, therefore small, independent shops find it easier to make a profit, because one of the many reasons that tourists come here is for the unique shopping experience.
Use of the internet for shopping
Many people now shop online, which means that the actual retail units don’t get as much money as they need. If their income gets really low, they would be forced to close, meaning that the unit could potentially be taken over by an independent shop (which would explain the increase), or another chain store, increasing Bath’s clone town rating.
Other examples of technology
Households now own fridges and freezers, which means they don’t have to go shopping as often as they would have before, because they can keep food much longer, when before they would have had to buy some products every day, for example milk, otherwise it would have gone off.
Globalisation We now have more products and shops from all over the world, mostly independent, for example Thai restaurants and Polish delis.
More chain stores The rent for retail units in the centre of town are increasing, and many independent shops cannot afford these. Chain stores can, therefore they prosper more.
34 WWW.OCR.ORG.UK
GCSE GEOGRAPHY B EXEMPLAR CANDIDATE WORK
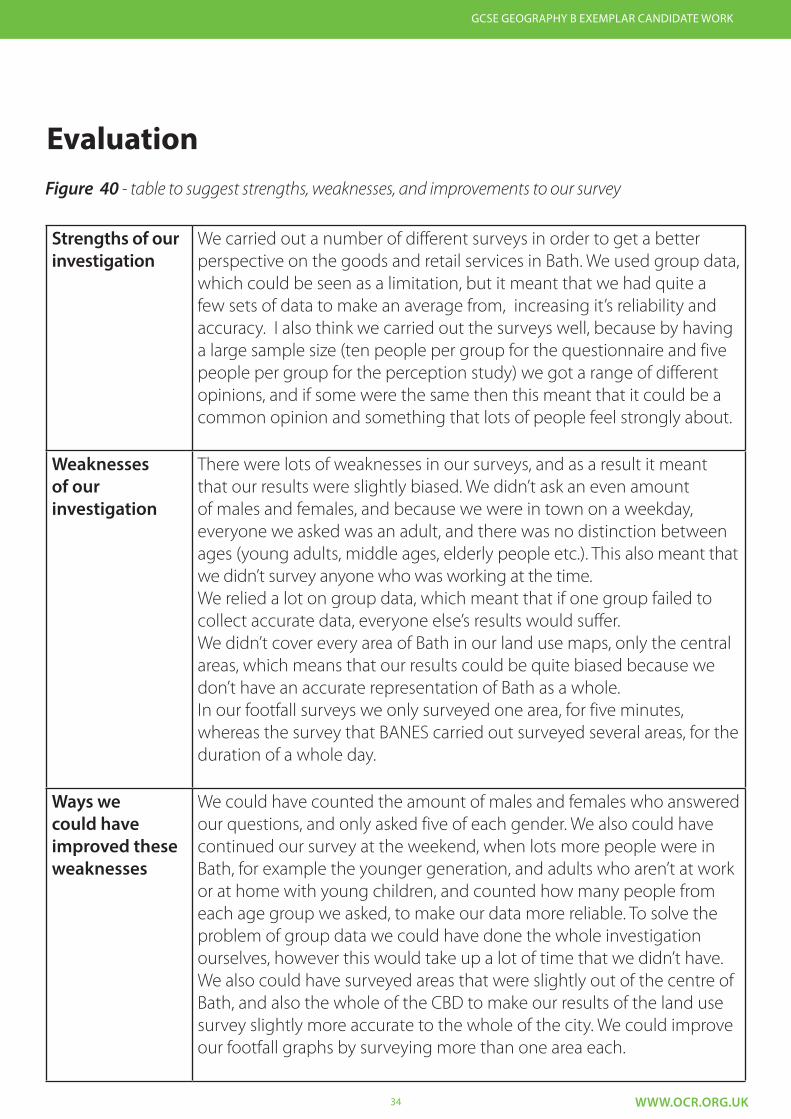
Figure 40 - table to suggest strengths, weaknesses, and improvements to our survey
Strengths of our investigation
We carried out a number of different surveys in order to get a better perspective on the goods and retail services in Bath. We used group data, which could be seen as a limitation, but it meant that we had quite a few sets of data to make an average from, increasing it’s reliability and accuracy. I also think we carried out the surveys well, because by having a large sample size (ten people per group for the questionnaire and five people per group for the perception study) we got a range of different opinions, and if some were the same then this meant that it could be a common opinion and something that lots of people feel strongly about.
Weaknesses of our investigation
There were lots of weaknesses in our surveys, and as a result it meant that our results were slightly biased. We didn’t ask an even amount of males and females, and because we were in town on a weekday, everyone we asked was an adult, and there was no distinction between ages (young adults, middle ages, elderly people etc.). This also meant that we didn’t survey anyone who was working at the time.We relied a lot on group data, which meant that if one group failed to collect accurate data, everyone else’s results would suffer. We didn’t cover every area of Bath in our land use maps, only the central areas, which means that our results could be quite biased because we don’t have an accurate representation of Bath as a whole.In our footfall surveys we only surveyed one area, for five minutes, whereas the survey that BANES carried out surveyed several areas, for the duration of a whole day.
Ways we could have improved these weaknesses
We could have counted the amount of males and females who answered our questions, and only asked five of each gender. We also could have continued our survey at the weekend, when lots more people were in Bath, for example the younger generation, and adults who aren’t at work or at home with young children, and counted how many people from each age group we asked, to make our data more reliable. To solve the problem of group data we could have done the whole investigation ourselves, however this would take up a lot of time that we didn’t have. We also could have surveyed areas that were slightly out of the centre of Bath, and also the whole of the CBD to make our results of the land use survey slightly more accurate to the whole of the city. We could improve our footfall graphs by surveying more than one area each.
Evaluation

35 WWW.OCR.ORG.UK
GCSE GEOGRAPHY B EXEMPLAR CANDIDATE WORK
Figure 41 - table to suggest possible extensions to our investigation and how to carry them out
Question Information needed How will data be collected?
Why has the amount of independent shops increased in Bath, when in the rest of the UK it has decreased?
The number of independent shops in Bath, the number of independent shops in another city eg. Bristol, the number of chain stores in Bath, and the number of chain stores in another city eg. Bristol
We could use our land use maps from this investigation to find out about Bath’s data, and produce similar maps for the other city we are surveying.
Why have our attitudes towards shopping changed?
Perhaps another questionnaire, detailing how much time people spend shopping in the CBD, how much time they spend shopping on the internet, what they prefer to spend their money on etc.
A questionnaire similar to the one we carried out in our investigation, but with different questions.
How much of an impact has outsourcing actually had on our shopping environment?
The number of shops in Bath whose origin isn’t British, for example Thai and Indian restaurants, or American companies such as McDonalds and many other shops.
We could use our land use maps from this investigation, and find out which shops on it are of British origin and which ones aren’t.
Extending our Evaluation
36 WWW.OCR.ORG.UK
GCSE GEOGRAPHY B EXEMPLAR CANDIDATE WORK
Appendices - Secondary Data
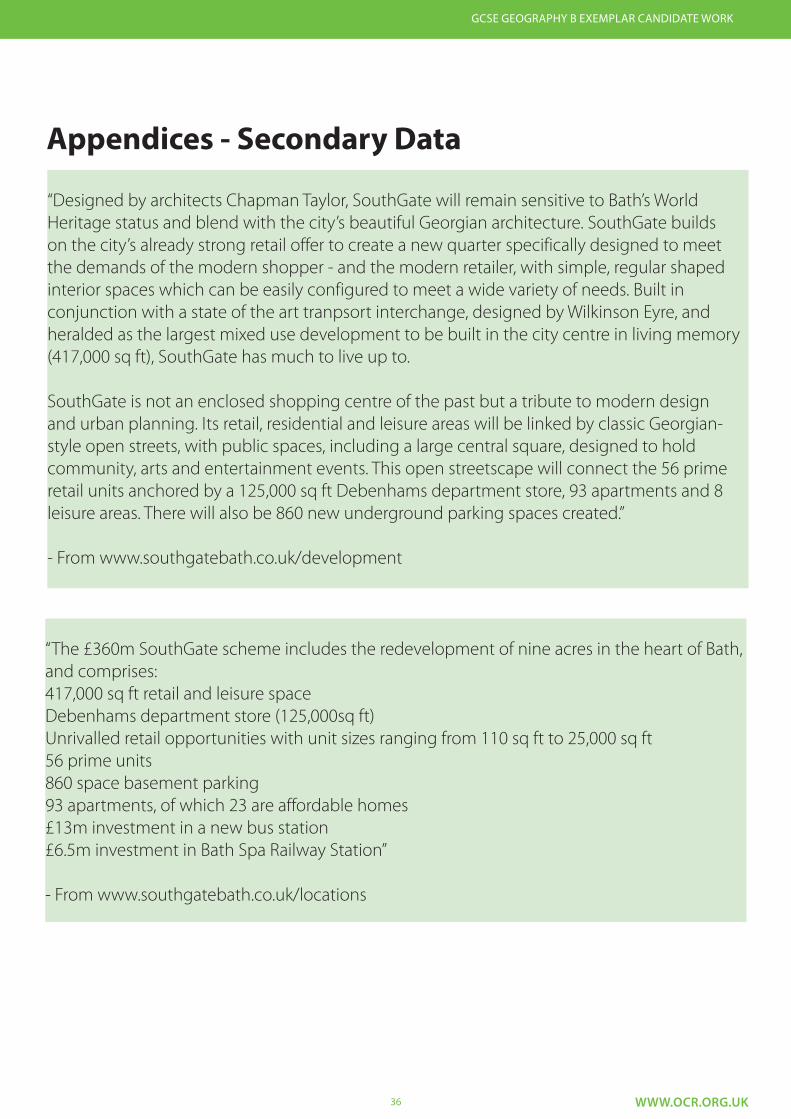
“Designed by architects Chapman Taylor, SouthGate will remain sensitive to Bath’s World Heritage status and blend with the city’s beautiful Georgian architecture. SouthGate builds on the city’s already strong retail offer to create a new quarter specifically designed to meet the demands of the modern shopper - and the modern retailer, with simple, regular shaped interior spaces which can be easily configured to meet a wide variety of needs. Built in conjunction with a state of the art tranpsort interchange, designed by Wilkinson Eyre, and heralded as the largest mixed use development to be built in the city centre in living memory (417,000 sq ft), SouthGate has much to live up to.
SouthGate is not an enclosed shopping centre of the past but a tribute to modern design and urban planning. Its retail, residential and leisure areas will be linked by classic Georgian-style open streets, with public spaces, including a large central square, designed to hold community, arts and entertainment events. This open streetscape will connect the 56 prime retail units anchored by a 125,000 sq ft Debenhams department store, 93 apartments and 8 leisure areas. There will also be 860 new underground parking spaces created.”
- From www.southgatebath.co.uk/development
“The £360m SouthGate scheme includes the redevelopment of nine acres in the heart of Bath, and comprises: 417,000 sq ft retail and leisure spaceDebenhams department store (125,000sq ft)Unrivalled retail opportunities with unit sizes ranging from 110 sq ft to 25,000 sq ft56 prime units860 space basement parking93 apartments, of which 23 are affordable homes£13m investment in a new bus station£6.5m investment in Bath Spa Railway Station”
- From www.southgatebath.co.uk/locations
37 WWW.OCR.ORG.UK
GCSE GEOGRAPHY B EXEMPLAR CANDIDATE WORK
Appendices - Secondary Data
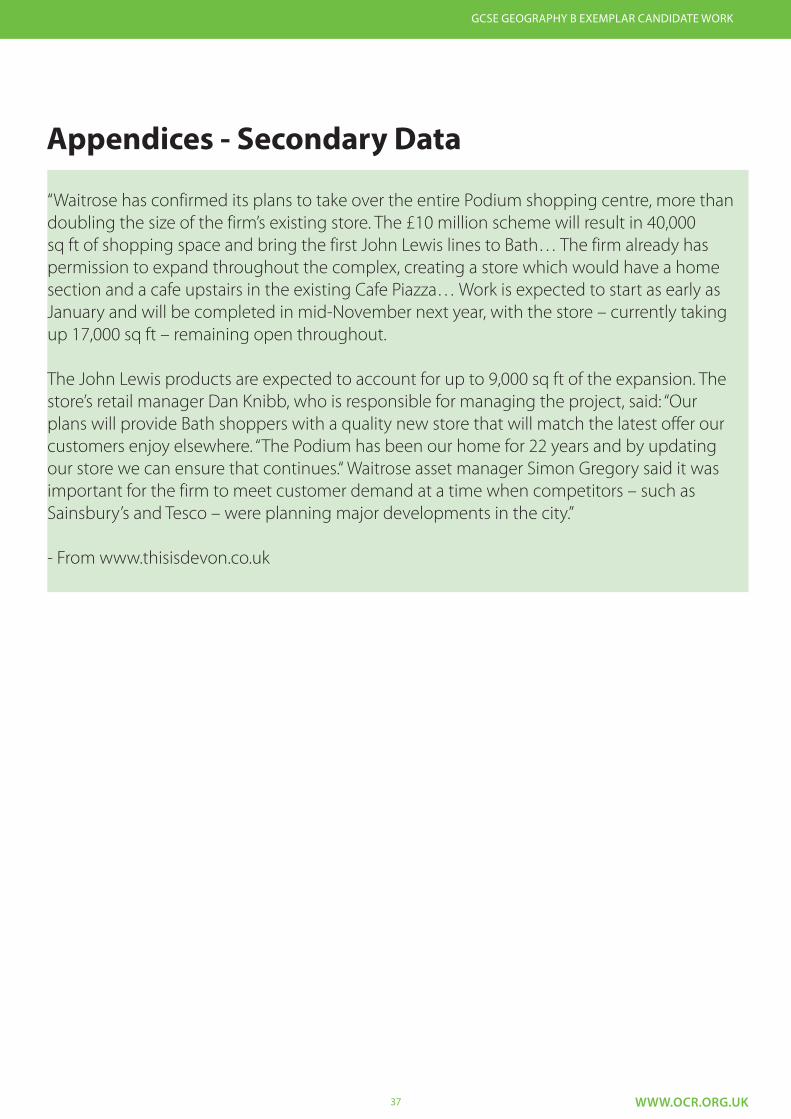
“Waitrose has confirmed its plans to take over the entire Podium shopping centre, more than doubling the size of the firm’s existing store. The £10 million scheme will result in 40,000 sq ft of shopping space and bring the first John Lewis lines to Bath… The firm already has permission to expand throughout the complex, creating a store which would have a home section and a cafe upstairs in the existing Cafe Piazza… Work is expected to start as early as January and will be completed in mid-November next year, with the store – currently taking up 17,000 sq ft – remaining open throughout.
The John Lewis products are expected to account for up to 9,000 sq ft of the expansion. The store’s retail manager Dan Knibb, who is responsible for managing the project, said: “Our plans will provide Bath shoppers with a quality new store that will match the latest offer our customers enjoy elsewhere. “The Podium has been our home for 22 years and by updating our store we can ensure that continues.“ Waitrose asset manager Simon Gregory said it was important for the firm to meet customer demand at a time when competitors – such as Sainsbury’s and Tesco – were planning major developments in the city.”
- From www.thisisdevon.co.uk
38 WWW.OCR.ORG.UK
GCSE GEOGRAPHY B EXEMPLAR CANDIDATE WORK
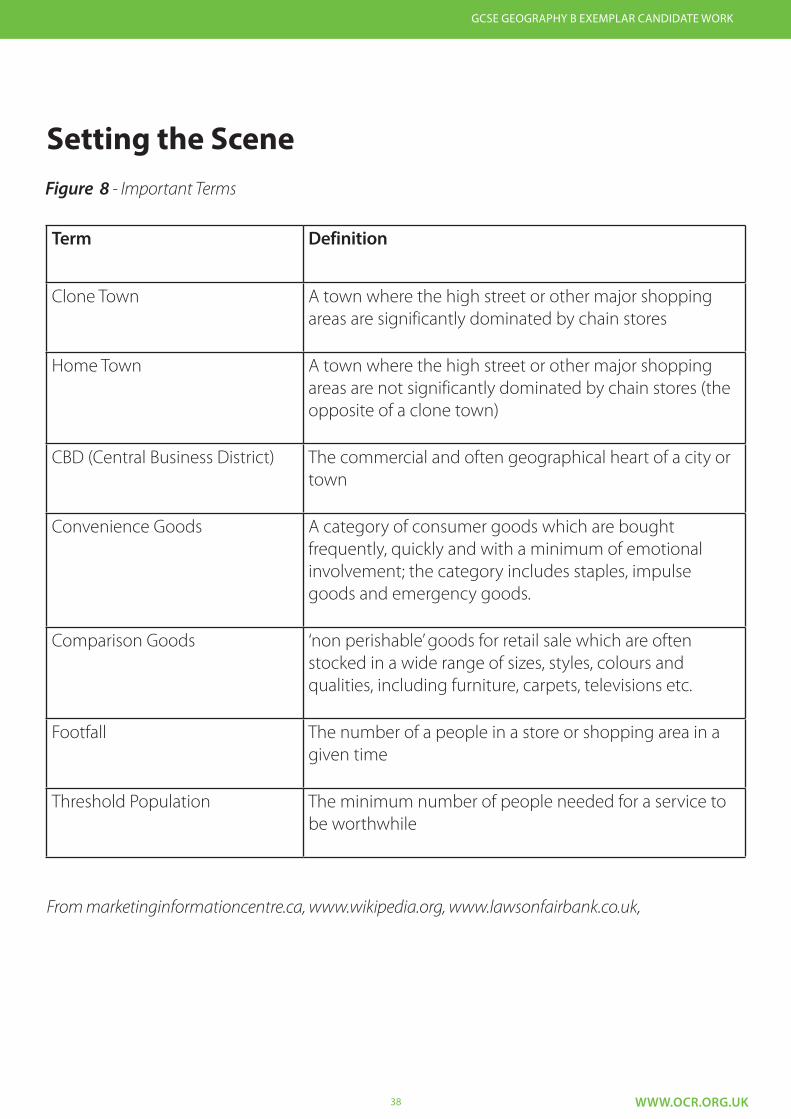
Figure 8 - Important Terms
Term Definition
Clone Town A town where the high street or other major shopping areas are significantly dominated by chain stores
Home Town A town where the high street or other major shopping areas are not significantly dominated by chain stores (the opposite of a clone town)
CBD (Central Business District) The commercial and often geographical heart of a city or town
Convenience Goods A category of consumer goods which are bought frequently, quickly and with a minimum of emotional involvement; the category includes staples, impulse goods and emergency goods.
Comparison Goods ‘non perishable’ goods for retail sale which are often stocked in a wide range of sizes, styles, colours and qualities, including furniture, carpets, televisions etc.
Footfall The number of a people in a store or shopping area in a given time
Threshold Population The minimum number of people needed for a service to be worthwhile
Setting the Scene
From marketinginformationcentre.ca, www.wikipedia.org, www.lawsonfairbank.co.uk,
39 WWW.OCR.ORG.UK
GCSE GEOGRAPHY B EXEMPLAR CANDIDATE WORK
How and why has the provision of goods and retail services in Bath City centre changed over time?
AO2 Application of knowledge and understanding in familiar and unfamiliar contexts• They have applied their knowledge and understanding to split the title into four key questions. They have made
some justification for these. They have also made reference to retail change in other contexts outside of Bath. They have also included in the appendices details about recent changes in Bath. Level 3 just, more justification of the key questions could have been given.
• They have stated what they expect to find with some reasoning. Level 3 just, more reason required.• They have located Bath on maps and images with basic headings. There is no description of the study area. Level
2 just, it needed a written description of the study area.• They have described and explained in consistently detailed way. Level 3Overall level 3 19 marks
AO3 Selection and use of a variety of skills, techniques and technologies to investigate, analyse and evaluate questions and issues: Selection, investigation and presentation.• They have suggested a wide variety of fieldwork techniques, land use survey, questionnaire, perception study,
footfall survey, photographs and secondary information from BANES in a methodology table. These were comprehensively and justified. Level 3
• They have obviously collected data as a class and taken photographs. However, their class questionnaire results should have been included and a copy of their questionnaire. A distinction between what are class and group results was needed. Level 3 just.
• They have presented their data in a wide range of appropriate maps, annotated photographs, graphs (bar and pie graphs only) and diagrams. Level 3 just, they could have drawn a wider range of graphs such as proportional symbols. Did they need to have so many graphs drawn?
• Their work is word processed and SPAG is accurate. Meaning is communicated clearly. Level 3• They have written with some precision and succinctness, but exceed the word limit. The use of tables in the
evaluation was counted as well as comments which were analysing graphs, but not annotating them. Some of the descriptions and analysis could have been more concise. Too many aspects of change were analysed and they could have cut down the word count by focusing on the key questions only. Level 2
Overall Level 3 15 marks
AO3 Selection and use of a variety of skills, techniques and technologies to investigate, analyse and evaluate questions and issues: selection, investigation and presentation.• They have suggested a wide variety of fieldwork techniques, land use survey, questionnaire, perception study,
footfall survey, photographs and secondary information from BANES in a methodology table. These were comprehensively and justified. Level 3
• They have obviously collected data as a class and taken photographs. However, their class questionnaire results should have been included and a copy of their questionnaire. A distinction between what are class and group results was needed. Level 3 just.
• They have presented their data in a wide range of appropriate maps, annotated photographs, graphs (bar and pie graphs only) and diagrams. Level 3 just, they could have drawn a wider range of graphs such as proportional symbols. Did they need to have so many graphs drawn?
• Their work is word processed and SPAG is accurate. Meaning is communicated clearly. Level 3• They have written with some precision and succinctness, but exceed the word limit. The use of tables in the
evaluation was counted as well as comments which were analysing graphs, but not annotating them. Some of the descriptions and analysis could have been more concise. Too many aspects of change were analysed and they could have cut down the word count by focusing on the key questions only. Level 2
Overall level 3 15 marks
40 WWW.OCR.ORG.UK
GCSE GEOGRAPHY B EXEMPLAR CANDIDATE WORK
AO3 Selection and use of a variety of skills, techniques and technologies to investigate, analyse and evaluate questions and issues: Analysis and evaluation• Interpretation of evidence is well integrated in the study to provide a coherent link with results and graphs.
Level 3• They have used their analysis to draw substantiated conclusions with data for each of the four key questions.
Level 3• A critical evaluation of the success and usefulness of their enquiry is made. Level 3• They have analysed thoroughly including limitations in their methodology table and in their evaluation. Level 3• They have made three Overall Level 3 18 marks
Overall this is top level 3 with 52 marks out of 60.
The major issue with this work is the excessive use of tables and to some extent text boxes which has meant the word limit has been exceeded. However, there is no doubting the quality of the enquiry skills undertook and the knowledge and understanding demonstrated by the candidate.
Contact us
For staff training purposes and as part of our quality assurance programme your call may be recorded or monitored.© OCR 2012 Oxford Cambridge and RSA Examinations is a Company Limited by Guarantee. Registered in England. Registered office 1 Hills Road, Cambridge CB1 2EU. Registered company number 3484466. OCR is an exempt charity.
Telephone 01223 553998Facsimile 01223 552627Email [email protected]
Keep up to date with the latest news by registering to receive e-alerts at www.ocr.org.uk/updates
www.ocr.org.uk/gcse2012