LAND USE CHANGES ALONG THE BOSPHORUS COASTS IN ISTANBUL BETWEEN 1987 AND 2007
13
Ozean Journal of Applied Sciences 5(4), 2012 271 LAND USE CHANGES ALONG THE BOSPHORUS COASTS IN ISTANBUL BETWEEN 1987 AND 2007 SUMEYRA KURT Istanbul University, Department of Geography, Fatih / Istanbul - Turkey E-mail address for correspondence: [email protected] _____________________________________________________________________________________ Abstract: Lately, significant land use change has been seen in the coastal regions of Istanbul Bosphorus as a result of fast urban growth and an increasing population. The object of this study is to determine changes in land use in coastal regions of Istanbul Bosphorus between 1987 and 2007. Two Landsat satellite images with 30 m resolution which were taken in 1987 and 2007 were classified using the maximum probability supervised classification method by means of ERDAS IMAGINE 9.1. Urban areas, agricultural areas, forest, bare soil, brush/grassland, and lake/pond are the six land use types in coastal regions extending one kilometer inland from the coastline. Land use changes between 1987 and 2007 were analyzed. According to this study, over the twenty year period, forest and brush/grassland regions decreased by 39% and 20% respectively, while urban areas increased by 12% in the Istanbul Bosphorus coastal region. Significant change in coastal land use was observed along the Istanbul Bosphorus in the study area. The study also provides an understanding of the current land use classes for the Istanbul Bosphorus coastal region. As can be seen from the results, almost half of the study area (66%) was urban areas in 2007. In 2007, only a small land area (1%) was dedicated to agriculture, while 24% of the land was occupied by grassland and bare soil in the study area. As the population continues to grow, the Istanbul Bosphorus coastal region is most likely to continue experiencing more pressure from urbanization in the future. To preserve the Istanbul Bosphorus coastal region, a sustainable coastal management plan must be applied. Keywords: Coastal land use, land use change, remote sensing, Bosphorus Coast of Istanbul. _____________________________________________________________________________________ INTRODUCTION Throughout history, coastal regions have been attractive as residential areas because of the existence of rich potential resources, and favourable conditions for transportation and climate. In periods when living conditions were difficult, irrigated farming and animal breeding activities and the existence of defensive capabilities provided by the sea made the coasts desirable residential areas (Gulez et al., 2007, Chen and Rau, 1998). Because they offer a lot of advantages to their inhabitants, coastal regions have been home to approximately two-thirds of the world population (Koksal, 2000). This has also brought problems with the increasing population, depending on their industrial activities, and people’s desire to mobilize towards the coasts and utilize the coast for recreational and touristic aims (Jayappa et al., 2006; Alonso and Ozean Journal of Applied Sciences 5(4), 2012 ISSN 1943-2429 © 2012 Ozean Publication
-
Upload
independent -
Category
Documents
-
view
0 -
download
0
Transcript of LAND USE CHANGES ALONG THE BOSPHORUS COASTS IN ISTANBUL BETWEEN 1987 AND 2007
Ozean Journal of Applied Sciences 5(4), 2012
271
LAND USE CHANGES ALONG THE BOSPHORUS COASTS IN ISTANBUL
BETWEEN 1987 AND 2007
SUMEYRA KURT
Istanbul University, Department of Geography, Fatih / Istanbul - Turkey
E-mail address for correspondence: [email protected]
_____________________________________________________________________________________
Abstract: Lately, significant land use change has been seen in the coastal regions of Istanbul Bosphorus
as a result of fast urban growth and an increasing population. The object of this study is to determine
changes in land use in coastal regions of Istanbul Bosphorus between 1987 and 2007. Two Landsat
satellite images with 30 m resolution which were taken in 1987 and 2007 were classified using the
maximum probability supervised classification method by means of ERDAS IMAGINE 9.1. Urban areas,
agricultural areas, forest, bare soil, brush/grassland, and lake/pond are the six land use types in coastal
regions extending one kilometer inland from the coastline. Land use changes between 1987 and 2007
were analyzed. According to this study, over the twenty year period, forest and brush/grassland regions
decreased by 39% and 20% respectively, while urban areas increased by 12% in the Istanbul Bosphorus
coastal region. Significant change in coastal land use was observed along the Istanbul Bosphorus in the
study area. The study also provides an understanding of the current land use classes for the Istanbul
Bosphorus coastal region. As can be seen from the results, almost half of the study area (66%) was urban
areas in 2007. In 2007, only a small land area (1%) was dedicated to agriculture, while 24% of the land
was occupied by grassland and bare soil in the study area. As the population continues to grow, the
Istanbul Bosphorus coastal region is most likely to continue experiencing more pressure from
urbanization in the future. To preserve the Istanbul Bosphorus coastal region, a sustainable coastal
management plan must be applied.
Keywords: Coastal land use, land use change, remote sensing, Bosphorus Coast of Istanbul.
_____________________________________________________________________________________
INTRODUCTION
Throughout history, coastal regions have been attractive as residential areas because of the existence of
rich potential resources, and favourable conditions for transportation and climate. In periods when living
conditions were difficult, irrigated farming and animal breeding activities and the existence of defensive
capabilities provided by the sea made the coasts desirable residential areas (Gulez et al., 2007, Chen and
Rau, 1998). Because they offer a lot of advantages to their inhabitants, coastal regions have been home to
approximately two-thirds of the world population (Koksal, 2000). This has also brought problems with
the increasing population, depending on their industrial activities, and people’s desire to mobilize towards
the coasts and utilize the coast for recreational and touristic aims (Jayappa et al., 2006; Alonso and
Ozean Journal of Applied Sciences 5(4), 2012
ISSN 1943-2429
© 2012 Ozean Publication
Ozean Journal of Applied Sciences 5(4), 2012
272
Cabrera, 2008). It has also caused changes in the nature of coastlines due to filling and construction
activities, while the fast-growing population and urbanization is changing the coastal regions. Physical
interference directly with the coastline also leads to destruction of their biological, ecological and
physical characteristics. For instance, because the coastal regions are faced with a high rate of growth,
34% of the coasts confront a high-level risk of damage and 17% confront a medium-level risk of damage,
according to the World Resources Institute. The coasts at risk are mostly north of the Equator and in
temperate regions. In addition, 86% of European coasts and 69% of Asian coasts are at risk (Mackenzie,
2003). So, nowadays it is clearly seen that changes in the land use of coastal regions are much greater
than in other places.
Over the centuries, civilizations have tended to prefer sea routes to land routes since they are
comparatively easier and cheaper. As sea trade improved at the international level over the course of time,
it caused the development of port cities and and an increase in their numbers. So, it can be said that many
coastal metropolises developed because of having useful seaports. Istanbul is one such port city. and is
the only city in the world that was established at the conjunction of two continents and on the Bosphorus
watercourse (Yenen et al., 1992). The city. which is located in the Kadikoy region, developed around
Eminonu in the Byzantine period and then expanded through Beyoglu, Uskudar, Eyup and Bosphorus
during the Ottoman period (IMM, 2009). Istanbul has a great historical and cultural heritage as a meeting
point for eastern and western civilizations by virtue of its geographical location, and so it was the capital
city of two of the biggest empires. It is still one of the most significant cities in the world. The Bosphorus
and the Golden Horn, which is an important internal sea port, have great importance as being the natural
water route for Istanbul (Ozbakir et al., 2007). The connection of Istanbul with water is different from
cities divided by canals such as Venice and Amsterdam, and also different from riverside cities like
London, Paris, and Frankfurt. The feature that distinguishes Istanbul is the Bosphorus, which splits the
city into two parts. This waterway, which connects the Mediterreanean Sea and the Black Sea, has been
of great importance throughout history (Ozdemir, 2004).
Istanbul Bosphorus is one of the key points for sea route transportation, and Istanbul’s harbours have
great importance in the transportation of petroleum from the Caucasus region to world markets. Because
of the increasing population, industrialization, and intense trade and tourism activities, Istanbul’s 450
kilometers of coastline are under pressure (Ayat et al., 2007). In particular, filling points for recreational
purposes have increased lately, causing important changes in the land use of the coastal regions of
Istanbul. Among the various reasons for changing land use in Istanbul’s coastal regions, the principal
factors are increasing population and urbanization. After 1950, Istanbul became enlarged via fast
urbanization resulting from the industrialization, which continued in the 1970s, and by the 1990s reached
today’s form, exacerbated by internal immigrations. Especially after 1950, the city saw fast and
unplanned urbanization as a result of excess immigration. Also, both the Bosphorus bridges constructed
in 1973 and 1987 contributed to the urban expansion (Erbek et al., 2004). According to the 1985
population census, the number of inhabitants in the coastal regions was 5,299,647 but it had increased to
8,157,853 by 2007 (TSI, 2007). The greater part of this population lives in coastal regions. With the
increasing population, urbanization extended along the Marmara Sea coast, on a west-east axis, to the
north and on both sides of the Bosphorus in Istanbul (Karaburun et al., 2009). The rapid population rise
and uncontrolled urban growth have not only transformed natural environments into urban areas, but also
destroyed the spectacular views of the coast and the surrounding areas in the Bosphorus region. For
example, the waterside houses constructed at the Bosphorus, a considerable number of which are second
homes, are among the kinds of seaside developments that have played a great role in construction on the
Istanbul coasts in recent years. Especially after 1950, this has led to changing the coastlines with the fast
growth resulting from urbanization and industrialization (Kilicaslan, 2006; Bayram et al. 2008).
Several plans have been drawn up in order to protect the natural and cultural assets of the Bosphorus
region (Selcuk and Gulersoy 2004). The first step taken was for the protection of historical mansions
located along the coasts of the region. In 1972, the old plan was revised to protect 365 historical mansions
located along the Bosphorus (Pilgir 1992, Eyuboglu 1998). The first special revision plan which was on a
scale of 1/5000 was the protection plan of 1971 (IMM,1971). The aim was to provide compliance
between the new construction and existing historical construction (Selcuk & Gulersoy 2004). The
southern part of the Bosphorus region was declared a natural protected area, and this was thought to be a
most important step for the protection of historical mansions and forest zones. The 1/5000 plan was
revised in 1983 (CNHPB, 1974). Because all of these plans were insufficient for the protection of the
Bosphorus’s natural and cultural values, another Bosphorus plan on a scale of 1/1000 was enacted (Elgun
Ozean Journal of Applied Sciences 5(4), 2012
273
1994). According to this plan, the Bosphorus region was divided into 4 different sections: the coastline,
preview, back view and affected region. Although several different strategies were developed for each
region, the most important zones were the coastline and preview, because both of these were directly
visible from the Bosphorus (Selcuk and Gulersoy, 2004; Pilgir, 1992; Official Newspaper, 1983). In fact,
illegal housing had reduced the heavily forested area, especially in the northern part which was not
included in the urbanization plan of 1974. Two districts (Sariyer and Beykoz) were declared as a natural
protected area in 1995 because they had the administration of the areas located on both sides of the
Bosphorus in the north (CNHPB, 1995). Increasing population and unbalanced urban growth are still the
most significant problems for the region despite the laws and urban plans enacted since 1970.
Various studies have been done in different years that are relevant to changes in the Istanbul Bosphorus
region. These include the following: “Istanbul Bosphorus as our Cultural Heritage, The Process of
Change over Time”, “An Appraisal of Bosphorus Coastlines’ Visual Qualities from the Perspective of
Tourism”, “Assessment of Urban Growth in a Natural Protected Area Using Multi-Temporal Satellite
Data – a Case Study of the Strait of Istanbul (Bosphorus)” (Demirci et al., 2009; Baytin et al., 2003,
Hatipoglu, 1997).
The study of “Assessment of Urban Growth in a Natural Protected Area Using Multi - Temporal Satellite
Data - a Case Study of the Strait of Istanbul (Bosphorus)” determined the land use change and variations
in the preview region and coastline of Istanbul Bosphorus from 1974, which were declared a natural
protected area in 2007 (Demirci et al., 2009). The study of “Istanbul Bosphorus as our Cultural Heritage,
The Process of Change over Time” determined the cultural heritage and natural environment features of
the Bosphorus region from the perspective of landscape and sustainable development (Baytin et al.,
2003). The study of “An Appraisal of Bosphorus Coastlines’ Visual Qualities from the Perspective of
Tourism” reported on variations in the Istanbul Bosphorus region from the perspective of tourism
(Hatipoglu, 1997).
The difference of our study from the others is in the use of remote sensing techniques to determine the
land use change on the Istanbul Bosphorus coastline from 1987 to 2007 including areas that are located
1000 meters inland.
When we take into account that Istanbul is the cultural capital of Europe in 2010, the importance of
utilizing the coasts can be clearly realised. The Istanbul Bosphorus coast has been more changed by
human activities than other coastal regions of Turkey. This is why an effective observation is needed in
this context. This study aims to answer the questions stated below:
1. What changes concerning the land use along Istanbul Bosphorus coastal areas occurred between
1987 and 2007?
2. What kind of arrangements/legislation are needed in coastal land use in order to
manage urbanization activities according to modern urban criteria?
Study Area
Istanbul, bounded by the water separation line of Ergene catchment to the west, the Marmara Sea to the
south, the Kocaeli mountain range to the east and the Black Sea to the north, is located between 27 ̊58 ̍–
29̊ 56 ̍E longitude and 40̊̊ 48̍ – 41̊ 36 ̍N latitude. The city, established in the northwest of Turkey along the
Marmara Sea and Bosphorus, is like a bridge connecting Asia and Europe. The western side of the
Bosphorus is called Rumelia and the eastern side is Anatolia. The city has 32 counties (IMM, 2007) and
an area of 5512 square kilometers (IMM, 2009). It looks like a peninsula as it is surrounded by Halic, the
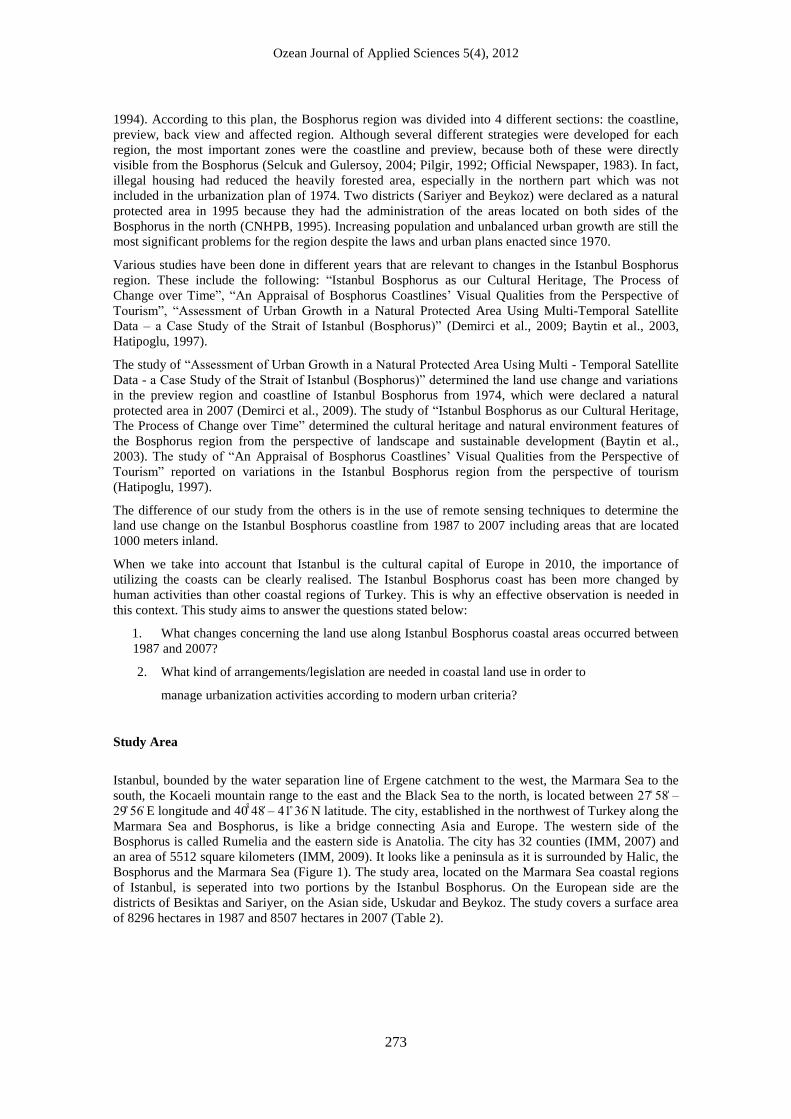
Bosphorus and the Marmara Sea (Figure 1). The study area, located on the Marmara Sea coastal regions
of Istanbul, is seperated into two portions by the Istanbul Bosphorus. On the European side are the
districts of Besiktas and Sariyer, on the Asian side, Uskudar and Beykoz. The study covers a surface area
of 8296 hectares in 1987 and 8507 hectares in 2007 (Table 2).
Ozean Journal of Applied Sciences 5(4), 2012
274
Figure 1: Study Area
From the initial point of the Asian and Europe fortresses, the Bosphorus reaches to Uskudar on the Asian
side and Tophane on the European side, including valleys, savannas, bays and capes. The width of the
Bosphorus is about 3600 m between the Asian and European phenars, and is 760 meters between the
Anatolian and Rumeli castles. This is the narrowest distance between the Asian and European sides of the
Bosphorus. While the inclination on the western side of the Bosphorus varies from 10 % to 30 %, it
begins from 5 % on the Anatolian side. The Halic, or “Golden Horn”, is 500 meters in breadth till
Beyoglu, and 5 kilometers in length as an internal port area (Ozdemir, 2004).
MATERIALS AND METHODS
Nowadays, various kinds of methods are used depending on technological developments in order to
determine variations of land use in coastal regions. Year by year, coastal areas, depending upon seasonal
and daily events, are continuously changing and require monitoring in specific locations and periods.
Since the classical methods take longer to process, Geographic Information Systems (GIS) and Remote
Sensing (RS) technologies are preferred as the most convenient methods (Sesli, 2006, Fan et al., 2007).
Geographic Information Systems (GIS) can easily be used without any risk of destruction or the effect of
pollutant factors, and enables the maintenance of the sustainable life and integrity of the triangle
composed of nature, environment and people (Sesli et al., 2002). Because it is so much easier to record,
analyse and reprocess information with GIS, it is known as an effective method in coastal management,
and determining coastal and coastline changes. The importance of GIS has increased due to the possibility
of taking early precautions by determining and controlling changes to prevent environmental degradation.
GIS provides an important mechanism for geographic-based information storage, analysis, use and image.
Ozean Journal of Applied Sciences 5(4), 2012
275
Additionally, GIS is used as a reflection of the transition to the information age in urban and
infrastructure information systems, applications, land use and planning applications, environmental
applications, geological applications, forestry and agricultural applications, business applications and
security applications (Colkesen and Sesli, 2007; Doygun et al., 2003).
Today, it is possible to obtain the information required by means of remote sensing data in a reliable and
economical way within a short time. For this reason, remote sensing is one of the most preferred and
reliable sources in many fields of study (Tunay and Atesoglu, 2004; Fan et al., 2007; Yuan, 2008).
Remote Sensing (RS) is used in many applications such as monitoring arid and semi-arid areas,
monitoring agricultural areas and controlling the variations, especially taking precautions against
environmental degradation (Doygun et al., 2003; Deng et al., 2008). Satellites used in Remote Sensing are
LANDSAT, TERRA, SPOT, ESR, IRS, MOS, JERS, Radarsat satellites, and also IKONOS and
Quickbird, which have high-resolution satellites. In this study, images from the LANDSAT satellite were
used (Compton et al., 2004).
The spectral differences among the various land-cover types are used for land-cover classification (Cihlar
et al., 2000). The process of assigning pixels to particular spectral classes in remotely sensed data is
called classification. A map-like image is the final product of the classification process of remotely
sensed data (Campbell, 2002). Supervised and unsupervised classifications are the main types of
classifications. Supervised classification is used to extract quantitative information from remotely sensed
image data (Richards, 1995).
In this type of classification, pixels that represent the classes to be extracted from the image data were
used. The maximum similarity is the most common method used in supervised classification with
remotely sensed images (Richards, 1995). In this study, the maximum similarity supervised classification
method was used to classify image data. Training areas were defined on the image data to collect pixels
that represent specific land-use classes.
The LANDSAT satellite images, with 30 m ground resolution, produced in 1987 and 2007 were classified
with the maximum probability supervised classification method by means of the ERDAS IMAGINE
program, and verified using the reference data in hand. After editing the classification results and
converting them to vectors using the ArcGIS program, they were ready to use in the GIS questionable
analysis medium. In the first stage of the classification process, image data was subjected to Principal
Component Analysis. After the transformation process of the principal components is completed, the
signature collection process followed by checking the reference data. The signatures of previously
designated classes are collected and signatures continue to be collected until the most suitable classified
image data for the reference data is achieved. After completing the signature process, the classification
process was initiated using controlled classification methods of the highest possibility method.
The recode process was done by joining each signature data item obtained after classification. Thus, the
classes of the image data were defined. After the process was done using the ERDAS program, the data
obtained was converted from the raster format to vector format using the ArcGIS program. The vector of
the data was checked with the reference data, and some areas that were confused in the first editing
process were corrected by editing methods. As a result of this process, the final data was obtained. The
general categories used in the classification were: urban areas, agricultural areas, bare soil,
brush/grassland, lake/pond, forest and cloud. The reason for including cloud was that the LANDSAT
image in 1987 also included the cloud class. Since ships in this image could be eliminated by editing
method, there was no need for a new class.
Verification analysis of this application was done with ERDAS 9.1 software. Initially, 100 points were
taken randomly, proportional with the areas that were found before filtering using the software. Before
obtaining the verification analysis, each point taken automatically was controlled manually using the
information from the ground actuality. Ground actuality information was obtained using a combination of
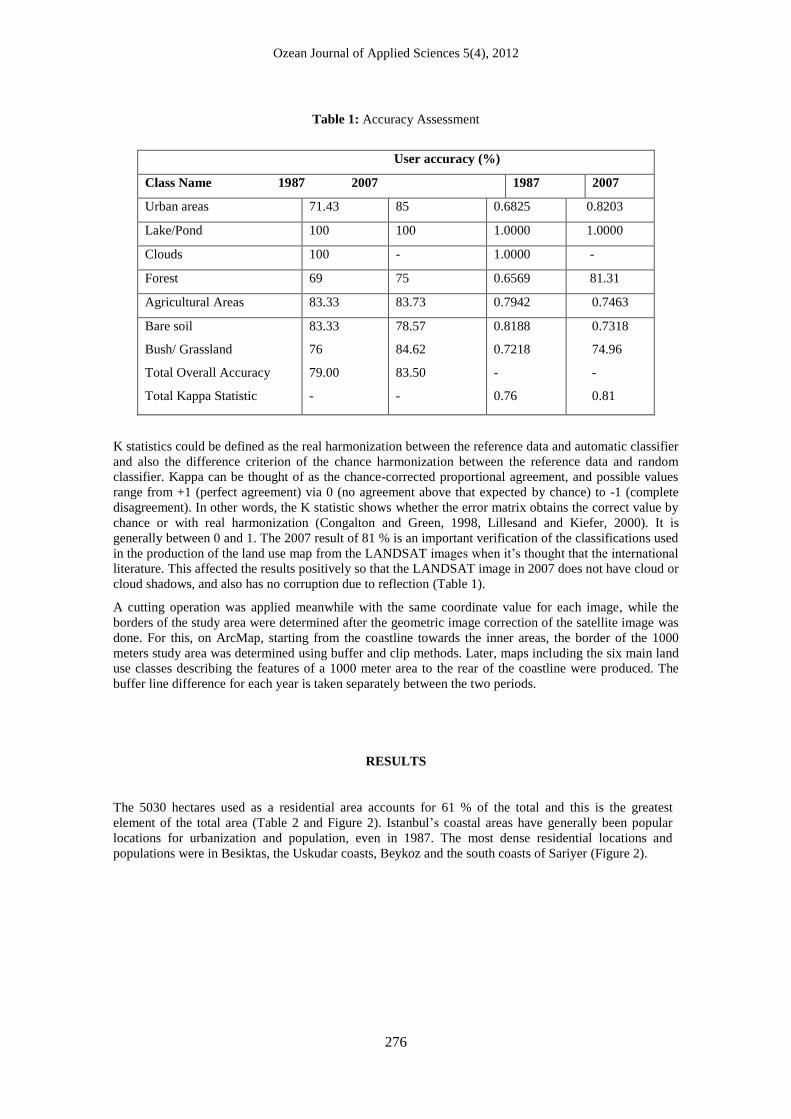
the LANDSAT image, natural bands and recent orthophotos (Table 1).
Ozean Journal of Applied Sciences 5(4), 2012
276
Table 1: Accuracy Assessment
User accuracy (%)
Class Name 1987 2007 1987 2007
Urban areas 71.43 85 0.6825 0.8203
Lake/Pond 100 100 1.0000 1.0000
Clouds 100 - 1.0000 -
Forest 69 75 0.6569 81.31
Agricultural Areas 83.33 83.73 0.7942 0.7463
Bare soil
Bush/ Grassland
Total Overall Accuracy
Total Kappa Statistic
83.33
76
79.00
-
78.57
84.62
83.50
-
0.8188
0.7218
-
0.76
0.7318
74.96
-
0.81
K statistics could be defined as the real harmonization between the reference data and automatic classifier
and also the difference criterion of the chance harmonization between the reference data and random
classifier. Kappa can be thought of as the chance-corrected proportional agreement, and possible values
range from +1 (perfect agreement) via 0 (no agreement above that expected by chance) to -1 (complete
disagreement). In other words, the K statistic shows whether the error matrix obtains the correct value by
chance or with real harmonization (Congalton and Green, 1998, Lillesand and Kiefer, 2000). It is
generally between 0 and 1. The 2007 result of 81 % is an important verification of the classifications used
in the production of the land use map from the LANDSAT images when it’s thought that the international
literature. This affected the results positively so that the LANDSAT image in 2007 does not have cloud or
cloud shadows, and also has no corruption due to reflection (Table 1).
A cutting operation was applied meanwhile with the same coordinate value for each image, while the
borders of the study area were determined after the geometric image correction of the satellite image was
done. For this, on ArcMap, starting from the coastline towards the inner areas, the border of the 1000
meters study area was determined using buffer and clip methods. Later, maps including the six main land
use classes describing the features of a 1000 meter area to the rear of the coastline were produced. The
buffer line difference for each year is taken separately between the two periods.
RESULTS
The 5030 hectares used as a residential area accounts for 61 % of the total and this is the greatest
element of the total area (Table 2 and Figure 2). Istanbul’s coastal areas have generally been popular
locations for urbanization and population, even in 1987. The most dense residential locations and
populations were in Besiktas, the Uskudar coasts, Beykoz and the south coasts of Sariyer (Figure 2).
Ozean Journal of Applied Sciences 5(4), 2012
277
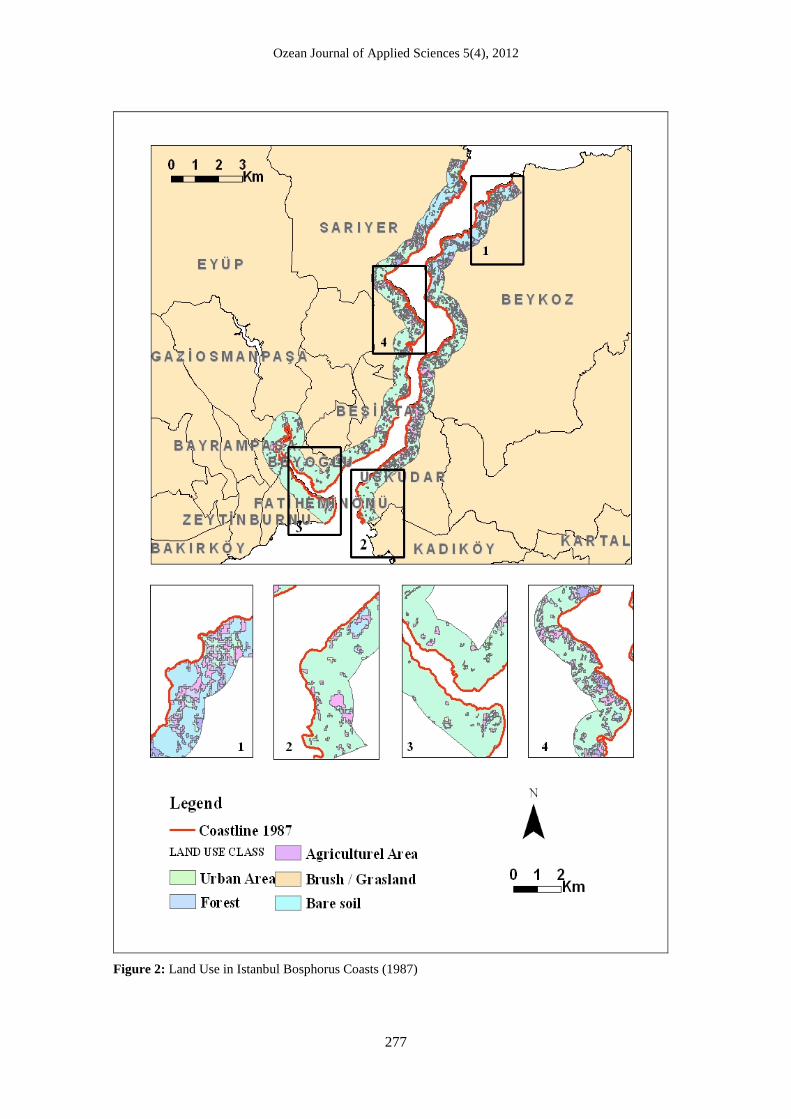
Figure 2: Land Use in Istanbul Bosphorus Coasts (1987)
Ozean Journal of Applied Sciences 5(4), 2012
278
Brush/grassland is the second land-use class in the study area in 1987. The total area of brush/grassland
is 1776 hectares in 1987. This was 21 % of the total area. Brush/grassland is generally dense around the
forest areas. The reason for this is destruction of forests in areas wanted for construction. Due to the
increasing construction and urbanization, brush/grassland and forest areas were destroyed especially in
Sariyer and the north side of the Beykoz coasts (Table 2, Figure 2).
The forests on the Bosphorus coasts covered 17 % of the area with 1429 hectares in 1987. In that year,
the districts with the densest forest areas were Beykoz and the northern coasts of Sariyer. In these
districts, the areas including parks and groves are the other places that show the existence of forest in the
Bosphorus (Figure 2). After forest, the largest land class is bare soil or naked land surfaces. This covered
41 hectares of the working area in 1987 and was 0.49 % of the total (Table 2). The most dense locations
of blank lands are in Beykoz and the north side of Sariyer (Figure 2).
Agricultural areas cover only 19 hectares or 0.23 % of the Istanbul Bosporus coasts in 1987. In that year
agricultural areas were most dense in Beykoz and the north side of Sariyer (Figure 2). The sections
referred to as lake/pond form 7 % and 0.06 hectare of the total working area in 1987 (Table 2).
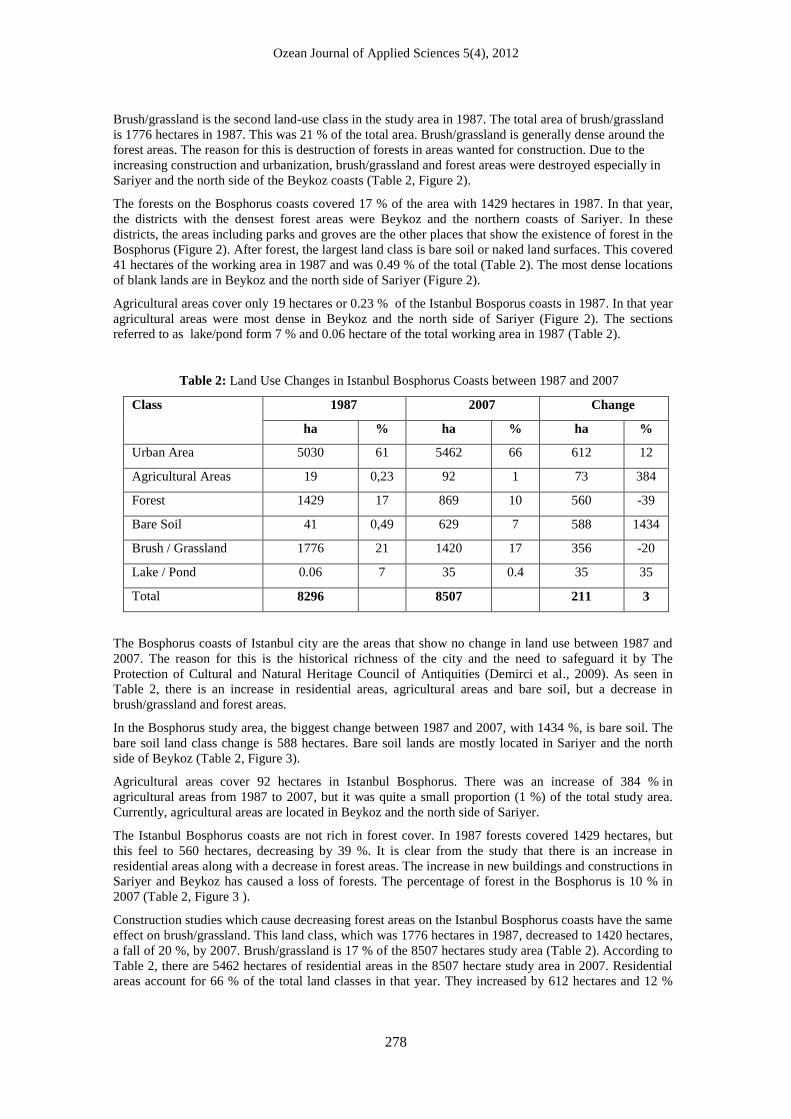
Table 2: Land Use Changes in Istanbul Bosphorus Coasts between 1987 and 2007
Class 1987 2007 Change
ha % ha % ha %
Urban Area 5030 61 5462 66 612 12
Agricultural Areas 19 0,23 92 1 73 384
Forest 1429 17 869 10 560 -39
Bare Soil 41 0,49 629 7 588 1434
Brush / Grassland 1776 21 1420 17 356 -20
Lake / Pond 0.06 7 35 0.4 35 35
Total 8296 8507 211 3
The Bosphorus coasts of Istanbul city are the areas that show no change in land use between 1987 and
2007. The reason for this is the historical richness of the city and the need to safeguard it by The
Protection of Cultural and Natural Heritage Council of Antiquities (Demirci et al., 2009). As seen in
Table 2, there is an increase in residential areas, agricultural areas and bare soil, but a decrease in
brush/grassland and forest areas.
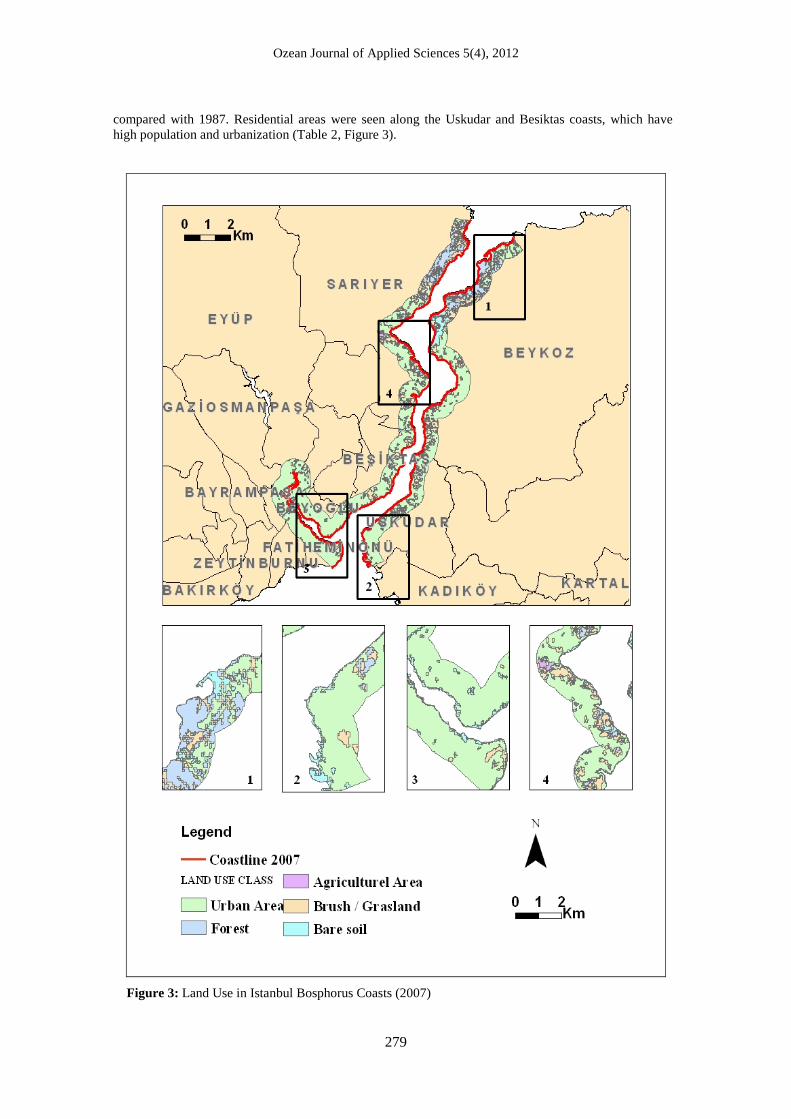
In the Bosphorus study area, the biggest change between 1987 and 2007, with 1434 %, is bare soil. The
bare soil land class change is 588 hectares. Bare soil lands are mostly located in Sariyer and the north
side of Beykoz (Table 2, Figure 3).
Agricultural areas cover 92 hectares in Istanbul Bosphorus. There was an increase of 384 % in
agricultural areas from 1987 to 2007, but it was quite a small proportion (1 %) of the total study area.
Currently, agricultural areas are located in Beykoz and the north side of Sariyer.
The Istanbul Bosphorus coasts are not rich in forest cover. In 1987 forests covered 1429 hectares, but
this feel to 560 hectares, decreasing by 39 %. It is clear from the study that there is an increase in
residential areas along with a decrease in forest areas. The increase in new buildings and constructions in
Sariyer and Beykoz has caused a loss of forests. The percentage of forest in the Bosphorus is 10 % in
2007 (Table 2, Figure 3 ).
Construction studies which cause decreasing forest areas on the Istanbul Bosphorus coasts have the same
effect on brush/grassland. This land class, which was 1776 hectares in 1987, decreased to 1420 hectares,
a fall of 20 %, by 2007. Brush/grassland is 17 % of the 8507 hectares study area (Table 2). According to
Table 2, there are 5462 hectares of residential areas in the 8507 hectare study area in 2007. Residential
areas account for 66 % of the total land classes in that year. They increased by 612 hectares and 12 %
Ozean Journal of Applied Sciences 5(4), 2012
279
compared with 1987. Residential areas were seen along the Uskudar and Besiktas coasts, which have
high population and urbanization (Table 2, Figure 3).
Figure 3: Land Use in Istanbul Bosphorus Coasts (2007)
Ozean Journal of Applied Sciences 5(4), 2012
280
CONCLUSIONS
Changes in land cover over 20 years were observed in the study by using images from the 30 m resolution
LANDSAT TM data of 11 May 1987 and 11 May 2007. It was seen that the human factors - such as
filling of coasts and transfer of sand- had greater effects than natural factors, in the general use of coasts
at the search area.
The Bosphorus coastlines in particular and Istanbul in general, as one of the most significant metropolitan
areass of the world with its cultural and historical values, are under pressure from intensive construction.
Gradually, people living in Istanbul are being deprived of recreational use of the coastline and sea. With
the aim of benefitting the people along the coasts, Istanbul Municipality took action just after 1984
(Atakan, 2003). The coastal areas which have been gained by filling have been opened for potential
recreational use in line with this objective. This is still in progress even nowadays.
The study area includes 4 districts of Istanbul and 1,292,419 people according to 2007 data. The buffer
region, comprising 1000 meters inland from the coastline, incorporated a total of 8296 hectares in 1987.
This buffer area expanded to 8507 hectares with filling additions by 2007.
In the area of study, it was clear that recreation, transportation, accommodation, and shopping areas were
the main ways of using the coastal filling areas. Recreational areas include pedestrian and cycle paths, tea
gardens, playgrounds, parks, and picnic areas. For transportation purposes, generally sea ports and coastal
highways attract attention.
In the study area in 2007, 5462 hectares were used as residential areas while 92, 869, 629, and 1420
hectares were used as agricultural land, forest, bare soil, and bush/grassland, respectively.
Whereas the residential area was expanding until 2007, forest, bush/grassland, and bare soil areas
decreased (Table 2). In the study area, it was observed that construction started just behind the coastal line
in 1987, but in 2007 these buildings were left behind the roads and parks as a result of coastal filling
activities.
Some proposals, listed below, are relevant to the possible solution of all the problems mentioned and to
help develop precautions to ensure the proper use of the coasts.
It is provided that coastal areas should be easily accessible to the public, as mentioned in Article 43 of the
Constitution of 2709 in 1982, which states that coastal areas are under the provisions and care of the state.
Moreover, according to Article 715 of Civil Law 4721 in 2001, coastal areas cannot be in the private
ownership of anybody (Sesli et al., 2003). For this reason, measures should have been taken to prevent the
construction of any building in the areas determined to be within coastlines by law. According to the
active Item 5 of the coastal law, construction and planning should not have been allowed on coasts where
the coastline has not been determined. Relevant to this subject, municipalities that govern the coastal
areas should protect coastal areas from the pressure of private properties and public institutions by
establishing regulations for the benefit of society.
In addition, coastal fillings have changed the contours of the Istanbul Bosphorus coasts, and beaches
used by the public have been destroyed as a result of coastal fillings. It can be seen that coastal fillings
have destroyed the topographic structure and the silhouette of the coast in such places. Instead of filling
the coasts for the rearrangement of the Istanbul Bosphorus coastal areas, it is necessary to determine new
approaches to reclaim coastal areas, and prevent the loss of natural coastlines.
Particularly as the Istanbul Bosphorus coasts are attractive areas for tourism, problems related to the
organization and handling of aspects such as tourism, transportation, infrastructure, industry, and
recreation, need to be resolved with a holistic plan.
Nowadays, especially waterside residences and private properties built on the Bosphorus coastline have
cut the link between the people and the sea. By enforcing new regulations, coastal areas in such places
need to be deprivatized. Moreover, with the help of new arrangements, the objective of balancing the
interests of the city and the sea must be realized.
Excessive construction and mistakes in the use of land in the coastal areas of Istanbul must be prevented
by legal measures, and all future applications must be inspected.
Ozean Journal of Applied Sciences 5(4), 2012
281
REFERENCES
Alonso, A., Alcántara-Carrió, J., and Cabrera, L. (2008). Tourist Resorts and their Impact on Beach
Erosion at Sotavento Beaches, Fuerteventura, Spain. Journal of Coastal Research SI 36 1-7
(ICS 2002 Proceedings).
Atakan, B. (2003). Study in Regard of Landscape of the Shore Filling Areas between Kuyumcular-Pendik
and Maltepe-Kartal of the City Istanbul” Istanbul University, Institute of Science, Department
of Landscape Architecture, Master Thesis, Istanbul (in Turkish).
Ayat, B., Uzmez, Z., Cevik, E. O., and Yuksel, Y. (2007). Planning and Management of Coastal Areas in
Istanbul, “5. National Symposium on Urban Infrastructure Proceedings”, 1-2 November 2007,
Antakya, Turkey: 217-231.
Bayram, B., Acar, U., Seker, D. Z., and Ari, A. H. (2008). A Novel Algorithm for Coast Line Fitting
Through A Case Study Over the Bosphorus. Journal of Coastal Research 24(4): 983–991.
Baytin, C., Canbay Turkyilmaz, C., Kiran, A., and Tunbis, M. (2003). Istanbul-Bosphorus as our Cultural
Heritage: The Change over Time. 19th International CIPA Symposium: “New Perspectives to
Save the Cultural Heritage”, 30 Sept–4 Oct 2003, Antalya, Turkey: 748–753.
Campbell, J. B. (2002). Introduction to Remote Sensing. New York: The Guilford Press.
Chen, L. C., and Rau, J. Y. (1998). Detection of Shoreline Changes for Tideland Areas Using Multi-
temporal Satellite Images. International Journal of Remote Sensing 19(17): 3383- 3397.
Cihlar, J., Latifovic, R., and Beaubien, J. 2(000). A comparison of Clustering Strategies for Unsupervised
Classification. Canadian Journal of Remote Sensing 26(5): 446–454.
Compton, J., T., Denelle, M., G., and Jon, D., D., (2004). NASA’s Global Orthorectified Landsat Data
Set, Photogrammetric Engineering & Remote Sensing, 70(3): 313-322.
Congalton, R. G., and Green, K. 1998. Assessing the Accuracy of Remotely Sensed data: Principles and
Practices. New York: Lewis Publishers.
Colkesen, İ., and Sesli, F. A. (2007). Monitoring the Changing Position of Coastlines Using Information
Technologies, an Example of Trabzon: “Turkish Engineers and Architects of Chambers of
Union, National Geographic Information Systems Conference”, Proceedings, 30 October -02
November, Blacksea Technical University, Trabzon, Turkey: 607-614.
Demirci, A., Karaburun, A., and Kurt, S. (2009). Assessment of Urban Growth in a Natural Protected
Area Using Multi-Temporal Satellite Data: A Case Study of the Strait of Istanbul (Bosphorus).
Fresenius Environmental Bulletin 18(9a): 1701-1708.
Deng, J. S, Wang, K., Deng, Y. H., and Qi, G. J. (2008). PCA-based land-use change detection and
analysis using multitemporal and multisensor satellite data. International Journal of Remote
Sensing 29(16): 4823-4838.
Doygun, H., Berberoglu, S., and Alphan, H. (2003). The Determination of Land Use Changes By Using
Remote Sensing in Burnaz Coastal Dunes, Hatay. Ekoloji 12(48): 4-9.
Elgun, Y. (1994). Factors Directing Urban Planning and Urban modeling from a Historical Perspective
(in Turkish). Unpublished Graduate Thesis, Istanbul Technical University, Istanbul (in
Turkish).
Erbek, F. S., Ozkan, C., and Taberner, M. (2004). Comparison of Maximum Likelihood Classification
Method with Supervised Artificial Neural Nnetwork Algorithms for Land Use Activities.
International Journal of Remote Sensing 25(9): 1733–1748.
Ozean Journal of Applied Sciences 5(4), 2012
282
Eyuboglu, E. 1998. Factors directing urban modeling in history: Istanbul case (in Turkish). Unpublished
PhD dissertation, Istanbul Technical University, Istanbul (in Turkish).
Fan, F., Wang, Y., and Wang, Z. (2007). Temporal and Spatial Cchange Detecting (1998-2003) and
Predicting of Land Use and Land Cover in Core Corridor of Pearl River Delta (China) by using
TM and ETM+ images. Environmental Monitoring and Assessment 137(1-3): 127-47.
Gulez, S., Kaya, L. G., Donmez, S., Cetinkale, S. G., and Kocan, N. (2007). A Study on the Landscape
Design for the Mugada Coastal Land. Karaelmas University, Journal of Bartin Faculty of
Forestry, 9(12): 1-10.
Hatipoglu, A. (1997). An Apprise of Bosphorus Coast Lines Visual Qualities in the View of Tourism”,
Unpublished Master Thesis, Istanbul Technical University, Institute of Science, Istanbul (in
Turkey).
IMM, Istanbul Metropolitan Municipality (2009). http://www.ibb.gov.tr , accessed 15 May 2009.
IMM. (1971). Istanbul Metropolitan Municipality. Bosphorus Coastline Conservation Plan on a Scale of
1/5000, 15 July 1971, Istanbul (in Turkish).
IMM. (2007). 2008-2012 Strategic Plan. Istanbul Water and Sewerage Administration (IWSA), Istanbul
(in Turkish).
Jayappa, K. S., Mitra, D., and Mishra, A. K. (2006). Coastal geomorphological and land-use and land-
cover study of Sagar Island, Bay of Bengal (India) using remotely sensed data. International
Journal of Remote Sensing 27(17): 3671–3682.
Karaburun, A., and Demirci, A. (2009). The Changing Risks of Agricultural Activities on Water
Resources in Rapidly Urbanized Areas: Agricultural Land Cover Change in Istanbul between
1987 and 2007. Fresenius Environmental Bulletin 18(11a): 2181-2191.
Kilicaslan, C. (2006). Impacts Of Second Homes Upon The Coastal Areas,” Suleyman Demirel
University, Forestry Faculty of Journal, Series A, (1): 147-156.
CNHPB, (1974). The Protection of Cultural and Natural Heritage Council. Supreme Council of
Monuments’ Real Estate Antiquities Report, n. 8172, Ankara (in Turkish).
CNHPB, (1995). Decision of The Protection of Cultural and Natural Heritage Council in Istanbul
(Ccouncil III) entitled “Natural protected lands in the northern parts of Istanbul, along the
Black Sea”, n. 7755, 15 November 1995 (in Turkish).
Lillesand, T. M., and Kiefer, R.W. (2000). Remote Sensing and Image Interpretation. New York: John
Wiley.
Mackenzie, T. F. (2003). Our Changing Planet. New Jersey, Prentice Hall.
Ozbakir, B. A., Bayram, B., Acar, U., Uzar, M., Baz, I., and Karas, I. R. (2007). Synergy between
Shoreline Change Detection and Social Profile of Waterfront Zones: A Case Study in Istanbul.
Joint Meeting of ISPRS Commission VII WG2 & WG7, Conference on Information Extraction
from SAR and Optical Data, 16-18 May 2007 Istanbul, ISSN No: 1682-1777, Volume:
XXXVI-7/C46.
Ozdemir, E. (2004). A the Research of Filled Areas on IStanbul Shore in Recreational Usage in Aspects
of Plannıg the Model of Istanbul Avcılar”, PhD Thesis, Istanbul University, Faculty of
Forestry, Department of Landscape Architecture, Istanbul (in Turkish).
Ozean Journal of Applied Sciences 5(4), 2012
283
Pilgir, A. S. (1992). Human impacts and visual interpretation of the environment in the Bosphorus Region
(in Turkish). Unpublished Graduate Thesis, Istanbul Technical University, Istanbul (in
Turkish).
Official Gazette. (1983). Bosphorus Law, article 2, n. 2960, of 22 November 1983 (in Turkish).
Richards, J. A. (1995). Remote sensing digital image analysis: An introduction. Springer-Verlag.
Selcuk, F. Z., and Gulersoy, N. Z. (2004). An evaluation method for ecological landscape planning of the
Bosphorus (in Turkish). Istanbul Technical University Architecture Journal /a 3(1): 89-102.
Sesli, F. A. (2006). Monitoring Changes Coastal Land Use whit Digital Photogrammetry. Turkish
Engineers and Architects of Chambers of Union, Mapping and Cadastre Chamber of Engineers
, MCE Geodesy Jeoinformasyon Land Management Journal (95): 11-17.
Sesli, F. A., Akyol, N., and İnan, H. İ. (2002). Determining the changes on the land use in the coastal
areas using GIS. Proceedings of 4th National Conference on Coastal and Sea Areas of Turkey,
2: 1033-1042.
Sesli, F. A., and Aydinoglu, A. C. (2003). Investigation of Coastal Land Use Changes by Using GIS and
Web Technologies. The International Colloquium Series on Land Use/Cover Change Science
and Applications: "Studying Land Use Effects in Coastal Zones with Remote Sensing and GIS",
Proceedings Book, Antalya/Kemer, Turkey, pp. 66-70.
Turkey Statistical Institute (TSI). (2007). http://www.tuik.gov.tr. 3(1), 89-102.
Tunay, M., and Atesoglu, A. (2004). A Study with Remote Sensıng Data of Change in Flood Plains at
Bartın Province” Faculty of Suleyman Demirel University Journal of Forestry, Series A, (2):
60-72.
Yenen, Z., Unal, Y., and Enlil, M. (1992). Identity Change in Istanbul: Water Of The City To The Land
of the City, In this article, the International Centre Cities on Water's waterfronts: A New Urban
Frontier, prepared for Congress and published in English, were presented "the 16th World
Urbanism Day Colloquium "of wax paper between 3 - 8 November 1992 in Istanbul (in
Turkish), http://www.metropolIstanbul.com/public/temamakale.aspx?mid=14
Yuan, F. (2008). Land-cover change and environmental impact analysis in the Greater Mankato area of
Minnesota using remote sensing and GIS modeling. International Journal of Remote Sensing
29(4): 1169-1184.