A model for the pressure drop in gas—liquid cocurrent downflow through packed beds
10
The Chemical Engineering Journal, 51 (1993) 19-28 19 A model for the pressure drop in gas-liquid cocurrent downflow through packed beds G. S. V. Ratnam, M. S. Ananth and Y. B. G. Varma* Department of Chemical Engineering, Indian Institute of Technology, Madras 600036 (k&a. (Received September 16, 1991; in kal form April 20, 1992) Abstract A model for pressure drop is proposed for gas-liquid flow through packed beds on the basis of the observed absence of radial pressure gradients and taking into consideration the structure of the bed and the physical properties of the fluids. The model divides the total voidage of the bed into internal and external voidage and appropriately distributes the total liquid holdup into internal and external holdup. Over 2500 experimental data, from the present study as well as those reported in literature, are correlated by the model with an r.m.s. deviation of less than f 9%. The significant parameters affecting the two-phase pressure drop are found to be the bed porosity, the Reynolds number, and the product of the Eijtvos and the Morton numbers. 1. Introduction Gas-liquid flow through packed beds is an im- portant operation with wide application in the pet- roleum and petrochemical industries, in waste-water treatment, in air pollution control and for conducting chemical and biochemical reactions. Pressure drop and liquid holdup are the two important macroscopic hydrodynamic parameters characterizing the op- eration as the former is indicative of the energy consumption within the equipment, while the latter is a measure of the inter-facial area between the phases. The importance of the study of these pa- rameters is obvious from the large number of pub- lications that have appeared in the past. The earlier correlations for two-phase pressure drop are either empirical or model based and may be classified as follows. (a) Correlations relating the two-phase pressure drop or the appropriately defined two-phase friction factor to the flow rates of the phases or their Reynolds numbers, the bed porosity and the particle size. The two-phase flow forms different flow regimes such as gas continuous flow, pulse flow, foaming pulse flow, foaming flow and dispersed bubble flow [ 11or is divided into low and high interaction regimes [ 2, 31. Such delineation for the purposes of cor- relating the two-phase pressure drop in terms of *Author to whom correspondence should be addressed. the system variables is favoured compared with a single correlation [4] for the entire range of op- eration. (b) Correlations which visualize the two-phase pressure drop as an enhancement over the single- phase pressure drop due to the presence of the second phase, thus relating the ratio of the two- phase pressure drop to the single-phase pressure drop to the system variables [5, 61. (c) Correlations relating the two-phase pressure drop to the liquid holdup and the system variables are essentially based on the models proposed for the two-phase flow through packed beds. In summary, while delineation of two-phase flow into a number of flow regions improves the un- derstanding of the flow phenomena in the bed, the pressure drop correlations based on such a dis- tinction do not work significantly better than the correlations based on the two-phase multiplier ap- proach disregarding the flow pattern of the phases. One of the drawbacks in using the two phase mul- tiplier approach, e.g. of the Lockhart-Martinelli [7] type, is that the correlations between +, and X are obtained by curve fitting rather than on the basis of hydrodynamic considerations. Macroscopic models are based on either the mo- mentum or the energy balance and on the observed absence of radial pressure gradients. Sweeney [8] was the 6rst to formulate a model following this 0300-9467/93/$6.00 0 1993 - Elsevier Sequoia. All rights reserved
-
Upload
independent -
Category
Documents
-
view
2 -
download
0
Transcript of A model for the pressure drop in gas—liquid cocurrent downflow through packed beds
The Chemical Engineering Journal, 51 (1993) 19-28 19
A model for the pressure drop in gas-liquid cocurrent downflow through packed beds
G. S. V. Ratnam, M. S. Ananth and Y. B. G. Varma* Department of Chemical Engineering, Indian Institute of Technology, Madras 600036 (k&a.
(Received September 16, 1991; in kal form April 20, 1992)
Abstract
A model for pressure drop is proposed for gas-liquid flow through packed beds on the basis of the observed absence of radial pressure gradients and taking into consideration the structure of the bed and the physical properties of the fluids. The model divides the total voidage of the bed into internal and external voidage and appropriately distributes the total liquid holdup into internal and external holdup.
Over 2500 experimental data, from the present study as well as those reported in literature, are correlated by the model with an r.m.s. deviation of less than f 9%. The significant parameters affecting the two-phase pressure drop are found to be the bed porosity, the Reynolds number, and the product of the Eijtvos and the Morton numbers.
1. Introduction
Gas-liquid flow through packed beds is an im- portant operation with wide application in the pet- roleum and petrochemical industries, in waste-water treatment, in air pollution control and for conducting chemical and biochemical reactions. Pressure drop and liquid holdup are the two important macroscopic hydrodynamic parameters characterizing the op- eration as the former is indicative of the energy consumption within the equipment, while the latter is a measure of the inter-facial area between the phases. The importance of the study of these pa- rameters is obvious from the large number of pub- lications that have appeared in the past. The earlier correlations for two-phase pressure drop are either empirical or model based and may be classified as follows.
(a) Correlations relating the two-phase pressure drop or the appropriately defined two-phase friction factor to the flow rates of the phases or their Reynolds numbers, the bed porosity and the particle size. The two-phase flow forms different flow regimes such as gas continuous flow, pulse flow, foaming pulse flow, foaming flow and dispersed bubble flow [ 11 or is divided into low and high interaction regimes [ 2, 31. Such delineation for the purposes of cor- relating the two-phase pressure drop in terms of
*Author to whom correspondence should be addressed.
the system variables is favoured compared with a single correlation [4] for the entire range of op- eration.
(b) Correlations which visualize the two-phase pressure drop as an enhancement over the single- phase pressure drop due to the presence of the second phase, thus relating the ratio of the two- phase pressure drop to the single-phase pressure drop to the system variables [5, 61.
(c) Correlations relating the two-phase pressure drop to the liquid holdup and the system variables are essentially based on the models proposed for the two-phase flow through packed beds.
In summary, while delineation of two-phase flow into a number of flow regions improves the un- derstanding of the flow phenomena in the bed, the pressure drop correlations based on such a dis- tinction do not work significantly better than the correlations based on the two-phase multiplier ap- proach disregarding the flow pattern of the phases. One of the drawbacks in using the two phase mul- tiplier approach, e.g. of the Lockhart-Martinelli [7] type, is that the correlations between +, and X are obtained by curve fitting rather than on the basis of hydrodynamic considerations.
Macroscopic models are based on either the mo- mentum or the energy balance and on the observed absence of radial pressure gradients. Sweeney [8] was the 6rst to formulate a model following this
0300-9467/93/$6.00 0 1993 - Elsevier Sequoia. All rights reserved

20 G. S. V. Ratnum et al. / Pressure drop model in gas-liquid $0~ through packed beds
approach. The dynamics of interaction between the phases were neglected in the model.
Charpentier et al. [9, lo] derived a modified Lockhart-Martinelli type of correlation based on ratios of work done in two-phase flow to that in single-phase flow rather than on ratios of pressure drop in two-phase flow to that in single-phase flow. When the frictional pressure drop is very large compared with the static head, the energy flux is proportional to the momentum flux. They also showed that, except at very low liquid flow rates, the correlations based on the energy balance do not differ significantly from those based on the momentum balance. Further the models for the two- phase pressure drop in terms of the single-phase pressure drop and the holdup are independent of the balance on which the final correlations are based.
Rao et al. [ 111 extended the model to account for interactions caused by bubble formation. They showed that, while work done due to bubble for- mation is small for any given bubble, the total work due to repetitive bubble formation during the flow of the gas through a packed bed can account for as much as 50% of the observed total pressure drop in the pulse flow and dispersed bubble flow regions. The model equations are non-linear and have to be solved iteratively. The weakness of the model lies in the fact that it is necessary to know a priori the region of operation before calculations are performed.
Hutton and Leung [ 12 ] suggested that the equation for pressure drop in cocurrent flow should use the “effective” voidage for each phase rather than the total voidage of the bed. Specchia and Baldi [2] used the model of Hutton and Leung [ 12 ] to correlate data for both foaming and non-foaming systems. Saez and Carbonell [13] and Saez et al. [14] de- veloped a model for two-phase pressure drop in cocurrent flow through packed beds using the con- cept of relative permeabilities. While the resulting two-parameter correlations appear to correlate data satisfactorily, the relative permeability concept itself is only appropriate for beds of small packings.
2. Development of a model
The model deals with the complex problem of two-phase flow through packed beds and is based on well-de&red assumptions, leading to correlating equations similar to those developed for two-phase flow in horizontal pipes. Considering only the fiic- tional pressure gradient, Wallis [ 151 presented the following relationships for two-phase flow:
4Lpt-” (1) @=(l -pd-” (2)
(-.g+(-$)l-4 (3)
where #J = (APiJAP)“2 and fit is the total liquid holdup in the pipe. If we de6ne X=(AP,/APJ’“, eqn. (3) is conveniently written as
&,“I” = I +X2/m (4)
Wallis [ 151 observed that m varies from 2 for laminar flow to as high as 3.5 for turbulent flow of a two-phase mixture in a horizontal pipe. The analysis presented below for gas-liquid flow through packed beds preserves the form of the above re- lationships and leads to an expression for m in terms of the bed porosity, the particle size and the physical properties of the fluid.
2.1. Particles without an internal structure Consider the two-phase cocurrent downflow
through a packed bed containing rigid particles of uniform size. For single-phase flow of any one of the fluids through the same bed, the frictional pres- sure drop is assumed to be well correlated by the Burke-Plummer equation [ 161
where u is the superficial velocity of the fluid based on an empty cross-sectional area. In two-phase flow, one can visualize the same fluid as flowing through the same bed with an effective voidage that is reduced by the presence of the second fluid. For example, the effective voidage available for the flow of liquid in two-phase flow is essentially E&, with the re- maining void volume ~(1 - /3+) being occupied by the gas. The ratio of the frictional pressure drop in the liquid phase in two-phase flow to that in single-phase flow of liquid through the same bed can thus be obtained following eqn. (5):
42_ $g _ (l-&k2
Cl- d(@t)3 (‘3)
fl
For small E, the following approximation may be made:
1+ u-m l--E
_p -f/(1-c) t
This, when substituted into eqn. (6), yields eqn. (1) to give
G. S. V. Ratnam et al. / Pressure drop model in gas-liquid J%W through packed beds 21
m=3+ E l--E
(8)
The same expression for m follows from arguments relating to the flow of the gas phase in two-phase flow. Equation (8) is valid for turbulent flows and for small values of E, say less than 0.4. It is straight- forward to verify that in laminar flow, the use of the Blake-Kozeny equation [ 161 in place of eqn. (5) leads to the following expression for m:
2E m=3+ -
l--E
It is, however, to be noted that, while the frictional pressure drop in horizontal flow through pipes is equal to the total pressure drop, the total and the frictional pressure drops differ by the static head in flow through vertical packed beds. Secondly, eqn. (8) is applicable to packed beds of small voidage (e.g. beds of spheres or cylinders), and not to beds of particles with an internal structure (e.g. Raschig rings or Berl saddles) which give rise to large voidage. This is due to the approximation effected in eqn. (7). The next section considers two-phase flow through packed beds presenting large voidage.
2.2. Particles with an internal structure It is expedient to distinguish in beds of particles
with an internal structure between “external” voi- dage and “internal” voidage. The former refers to the voidage l 0 of the bed that would be expected if the particles were replaced by “equivalent” rigid particles of uniform size while the latter refers to the remaining voidage Ei* It should be emphasized that neither co nor Ei is a simple structural parameter. Both can depend on the wetting and flow char- acteristics of the fluid and the manner in which the equivalent rigid particle is del?ned. It is also con- venient to define an “external” holdup &, and an “internal” holdup pi. The quantities may now be related by the following equations:
E=E,+Ej (9)
h= - P&o + & E E
(10)
Equation (10) may be replaced by the corresponding geometric mean as
p t
= P&o + PiS
E
or
pt = &~&/L$ih (11)
The observed absence of radial pressure gradient for the two-phase flow in a packed bed is now invoked as a requirement for purposes of relating p,, to pi and to find an expression for m maintaining the form of eqn. (4). The absence of radial pressure gradients implies that the pressure drop from inlet to any axial position in the bed is the same for both the liquid and the gas. Further, if the static pressure drop is assumed to be small compared with the frictional pressure drop, it follows that the pressure drop from inlet to any axial position in the bed is the same for both the liquid and the gas. This equality is a convenient basis for determining the relation between & and pi as well as that between m, E and Ei*
The present model visualized flow through a bed of structured particles as consisting of two separate flows through two parallel beds (of the same length and diameter) of rigid uniform-size particles, one of voidage E, and the other of voidage Ei (Fig. 1). Consider first the single-phase flow of liquid alone through the beds. For the model to represent the actual flow it is necessary that the frictional pressure drop be the same for both beds. Thus
hPfl(E9 u, = @tl(G, uO) = hpfl(Ei7 ui> (12)
L G
ii
E
L 6
6 L
= Po(E-EJ+PiEi
E
(4 (b) Lt tG
Fig. 1. Flow visualisation of the model: (a) prototype; (b) model.
22 G. S. V. Ratnam et al. / Pressure drop model in gas-liquid $0~ through packed beds
This equation, together with eqn. (5), provides the This equation can be combined with eqn. (11) to following relationship between the superficial ve- yield an equation for m: locities u, and q in the two beds: & = p. f&pi a/E
u2(1 - 6) = u02(1 - e0) = w2(I - l ) E3 %I
3 E3
(13)
Further it is clear that
u=u,+u$ (14)
Thus the flow distributes itself between the two beds in such a manner that E,, Ei, U, and Ui satisfy eqns. (9), (13) and (14).
It is now assumed that in two-phase flow the distribution of the liquid between the two hypo- thetical beds remains the same as in single-phase flow. The holdups & and pi in the two beds then adjust themselves in such a manner as to preserve the equality of the pressure drop. This pressure drop is the same as that for flow of the entire liquid in two-phase flow through the prototype bed of voidage E at a superficial velocity u. Figure 1 il- lustrates the visualization of the prototype and its model equivalent. The above statements can be quantified using eqns. (l), (5), (8) and (13) to give
(15)
Similar expressions can also be written for the gas flow through the bed.
Equation (15) expresses a series of very useful equalities. pt is the liquid holdup in the actual bed and can be measured experimentally [ 171 while m is the index to be calculated. Since E can be large (especially in beds of structured particles), the approximation effected in eqn. (7) is not valid and hence is the relationship between m and E as given by eqn. (8). However, by considering the total voidage to be the sum of “internal” and “external” voidages, each of them may be represented in the format similar to eqn. (8) as
m,=3+ -!%- 1 - E0
(16)
m=3+ -% 1 - Ei
(17)
Alternatively the “laminar” counterpart equations can be used for m, and m,.
It follows from the equalities of eqn. (15) and eqn. (12) that
po-=piml (18)
(19)
Thus, from eqn. (19), m is given by
m0 m= mieO + (m,/mJ(~ - 4/E
momi6 = m,e, + m,(E - E,)
(20)
For purposes of comparison of experimental data, it is expedient to express m as a linear function of E. Equation (20) is expanded by the Taylor series, keeping only the linear terms (justified in the close neighbourhood), to give
m=A+BE (21)
whereA = m,,“/mi adB = m,(mi - m,)E/mieo. Clearly m=mo when l i=O or E=E,.
The aforementioned analysis presents two ob- servations. Firstly E,,, Ei, u,, 3, & and pi are model quantities which can be calculated from the model equations without recourse to experimental mea- surements. In eqn. (21), A and B are best treated as model parameters that can be obtained by fitting experimental APti data. Secondly the discussion is based on the Burke-Phmuner equation or the Blake-Kozeny equation both of which ignore the effects of surface tension. It is therefore possible to use eqn. (21) together with eqn. (4) to correlate experimental data while allowing A and B to vary with the physical properties of the gas-liquid mix- ture, considered through the dimensionless group (EoM) . 1/2 The validity of this model as a correlating tool for experimental data of the present as well as previous studies is demonstrated in Section 4.
3. Experimental details
Figure 2 shows the schematic diagram of the experimental set-up. Air and liquid were metered and fed at the top of the column through a multi- tubular gas-liquid distributor to flow cocurrently through the bed of packing and discharge through a separator positioned at the bottom of the column.
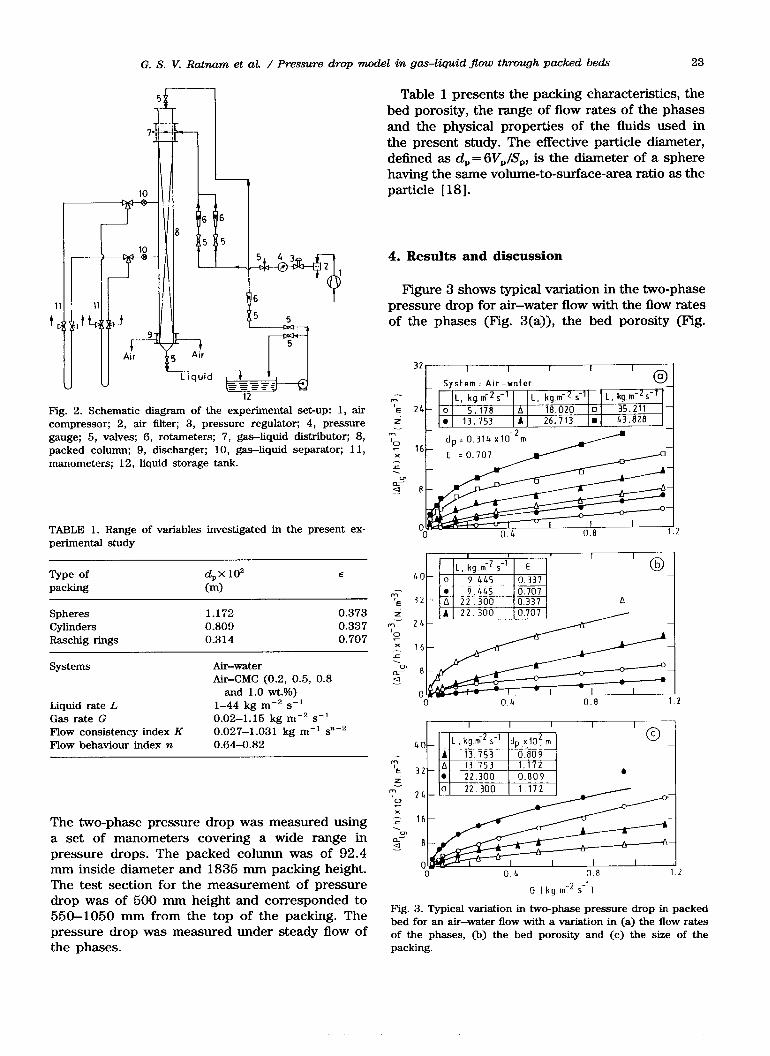
G. S. V. Ratnam et al / Pressure drop model in gas-liquid $0~ through packed beds 23
12
Fig. 2. Schematic diagram of the experimental set-up: 1, air compressor; 2, air filter; 3, pressure regulator; 4, pressure gauge; 5, valves; 6, rotameters; 7, gas-liquid distributor; 8, packed column; 9, discharger; 10, gas-liquid separator; 11, manometers; 12, liquid storage tank.
TABLE 1. Range of variables investigated in the present ex- perimental study
Type of packing
d,x 10’ (m)
l
Spheres 1.172 0.373 Cylinders 0.809 0.337 Raschig rings 0.314 0.707
Systems
Liquid rate L Gas rate G Flow consistency index K Flow behaviour index n
Air-water Air-CMC (0.2, 0.5, 0.8
and 1.0 wt.%) l-44 kg mm2 s-l 0.02-1.15 kg mm2 s-l 0.027-1.031 kg m-l s”-’ 0.64-0.82
The two-phase pressure drop was measured using a set of manometers covering a wide range in pressure drops. The packed column was of 92.4 mm inside diameter and 1335 mm packing height. The test section for the measurement of pressure drop was of 500 mm height and corresponded to 550-1050 mm from the top of the packing. The pressure drop was measured under steady flow of the phases.
Table 1 presents the packing characteristics, the bed porosity, the range of flow rates of the phases and the physical properties of the fluids used in the present study. The effective particle diameter, defined as d, = 6V,/S,, is the diameter of a sphere having the same volume-to-surface-area ratio as the particle [ 181.
4. Results and discussion
F’igure 3 shows typical variation in the two-phase pressure drop for air-water flow with the flow rates of the phases (Fig. 3(a)), the bed porosity (Fig.
16
2
6 t kg III-~ s-’ I
Fig. 3. Typical variation in two-phase pressure drop in packed bed for an air-water flow with a variation in (a) the flow rates of the phases, (b) the bed porosity and (c) the size of the packing.
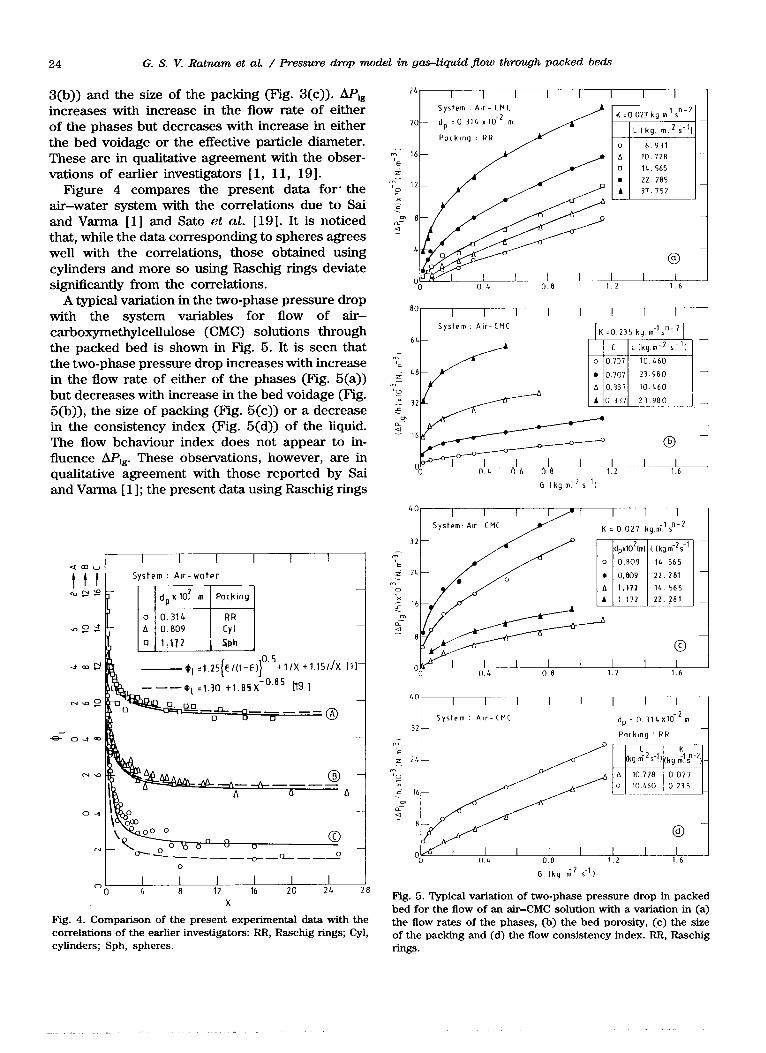
24 G. S. V. Ratnam et al. / Pressure drop model in gas-liquid -flow through packed beds
3(b)) and the size of the packing (Fig. 3(c)). hp, increases with increase in the flow rate of either of the phases but decreases with increase in either the bed voidage or the effective particle diameter. These are in qualitative agreement with the obser- vations of earlier investigators [ 1, 11, 191.
Figure 4 compares the present data for the air-water system with the correlations due to Sai and Varma [ 1 ] and Sato et al. [ 191. It is noticed that, while the data corresponding to spheres agrees well with the correlations, those obtained using cylinders and more so using Raschig rings deviate significantly from the correlations.
A typical variation in the two-phase pressure drop with the system variables for flow of air- carboxymethylcellulose (CMC) solutions through the packed bed is shown in Fig. 5. It is seen that the two-phase pressure drop increases with increase in the flow rate of either of the phases (Fig. 5(a)) but decreases with increase in the bed voidage (Fig. 5(b)), the size of packing (Fig. 5(c)) or a decrease in the consistency index (Fig. 5(d)) of the liquid. The flow behaviour index does not appear to in- fluence APIg. These observations, however, are in qualitative agreement with those reported by Sai and Varma [ 11; the present data using Raschig rings
I I I I I I
System : Air-water
Fig. 4. Comparison of the present experimental data with the correlations of the earlier investigators: RR, Raschig rings; Cyl, cylinders; Sph, spheres.
. I I 22 285 A 37 752 Ii
-- 16- IE
f ': 12 0 x - r -
a- 8
4
0 <
K ~0.235 kg rn-'~"-~
G Ikg m-2s~'I
LO I I I l/l I I r I
System, Air- CMC
32-
LO I I I I I I I I 1
I System : Air-[MC 32
dp = 0.31Lx10-2m
PotkIng. RR
2-:-:_:.:::::::i-~~
0 OL 0.E 12 1.6
G Ikg. ri2 i'l
Fig. 5. Typical variation of two-phase pressure drop in packed bed for the flow of an air-CMC solution with a variation in (a) the flow rates of the phases, @) the bed porosity, (c) the size of the packing and (d) the flow consistency index. RR, Raschig rings.

G. S. V. Ratnam et al. / Pressure drop model in gas-liquid .flow through packed beds 25
4 I I I I I System: Air- CMC
K =0.235 kg m. s
exptl Idp=1.172 xIO-~ ml
IPockIng : Sphl
A exptl Idp=0.809xlO
IPockIng :Cyll _
* 1 BAA A A A A
X
Fig. 6. Comparison of the present experimental data with the correlation of Sai and Varma [ 11: Sph, spheres; Cyl, cylinders; RR, Rash@ rings.
are found to deviate considerably from the authors’ correlation (Fig. 6).
4.1. Comparison of the present model and the experimental data
The model developed in the present study is compared with the experimental data of the present study as well as those reported in the literature. A in eqn. (21) is expressed in terms of (Eij ikf)‘j2 to give
m = a(E6 lkQsn +BE (22)
which is valid for particles both with and without an internal structure.
The constants (Y, 6 and B are evaluated through regression analysis using over 2500 data points covering non-foaming liquids and a wide range in experimental conditions as listed in Tables 2 and 3. The constants are found to be B=2.1, (~=1.55 and 6= - 0.05.
Figure 7 is a plot of m - 2.1~ vs. (Eii M)ln, showing the spread in m over the range covered in (ES l14)In. Each data point represents the average for the experimental data obtained using a packing type and the system.
Fig. 7. Variation in the model parameter m with (E6 i14)ln for the experimental data of the present study and that reported in the literature. 0, Larkins et al. [22]; A, Wen et al. 1231;
0, Charpentier et al. [9]; X, Sate et al. [ 191; 0, Specchia and Baldi 121; A, Clements and Schmidt [24]; n , Rao et al. [ll]; 0, Sai and Varma [ 11; 0, present study.
Tables 2 and 3 summarize the comparison of the experimental data with the present model for air-newtonian liquids and air-CMC solutions through the packed beds. The single-phase pressure drops for air and water are estimated using Ergun’s [20] equation while the pressure drop for CMC solutions is estimated using the equation of Kem- blowski and Mertl [ 2 11. It is noted from the tables that the maximum r.m.s. deviation is limited to 9% with most of the data being within 5%. These are the lowest deviations of the data reported with respect to the available correlations in the literature.
6. Conclusions
The significance of the model and the correlating equations (eqns. (4) and (21)) lies in their simplicity in form and satisfactory representation of the ex- perimental data covering a wide range of experi- mental conditions. The model formulation is similar to that applicable for two-phase flow through un- packed tubes; yet it describes the pressure drop in a complex situation of two-phase flow through packed beds. While E in eqn. (21) characterizes the bed structure, the dimensionless group (Eii A4)lf2
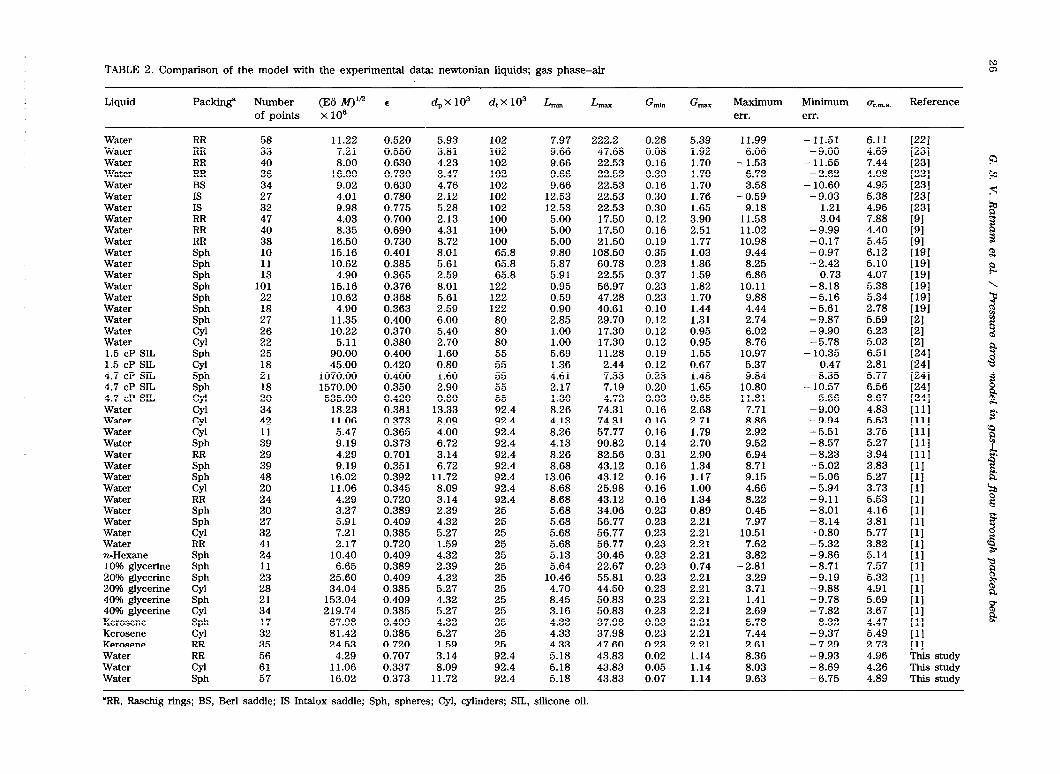
TABLE 2. Comparison of the model with the experimental data: newtonian liquids; gas phase-air
Liquid Packing” Number (Eo A4)‘” E d,X 10s &x103 L”,,,, L, G,,,, G, Maximum Mlniitlm G.m.s. Reference
of points x 10s err. err.
Water Water Water Water Water Water Water Water Water Water Water Water Water Water Water Water Water Water 1.5 CP SIL 1.5 CP SIL 4.7 CP SIL 4.7 CP SIL 4.7 CP SIL Water Water Water Water Water Water Water Water Water Water Water Water Water n-Hexane 10% glycerine 20% glycerine 20% glycerine 40% glycerine 40% glycerine Kerosene Kerosene Kerosene Water Water Water
RR RR RR RR BS IS IS RR RR RR Sph Sph Sph Sph Sph Sph Sph CYl CYl Sph CYl Sph Sph CYl CYl CYl CYl Sph RR Sph Sph CYI RR Sph Sph CYI RR Sph Sph Sph CYl Sph CYI Sph CYl RR RR CYI Sph
58 33
:: 34 27 32 47 40 38 10 11 13
101 22 18 27
;1 25 18 21 18 20 34 42 11 39 29 39 48 20 24 20
3”;:
;: 11 23 28 21 34 17 32 35 56 61 57
11.22 0.520 5.93 7.21 0.550 3.81 8.00 0.630 4.23
16.00 0.730 8.47 9.02 0.630 4.76 4.01 0.780 2.12 9.98 0.775 5.28 4.03 0.700 2.13 8.35 0.690 4.31
16.50 0.730 8.72 15.16 0.401 8.01 10.62 0.385 5.61
4.90 0.365 2.59 15.16 0.376 8.01 10.62 0.368 5.61 4.90 0.363 2.59
11.35 0.400 6.00 10.22 0.370 5.40
5.11 0.380 2.70 90.00 0.400 1.60 45.00 0.420 0.80
1070.00 0.400 1.60 1570.00 0.350 2.90 535.00 0.420 0.80
18.23 0.381 13.33 11.06 0.373 8.09
5.47 0.365 4.00 9.19 0.373 6.72 4.29 0.701 3.14 9.19 0.351 6.72
16.02 0.392 11.72 11.06 0.345 8.09 4.29 0.720 3.14 3.27 0.389 2.39 5.91 0.409 4.32 7.21 0.385 5.27 2.17 0.720 1.59
10.40 0.409 4.32 6.65 0.389 2.39
25.60 0.409 4.32 34.04 0.385 5.27
153.04 0.409 4.32 219.74 0.385 5.27
67.98 0.409 4.32 81.42 0.385 5.27 24.53 0.720 1.59
4.29 0.707 3.14 11.06 0.337 8.09 16.02 0.373 11.72
102 102 102 102 102 102 102 100 100 100 65.8 65.8 65.8
122 122 122 80 80 80 55 55 55 55 55 92.4 92.4 92.4 92.4 92.4 92.4 92.4 92.4 92.4 25 25 25 25 25 25 25 25
;: 25 25 25 92.4 92.4 92.4
7.97 222.2 0.28 5.39 11.99 - 11.51 6.11 9.66 47.68 0.08 1.92 6.06 -9.00 4.69 9.66 22.53 0.16 1.70 - 1.53 - 11.55 7.44 9.66 22.53 0.30 1.70 6.73 - 2.62 4.08 9.66 22.53 0.16 1.70 3.58 - 10.60 4.95
12.53 22.53 0.30 1.76 - 0.59 - 9.03 5.38 12.53 22.53 0.30 1.65 9.18 1.21 4.95 5.00 17.50 0.12 3.90 11.58 3.04 7.88 5.00 17.50 0.16 2.51 11.02 -9.99 4.40 5.00 21.50 0.19 1.77 10.98 -0.17 5.45 9.80 108.50 0.35 1.03 9.44 -0.97 6.12 5.87 60.78 0.23 1.86 8.25 - 2.42 5.10 5.91 22.55 0.37 1.59 6.86 0.73 4.07 0.95 56.97 0.23 1.82 10.11 -8.18 5.38 0.59 47.28 0.23 1.70 9.88 -5.16 5.34 0.90 40.61 0.10 1.44 4.44 -5.61 2.78 2.85 29.70 0.12 1.31 2.74 -9.87 5.59 1.00 17.30 0.12 0.95 6.02 -9.90 6.23 1 .oo 17.30 0.12 0.95 8.76 -5.78 5.03 5.69 11.28 0.19 1.55 10.97 - 10.35 6.51 1.36 2.44 0.12 0.67 5.37 0.47 2.81 4.61 7.33 0.23 1.48 9.84 - 8.35 5.77 2.17 7.19 0.20 1.65 10.80 - 10.57 6.56 1.30 4.72 0.03 0.65 11.81 - 5.56 8.67 8.26 74.31 0.16 2.68 7.71 - 9.00 4.83 4.13 74.31 0.16 2.71 8.86 - 9.94 5.53 8.26 57.77 0.16 1.79 2.92 -5.51 3.75 4.13 90.82 0.14 2.70 9.52 -8.57 5.27 8.26 82.56 0.31 2.90 6.94 - 8.23 3.94 8.68 43.12 0.16 1.34 8.71 - 5.02 3.83
13.06 43.12 0.16 1.17 9.15 - 5.06 5.27 8.68 25.98 0.16 1.00 4.66 - 5.94 3.73 8.68 43.12 0.16 1.34 8.22 -9.11 5.53 5.68 34.06 0.23 0.89 0.45 -8.01 4.16 5.68 56.77 0.23 2.21 7.97 -8.14 3.81 5.68 56.77 0.23 2.21 10.51 -0.80 5.77 5.68 56.77 0.23 2.21 7.62 - 5.32 3.82 5.13 30.46 0.23 2.21 3.82 - 9.86 5.14 5.64 22.67 0.23 0.74 -2.81 -8.71 7.57
10.46 55.81 0.23 2.21 3.29 -9.19 5.32 4.70 44.50 0.23 2.21 3.71 -9.88 4.91 8.45 50.83 0.23 2.21 1.41 - 9.78 5.69 3.16 50.83 0.23 2.21 2.69 - 7.82 3.67 4.33 37.98 0.23 2.21 5.78 - 8.32 4.47 4.33 37.98 0.23 2.21 7.44 -9.37 5.49 4.33 47.60 0.23 2.21 2.61 - 7.29 2.73 5.18 43.83 0.02 1.14 8.36 - 9.93 4.96 5.18 43.83 0.05 1.14 8.03 - 8.69 4.26 5.18 43.83 0.07 1.14 9.63 -6.75 4.89
(221 1231
t;x; f231 r231 WI WI PI PI rIgI [I91 1191 1191 [I91
[By’ El El WI
Ix:;
t;:: (111 1111 (111 [I11 1111 111 [II [II 111 111 111 [II [II [II 111 111 111 [II [II [II Ill [II This study This study This study
‘RR, Raschig rings; BS, Berl saddle; IS Intalox saddle; Sph, spheres; Cyl, cylinders; SIL, silicone oil
TABLE 3. Comparison of the model with experimental data: carboxymethylcellulose solutions; gas phase-air
Liquid Kx103 n c&x 103 Packing” Number (EC ?vI)'~X lo4 E d,x lo3 Lm L,, G,,,,n G, Maximum Miium u~.,,,.~ Reference
(%I of points err. err.
0.2 CMC 3.97 0.856 25.0 0.5 CMC 10.27 0.789 25.0 0.5 CMC 10.27 0.789 25.0 0.5 CMC 10.27 0.789 25.0 0.5 CMC 10.27 0.789 25.0 1.0 CMC 18.34 0.735 25.0 1.0 CMC 18.34 0.735 25.0 1.0 CMC 18.34 0.735 25.0 1.0 CMC 18.34 0.735 25.0 2.0 CMC 62.43 0.785 25.0 2.0 CMC 62.43 0.785 25.0 2.0 CMC 62.43 0.785 25.0 0.1 CMC 1.61 0.967 92.4 0.1 CMC 1.61 0.967 92.4 0.2 CMC 3.97 0.856 92.4 0.2 CMC 3.97 0.856 92.4 0.2 CMC 3.97 0.856 92.4 0.5 CMC 10.27 0.789 92.4 0.5 CMC 10.27 0.789 92.4 0.5 CMC 10.27 0.789 92.4 1.0 CMC 18.34 0.735 92.4 1.0 CMC 18.34 0.735 92.4 1.0 CMC 18.34 0.735 92.4 2.0 CMC 62.43 0.785 92.4 2.0 CMC 62.43 0.785 92.4 0.2 CMC 27.00 0.820 92.4 0.2 CMC 27.00 0.820 92.4 0.2 CMC 27.00 0.820 92.4 0.5 CMC 234.50 0.705 92.4 0.5 CMC 234.50 0.705 92.4 0.5 CMC 234.50 0.705 92.4 0.8 CMC 466.00 0.703 92.4 0.8 CMC 466.00 0.703 92.4 1.0 CMC 1031.00 0.641 92.4
Sph 14 RR 34
Sph 13
Sph 24
CYl 25 RR 33
Sph 10
Sph 27
CYf 28 RR 28
Sph 27
CYl 24
Sph 46
CYl 20
Sph 30
Sph 24
CYl 16
Sph 35
Sph 14 RR 20 RR 21
Sph 23
Sph 20
Sph 17 RR 19 RR 55
CYf 50
Sph 36 RR 56
CYl 36
Sph 24
CYl 47
Sph 24 RR 44
0.216 0.389 2.39 5.49 27.36 0.23 0.74 3.72 -9.39
0.532 0.720 1.59 9.58 53.19 0.23 2.21 8.07 - 8.90
0.871 0.389 2.39 4.38 20.48 0.23 0.74 - 0.46 -9.39
1.780 0.409 4.32 9.58 53.19 0.23 2.21 2.04 - 7.28
2.270 0.385 5.27 9.58 42.19 0.23 2.21 2.28 -8.41
1.190 0.720 1.59 7.77 48.46 0.23 2.21 8.09 -9.71
1.990 0.389 2.39 2.45 17.79 0.23 0.56 - 1.13 - 10.36
4.210 0.409 4.32 2.45 48.46 0.23 2.21 8.75 - 10.33
5.420 0.385 5.27 7.77 48.46 0.23 2.21 0.58 - 10.71
30.800 0.720 1.59 3.74 34.79 0.23 2.21 12.48 -2.39
104.000 0.409 4.32 3.74 23.16 0.23 2.21 7.72 -3.99
132.000 0.385 5.27 3.74 27.04 0.23 2.21 11.41 -4.67
0.459 0.392 11.72 12.5 42.59 0.16 1.34 9.10 - 8.22
0.313 0.345 8.09 8.19 25.47 0.16 1.00 - 0.30 -9.71
0.703 0.351 6.72 8.12 32.78 0.16 1.34 7.59 - 7.26
1.330 0.392 11.72 8.12 36.88 0.16 1.34 7.35 - 8.46
0.870 0.345 8.09 8.12 24.66 0.16 1.00 7.78 - 10.26
3.050 0.351 6.72 7.46 31.55 0.16 1.34 2.93 -9.38
5.980 0.392 11.72 7.46 31.55 0.16 1.34 3.71 -9.37 1.210 0.720 3.14 7.46 31.55 0.16 1.34 8.94 - 10.35 2.810 0.720 3.14 7.03 22.45 0.16 1.34 3.38 - 9.05
7.370 0.351 6.72 7.03 22.45 0.16 1.34 8.86 - 10.07
14.900 0.392 11.72 7.03 18.63 0.16 1.34 3.74 - 11.99 177.000 0.351 6.72 4.29 11.44 0.16 1.34 4.83 - 0.80
70.400 0.720 3.14 4.29 18.35 0.16 1.34 11.67 -3.71
10.700 0.707 3.14 6.96 37.90 0.02 1.14 10.92 - 14.84
32.800 0.337 8.09 3.11 37.90 0.02 1.14 11.28 - 10.98 50.700 0.373 11.72 6.96 37.90 0.05 1.14 10.93 - 10.88
322.000 0.707 3.14 3.73 31.07 0.02 1.14 10.90 - 10.16
1100.000 0.337 8.09 3.73 24.03 0.02 1.14 9.55 - 5.83 1770.000 0.373 11.72 1.52 24.03 0.14 1.14 10.84 3.94 4270.000 0.337 8.09 1.66 18.23 0.02 1.14 10.48 2.36
6900.000 0.373 11.72 6.00 18.23 0.05 1.14 10.58 2.94 4100.000 0.707 3.14 2.40 14.91 0.02 1.14 8.87 -6.78
7.05 [I] 3.90 [ll 5.71 [ll 4.70 [l] 4.14 [I] 4.97 [l] 7.15 [ll 7.70 (11 6.51 [l] 6.17 [l] 4.28 [l] 5.36 [l] 4.72 [l] 6.07 [l] 4.21 [l] 5.55 [l] 7.19 [I] 4.99 [I] 4.55 [ll 6.24 [l] 5.51 (11 6.12 [l] 7.07 [ll 2.80 [l] 4.52 [l] 7.06 This study 6.48 This study 8.05 This study 6.21 This study 4.84 This study 9.04 This study 6.75 This study 7.51 This study 3.99 This study
“Sph, spheres; RR, Raschig rings; Cyl, cylinders.
28 G. S. V. Ratnum et al. / Pressure drop model in gas-liquid flow through packed beds
suitably considers the physical properties of the fluids influencing the bubble formation and its move- ment in the two-phase system.
References
1
2
3
4
5
6
7
8 9
10
11
12
13 14
15
16
17
18
19
P. S. T. Sai and Y. B. G. Varma, AlChE J., 33 (1987) 2027-2036. V. Specchia and G. Baldi, Chem. Eng. Sci., 32 (1977) 515-523. M. J. Ellman, N. Midow, A. Laurent and J. C. Charpentier, Chem. Eng. Sci., 43 (1988) 2201-2206. J. L. Turpin and R. L. Huntington, AI&E J., I3 (1967) 1196-1202. N. Midoux, M. Favier and J. C. Charpentier, J. Chcm. Eng.
Jpn., 9 (1976) 350-356. G. Tosun, Ind. Eng. Chem., Process Des. Dev., 23 (1984) 35-39. R. W. Lockhart and R. C. Martinelli, Chem. Eng. Prog., 45 (1949) 39-48. D. E. Sweeny, AIChE J., 13 (1967) 663-666. J. C. Charpentier, C. Prost and P. Le Goff, Chcm. Eng. Sci., 24 (1969) 1777-1794. J. C. Charpentier, M. Bakos and P. Le Goff, Proc. 2nd Conq. on Applications of Physical Chemistry, Vesqn-em,
1971, pp. 31-47. V. G. Rao, M. S. Ananth and Y. B. G. Varma, AICh.E J., 29 (1983) 467-483. B. E. T. Hutton and L. S. Leung, Chewz. Eng. Sci., 29 (1974) 1681-1685. A. E. Saez and R. G. Carbonell, AZ&E J., 31 (1985) 52-62. A. E. Saez, R. B. Carbonell and J. Levee, AlChE J., 32 (1986) 353-368. G. B. Wallis, One-Dimensional Two-Phase Flow, McGraw- Hill, New York, 1969. R. S. Brodkey and H. C. Hershey, Transport Ph- McGraw-Hill, New York, 1988. P. S. T. Sai and Y. B. G. Varma, Can. J. Chem. Eng., 66 (1988) 353-360. A. S. Foust, L. A. Wenzel, C. W. Clump, L. Maus and L. G. Anderson, Principles of Unit Operations, Wiley, New York, 1980. Y. Sato, T. Hirose, F. Takahasi and M. Toda, J. Chem. Eng.
Jpn., 6 (1973) 147-152. 20 S. Ergun, Chem. Eng. Prog., 48 (1952) 89-94. 21 2. Kemblowski and J. Mertl, Chem. Eng. Sci., 29 (1974)
213-223. 22 R. P. Larkins, R. R. White and D. W. Jeffrey, AICh.E J., 7
(1961) 231-239. 23 C. Y. Wen, W. S. O’Brien and L. T. Fan, J. Chem. Eng.
Data, 8 (1963) 47-51. 24 L. D. Clements and P. C. Schmidt, AZCh.E J., 26 (1980)
314-317.
Appendix A: Nomenclature
A
B
2
E6 (Eo M)rD Q G h
K
L
G
n
AP
% U
VP X
constant constant effective particle diameter (m) column diameter (m) g Ap c&‘/a, Eiitvos number gd,p2/u2, gndp2+K2/a2, for CMC liquids acceleration due to gravity (m s-‘) gas superficial mass velocity (kg me2 s- ‘) height of the test section (m) flow consistency index (kg m-’ snp2) liquid superficial mass velocity (kg m-’ s-1) exponent gp4 Ap/p2a3, Morton number flow behaviour index pressure drop (N m-“) surface area of the particle (m2) superficial velocity of the phase (m s- ‘) volume of the particle (m3) (AW~I‘J’? Lockhart-Martinelh para- meter
Greek letters
;
constant as in eqn. (22) liquid holdup based on void volume in the bed
s APlpgh, dimensionless frictional pressure drop
E porosity of the bed CL viscosity (kg m-l s- ‘) P density (kg mp3) (T surface tension (kg se2)
7’“’ r.m.s. deviation (A&/Aw2, Lockhart-Martinelli para- meter
Subscripts f frictional g gas phase
: internal liquid phase
lg two-phase max maximum min minimum 0 external
t total