Wheat on permanent beds in Punjab, India- CSIRO Technical Report
100
Productivity, water use efficiency and hydrology of wheat on beds and flats in Punjab, India E. Humphreys 1 , S. Thaman 2 , A. Prashar 2 , P.R. Gajri 2 , S.S. Dhillon 2 , Yadvinder-Singh 2 , A. Nayyar 2 , J. Timsina 1 and Bijay-Singh 2 1 CSIRO Land and Water 2 Punjab Agricultural University CSIRO Land and Water Technical Report No. 03/04 May 2004
Transcript of Wheat on permanent beds in Punjab, India- CSIRO Technical Report

Productivity, water use efficiency and hydrology of wheat on beds and flats in Punjab, India
E. Humphreys1, S. Thaman2, A. Prashar2, P.R. Gajri2, S.S. Dhillon2, Yadvinder-Singh2, A. Nayyar2, J. Timsina1 and Bijay-Singh2
1CSIRO Land and Water 2Punjab Agricultural University
CSIRO Land and Water Technical Report No. 03/04 May 2004

© 2004 CSIRO To the extent permitted by law, all rights are reserved and no part of this publication covered by copyright may be reproduced or copied in any form or by any means except with the written permission of CSIRO Land and Water. Important Disclaimer: CSIRO Land and Water advises that the information contained in this publication comprises general statements based on scientific research. The reader is advised and needs to be aware that such information may be incomplete or unable to be used in any specific situation. No reliance or actions must therefore be made on that information without seeking prior expert professional, scientific and technical advice. To the extent permitted by law, CSIRO Land and Water (including its employees and consultants) excludes all liability to any person for any consequences, including but not limited to all losses, damages, costs, expenses and any other compensation, arising directly or indirectly from using this publication (in part or in whole) and any information or material contained in it. Citation details: Humphreys, E., Thaman, S., Prashar, A., Gajri, P.R., Dhillon, S.S., Yadvinder-Singh, Nayyar, A., Timsina, J. and Bijay-Singh (2004). Productivity, water use efficiency and hydrology of wheat on beds and flats in Punjab, India. CSIRO Land and Water Technical Report 03/04

Acknowledgements This work was undertaken as part of the Australian Centre for International Agricultural Research (ACIAR) project LWR2/2000/89 Permanent beds for irrigated rice-wheat and alternative cropping systems in north west India and south east Australia. This is a collaborative project between Punjab Agricultural University (PAU), CSIRO Land and Water and NSW Agriculture. We especially thank: Sarabjeet Singh and Harpal Singh of PAU for their dedication and hard work. We also thank:
• Lakhbir Singh and Karamjeet Singh of PAU for field assistance, and many field labourers • David Smith of CSIRO Land and Water for assistance in installation of the irrigation
system and soil water monitoring equipment and instruction in its use and maintenance, and for his comments on the manuscript
• Brad Fawcett and Roy Zandona of CSIRO land and Water for construction of
tensiometers and assembly and testing of loggers and soil water sensors • Daljeet Singh, farmer at Phillaur, for use of his field and assistance and advice
• Dr A.K. Singh, Indian Agricultural Research Institute for determinations of soil water
content at 15 bars
• Bachatter Singh of PAU for particle size analyses
• Dr Evan Christen, CSIRO Land and Water for graphical analyses of root length and soil water content distributions


Table of Contents Summary ..................................................................................................... 1 Introduction ................................................................................................ 2 Methods....................................................................................................... 3
Site ...............................................................................................................................................3 Experimental design...................................................................................................................6
Treatments................................................................................................................................6 Layout..........................................................................................................................................6
Layout.......................................................................................................................................7 Crop management ......................................................................................................................7 Irrigation, surface drainage and rainfall .................................................................................9 Soil water content .....................................................................................................................11 Soil water potential...................................................................................................................11 Soil water characteristic ..........................................................................................................12 Weather .....................................................................................................................................13 Crop growth, development and yield .....................................................................................13 Root observations .....................................................................................................................13
Results and discussion ........................................................................... 14 Soil hydraulic properties .........................................................................................................14 Weather .....................................................................................................................................15 Crop...........................................................................................................................................17
Establishment .........................................................................................................................17 Phenological development .....................................................................................................17 Growth....................................................................................................................................19 Yield and yield components....................................................................................................25 Root growth ............................................................................................................................28
Soil water dynamics .................................................................................................................31 Matric potential......................................................................................................................31 Volumetric soil water content – sandy loam ..........................................................................36
Crop water use..........................................................................................................................37 Crop water use, water use efficiency and productivity.........................................................45
General discussion .................................................................................. 49 References ................................................................................................ 51 Appendices ............................................................................................... 54


1
Summary Rice-wheat rotations are major contributors to both rice and wheat production in South Asia. However their sustainability is at risk due to associated problems including groundwater depletion, waterlogging and salinity, deteriorating soil physical conditions, declining soil organic matter content, groundwater and air pollution. Over the past decade it has been shown that wheat can be grown successfully on beds in rice-wheat systems, with many advantages including substantial irrigation water savings and higher yields. However, the nature of the water savings has not been quantified, and guidelines for irrigation management for wheat on beds, based on understanding of the system, have not been developed. This report presents the results of field experiments to evaluate irrigation scheduling options for wheat on beds in comparison with the recommended practice for conventionally tilled wheat. Replicated, small plot experiments were established on three soil types (sandy loam, loam, reclaimed sodic loam) in Punjab, India in November 2002. Irrigation treatments were commenced following an initial common irrigation 2-4 weeks after sowing. Irrigation of beds was to be scheduled when cumulative pan evaporation minus rain (CPE-R) reached 40, 60 or 80 mm (B40, B60, B80) and irrigation of flats when CPE-R reached 80 mm (recommended practice) or 120 mm (F80, F120). Irrigation application rates were 40 mm on beds and 80 mm on flats. Mid-season conditions were unusually overcast and cold, and the crops virtually stopped growing during the month prior to anthesis, resulting in lower than expected yields. Grain yields ranged from 3.5 to 3.6 t/ha on the reclaimed sodic loam, and 4.1 to 4.9 t/ha on the other two soils. Lodging prior to heading and waterlogging on the reclaimed sodic loam probably contributed to the lower yields. Rainfall was much higher than average and reasonably well distributed, and there were no differences in yield between irrigation treatments and layouts, with one exception. On the sandy loam yields on the flats were generally significantly higher than on the beds, by around 0.5 t/ha. This appeared to be due to failure of the crop on beds to produce sufficient tillers to compensate for the lower sowing rate associated with the wider row spacing between beds. The number of tillers per plant on the flats and beds on the sandy loam was similar, whereas at the other two sites the number of tillers per plant was 15-30% higher on the beds. The soil matric potential data suggest that the crop on the sandy loam suffered from water deficit stress during the period when tillers were forming as a result of delaying the first irrigation until 26 days after sowing, together with the more rapid drying of the topsoil on the beds. The recommended practice of delaying the first irrigation until 3-4 weeks after sowing may need to be revised to 2-3 weeks after sowing for wheat on beds on sandy loam soils. There was a substantial amount of residual soil water in all treatments at all sites at the time of harvest, more so on the two loam soils, largely due to the heavy rain (90-125 mm) prior to anthesis and over irrigation, particularly on the loam soil. The pattern of crop water extraction was quite different between the bed and flat treatments. The degree of drying at each site was relatively uniform to depth in the flat treatments. In contrast, drying was much greater in the surface layers of the beds, more so on the loam soils, where there was less drying at depth. The crops extracted water to at least 180 cm in all treatments on the sandy loam, and in the flat treatments on the two loam soils. However, extraction was confined to the upper 100 and 180 cm

2
in the bed treatments on the two loams. The results indicate that soil monitoring needs to be undertaken to depths beyond 180 cm on all soils to more accurately determine soil water depletion and to identify drainage beyond the rootzone In the bed treatments, soil water depletion from under the beds was greater than from the furrows in the upper layers. Therefore it is important to monitor both beds and furrows to more accurately determine soil water depletion on the bed layout. The efficiency of applied water (irrigation plus rain) in producing grain ranged from 1.1 to 1.9 g grain/kg water on the sandy loam and loam soils, and from 1.0 to 1.2 g/kg on the reclaimed sodic soil. Applied water productivity decreased with increasing irrigation application. There was no effect of layout or soil type on efficiency of use of available water (crop water use/total available water) nor on grain and biomass total water productivity. Introduction Rice-wheat rotations are major contributors to both rice and wheat production in South Asia and China, and contribute 19% (Pakistan), 35% (China), 40% (India) and 85% (Bangladesh, Nepal) of total wheat production in each country (Timsina and Connor 2001). In South Asia rice-wheat rotations are predominantly located the Indo-Gangetic Plains, occupying 13.5 Mha or 85% of the cultivated land area. However food security is threatened by yield stagnation, and the sustainability of rice-wheat systems is at risk due to problems including groundwater depletion, waterlogging and salinity, deteriorating soil physical conditions, declining soil organic matter content, and groundwater and air pollution. Over the past decade raised raised beds have been investigated for their suitability for wheat in rice-wheat and other systems of the Indo-Gangetic Plains, drawing on the experience of the high-yielding irrigated wheat growing area of northwestern Mexico (Hobbs and Gupta 2003). This work showed that wheat could be successfully grown on beds, with the advantages of reduced irrigation water requirement, sowing rate, lodging and incidence of Phalaris minor (Dhillon et al. 2000, Hobbs and Gupta 2003, RWC-CIMMYT 2003a, RWC-CIMMYT 2003b). While guidelines for irrigation management for conventionally tilled wheat on the flat in Punjab, India have been established based on sound understanding of the plant-soil water system (Prihar et al. 1974, 1976, 1978a,b) no guidelines are available for wheat on beds. The recommended post-sowing irrigation practice for wheat with conventional tillage on the flat is an initial irrigation at the crown root initiation stage (3-4 weeks after sowing), followed by three irrigations of about 75 mm when CPE-rain = 75-100 mm. This results in a total application of about 300 mm during an average wheat season, in addition to an irrigation prior to pre-sowing cultivation. The scheduling of irrigation based on CPE can assist more efficient use of both applied and residual soil water (Prihar et al. 1974, 1976). The purpose of the work reported here was to evaluate irrigation scheduling options for wheat on beds in comparison with the recommended practice for conventionally tilled wheat. Crop performance, soil water dynamics, components of the water balance and indices of water use efficiency were determined for wheat on beds and flats on three soil types in Punjab, India.

3
Methods Site Replicated field experiments were established at three sites in Punjab, India, during 2002/3. All soils were deep alluvial soils with very low organic matter content. The soil at Ludhiana was a sandy loam, while the soils at Phillaur and Kapurthala were both loams, the latter a reclaimed sodic soil with higher pH. There was a dense layer around 20 cm depth in the sandy loam and loam P, with bulk densities of 1.76 and 1.79 g/cm 3, respectively (Figure 1), similar to values previously reported for rice-wheat on a sandy loam at Ludhiana (Agarwal et al. 1995, and Kukal and Aggarwal 2002).
Figure 1. Soil bulk density at the three sites.
0
40
80
120
160
1.5 1.6 1.7 1.8Bulk density (g/cm3)
Dep
th (c
m)
sandy loamloam Ploam K
The loam at Phillaur (“loam P”) had much more clay (20-30%) in the subsurface layers than the other two soils, while the sandy loam had much more sand throughout the profile, increasing from 65% in the surface layer to 88% at 180 cm (Figures 2a,b,c). The sites were sampled for soil water content and pH immediately prior to sowing. Other properties were determined on samples collected from soil pits in the buffer areas during the wheat season. Soil properties and site details are summarised in Table 1. The depth to the groundwater at each site was in excess of 10 m.

4
Figure 2. Clay, silt (2-20 µm) and sand content of the soil at the three sites.
0
40
80
120
160
0 10 20 30 40
Clay %
Dep
th (c
m)
sandy loamloam Ploam K
0
40
80
120
160
0 10 20 30 40 50 60
Silt %
Dep
th (c
m)
sandy loamloam Ploam K
0
40
80
120
160
0 20 40 60 80 100
Sand %
Dep
th (c
m)
sandy loamloam Ploam K

5
Table 1. Soil properties at the three sites
Depth (cm)
Bulk density (g/cm3)
SWC at field
capacity
(cm3/cm3)
SWC at 15 bars
(cm3/cm3)
% clay % silt % sand pH 1:2
soil:water
Sandy loam (Punjab Agricultural University, Ludhiana – 30o56’N, 75o52’E, 247 m above sea level)
0-15 1.61±0.02 0.26 0.07 17.2 17.2 65.6 6.7 15-30 1.76±0.05 0.27 0.07 15.3 17.4 67.3 7.3 30-60 1.61±0.02 0.23 0.06 16.6 12.0 71.4 7.6 60-90 1.53±0.02 0.21 0.06 14.8 13.0 72.2 7.7 90-120 1.53±0.02 0.21 0.07 14.0 12.2 73.8 7.8 120-150 1.52±0.02 0.21 0.05 8.2 10.9 80.9 150-180 1.52±0.02 0.20 0.05 8.6 5.3 88.1
Loam P (Phillaur)
0-15 1.55±0.02 0.33 0.09 17.4 42.6 40.0 8.3 15-30 1.79±0.01 0.34 0.09 23.2 48.7 28.1 8.3 30-60 1.70±0.00 0.34 0.10 25.0 44.0 31.0 8.3 60-90 1.71±0.00 0.34 0.13 26.0 48.2 25.8 8.2 90-120 1.67±0.03 0.34 0.14 29.9 47.5 22.6 8.2 120-150 1.67±0.16 0.34 0.14 30.8 48.4 20.8 150-180 1.67±0.07 0.34 0.14 29.3 49.5 21.2
Loam K (Kapurthala)
0-15 1.70±0.06 0.37 0.06 17.6 47.6 34.7 8.8 15-30 1.69±0.02 0.26 0.05 17.0 28.0 55.0 9.0 30-60 1.51±0.01 0.22 0.04 14.0 29.8 56.2 9.2 60-90 1.63±0.01 0.26 0.05 7.8 54.4 37.8 9.2 90-120 1.76±0.01 0.34 0.12 26.4 55.0 18.6 9.3 120-150 1.78±0.04 0.38 0.07 19.8 53.9 26.3 150-180 1.77±0.00 0.38 0.09 19.8 56.7 23.4

6
Experimental design Treatments The experiments compared irrigation scheduling and application rate for wheat on bed and flat layouts, based on cumulative pan evaporation (CPE) adjusted for rainfall (CPE-rain) (Table 2). Each site was irrigated after rice harvest, prior to cultivation and sowing of wheat. At each site all plots were irrigated on the same date 2-4 weeks after sowing, prior to commencement of the irrigation treatments. There was significant rain at all sites (189-235 mm) during the period 80-110 DAS therefore the number of irrigations was reduced compared with the usual situation of four irrigations after sowing. Treatments B80 and B60 were identical on loam K, and almost identical on the sandy loam (a difference of 6 days in the timing of the last irrigation). On loam P treatments B80 and B60 also received the same total irrigation amount, but with considerable differences in the timing of the second and third irrigations. The treatments on loam P received higher irrigation applications than the same treatments at the other two sites, partly as a result of being sown earlier and the earlier irrigation during establishment, and partly as a result of over-irrigation. The amounts and time of irrigation for each treatment at each site are detailed in Table 3. Cumulative pan evaporation and irrigation plus rain over time after sowing are shown in Appendix Figures A1-3. The figures show that most treatments were over-irrigated according to scheduling based on CPE-rain. The over-irrigation occurred during the second half of the season following the heavy rain in February 2003, and to a greater degree on loam P. Further irrigations following the rain should not have been applied until CPE-rain reached the amount specified in the schedule.
Table 2. Irrigation scheduling treatment details Treatment ID Layout Irrigation schedule
CPE-rain (mm)
Irrigation rate
(mm) F80 Flat 80 80 F120 Flat 120 80 B80 Bed 80 40 B60 Bed 60 40 B40 Bed 40 40 B80(60) Bed 80 60

7
Table 3. Amounts (mm) and timings of irrigations and total rain Site Treatment Sandy loam
DAS F80 F120 B80 B60 B40 B80(60) Rain
26 71 71 60 60 60 60 56 40 129 40 40 135 80 40 40 60 Total 151 71 100 100 180 120 189 Loam P DAS F80 F120 B80 B60 B40 B80(60) 16 67 67 45 45 45 45 39 40 49 40 74 80 40 40 60 126 80 40 137 40 143 80 40 40 60 Total 227 147 125 125 205 165 189 Loam K DAS F80 F120 B80 = B60 B40 B80(60) 31 60 60 48 48 48 77 40 108 60 130 80 40 Total 140 60 48 128 108 235 Layout Plot size was 11.2 m x 12 m on the loam soils, and a little smaller (7 m x 12 m) on the sandy loam. There were four replicates in a randomized block design adjusted so that the same layout occurred in corresponding plots in replicates 1 and 2, and likewise for replicates 3 and 4 (Appendix 1). There were also large sown buffers between replicates and around the perimeter of the experiment. The purpose of paired layout plots and buffers was to provide longer runs for the bed planter and eliminate the need for turning within plots and unnecessary trafficking. Crop management The crops were established using recommended practices for flats and beds. The experimental sites were irrigated prior to applying two discings, two cultivations with a tyne harrow and one or two plankings. The flat plots were sown at 20 cm row spacing with a combine seed drill and the beds were formed and sown simultaneously with a bed planter (Photo 1). Row spacing on the beds was 20 cm, with 47 cm between rows on adjacent beds. The bed geometry is described in Figure 3. The seed was sown at about 5 cm depth, and sowing rate on the flats was higher than on the beds, at 100 and 75 kg/ha, respectively. Previous investigations have shown that these are the optimum sowing rates for wheat on flats and beds, and that the wheat on beds compensates for the lower plant population by producing more spikes per plant more grains per spike. Details of

8
the agronomic management are provided in Table 4. Weed control was excellent and there were no problems with pests and diseases.
Photo 1. Bed formation and sowing at Phillaur
Figure 3. Geometry of the beds
15 cm
5 cm 10 cm
37 cm 30 cm

9
Table 4. Crop management at the three sites Operation/ observation
Ludhiana (sandy loam)
Phillaur (loam P)
Kapurthala (loam K)
Pre sowing tillage
Disc=1 Tyne cultivator=2
Planker 2
Disc=2 Tyne cultivator=2
Planker=1 Sowing date 8/11/2002 1/11/2002 12/11/2002 Variety PBW 343 Seed rate Bed = 75 kg/ha
Flat = 100 kg/ha Row spacing 20 cm Sowing depth ~5 cm Pre-sowing fertilizers
26 kg P/ha and 23 kg N/ha as diammonium phosphate plus 37 kg N/ha as urea (total 60 kg N/ha) plus 25 kg K/ha as potassium chloride
broadcast immediately prior to sowing Topdressing 60 kg N/ha as urea broadcasta on: fertilizer 4/12/2002 25/11/2002 17/12/2002 Herbicide Leader (sulfosulfuron) @ 32.5 g/ha) on 11/12/2002 6/12/2002 22/12/2002 50% emergence
flats13/11/2002 beds 14/11/2002
flats 6/11/2002 beds 7/11/2002
50% anthesis 3-4/3/2003 2/3/2003 6/3/2003 30% grain moisture
3/4/2003 6/4/2003 8/4/2003
Harvest date 19/4/2003 16/4/2003 23/4/2003 A urea broadcast between the plant rows on the beds, and across the whon the beds Irrigation, surface drainage and rainfall The plots were irrigated with groundwater via a flexible pipe irrigation system connected to a tubewell (Photo 2). Irrigation volume was measured with a Woltman1 helical turbine meter installed in each tubewell outlet with at least 10 and 2 pipe diameters of straight pipe upstream and downstream, respectively. Plots were irrigated one at a time with the proscribed depth of water. The plots had earthen bunds and there was no visible seepage through the bunds or surface runoff. Salinity of the irrigation water was highest on loam K (1.2 dS/m) and least on the sandy loam (0.8 dS/m). The groundwater at Ludhiana contained 2.50 µg N/ml as nitrate, and 1.56 µg N/ml as ammonium. Table 5 provides chemical properties of the irrigation water.
1 Use of a registered trade name does not imply endorsement.

10
Photo 2. The irrigation system and irrigation of flat and bed plots at Phillaur
Flowmeter
Flexible pipe

11
Table 5. Chemical properties of the irrigation water at the three sites meq/l µg N/ml Location CO3
2- HCO3- Cl- Ca2++Mg2
+ Residual NaHCO3
NO3- NH4
+ EC dS/m
Ludhiana 0.0 5.0 0.8 8.2 0.0 2.50 1.56 0.78 Phillaur 0.0 7.2 1.0 7.7 0.0 0.91 Kapurthala 0.8 7.6 1.4 7.1 1.3 1.17 Soil water content Gravimetric soil water content was determined on augered samples taken immediately after sowing at 5 to 8 locations in the flat and bed areas at each site, and at the time of harvest in 2 replicates of each treatment. Samples in the bed area were collected from the middle of the beds at sowing, and from both mid-bed and mid-furrow at harvest. Volumetric soil water content was calculated from gravimetric water content and bulk density. Bulk density was determined by taking undisturbed samples from the wall of a deep soil pit in a flat buffer area using 5.5 cm diameter x 5 cm height steel rings. Two samples were collected from the middle of each depth interval (Table 1) at each site. Echo probes (20 cm long) were installed at 0-20 and 20-40 cm in F80 and B40 in replicates 1 and 2 on the sandy loam. In B40 sensors were installed both in the middle of the beds and in the plant rows at both depths, and at 0-20 cm in the furrows. Volumetric water content was logged hourly using Echo loggers for 70-80 days prior to removal from the field due to problems with theft and vandalism. The volumetric water content data reported here are derived using the manufacturer’s calibration, as the probes are yet to be calibrated for the sandy loam. Soil water potential Tube tensiometers were installed at 6-8 depths from 10-140 cm in two treatments – F80 and B40. In the bed plots they were installed both in the middle of the furrow and in the bed, about 4 cm inside the row (Photo 3). The tensiometers were installed in a tight-fitting hole sealed with a bentonite plug at the top, and were read with a SoilSpec vacuum gauge. Granular matrix sensors (GBlites) connected to Gbug loggers were installed at 120 and 140 cm in B40 (middle of bed and furrow), and at 40, 80, 100 and 120 cm in the flat plots. The GBlites were installed in an augered hole which was back-filled with loam and a bentonite plug. The GBlites were monitored using a manual reader following theft of three of the Gbugs from the field on 3 January 2003. Matric potential data reported here have not been corrected for temperature, which will be monitored at the relevant depths in 2004/5.

12
Photo 3. Tensiometers in the bed and furrow (after wheat harvest)
Soil water characteristic Soil water content at field capacity was determined in the field by ponding water in a buffer area, covering the surface to prevent evaporation, and sampling the soil two days after ponding had ceased. Gravimetric soil water content was determined on two samples from each depth, and converted to volumetric water content using bulk density. Gravimetric soil water content at 15 bars was determined in duplicate in the laboratory using pressure membrane apparatus and disturbed samples collected from the soil pits at each depth.

13
Weather Meteorological data was collected from the Department of Agronomy and Meteorology weather station on the PAU farm at Ludhiana, within 1.5 km of the experimental site. Rainfall was collected in rain gauges located about 0.5 km from the field at Kapurthala, and adjacent to the field at Phillaur. Crop growth, development and yield Plant population was determined by counting the number of plants in 4 x 1 m adjacent rows at two locations in each plot. Plant height and tiller and spike density were determined at the same locations at early tillering, later tillering, anthesis and maturity. At the same times 2 x 0.5 m adjacent rows were cut off at the soil surface for biomass determination. Plant height was determined on 15 plants in each plot on loams P and K, and on 10 plants on the sandy loam. Plant height was measured from the base of the plant to the collar of the last expanded leaf, or to the base of the spike at anthesis and maturity. At maturity, grain and straw yield were determined on a hand-harvested area of approximately 25 m2 in each plot on the sandy loam and loam K, and on an area of about 50 m2 on loam P. The number of grains per spike was determined on 10 spikes randomly selected from each plot on loams P and K, and on 5 spikes per plot on the sandy loam.. Average grain weight was determined on 1,000 grains randomly sampled from the large area harvest. The date of physiological maturity was estimated by grain hardness between the teeth. Root observations Root observations were made on two occasions in the flat and bed buffer areas receiving the same irrigation scheduling as F80 and B80. Sampling areas were selected where crop growth in the buffer was similar to crop growth in the experimental plots. Roots were exposed in flat and bed planted buffer areas 48 days after sowing on the sandy loam soil. A 1 m deep pit was dug and a wall perpendicular to the rows was prepared and washed carefully to minimize root loss. Root length density was determined at the end of heading in flat and bed buffer areas receiving the same irrigation scheduling as F80 and B80. Soil cores (5 cm diameter) were collected in 10 cm increments to the maximum observed rooting depth. In the flat plots samples were collected from two locations – immediately adjacent to the plant row (C) and mid-way between rows (D) (Photo 5a). The bed plot was sampled at four roughly equally spaced positions across the bed/furrow system – mid-bed (D), inside plant row (C), outside plant row (B - mid-slope) and mid furrow (A) (Photo 5b). Sampling was done at four sites in flat and bed buffer areas. The roots were washed out of the soil cores on a 1 mm sieve and root length density was determined by the line intercept technique (Newman 1966).
14
Results and discussion Soil hydraulic properties Volumetric soil water content (SWC) at field capacity on the sandy loam decreased with increasing depth below the surface, and was generally much lower that at the other two sites (Figure 4), consistent with the much higher sand content. SWC at field capacity in loam K reflected the trend in clay and silt content at that site, declining below the surface and then increasing at depth. SWC at field capacity on loam P was uniform to depth.
Figure 4. Volumetric soil water content at field capacity (FC) and 15 bars
0
40
80
120
160
0.0 0.1 0.2 0.3 0.4
Volumetric water content
Dep
th (c
m)
FC sandy loamFC loam PFC loam K15 bars sandy loam15 bars loam P15 bars loam K
Plant available water holding capacity calculated from the difference in SWC at field capacity and 15 bars, was similar on both loam soils to 90 cm, and below this depth was higher on loam K (Figure 5). Plant available water holding capacity on the sandy loam was lower than on the loam soils. Total available water capacity at 0-180 cm was 291, 389 and 443 mm on the sandy loam, loam P and loam K, respectively. These values are higher than those determined by Gajri et al. (1992, 1993) of 238 and 275 mm for sandy loam soils with lower clay % (6-10% and 10-14%, respectively) in the top 1.2 m.

15
Figure 5. Cumulative plant available water holding capacity (0-180 cm) at the three sites
0
40
80
120
160
0 100 200 300 400
Cumulative plant available water (mm)
Dep
th (c
m)
sandy loamloam Ploam K
Weather The 2002/3 wheat season was cooler than the long-term average, due to much lower maximum temperatures in January 2003 (Figure 6) due to unusually foggy conditions. Solar radiation was less than average in most months, especially in January when the number of sunshine hours was around half the average (Figure 7a), with less than 2 sunshine hours on 11 days. Total monthly pan evaporation was lower than average for most of the season, and there was unusually high rainfall at all three sites in February 2003 (Figure 7b). The long-term average rain for Ludhiana in February is 30 mm, whereas a total of 135 mm fell in February 2003 in two major events about 10 days apart.
Figure 6. Mean monthly maximum and minimum temperatures in 2002/3 and the long-
term (1966-1995) averages at Ludhiana
0
10
20
30
40
Nov Dec Jan Feb Mar Apr
Tem
pera
ture
(oC
)
Average Max
Max T 02/03
Min T 02/03
Average Min

16
Figure 7a. Mean monthly sunshine hours in 2002/3 and the long-term (1966-1995) averages at Ludhiana
0
2
4
6
8
10
12
Nov Dec Jan Feb Mar Apr
Sun
shin
e (h
ours
/day
)
02/03Average
Figure 7b. Mean monthly pan evaporation and rain in 2002/3 and the long-term (1966-
1995) averages at Ludhiana
0
50
100
150
200
250
Nov Dec Jan Feb Mar Apr
Rai
n (m
m)
0
50
100
150
200
250Ev
apor
atio
n (m
m)
Rain 02/03Average RainPan evap 02/03Average Pan

17
Crop Establishment Crop establishment at all three sites was good and ranged from 171-208 plants/m2 on the flats and 120-135 plants/m2 on the beds (Figure 8). The lower population in the bed treatments was largely due to the 25% lower sowing rate. Establishment was more uniform (lower standard deviations) on the sandy loam, probably because of the finer tilth and therefore more even sowing depth on this soil. Plant density on the flats on loam K was about 13% lower than at the other two sites, whereas plant density on the beds at all three sites was similar (means for each site 127-130 plants/ m2). The reason for the lower establishment on the flat on loam K is unclear, but was possibly due to cloddier soil or incorrect adjustment of the bed planter to achieve the correct sowing rate. Phenological development Fifty per cent establishment occurred 5 to 6 days after sowing on the sandy loam and loam P, and was consistently one day later on the beds. The duration of the crops from sowing to anthesis decreased with later sowings, and was 113 days on loam K, 115 days on the sandy loam and 121 days on loam P. The duration from sowing to maturity was 156 days on loam P and 146-147 days at the other two sites. The duration of grain filling from anthesis to maturity was similar at all sites and ranged from 32 days on the sandy loam to 35 days on loam P.

18
Figure 8. Plant establishment
0
50
100
150
200
250
F80 F120 B80 B60 B40 B80(60)
No.
pla
nts/
m2
a) sandy loam
0
50
100
150
200
250
F80 F120 B80 B60 B40 B80(60)
No.
pla
nts/
m2
b) loam P
0
50
100
150
200
250
F80 F120 B80 B60 B40 B80(60)
No.
pla
nts/
m2
c) loam K

19
Growth The crops were very uniform at all three sites (Photos 4a,b,c), with the exception of a couple of plots on the sandy loam with due to an uneven soil surface, and a couple of plots with suspected high alkalinity on loam K. Crop growth was similar at all sites up to anthesis, with mean biomass at the three sites ranging from 7.0-7.4 t/ha at anthesis (Figure 9). There was very little dry matter accumulation from about 75 DAS to anthesis, reflecting the cold, foggy and overcast weather during this period. Biomass tended to be higher on the flats than on the beds during late tillering and anthesis, with some significant but small differences. At maturity total biomass was similar in all treatments on the two loam soils, but was significantly higher in the flat treatments (mean 11.8 t/ha) compared with the beds (mean 10.2 t/ha) on the sandy loam. There were no significant differences between irrigation treatments within layouts. Total biomass at harvest was much higher on loam P (mean 13.2 t/ha) compared with the other two sites (mean 10.2 t/ha on loam K and 10.7 t/ha on the sandy loam) due to a much higher growth rate on loam P between anthesis and maturity. Between anthesis and harvest the mean total biomass increased by 5.8 t/ha on loam P compared with 3.8 t/ha on the sandy loam and 2.9 t/ha on loam K. The increase in biomass on the flat treatments on the sandy loam was higher (4.6 t/ha) than on the beds (3.9 t/ha), but still considerably less than the increase on loam P. There was lodging in all treatments on loam K as a result of heavy rain around the end of tillering – the crop grew vertically following this, producing an L-shaped stem (Photo 5). There were very few additional tillers produced beyond 75 DAS. There was a consistent trend for higher tiller density in the flat treatments at all sites, and the difference was much larger and always significant on the sandy loam (Figure 10). Tiller density on the beds on the sandy loam was lower than on the two loam soils, while tiller density on the flats on loam P was lower than at the other two sites. Tiller density tended to be higher on the more frequently irrigated bed treatments (B40, B60) than on the other bed treatments, but the differences were seldom significant. In contrast with biomass and tiller production, crop height increased rapidly between 75 DAS and heading, especially on the loam soils (Figure 11). On the sandy loam the crop grew taller earlier in the season, despite roughly the same biomass around 75 DAS at all three sites. Plant height was not affected by layout or irrigation treatment, and at maturity the crop was a little shorter on loam K (76 cm) compared with the other two sites (84 cm). Total N uptake at harvest ranged from 111-141 kg N/ha, and was about 20 kg N/ha higher on loam P than the other two sites, due to much higher N uptake in the grain (Appendix Figure A4). The higher N uptake in the grain on loam P was due to higher grain %N (mean 2.39% on loam P compared with 2.11% on the sandy loam). This was reflected in the much higher nitrogen harvest indices on loam P (0.83-0.87) than at the other two sites (0.79-0.84). Differences between treatments were small apart from much higher N uptake in F80 compared with F120 on loam P.

20
Photos 4a,b,c. Appearance of the crop during early grain filling at each site
a) sandy loam
b) loam P
c) loam K

21
Photo 5. Appearance of the crop on beds on loam K following lodging around the end of tillering on loam K

22
Figure 9. Biomass accumulation over time (vertical bars are l.s.d., P=0.05)
0
5
10
15
0 50 100 150 200
Days after sowing
Dry
wei
ght (
t/ha)
F80F120B80B60B40B80(60)Series1
a) sandy loam
0
5
10
15
0 50 100 150 200
Days after sowing
Dry
wei
ght (
t/ha)
F80F120B80B60B40B80(60)Series1
b) loam P
0
5
10
15
0 50 100 150 200
Days after sowing
Dry
wei
ght (
t/ha)
F80F120B80B60B40B80(60)Series1
c) loam K

23
Figure 10. Tiller density over time (vertical bars are l.s.d., P=0.05)
300
400
500
600
700
0 50 100 150 200
Days after sowing
No.
tille
rs/m
2F80F120B80B60B40B80(60)Series1
a) sandy loam
300
400
500
600
700
0 50 100 150 200
Days after sowing
No.
tille
rs/m
2
F80F120B80B60B40B80(60)Series1
b) loam P
300
400
500
600
700
0 50 100 150 200
Days after sowing
No.
tille
rs/m
2
F80F120B80B60B40B80(60)Series1
c) loam K

24
Figure 11. Plant height over time (vertical bars are l.s.d., P=0.05)
0
20
40
60
80
100
0 50 100 150 200
Days after sowing
Hei
ght (
cm)
F80F120B80B60B40B80(60)Series1
a) sandy loam
0
20
40
60
80
100
0 50 100 150 200
Days after sowing
Hei
ght (
cm)
F80F120B80B60B40B80(60)Series1
b) loam P
0
20
40
60
80
100
0 50 100 150 200
Days after sowing
Hei
ght (
cm)
F80F120B80B60B40B80(60)
c) loam K

25
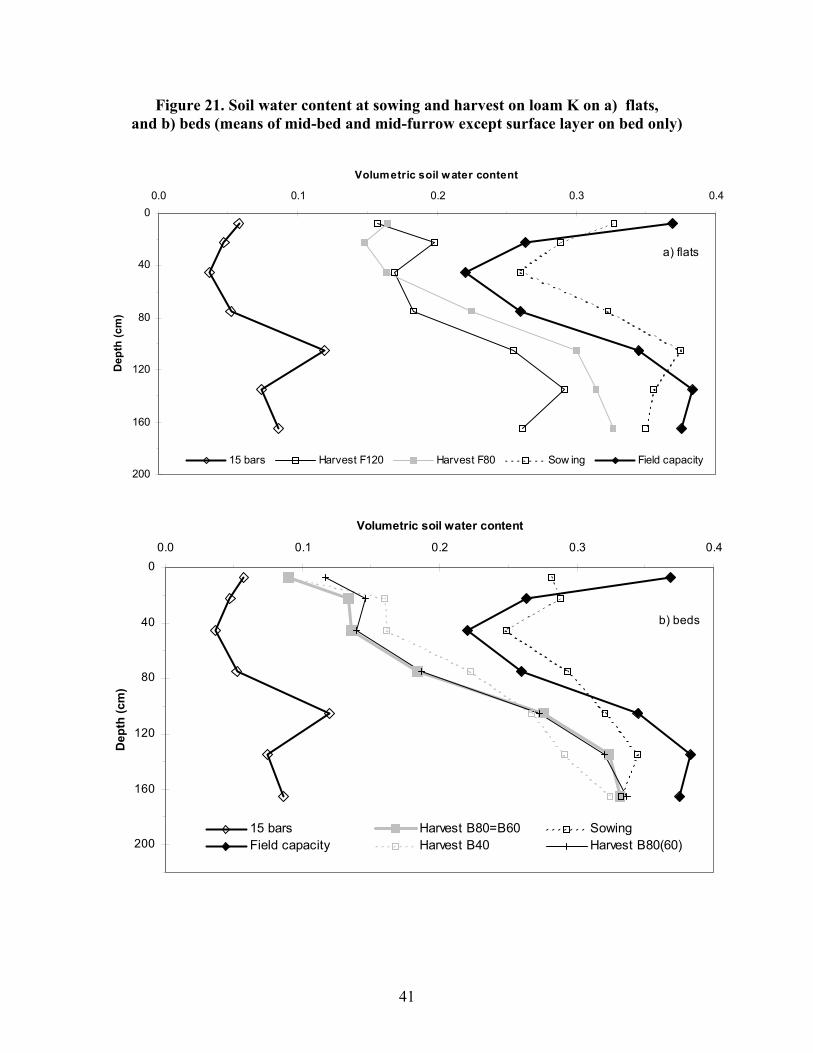
Yield and yield components Spike density was significantly higher on the flats than on the beds on the sandy loam and loam K (Table 6, Appendix Figure A5). There were no significant differences between irrigation treatments within layout at any sites, although there was a consistent trend for the lowest spike density in B80, which was always significantly lower than in F80. Mean spike density on the flats on the sandy loam was higher than on the loam sites (490 spikes/m2 cf. 467 and 412 spikes/m2 on loams K and P, respectively). However mean spike density on the beds was similar at all three sites (379-412 spikes/m2). There was a consistent trend for more grains per spike on the beds than on the flats at all sites, however there were no significant differences between layouts or irrigation treatments (Table 6, Appendix Figure A6). The mean number of grains per spike was higher on the sandy loam (41 grains/spike) than on the loam soils (30-33 grains/spike). There was a consistent trend for higher average grain weight on beds than on flats, with some significant but small differences between treatments on the sandy loam and loam P (Table 6, Appendix Figure A7). There were no significant differences between irrigation treatments within layout. Average grain weight was lowest on the sandy loam (43 mg) and highest on loam K (49 mg). Grain yields were lower on loam K ranging from 3.5 to 3.6 t/ha compared with 4.1 to 4.9 t/ha at the other two sites (Table 6, Figure 12). Yield was significantly higher in F120 than all bed treatments on the sandy loam, and yield of F80 was significantly higher than all bed treatments except B80. Yields of all treatments at the other two sites were similar. Straw yield was highest on loam P (7.6-9.8 t/ha) compared with 5.6-7.2 t/ha at the other two sites (Appendix Figure A8). There were no consistent treatment effects on straw yield across the sites, except for a tendency to be higher on the flats than on the beds on the sandy loam and loam K, with some significant differences. Harvest index was higher on the sandy loam (0.40-0.44) than at the other two sites (0.32-0.39) (Table 6, Appendix Figure A9). There were no consistent trends in harvest index across treatments. Grain yields calculated from the yield components were unreasonably high (up to 7.9 t/ha) and considerably higher than measured yields from the large areas harvested for yield determination (Table 6). The correlation between measured and calculated grain yield was extremely weak (R2 = 0.0 on each loam soil and 0.5 on the sandy loam, and 0.1 when the data from all three sites were lumped together). The discrepancies ranged from 14 to 37% on loam K, and were even higher on the sandy loam (46 to 73%) and loam K (56 to 83%). These discrepancies between observed and calculated grain yield are unacceptable and it is most likely that there were errors in the determination of one or more of the yield components. Spike density was considerably higher (by 13 to 54%) than the mean of 321 spikes/m2 reported for PBW343 by Dhillon et al. (2000) for crops with a mean yield of 4.9 t/ha, similar to the

26
highest yielding treatments on the sandy loam and loam P. The number of grains per spike at all sites was lower by around 15% on the sandy loam, 30% on loam P and 40% on loam K than the values recorded by Dhillon et al. (2000), however the sample size for determination of the number of grains per spike very small. Average grain weight on the sandy loam was comparable to the average of 41 mg recorded by Dhillon et al. (2000) and higher by around 10% on loam P and 20% on loam K. The magnitude of the yield components should be viewed with suspicion, especially spike density, however if there was a systematic error in the determinations then the relative values may still reflect real differences between the treatments.
Table 6. Grain yield and yield components
Spikes/m2
(no./ m2) Grains/spike
(no.) Grain wt
(mg) Calculatedgrain yield (t/ha - dry)
Harvest grain yield (t/ha - dry)
Harvest index
Sandy loam F80 493 38.0 42.4 7.93 4.78 0.40 F120 486 38.4 40.9 7.64 4.92 0.42 B80 363 41.4 43.4 6.53 4.46 0.44 B60 396 43 43.5 7.41 4.35 0.44 B40 396 42.6 43.8 7.39 4.26 0.40
B80(60) 362 40.4 43.8 6.40 4.12 0.41 CD (5%) 40.9 NS 1.5 0.41
Loam P F80 397 30.7 43.9 5.36 4.70 0.35 F120 423 31.6 45.9 6.19 4.63 0.36 B80 368 34.9 46.9 6.03 4.94 0.39 B60 388 34.0 47.3 6.24 4.55 0.33 B40 385 33.0 48.0 6.11 4.60 0.32
B80(60) 398 33.8 47.3 6.38 4.93 0.35 CD (5%) NS NS 1.85 NS
Loam K F80 467 29.1 48.2 6.55 3.59 0.34 F120 446 26.5 48.2 5.69 3.64 0.34
B80/B60 402 30.8 50.4 6.23 3.49 0.35 B40 400 31.3 49.0 6.13 3.49 0.36
B80(60) 404 29.4 49.2 5.85 3.46 0.34 CD (5%) 45.2 NS NS 5 NS

27
Figure 12. Dry grain yield (vertical bars are l.s.d., P=0.05)
0
1
2
3
4
5
6
F80 F120 B80 B60 B40 B80(60)
Gra
in y
ield
(t/h
a)
a) sandy loam
0
1
2
3
4
5
6
F80 F120 B80 B60 B40 B80(60)
Gra
in y
ield
(t/h
a)
b) loam P
0
1
2
3
4
5
6
F80 F120 B80 B60 B40 B80(60)
Gra
in y
ield
(t/h
a)
c) loam K

28
Root growth Visual observations 48 days after sowing showed that root concentration in the surface layers of wheat on the flat was highest near the plant row and decreased with distance from the row (Photo 6a). In the sub-surface layers roots were evenly distributed across the profile. At this stage the crop on beds also had more roots near the plant row in the surface layers (Photo 6b). Roots in the surface layers of the bed planted crop were thinner than those of the crop on the flat, possibly due to lower soil strength in the beds (not measured). Roots were observed under both the bed and the furrow, however there were more roots under the bed compared with the furrow in the subsurface layers.
Photo 6. Root distribution 48 days after sowing on a) flat, and b) bed layouts A = mid-furrow, B = mid-slope, C = plant row, D = mid-bed/mid-plant row
At the end of heading roots were detected to a depth of 140 cm adjacent to the plant row and to 160 cm mid-way between the rows in the flat layout (Appendix Table A1). Root length density was higher adjacent to the row than mid-row throughout the profile to a depth of about 100 cm,
D C B
A
C D b) a)

29
except in the 20-30 cm layer with very high bulk density (Table 1). On the beds, root depth adjacent to the plant row on either side was slightly deeper (to 150 cm compared with 140 cm on the flat). Root depth in the middle of the beds was less (130 cm) (Appendix Table A1, Figure 13a). Roots were detected to 140 cm in the middle of the furrow, equivalent to 150-155 cm below the bed surface. These observations suggest that the soil volume exploited by the roots was similar for both flat and bed layouts. Root length density was much higher in the surface (0-10 cm) of the beds than in the surface of the flats, both adjacent to the plant row and mid-way between the rows, despite the fact that row spacing was the same on the flats and on the bed tops. In the surface layers of the beds, root length density was greatest in the middle of the bed, mid-way between the rows, and decreased moving towards the furrow. Below 30 cm root length density was similar under the bed and furrow. The spatial variation in gravimetric soil water content throughout the soil profile was relatively small at the time of harvest, ranging from 5.9 to 9.8%. However the trends across the profile generally corresponded closely with the root length density profiles (Appendix Table A2, Figure 13b). On the beds soil water content was least in the surface 0-30 cm mid way between the rows, and increased towards the furrow. Soil water content was higher in the furrow to about 90 cm depth. On the flats soil water content was lower in the surface 0-30 cm near the rows than mid-way between the rows, and similar below this depth.

30
Figure 13a. Root length distribution (cm/cm3) in the bed/furrow at heading
Figure 13b. Gravimetric soil water content (%) in the bed/furrow system at harvest
-150cm
-140cm
-130cm
-120cm
-110cm
-100cm
-90cm
-80cm
-70cm
-60cm
-50cm
-40cm
-30cm
-20cm
-10cm
00.10.20.40.60.81.21.41.61.822.22.42.62.833.13.2
-180
-170
-160
-150
-140
-130
-120
-110
-100
-90
-80
-70
-60
-50
-40
-30
-20
-10
6.4%
6.6%
6.8%
7%
7.2%
7.4%
7.6%
7.8%
8%
8.2%
8.4%
8.6%
8.8%
9%
9.2%
9.4%
9.6%

31
Soil water dynamics Matric potential Around the time of sowing matric potential was low (less than – 15 kPa) in the subsoil at all sites (Figures 14-16). During the season there was considerable drying and wetting of the surface layers at all sites in response to crop water use, irrigation and rain. The tensiometers were read manually and were not read at times when the surface of the plots was too wet to walk on without damaging the soil and crop. Therefore the presented data under-represent the degree and duration of wetting in the surface layers. The surface soil (10, 20 cm) in the beds generally dried faster than on the flats after sowing (Appendix Figures A10a,b, A11a,b, A12a,b ), however on the loam soils matric potential at 10 and 20 cm did not increase beyond -50 k Pa prior to the first irrigation, or beyond -40 to -70 kPa prior to the second irrigation. In contrast, the tensiometers broke down (matric potentials in excess of -70 to -80 kPa) prior to the first and second irrigations in both treatments at 10 cm on the sandy loam, and exceeded -70 kPa on the beds at 20 cm.
Sandy loam On the sandy loam in F80 there was very little drying of the soil at 60 cm or deeper until the end of January, and no response below 40 cm to the rain in January (Figure 14a). Throughout the season average matric potential at 100 cm and deeper increased steadily from about -5 kPa to about –15 kPa between sowing and harvest, however this was the result of significant drying to depth in one replicate only (a consistent effect throughout the profile), and the sudden decrease in mean matric potential at 100 cm prior to irrigation in mid March was due to the tensiometer breaking down in the replicate with significant drying, resulting in the lower matric potential calculated from the three remaining replicates in which the degree of drying was very small. The heavy rain in February wet the profile to a depth of at least 80 cm. There was no response to irrigation or rainfall below 100 cm. However, potential gradients between 140 and 120 cm were small but negative (downwards) from sowing until the end of February (Appendix Figure 13a), suggesting some deep drainage beyond 140 cm at this site in F80. Estimation of the amount of drainage requires knowledge of the hydraulic conductivity of the soil as a function of soil water content, which will be determined in 2004. Treatment B40 was irrigated more frequently than F80, but with half the amount at each irrigation, and received a total of only 29 mm more than F80. In the surface soil (10, 20 cm) the beds dried down much more rapidly than the flats and the furrows (Appendix Figures A10a,b). At depths of 60-100 cm, matric potentials in the beds and furrows in corresponding layers were similar until around mid-February, when the beds began to dry down faster than the furrows at 80 and 100 cm (Appendix Figures A10e,f). At deeper depths potentials were similar under beds and furrows throughout the season (Appendix Figures A10g,h). Below 40 cm matric potentials in B40 and F80 were similar until early to mid-February, after which potentials were generally lower in B40 than in F80, despite the fact that each treatment received a total of 80 mm irrigation (the beds in two doses) within a period of 6 days. The wetter soil at depth in B40 probably reflects the poorer growth of the crop on beds and consequently reduced crop water use requirement to meet evaporative demand.

32
The trends in matric potential measured using the Gblites were generally consistent with the tensiometer data, and also showed gradual soil drying at depth, more so at 120 cm than 140 cm towards the end of the season (Appendix Figures 14a,b). They also showed similar values under the beds and furrows at depth.
Loam P Drying at 80-140 cm in F80 occurred to a slightly greater degree on loam P than on the sandy loam, despite an additional irrigation in January, with matric potential increasing from about –5 kPa to –20 kPa by the end of January, compared with less than –10kPa on the sandy loam at this time (Figures 14a, 15a). Drying at depth ceased following the rain in late January, and matric potentials at all depths decreased to less than –10 kPa following heavy rain in mid-February, indicating deep drainage beyond the monitoring depth (140 cm). The degree of drying at all depths from 40 to 140 cm was generally greater in F80 than under the beds in the more frequently irrigated B40 (Appendix Figures A11a-e). In the surface layers (10, 20 cm) the beds dried down more rapidly than the flats. There was evidence of wetting and drainage beyond 140 cm following the rain in mid-February in B40. Matric potentials under the beds and furrows at 140 cm below the bed surface were similar throughout the season in B40. Potential gradients were small but negative throughout the season, suggesting some drainage beyond 140 cm in F80 and B40 (Appendix Figure 13b).
Loam K Water extraction on loam K was largely confined to the upper 40 cm throughout the season, with little drying at 40 cm until the end of the grain filling period (Figures 16a,b). Potentials at 80-100 cm remained close to field capacity (-10 kPa), and the soil at 120 and 140 cm remained close to saturation throughout the season. Differences in matric potential under beds and furrows at corresponding depths relative to the bed surface were generally small (Appendix Figures A12a-g). Matric potential at all depths declined slightly following the heavy rain in mid-February, and the final irrigation on 22 March, indicating deep drainage beyond 140 cm. Potential gradients between 120 and 140 cm were very small throughout the season (Appendix Figure 13c).

33
Figure 14. Matric potential in the sandy loam in F80 and beds in B40 (means of 4)
-80
-70
-60
-50
-40
-30
-20
-10
010-Nov-02 10-Dec-02 9-Jan-03 8-Feb-03 10-Mar-03 9-Apr-03
Mat
ric p
oten
tial (
kPa)
10 cm
140 cm
120 cm
100 cm
80 cm
40 cm
20 cm21 mm
rain80 mm
irrigation
90 mmrain71 mm
irrigation
35 mmrain
60 cm
12 mm rain
F80
-80
-70
-60
-50
-40
-30
-20
-10
010-Nov-02 10-Dec-02 9-Jan-03 8-Feb-03 10-Mar-03 9-Apr-03
Mat
ric p
oten
tial (
kPa) 21 mm
rain
40 mmirrigation
90 mmrain60 mm
irrigation
35 mmrain
B40 - bed
12 mm rain40 mmirrigation
10 cm
120 cm
100 cm
60 cm
80 cm
40 cm
20 cm
140 cm

34
Figure 15. Matric potential in loam P in F80 and beds in B40 (means of 4)
-90
-80
-70
-60
-50
-40
-30
-20
-10
012-Nov-02 12-Dec-02 11-Jan-03 10-Feb-03 12-Mar-03 11-Apr-03
Mat
ric p
oten
tial (
kPa)
10 cm
140 cm
120 cm
80 cm
40 cm
20 cm
18 mmrain
80 mmirrigation
90 mmrain
67 mmirrigation
80 mmirrigation
20 mmrain
F80
33 mmrain
-90
-80
-70
-60
-50
-40
-30
-20
-10
012-Nov-02 12-Dec-02 11-Jan-03 10-Feb-03 12-Mar-03 11-Apr-03
Mat
ric p
oten
tial (
kPa)
10 cm
140 cm
120 cm
80 cm
40 cm
20 cm
21 mmrain
40 mm irrigation
90 mmrain
45 mmirrigation 40 mm
irrigation40 mm irrigation
30 mmrain
40 mm irrigation
B40
33 mmrain

35
Figure 16. Matric potential in loam K in F80 and beds in B40 (means of 4)
-80
-70
-60
-50
-40
-30
-20
-10
0
1012-Nov-02 12-Dec-02 11-Jan-03 10-Feb-03 12-Mar-03 11-Apr-03
Mat
ric p
oten
tial (
kPa)
10 cm
140 cm
120 cm100 cm
80 cm
40 cm
20 cm
18 mmrain
80 mm irrigation
115 mmrain
60 mm irrigation
F80
-80
-70
-60
-50
-40
-30
-20
-10
0
1012-Nov-02 12-Dec-02 11-Jan-03 10-Feb-03 12-Mar-03 11-Apr-03
Mat
ric p
oten
tial (
kPa)
10 cm
140 cm
120 cm100 cm
80 cm
40 cm
20 cm18 mm
rain40 mm irrigatio
115 mmrain48 mm
irrigation 40 mmirrigation
B40

36
Volumetric soil water content – sandy loam The Echo probe data show slow drying prior to irrigation in both layers, and virtually simultaneous (within 1 h – the logging interval) wetting of the surface soil and subsoil upon irrigation. The diurnal fluctuations in the data are temperature effects, and thus their magnitude is smaller in the subsoil, and decreases over time as the diurnal temperature fluctuation decreases going into winter. The Echo probe data suggest that volumetric water content of the surface soil (0-20 cm) was initially higher than of the subsoil (20-40 cm), which appears to be inconsistent with the tensiometer data (Figure 14a). The reason for the discrepancy is not known; the porosity in the surface soil may have been initially higher due to cultivation, and may have declined over time following irrigation. The soil water contents at field capacity reported in Table 1 were determined some time after irrigation, i.e. after the cultivated layer had settled, hence the similar values in the surface layer and the layer below. The 20-40 cm probes were in zones of higher bulk density and likely lower porosity.
Figure 17. Volumetric soil water content in F80
0.05
0.1
0.15
0.2
0.25
0.3
0.35
0.4
0 10 20 30 40 50 60 70 80
Days after sowing
Volu
met
ric w
ater
con
tent
0-20 cm R1
20-40 cm R1
20-40 cm R2
F80

37
The Echo probe data show that the beds were evenly wetted, both horizontally and to a depth of 40 cm (Figure 18). The surface layers (0-20 cm) in the beds dried down more rapidly than the furrow and the subsoil in the bed following irrigation. The subsoil in the middle of the bed was initially wetter than the subsoil under the plant row, and this continued to be the case following the first two irrigations.
Figure 18. Volumetric soil water content in B40 across beds and furrow
0.05
0.1
0.15
0.2
0.25
0.3
0.35
0.4
0 10 20 30 40 50 60 70
Days after sowing
Volu
met
ric w
ater
con
tent
20-40 cm mid bed0-20 cm furrow20-40 cm row0-20 cm mid bed0-20 cm row
B40 rep 2
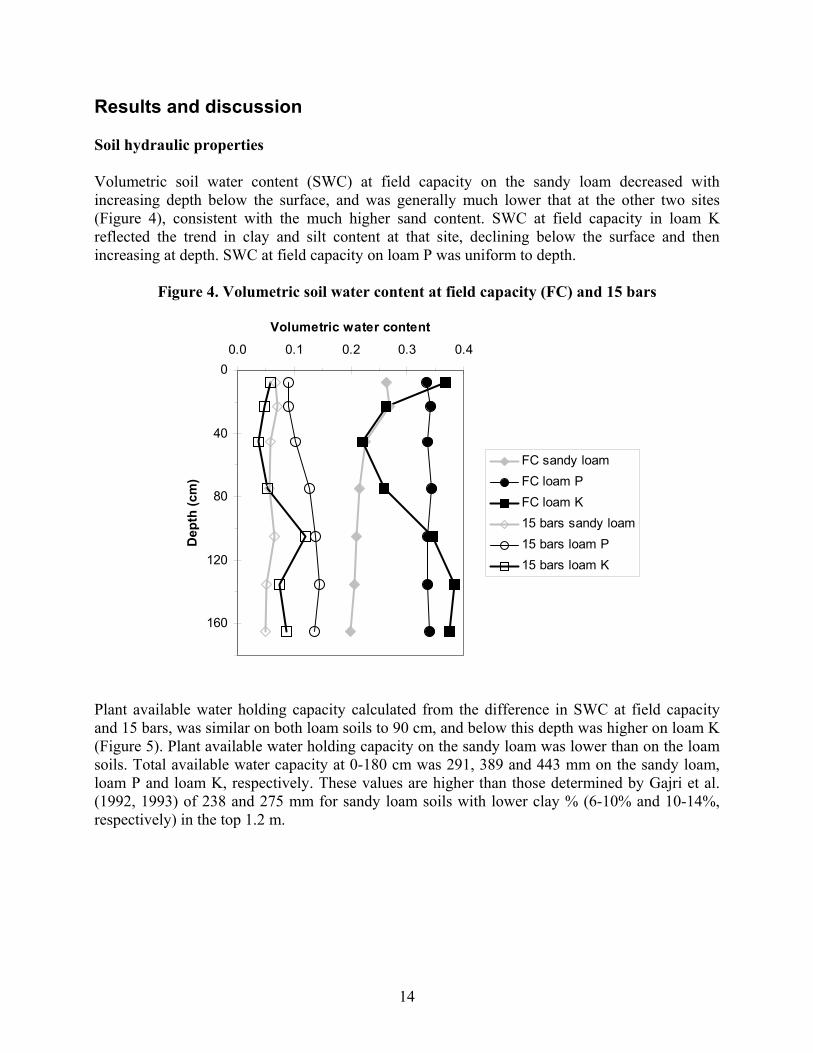
Crop water use Total water application (irrigation plus rain) ranged from 260-370 mm on the sandy loam, 283-375 mm on loam K, and 314-416 mm on loam P (Appendix Table A3). At the time of sowing soil water content was lower than field capacity throughout the profile on the sandy loam and loam P, but with adequate moisture for good establishment (Figures 19, 20). On loam K the topsoil was drier than field capacity at the time of sowing, but the subsoil was wetter than field capacity and therefore close to saturation (Figure 21), consistent with the tensiometer data prior to the first irrigation after sowing (Figure 16). By the time of harvest there was net drying of the soil profile at all sites in all treatments (Figures 19-21). Significant drying had occurred to the depth of measurement (158-180 cm layer) in all treatments on the sandy loam, and in the flat treatments on the two loam soils. The depth of drying was less on the bed treatments on the loam soils, to about 100 cm on loam P and 150 cm on loam K.

38
The pattern of crop water extraction was quite different between the bed and flat treatments (Figures 19-21). The degree of drying at each site was relatively uniform to depth in the flat treatments, although the degree of drying in the less frequently irrigated F120 on the sandy loam was greatest in the upper layers. In contrast, drying was much greater in the surface layers of the bed treatments, more so on the loam soils, where there was also less drying at depth. The degree of drying under the less frequently irrigated F120 was greater than under F80 on the sandy loam and loam K, but not on loam P, which is surprising given that F80 on loam P received an additional 80 mm towards the end of the season, and the similar biomass production in both treatments. Patterns of soil drying in the bed treatments were not obviously related to the irrigation treatments at any site, and total soil water depletion between sowing and harvest was similar in all bed treatments within sites (113-132 mm on the sandy loam, 90-101 mm on loam P and 174-182 on loam K) (Appendix Table A3). Soil water depletion was greatest on loam K, which received lower irrigation applications than the other two sites. In B80 the amount of drying in the subsoil under the beds was greater than under the furrows on all soils (Figures 22a,b,c). The differences were least on loam P, where they only occurred in the deep subsoil (below about 80 cm) at this site. Soil water content at harvest was similar under the beds and furrows in the three more frequently irrigated bed treatments on the sandy loam and loam P (Appendix Figures A14-16), suggesting that there was adequate available water under the beds and no cause for the roots to proliferate further into the furrows. Soil water content was always higher in the subsoil under the furrows than under the beds on loam K, probably reflecting the poorer growth and lower water use requirement of the crop at this site. On the sandy loam, soil water content at harvest under the beds and furrows was similar in B60 despite the fact that it received the same total irrigation application as B80, where the differences between the soil water content under the beds and furrows were pronounced. The last irrigation in B80 was 6 days later than in B60, towards the end of the grain filling period. Therefore the root system under the furrow in B80 may have been less well developed, or with too little time left before maturity to dry the soil in furrows to the same degree as under the beds. There was a substantial amount of residual plant available soil water (PAW) at all sites at the time of harvest (Figure 23), especially on the loams. This was largely a result of the heavy mid-season rainfall and over-irrigation in relation to CPE-rain, more so on loam P (Appendix Figures A1-3). Even in F120 on loam K, which only received one early irrigation, there was considerable PAW remaining at the time of harvest (274 mm). In contrast, in F120 on the sandy loam, which also only received one early irrigation, there were only 61 mm of PAW remaining at harvest. Soil water depletion between sowing and harvest was much less on loam P (42-109 mm) compared with the sandy loam (87-155 mm) and loam K (145-190 mm) (Figure 23, Appendix Table A3). The lower irrigation applications on the latter two sites, and the lower soil water holding capacity of the sandy loam, would have contributed to the greater soil water depletion compared with loam P. Soil water depletion in all treatments on the sandy loam was less than the allowable depletion of 170 mm determined by Prihar et al. (1978) for a sandy loam with a slightly lower total plant available water capacity.

39
Figure 19. Soil water content at sowing and harvest on the sandy loam on a) flats, and b) beds (means of mid-bed and mid-furrow except surface layer on bed only)
0
40
80
120
160
200
0.0 0.1 0.2 0.3 0.4
Volumetric soil water content
Dep
th (c
m)
15 bars Harvest F120 Harvest F80 Sow ing Field capacity
a) flats
0
40
80
120
160
200
0.0 0.1 0.2 0.3 0.4
Volumetric soil water content
Dep
th (c
m)
15 bars Harvest B80 Harvest B60Sowing Field capacity Harvest B40Harvest B80(60)
b) beds

40
Figure 20. Soil water content at sowing and harvest on loam P on a) flats, and b) beds (means of mid-bed and mid-furrow except surface layer on bed only)
0
40
80
120
160
200
0.0 0.1 0.2 0.3 0.4
Volumetric soil water content
Dep
th (c
m)
15 bars Harvest F120 Harvest F80 Sow ing Field capacity
a) flats
0
40
80
120
160
200
0.0 0.1 0.2 0.3 0.4
Volumetric soil water content
Dep
th (c
m)
15 bars Harvest B80 Harvest B60Sowing Field capacity Harvest B40Harvest B80(60)
b) beds
41
Figure 21. Soil water content at sowing and harvest on loam K on a) flats, and b) beds (means of mid-bed and mid-furrow except surface layer on bed only)
0
40
80
120
160
200
0.0 0.1 0.2 0.3 0.4
Volumetric soil water content
Dep
th (c
m)
15 bars Harvest F120 Harvest F80 Sow ing Field capacity
a) flats
0
40
80
120
160
200
0.0 0.1 0.2 0.3 0.4
Volumetric soil water content
Dep
th (c
m)
15 bars Harvest B80=B60 SowingField capacity Harvest B40 Harvest B80(60)
b) beds

42
Figure 22a,b. Soil water content under the beds and furrows at harvest in B80 on the sandy loam and loam P
0
40
80
120
160
200
0.0 0.1 0.2 0.3 0.4
Volumetric soil water content
Dep
th (c
m)
15 bars Sowing Field capacityHarvest B80 - furrow Harvest B80 - bed
a) sandy loam
0
40
80
120
160
200
0.0 0.1 0.2 0.3 0.4
Volumetric soil water content
Dep
th (c
m)
15 bars Sowing Field capacityHarvest B80 - furrow Harvest B80 - bed
b) loam P

43
Figure 22c. Soil water content under the beds and furrows at harvest in B80 on loam K
0
40
80
120
160
200
0.0 0.1 0.2 0.3 0.4
Volumetric soil water content
Dep
th (c
m)
15 bars SowingField capacity Harvest B80 - furrowHarvest B80 - bed
c) loam K

44
Figure 23. Components of the water balance and residual plant available soil water (0-180 cm) (Dswc = initial-final soil water content)
-500
-300
-100
100
300
500
F80 F120 B80 B60 B40 B80(60)
mm
IrrigationRainResidual PAWDswc
a) sandy loam
-500
-300
-100
100
300
500
F80 F120 B80 B60 B40 B80(60)
mm
IrrigationRainResidual PAWDswc
b) loam P
-500
-300
-100
100
300
500
F80 F120 B80=B60 B40 B80(60)
mm
IrrigationRainResidual PAWDswc
c) loam K

45
Crop water use, water use efficiency and productivity Crop water use (CWU) was calculated from total water application (irrigation plus rain) and soil water depletion (SWD) (Appendix Table 3). The calculation of CWU assumes that there was no drainage below 180 cm, no runoff, and that soil water extraction was confined to the upper 180 cm. The latter assumption is true in the case of the beds on the two loam soils, however the soil water profiles (Figures 19-21) indicate that the crop extracted water to at least 180 cm in all treatments on the sandy loam, and in the flat treatments on the two loam soils. It is unlikely that there was significant run off as the plots had bunds about 15 cm high. CWU ranged from 402-492 mm on the sandy loam, 385-498 mm on loam P and 465-537 mm on loam K. Within treatments, CWU was consistently highest on loam K, which is unexpected given the lower total biomass at this site. Total biomass production was highest on loam P, however this also was not reflected in higher crop water use. Therefore the assumptions of no runoff or deep drainage losses are questionable, especially at site K. At site P the rain gauge overflowed in February, and the rainfall for Ludhiana was used in the water balance; if the rainfall at Ludhiana was lower than at Phillaur, this would result in underestimation of CWU at Phillaur. Total water use efficiency (WUET) was calculated from crop water use as a proportion of total available water as detailed below. CWU = I+R+∆SWC
WUET = CWU*100/(I+R+PAW) where ∆SWC = soil water depletion between sowing and harvest PAW = plant available soil water at the time of sowing (0-180 cm)
= SWCsowing-SWC15bars SWCsowing = soil water content at sowing SWC15bars = soil water content at 15 bars Total water use efficiency was highest on the sandy loam (78-94%), least on loam K (68-72%) and intermediate on loam P (67-79%) (Table 7). Total water use efficiency decreased as the amount of available water increased (due to irrigation), and the data for the two layouts and three sites fitted the one regression line, suggesting no effect of layout or soil type on total water use efficiency (Figure 24).

46
Table 7. Water use efficiency indices F80 F120 B80 B60 B40 B80(60)
Total water use efficiency (WUET) Sandy loam 77.9 93.5 87.5 85.0 88.8 89.4 Loam P 74.6 67.1 77.9 76.4 78.8 76.0 Loam K 68.3 71.2 69.5 71.7 71.1
Applied water use productivity (g grain/kg irrigation + rain) Sandy loam 1.41 1.89 1.54 1.51 1.15 1.34 Loam P 1.13 1.38 1.57 1.45 1.17 1.39 Loam K 0.96 1.23 1.23 0.96 1.01
Grain total water productivity (g grain/kg irrigation + rain + soil water) Sandy loam 1.12 1.18 1.08 1.08 0.87 0.94 Loam P 0.96 1.20 1.15 1.08 0.92 1.10 Loam K 0.69 0.75 0.75 0.65 0.67
Biomass total water productivity (g biomass/kg irrigation + rain + soil water) Sandy loam 2.80 2.81 2.43 2.48 2.16 2.28 Loam P 2.71 3.34 2.38 3.25 2.89 2.81 Loam K 2.00 2.19 2.18 1.80 1.97
Figure 24. Total water use efficiency (WUET) as affected by available water (I+R+PAW at sowing) at the three sites
(the thick black line is the trendline for beds and flats combined across the three sites)
y = -0.064x + 117R2 = 0.71
y = -0.068x + 117R2 = 0.61
y = -0.067x + 118R2 = 0.66
50
60
70
80
90
100
400 500 600 700 800
Total available water (mm)
WU
ET (%
)
FlatsBedsLinear (all)

47
The productivity of applied water (irrigation plus rain) in producing grain averaged 1.31 g/kg and ranged from 1.89 in F120 on the sandy loam to 0.96 in B40 on loam K. Sharma et al. (2002) observed water productivities of 1.30-1.35 g/kg for wheat on beds on a marginally sodic silt loam in north west India, compared with 1.55 g/kg for conventionally tilled wheat on the flat. The higher water productivity on the flats was due to higher grain yield, with similar total water application (320 mm) to that received by F80 on the sandy loam in our experiment. Total water productivity was calculated from grain and total biomass yields as a proportion of total water use (I+R+∆SWC). Both grain and total water productivity declined as crop water use increased (Figures 25, 26). Grain total water productivity was highest on loam P (0.92-1.20 g/kg), least on loam K (0.69-0.75 g/kg), and intermediate on the sandy loam (Table 7). The data for all layouts and sites fitted the same line (R2=0.79), suggesting no effect of layout or soil type on grain total water productivity (Figure 25). There was a wide range in biomass total water productivity within and between sites, from 1.8 g/kg in B40 on loam K to 3.3 g/kg in F120 on loam P. Biomass total water productivity was least on loam K and was similar or higher on loam P than on the sandy loam. The data for all layouts and sites fitted the same line better than individual regressions for the beds and flats, suggesting no effect of layout or soil type on biomass total water productivity (Figure 26).

48
Figure 25. Grain total water productivity as affected by total water use (the thick black line is the trendline for beds and flats combined across the three sites)
y = -0.0040x + 2.80R2 = 0.87
y = -0.0035x + 2.53R2 = 0.74
y = -0.0037x + 2.65R2 = 0.79
0.6
0.8
1.0
1.2
1.4
300 350 400 450 500 550
Total water use (mm)
Wat
er p
rodu
ctiv
ity (g
/kg)
BedsFlatsLinear (all)
Figure 26. Biomass total water productivity as affected by total water use (the thick black line is the trendline for beds and flats combined across the three sites)
y = -0.0084x + 6.44R2 = 0.81
y = -0.0058x + 5.16R2 = 0.34
y = -0.0069x + 5.71R2 = 0.50
1.5
2.0
2.5
3.0
3.5
4.0
300 350 400 450 500 550
Total water use (mm)
Wat
er p
rodu
ctiv
ity (g
/kg)
Flats
BedsLinear (all)

49
General discussion The overcast, cool mid-season conditions in 2003 probably prevented the crops from achieving the growth and grain yields that would be expected from a well-managed wheat crop in a more normal season. Grain yields of around 5 t/ha would normally be achievable in this environment with the management adopted in this experiment (Dhillon et al. 2000). The early lodging in the crop on loam K and wet soil conditions probably contributed to the lower total biomass production and yield at this site. The reasons for the higher growth rate between anthesis and maturity and thus higher total biomass production on loam P compared with the sandy loam are unclear. The significant rain in late January and mid-February and the fact that all treatments received ample or excessive irrigation prevented any crop response to irrigation treatment, in contrast with other studies where rainfall was very low (Gajri et al. 1992, 1993). However there was a consistent trend for lower tillering and spike production in the less frequently irrigated bed treatments, suggesting possible water deficit in these treatments during the tillering phase. Crop growth on beds and flats was generally similar within each loam site, apart from a trend for higher biomass and tiller density on the flats during mid-tillering and anthesis, due to the lower sowing rate and plant population on the beds and the time taken for the crops on beds to compensate for the wider row spacing between rows on adjacent beds. Yields on the beds on the sandy loam were lower than on the flats due to lower tiller and subsequently spike density. The plants on beds did not compensate for the wider row spacing between beds by increased tiller production, in contrast with the crops on beds on the loam soils, especially loam P. At anthesis the number of tillers per plant on the beds (~4.02) was 30% higher than on the flats on loam P and about 15% higher on the beds than flats on loam K, while there was no difference between the number of tillers per plant on the beds and flats on the sandy loam (Figure 27). The difference was significant on loam P. Yadvinder-Singh (2003) also found lower yields of wheat on beds compared with flats in 2002/3 on a sandy loam site very close to the sandy loam site in the above experiment. Sharma et al. (2002) also reported significantly lower grain and straw yield and spike density for wheat on beds compared with conventional tillage on the flat on a marginally sodic silt loam at Modipuram. While tillering was better on beds, it did not fully compensate for the area loss between the beds. These findings are in contrast with numerous other reports of similar or higher yields for wheat on beds compared with flats on research stations and in farmers’ fields (Dhillon et al. 2000, Hobbs and Gupta 2003, RWC-CIMMYT 2003a,b, Sayre and Hobbs 2003).
2 Calculated assuming that the number of plants at anthesis was the same as the number present after crop establishment.

50
Figure 27. Number of tillers per plant (vertical bar is l.s.d. P=0.05)
0
2
4
Tille
rs p
er p
lant
Flat Bed
sandy loam loam Kloam P
Total N uptake of the plant tops at harvest averaged around 120 kg N/ha on the sandy loam and loam K, and 130 kg N/ha on loam P. A total of 120 kg N/ha was applied as fertiliser, raising the question of whether 120 kg N/ha is adequate to reach yield potential, given the possibility of N losses. However the cause of the lower tillering on the beds on the sandy loam is unlikely to have been due to inadequate N in the 2002/3 season in which yield potential was reduced due to lack of radiation. Furthermore, in an adjacent rice-wheat field during the same season on the same soil type, yields of wheat on beds and flats increased with N rate up 120 kg N ha-1, with no further response at 160 kg N ha-1 (Yadvinder-Singh 2003). The soil matric potential data showed that the topsoil (10, 20 cm) in the beds dried more rapidly than in the flats after irrigation, and that the tensiometers broke down (matric potentials in excess of -70 to -80 kPa) prior to the first and second irrigations in both beds and flats at 10 cm on the sandy loam, and exceeded -70 kPa on the beds at 20 cm. The results suggest that the crop on the sandy loam may have suffered from water deficit stress during the period when tillers were forming, impairing the ability of the crop on beds to compensate for the lower plant population and the wider row spacing. The recommended practice of delaying the first irrigation until 3-4 weeks after sowing may need to be revised to 2-3 weeks after sowing for wheat on beds on sandy loam soils.

51
The benefits of beds in fine textured soils prone to waterlogging have been clearly demonstrated in other parts of the world (Batchelor et al. 1980, Sweeney et al. 1988, Tisdall and Hodgson 1990, Thompson and North 1994). However in our experiment there were no benefits of beds on loam K, a sodic soil prone to waterlogging as demonstrated by the tensiometer data. The poor weather for growth and lodging as a result of rain may have overridden any potential benefits of beds in this season. Numerous comparisons of wheat on flat and bed layouts in farmers’ field suggest significant savings in irrigation water applications, often estimated from the time taken to irrigate the fields (RWC-CIMMYT 2003a,b, Sayre and Hobbs 2003). The reduced irrigation applications are probably largely due to reduced deep drainage losses. As there was no yield response to irrigation treatment due to the unusually high rain in late January and mid-February and adequate or over irrigation of treatments in this experiment, it was not possible to identify any irrigation water savings with beds in this experiment. Furthermore, irrigation water savings determined in small plot experiments are likely to underestimate the savings in farmers’ fields due to the much longer irrigation times in farmers’ fields and increased opportunity for deep drainage losses. The total potential gradients indicated drainage fluxes between 120 and 140 cm for most of the season in most treatments at all sites. The gradients were similar for F80 and B40 except in F80 on the sandy loam during the grain filling period, when the gradient changed from drainage to upflow. F80 received 30 mm less irrigation than B40, while these treatments received roughly similar total irrigation applications on the two loams. The gravimetric soil water determinations indicate that the crops in F80 and F120 used water from the lowest sampled layer (150-180 cm) at all sites, and also in all bed treatments on the sandy loam, consistent with the findings of Prihar et al. (1976). A small amount of roots were also observed to depths of 160 cm at the time of heading on the sandy loam. Therefore monitoring needs to be undertaken to deeper depths to more accurately determine crop water use from soil water depletion, and drainage losses beyond the rootzone. The tensiometer data and gravimetric soil water data at harvest show that soil water extraction was greater under the beds than in the furrows in B80 at all sites, and in all bed treatments on loam K. This was consistent with the observation of higher root density in the top of the beds in B80 on the sandy loam. Therefore it is necessary to sample both the beds and furrows to depth to more accurately determine soil water depletion from the bed layout. References Aggarwal, G.C., Sidhu, A.S., Sekhon, N.K., Sandhu, K.S. and Sur, H.S. (1995). Puddling and N management effects on crop response in a rice-wheat cropping system. Soil and Tillage Research 36, 129-139. Batchelor, J.T., Collins, F.C., Parsons, C.E. (1980) Wheat production on wide beds formed on Sharkey clay. Arkansas Farm Res. 29: 3.

52
Dhillon, S.S., Hobbs, P.R. and Samra, J.S. (2000). Investigations on bed planting system as an alternative tillage and crop establishment practice for improving wheat yields sustainably. In Proc. 15th Conf Int. Soil Till. Res. Org. 2-7 July 2000, Fort Worth, Texas (CD-ROM). Gajri, P.R., Prihar, S.S. and Arora, V.K. (1993). Interdependence of nitrogen and irrigation effects on growth and input-use efficiencies in wheat. Field Crops Res. 31: 71-86. Gajri, P.R., Arora, V.K. and Prihar, S.S. (1992). Tillage management for efficient water and nitrogen use in wheat following rice. Soil Till. Res. 24: 167-182. Hobbs, P.R. and Gupta, R.K. (2003). Resource-conserving technologies for wheat in the rice-wheat system. In Ladha, J.K., Hill, J.E., Duxbury, J.M., Gupta, R.K. and Buresh, R.J. (Eds) ‘Improvint the Productivity and Sustainability of Rice-Wheat Systems: Issues and Impacts’. Pp. 149-171. American Society of Agronomy Special Publication No. 65. ASA, CSSA, SSSA, Madison, Wisconsin, USA. Kukal, S.S. and Aggarwal, G.C. (2003). Puddling depth and intensity effects in rice-wheat system on a sandy loam soil I. Development of subsurface compaction. Soil and Tillage Research 72, 1-8. Newman, E.I. (1966). A method of estimating total length of roots in a sample. J. Appl. Ecol 3: 139-145. Prihar, S.S., Sandhu, B.S., Khera, K.L. and Jalota, S.K. (1978a). Water use and yield of winter wheat in northern India as affected by timing of last irrigation. Irrigation Science 1, 39-45. Prihar, S.S., Gajri, P.R. and Narang, R.S. (1978b). Permissible profile-water depletions for optimum wheat production on two different soils. Journal of Indian Society of Soil Science 26, 7-11. Prihar, S.S., Khera, K.L., Sandhu, K.S. and Sandhu, B.S. (1976). Comparison of irrigation schedules based on pan evaporation and growth stages in winter wheat. Agronomy Journal 68, 650-653. Prihar, S.S., Gajri, P.R., Narang, R.S. (1974). Scheduling irrigation to wheat using pan evaporation. Ind. J. Agric. Sci. 44: 567-571. RWC-CIMMYT (2003a). Addressing resource conservation issues in rice-wheat systems of south Asia: a resource book. Rice-Wheat Consortium for the Indo-Gangetic Plains – International Maize and Wheat Improvement Center. New Delhi, India. RWC-CIMMYT (2003b). Agenda notes – 11th Regional Technical Coordination Committee Meeting. 4-6 March 2003, Kathmandu, Nepal. R Rice-Wheat Consortium for the Indo-Gangetic Plains – International Maize and Wheat Improvement Center. New Delhi, India.

53
Sayre, K.D. and Hobbs, P. (2003). Raised bed system of cultivation for irrigated production. (unpubl) Sharma, P.K., Bushan, Lav, Ladha, J.K., Naresh, R.K., Gupta, R,J., Balasubramanian, B.V., Bouman, B.A.M. (2002). Crop-water relations in rice-wheat cropping under different tillage systems and water-management practices in a marginally sodic, medium-textured soil. In Bouman, B.A.M., Hengsdijk, H., Hardy, B., Bindraban, P.S., Tuong, T.P., Ladha, J.K (eds) ‘Water-wise rice production’. Proceedings of the International Workshop on Water-wise Rice Production, 8-11 April 2002, Los Banos, Philippines. IRRI, Los Banos, Philippines. Sweeney, D.W., Sisson, J.B. (1988). Effect of ridge planting and N application methods on wheat grown in somewhat poorly drained soils. Soil Till. Res. 12: 187-196. Thompson, J.A., North, S. (1994). Raised beds reduce winter waterlogging. Farmers’ Newsletter Large Area No. 143: 38. Timsina, J., Connor, D.J. (2001). Productivity and management of rice-wheat cropping systems: issues and challenges. Field Crops Res. 69: 93-132. Tisdall, J.M., Hodgson, A.S. (1990). Ridge tillage in Australia: a review. Soil Till. Res. 18: 127-144. Yadvinder-Singh (2003). Integrated Soil, Water and Nutrient Management for Sustainable Rice-Wheat Cropping Systems in Asia. International Atomic Energy Agency Coordinated Research Project Progress Report. IAEA, Vienna, Austria.

54
Appendices

55
Layout at PAU Sowing date: 8-11-2002 N 24 T2
23 T5
22 T4
21 T1
20 T3
19 T6
Non-experimental area Non-experimental area 13 T1
14 T6
15 T3
16 T2
17 T4
18 T5
Non-experimental area Non-experimental area 12 T5
11 T4
10 T1
9 T3
8 T6
7 T2
Non-experimental area Non-experimental area 1 12 m T6
2 7.0 m T3
3 T2
P AS S AGE 4
T4
5 T5
6 T1
Tubewell
Irrigation Treatments: T1: Flat (80mm) at CPE = 80, 160 and 240 mm T2: Flat (80mm) at CPE = 120 and 240 mm T3: Bed (40mm) at CPE = 80, 160 and 240 mm T4: Bed (40mm) at CPE = 60, 120, 180 and 240 mm T5: Bed (40mm) at CPE = 40, 80, 120, 160, 200 and 240 mm T6: Bed (60mm) at CPE = 80, 160 and 240 mm Amount of water required for each cm of irrigation = 0.84 m3 Plot area = 84 m2

56
Layout at Phillaur Sowing date: 1-11-2002 N 24 T2
23 T5
22 T4
21 T1
20 T3
19 T6
Non-experimental area Non-experimental area 13 T1
14 T3
15 T6
16 T2
17 T5
18 T4
Non-experimental area Non-experimental area 12 T3
11 T6
10 T2
9 T5
8 T4
7 T1
Non-experimental area Non-experimental area 1 12 m T4
2 11.2 m T5
3 T1
P AS S AGE 4
T3
5 T6
6 T2
Tubewell
Irrigation Treatments: T1: Flat (80mm) at CPE = 80, 160 and 240 mm T2: Flat (80mm) at CPE = 120 and 240 mm T3: Bed (40mm) at CPE = 80, 160 and 240 mm T4: Bed (40mm) at CPE = 60, 120, 180 and 240 mm T5: Bed (40mm) at CPE = 40, 80, 120, 160, 200 and 240 mm T6: Bed (60mm) at CPE = 80, 160 and 240 mm Amount of water required for each cm of irrigation = 1.34 m3 Plot area = 134 m2

57
Layout at Kapurthala Sowing date: 12-11-2002 S 24 T5
23 T2
22 T4
21 T6
20 T3
19 T1
Non-experimental area Non-experimental area 13 T4
14 T1
15 T6
16 T3
17 T5
18 T2
Non-experimental area Non-experimental area 12 T1
11 T6
10 T3
9 T2
8 T4
7 T5
Non-experimental area Non-experimental area 1 12 m T2
2 11.2 m T3
3 T5
P AS S AGE 4
T1
5 T6
6 T4
Tubewell Irrigation Channel
Irrigation Treatments: T1: Flat (80mm) at CPE = 80, 160 and 240 mm T2: Flat (80mm) at CPE = 120 and 240 mm T3: Bed (40mm) at CPE = 80, 160 and 240 mm T4: Bed (40mm) at CPE = 60, 120, 180 and 240 mm T5: Bed (40mm) at CPE = 40, 80, 120, 160, 200 and 240 mm T6: Bed (60mm) at CPE = 80, 160 and 240 mm Amount of water required for each cm of irrigation = 1.34 m3 Plot area = 134 m2

58
Appendix Figure A1. Cumulative pan evaporation and irrigation plus rain on the sandy loam (arrows indicate irrigations and amount applied)
0
50
100
150
200
250
300
350
400
450
0 20 40 60 80 100 120 140 160
Days after sowing
mm
71 mm
80 mm
CPE
F120
F80
sandy loam
0
50
100
150
200
250
300
350
400
450
0 20 40 60 80 100 120 140 160
Days after sowing
mm
sandy loam
CPE
60 mm
B80B60
B40
40 mm
40 mm

59
Appendix Figure A2. Cumulative pan evaporation and irrigation plus rain on loam P (arrows indicate irrigations and amount applied)
0
50
100
150
200
250
300
350
400
450
0 20 40 60 80 100 120 140 160
Days after sowing
mm
67 mm
80 mm
CPE
F120
F80
loam P
80 mm
0
50
100
150
200
250
300
350
400
450
0 20 40 60 80 100 120 140 160
Days after sowing
mm
loam P
CPE
45 mm
B80B60
B4040 mm
40 mm40 mm

60
Appendix Figure A3. Cumulative pan evaporation and irrigation plus rain on loam K (arrows indicate irrigations and amount applied)
0
50
100
150
200
250
300
350
400
450
0 20 40 60 80 100 120 140 160
Days after sowing
mm
60 mm
80 mm
CPE
F120
F80
loam K
0
50
100
150
200
250
300
350
400
450
0 20 40 60 80 100 120 140 160
Days after sowing
mm
loam K
CPE
48 mm
B80=B60
B4040 mm
40 mm

61
Appendix Figure A4. Total N uptake at harvest in straw ( ) and grain ( )
0
40
80
120
160
F80 F120 B80 B60 B40 B80(60)
kg N
/ha
a) sandy loam
0
40
80
120
160
F80 F120 B80 B60 B40 B80(60)
kg N
/ha
b) loam P
0
40
80
120
160
F80 F120 B80 B60 B40 B80(60)
kg N
/ha
b) loam K
62
Appendix Figure A5. Spike density (vertical bars are l.s.d., P=0.05)
0
200
400
600
F80 F120 B80 B60 B40 B80(60)
No.
spi
kes/
m2
a) sandy loam

63
0
200
400
600
F80 F120 B80 B60 B40 B80(60)
No.
spi
kes/
m2
b) loam P
0
200
400
600
F80 F120 B80 B60 B40 B80(60)
No.
spi
kes/
m2
c) loam K
Appendix Figure A6. Number of grains per spike (vertical bars are l.s.d.,
P=0.05)
0
10
20
30
40
50
F80 F120 B80 B60 B40 B80(60)
No.
gra
ins/
spik
e
a) sandy loam

64
0
10
20
30
40
50
F80 F120 B80 B60 B40 B80(60)
No.
gra
ins/
spik
e
b) loam P
0
10
20
30
40
50
F80 F120 B80 B60 B40 B80(60)
No.
gra
ins/
spik
e
c) loam K

65
Appendix Figure A7. 1,000 grain weight (vertical bars are l.s.d., P=0.05)
0
10
20
30
40
50
F80 F120 B80 B60 B40 B80(60)
1000
gra
in w
t (g)
a) sandy loam
0
10
20
30
40
50
F80 F120 B80 B60 B40 B80(60)
1000
gra
in w
t (g)
b) loam P
0
10
20
30
40
50
F80 F120 B80 B60 B40 B80(60)
1000
gra
in w
t (g)
c) loam K

66
Appendix Figure A8. Straw yield (vertical bars are l.s.d., P=0.05)
0
2
4
6
8
10
F80 F120 B80 B60 B40 B80(60)
Stra
w y
ield
(t/h
a)
a) sandy loam
0
2
4
6
8
10
F80 F120 B80 B60 B40 B80(60)
Stra
w y
ield
(t/h
a)
b) loam P
0
2
4
6
8
10
F80 F120 B80 B60 B40 B80(60)
Stra
w y
ield
(t/h
a)
c) loam K

67
Appendix Figure A9. Harvest index (vertical bars are l.s.d., P=0.05)
0.00
0.10
0.20
0.30
0.40
0.50
F80 F120 B80 B60 B40 B80(60)
Har
vest
inde
x
a) sandy loam
0.00
0.10
0.20
0.30
0.40
0.50
F80 F120 B80 B60 B40 B80(60)
Har
vest
inde
x
b) loam P
0.00
0.10
0.20
0.30
0.40
0.50
F80 F120 B80 B60 B40 B80(60)
Har
vest
inde
x
c) loam K

68
Appendix Figures A10a,b. Soil matric potential in treatments F80 and B40 on the sandy loam at 10 and 20 cm
-80
-70
-60
-50
-40
-30
-20
-10
010-Nov-02 10-Dec-02 9-Jan-03 8-Feb-03 10-Mar-03 9-Apr-03
Mat
ric p
oten
tial (
kPa)
bed 10 cmflat 10 cm
-80
-70
-60
-50
-40
-30
-20
-10
010-Nov-02 10-Dec-02 9-Jan-03 8-Feb-03 10-Mar-03 9-Apr-03
Mat
ric p
oten
tial (
kPa)
bed 20 cm
furrow 25 cm
flat 20 cm

69

70
Appendix Figures A10c,d. Soil matric potential in treatments F80 and B40 on the sandy loam at 40 and 60 cm
-80
-70
-60
-50
-40
-30
-20
-10
010-Nov-02 10-Dec-02 9-Jan-03 8-Feb-03 10-Mar-03 9-Apr-03
Mat
ric p
oten
tial (
kPa)
bed 40 cm
furrow 35 cm
flat 40 cm
-80
-70
-60
-50
-40
-30
-20
-10
010-Nov-02 10-Dec-02 9-Jan-03 8-Feb-03 10-Mar-03 9-Apr-03
Mat
ric p
oten
tial (
kPa)
bed 60 cm
furrow 55 cm
flat 60 cm

71
Appendix Figures A10e,f. Soil matric potential in treatments F80 and B40 on the sandy loam at 80 and 100 cm
-80
-70
-60
-50
-40
-30
-20
-10
010-Nov-02 10-Dec-02 9-Jan-03 8-Feb-03 10-Mar-03 9-Apr-03 9-May-03 8-Jun-03 8-Jul-03
Mat
ric p
oten
tial (
kPa)
bed 80 cm
furrow 75 cm
flat 80 cm
-80
-70
-60
-50
-40
-30
-20
-10
012-Nov-02 12-Dec-02 11-Jan-03 10-Feb-03 12-Mar-03 11-Apr-03
Mat
ric p
oten
tial (
kPa)
bed 100 cm
furrow 95 cm
flat 95 cm

72
Appendix Figures A10g,h. Soil matric potential in treatments F80 and B40 on the sandy loam at 120 and 140 cm
-80
-70
-60
-50
-40
-30
-20
-10
012-Nov-02 12-Dec-02 11-Jan-03 10-Feb-03 12-Mar-03 11-Apr-03
Mat
ric p
oten
tial (
kPa)
bed 120 cm
furrow 115 cm
flat 120 cm
-80
-70
-60
-50
-40
-30
-20
-10
012-Nov-02 12-Dec-02 11-Jan-03 10-Feb-03 12-Mar-03 11-Apr-03
Mat
ric p
oten
tial (
kPa)
bed 140 cm
furrow 135 cm
flat 140 cm

73
Appendix Figures A11a,b. Soil matric potential in treatments F80 and B40 on loam P at 10 and 20 cm
-90
-80
-70
-60
-50
-40
-30
-20
-10
012-Nov-02 12-Dec-02 11-Jan-03 10-Feb-03 12-Mar-03 11-Apr-03
Mat
ric p
oten
tial (
kPa)
bed 10 cmflat 10 cm
21 mmrain
Birrig
90 mmrain
B, Firrig
B,Firrig
B irrig
30 mmrain
Birrig
33 mmrain
-90
-80
-70
-60
-50
-40
-30
-20
-10
012-Nov-02 12-Dec-02 11-Jan-03 10-Feb-03 12-Mar-03 11-Apr-03
Mat
ric p
oten
tial (
kPa)
bed 20 cm
furrow 25 cm
flat 20 cm
21 mmrain
Birrig
90 mmrain
B, Firrig B,F
irrigB irrig
30 mmrain
Birrig
33 mmrain

74
Appendix Figures A11c,d. Soil matric potential in treatments F80 and B40 on loam P at 40 and 80 cm
-80
-70
-60
-50
-40
-30
-20
-10
012-Nov-02 12-Dec-02 11-Jan-03 10-Feb-03 12-Mar-03 11-Apr-03
Mat
ric p
oten
tial (
kPa)
bed 40 cm
furrow 35 cm
flat 40 cm
21 mmrain
Birrig
90 mmrain
B, Firrig B,F
irrigB irrig
30 mmrain
Birrig
33 mmrain
-80
-70
-60
-50
-40
-30
-20
-10
012-Nov-02 12-Dec-02 11-Jan-03 10-Feb-03 12-Mar-03 11-Apr-03
Mat
ric p
oten
tial (
kPa)
bed 80 cm
flat 80 cm
21 mmrain
Birrig
90 mmrain
B, Firrig B,F
irrigB irrig
30 mmrainB
irrig
33 mmrain

75

76
Appendix Figures A11e,f. Soil matric potential in treatments F80 and B40 on loam P at 120 and 140 cm
-80
-70
-60
-50
-40
-30
-20
-10
012-Nov-02 12-Dec-02 11-Jan-03 10-Feb-03 12-Mar-03 11-Apr-03
Mat
ric p
oten
tial (
kPa)
bed 120 cm
flat 120 cm
21 mmrain
Birrig
90 mmrain
B, Firrig B,F
irrigB irrig
30 mmrainB
irrig
33 mmrain
-80
-70
-60
-50
-40
-30
-20
-10
012-Nov-02 12-Dec-02 11-Jan-03 10-Feb-03 12-Mar-03 11-Apr-03
Mat
ric p
oten
tial (
kPa)
bed 140 cm
flat 140 cm
furrow 135 cm
21 mmrain
Birrig
90 mmrain
B, Firrig B,F
irrigB irrig
30 mmrainB
irrig
33 mmrain

77

78
Appendix Figures A12a,b. Soil matric potential in treatments F80 and B40 on loam K at 10 and 20 cm
-80
-70
-60
-50
-40
-30
-20
-10
0
1012-Nov-02 12-Dec-02 11-Jan-03 10-Feb-03 12-Mar-03 11-Apr-03 11-May-03 10-Jun-03
Mat
ric p
oten
tial (
kPa)
bed 10 cm
flat 10 cm18 mm
rainBirrig
115 mmrain
B, Firrig B, F
irrig
-80
-70
-60
-50
-40
-30
-20
-10
0
1012-Nov-02 12-Dec-02 11-Jan-03 10-Feb-03 12-Mar-03 11-Apr-03 11-May-03 10-Jun-03
Mat
ric p
oten
tial (
kPa)
bed 20 cm
furrow (25 cm)
flat 20 cm18 mmrain
Birrig
115 mmrain
B, Firrig
B, Firrig

79
Appendix Figures A12c,d. Soil matric potential in treatments F80 and B40 on loam K at 40 and 80 cm
-80
-70
-60
-50
-40
-30
-20
-10
0
1012-Nov-02 12-Dec-02 11-Jan-03 10-Feb-03 12-Mar-03 11-Apr-03 11-May-03 10-Jun-03
Mat
ric p
oten
tial (
kPa)
bed 40 cm
furrow 35 cm
flat 40 cm18 mm
rain
Birrig
115 mmrain
B, Firrig
B, Firrig
-60
-50
-40
-30
-20
-10
0
1012-Nov-02 12-Dec-02 11-Jan-03 10-Feb-03 12-Mar-03 11-Apr-03 11-May-03 10-Jun-03
Mat
ric p
oten
tial (
kPa)
bed 80 cm
flat 80 cm
18 mmrain
Birrig
115 mmrain
B, Firrig
B, Firrig
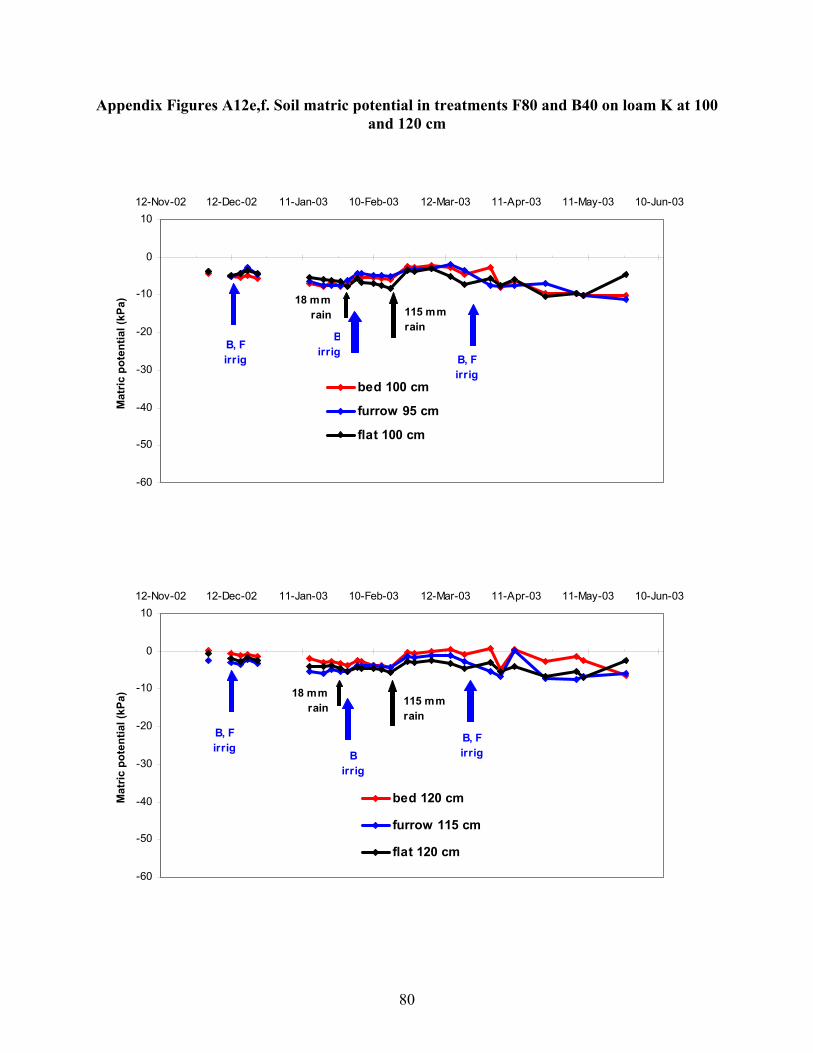
80
Appendix Figures A12e,f. Soil matric potential in treatments F80 and B40 on loam K at 100 and 120 cm
-60
-50
-40
-30
-20
-10
0
1012-Nov-02 12-Dec-02 11-Jan-03 10-Feb-03 12-Mar-03 11-Apr-03 11-May-03 10-Jun-03
Mat
ric p
oten
tial (
kPa)
bed 100 cm
furrow 95 cm
flat 100 cm
18 mmrain
Birrig
115 mmrain
B, Firrig B, F
irrig
-60
-50
-40
-30
-20
-10
0
1012-Nov-02 12-Dec-02 11-Jan-03 10-Feb-03 12-Mar-03 11-Apr-03 11-May-03 10-Jun-03
Mat
ric p
oten
tial (
kPa)
bed 120 cm
furrow 115 cm
flat 120 cm
18 mmrain
Birrig
115 mmrain
B, Firrig
B, Firrig

81
Appendix Figures A12g. Soil matric potential in treatments F80 and B40 on loam K at 140 cm
-60
-50
-40
-30
-20
-10
0
1012-Nov-02 12-Dec-02 11-Jan-03 10-Feb-03 12-Mar-03 11-Apr-03 11-May-03 10-Jun-03
Mat
ric p
oten
tial (
kPa)
bed 140 cm
furrow 135 cm
flat 140 cm
18 mmrain
Birrig
115 mmrain
B, Firrig
B, Firrig

82
Appendix Figures A13a,b. Soil water potential gradients in F80 and B40 at 120-140 cm (negative values = drainage fluxes, positive values = upwards fluxes)
-10
-5
0
5
10
15
2012-Nov-02 12-Dec-02 11-Jan-03 10-Feb-03 12-Mar-03 11-Apr-03
Pote
ntia
l gra
dien
t
bed
furrow
flat
120-140 cm
a) sandy loam
-10
-5
0
5
10
15
2012-Nov-02 12-Dec-02 11-Jan-03 10-Feb-03 12-Mar-03 11-Apr-03
Pote
ntia
l gra
dien
t
bed
furrow
flat
120-140 cm
b) loam P

83
Appendix Figure A13c. Soil water potential gradients in F80 and B40 at 120-140 cm (negative values = drainage fluxes, positive values = upwards fluxes)
-10
-5
0
5
10
15
2012-Nov-02 12-Dec-02 11-Jan-03 10-Feb-03 12-Mar-03 11-Apr-03
Pote
ntia
l gra
dien
t
bed
furrow
flat
120-140 cm
c) loam K

84
Appendix Figures A14a,b. Soil matric potential in F80 and B40 on the sandy loam as measured using GBlites (raw data not corrected for temperature; means of 3)
0
10
20
30
40
50
60
70
31-Oct-02 20-Nov-02 10-Dec-02 30-Dec-02 19-Jan-03 8-Feb-03 28-Feb-03 20-Mar-03
kPa
40 cm80 cm120 cm140 cm
a) F80
0
10
20
30
40
50
60
70
31-Oct-02 20-Nov-02 10-Dec-02 30-Dec-02 19-Jan-03 8-Feb-03 28-Feb-03 20-Mar-03
kPa
furrow 120 cmfurrow 140 cmbed 120 cmbed 140 cm
b) B40

85
Appendix Figures A15a,b. Soil water content under the beds and furrows at harvest in B60 on the sandy loam and loam P
0
40
80
120
160
200
0.0 0.1 0.2 0.3 0.4
Volumetric soil water content
Dep
th (c
m)
15 bars Sowing Field capacityHarvest B60 - furrow Harvest B60 - bed
a) sandy loam
0
40
80
120
160
200
0.0 0.1 0.2 0.3 0.4
Volumetric soil water content
Dep
th (c
m)
15 bars Sowing Field capacityHarvest B60 - furrow Harvest B60 - bed
b) loam P

86
Appendix Figures A15c. Soil water content under the beds and furrows at harvest in B60 on loam K
0
40
80
120
160
200
0.0 0.1 0.2 0.3 0.4
Volumetric soil water content
Dep
th (c
m)
15 bars Sowing Field capacityHarvest B60 - furrow Harvest B60 - bed
c) loam K
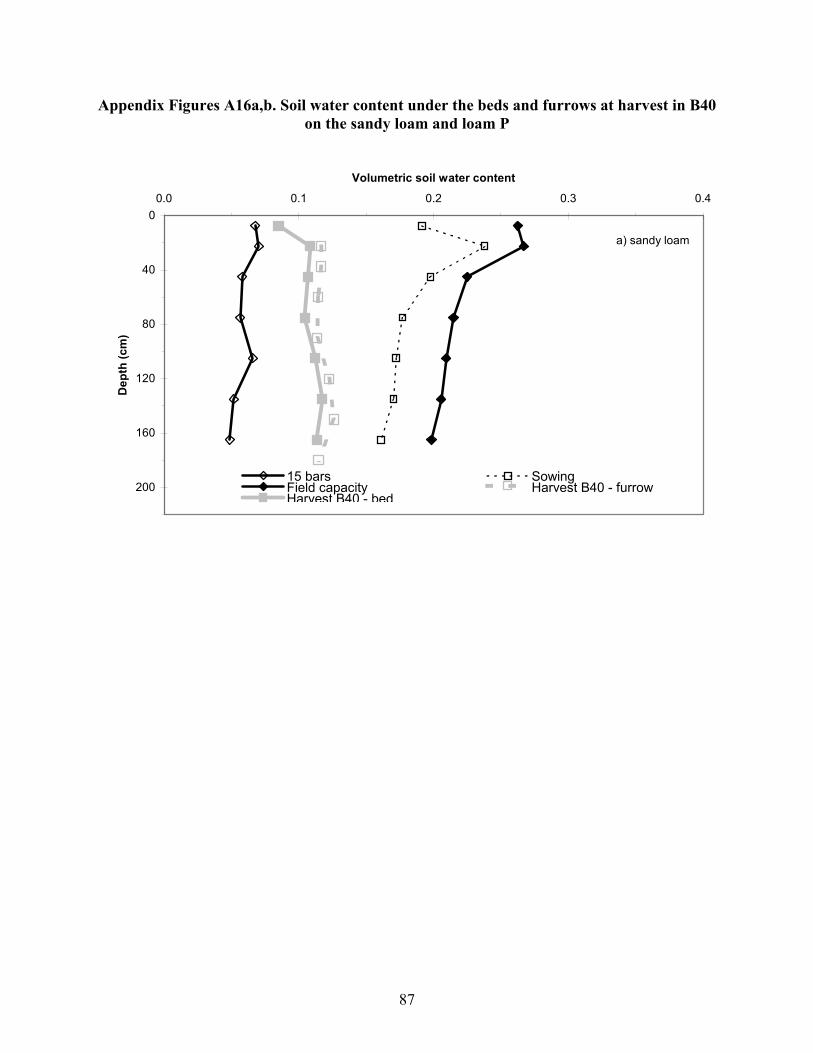
87
Appendix Figures A16a,b. Soil water content under the beds and furrows at harvest in B40 on the sandy loam and loam P
0
40
80
120
160
200
0.0 0.1 0.2 0.3 0.4
Volumetric soil water content
Dep
th (c
m)
15 bars SowingField capacity Harvest B40 - furrowHarvest B40 - bed
a) sandy loam

88
0
40
80
120
160
200
0.0 0.1 0.2 0.3 0.4
Volumetric soil water contentD
epth
(cm
)
15 bars SowingField capacity Harvest B40 - furrowHarvest B40 - bed
b) loam P

89
Appendix Figures A16c. Soil water content under the beds and furrows at harvest in B40 on loam K
0
40
80
120
160
200
0.0 0.1 0.2 0.3 0.4
Volumetric soil water content
Dep
th (c
m)
15 bars Sowing Field capacityHarvest B40 - furrow Harvest B40 - bed
c) loam K

90
Appendix Figures A17a,b. Soil water content under the beds and furrows at harvest in B40 on the sandy loam and loam P
0
40
80
120
160
200
0.0 0.1 0.2 0.3 0.4
Volumetric soil water content
Dep
th (c
m)
15 bars SowingField capacity Harvest B80(60) - furrowHarvest B80(60) - bed
a) sandy loam
0
40
80
120
160
200
0.0 0.1 0.2 0.3 0.4
Volumetric soil water content
Dep
th (c
m)
15 bars SowingField capacity Harvest B80(60) - furrowHarvest B80(60) - bed
b) loam P

91
Appendix Figures A17c. Soil water content under the beds and furrows at harvest in B40 on loam K
0
40
80
120
160
200
0.0 0.1 0.2 0.3 0.4
Volumetric soil water content
Dep
th (c
m)
15 bars Sowing Field capacityHarvest B80(60) - furrow Harvest B80(60) - bed
c) loam K

92
Appendix Table A1. Root length density (cm/cm3 ) in transect across the bed/furrow system at the end of heading, on the sandy loam
Position across transect Depth below surface at sampling location (cm)
A mid-furrow
B C adjacent to row
D mid-bed mid-row
Bed (at time of sampling furrow base was 12 cm below bed surface) 0-10 0.91 ± 0.57 1.35 ± 0.49 3.15 ± 0.59 3.30 ± 0.50 10-20 0.14 ± 0.06 0.51 ± 0.48 0.75 ± 0.15 0.99 ± 0.32 20-30 0.13 ± 0.07 0.21 ± 0.20 0.32 ± 0.13 0.26 ± 0.16 30-40 0.18 ± 0.14 0.11 ± 0.06 0.19 ± 0.15 0.12 ± 0.08 40-50 0.19 ± 0.07 0.18 ± 0.13 0.12 ± 0.06 0.14 ± 0.11 50-60 0.17 ± 0.06 0.28 ± 0.17 0.17 ± 0.16 0.26 ± 0.20 60-70 0.12 ± 0.10 0.23 ± 0.18 0.27 ± 0.17 0.21 ± 0.09 70-80 0.15 ± 0.19 0.14 ± 0.11 0.13 ± 0.06 0.09 ± 0.09 80-90 0.15 ± 0.18 0.11 ± 0.13 0.18 ± 0.08 0.07 ± 0.07 90-100 0.10 ± 0.12 0.06 ± 0.08 0.07 ± 0.02 0.07 ± 0.12 100-110 0.09 ± 0.07 0.06 ± 0.12 0.12 ± 0.08 0.07 ± 0.14 110-120 0.07 ± 0.10 0.06 ± 0.11 0.11 ± 0.16 0.09 ± 0.01 120-130 0.07 ± 0.06 0.03 ± 0.05 0.05 ± 0.05 0.01 ± 0.01 130-140 0.06 ± 0.07 0.03 ± 0.05 0.04 ± 0.05 0.0 140-150 0.0 0.02± 0.06 0.06 ± 0.05 0.0 Flat 0-10 2.51 ± 0.96 1.95 ± 0.88 10-20 0.91 ± 0.52 0.54 ± 0.0.17 20-30 0.35 ± 0.21 0.75 ± 0.28 30-40 0.49 ± 0.09 0.19 ± 0.13 40-50 0.21 ± 0.14 0.17 ± 0.11 50-60 0.23 ± 0.13 0.11 ± 0.07 60-70 0.18 ± 0.08 0.10 ± 0.02 70-80 0.24 ± 0.05 0.09 ± 0.03 80-90 0.18 ± 0.14 0.09 ± 0.03 90-100 0.16 ± 0.04 0.11 ± 0.04 100-110 0.07 ± 0.01 0.13 ± 0.13 110-120 0.06 ± 0.02 0.13 ± 0.10 120-130 0.08 ± 0.04 0.09 ± 0.06 130-140 0.02 ± 0.05 0.07 ± 0.04 140-150 0.0 0.05 ± 0.02 150-160 0.0 0.01 ± 0.02

93
Appendix Table A2. Gravimetric soil water content (%) in transect across the bed/furrow system at harvest on the sandy loam
Position across transect Depth below surface at sampling location (cm)
A mid-furrow
B C adjacent to row
D mid-bed mid-row
Bed (at time of sampling furrow base was 12 cm below bed surface) 0-15 8.8 ± 0.66 7.5 ± 0.40 6.5 ± 0.99 6.6 ± 1.21 15-30 7.8 ± 0.89 7.4 ± 0.48 6.9 ± 0.19 6.7 ± 0.09 30-60 9.1 ± 0.65 8.4 ± 0.94 7.5 ± 0.16 6.9 ± 0.48 60-90 9.3 ± 0.82 9.0 ± 0.73 8.7 ± 0.09 8.5 ± 0.67 90-120 9.6 ± 0.67 9.3 ± 0.72 9.5 ± 0.29 9.5 ± 0.45 120-150 9.8 ± 0.53 9.5 ± 0.68 9.7 ± 0.43 9.7 ± 0.41 150-180 9.2 ± 0.49 9.4 ± 0.22 9.5 ± 0.65 9.7 ± 0.38 Flat 0-15 5.9 ± 2.12 7.1 ± 1.08 15-30 6.4 ± 1.99 8.1 ± 2.26 30-60 8.9 ± 0.62 8.7 ± 0.94 60-90 9.0 ± 0.43 9.3 ± 0.84 90-120 9.3 ± 0.06 9.1 ± 0.46 120-150 9.2 ± 0.13 9.1 ± 0.30 150-180 9.0 ± 0.08 9.0 ± 0.13

94
Appendix Table A3. Components of the water balance at each site (mm)
Treatment F80 F120 B80 B60 B40 B80(60)
Sandy loam Irrigation 151 71 100 100 181 119 Rain 189 189 189 189 189 189 Soil water depletionA
87 155 125 113 122 132
Total water use
427 416 414 402 402 440
Loam P Irrigation 227 147 125 125 205 165 Rain 189 189 189 189 189 189 Soil water depletionA
65 42 101 96 90 91
Total water use
488 385 430 422 498 450
Loam K Irrigation 140 60 48 128 108 Rain 235 235 235 235 235 Soil water depletionA
145 190 182 174 175
Total water use
520 485 465 537 518
A initial soil water content minus final soil water content over 0-180 cm