How moving visual stimuli modulate the activity of the substantia nigra pars reticulata
Upload
khangminh22Category
view
1download
0
Article
Increased Post-Drought Growth after Thinning inPinus nigra Plantations
Agravengela Manrique-Alba 1 Santiago Begueriacutea 1 Miquel Tomas-Burguera 2 and Jesuacutes Julio Camarero 3
Citation Manrique-Alba Agrave
Begueriacutea S Tomas-Burguera M
Camarero JJ Increased Post-Drought
Growth after Thinning in Pinus nigra
Plantations Forests 2021 12 985
httpsdoiorg103390f12080985
Academic Editor Roberto Tognetti
Received 15 June 2021
Accepted 21 July 2021
Published 24 July 2021
Publisherrsquos Note MDPI stays neutral
with regard to jurisdictional claims in
published maps and institutional affil-
iations
Copyright copy 2021 by the authors
Licensee MDPI Basel Switzerland
This article is an open access article
distributed under the terms and
conditions of the Creative Commons
Attribution (CC BY) license (https
creativecommonsorglicensesby
40)
1 Estacioacuten Experimental Aula Dei (EEAD-CSIC) 50059 Zaragoza Spain santiagobegueriacsices2 Centre National de Recherches Meacuteteacuteorologiques Universiteacute de Toulouse Meacuteteacuteo-France CNRS
31057 Toulouse France miqueltomasgmailes3 Instituto Pirenaico de Ecologiacutea (IPE-CSIC) 50059 Zaragoza Spain jjcamareroipecsices Correspondence amanriqueeeadcsices
Abstract In Mediterranean seasonally dry regions the rise in dieback and mortality episodesobserved in pine afforestations has been related to higher drought intensity and lack of appropriatemanagement which enhance competition between trees for water and light However there islittle understanding of the benefits of silviculture for plantations under seasonal drought stress Acombination of dendrochronology and wood C and O isotope analyses was used in three Blackpine (Pinus nigra) plantations to work out the responses of radial growth (BAI basal area increment)and water-use efficiency (WUEi) to thinning treatments (removal of 40 of the stand basal area)Thinning had a positive effect on BAI and WUEi reduced drought sensitivity and reduced thetemporal dependence on the previous yearrsquos growth These results were significant even 13ndash14 yearsafter thinning and coherent for the three study sites Differences were found between the sitesregarding the physiological mechanisms of adaptation In two sites we inferred the enhanced WUEiwas due to increased photosynthetic rates (A) at constant stomatal conductance (gs) In the third sitewhich had higher tree density and therefore competition we inferred increases in both A and gs withthe former being proportionally larger than the latter
Keywords Pinus nigra forest management water use efficiency isotopes dendroecology
1 Introduction
Forests in Southern Europe are expected to undergo severe water limitations andincreased temperatures due to climate change [1] Drought-triggered canopy dieback andmortality have affected some of these seasonally dry forests such as for instance Black pine(Pinus nigra Arn) populations [23] Some studies have reported dieback in Mediterraneantree species generally viewed as drought-tolerant such as Holm oak (Quercus ilex) [4] Therise in mortality in some pine forests has also been observed in plantations and this hasbeen connected not only to increased drought but also to lack of silvicultural intervention(ie absence of thinning) which may increase competition between trees for water andlight in structurally homogeneous planted stands [35]
The knowledge of how forest structure modifies the physiological response of treesto drought would guide managers to implement policies that enhance their resistanceagainst drought Among other silvicultural options (eg species composition) thinningcan increase soil water content [6] due to reduced competition [78] Previous researchhas established that thinning promotes radial growth of the remaining trees in the shortand medium terms (1ndash10 years) with this increase positively correlated with thinningintensity [9] However the consequences of rising drought frequency for long-term growthdynamics and the interactions between thinning and post-drought recovery are poorlyunderstood in pine plantations Furthermore the treersquos response varies with the intensityof the treatment [10] the size [11] and age of the trees [7] the local climate conditions [12]and the period elapsed after the last intervention [13] For those reasons there is still
Forests 2021 12 985 httpsdoiorg103390f12080985 httpswwwmdpicomjournalforests
Forests 2021 12 985 2 of 17
considerable uncertainty about (i) the optimal thinning intensity (ii) the duration ofthinning effects (iii) how these effects vary with tree species and local climate However todate most of the available studies have focused on short-term effects Only a few studiesassessed the long-term growth dynamics [14ndash16]
In addition to growth data the study of stable isotopes (C O) in tree-ring woodor cellulose provides insights regarding the tree response mechanisms to drought andthinning [17] These measures approximate changes in the intrinsic water-use efficiency(WUEi) [1819] After a thinning treatment the response of WUEi is complex as manystudies have shown Several studies on diverse pine species showed that WUEi decreasedafter thinning as expected in response to reduced competition for water [20] Contraryto this earlier studies have suggested increasing WUEi after thinning [1421] or even nosignificant changes [22223] Thus the question regarding the effect of thinning on WUEidepends mainly on the tree species and environmental conditions such as climate or standfeatures such as tree density
Different physiological adjustments explain WUEi variations after thinning (i) changesin stomatal conductance (gs) at a steady photosynthetic rate (A) (ii) changes in A at a steadygs and (iii) changes in both with that of A or gs being higher The dual-isotope method hasbeen used to separate the importance of A and gs on WUEi since δ18O is linked to gs [2425]However recent studies indicate that this approach has some restrictions and applies onlyunder certain environmental conditions which should be considered appropriately [2627]
Our previous research focused on the physiological mechanisms after thinning in anAleppo pine (Pinus halepensis) plantation in dry conditions [28] We found out that thinninghad a positive effect that lasted for almost 20 years Our results also suggested that changesin water availability were fundamental in improving growth and reducing the growthreliance on adequate climatic conditions The present study addresses the effect of thinningon a different pine species under less limiting climatic conditions (a mesic site) consideringthe main environmental conditions modified by thinning (water availability and light)
Therefore we analysed the long-term response to thinning (thirteen and fifteen yearsafter treatment) in three Black pine plantations located in north-eastern Spain This shade-intolerant and long-lived pine species is widely distributed across the Mediterranean Basinand central Europe It is usually very productive in response to wet winter and springconditions [29] although it is regarded as a drought-tolerant species [3] However itcan also be periodically defoliated by pine processionary moth (Thaumetopoea pityocampa)outbreaks [30]
We used dendrochronology (basal area increment BAI) and stable isotopes (δ13Cδ18O) data to evaluate the climate-growth relationships and the physiological mechanismsof adaptation We study three sites with similar climatic conditions to determine therobustness of the results The main issues addressed in this paper were (i) to evaluate thereaction of BAI and WUEi to long-term thinning and their links with drought intensityand (ii) to determine the physiological adaptations after thinning driving any changes inWUEi using δ18O
We hypothesise that thinning will increase BAI and decrease WUEi due to reducedtree-to-tree competition for water Concerning the physiological mechanisms we hypoth-esise that simultaneous analysis of δ13C and δ18O will enable us to identify the relativeimportance of changes in A and gs on WUEi
2 Materials and Methods21 Study Sites and Thinning
We selected three Black pine plantations located in the ldquoCinco Villasrdquo region in Aragoacutennorth-east Spain (Figure 1) Urrieacutes (4232prime N 105prime W 920 m asl) Los Pintanos (4230prime N102prime W 907 m asl) and Monte Alto (4233prime N 106prime W 705 m asl) Similar climaticconditions characterise the sites [3132] Following the Koumlppen classification the climatein the study region is classified as Temperate Oceanic (Cfb) [33] The mean annual tem-perature ranges from 114 C in Los Pintanos to 122 C in Monte Alto The mean annual
Forests 2021 12 985 3 of 17
Penman-Monteith reference evapotranspiration values are 1069 1091 1070 mm in UrrieacutesLos Pintanos and Monte Alto respectively In contrast the mean annual precipitationis 907 mm (sd of 145 mm) in Urrieacutes 809 mm (sd of 126 mm) in Los Pintanos and1060 mm in Monte Alto (sd of 178 mm) Therefore the hydrologic balance is minus161 minus10andminus282 mm in Urrieacutes Los Pintanos and Monte Alto respectively The maximum rainfalloccurs in October in the three sites with a maximum value of 105 mm in Urrieacutes 126 mm inLos Pintanos and 93 mm in Monte Alto Only in Urrieacutes a period of water shortage occursin July (Supplementary material Figure S1)
Figure 1 Location of the Cinco Villas study area in Aragoacuten north-eastern Spain and the control (not-thinned) and thinnedplots in the three selected sites All photographs were taken in the spring of 2019
Black pine plantations were established in the area during the 1960s with the mainobjectives of timber production and preventing soil erosion No forest management wasimplemented before the thinning trials took place The plots presented sparse understoryvegetation (Buxus sempervirens L Juniperus communis L Quercus faginea L and Genistascorpius L) that was not cleared during the thinning intervention nor after The slope isbetween 5ndash10 According to the World Reference Base for Soil Resources [34] the soilscorrespond to Cambisols
Experimental thinning management occurred in different years In Urrieacutes thinningwas carried out in 2006 while it was performed in 2000 in Los Pintanos and 2003 in MonteAlto The initial canopy cover was similar in the three sites More precisely in Urrieacutes theoriginal canopy cover of 80 (control plot C) was reduced to 42 (thinned plot T) In LosPintanos the initial canopy cover was diminished from 78 (C) to 48 (T) while in MonteAlto it went from an initial canopy cover of 68 (C) to 41 (T) Approximately 27ndash38 ofthe canopy cover was removed corresponding to a mean reduction in stand basal area of40 (Table 1) The Los Pintanos site shows a higher tree density than the other sites
Forests 2021 12 985 4 of 17
Table 1 Pinus nigra plots characteristics in the three study sites before and after thinning
SiteThinningTreatment
Diameter at13 m (cm)
TreeHeight (m)
CanopyCover ()
Density(Trees haminus1)
Basal Area(m2 haminus1)
UrrieacutesControl 159 128 80 1879 420Thinned 265 139 42 414 231
Los PintanosControl 154 12 78 2548 548Thinned 204 115 48 978 345
Monte AltoControl 153 123 68 1783 345Thinned 21 12 41 573 205
22 Dendrochronology Tree-Ring Width Data
In 2019 we randomly selected ten trees per plot and treatment and obtained two coresper tree at breast height (13 m) using two perpendicular directions using Pressler borersA sum of 120 cores from 60 trees was obtained and analysed (Supplementary materialTable S1) Samples were extracted from dominant and mature trees with no observablesigns of damage The diameter of all sampled trees and a total height of 5 trees per plot weremeasured using girth tapes and clinometers respectively In addition one 25 m times 25 mplot was randomly established in each stand before and after thinning to measure canopycover tree density and stand basal area (Table 1)
The increment core samples were air-dried sanded until rings were visible and vi-sually cross-dated The tree-ring width was measured with a stereo microscope with aprecision of 001 mm using the TSAP-Win program LINTAB measuring device (RinntechHeidelberg Germany) The cross-dating quality was examined with the COFECHA pro-gram [35] Ring-width data was converted into basal area increment (BAI) found to bebiologically more significant to measure growth differences between years and differenttreatments [36] BAI values were computed annually from each ring-width measurementassuming a circular form of the stems as the variation between consecutive annual cross-sectional basal areas The mean BAI of the two cores for each tree was considered and themean BAI series were used in all statistical analyses To avoid the use of juvenile trees databefore 1980 were not used
23 Climate Data
We used the Standardised Precipitation Evapotranspiration Index (SPEI) to quantifythe climatic characteristics (in particular the hydric conditions) during the growing pe-riod [3738] The SPEI reports deviations in the climatic water balance (precipitation minuspotential evapotranspiration) compared to the average conditions at a site taking positivevalues for more humid than normal conditions and negative values for drought conditions
We downloaded SPEI data for the study area from httpmonitordesequiacsices(accessed on 22 May 2021) [31] The data has a weekly frequency and is available at varioustime scales (length of the period over which the climatic water balance is computed)Therefore there are many possible combinations of time scale and calculation period thatcan be used in the analysis We carried out a correlation analysis between BAI and theSPEI at different time scales using the data between the previous yearrsquos October andDecember This allowed determining the week of the year and the aggregation time scalethat presented the highest correlation with tree growth
24 Intrinsic Water Use Efficiency (WUEi) and Isotopes Analysis
Wood tissue samples were taken for C and O isotope analyses [39] According totheir good correlation with the mean growth series five trees were selected in control andthinned plots Single-year rings were then isolated and pools of trees were created foreach year after 1990 until the present The samples were milled to a fine powder (Retsch
Forests 2021 12 985 5 of 17
MM301 mixer mill Haan Germany) and 0001 g aliquots were taken using a micro-balance(AX205 Mettler Toledo OH USA) Samples for δ13C determination were stored in tin foilcapsules while those for δ18O were put in silver foil capsules Isotopes were analysed at theStable Isotope Facility of the University of California at Davis (USA) δ13C was determinedafter combustion to CO2 by utilising a Flash EA-1112 elemental analyser interfaced witha Finnigan MAT Delta C isotope ratio mass spectrometer (Thermo Fisher Scientific IncWaltham MA USA) For δ18O the samples were combusted in an elementary PyroCube(Elementar Analysensysteme GmbH Hanau Germany) interfaced to a PDZ Europa 20-20isotope ratio mass spectrometer (Sercon Ltd Cheshire UK) Stable isotope ratios wererepresented as per mil (permil) deviations using the δ notation relative to VPDB (for carbon)and VSMOW (for oxygen) standards
We computed C isotope discrimination in wood (∆13C) using changes in δ13C ofatmospheric CO2 (δ13 ca) and wood δ13C (δ13cw) as
∆13C = (δ13ca minus δ13cw)((1 + δ13cw)1000) (1)
δ13ca was obtained from McCarroll and Loader [18] and Belmecheri and Lavergne [40]∆13C results from the preferential use of 12C over 13C during photosynthesis and dependson (i) the fractionation during CO2 diffusion through the stomata (a = 44permil) (ii) thefractionation by RuBisCO (b = 280permil) (iii) leaf intercellular space (ci) and ambient CO2concentrations (ca) [41] Then we computed WUEi (in micromol molndash1) utilizing the equationsuggested by Farquhar et al [42]
WUEi = ca [1 minus (cica)] 0625 = (ca minus ci)16 (2)
where 0625 is the ratio between the conductance of H2O in comparison to the conductanceof CO2 To define ci we referred Francey and Farquhar [43]
ci = [(∆13C minus a) times ca](b minus a)] (3)
25 Statistical Analysis
A generalised linear mixed-effects model (GLMM) [44] was fitted at each site withBAI as the response variable and the previous-year BAI (BAIprev) and current-year SPEIas fixed effects BAIprev accounted for temporal autocorrelation often present in tree-ringwidth data while SPEI accounted for the drought effect on growth The data were enteredfor each sampled tree individually so the tree identifier was used in the model as a randomeffect thus controlling for between-individual variability The combination of treatment(thinnedcontrol) and period (prepost-treatment) was used as a factor interacting withthe modelsrsquo intercept and the BAIprev and SPEI coefficients leading to a total of twelvemodel coefficients ((intercept + two fixed effects) times two treatments times two periods)
Due to the nature of the BAI data which contains only positive values and exhibits acharacteristic skewed distribution the Gamma distribution family with a logarithmic linkwas used to relate the linear predictor to the conditional mean of the response The modelwas fitted via maximum likelihood using the BOBYQUA algorithm [45] as implementedin the lme4 package in R [46]
The significance of the model coefficients was determined by their confidence range(estimated at α = 005) not overlapping zero The significance of the differences betweenperiods (pre- and post- thinning) and between plots (thinned and control) was determinedby their ranges not overlapping each other
Linear models were fitted for WUEi and δ18O with SPEI and the interaction oftreatment and period as covariates The effect of the previous-year WUEi and δ18O was notincluded as there was no sign of temporal autocorrelation on those variables Similarlyno link function was required so a Gaussian model with an identity link was used Asthe data were pooled across five trees no individual random effects were included Themodels were fit by Ordinary Least Squares using the lm function in R [47]
Forests 2021 12 985 6 of 17
3 Results31 Influence of Thinning on Radial Growth
The BAI time series presented consistent results for all treatment plots before thinningAs expected BAI decreased notably in drought years (eg 1986 1994ndash1995 and 2012) whileit had high values during wet years (eg 2014) (Figure 2) Differences in growth betweentreatments were minor or even not noticeable before thinning but increased notably afterthinning in all sites The largest differences between treatments (+200ndash300) occurredaround 2014 coinciding with two consecutive humid years
Figure 2 Basal area increment (BAI) series of Pinus nigra in Urrieacutes Los Pintanos and Monte Alto for control plots (blacksquares) and thinned plots (white triangles) Points represent mean values while vertical bars depict standard errors Thedashed vertical lines represent thinning treatments (2006 2000 and 2003 in Urrieacutes Los Pintanos and Monte Alto) Letters hand d above the x-axis indicate humid (SPEI gt 128) and dry (SPEI lt minus128) years respectively
32 Impact of Climate and Thinning on Growth
The highest correlation between BAI and SPEI series was observed after summer forall sites (Figure S2 in the Supplementary material) More precisely the highest correlationwas at the time scale of 6 months and week 42 of the year (November) in Urrieacutes with apositive and significant (p lt 005) coefficient correlation of 0584 In Los Pintanos it wasfound in week 37 (early September) at a time scale of 9 months with a coefficient of 0565In Monte Alto the highest correlation also corresponded to week 37 (early September)at a time scale of 12 months and 0562 (Figure S3) Consequently these SPEI data timescales were selected for use in the regression analysis as independent variables for BAIAdditionally the most severe droughts for each site based on the SPEI data were 1985ndash1986
Forests 2021 12 985 7 of 17
1989 1995 2001 and 2016 in Urrieacutes 1989 1994ndash1995 2005 and 2011ndash2012 in Los Pintanosand 1985ndash1986 1989 1995 2001 and 2016 in Monte Alto (Figure S3)
According to the regression analyses BAI was significantly influenced by BAIprev andthe SPEI (Figure 3a and Table S2) Comparing model coefficients across the three sites itcan be seen that they were similar stressing the robustness of the results
Figure 3 GLMM fixed-effects model coefficients (Bars depict 95 confidence intervals) for basal area increment (BAI) inUrrieacutes Los Pintanos and Monte Alto study sites in the thinned and control plots during pre- (preT) and post-thinning (post)periods (a) and predicted BAI as a function of SPEI in the posT period for different values of previous growth BAIprev (1 5and 10 cm2) (b)
The model coefficients for BAIprev were positive and significant (p lt 005) indicating acertain amount of autocorrelation in the BAI series That is the potential growth in a givenyear was positively influenced by the previous yearrsquos growth There were no differencesin the model coefficients between control and thinned plots before thinning (preT period)However in the post-thinning (posT) period the differences became more prominent andsignificant While the influence of the previous yearrsquos BAI on growth increased or remainedat a similar level than before the intervention in the control plots it decreased in the thinnedplots indicating reduced dependence from the previous yearrsquos growth after thinning
The model coefficients for SPEI were also positive in all cases as expected (as positivevalues of SPEI indicate humid conditions associated with enhanced growth) The coeffi-cients were similar between treatments in the preT period at all sites In the posT period the
Forests 2021 12 985 8 of 17
coefficients were slightly lower in the thinned plots but the difference was not significantOverall the effect of SPEI tended to be larger in the posT than in the preT period
The results confirmed the importance of accounting for the effects of both temporalautocorrelation of BAI and climate The model intercepts which indicate the mean BAIunder average BAIprev and SPEI showed non-significant differences between thinning andcontrol plots in the preT period However differences arose in the posT period Thus whilemean BAI tended to decrease in the control plots (significantly so in the Los Pintanos andMonte Alto sites) it experienced a relevant increase in the thinned plots (significantly so inUrrieacutes) After thinning the mean BAI increase was around 1ndash16 cm2 in Urrieacutes 075ndash1 cm2
in Los Pintanos and 045ndash080 cm2 in Monte AltoFigure 3b shows the predicted BAI in the posT period for different values of SPEI and
BAIprev The differences in BAI between treatments are apparent In all sites growth washigher in the thinned plots for the same values of SPEI and BAIprev The highest variationsamong treatments were found in Urrieacutes
33 Thinning and Climate Effects on WUEi and δ18O
The examination of the WUEi and δ18O time series revealed some interesting pat-terns (Figure 4) WUEi exhibited a progressive increase during the whole period and forboth treatments especially during dry years However δ18O remains unchanged if notdiminished (in Monte Alto) especially during the posT period
Figure 4 Time series of δ18O (a) and the intrinsic water-use efficiency (WUEi (b)) in Urrieacutes Los Pintanos and Monte Altostudy sites control (white triangles) and thinning (black squares) The dashed vertical lines represent thinning treatments(2006 2000 and 2003 in Urrieacutes Los Pintanos and Monte Alto)
Forests 2021 12 985 9 of 17
In all sites the highest correlation between WUE and SPEI occurred at the time scaleof 6 months and week 38 of the year (Figure S2) with negative and significant (p lt 005)correlations of minus0604 in Urrieacutes minus0536 in Los Pintanos and minus0484 in Monte Alto
Results of the regression analysis of WUEi are shown in Figure 5a and Table S3 TheSPEI negatively influenced WUEi suggesting improved water use efficiency during dryperiods vs humid ones The model coefficients for SPEI were not always significant as theconfidence intervals overlapped the zero value especially in Monte Alto No differenceswere found in the SPEI model coefficients among treatments preT and postT periods andthe three sites
Figure 5 Intrinsic water use efficiency (WUEi) mean values model coefficients for the fixed effects (bars depict 95confidence intervals) in Urrieacutes Los Pintanos and Monte Alto sites for control and thinning treatments during pre- (preT)and post-thinning (posT) periods (a) and generalised linear models of WUEi against SPEI for the two treatments in the posTperiod (b)
Regarding the model intercepts there were some differences during the preT periodonly significant in Los Pintanos The intercept increased significantly in the posT periodin the two plots (thinned and control) and the three sites The increase was higher in thethinned plots with significant differences concerning control in Urrieacutes and Los Pintanos(Table S3)
The relation between WUEi and SPEI for the posT period in control and thinned plotsis depicted in Figure 5b The highest WUEi occurred in the thinned plots except in MonteAlto In Urrieacutes and Los Pintanos WUEi ranged roughly between 115 and 90 micromol molminus1
for dry and wet conditions respectively while in Monte Alto the range of WUEi variationwas narrower
Forests 2021 12 985 10 of 17
Regarding δ18O the highest correlation with SPEI was found at the time scale of3 months and week 12 (Figure S2) with a negative significant correlation coefficient ofminus0602 in Urrieacutes minus0311 in Los Pintanos and minus0400 in Monte Alto Regression analysisshowed a negative relation between δ18O and SPEI in general meaning that δ18O tended todecrease during wet years and increased during droughts However the coefficients werenot significant in all cases (Figure 6 and Table S4) The SPEI coefficients tended to decreasein the posT period with no significant differences between treatments Regarding the modelintercepts they tended to decrease during the posT period in the control plots (significantlyso in Urrieacutes and Monte Alto sites) while in the thinned plots they remained unchanged(Urrieacutes) or also diminished (not significantly) The differences between treatments wereonly significant in Urrieacutes during the posT period
Figure 6 δ18O mean model coefficients for the values of the fixed effects (Bars depict 95 confidence intervals) in UrrieacutesLos Pintanos and Monte Alto study sites for the two treatments and pre- (preT) and post-thinning (postT) periods (a) andgeneralised linear models of δ18O versus SPEI for both treatments only in the posT period (b)
The greater sensitivity of δ18O to SPEI in Urrieacutes is depicted by the sharper responsecurve of thinned trees (Figure 6b) Therefore during wet years (high SPEI values) thedifference in δ18O concerning control was slight but the difference increased rapidly asdrought conditions were achieved These results indicate a more flexible reaction of thinnedtrees to the climatic conditions on Urrieacutes although this difference was not significant Therate of change of δ18O with SPEI was resemblant in all sites changing between ca 25permilto 27permil
Forests 2021 12 985 11 of 17
34 Physiological Interpretations
Scheidegger et al [24] offer an explanatory approach in the dual-isotope model tounderstand the variations in isotopic concentrations In Figure 7 we interpret the annualand mean relative changes in δ13C and δ18O relative to the control plot (∆δ13C and ∆δ18Orespectively) after thinning As the starting point (white squares) we used the meandifference between thinned and control plots before thinning In Urrieacutes and Monte Altothe primary signal was a positive shift along the ∆δ18O axis At the same time there wasmore variability between years along the ∆δ13C axis and the average difference was alsopositive In the Los Pintanos site the primary signal was a negative shift in the ∆δ18Oaxis and a positive shift in the ∆δ13C There was no connection between different climaticconditions and the positive or negative sign of ∆δ13C
Figure 7 Annual and mean differences of δ13C and δ18O for modelled values concerning the control White squares depictthe mean values of δ13C and δ18O for the pre-thinning (preT) period Grey arrows represent the changes in respect to themeans for all years in the post-thinning (posT) period and the black arrow depicts the mean value of the posT period Dryyears are indicated in bold typeface
4 Discussion
The main goals of this study were to determine the effect of thinning on tree growthand to understand the physiological mechanisms of adaptation (water use and gas ex-change) as tools to manage high-density pine plantations growing in the Mediterraneanseasonally dry regions We analysed time series of radial growth (BAI) reconstructedintrinsic water-use efficiency (WUEi) and measured wood O isotope composition (δ18O)and we related them to the hydric conditions during the growing season (SPEI) in thinnedand control plots at three sites with similar environmental conditions
41 Thinning Effects on Radial Growth
Thinning had an overall positive effect as it improved growth in all sites This resultwas expected as thinning reduces competition among trees [2124849] Our results areconsistent with data obtained in previous thinning experiments in Black pine [2320]However in addition to those earlier studies our results confirm that thinning effectspersisted for at least 13ndash14 years Another study in two Pinus halepensis plantations showedthinning improved growth even 20 years after the thinning [28] It is essential to evaluatethe impact of thinning in long-term trials to assess the persistence of the managementpractices Long-term thinning effects have been reported already for several pine speciessuch as Lodgepole pine (Pinus contorta) where the growth increase was sustained for18 years [15] for 15 years in Maritime pine (Pinus pinaster) [14] after heavy thinning and
Forests 2021 12 985 12 of 17
for 29 years in Scots pine (Pinus sylvestris) [50] For Black pine growth amplification lastedfor 12 years after thinning [2] and in short-term trials of 5ndash10 years in [20]
We also found that thinning reduced the BAI sensitivity to SPEI with regressioncoefficients closer to zero Lower climate sensitivity translates into reduced stress duringdrought resulting in significant positive repercussions for growth forest vigour andhealth [51] These results align with previous studies suggesting a feeble growth-climaterelationship after thinning in Pinus sylvestris [1250] and P halepensis [52] In Black pineMartin-Benito et al [2] detected that tree growth was less responsive to precipitationafter thinning
Another important finding was that the BAI dependence on the previous-year growthwas reduced after thinning These lines of evidence support the idea that thinned trees have alower sensitivity to environmental stress particularly to drought Saacutenchez-Salguero et al [3]arrived at similar conclusions for P nigra asserting that thinning of drought-prone plantedforests decreases competition and enhances the adaptive capacity to withstand droughtstress by increasing resilience and reducing vulnerability
42 Thinning Influence on Water Use Efficiency
The WUEi exhibited an increasing trend during the study period for both treatmentsin the three sites As expected WUEi increased primarily during dry years when trees areaffected by water scarcity [22] This was also evident from the regression model results asWUEi had a negative relationship with the SPEI consistently indicating that lower wateruse efficiency is linked to relief in water stress [53]
In two sites we found significant differences in WUEi between control and thinnedplots after thinning In the third site (Los Pintanos) there were differences between theplots before thinning Other authors also found increasing WUEi after thinning suchas [14] in Mediterranean P pinaster forests and [21] in Monterey pine (Pinus radiata) undermore mesic conditions However others reported decreasing WUEi in pine species such asP sylvestris [50] Ponderosa pine (Pinus ponderosa) [54] and P halepensis [2852] associatedwith drier semiarid sites Other authors reported no significant changes in WUEi in Pnigra [2] and P halepensis [22] Whereas the reaction of WUEi to thinning is variable thelarge number of tree-ring isotope studies determined that a reduction in competition canenhance tree water availability and stomatal conductance and carbon assimilation therebydecreasing drought stress via improved resilience [55]
When considering the effects of SPEI on WUEi under control and thinned plots wedid not find any differences between treatments during the preT and posT periods Thiseffect was constant across sites It should also be noted that very wet conditions occurredin the post-thinning period 2013ndash2015 (Figure S3) which could have induced a passivephysiological response characterised by a reduced impact of rising ca on tree WUEi [51]
43 Thinning Effects on C and O Isotope Composition and Physiological Interpretations
In Urrieacutes and Monte Alto the primary signal was a positive shift in both the ∆δ18Oand ∆δ13C axes (Figure 7) while in Los Pintanos the change along the ∆δ18O axis wasnegative According to the dual-isotope model of [24] the increase of δ18O and δ13C inUrrieacutes and Monte Alto of thinned trees as compared to control trees need to be understoodas a consequence of a decrease of stomatal conductance (gs) at constant photosyntheticcapacity (A) On the other hand in Los Pintanos the reduction of δ18O and increase of δ13Cshould correspond to constant gs with increasing A
Nevertheless according to Barnard et al [27] caution should always be used wheninterpreting physiological responses from the dual-isotope conceptual model The in-terpretation of δ18O remains unclear since variation can be produced through severalmechanisms [5657] The δ18O of plant material can be affected by differences in δ18O ofsource water and variations in δ18O of water vapour [5658] In addition several reportshave shown that when plants share water sources variation in δ18O is strongly correlatedwith relative humidity and evaporative demand which influence gs [252759ndash61] As
Forests 2021 12 985 13 of 17
differences in air humidity and vapour pressure deficit have a substantial effect on δ18Oenrichment variation between plots could make the interpretation of results problem-atic [26] What is more according to [27] changes in air humidity drive changes in δ18Oand influence gs
It could be hypothesised that a variation of air humidity is likely to occur after thin-ning Removal of a significant number of trees produces a hotter micro-climate withenhanced turbulence and air interchange at the forest stand level resulting in a lowerair humidity [262] Consequently the δ18O enrichment detected could not be associatedwith changes in stomatal conductance rates Other authors have put forward this mecha-nism [252] and in our previous study on P halepensis [28] This observation may supportthe hypothesis that the increase of WUEi observed in Urrieacutes and Monte Alto after thinningcould potentially be an effect of enhanced light or nitrogen availability (which wouldstrengthen WUEi) in contradiction to the influence of enhanced soil moisture (which woulddecrease WUEi) [54] Under that hypothesis the increase of interception of radiation bytrees in the thinned plots should be associated with increased rates of photosynthesis(A) [21] In Los Pintanos the decrease of δ18O and increase of δ13C should be interpreted asvariations of both A and gs with the former being proportionally larger than the latter Thissuggests that the thinning effect on this site could have something to do with an increase oflight along with an increase of soil moisture per tree The difference between Los Pintanosand the other two sites could be related to the much higher tree density before and afterthinning resulting in increased competition for resources These results match previousstudies where larger changes in A than gs or unchanged gs were detected [216364] Thesestudies were conducted in mesic to wet areas where water is less limiting than in ourstudy sites [50]
These findings may help us understand the variable reaction of WUEi to thinningA possible explanation for this might be the different hydrologic balance from mesic toxeric sites This has been evident in the case of our previous work [28] carried out on twosemiarid P halepensis sites with a mean hydrologic balance (annual precipitation minuspotential evapotranspiration) of minus720 mm In the two sites analysed WUEi decreased inthe thinned plots which we interpreted as a sign of relieving drought stress Similar resultswere found in other studies associated with xeric conditions [505254]
44 Other Issues
Our work focuses on the ecological effects of thinning particularly regarding thecompetence for resources and leaves many other topics not treated In particular we didnot consider how thinning may affect productivity and yield at the stand level It has beenclaimed that thinning can harm stand productivity in the long term due to decreased treedensity [16] However this is highly site- and species-specific Stand productivity afterthinning depends on the combined effect of the thinning intensity (number of trees logged)and the growth boost to the remaining trees Trees in rich vs poor sites (from climaticand other environmental points of view) may also react differently Also the thinningstrategy (thinning from below vs thinning from above) may have a relevant influence onthe thinning effects [65]
In addition thinning may also have other ecological effects that might be consideredsuch as the higher wind speeds in recently thinned stands that could lead to a risk of fellingthe greater penetration of solar radiation [65] and the increase of understory vegetation [66]On the other hand thinning might have a positive effect in facing biotic disturbances as ithas been shown that higher resource acquisition capacity per tree can reduce predispositionto insect plagues and diseases [67]
5 Conclusions
Thinning enhanced growth but more importantly also decreased growth sensitivityto climate and reduced year-to-year growth dependence Lastly the water use efficiencyalso increased in response to thinning These effects remained at least 13ndash14 years after
Forests 2021 12 985 14 of 17
thinning As an appropriate management strategy our results recommend that a thinningtreatment (40 of the initial stand basal area removed) can be an instrument to adapt theMediterranean and other seasonally dry pine forests and plantations to climate variability
Supplementary Materials The following are available online at httpswwwmdpicomarticle103390f12080985s1 Figure S1 Ombrothermic diagrams showing the mean monthly distributionof temperature (dashed line) and precipitation (grey bars) at Urrieacutes (a) Los Pintanos (b) and MonteAlto (c) study sites Figure S2 Correlations between BAI δ18O and WUEi time series and SPEItime series at various time scales (y-axis) and weeks of the year (x-axis) Significant correlations areindicated with a dot and the maximum significant correlation for each case is marked with a circleCorrelation between BAI and SPEI in Urrieacutes (significant at week 42 6-month SPEI) (a) BAI and SPEIin Los Pintanos (significant at week 37 9-month) (b) BAI and SPEI in Monte Alto (significant atweek 37 12-month SPEI) (c) δ18O and SPEI in Urrieacutes Los Pintanos and Monte Alto (significant atweek 12 3-month SPEI) (d) WUEi and SPEI in Urrieacutes Los Pintanos and Monte Alto (significant atweek 38 6-month SPEI) (e) Figure S3 SPEI time series at 6-month and 42-week time scale for Urrieacutes9-month time scale week 37 in Los Pintanos and 12- months 37-week in Monte Alto study sites Solidvertical lines indicate the year of thinning at each location Red and blue bars indicate dry and wetconditions respectively Table S1 Tree-ring width statistics Table S2 Summary of the linear modelsof the effect of thinning on growth (BAI) on Urrieacutes Los Pintanos and Monte Alto study sites Theperiods correspond to the pre- (preT) and post-thinning (postT) periods Table S3 Summary of thelinear models of the effect of thinning on WUEi values on Urrieacutes Los Pintanos and Monte Alto studysites The periods correspond to the pre- (preT) and post-thinning (postT) periods Table S4 Summaryof the linear models of thinning effect on δ18O values on Urrieacutes Los Pintanos and Monte Alto studysites The periods correspond to the pre- (preT) and post-thinning (postT) periods
Author Contributions Conceptualization AgraveM-A SB and JJC methodology SB and JJC for-mal analysis SB investigation AgraveM-A data curation MT-B writingmdashoriginal draft preparationAgraveM-A writingmdashreview and editing SB and JJC supervision SB funding acquisition SB Allauthors have read and agreed to the published version of the manuscript
Funding Funding for this research was provided by the ldquoAgencia Estatal de Investigacioacutenrdquo ofSpain (CSIC) in the frame of the ERA-NET WaterWorks2015 co-funded Call (project PCIN-2017-020INNOMED) This ERA-NET is an integral part of the 2016 Joint Activities developed by theWater Challenges for a Changing World Joint Programme Initiative (Water JPI) as a result of a jointcollaborative effort with the Joint Programming Initiative on Agriculture Food Security and ClimateChange (FACCE JPI) Funding was also provided by the project EFA21016PIRAGUA co-fundedby the European Regional Development Fund (ERDF) through the Interreg V Spain-France-AndorreProgramme (POCTEFA 2014-2020) of the European Union The authors also acknowledge supportfrom the Spanish Ministry of Science Innovation and Universities through the research projectsFORMAL (RTI2018-096884-B-C31) and CLICES (CGL2017-83866-C3-3-R)
Institutional Review Board Statement Not applicable
Informed Consent Statement Not applicable
Data Availability Statement Data available for research upon request
Acknowledgments We sincerely thank E Arrechea and Alvaro Hernaacutendez (Gob Aragoacuten) for theirsupport and help to study Urrieacutes Los Pintanos and Monte Alto study sites
Conflicts of Interest The authors declare no conflict of interest The funders had no role in the designof the study in the collection analyses or interpretation of data in the writing of the manuscript orin the decision to publish the results
References1 Giorgi F Lionello P Climate change projections for the Mediterranean region Glob Planet Chang 2008 63 90ndash104 [CrossRef]2 Martiacuten-Benito D del Rio M Heinrich I Helle G Cantildeellas I Response of climate-growth relationships and water use
efficiency to thinning in a Pinus nigra afforestation For Ecol Manag 2010 259 967ndash975 [CrossRef]3 Saacutenchez-Salguero R Camarero JJ Dobbertin M Fernaacutendez-Cancio Aacute Vilagrave-Cabrera A Manzanedo RD Zavala MA
Navarro-Cerrillo RM Contrasting vulnerability and resilience to drought-induced decline of densely planted vs naturalrear-edge Pinus nigra forests For Ecol Manag 2013 310 956ndash967 [CrossRef]
Forests 2021 12 985 15 of 17
4 Gazol A Camarero JJ Sanguumlesa-Barreda G Serra-Maluquer X Saacutenchez-Salguero R Coll L Casals P Tree Species AreDifferently Impacted by Cumulative Drought Stress and Present Higher Growth Synchrony in Dry Places Front For Glob Chang2020 3 [CrossRef]
5 Saacutenchez-Salguero R Linares JC Camarero JJ Madrigal-Gonzaacutelez J Hevia A Saacutenchez-Miranda A Ballesteros-CaacutenovasJA Saacutenchez RA Garciacutea-Cervigoacuten AI Bigler C et al Disentangling the effects of competition and climate on individual treegrowth A retrospective and dynamic approach in Scots pine For Ecol Manag 2015 358 12ndash25 [CrossRef]
6 Tague CL Moritz M Hanan E The changing water cycle The eco-hydrologic impacts of forest density reduction inMediterranean (seasonally dry) regions Wiley Interdiscip Rev Water 2019 e1350 [CrossRef]
7 DrsquoAmato AW Bradford JB Fraver S Palik BJ Effects of thinning on drought vulnerability and climate response in northtemperate forest ecosystems Ecol Appl 2013 23 1735ndash1742 [CrossRef] [PubMed]
8 Tarancoacuten AA Fuleacute PZ Shive KL Sieg CH Meador AS Strom B Simulating post-wildfire forest trajectories underalternative climate and management scenarios Ecol Appl 2014 24 1626ndash1637 [CrossRef]
9 Schmitt A Trouveacute R Seynave I LeBourgeois F Decreasing stand density favors resistance resilience and recovery of Quercuspetraea trees to a severe drought particularly on dry sites Ann For Sci 2020 77 1ndash21 [CrossRef]
10 Molina AJ del Campo AD The effects of experimental thinning on throughfall and stemflow A contribution towardshydrology-oriented silviculture in Aleppo pine plantations For Ecol Manag 2012 269 206ndash213 [CrossRef]
11 Pretzsch H Schuumltze G Biber P Drought can favour the growth of small in relation to tall trees in mature stands of Norwayspruce and European beech For Ecosyst 2018 5 20 [CrossRef]
12 Sohn JA Saha S Bauhus J Potential of forest thinning to mitigate drought stress A meta-analysis For Ecol Manag 2016 380261ndash273 [CrossRef]
13 Del Campo AD Fernandes TJ Molina AJ Hydrology-oriented (adaptive) silviculture in a semiarid pine plantation Howmuch can be modified the water cycle through forest management Eur J For Res 2014 133 879ndash894 [CrossRef]
14 Navarro-Cerrillo R Saacutenchez-Salguero R Herrera R Ruiz CC Moreno-Rojas J Manzanedo RD Loacutepez-Quintanilla JContrasting growth and water use efficiency after thinning in mixed Abies pinsapondashPinus pinasterndashPinus sylvestris forests J ForSci 2016 62 53ndash64
15 Prescott C de Montigny L Harper G Eighteen-year growth responses to thinning and fertilization of a height-repressedlodgepole pine stand in interior British Columbia For Chron 2019 95 207ndash221 [CrossRef]
16 Steckel M Moser WK Del Riacuteo M Pretzsch H Implications of Reduced Stand Density on Tree Growth and DroughtSusceptibility A Study of Three Species under Varying Climate Forests 2020 11 627 [CrossRef]
17 McDowell NG Adams HD Bailey JD Hess M Kolb TE Homeostatic maintenance of ponderosa pine gas exchange inresponse to stand density changes Ecol Appl 2006 16 1164ndash1182 [CrossRef]
18 McCarroll D Loader N Stable isotopes in tree rings Quat Sci Rev 2004 23 771ndash801 [CrossRef]19 Gessler A Cailleret M Joseph J Schoumlnbeck L Schaub M Lehmann M Treydte K Rigling A Timofeeva G Saurer M
Drought induced tree mortalitymdashA tree-ring isotope based conceptual model to assess mechanisms and predispositions NewPhytol 2018 219 485ndash490 [CrossRef]
20 Navarro-Cerrillo RM Saacutenchez-Salguero R Rodriacuteguez C Lazo JD Moreno-Rojas JM Palacios-Rodriguez G Camarero JJIs thinning an alternative when trees could die in response to drought The case of planted Pinus nigra and P Sylvestris stands insouthern Spain For Ecol Manag 2019 433 313ndash324 [CrossRef]
21 Warren CR McGrath JF Adams M Water availability and carbon isotope discrimination in conifers Oecologia 2001 127476ndash486 [CrossRef]
22 Moreno-Gutieacuterrez C Battipaglia G Cherubini P Saurer M Nicolas E Contreras S Querejeta JI Stand structure modulatesthe long-term vulnerability of Pinus halepensis to climatic drought in a semiarid Mediterranean ecosystem Plant Cell Environ2012 35 1026ndash1039 [CrossRef]
23 Fernaacutendez-De-Untildea L McDowell NG Cantildeellas I Gea-Izquierdo G Disentangling the effect of competition CO2 and climateon intrinsic water-use efficiency and tree growth J Ecol 2016 104 678ndash690 [CrossRef]
24 Scheidegger Y Saurer M Bahn M Siegwolf R Linking stable oxygen and carbon isotopes with stomatal conductance andphotosynthetic capacity A conceptual model Oecologia 2000 125 350ndash357 [CrossRef]
25 Barbour MM Fischer RA Sayre KD Farquhar GD Oxygen isotope ratio of leaf and grain material correlates with stomatalconductance and grain yield in irrigated wheat Funct Plant Biol 2000 27 625 [CrossRef]
26 Roden J Siegwolf R Is the dual-isotope conceptual model fully operational Tree Physiol 2012 32 1179ndash1182 [CrossRef][PubMed]
27 Barnard H Brooks J Bond B Applying the dual-isotope conceptual model to interpret physiological trends under uncontrolledconditions Tree Physiol 2012 32 1183ndash1198 [CrossRef]
28 Manrique-Alba Agrave Begueriacutea S Molina AJ Gonzaacutelez-Sanchis M Tomagraves-Burguera M Del Campo AD Colangelo MCamarero JJ Long-term thinning effects on tree growth drought response and water use efficiency at two Aleppo pineplantations in Spain Sci Total Environ 2020 728 138536 [CrossRef]
29 Linares JC Tiacutescar PA Climate change impacts and vulnerability of the southern populations of Pinus nigra subsp salzmanniiTree Physiol 2010 30 795ndash806 [CrossRef] [PubMed]
Forests 2021 12 985 16 of 17
30 Gazol A Hernaacutendez-Alonso R Camarero JJ Patterns and Drivers of Pine Processionary Moth Defoliation in MediterraneanMountain Forests Front Ecol Evol 2019 7 [CrossRef]
31 Vicente-Serrano SM Tomas-Burguera M Begueriacutea S Reig-Gracia F Latorre B Pentildea-Gallardo M Luna MY Morata AGonzaacutelez-Hidalgo JC A High Resolution Dataset of Drought Indices for Spain Data 2017 2 22 [CrossRef]
32 Tomas-Burguera M Vicente-Serrano SM Begueriacutea S Reig F Latorre B Reference crop evapotranspiration database in Spain(1961ndash2014) Earth Syst Sci Data 2019 11 1917ndash1930 [CrossRef]
33 Koumlppen W IDas Geographisca System der Klimate Handbuchder Klimatologiei Koumlppen W Geiger G Eds 1936 pp 1ndash44Available online httpswwwscirporg(S(czeh2tfqyw2orz553k1w0r45))referenceReferencesPapersaspxReferenceID=242388 (accessed on 20 May 2021)
34 World Reference Base for Soil Resources (WRB) Update 2015 World Soil Resources Reports 106 FAO Rome Italy 201435 Holmes RL Computer-assisted quality control in tree-ring dating and measurement Tree-Ring Bull 1983 43 69ndash7536 Biondi F Qeadan F A theory-driven approach to tree-ring standardization Defining the biological trend from expected basal
area increment Tree-Ring Res 2008 64 81ndash96 [CrossRef]37 Vicente-Serrano SM Begueriacutea S Loacutepez-Moreno JI A multiscalar drought index sensitive to global warming The standardized
precipitation evapotranspiration index J Clim 2010 23 1696ndash1718 [CrossRef]38 Begueriacutea S Vicente-Serrano SM Reig F Latorre B Standardized precipitation evapotranspiration index (SPEI) revisited
Parameter fitting evapotranspiration models tools datasets and drought monitoring Int J Climatol 2014 34 3001ndash3023[CrossRef]
39 Saurer M Siegwolf RTW Schweingruber FH Carbon isotope discrimination indicates improving water-use efficiency of treesin northern Eurasia over the last 100 years Glob Chang Biol 2004 10 2109ndash2120 [CrossRef]
40 Belmecheri S Lavergne A Compiled records of atmospheric CO2 concentrations and stable carbon isotopes to reconstructclimate and derive plant ecophysiological indices from tree rings Dendrochronologia 2020 63 125748 [CrossRef]
41 Farquhar G Richards R Isotopic composition of plant carbon correlates with water-use efficiency of wheat genotypes FunctPlant Biol 1984 11 539ndash552 [CrossRef]
42 Farquhar G OrsquoLeary M Berry J On the Relationship between Carbon Isotope Discrimination and the Intercellular CarbonDioxide Concentration in Leaves Funct Plant Biol 1982 9 121ndash137 [CrossRef]
43 Francey RJ Farquhar G An explanation of 13C12C variations in tree rings Nature 1982 297 28ndash31 [CrossRef]44 Pinheiro J Bates D Mixed-Effects Models in S and S-PLUS Springer Science amp Business Media BerlinHeidelberg Germany
200645 Powell MJD The BOBYQA Algorithm for Bound Constrained Optimisation without Derivatives Report No DAMTP 2009NA06
Centre for Mathematical Sciences Univ Cambridge UK 2009 Available online httpwwwdamtpcamacukusernaNA_papersNA2009_06pdf (accessed on 22 May 2021)
46 Bates D Maumlchler M Bolker B Walker S Fitting Linear Mixed-Effects Models Using lme4 J Stat Softw 2015 67 1ndash48[CrossRef]
47 R Core Team R A Language and Environment for Statistical Computing R Foundation for Statistical Computing Vienna Austria2021 Available online httpswwwR-projectorg (accessed on 22 May 2021)
48 Breda N Granier A Aussenac G Effects of thinning on soil and tree water relations transpiration and growth in an oak forest(Quercus petraea (Matt) Liebl) Tree Physiol 1995 15 295ndash306 [CrossRef] [PubMed]
49 Vilagrave-Cabrera A Coll L Martinez-Vilalta J Retana J Forest management for adaptation to climate change in the Mediterraneanbasin A synthesis of evidence For Ecol Manag 2018 407 16ndash22 [CrossRef]
50 Giuggiola A Ogee J Rigling A Gessler A Bugmann H Treydte K Improvement of water and light availability afterthinning at a xeric site Which matters more A dual isotope approach New Phytol 2015 210 108ndash121 [CrossRef]
51 Linares JC Camarero JJ From pattern to process Linking intrinsic water-use efficiency to drought-induced forest declineGlob Chang Biol 2011 18 1000ndash1015 [CrossRef]
52 Fernandes TJ del Campo A Herrera R Molina AJ Simultaneous assessment through sap flow and stable isotopes of wateruse efficiency (WUE) in thinned pines shows improvement in growth tree-climate sensitivity and WUE but not in WUEi ForEcol Manag 2016 361 298ndash308 [CrossRef]
53 Klein T Hemming D Lin T Gruumlnzweig JM Maseyk K Rotenberg E Yakir D Association between tree-ring and needleδ13C and leaf gas exchange in Pinus halepensis under semi-arid conditions Oecologia 2005 144 45ndash54 [CrossRef]
54 McDowell N Brooks JR Fitzgerald SA Bond BJ Carbon isotope discrimination and growth response of old Pinus ponderosatrees to stand density reductions Plant Cell Environ 2003 26 631ndash644 [CrossRef]
55 Sohn JA Gebhardt T Ammer C Bauhus J Haumlberle K-H Matyssek R Grams TE Mitigation of drought by thinningShort-term and long-term effects on growth and physiological performance of Norway spruce (Picea abies) For Ecol Manag 2013308 188ndash197 [CrossRef]
56 Farquhar GD Barbour MM Henry BK Interpretation of oxygen isotope composition of leaf material In Stable IsotopesIntegration of Biological Ecological and Geochemical Processes Griffiths H Ed BIOS Scientific Publishers Oxford UK 1998pp 27ndash61
57 Barbour MM Stable oxygen isotope composition of plant tissue A review Funct Plant Biol 2007 34 83ndash94 [CrossRef]
Forests 2021 12 985 17 of 17
58 Roden JS Lin G Ehleringer JR A mechanistic model for interpretation of hydrogen and oxygen isotope ratios in tree-ringcellulose Geochim Cosmochim Acta 2000 64 21ndash35 [CrossRef]
59 Barbour M Farquhar G Relative humidity-and ABA-induced variation in carbon and oxygen isotope ratios of cotton leavesPlant Cell Environ 2000 23 473ndash485 [CrossRef]
60 Siegwolf RTW Matyssek R Saurer M Maurer S Guumlnthardt-Goerg MS Schmutz P Bucher JB Stable isotope analysisreveals differential effects of soil nitrogen and nitrogen dioxide on the water use efficiency in hybrid poplar leaves New Phytol2001 149 233ndash246 [CrossRef] [PubMed]
61 Roden JS Farquhar GD A controlled test of the dual-isotope approach for the interpretation of stable carbon and oxygenisotope ratio variation in tree rings Tree Physiol 2012 32 490ndash503 [CrossRef] [PubMed]
62 Anderson PD Larson DJ Chan SS Riparian buffer and density management influences on microclimate of young headwaterforests of western Oregon For Sci 2007 53 254ndash269
63 Powers MD Pregitzer KS Palik BJ Webster CR Wood δ13C δ18O and radial growth responses of residual red pine tovariable retention harvesting Tree Physiol 2010 30 326ndash334 [CrossRef] [PubMed]
64 Brooks JR Mitchell AK Interpreting tree responses to thinning and fertilization using tree-ring stable isotopes New Phytol2011 190 770ndash782 [CrossRef]
65 Pretzsch H Density and growth of forest stands revisited Effect of the temporal scale of observation site quality and thinningFor Ecol Manag 2020 460 117879 [CrossRef]
66 Thomas SC Halpern CB Falk DA Liguori DA Austin KA Plant diversity in managed forests Understory responses tothinning and fertilization Ecol Appl 1999 9 864ndash879 [CrossRef]
67 Chmura DJ Anderson PD Howe GT Harrington CA Halofsky JE Peterson DL Shaw DC St Clair JB Forestresponses to climate change in the northwestern United States Ecophysiological foundations for adaptive management For EcolManag 2011 261 1121ndash1142 [CrossRef]
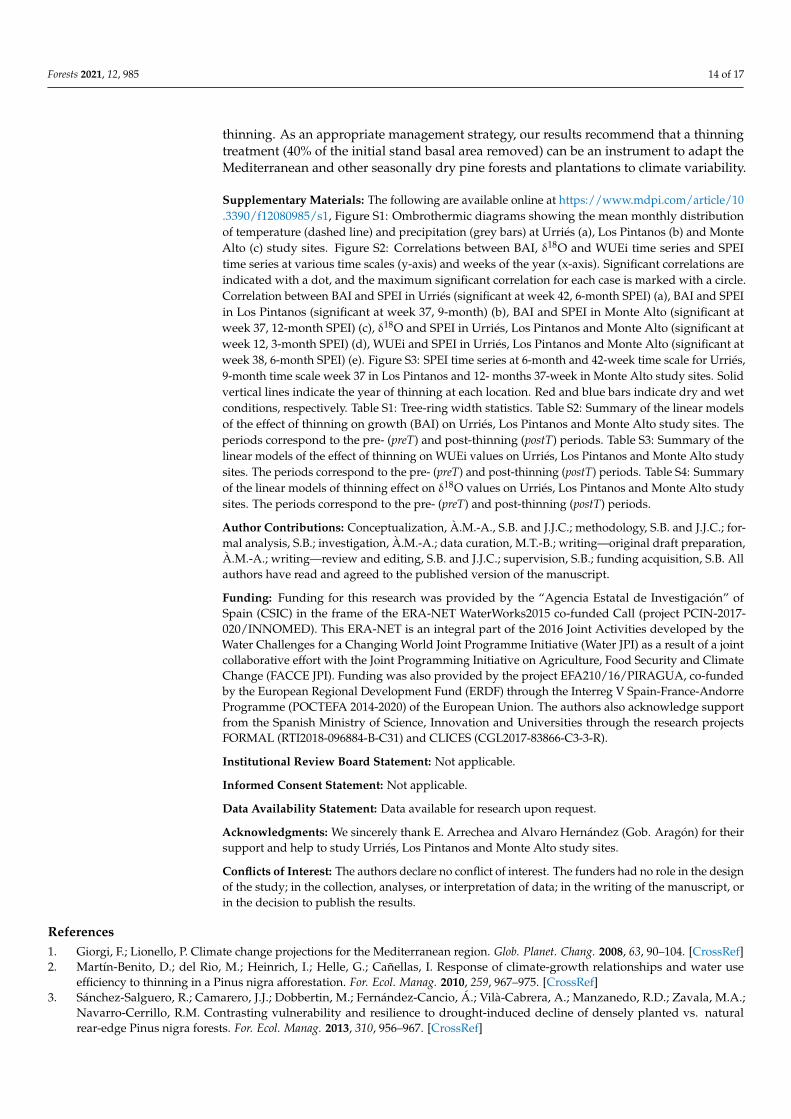
Copyright © 2022 FDOKUMEN