Pinus thunbergii bark extract rich in flavonoids promotes hair ...
Upload
independentCategory
view
0download
0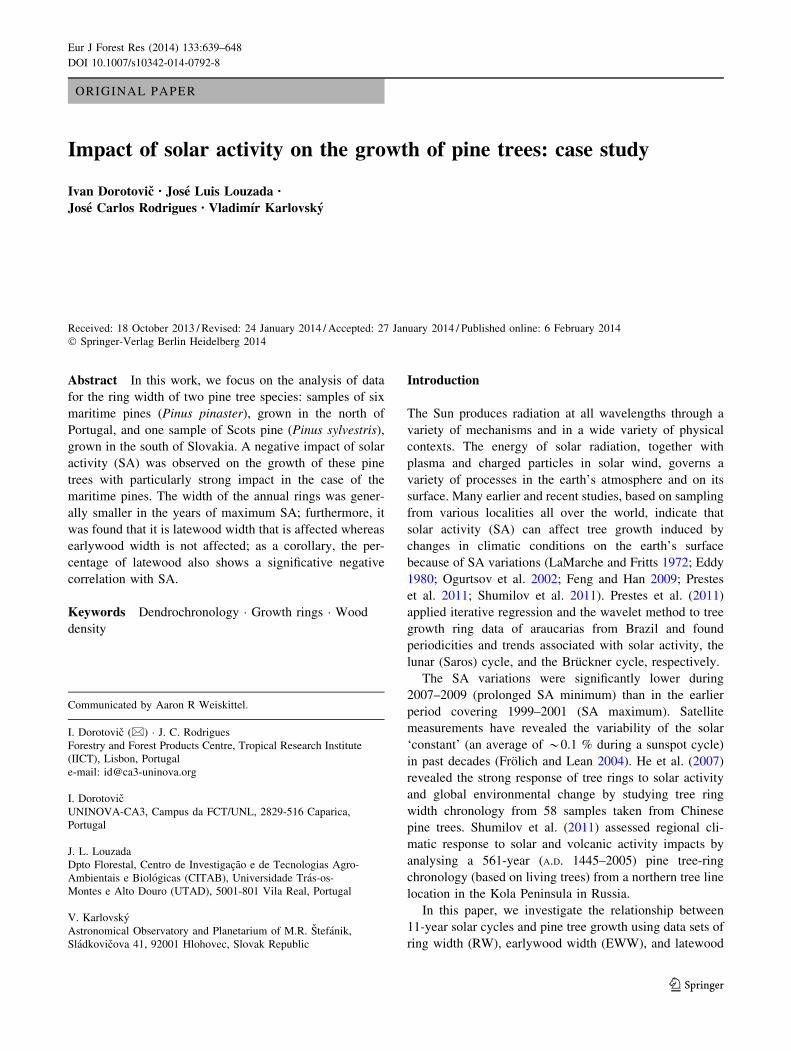
ORIGINAL PAPER
Impact of solar activity on the growth of pine trees: case study
Ivan Dorotovic • Jose Luis Louzada •
Jose Carlos Rodrigues • Vladimır Karlovsky
Received: 18 October 2013 / Revised: 24 January 2014 / Accepted: 27 January 2014 / Published online: 6 February 2014
� Springer-Verlag Berlin Heidelberg 2014
Abstract In this work, we focus on the analysis of data
for the ring width of two pine tree species: samples of six
maritime pines (Pinus pinaster), grown in the north of
Portugal, and one sample of Scots pine (Pinus sylvestris),
grown in the south of Slovakia. A negative impact of solar
activity (SA) was observed on the growth of these pine
trees with particularly strong impact in the case of the
maritime pines. The width of the annual rings was gener-
ally smaller in the years of maximum SA; furthermore, it
was found that it is latewood width that is affected whereas
earlywood width is not affected; as a corollary, the per-
centage of latewood also shows a significative negative
correlation with SA.
Keywords Dendrochronology � Growth rings � Wood
density
Introduction
The Sun produces radiation at all wavelengths through a
variety of mechanisms and in a wide variety of physical
contexts. The energy of solar radiation, together with
plasma and charged particles in solar wind, governs a
variety of processes in the earth’s atmosphere and on its
surface. Many earlier and recent studies, based on sampling
from various localities all over the world, indicate that
solar activity (SA) can affect tree growth induced by
changes in climatic conditions on the earth’s surface
because of SA variations (LaMarche and Fritts 1972; Eddy
1980; Ogurtsov et al. 2002; Feng and Han 2009; Prestes
et al. 2011; Shumilov et al. 2011). Prestes et al. (2011)
applied iterative regression and the wavelet method to tree
growth ring data of araucarias from Brazil and found
periodicities and trends associated with solar activity, the
lunar (Saros) cycle, and the Bruckner cycle, respectively.
The SA variations were significantly lower during
2007–2009 (prolonged SA minimum) than in the earlier
period covering 1999–2001 (SA maximum). Satellite
measurements have revealed the variability of the solar
‘constant’ (an average of *0.1 % during a sunspot cycle)
in past decades (Frolich and Lean 2004). He et al. (2007)
revealed the strong response of tree rings to solar activity
and global environmental change by studying tree ring
width chronology from 58 samples taken from Chinese
pine trees. Shumilov et al. (2011) assessed regional cli-
matic response to solar and volcanic activity impacts by
analysing a 561-year (A.D. 1445–2005) pine tree-ring
chronology (based on living trees) from a northern tree line
location in the Kola Peninsula in Russia.
In this paper, we investigate the relationship between
11-year solar cycles and pine tree growth using data sets of
ring width (RW), earlywood width (EWW), and latewood
Communicated by Aaron R Weiskittel.
I. Dorotovic (&) � J. C. Rodrigues
Forestry and Forest Products Centre, Tropical Research Institute
(IICT), Lisbon, Portugal
e-mail: [email protected]
I. Dorotovic
UNINOVA-CA3, Campus da FCT/UNL, 2829-516 Caparica,
Portugal
J. L. Louzada
Dpto Florestal, Centro de Investigacao e de Tecnologias Agro-
Ambientais e Biologicas (CITAB), Universidade Tras-os-
Montes e Alto Douro (UTAD), 5001-801 Vila Real, Portugal
V. Karlovsky
Astronomical Observatory and Planetarium of M.R. Stefanik,
Sladkovicova 41, 92001 Hlohovec, Slovak Republic
123
Eur J Forest Res (2014) 133:639–648
DOI 10.1007/s10342-014-0792-8

width (LWW), respectively, of the maritime pine (Pinus
pinaster) and the Scots pine (Pinus sylvestris).
Input data and methods
We used the following input data in our analysis:
1. Ring width, earlywood width, latewood width, and
wood density, respectively, of maritime pine (Pinus
pinaster) derived from samples of six individual pine
trees aged 79, 79, 80, 78, 81, and 85 years, respec-
tively (Geres, Portugal);
2. Ring width, earlywood width, latewood width, and
wood density, respectively, of Scots pine (Pinus
sylvestris) aged 180 years (Hurbanovo, Slovakia);
3. Sunspot data (Wolf sunspot number—SSN) from the
SIDC in Brussels, Belgium (http://www.sidc.be/sun
spot-data/), and the dates of minima and maxima of
sunspot cycles from the NGDC in Boulder, CO, USA
(http://www.ngdc.noaa.gov/stp/space-weather/solar-data/
solar-indices/sunspot-numbers/miscellaneous_in-pro
cess/docs/maxmin.new).
The Geres experimental site is located in the north of
Portugal (N 41�43030.3400, W 8�9056.9800) at an elevation of
500–600 m. The region has a maritime climate with some
influence of altitude (Csb Koppen–Geiger climate classi-
fication). Average annual temperature is 14.3 �C, annual
precipitation is 2,994 mm, with a potential evapotranspi-
ration of 747 mm (Thornthwaite method) and water deficit
of 95 mm (Mendes and Bettencourt 1980; Miranda et al.
2006). The soils are coarse-textured, rich in organic matter
Fig. 1 Evolution of the ring width—RW, earlywood width—EWW,
and the latewood width—LWW, respectively, in comparison with
evolution of the annual Wolf sunspot number—SSN (upper panel).
Bivariate fit of the RW (second panel from the top), the EWW (third
panel from the top), and the LWW (bottom panel), respectively, of the
maritime pine for solar (sunspot) activity (annual SSN)
Fig. 1 continued
640 Eur J Forest Res (2014) 133:639–648
123

and acids, with a low concentration of bases and a high
concentration of acidity. They show low levels of assimi-
lable phosphorus and medium to high assimilable potas-
sium (Agroconsultores and Coba 1991).
Fig. 2 Wavelet power spectrum (two upper panels) for red noise
background, cross-wavelet transform (two middle panels), and
wavelet coherence (two bottom panels) of the Wolf sunspot number
and the RW time series of both Pinus pinaster (upper of each pair of
panels) and Pinus sylvestris (lower of each pair of panels). The cone
of influence is marked as a shaded area, and the contour lines show
the 95 % confidence level. (Color figure online)
Fig. 2 continued
Eur J Forest Res (2014) 133:639–648 641
123

The Hurbanovo sampling site is located in the south-west
of Slovakia (N 47�52033.2800, E 18�11037.9300). The region
(differently from the site of samples of the maritime pine) has
a continental, lowland climate. Average annual temperature
Fig. 3 Wavelet power spectrum (two upper panels) for red noise
background, cross-wavelet transform (two middle panels), and
wavelet coherence (two bottom panels) of the Wolf sunspot number,
EWW, and LWW, respectively, for Pinus pinaster. The cone of
influence is marked as a shaded area and the contour lines show the
95 % confidence level. (Color figure online)
Fig. 3 continued
642 Eur J Forest Res (2014) 133:639–648
123

is 10 �C. Average summer temperatures in July reach
20.2 �C, and winter ones -1.5 �C in January. The climate is
dry, and average annual rainfall is 550 mm (Miklos and
Hrnciarova 2002). The most common vegetation type in the
surveyed region is agricultural monoculture. In natural types
of vegetation, one can find lowland floodplain forests and
willow-poplar floodplain forests (Michalko et al. 1986). The
Scots pine tree was planted inside the town of Hurbanovo, in
the park of the Astronomical Observatory, and grew between
1830 and 2010.
Measurements of the annual growth of all tree samples
were performed by a microdensitometric method using a
Joyce-Loebl MK3 apparatus as described in Louzada (2000).
We investigated the relationship between the 11-year SA
cycles and pine tree growth by studying data distributions in
scatter plots of tree growth and SA relationships and applied
bivariate fit as a reference marker. The data series of sun-
spot activity and tree ring width were then analysed with a
wavelet tool in order to extract any periods of tree growth
evolution evidenced within the data. The algorithm used
was an adapted version of Torrence and Compo’s (1998)
wavelet routine as provided by Grinsted et al. (2004). Fur-
thermore, both white and red noise backgrounds were
employed in order to verify the consistency of the results.
According to our knowledge, this is the first time that
the eventual impact of solar activity on tree growth has
been studied, not only by means of RW data but also
through separate consideration of the EWW and the LWW
time series (proportion of the rings formed in the spring
and summer seasons, respectively).
Results
Pinus pinaster
In the case of the maritime pine, we present only the results for
one particular sample aged 79 years, since the results for the
other five samples are very similar. Figure 1 shows the
bivariate fit of the RW, EWW, and LWW, respectively, of the
maritime pine for solar (sunspot) activity. As can be observed,
there is a highly significant (p value \ 0.0001) negative cor-
relation between sunspot activity and ring widths (R = 0.49)
for the period 1925–1980 and an even more significant neg-
ative correlation between sunspot activity and latewood
growth rings (R = 0.656). On the other hand, we found
insignificant correlation close to zero between sunspot activity
and earlywood growth rings (R = 0.033). Note that the initial
period from 1910 to 1925 corresponding to the development
of juvenile wood was not considered in the analysis.
To be able to investigate periods of tree growth evolution
present within the data and their temporal variation, we used a
wavelet tool (Torrence and Compo 1998; Grinsted et al.
2004), and we performed wavelet transform (CWT), cross-
wavelet transform (XWT) and wavelet transform coherence
(WTC), respectively, on the data of the maritime pine tree
growth (RW, EWW, and LWW, respectively). Figure 2
shows the results of the wavelet analysis for the RW time
series of both Pinus pinaster and Pinus sylvestris. Figure 3
shows the results of the wavelet analysis of the EWW and
LWW time series, respectively, of Pinus pinaster. Table 1
summarises the results of wavelet analysis (for the red noise),
i.e., significant periods found in the power spectrum of the
CWT and XWT during high power intervals of years. No
significant wavelet power was found in the EWW evolution in
the CWT analysis. The table also contains significant phase
angle orientations identified by means of WTC where phase
angle 0� means a strong correlation between two input
parameters and phase angle 180� indicates strong anticorre-
lations between parameters. A confidence level of 95 % was
assumed in almost all cases as a threshold of significance.
Pinus sylvestris
Similarly, Fig. 4 shows the bivariate fit of the RW, EWW,
and LWW, respectively, of the Scots pine for solar
Table 1 Significant periods found in the power spectrum of the wavelet transform (CWT) in the case of the RW and LWW analysis,
respectively (no significant wavelet power was found in the EWW evolution)
Wavelet analysis CWT CWT CWT XWT XWT XWT WTC WTC WTC
Ring width type RW EWW LWW SSN/RW SSN/EWW SSN/
LWW
RW EWW LWW
Intervals of years 1950–1989 – 1952–1987 1924–1988 1926–1960/
1969–1983
1923–1989 1920–1989 1935–1950 1920–1989
Significant periods
(years)
8–12 – 8–12 8–14 8–14/10–14 8–14 x x x
Phase angle in
WTC (�)
x x x x x x 180 0 180
Significant periods found in the power spectrum of the cross-wavelet transform (XWT) of the Wolf sunspot number (SSN) and the tree RW,
EWW, and LWW, respectively. Significant phase angle orientations found in the power spectrum of the wavelet coherence. Confidence level is
in most cases higher than 95 % for Pinus pinaster
Eur J Forest Res (2014) 133:639–648 643
123

(sunspot) activity. These results depict a behaviour similar
to that observed for the maritime pine, although with
slightly lower values of correlation (Fig. 4).
Results of the wavelet analysis for the RW time series of
both Pinus pinaster and Pinus sylvestris have already been
shown in Fig. 2. Figure 5 shows the CWT, XWT, and WTC of
the time series of the Wolf sunspot number (SSN) and the
EWW and LWW of Pinus sylvestris for the years 1845–2010.
In contrast to Pinus pinaster’s wavelet transform results, the
wavelet power spectrum for the Pinus sylvestris data shows
high wavelet power only in the case of LWW analysis for
1930–1960. Arrows in the figures of cross-wavelet transform
and wavelet coherence indicate that for the range of
8–12 years (which coincides with the 11-year sunspot cycle),
the growth of the juvenile pine tree is in phase with SSN
evolution (phase angle is near 0�), whereas in the years
1915–2002, the phase angle turns to *180� (significant an-
ticorrelation of both time series). Table 2 summarises the
results of wavelet analysis (for the red noise), i.e., significant
periods found in the power spectrum of the CWT and XWT
during high power intervals of years and also significant phase
angle orientations identified by means of the WTC.
Solar activity versus tree density
Figure 6 shows the bivariate fit of the medium density of
the maritime pine. Figure 7 shows the wavelet power
spectrum, cross-wavelet transformation, and the wavelet
coherence of the time series of the Wolf sunspot number
(SSN) and the tree density of Pinus pinaster and Pinus
sylvestris. Evolution of the wavelet power is very similar as
in the case of the wavelet analysis of the Wolf sunspot
number and the tree ring width (RW).
Fig. 4 Evolution of the ring width—RW, earlywood width—EWW,
and the latewood width—LWW, respectively, in comparison with
evolution of the annual Wolf sunspot number—SSN (upper panel).
Bivariate fit of the ring width—RW (second panel from the top),
earlywood width—EWW (third panel from the top), and the latewood
width—LWW (bottom panel), respectively, of the Scots pine for solar
(sunspot) activity (annual Wolf sunspot number—SSN)
Fig. 4 continued
644 Eur J Forest Res (2014) 133:639–648
123

Discussion and conclusions
The results depicted similar behaviours to the ones iden-
tified by Surovy et al. (2008), i.e, the tree growth seems to
Fig. 5 Wavelet power spectrum (two upper panels) for red noise
background, cross-wavelet transform (two middle panels), and
wavelet coherence (two bottom panels) of the Wolf sunspot number,
EWW, and LWW, respectively, for Pinus sylvestris. The cone of
influence is marked as a shaded area and the contour lines show the
95 % confidence level. (Color figure online)
Fig. 5 continued
Eur J Forest Res (2014) 133:639–648 645
123

be higher in the periods of SA minima than in the periods
of SA maxima. This means that a negative impact of the
SA is observed in the growth of pine trees. It was found
that the effect of solar activity is more pronounced in the
characteristics of density and growth of the wood formed
during the summer/autumn (latewood) than the wood
formed during the spring (earlywood) (see the bivariate fits
in Figs. 1 and 4, respectively). It was also found that the
greater the solar activity, the lower the maximum density,
the density of latewood, and therefore also the lower the
average ring density (RD) of the formed tree rings. With
regard to growth characteristics, these rings also showed a
reduction in the width of the latewood (LWW), latewood
percentage, and ring width. The result suggests that it is the
latewood width (LWW) that is affected by SA, whereas the
earlywood width (EWW) is not affected by SA and is a
very important finding of this paper. Statistical significance
is low, however. The authors are also aware that processing
of further tree growth and density data is needed to achieve
higher statistical significance. In spite of that fact, we
decided to publish our results as a case study on the
eventual different impacts of SA on EWW and LWW in
relation to the growth data of pine trees. A possible
explanation of the coupling between SA and tree growth
could be photograph assimilation in trees: high SA can
indirectly (through changes evoked in the earth’s global
climate) affect (slow down) the assimilation process in tree
growth. In summer, the characteristics of the atmosphere
are more permeable to sunlight, taking less distance in the
atmosphere to reach the surface and reaching the treetops
with higher energy. Thus, in the years of maximum SA,
these rays destroy the existing chlorophyll in the leaves,
reducing the amount of sugars produced by photosynthesis.
Hence, it is expected that during the summer/autumn of a
year with higher SA, trees show a reduction of their pho-
tosynthetic activity, and they form fewer cells with thinner
walls, resulting in a reduction of ring width and the for-
mation of less dense wood. Of course, there are many other
factors (e.g., local surface temperature, precipitation, soil
quality, etc.) that can have even stronger influence on tree
growth than solar activity.
Wavelet transform allowed us to study temporal changes
in the evolution of RW, EWW, LWW, and RD both for
Pinus pinaster and for Pinus sylvestris. In general, wavelet
power seems to be higher in the case of the comparison of
the evolution of solar activity and the evolution of RW,
LWW, and RD of Pinus pinaster than in the case of the
comparison of the evolution of solar activity and the evo-
lution of RW, LWW, and RD of Pinus sylvestris. Changes
found in the phase angles of wavelet coherence, in the
range of 8–12 years, are probably caused by the non-solar
factors mentioned above. Therefore, it would be useful in
Table 2 Significant periods found in the power spectrum of the wavelet transform (CWT) in the case of the LWW analysis, respectively (no
significant wavelet power was found in the RW- and the EWW evolution, respectively)
Wavelet
analysis
CWT CWT CWT XWT XWT XWT WTC WTC WTC
Ring width
type
RW EWW LWW SSN/RW SSN/EWW SSN/LWW RW EWW LWW
Intervals of
years
– – 1930–1960 1845–1860/
1915–2002
1842–1895/
1907–1929/
1970–1990
1845–1862/
1925–2003
1842–1850/
1917–1974/
1842–1908
1840–1880 1930–2000
Significant
periods
(years)
– – 8–12 9–13/6–10 9–13/9–10/6–11 11–13/7–12 x x x
Phase angle
in WTC (�)
x x x x x x 0/170–200/10–50 0 180
Significant periods found in the power spectrum of the cross-wavelet transform (XWT) of the Wolf sunspot number (SSN) and the tree RW,
EWW, and LWW, respectively. Significant phase angle orientations found in the power spectrum of the wavelet coherence. Confidence level is
in most cases higher than 95 % for Pinus sylvestris
Fig. 6 Bivariate fit of the medium density of the maritime pine
646 Eur J Forest Res (2014) 133:639–648
123

future research to compare our results with an analysis of
temperature and precipitation data evolution in the corre-
sponding years.
Acknowledgments This work was supported by grant number
SFRH/BPD/44018/2008 from the Fundacao para a Ciencia e
Fig. 7 Wavelet power spectrum (two upper panels) for red noise
background, cross-wavelet transform (two middle panels), and
wavelet coherence (two bottom panels) of the Wolf sunspot number
and the wood density time series of both Pinus pinaster (upper of
each pair of panels) and Pinus sylvestris (lower of each pair of
panels). The cone of influence is marked as a shaded area and the
contour lines show the 95 % confidence level. (Color figure online)
Fig. 7 continued
Eur J Forest Res (2014) 133:639–648 647
123

Tecnologia, MCTES, Lisbon, Portugal (I.D.). The authors are grateful
to the SIDC Team for providing the sunspot numbers. The authors
would also like to acknowledge the technical assistance of V. Calfa
and S. Macansky (SCO Hurbanovo) in obtaining the samples from
Pinus sylvestris. Wavelet and wavelet coherence were calculated with
a modified computing algorithm of wavelet transform, the original of
which was developed and provided by A. Grinsted and is available
at URL: http://www.pol.ac.uk/home/research/waveletcoherence/down
load.html.
References
Agroconsultores and Coba (1991) Carta dos Solos, Carta do Uso
Actual da Terra e Carta da Aptido da Terra do Nordeste de
Portugal [Soil maps, current land use maps, and land aptitude
maps of Northeast Portugal]. University of Tras-os-Montes and
Alto Douro, Vila Real
Eddy J (1980) The historical record of solar activity. In: Proceedings
of the ancient sun: fossil record in the earth, moon and
meteorites. Pergamon Press, New York/Oxford, pp 119–134
Feng B, Han YB (2009) Possible effect of solar activity on variation
of the tree-rings of a 500 a platycladus orientalis at the
Mausoleum of Emperor Huang. Sci China Ser G Phys Mech
Astron 52(4):631
Frolich C, Lean J (2004) Solar radiative output and its variability:
evidence and mechanisms. Astron Astrophys Rev 12:273
Grinsted A, Moore JC, Jevrejeva S (2004) Application of the cross
wavelet transform and wavelet coherence to geophysical time
series. Nonlinear Process Geophys 11:561
He XG, Chen ZJ, Chen W, Shao XM, He H, Sun Y (2007) Solar
activity, global surface air temperature anomaly and pacific
decadal oscillation recorded in urban tree rings. Ann For Sci
64:743
LaMarche VC, Fritts HC (1972) Tree-rings and sunspot numbers.
Tree Ring Bull 32:19
Louzada J (2000) Variacao fenotıpica e genetica em caracterısticas
estruturais na madeira de Pinus pinaster Ait. UTAD, Serie
Didactica, Ciencias Aplicadas no 143 (Phenotypic and genetic
variation in the structural features of Pinus pinaster wood) Vila
Real, p 293
Mendes JC, Bettencourt ML (1980) O Clima de Portugal—Contrib-
uicao para o estudo do balanco climatologico de agua no solo e
classificacao climatica de Portugal Continental (The climate of
Portugal—contribution to the study of climatological water
balance in the soil and climatic classification of Portugal), Fasc.
XXIV. Instituto Nacional de Meteorologia e Geofısica, p 287
Michalko J, Berta J, Magic D (1986) Geobotanicka mapa CSSR—
Slovenska socialisticka republika (geobotanical map of Czecho-
slovakia, Slovak Socialist Republic). Veda, Bratislava
Miklos L, Hrnciarova T (eds) (2002) Atlas krajiny Slovenskej
republiky (Landscape atlas of the Slovak Republic). Ministerstvo
zivotneho prostredia SR, Bratislava and Slovenska agentura
zivotneho prostredia, Banska Bystrica
Miranda P, Valente M, Tome A, Trigo M, Coelho F, Aguiar A,
Azevedo E (2006) The Portuguese climate in the 20th and 21st
centuries, in Santos and Miranda (eds), Gradiva, p 47
Ogurtsov MG, Kocharov GE, Lindholm M, Merilainen J, Eronen M,
Nagovitsyn YuA (2002) Evidence of solar variation in tree-ring-
based climate reconstructions. Solar Phys 205:403
Prestes A, Rigozo NR, Nordemann DJR, Wrasse CM, Souza Echer
MP, Echer E, da Rosa MB, Rampelotto PH (2011) Sun–earth
relationship inferred by tree growth rings in conifers from
Severiano De Almeida, Southern Brazil. J Atmos Sol Terr Phys
73:1587–1593
Shumilov OI, Kasatkina EA, Mielikainen K, Timonen M, Kanatjev
AG (2011) Palaeovolcanos, solar activity and pine tree-rings
from the Kola Peninsula (northwestern Russia) over the last
560 years. Int J Environ Res 5(4):855–864
Surovy P, Ribeiro NA, Pereira JS, Dorotovic I (2008) Influence of
solar activity cycles on cork growth—a hypothesis. In: Proceed-
ings of the 19th National solar physics meeting, Papradno 2008,
Dorotovic I (ed), SUH Hurbanovo (published on CD), p 67
Torrence C, Compo G (1998) A practical guide to wavelet analysis.
Bull Am Meteorol Soc 79:61
648 Eur J Forest Res (2014) 133:639–648
123
Copyright © 2022 FDOKUMEN