Chemical composition of Pinus sibirica nut oils
7
Research Paper Chemical composition of Pinus sibirica nut oils Ryszard Zadernowski 1 , Marian Naczk 2 and Sylwester Czaplicki 1 1 Department of Food Plant Chemistry and Processing, Faculty of Food Science, University of Warmia and Mazury, Olsztyn, Poland 2 Department of Human Nutrition, St. Francis Xavier University, Antigonish, Canada The chemical composition of oil obtained from Pinus sibirica was investigated. The nonpolar lipids were the predominant lipid fraction while the triacylglycerols were the major component of this fraction. a- and g-tocopherols were the dominant tocopherols in pine oils. Eleven fatty acids (FA) were identified in pine nut oil. The unsaturated FA comprised over 90% of the total FA. Of these, polyunsaturated FA accounted for 66% of the total FA. 18:2 and 18:3 acids were the dominant unsaturated FA, while palmitic and stearic acids were the major saturated FA. Three unusual FA, namely 10,13-octadecadienoic, gorlic and 11,13- eicosadienoic acid, were tentatively identified in pine nut oil. Keywords: Cold-pressed oil / Gorlic acid / Pinus sibirica / Tocopherols Received: October 1, 2008; accepted: November 11, 2008 DOI 10.1002/ejlt.200800221 698 Eur. J. Lipid Sci. Technol. 2009, 111, 698–704 1 Introduction The seeds of the genus Pinus, commonly known as pine nuts, are 9–12 mm long and are a good source of nutrients. The pine nuts are consumed raw or roasted and as additive (con- diment) in many food preparations [1]. According to Savage [2], daily consumption of nuts may lower the risk of coronary heart disease as well as non-fatal myocardial infraction. The chemical composition of pine seeds is affected not only by the variety but also by geographical and climatic factors [3]. For example, Pinus pinea seeds contain 44.9% of fat and 31.9% of protein, and are a good source of potassium, magnesium, phosphorus and vitamin B 1 [4]. Literature data on the chemical composition of Pinus sibirica seed oils are still limited. Therefore, the purpose of this study was to investigate the chemical com- position of both cold-pressed and hexane-extracted pine oils. 2 Materials and methods 2.1 Samples The nuts of the Pinus sibirica cultivar were used in this study. The nuts were obtained from the Novosybirski Institute (Russia) and were harvested in Siberia in September 2002. After the harvest, the nuts were immediately dried at 30 7C till the moisture level was 7%. Following this, the nuts were packed in plastic bags, transported to the laboratory and stored at –20 7C until analysis. The nuts were deforested and shelled before analysis. 2.2 Sample preparation Before analysis, the nuts were cracked in a laboratory mill (10 s) model WZ-1 (Spomasz, Z ˙ nin, Poland) and then shelled manually. Following this, the nuts were finely ground using a cyclone sample mill (UD Corporation, Boulder, CO, USA). Pine nut oil was expelled from the finely ground nuts by using a Komet screw press model CLP 150 (IBG Menforts & Reiners, Mönchengladbach, Germany) equip- ped with 5-mm diameter dye. The oil was then clarified by centrifugation for 20 min at 12006g using a Janetzki cen- trifuge model MLW T 24 (VEB Zentrifugebau, Leipzig- Engelsdorf, Germany). The oil was also extracted from the nuts by mixing finely ground nuts with hexane at a nut-to- hexane ratio of 1 : 10 at room temperature for 15 min. The slurry was then filtered through a Whatman No. 1 filter. Following this, the residue was re-extracted three more times. The hexane extracts were combined and the hexane was removed by vacuum distillation. Both the pressed and hexane-extracted oils were kept in tubes flushed with nitro- gen. The tubes were wrapped in aluminum foil and stored at –20 7C until analysis. Correspondence: Ryszard Zadernowski, University of Warmia and Mazury, Plac Cieszyn ´ ski 1, 10-957 Olsztyn, Poland. E-mail: [email protected] Fax: 148 89 5233466 © 2009 WILEY-VCH Verlag GmbH & Co. KGaA, Weinheim www.ejlst.com
Transcript of Chemical composition of Pinus sibirica nut oils
Research Paper
Chemical composition of Pinus sibirica nut oils
Ryszard Zadernowski1, Marian Naczk2 and Sylwester Czaplicki1
1 Department of Food Plant Chemistry and Processing, Faculty of Food Science,University of Warmia and Mazury, Olsztyn, Poland
2 Department of Human Nutrition, St. Francis Xavier University, Antigonish, Canada
The chemical composition of oil obtained from Pinus sibirica was investigated. The nonpolar lipids werethe predominant lipid fraction while the triacylglycerols were the major component of this fraction. a- andg-tocopherols were the dominant tocopherols in pine oils. Eleven fatty acids (FA) were identified in pinenut oil. The unsaturated FA comprised over 90% of the total FA. Of these, polyunsaturated FA accountedfor 66% of the total FA. 18:2 and 18:3 acids were the dominant unsaturated FA, while palmitic and stearicacids were the major saturated FA. Three unusual FA, namely 10,13-octadecadienoic, gorlic and 11,13-eicosadienoic acid, were tentatively identified in pine nut oil.
Keywords: Cold-pressed oil / Gorlic acid / Pinus sibirica / Tocopherols
Received: October 1, 2008; accepted: November 11, 2008
DOI 10.1002/ejlt.200800221
698 Eur. J. Lipid Sci. Technol. 2009, 111, 698–704
1 Introduction
The seeds of the genus Pinus, commonly known as pine nuts,are 9–12 mm long and are a good source of nutrients. Thepine nuts are consumed raw or roasted and as additive (con-diment) in many food preparations [1]. According to Savage[2], daily consumption of nuts may lower the risk of coronaryheart disease as well as non-fatal myocardial infraction.
The chemical composition of pine seeds is affected not onlyby the variety but also by geographical and climatic factors [3].For example, Pinus pinea seeds contain 44.9% of fat and 31.9%of protein, and are a good source of potassium, magnesium,phosphorus and vitamin B1 [4]. Literature data on the chemicalcomposition of Pinus sibirica seed oils are still limited. Therefore,the purpose of this study was to investigate the chemical com-position of both cold-pressed and hexane-extracted pine oils.
2 Materials and methods
2.1 Samples
The nuts of the Pinus sibirica cultivar were used in this study.The nuts were obtained from the Novosybirski Institute
(Russia) and were harvested in Siberia in September 2002.After the harvest, the nuts were immediately dried at 30 7C tillthe moisture level was �7%. Following this, the nuts werepacked in plastic bags, transported to the laboratory andstored at –20 7C until analysis. The nuts were deforested andshelled before analysis.
2.2 Sample preparation
Before analysis, the nuts were cracked in a laboratory mill(10 s) model WZ-1 (Spomasz, Znin, Poland) and thenshelled manually. Following this, the nuts were finely groundusing a cyclone sample mill (UD Corporation, Boulder,CO, USA). Pine nut oil was expelled from the finely groundnuts by using a Komet screw press model CLP 150 (IBGMenforts & Reiners, Mönchengladbach, Germany) equip-ped with 5-mm diameter dye. The oil was then clarified bycentrifugation for 20 min at 12006g using a Janetzki cen-trifuge model MLW T 24 (VEB Zentrifugebau, Leipzig-Engelsdorf, Germany). The oil was also extracted from thenuts by mixing finely ground nuts with hexane at a nut-to-hexane ratio of 1 : 10 at room temperature for 15 min. Theslurry was then filtered through a Whatman No. 1 filter.Following this, the residue was re-extracted three moretimes. The hexane extracts were combined and the hexanewas removed by vacuum distillation. Both the pressed andhexane-extracted oils were kept in tubes flushed with nitro-gen. The tubes were wrapped in aluminum foil and storedat –20 7C until analysis.
Correspondence: Ryszard Zadernowski, University of Warmia andMazury, Plac Cieszynski 1, 10-957 Olsztyn, Poland.E-mail: [email protected]: 148 89 5233466
© 2009 WILEY-VCH Verlag GmbH & Co. KGaA, Weinheim www.ejlst.com
Eur. J. Lipid Sci. Technol. 2009, 111, 698–704 Pinus sibirica nut oils 699
2.3 Fatty acid composition
The fatty acid (FA) composition of the lipids was determinedas FA methyl esters (FAME) prepared as described byZadernowski and Sosulski [5]. FAME were separated andquantified by gas chromatography (GC) using a Hewlett-Packard Model 6890 gas chromatograph with MSD (Agilent,Palo Alto, CA, USA) equipped with a fused-silica capillarycolumn (SUPELCOWAX-10, 0.32 mm i.d., 30 m length,coated with a 0.25-mm film of polar phase SP 2330; Sigma-Aldrich, Poznan, Poland). The sample was injected into thegas chromatograph using a Hewlett-Packard 7673 auto-injector (Agilent). The temperature of the oven was at 180 7C.Helium at a flow rate of 0.25 mL/min was used as the carriergas. The injection port and the flame ionization detector oventemperatures were set at 250 7C. Margaric acid was used asinternal standard. The injections were carried out in splitmode with a split ratio of 20 : 1. The mass spectra wereobtained by electron ionization at 70 eV, and were scannedfrom 50 to 500 m/z at 0.8 s per scan. The volume injected was1 mL. The results are expressed as relative percentage of eachFA in the mixture and were calculated based on internal nor-malization of the chromatographic peak area. FAME wereidentified by comparing retention times with those of anauthentic standard mixture (GLC-461; Nu-Check-Prep,Elysian, MN, USA) and/or based on the MS spectra library ofFA provided by the supplier of the equipment.
2.4 Tocopherol composition
The tocopherols in the pine nut oils were determined asdescribed by Thompson and Hatine [6]. The oil was dissolvedin the elution solvent (hexane/diethyl ether, 95 : 5, vol/vol) to afinal volume of 1 g/10 mL. The solution was then filteredthrough a 0.45-mm Gelman Acrodisc filter (VWR Interna-tional, Missisauga, ON, Canada). Care was taken to excludeexposure of the samples to sunlight throughout the analyticalprocedure. Samples (20 mL) were analyzed using a ShimadzuHPLC system (Kyoto, Japan) consisting of a pump (modelLC 10AD), a system controller (model SCTL 10A), a columnoven (model CTO 10 AS) and a Shimadzu diode array detec-tor (model SPD M10A) interfaced with a personal computer.The HPLC system was equipped with a Luna silica column(5 m, 4.66250 mm) (Phenomenex, Torrance, CA, USA). Theseparation was carried out at 25 7C using hexane/diethyl ether(95 : 5, vol/vol) as the mobile phase. The system was operatedisocratically at a flow rate of 2 mL/min and tocopherols weredetected at 295 nm. A 10-min equilibration period was usedbetween sample injections. The identification of a-, b-, g- andd-tocopherols was made by comparison of retention times ofunknown peaks to those of reference authentic standards(Sigma Chemicals Co., St. Louis, MO, USA) and confirmedby comparison of DAD-UV spectra. Quantification of toco-pherols was based on the external standard method. Calibra-tion curves for each standard were established by plotting peak
areas at four different concentrations for each standard. Thecorrelation coefficients R were between 0.98 and 0.99. Reten-tion times for a-, b-, d- and g-tocopherols were 7.48, 11.24,20.05 and 13.16 min, respectively.
The content of biologically active vitamin E (CE) was cal-culated using the following formula: CE = C1 1 0.1 C2 1
0.03 C3 proposed by Eittenmiller et al. [7], where C1 = a-tocopherol content, C2 = g-tocopherol content, and C3 = d-tocopherol content.
2.5 Lipid fractionation
The polar and nonpolar lipids were separated as described byZadernowski and Sosulski [5]. A 25-g sample of pine nut oilwas first dissolved in 300 mL chloroform and then shakenwith 100 g activated silicic acid (100 mesh) for 20 min. Thesilicic acid (Sigma Chemicals) was activated by heating at120 7C for 24 h. The suspension was poured into a fritted discfunnel, and following this, the nonpolar lipids were first elutedwith 1500 mL chloroform and then the polar lipids with1000 mL methanol. The solvents were evaporated at reducedpressure under nitrogen at 50 7C, and the lipid fractions wereweighed and then stored under nitrogen at –20 7C in tubescarefully wrapped with aluminum foil.
The nonpolar lipids were further separated by thin-layerchromatography methodology as described by Clayton et al.[8]. Of the nonpolar lipid fraction, 1 g was dissolved in 10 mLchloroform and several 10-mL samples were applied to a20634 cm silica gel G (Merck, Darmstadt, Germany) plate.The chromatograms were developed using diethyl ether/ben-zene/ethanol/acetic acid (40 : 50 : 2 : 0.2, vol/vol/vol/vol) as themobile phase. When the solvent front reached the height of25 cm, the plates were dried and developed further to 32 cmheight using hexane/diethyl ether (94 : 6, vol/vol) as the mobilephase. Standards of each particular class of neutral lipid wereincluded in all chromatographic plates. The developed plateswere sprayed with 50% (wt/vol) sulfuric acid for the identifica-tion of acylglycerols and FA, while Liebermann-Burchardreagent was used to locate the sterols and sterol esters. Replicatechromatographic plates were placed in an iodine-saturatedchamber for spot identification, and after iodine evaporation,the spots were scraped from the plates and the lipids wereextracted with diethyl ether. The solvent was evaporated todryness under nitrogen and the residues were weighed.
2.6 Chemical analysis
The total content of lipids in the nuts was determined accord-ing to method Ba 3-38 of the Association of Official AnalyticalChemists [9]. The peroxide value of the oils was determinedaccording to the method of the Association of Official Analyti-cal Chemists [9]. The total content of phenols in the oils wasdetermined as described by Chimi and Cillard [10]. An amountof 50 g of oil was first dissolved in 100 mL hexane. This solu-tion was then extracted four times with a methanol/water mix-
© 2009 WILEY-VCH Verlag GmbH & Co. KGaA, Weinheim www.ejlst.com

700 R. Zadernowski et al. Eur. J. Lipid Sci. Technol. 2009, 111, 698–704
ture (60 : 40, vol/vol; 3 min for each extraction). The metha-nol/water layers were combined and evaporated to drynessunder vacuum. The residue was dissolved in 80% (vol/vol)methanol, and the content of phenolic compounds was thenestimated using the Folin-Denis reagent [11] and expressed as(1)-catechin equivalents per gram of oil.
The wet acid mineralization of oil samples was carried outusing a microwave furnace model MDS 2000 (CEM Corp.,Matthews, NC, USA) according to the procedure provided bythe supplier of the equipment. The concentrations of the ele-ments were measured using a Unicam 939 AA solar atomicflame spectrometer (Unicam, Cambridge, UK) equipped withthe appropriate lamp for the respective element, an ADAXdatabase station, a GF 90 graphite furnace, an FG autosampler,and a cold-vapor attachment. An air-acetylene flame was usedfor the determination of Mg and Ca, a graphite furnace was uti-lized for the determination of Fe, Cu, Cd, Pb, Mn and Zn, whilethe cold-vapor attachment was used for the quantification of Hg[12–15]. The concentration of phosphorus was measured col-orimetrically according to the AOAC method [9]. The quantifi-cation of the elements in question was carried out using appro-priate calibration curves established by plotting absorbances atfour different concentrations for each standard (BDH, UK).
2.7 Data treatment
The results presented in the tables are mean values of dupli-cate experiments with three to six replicates per experiment.The statistical analysis of data (ANOVA and t-test) was car-ried out using the SigmaStat v.3.01 (SSPS, Chicago, IL,USA) software package. No statistically significant difference(t-test, p .0.05) was found among the experiments. In thetables, means within the same column followed by the samesuperscript are not significantly different (t-test, p .0.05).
3 Results and discussion
The shelled nuts from P. sibirica contained 65.1 6 2.1% of oil,on dry weight basis. On the other hand, Nasri et al. [16]reported that the fully ripe seeds of two Tunisian pines,P. pinea L. and P. halapensis, contained only 34.6–48.1% of oil,
on dry weight basis. Furthermore, Wolff and Bayard [1]studied seven species of the genus Pinus and reported that thepine seeds contained from 31 to 68% of oil on dry weightbasis.
Pressing of nuts yielded only 49.2% of the total lipidspresent in P. sibirica nuts, while 97.7% of total lipids wasrecovered by hexane extraction (Table 1). The peroxidevalues of the pine nut oils were between 0.26 and 1.00 milli-equivalents of active O2/kg of oil. These values are 2–5 timeslower than those reported by Amaral et al. [17] for oilsobtained from six walnut cultivars.
The percentage yields of nonpolar and polar lipids areshown in Table 2. The nonpolar lipids were the predominantfraction of the pine nut oils as the ratio of nonpolar to polaripids was ca. 166 : 1. This value is much higher than thatreported by Zadernowski and Sosulski [5] for oil extractedfrom Sinus and Janpol rapeseed cultivars. Triacylglycerolsdominated the nonpolar lipids of both pressed and hexane-extracted oils. The triacylglycerol composition of bothP. sibirica and P. pinea seed oils has already been investigated[4, 18]. However, it should be noted that Deineka and Deineka[18] reported some uncertainty in recalculation of the tri-acylglycerol composition of FA because of the presence ofsome inseparable pairs of triacylglycerols in P. sibirica oil.Diacylglycerols, sterol esters and hydrocarbons were minorcomponents of the nonpolar lipids in P. sibirica nut oil. Moreresearch is still needed to determine both composition and
Table 2. Composition of pine nut oils (wt-%).
Lipid fractions Cold-pressed oil Hexane-extracted oil
Polar lipids 0.60 6 0.02 0.60 6 0.02Nonpolar lipids 99.4 6 0.5 99.4 6 0.5
Triacylglycerols 90.2 6 1.2 85.8 6 3.0Diacylglycerols 2.2 6 0.1 4.0 6 0.1Free fatty acids 2.2 6 0.2 2.3 6 0.1Sterols traces tracesSterol esters 2.3 6 0.1 1.4 6 0.2Hydrocarbons 2.9 6 0.1 6.5 6 0.4
The results are mean values of n = 6 determinations 6 standarddeviation.
Table 1. Yield and chemical characteristics of pine nut oils.
Cold-pressed oil Hexane-extracted oil
Yield [%DM] 32.0 6 2.9 63.6 6 3.3Peroxide value [mM O2/kg of oil] 0.51 6 0.02 0.13 6 0.02Total FFA [mg KOH/g of oil] 2.40 6 0.01 0.52 6 0.01Iodine value [mM I2/g of oil] 85.0 6 0.6 85.0 6 0.7Total phenolics [mg of catechin equivalents/g of oil] 9.5 6 0.9 3.4 6 0.5
DM, dry mass; FFA, free fatty acid.The results are mean values of n = 6 determinations 6 standard deviation.
© 2009 WILEY-VCH Verlag GmbH & Co. KGaA, Weinheim www.ejlst.com
Eur. J. Lipid Sci. Technol. 2009, 111, 698–704 Pinus sibirica nut oils 701
molecular structures of components present in these lipidfractions. The composition of polar lipids was not investigateddue to insufficient amount of sample.
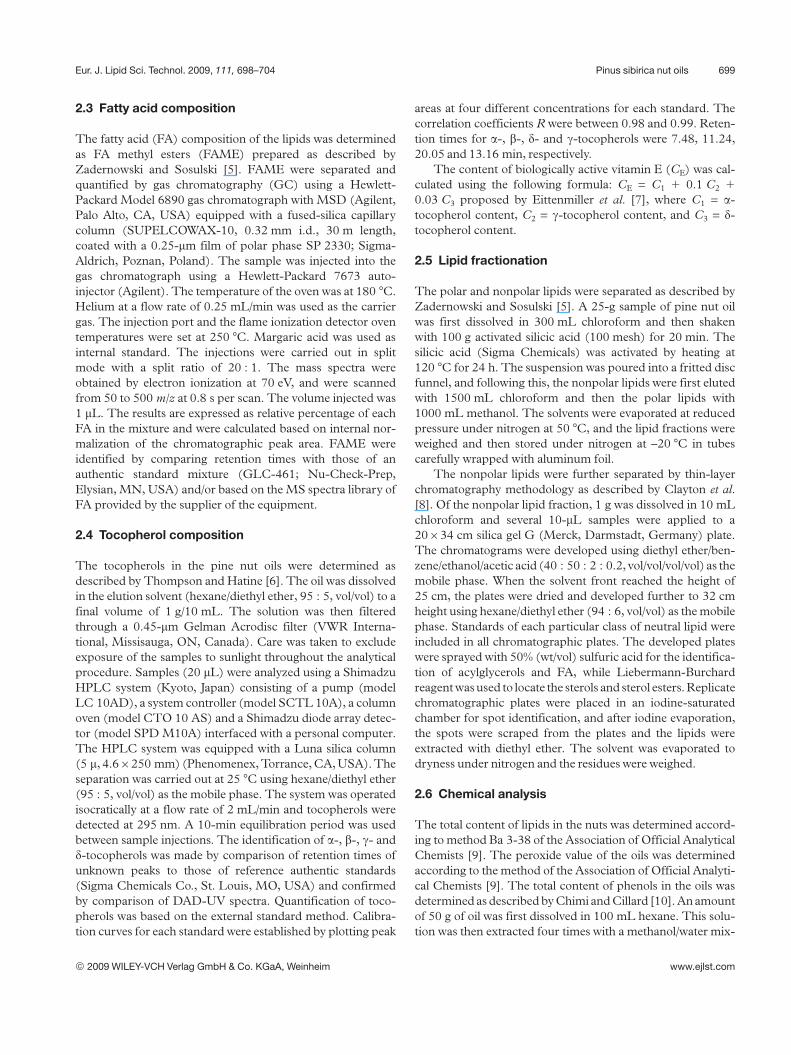
Table 3 summarizes the content of tocopherols in pine nutoils. The total tocopherol contents in the pressed and hexane-extracted oils were 49.6 and 46.6 mg/100 g of oil. Only a- andg-tocopherols were detected in significant quantities in thepine nut oils. a-Tocopherol comprised 53.8 and 53.6% of thetotal tocopherols, while g-tocopherol amounted to 44.4 and44.7% of the total tocopherols in pressed and hexane-extract-ed oils, respectively. The distribution of tocopherols in pinenut oils differs from that reported for sea buckthorn berries
[19], poppy seed [20], flaxseed [21], olive oil [22], and sun-flower seed [23]. The content of biologically active vitamin Eranged from 27.1 to 28.9 mg/100 g of oil for the hexane-extracted and pressed oils, respectively.
Figure 1 shows a typical GC chromatogram of FAME ofpine nut (P. sibirica) oil. Eleven FA were identified using bothauthentic FA standards and/or MS spectra of FA from thelibrary. Sykes and Caple [24] identified only four FA in the oilfrom P. edulis seeds. On the other hand, Wolff and Bayard [1]identified 14 FA in seven species of Pinus; Asset et al. [25]tentatively identified 13 FA in P. pinaster nut oil. Recently,Nergiz and Dönmez [4] detected 12 FA in P. pinea seed oil.
Table 3. Tocopherol and vitamin E contents (mg per 100 g of oil) in pine nut oils.
Oil Tocopherols
a g d Total Vitamin E
Cold-pressed 26.7 6 4.5 22.0 6 3.5 0.9 6 0.0 49.6 6 2.4 28.9Hexane-extracted 25.0 6 3.9 20.2 6 2.5 1.5 6 0.2 46.6 6 4.2 27.1
The results are mean values of n = 12 determinations 6 standard deviation.
Figure 1. GC chromatogram of FAME of pine nut(P. sibirica) oil. (1) Hexadecanoic acid methyl ester,(2) octadecanoic acid methyl ester, (3) 9-octadecenoicacid methyl ester, (4) 9,12-octadecadienoic acidmethyl ester, (5) 10,13-octadecadienoic acid methylester, (6) 9,12,15-octadecatrienoic acid methyl ester,(7) 6-tridecenoic acid 13-(2-cyclopenten-1-yl) methylester (gorlic acid methyl ester), (8) eicosanoic acidmethyl ester, (9) eicosenoic acid methyl ester,(10) 11,13-eicosadienoic acid methyl ester.
© 2009 WILEY-VCH Verlag GmbH & Co. KGaA, Weinheim www.ejlst.com
702 R. Zadernowski et al. Eur. J. Lipid Sci. Technol. 2009, 111, 698–704
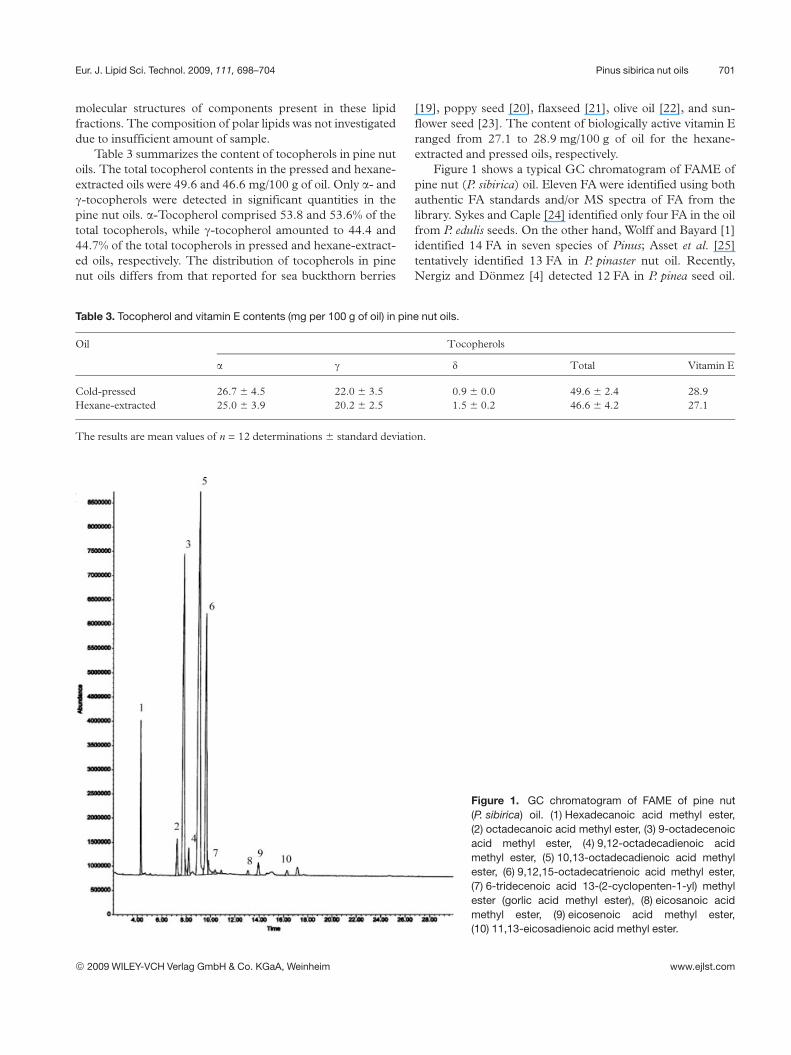
Figure 2. Mass spectrum of 10,13-octade-cadienoic acid methyl ester (A) and its cor-responding mass spectrum found in the MSspectra library (B).
Figure 3. Mass spectrum of 6-tridecenoic acid13-(2-cyclopenten-1-yl) methyl ester (gorlicacid methyl ester) (A) and its correspondingmass spectrum found in the MS spectralibrary (B).
© 2009 WILEY-VCH Verlag GmbH & Co. KGaA, Weinheim www.ejlst.com

Eur. J. Lipid Sci. Technol. 2009, 111, 698–704 Pinus sibirica nut oils 703
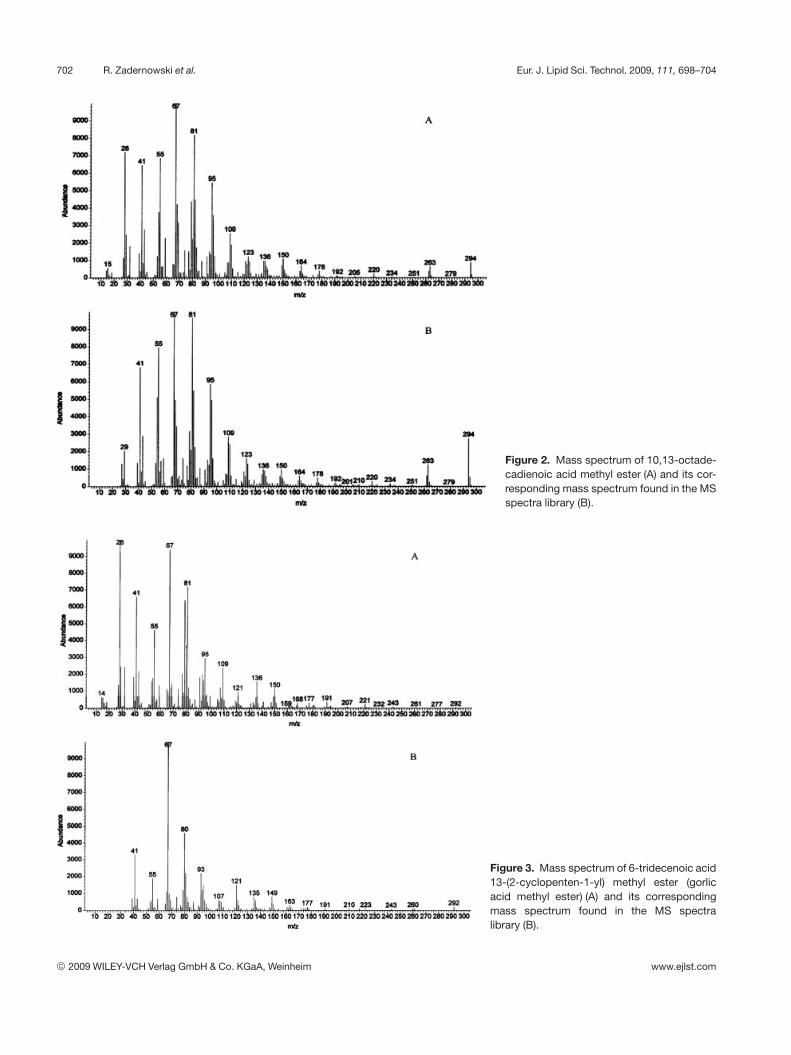
Figure 4. Mass spectrum of 11,13-eicosadie-noic acid methyl ester (A) and its correspond-ing mass spectrum found in the MS spectralibrary (B).
These authors did not report any presence of unusual D5 ole-finic acids, but identified myristic (14:0) and lignoceric (24:0)acids. Of these, 14:0, 17:0, 24:0 and four unusual D5 olefinicacids identified by these authors were not found in P. sibiricanut oils. However, three other unusual FA, namely 10,13-octadecadienoic acid (18:2), gorlic acid (13-Cp 6c-13:1) and11,13-eicosadienoic acid (20:2), were tentatively identifiedhere. The mass spectra of the methyl esters of these FA as wellas their corresponding mass spectra found in the MS spectralibrary are shown in Figs. 2, 3 and 4. It should be noted thatthe presence of gorlic acid has been previously reported in theseed oil of the genus Hydnocarpus (Flacourtiaceae) [26–31].
The FA distribution of the P. sibirica nut oils is shown inTable 4. The unsaturated FA amounted to over 90% of thetotal lipids. This value is in good agreement with that reportedfor P. pinaster nut oil [25] as well as with those published byNasri et al. [16] for two Tunisians pine seed oils and by Wolffand Bayard [1] for seven species of Pinus. The poly-unsaturated FA (PUFA) are the predominant FA in P. sibiricanut oils and accounted for 66% of the total lipids. The PUFAwere dominated by the n-2 FA, which amounted to 46% of thetotal lipids and to 69% of the total PUFA. These values aresomewhat lower than those reported for Pinus pinaster nut oil[25]. Palmitic (16:0) and stearic acid (18:0) were the majorsaturated FA, while 18:1 was the major monounsaturated FA.This is in good agreement with data reported by other authors[1, 16, 25]. PUFA were dominated by 18:2 and 18:3 FA.
Table 4. FA composition of pine nut oils (wt-%).
Cold-pressed oil Hexane-extracted oil
16:0 4.81 6 0.25 4.08 6 0.2516:1 0.14 6 0.00 0.08 6 0.0018:0 2.77 6 0.09 2.78 6 0.3018:1 24.70 6 1.55 24.82 6 1.9618:2 46.01 6 2.34 46.41 6 3.9918:3 19.23 6 2.55 19.28 6 0.9920:0 0.37 6 0.00 0.41 6 0.0320:1 1.16 6 0.06 1.32 6 0.2020:2 0.55 6 0.09 0.66 6 0.0313-Cp 6c-13:1 0.26 6 0.00 0.15 6 0.00Saturated 7.95 6 0.49 7.27 6 0.45Monounsaturated 26.95 6 3.50 26.22 6 4.10Polyunsaturated 66.04 6 5.95 66.50 6 5.89
The results are mean values of n = 6 determinations 6 standarddeviation.
Gorlic acid, as well as 20:0, 16:1, 20:1 and 20:2, were minorFA found in P. sibirica nut oils.
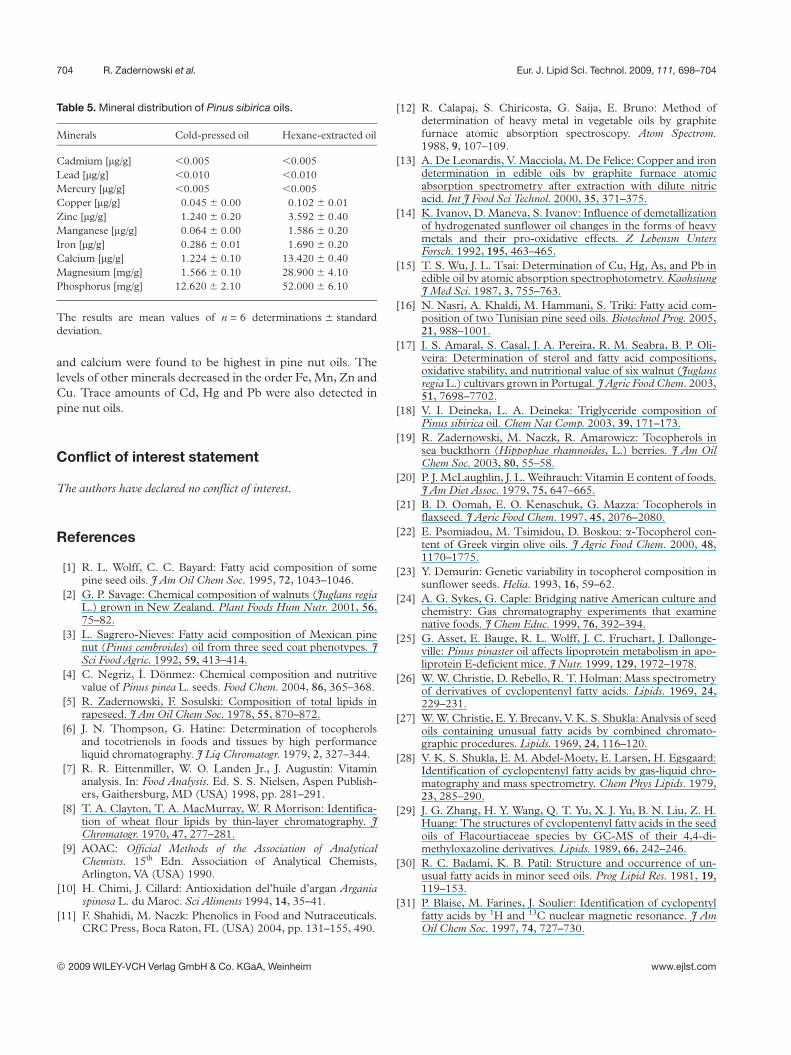
Table 5 summarizes the mineral distribution of pine nutoils. Higher levels of elements were detected in the hexane-extracted oil than in the cold-pressed oil. However, the con-tent of minerals in the oils, except for phosphorus, is muchlower than that reported for Pinus pinea seeds [4]. It shouldalso be noted that the amounts of phosphorus, magnesium
© 2009 WILEY-VCH Verlag GmbH & Co. KGaA, Weinheim www.ejlst.com
704 R. Zadernowski et al. Eur. J. Lipid Sci. Technol. 2009, 111, 698–704
Table 5. Mineral distribution of Pinus sibirica oils.
Minerals Cold-pressed oil Hexane-extracted oil
Cadmium [mg/g] ,0.005 ,0.005Lead [mg/g] ,0.010 ,0.010Mercury [mg/g] ,0.005 ,0.005Copper [mg/g] 0.045 6 0.00 0.102 6 0.01Zinc [mg/g] 1.240 6 0.20 3.592 6 0.40Manganese [mg/g] 0.064 6 0.00 1.586 6 0.20Iron [mg/g] 0.286 6 0.01 1.690 6 0.20Calcium [mg/g] 1.224 6 0.10 13.420 6 0.40Magnesium [mg/g] 1.566 6 0.10 28.900 6 4.10Phosphorus [mg/g] 12.620 6 2.10 52.000 6 6.10
The results are mean values of n = 6 determinations 6 standarddeviation.
and calcium were found to be highest in pine nut oils. Thelevels of other minerals decreased in the order Fe, Mn, Zn andCu. Trace amounts of Cd, Hg and Pb were also detected inpine nut oils.
Conflict of interest statement
The authors have declared no conflict of interest.
References
[1] R. L. Wolff, C. C. Bayard: Fatty acid composition of somepine seed oils. J Am Oil Chem Soc. 1995, 72, 1043–1046.
[2] G. P. Savage: Chemical composition of walnuts (Juglans regiaL.) grown in New Zealand. Plant Foods Hum Nutr. 2001, 56,75–82.
[3] L. Sagrero-Nieves: Fatty acid composition of Mexican pinenut (Pinus cembroides) oil from three seed coat phenotypes. JSci Food Agric. 1992, 59, 413–414.
[4] C. Negriz, I. Dönmez: Chemical composition and nutritivevalue of Pinus pinea L. seeds. Food Chem. 2004, 86, 365–368.
[5] R. Zadernowski, F. Sosulski: Composition of total lipids inrapeseed. J Am Oil Chem Soc. 1978, 55, 870–872.
[6] J. N. Thompson, G. Hatine: Determination of tocopherolsand tocotrienols in foods and tissues by high performanceliquid chromatography. J Liq Chromatogr. 1979, 2, 327–344.
[7] R. R. Eittenmiller, W. O. Landen Jr., J. Augustin: Vitaminanalysis. In: Food Analysis. Ed. S. S. Nielsen, Aspen Publish-ers, Gaithersburg, MD (USA) 1998, pp. 281–291.
[8] T. A. Clayton, T. A. MacMurray, W. R Morrison: Identifica-tion of wheat flour lipids by thin-layer chromatography. JChromatogr. 1970, 47, 277–281.
[9] AOAC: Official Methods of the Association of AnalyticalChemists. 15th Edn. Association of Analytical Chemists,Arlington, VA (USA) 1990.
[10] H. Chimi, J. Cillard: Antioxidation del’huile d’argan Arganiaspinosa L. du Maroc. Sci Aliments 1994, 14, 35–41.
[11] F. Shahidi, M. Naczk: Phenolics in Food and Nutraceuticals.CRC Press, Boca Raton, FL (USA) 2004, pp. 131–155, 490.
[12] R. Calapaj, S. Chiricosta, G. Saija, E. Bruno: Method ofdetermination of heavy metal in vegetable oils by graphitefurnace atomic absorption spectroscopy. Atom Spectrom.1988, 9, 107–109.
[13] A. De Leonardis, V. Macciola, M. De Felice: Copper and irondetermination in edible oils by graphite furnace atomicabsorption spectrometry after extraction with dilute nitricacid. Int J Food Sci Technol. 2000, 35, 371–375.
[14] K. Ivanov, D. Maneva, S. Ivanov: Influence of demetallizationof hydrogenated sunflower oil changes in the forms of heavymetals and their pro-oxidative effects. Z Lebensm UntersForsch. 1992, 195, 463–465.
[15] T. S. Wu, J. L. Tsai: Determination of Cu, Hg, As, and Pb inedible oil by atomic absorption spectrophotometry. KaohsiungJ Med Sci. 1987, 3, 755–763.
[16] N. Nasri, A. Khaldi, M. Hammani, S. Triki: Fatty acid com-position of two Tunisian pine seed oils. Biotechnol Prog. 2005,21, 988–1001.
[17] J. S. Amaral, S. Casal, J. A. Pereira, R. M. Seabra, B. P. Oli-veira: Determination of sterol and fatty acid compositions,oxidative stability, and nutritional value of six walnut (Juglansregia L.) cultivars grown in Portugal. J Agric Food Chem. 2003,51, 7698–7702.
[18] V. I. Deineka, L. A. Deineka: Triglyceride composition ofPinus sibirica oil. Chem Nat Comp. 2003, 39, 171–173.
[19] R. Zadernowski, M. Naczk, R. Amarowicz: Tocopherols insea buckthorn (Hippophae rhamnoides, L.) berries. J Am OilChem Soc. 2003, 80, 55–58.
[20] P. J. McLaughlin, J. L. Weihrauch: Vitamin E content of foods.J Am Diet Assoc. 1979, 75, 647–665.
[21] B. D. Oomah, E. O. Kenaschuk, G. Mazza: Tocopherols inflaxseed. J Agric Food Chem. 1997, 45, 2076–2080.
[22] E. Psomiadou, M. Tsimidou, D. Boskou: a-Tocopherol con-tent of Greek virgin olive oils. J Agric Food Chem. 2000, 48,1170–1775.
[23] Y. Demurin: Genetic variability in tocopherol composition insunflower seeds. Helia. 1993, 16, 59–62.
[24] A. G. Sykes, G. Caple: Bridging native American culture andchemistry: Gas chromatography experiments that examinenative foods. J Chem Educ. 1999, 76, 392–394.
[25] G. Asset, E. Bauge, R. L. Wolff, J. C. Fruchart, J. Dallonge-ville: Pinus pinaster oil affects lipoprotein metabolism in apo-liprotein E-deficient mice. J Nutr. 1999, 129, 1972–1978.
[26] W. W. Christie, D. Rebello, R. T. Holman: Mass spectrometryof derivatives of cyclopentenyl fatty acids. Lipids. 1969, 24,229–231.
[27] W. W. Christie, E. Y. Brecany, V. K. S. Shukla: Analysis of seedoils containing unusual fatty acids by combined chromato-graphic procedures. Lipids. 1969, 24, 116–120.
[28] V. K. S. Shukla, E. M. Abdel-Moety, E. Larsen, H. Egsgaard:Identification of cyclopentenyl fatty acids by gas-liquid chro-matography and mass spectrometry. Chem Phys Lipids. 1979,23, 285–290.
[29] J. G. Zhang, H. Y. Wang, Q. T. Yu, X. J. Yu, B. N. Liu, Z. H.Huang: The structures of cyclopentenyl fatty acids in the seedoils of Flacourtiaceae species by GC-MS of their 4,4-di-methyloxazoline derivatives. Lipids. 1989, 66, 242–246.
[30] R. C. Badami, K. B. Patil: Structure and occurrence of un-usual fatty acids in minor seed oils. Prog Lipid Res. 1981, 19,119–153.
[31] P. Blaise, M. Farines, J. Soulier: Identification of cyclopentylfatty acids by 1H and 13C nuclear magnetic resonance. J AmOil Chem Soc. 1997, 74, 727–730.
© 2009 WILEY-VCH Verlag GmbH & Co. KGaA, Weinheim www.ejlst.com