PRODUCCIÓN DE HOJARASCA EN UN RODAL DE Pinus
10
Disponible en: http://www.redalyc.org/articulo.oa?id=62926254012 Red de Revistas Científicas de América Latina, el Caribe, España y Portugal Sistema de Información Científica Reyes-Carrera, Santiago A.; Méndez-González, Jorge; Nájera-Luna, Juan A.; Cerano-Paredes, Julián PRODUCCIÓN DE HOJARASCA EN UN RODAL DE Pinus cembroides Zucc. EN ARTEAGA, COAHUILA, MÉXICO Y SU RELACIÓN CON LAS VARIABLES CLIMÁTICAS Revista Chapingo. Serie Ciencias Forestales y del Ambiente, vol. 19, núm. 1, enero-abril, 2013, pp. 147-155 Universidad Autónoma Chapingo Chapingo, México ¿Cómo citar? Número completo Más información del artículo Página de la revista Revista Chapingo. Serie Ciencias Forestales y del Ambiente, ISSN (Versión impresa): 2007-3828 [email protected] Universidad Autónoma Chapingo México www.redalyc.org Proyecto académico sin fines de lucro, desarrollado bajo la iniciativa de acceso abierto
Transcript of PRODUCCIÓN DE HOJARASCA EN UN RODAL DE Pinus
Disponible en: http://www.redalyc.org/articulo.oa?id=62926254012
Red de Revistas Científicas de América Latina, el Caribe, España y Portugal
Sistema de Información Científica
Reyes-Carrera, Santiago A.; Méndez-González, Jorge; Nájera-Luna, Juan A.; Cerano-Paredes, Julián
PRODUCCIÓN DE HOJARASCA EN UN RODAL DE Pinus cembroides Zucc. EN ARTEAGA, COAHUILA,
MÉXICO Y SU RELACIÓN CON LAS VARIABLES CLIMÁTICAS
Revista Chapingo. Serie Ciencias Forestales y del Ambiente, vol. 19, núm. 1, enero-abril, 2013, pp. 147-155
Universidad Autónoma Chapingo
Chapingo, México
¿Cómo citar? Número completo Más información del artículo Página de la revista
Revista Chapingo. Serie Ciencias Forestales y
del Ambiente,
ISSN (Versión impresa): 2007-3828
Universidad Autónoma Chapingo
México
www.redalyc.orgProyecto académico sin fines de lucro, desarrollado bajo la iniciativa de acceso abierto
PRODUCCIÓN DE HOJARASCA EN UN RODAL DE Pinus cembroides Zucc. EN ARTEAGA, COAHUILA, MÉXICO Y SU RELACIÓN CON LAS VARIABLES CLIMÁTICAS
LITTERFALL PRODUCTION IN A Pinus cembroides ZUCC. STAND, IN ARTEAGA COAHUILA MEXICO AND ITS RELATIONSHIPS TO CLIMATIC VARIABLES
Santiago A. Reyes-Carrera1; Jorge Méndez-González1*; Juan A. Nájera-Luna2; Julián Cerano-Paredes3
1Universidad Autónoma Agraria Antonio Narro. Departamento Forestal. C. P. 25315. Saltillo, Coahuila, México. Correo-e: [email protected] (*Autor para correspondencia).2Instituto Tecnológico de El Salto. Mesa del Tecnológico s/n. El Salto, Pueblo Nuevo, Durango, México. 3INIFAP CENID-RASPA. km 6.5 Canal de Sacramento, Las Huertas. Gómez Palacio, Durango, México.
RESUMEN
La caída de hojarasca constituye la fuente principal de materia orgánica en los ecosistemas te-rrestres. La evaluación de la caída de hojarasca es importante para entender la productividad forestal, pero también proporciona información relevante como indicador fenológico de los efectos del cambio climático. Este estudio se llevó a cabo en un rodal joven de Pinus cembroides
Zucc. en la sierra de Arteaga, Coahuila, México. La hojarasca fue colectada mensualmente usando 40 colectores (1 m2) ubicados sistemáticamente dentro de una parcela de 1 ha. La prueba no paramétrica de Kruskal-Wallis se utilizó para detectar diferencias significativas entre fechas de colecta. Las relaciones de producción de hojarasca con las variables climáticas se evaluaron mediante análisis de componentes principales y modelos de regresión. La deposición total de hojarasca fue poco más de 1,000 kg·ha-1·año-1, la cual fue dependiente de la temperatura y el viento. Las acículas y ramas constituyeron cerca del 33 y 22 % de la deposición total, respectivamente.
ABSTRACT
Litterfall represents the main source of organic matter in terrestrial ecosystems. The assessment of litterfall production is important to understand the forest productivity, but it also provides important information as phenological indicator of the climate change effects. This study was carried out in a young Pinus cembroides Zucc. stand in La Sierra de Arteaga, Coahuila, Mexico.
Litterfall was collected monthly using 40 traps (1 m2) located systematically on 1-ha plot. The Kruskal-Wallis non parametric test was employed to detect significant differences among sampling dates. The stepwise regression and the principal component analysis were employed to evaluate the relationships of litterfall to climatic variables. Total annual litterfall was over 1000 kg.ha-1.year-1, which was dependent on temperature and wind. Needles and branches comprised about 33 and 22 % of the total litterfall.
Recibido: 23 de enero de 2012Aceptado: 21 de febrero de 2013doi: 10.5154/r.rchscfa.2012.01.006http://www.chapingo.mx/revistas
PALABRAS CLAVE: Deposi-ción, materia orgánica, pino piñonero, temperatura.
KEYWORDS: Litterfall, organic matter, pinyon pine, temperature.

Producción de hojarasca... Reyes-Carrera et al.
148
INTRODUCCIÓN
La hojarasca se integra de materiales provenientes de los estratos aéreos de la vegetación que se deposita sobre el suelo, incluyendo residuos orgánicos de plantas como ho-jas, ramas, frutos e inflorescencias (Bosco, Blanco, & Cas-tillo, 2004; Prause, Arce, De Caram, & Angeloni, 2003). La caída de hojarasca es importante ya que pone el sistema suelo-planta en relación funcional (Belmonte, Romero & López, 1998); es un proceso relacionado con la trans-ferencia de energía y ciclos biogeoquímicos (Aceñolaza, Zamboni & Gallardo, 2009; Santa Regina & Gallardo, 1989), materia orgánica (Liu et al., 2004) y representa el mayor flujo de nutrientes de la vegetación al suelo (Berg & Meentemeyer, 2001; González et al., 2008; Pérez-Suárez, Arredondo-Moreno, Huber-Sannwald, & Vargas-Hernán-dez, 2009). La hojarasca ha sido utilizada como una me-dida de la productividad primaria neta (Vargas & Varela, 2007), manteniendo la biodiversidad biológica (Carnevale & Lewis, 2001, Zamboni & Aceñolaza, 2004). Diversos es-tudios (Berg & Meentemeyer, 2001; Bosco et al., 2004; Liu et al., 2004) muestran una relación entre la producción de hojarasca y las variables climáticas, principalmente con la temperatura y precipitación, incluso con la humedad rela-tiva (Tanner, 1980).
En México, Pinus cembroides Zucc. se distribuye por casi todo el norte y centro del país (Rzedowski, 2006; Luna, Romero, & García, 2008) ocupando grandes regiones en la Sierra Madre Oriental. La especie es fundamental en la economía local al tener varios usos: postes, ornamento, muebles, piñón, étc., y se usa en reforestaciones por su resistencia a la sequía. Por ende, evaluar la caída de hojarasca representa conocer los procesos que determinan la productividad del ecosistema. El objetivo de la presente investigación fue cuantificar la caída de hojarasca en un bosque de P. cembroides y evaluar su rela-ción con las variables climáticas. La hipótesis nula representa igualdad en la deposición de hojarasca a escala temporal y es independiente de las variables climáticas.
MATERIALES Y MÉTODOS
Características físicas y biológicas del área
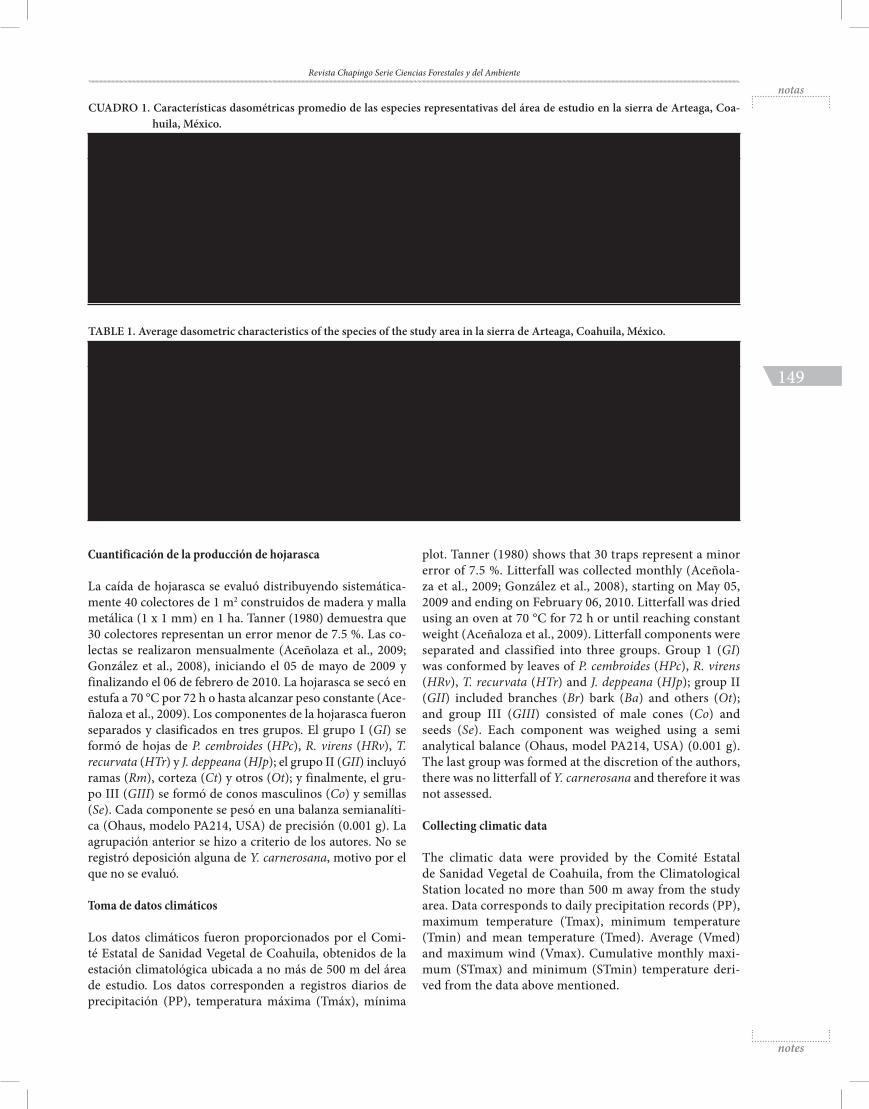
El área de estudio se localiza en la sierra de Arteaga, Coahuila, México (25° 23’ N y 100° 36’ O), inmersa en la Sierra Madre Oriental (Instituto Nacional de Estadística Geografía e Informática [INEGI], 2001), a una altitud de 2,270 m; pendiente de 25 % y exposición oeste. El clima es templado con temperatura media de 13.6 °C (enero, 8.3 °C; julio, 25.8 °C) y precipitación anual de 521.2 mm (Comi-sión Nacional del Agua [CONAGUA], 2000). El suelo es de tipo Litosol con capas de 10 a 15 cm de profundidad. La vegetación está representada por P. cembroides de 59 años de edad y otras especies (Rhus virens, Juniperus deppeana, Tillansia recurvata y Yucca carnerosana) que constituyen el estrato inferior del bosque (Cuadro 1).
INTRODUCTION
Litterfall consist of materials from plant air strata deposi-ted on the ground, including plant organic residues such as leaves, branches, fruits and inflorescences (Bosco, Blan-co, & Castillo, 2004; Prause, Arce, De Caram, & Angeloni, 2003). Litterfall is important because it sets the soil-plant system in functional relationship (Belmonte, Romero & Ló-pez, 1998); this process is related to the transfer of energy and biogeochemical cycles (Aceñolaza, Zamboni & Gallar-do, 2009; Santa Regina & Gallardo, 1989), organic matter (Liu et al., 2004) and represents the greatest flow of plant nutrients to soil (Berg & Meentemeyer, 2001; González et al., 2008; Pérez-Suárez, Arredondo-Moreno, Huber-Sann-wald, & Vargas-Hernández, 2009). Litterfall has been used as a measure of the net primary productivity (Vargas & Va-rela, 2007), maintaining the biological biodiversity (Carne-vale & Lewis, 2001, Zamboni & Aceñolaza, 2004). Several studies (Berg & Meentemeyer, 2001; Bosco et al., 2004; Liu et al., 2004) show a relationship between the production of litterfall and the climatic variables, mainly temperature and precipitation, including relative humidity (Tanner, 1980).
Pinus cembroides Zucc. is found for almost all of Northern and Central México (Rzedowski, 2006; Luna, Romero, & García, 2008), being on large areas of La Sierra Orien-tal. This species is important to the local economy due to its several uses as poles, ornaments, furniture, stone pine cone, etc., and it is used in reforestation due to its drought resistance. Thus, evaluating litterfall means to know the processes that determine the productivity of the ecosystem. The aim of the present study was to quantify litterfall in a P. cembroides forest and to evaluate its relation to climatic va-riables. The null hypothesis is equal to litterfall at temporal scale and is independent from the climatic variables.
MATERIALS AND METHODS
Physical and biological characteristics of the area
The study area is located in La Sierra de Arteaga, Coahuila, Mexico (25° 23’ N y 100° 36’ W), immersed in La Sierra Ma-dre Oriental (Instituto Nacional de Estadística Geografía e Informática [INEGI], 2001), at an altitude of 2,270 m; 25 % slope and West exposure. The weather is temperate with an average temperature of 13.6 °C (January, 8.3 °C; July, 25.8 °C) and annual precipitation of 521.2 mm (Comisión Nacional del Agua [CONAGUA], 2000). The soil type is Litosol with layers of 10 to 15 cm deep. The vegetation is represented by 59-year-old P. cembroides and other species (Rhus virens, Ju-niperus deppeana, Tillansia recurvata and Yucca carnerosana) forming the lower strata of the forest (Table 1).
Quantifying litterfall production
Litterfall was evaluated using 40 traps (1 m2) made of wood and wire mesh (1 x 1 mm) located systematically on 1 ha
Revista Chapingo Serie Ciencias Forestales y del Ambiente
149
Cuantificación de la producción de hojarasca
La caída de hojarasca se evaluó distribuyendo sistemática-mente 40 colectores de 1 m2 construidos de madera y malla metálica (1 x 1 mm) en 1 ha. Tanner (1980) demuestra que 30 colectores representan un error menor de 7.5 %. Las co-lectas se realizaron mensualmente (Aceñolaza et al., 2009; González et al., 2008), iniciando el 05 de mayo de 2009 y finalizando el 06 de febrero de 2010. La hojarasca se secó en estufa a 70 °C por 72 h o hasta alcanzar peso constante (Ace-ñaloza et al., 2009). Los componentes de la hojarasca fueron separados y clasificados en tres grupos. El grupo I (GI) se formó de hojas de P. cembroides (HPc), R. virens (HRv), T. recurvata (HTr) y J. deppeana (HJp); el grupo II (GII) incluyó ramas (Rm), corteza (Ct) y otros (Ot); y finalmente, el gru-po III (GIII) se formó de conos masculinos (Co) y semillas (Se). Cada componente se pesó en una balanza semianalíti-ca (Ohaus, modelo PA214, USA) de precisión (0.001 g). La agrupación anterior se hizo a criterio de los autores. No se registró deposición alguna de Y. carnerosana, motivo por el que no se evaluó.
Toma de datos climáticos
Los datos climáticos fueron proporcionados por el Comi-té Estatal de Sanidad Vegetal de Coahuila, obtenidos de la estación climatológica ubicada a no más de 500 m del área de estudio. Los datos corresponden a registros diarios de precipitación (PP), temperatura máxima (Tmáx), mínima
plot. Tanner (1980) shows that 30 traps represent a minor error of 7.5 %. Litterfall was collected monthly (Aceñola-za et al., 2009; González et al., 2008), starting on May 05, 2009 and ending on February 06, 2010. Litterfall was dried using an oven at 70 °C for 72 h or until reaching constant weight (Aceñaloza et al., 2009). Litterfall components were separated and classified into three groups. Group 1 (GI) was conformed by leaves of P. cembroides (HPc), R. virens (HRv), T. recurvata (HTr) and J. deppeana (HJp); group II (GII) included branches (Br) bark (Ba) and others (Ot); and group III (GIII) consisted of male cones (Co) and seeds (Se). Each component was weighed using a semi analytical balance (Ohaus, model PA214, USA) (0.001 g). The last group was formed at the discretion of the authors, there was no litterfall of Y. carnerosana and therefore it was not assessed.
Collecting climatic data
The climatic data were provided by the Comité Estatal de Sanidad Vegetal de Coahuila, from the Climatological Station located no more than 500 m away from the study area. Data corresponds to daily precipitation records (PP), maximum temperature (Tmax), minimum temperature (Tmin) and mean temperature (Tmed). Average (Vmed) and maximum wind (Vmax). Cumulative monthly maxi-mum (STmax) and minimum (STmin) temperature deri-ved from the data above mentioned.
CUADRO 1. Características dasométricas promedio de las especies representativas del área de estudio en la sierra de Arteaga, Coa-huila, México.
Variable Pinus cembroides Yucca carnerosana Rhus virens Juniperus deppeana
Altura (m) 5.78 1.15 2.39 4.55
Altura a la primera rama (m) 2.10 0.55 0.52 1.50
Diámetro normal (cm) 25.23 31.13 3.30 18.50
Diámetro de copa (m) 4.22 0.94 2.95 3.12
Longitud de copa (m) 3.68 0.60 1.89 3.05
Cobertura del área (%) 45.13 9.07 16.54 29.26
Densidad (árboles·ha-1) 685.00 285.00 140.00 20.00
TABLE 1. Average dasometric characteristics of the species of the study area in la sierra de Arteaga, Coahuila, México.
Variable Pinus cembroides Yucca carnerosana Rhus virens Juniperus deppeana
Height (m) 5.78 1.15 2.39 4.55
Height to first branch (m) 2.10 0.55 0.52 1.50
Diameter at breast height (cm) 25.23 31.13 3.30 18.50
Crown diameter (m) 4.22 0.94 2.95 3.12
Crown length (m) 3.68 0.60 1.89 3.05
Coverage of the area (%) 45.13 9.07 16.54 29.26
Density (trees·ha-1) 685.00 285.00 140.00 20.00

Producción de hojarasca... Reyes-Carrera et al.
150
(Tmín) y media (Tmed), velocidad media (Vmed) y máxi-ma del viento (Vmáx). De los datos anteriores se derivaron la temperatura máxima mensual acumulada (STmáx) y mí-nima (STmín).
Análisis estadístico
La deposición mensual de hojarasca (g·m-2) fue sometida a un análisis de varianza mediante la prueba no paramétri-ca de Kruskal-Wallis (KW) (Aceñaloza, 2009; González et al., 2008), calculando el estadístico de contraste H’ (95 %) y realizando pruebas de medias (P = 0.05) a los rangos de KW. La relación clima-hojarasca se evaluó mediante análi-sis de componentes principales (ACP) aplicado a la matriz estandarizada de las variables. Los modelos de regresión para estimar la caída de hojarasca en función de las varia-bles climáticas se generaron con el procedimiento Stepwise de SAS, v. 9.1 (Statistical Analysis System [SAS], 1989).
RESULTADOS Y DISCUSIÓN
Producción de hojarasca por componente
La deposición promedio mensual de hojarasca fue de 0.95 ± 0.49 g·m-2, representando en total 858.35 kg·ha-1 (aproximadamente 1,000 kg·ha-1·año-1). En el Cuadro 2A se observa que el componente HPc aportó en promedio 2.91 g·m-2 (290.70 kg·ha-1), Rm contribuyó con 1.92 g·m-2 (192.23 kg·ha-1) y elementos no identificados (Ot) registraron 1.13 g·m-2 (112.95 kg·ha-1), el resto (262.48 kg·ha-1) estuvo formado por Se con 0.05 g·m-2 (4.84 kg·ha-1). HPc contribuyó con 33.9 % de la hojarasca total, Rm y Ot con 22.4 y 13.2 %, respectivamente, representando casi el 70 % de la deposición total. En plantaciones de P. cembroides, pero con diferente dasometría, Gutiérrez, Méndez, Flores, Ramírez, y Gutiérrez (2012) reportaron 2.71 ± 6.01 g·m-2·mes-1 de hojas, ramas y
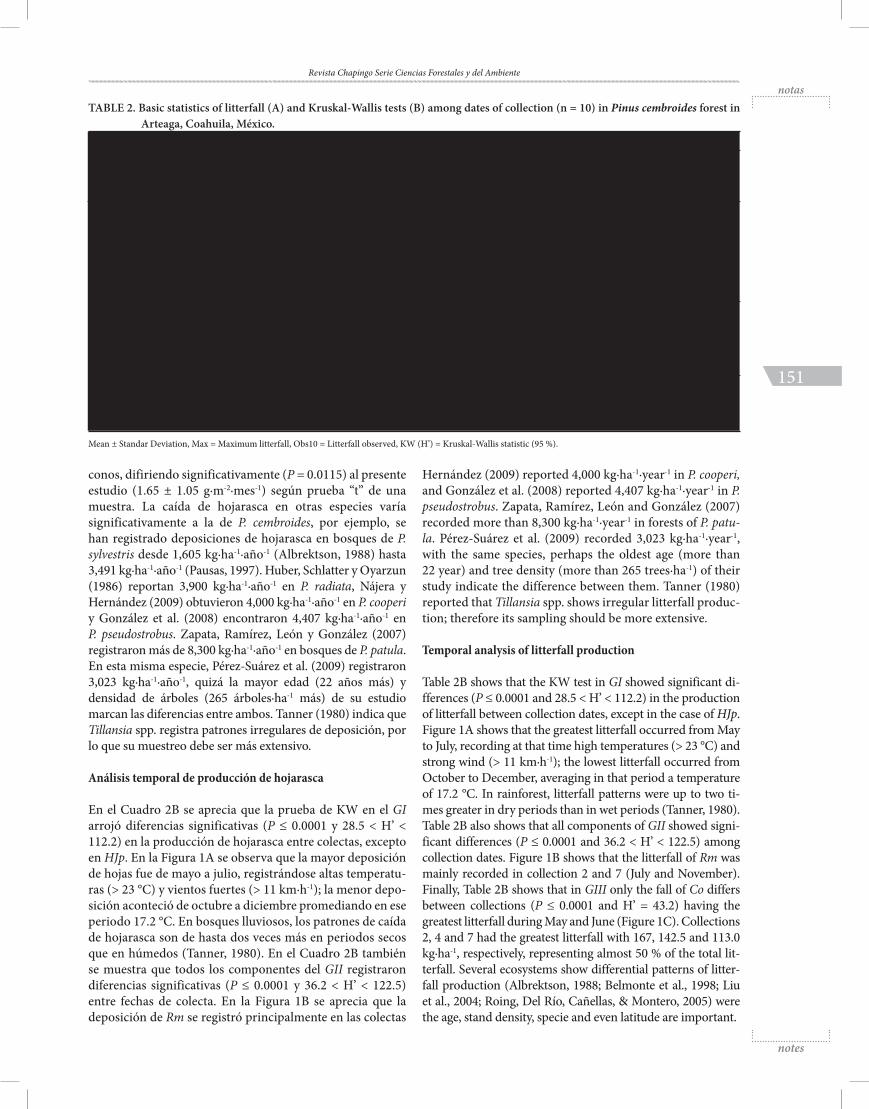
CUADRO 2. Estadísticos básicos de la deposición de hojarasca (A) y pruebas de Kruskal-Wallis (B) entre fechas de colecta (n = 10) en un bosque de Pinus cembroides en Arteaga, Coahuila, México.
A) Estadísticos básicos B) Pruebas de KWComponentede hojarasca Media
(g·m-2·mes-1) Máx
(g·m2·mes-1)Obs10
(kg·ha-1·mes-1)Hojarasca
(%)KW (H’)
Valor P
Gru
po I
HPc 2.91 ± 1.45 13.84 290.70 33.87 112.20 < 0.0001
HRv 0.80 ± 0.59 28.11 80.44 9.37 36.51 < 0.0001
HTr 0.90 ± 0.52 26.89 89.77 10.46 28.53 0.0008
HJp 0.08 ± 0.16 21.26 - 0.91 3.05 0.9624
Gru
po II
Rm 1.92 ± 1.71 32.56 192.23 22.40 122.50 < 0.0001
Ct 0.66 ± 0.61 19.56 65.87 7.67 36.24 < 0.0001
Ot 1.13 ± 0.69 24.97 112.95 13.16 102.93 < 0.0001
Gru
po II
I
Co 0.14 ± 0.16 5.25 13.80 1.61 43.23 < 0.0001
Se 0.05 ± 0.08 7.79 4.84 0.56 14.31 0.1117
± Desviación estándar, Máx = Deposición máxima, Obs10 = Deposición de hojarasca observada, KW (H’) = Estadístico de Kruskal-Wallis (95 %).
Statistical analysis
Monthly litterfall (g·m-2) was submitted to analysis of varian-ce by means of the Kruskal-Wallis non parametric test (KW) (Aceñaloza, 2009; González et al., 2008), obtaining the sta-tistic of contrast H’ (95 %) and performing mean tests (P = 0.05) at KW ranges. The relationship climate-litterfall was assessed using principal component analysis (PCA) with the standardized matrix of variables. Regression models to estimate litterfall based on the climatic variables were crea-ted using the Stepwise procedure, v. 9.1 (Statistical Analysis System [SAS], 1989).
RESULTS AND DISCUSION
Litterfall production per component
Monthly average litterfall was 0.95 ± 0.49 g·m-2, represen-ting a total of 858.35 kg·ha-1 (about 1,000 kg·ha-1·year-1). Ta-ble 2A shows that the component HPc provide on average 2.91 g·m-2 (290.70 kg·ha-1), Rm contributed with 1.92 g·m-2 (192.23 kg·ha-1) and miscellaneous (Ot) recorded 1.13 g·m-2 (112.95 kg·ha-1), the rest (262.48 kg·ha-1) consisted of Se with 0.05 g·m-2 (4.84 kg·ha-1). HPc provided 33.9 % total litterfall, Rm and Ot with 22.4 and 13.2 %, respectively, representing nearly 70 % of total litterfall. In P. cembroides plantations, but with different forest characteristics, Gutiérrez, Mén-dez, Flores, Ramírez, and Gutiérrez (2012) reported 2.71 ± 6.01 g·m-2·month-1 of leaves, branches and cones, differing significantly (P = 0.0115) to the present study (1.65 ± 1.05 g·m-2·monthy-1) according to the t-test. Litterfall in other species varies significantly from that of P. cembroides, for example, litterfall in forests of P. sylvestris have been recor-ded from 1,605 kg·ha-1·year-1 (Albrektson, 1988) up to 3,491 kg·ha-1·year-1 (Pausas, 1997). Huber, Schlatter and Oyarzun (1986) reported 3,900 kg·ha-1·year-1 in P. radiata, Nájera and
Revista Chapingo Serie Ciencias Forestales y del Ambiente
151
TABLE 2. Basic statistics of litterfall (A) and Kruskal-Wallis tests (B) among dates of collection (n = 10) in Pinus cembroides forest in Arteaga, Coahuila, México.
A) Basic statistics B) KW test
Litterfall / component
Mean (g·m-2·month-1)
Max(g·m2·month-1)
Obs10 (kg·ha-1·month-1)
Litterfall (%)
KW (H’)
P value
Gro
up I
HPc 2.91 ± 1.45 13.84 290.70 33.87 112.20 < 0.0001
HRv 0.80 ± 0.59 28.11 80.44 9.37 36.51 < 0.0001
HTr 0.90 ± 0.52 26.89 89.77 10.46 28.53 0.0008
HJp 0.08 ± 0.16 21.26 - 0.91 3.05 0.9624
Gro
up II
Rm 1.92 ± 1.71 32.56 192.23 22.40 122.50 < 0.0001
Ct 0.66 ± 0.61 19.56 65.87 7.67 36.24 < 0.0001
Ot 1.13 ± 0.69 24.97 112.95 13.16 102.93 < 0.0001
Gro
up II
I
Co 0.14 ± 0.16 5.25 13.80 1.61 43.23 < 0.0001
Se 0.05 ± 0.08 7.79 4.84 0.56 14.31 0.1117
Mean ± Standar Deviation, Max = Maximum litterfall, Obs10 = Litterfall observed, KW (H’) = Kruskal-Wallis statistic (95 %).
conos, difiriendo significativamente (P = 0.0115) al presente estudio (1.65 ± 1.05 g·m-2·mes-1) según prueba “t” de una muestra. La caída de hojarasca en otras especies varía significativamente a la de P. cembroides, por ejemplo, se han registrado deposiciones de hojarasca en bosques de P. sylvestris desde 1,605 kg·ha-1·año-1 (Albrektson, 1988) hasta 3,491 kg·ha-1·año-1 (Pausas, 1997). Huber, Schlatter y Oyarzun (1986) reportan 3,900 kg·ha-1·año-1 en P. radiata, Nájera y Hernández (2009) obtuvieron 4,000 kg·ha-1·año-1 en P. cooperi y González et al. (2008) encontraron 4,407 kg·ha-1·año-1 en P. pseudostrobus. Zapata, Ramírez, León y González (2007) registraron más de 8,300 kg·ha-1·año-1 en bosques de P. patula. En esta misma especie, Pérez-Suárez et al. (2009) registraron 3,023 kg·ha-1·año-1, quizá la mayor edad (22 años más) y densidad de árboles (265 árboles·ha-1 más) de su estudio marcan las diferencias entre ambos. Tanner (1980) indica que Tillansia spp. registra patrones irregulares de deposición, por lo que su muestreo debe ser más extensivo.
Análisis temporal de producción de hojarasca
En el Cuadro 2B se aprecia que la prueba de KW en el GI arrojó diferencias significativas (P ≤ 0.0001 y 28.5 < H’ < 112.2) en la producción de hojarasca entre colectas, excepto en HJp. En la Figura 1A se observa que la mayor deposición de hojas fue de mayo a julio, registrándose altas temperatu-ras (> 23 °C) y vientos fuertes (> 11 km·h-1); la menor depo-sición aconteció de octubre a diciembre promediando en ese periodo 17.2 °C. En bosques lluviosos, los patrones de caída de hojarasca son de hasta dos veces más en periodos secos que en húmedos (Tanner, 1980). En el Cuadro 2B también se muestra que todos los componentes del GII registraron diferencias significativas (P ≤ 0.0001 y 36.2 < H’ < 122.5) entre fechas de colecta. En la Figura 1B se aprecia que la deposición de Rm se registró principalmente en las colectas
Hernández (2009) reported 4,000 kg·ha-1·year-1 in P. cooperi, and González et al. (2008) reported 4,407 kg·ha-1·year-1 in P. pseudostrobus. Zapata, Ramírez, León and González (2007) recorded more than 8,300 kg·ha-1·year-1 in forests of P. patu-la. Pérez-Suárez et al. (2009) recorded 3,023 kg·ha-1·year-1, with the same species, perhaps the oldest age (more than 22 year) and tree density (more than 265 trees·ha-1) of their study indicate the difference between them. Tanner (1980) reported that Tillansia spp. shows irregular litterfall produc-tion; therefore its sampling should be more extensive.
Temporal analysis of litterfall production
Table 2B shows that the KW test in GI showed significant di-fferences (P ≤ 0.0001 and 28.5 < H’ < 112.2) in the production of litterfall between collection dates, except in the case of HJp. Figure 1A shows that the greatest litterfall occurred from May to July, recording at that time high temperatures (> 23 °C) and strong wind (> 11 km·h-1); the lowest litterfall occurred from October to December, averaging in that period a temperature of 17.2 °C. In rainforest, litterfall patterns were up to two ti-mes greater in dry periods than in wet periods (Tanner, 1980). Table 2B also shows that all components of GII showed signi-ficant differences (P ≤ 0.0001 and 36.2 < H’ < 122.5) among collection dates. Figure 1B shows that the litterfall of Rm was mainly recorded in collection 2 and 7 (July and November). Finally, Table 2B shows that in GIII only the fall of Co differs between collections (P ≤ 0.0001 and H’ = 43.2) having the greatest litterfall during May and June (Figure 1C). Collections 2, 4 and 7 had the greatest litterfall with 167, 142.5 and 113.0 kg·ha-1, respectively, representing almost 50 % of the total lit-terfall. Several ecosystems show differential patterns of litter-fall production (Albrektson, 1988; Belmonte et al., 1998; Liu et al., 2004; Roing, Del Río, Cañellas, & Montero, 2005) were the age, stand density, specie and even latitude are important.

Producción de hojarasca... Reyes-Carrera et al.
152
2 y 7 (junio y noviembre). Finalmente, en el Cuadro 2B se reporta que en el GIII sólo la caída de Co difiere entre colec-tas (P ≤ 0.0001 y H’ = 43.2) ocurriendo la mayor deposición durante mayo y junio (Figura 1C). Las colectas 2, 4 y 7 re-gistraron la mayor deposición de hojarasca aportando 167, 142.5 y 113.0 kg·ha-1, respectivamente, representando casi 50 % de la deposición total. En varios ecosistemas se eviden-cian patrones diferenciales de producción de hojarasca (Al-brektson, 1988; Belmonte et al., 1998; Liu et al., 2004; Roing, Del Río, Cañellas, & Montero, 2005) siendo determinantes la edad, densidad arbórea, especie, e incluso latitud.
Relación de hojarasca con factores climáticos
Los resultados del ACP indican que el componente 1 expli-ca más del 50 % de la variación total de la hojarasca y el
CP 1 (50.6 %)
-6 -4 -2 0 2 4 6
CP
2 (1
4 %
)
-6
-4
-2
0
2
4
6ColectaHojarascaClima
2
HTr
Ot
Ct
Rm
HRvHPc
Se
Co
3 74
1
5
PPT
STMax
STMin
TMax
VMax
9
810
6
FIGURA 2. Análisis de componentes principales entre variables climáticas en un bosque de Pinus cembroides en Arteaga, Coahuila, México. HPc = Hojas de Pinus cembroides, HRv = Hojas de Rhus virens, HTr = Hojas de Tillansia recurva-ta, HJp = Hojas de Juniperus depeanna, Rm = Ramas, Ct = Corteza, Ot = Otros, Co = Conos, Se = Semillas, STmáx = Temperatura máxima mensual acumulada (°C), Tmáx = Temperatura máxima promedio (°C), STmín = Tempera-tura mínima mensual acumulada (°C), Vmáx = Velocidad máxima del viento (km·h-1), PPT = Precipitación mensual (mm). 1 = mayo, 2 = junio, 3 = julio,…10 = febrero.
FIGURE 2. Principal component analysis among climatic varia-bles in a Pinus cembroides forest in Arteaga, Coahuila, Mexico. HPc = Pinus cembroides needles, HRv = Rhus virens leaves, HTr = Tillansia recurvata leaves, HJp = Juniperus depeanna leaves, Rm = Branches, Ct = Bark, Ot = Others, Co = Cones, Se = seeds, STmax = Cumula-tive monthly maximum temperature (°C), Tmax = Ave-rage maximum temperature (°C), STmin = Cumulative monthly minimum temperature (°C), Vmax = Maximum wind speed (km·h-1), PPT = Monthly precipitation (mm). 1 = May, 2 = June, 3 = July,…10 = February.
Relationship of litterfall to climatic factors
The results of PCA show that the component 1 represents more than 50 % of the total variation of litterfall and com-ponent 2 only 14 %. Figure 2 shows that there is a strong and positive relationship among climate and litterfall com-ponents. Winter collections (8, 9 and 10) showed less litter-fall (HPc, Co and Se) the opposite occurred during summer. Roing et al. (2004) and Pérez et al. (2009) reported greater litterfall production in summer and less in Winter. Table 3 shows the reggression models to quantify litterfall. These models explained from 23.7 (Ct) up to 83.9 % (HTr) of the litterfall. STmin, STmax and Tmax were the variables that explain better the production of litterfall.
The production of HPc and Co responds to the maximum temperatures and wind (Figure 3A and 3F); the produc-tion of Ct and Ot depend on the temperature (Figure 3D
Dep
osic
ión
(g·m
-2)
0
1
2
3
4
5
6HPc HRv HTr HJp
Dep
osic
ión
(g·m
-2)
0
1
2
3
4
5
6
Rm Ct Ot
Fecha de colecta (día/mes/año)
5/5/2009
5/6/2009
8/7/2009
9/8/2009
6/9/2009
9/10/2009
2/11/2009
7/12/2009
6/1/2010
6/2/2010
Dep
osic
ión
(g·m
-2)
0.0
0.2
0.4
0.6
0.8
1.0
Co Se
FIGURA 1. Variación mensual de la deposición de hojarasca (g·m-2) en un bosque de Pinus cembroides en Arteaga, Coahuila, México. HPc = Hojas de Pinus cembroides, HRv = Hojas de Rhus virens, HTr = Hojas de Tillansia recurvata, HJp = Hojas de Juniperus depeanna, Rm = Ra-mas, Ct = Corteza, Ot = Otros, Co = Conos, Se = semillas.
FIGURE 1. Monthly variation of litterfall (g·m-2) in a forest of Pinus cembroides in Arteaga, Coahuila, Mexico. HPc = Pinus cembroides needles, HRv = Rhus virens leaves, HTr = Tillansia recurvata leaves, HJp = Juniperus depeanna leaves, Rm = Branches, Ct = Bark, Ot = Others, Co = Cones, Se = seeds.
Dep
osic
ión
(g∙m
-2) /
Litt
erfa
ll (g
∙m-2)
Fecha de colecta (día/mes/año) / Date (day/month/year)
A)
B)
C)
Dep
osic
ión
(g∙m
-2) /
Litt
erfa
ll (g
∙m-2)
Dep
osic
ión
(g∙m
-2) /
Litt
erfa
ll (g
∙m-2)
CollectionLitterfallClimate

Revista Chapingo Serie Ciencias Forestales y del Ambiente
153
componente 2 sólo el 14 %. En la Figura 2 se puede obser-var que existe una relación positiva y estrecha entre compo-nentes de hojarasca y clima. Las colectas de invierno (8, 9 y 10) mostraron menor deposición de hojarasca (HPc, Co y Se) ocurriendo lo contrario durante el verano. Roing et al. (2004) y Pérez et al. (2009) reportan mayor producción de hojarasca en verano y menor en invierno. En el Cuadro 3 se muestran los modelos de regresión para cuantificar la depo-sición de hojarasca. Éstos explicaron desde 23.7 (Ct) hasta 83.9 % (HTr) de la caída de hojarasca. Las variables que más explican la producción de hojarasca fueron STmin, STmáx y Tmáx.
La producción de HPc y Co responde a la acumulación de las temperaturas máximas y el viento (Figura 3A y 3F); la pro-ducción de Ct y Ot depende de la temperatura (Figura 3D y 3E); y la caída de hojas de R. virens obedece a la temperatura mínima y el viento (Figura 3B). Las ramas de P. cembroides no responden a ninguna variable climática pero se correlacionan con HPc (Figura 3C). Contrario a lo reportado por Vargas y Varela (2007), la lluvia en este ecosistema parece tener poca influencia en la deposición de hojarasca, excepto en HTr. Berg y Meentemeyer (2001) y Liu et al. (2004) demostraron que la producción de hojarasca es dependiente de la tempe-
CUADRO 3. Modelos de regresión para cuantificar la deposición de hojarasca en un bosque de Pinus cembroides en La Sierra de Ar-teaga, Coahuila, México.
Componente (g·m-2)
Modelo β0 β1 β2 R2 Sxy P > F CV
HPc β0 + β1 * STmáx * Vmáx 0.41857 0.00012 - 0.589 0.927 0.005 31.89HRv β0 + β1 * STmín * Vmed 0.28214 0.00038 - 0.331 0.482 0.047 59.91HTr β0 + β1 * LnTmáx + β2 * STmín * PP 9.22373 -2.90792 4.4E-05 0.839 0.208 0.000 23.21Rm β0 + β1 * HPc -0.95194 0.98873 - 0.659 1.001 0.002 52.07Ct β0 + β1 * STmín 0.15771 0.00325 - 0.237 0.533 0.087 80.90Ot β0 + β1 * STmáx * STmín 0.43392 0.00001 - 0.727 0.362 0.001 32.09Co β0 + β1 * Tmáx * Vmed * LnTmáx -0.17358 0.00059 - 0.463 0.119 0.018 86.15
HPc = Hojas de Pinus cembroides, HRv = Hojas de Rhus virens, HTr = Hojas de Tillansia recurvata, HJp = Hojas de Juniperus depeanna, Rm = Ramas, Ct = Corteza, Ot = Otros,
Co = Conos, STmáx = Temperatura máxima mensual acumulada (°C), Tmáx = Temperatura máxima promedio (°C), STmín = Temperatura mínima mensual acumulada (°C),
Vmáx = Velocidad máxima del viento (km·h-1), Vmed = Velocidad media del viento (km·h-1), PP = Precipitación mensual (mm), Ln = Logaritmo natural. β0, β1 y β2 = Parámetros
de regresión, R2 = Coeficiente de determinación, Sxy = Error estándar (g·m-2), CV = Coeficiente de variación (%).
and 3E); and the litterfall of R. virens depends on the mini-mum temperature and wind (Figure 3B). The branches of P. cembroides do not respond to any climatic variable but they correlate to HPc (Figure 3C). This differs to that reported by Vargas and Varela (2007), the rain in this ecosystem seems to have little influence on litterfall, except in the case of HTr. Berg and Meentemeyer (2001) and Liu et al. (2004) showed that litterfall production depends on temperature, precipita-tion and wind. Unlike other studies, litterfall of Rm does not depend on the climate. Pardos (1999) said that the increase of global temperatura may contribute to a significant pro-duction of litterfall. CONCLUSIONS
Total litterfall of P. cembroides in the present study differs in time scales; it is up to three times lower than other species such as P. radiata, P. cooperi and P. pseudostrobus, whose lit-terfall rates are dependent on the species, age, stand, density and site microclimate. The greatest litterfall (leaves and bran-ches) was recorded in the warm season representing 62 % of the total litterfall; the lowest litterfall occurred in winter. This shows that climate directly affects on litterfall production, temperature and wind are the determinant variables.
TABLE 3. Regression models to quantify litterfall in a Pinus cembroides forest in La Sierra de Arteaga, Coahuila, Mexico. Component
(g·m-2)Model β0 β1 β2 R2 Sxy P > F CV
HPc β0 + β1 * STmax * Vmax 0.41857 0.00012 - 0.589 0.927 0.005 31.89HRv β0 + β1 * STmin * Vmed 0.28214 0.00038 - 0.331 0.482 0.047 59.91HTr β0 + β1 * LnTmax + β2 * STmin * PP 9.22373 -2.90792 4.4E-05 0.839 0.208 0.000 23.21Rm β0 + β1 * HPc -0.95194 0.98873 - 0.659 1.001 0.002 52.07Ct β0 + β1 * STmin 0.15771 0.00325 - 0.237 0.533 0.087 80.90Ot β0 + β1 * STmax * STmin 0.43392 0.00001 - 0.727 0.362 0.001 32.09Co β0 + β1 * Tmax * Vmed * LnTmax -0.17358 0.00059 - 0.463 0.119 0.018 86.15
HPc = Pinus cembroides needles, HRv = Rhus virens leaves, HTr = Tillansia recurvata leaves, HJp = Juniperus depeanna leaves, Rm = Branches, Ct = Bark, Ot = Others, Co =
Cones, STmax = Cumulative monthly maximum temperature (°C), Tmax = Average maximum temperature (°C), STmin = Cumulative monthly minimum temperature (°C),
Vmax = Maximum wind speed (km·h-1), Vmed = Mean wind speed (km·h-1), PP = Monthly precipitation (mm), Ln = Natural logarithm. β0, β1 y β2 = Parameters of regression,
R2 = Coefficient of determination, Sxy = Standard error (g·m-2), CV = Coefficient of variation (%).
á

Producción de hojarasca... Reyes-Carrera et al.
154
ACKNOWLEDGMENTS
Project funded by the Universidad Autónoma Agraria An-tonio Narro, No. 02-03-0207-2193. Special Acknowledge-ments to CESAVECO for providing the climatic data.
End of English Version
ratura, precipitación y del viento. A diferencia de otros estu-dios, la deposición de Rm no responde al clima. Pardos (1999) menciona que el incremento de la temperatura global podría contribuir a la producción significativa de la hojarasca.
CONCLUSIONES
La deposición total de hojarasca de P. cembroides en este es-tudio difiere en escalas temporales, es hasta tres veces menor que en otras especies como P. radiata, P. cooperi y P. pseu-dostrobus, cuyas tasas de deposición son dependientes de la especie, edad, densidad arbórea y microclima del sitio. La mayor producción de hojarasca (hojas y ramas) se registró en la época cálida representando 62 % de la deposición total; la menor deposición ocurrió durante el invierno. Lo ante-rior demuestra que el clima influye directamente sobre la producción de hojarasca, siendo la temperatura y el viento las variables determinantes.
AGRADECIMIENTOS
Proyecto financiado por la Universidad Autónoma Agraria Antonio Narro, clave 02-03-0207-2193. Agradecimientos especiales a la CESAVECO por brindar datos climáticos.
FIGURA 3. Relación de producción de la hojarasca y variables climáticas en un bosque de Pinus cembroides en Artea-ga, Coahuila, México. HPc = Hojas de Pinus cembroides, HRv = Hojas de Rhus virens, Rm = Ramas, Ct = Corteza, Ot = Otros, Co = Conos, STmáx = Temperatura máxima mensual acumulada (°C), Tmáx = Temperatura máxima promedio (°C), STmín = Temperatura mínima mensual acumulada (°C), Vmáx = Velocidad máxima del viento (km·h-1), Vmed = Velocidad media del viento (km·h-1).
FIGURE 3. Relationship of litterfall and climatic variables in a Pinus cembroides forest in Arteaga, Coahuila, Mexico. HPc = Pinus cembroides needles, HRv = Rhus virens leaves, Rm = Branches, Ct = Bark, Ot = Others, Co = Cones, STmax = Cumulative monthly maximum tem-perature (°C), Tmax = Average maximum temperature (°C), STmin = Cumulative monthly minimum tempera-ture (°C), Vmax = Maximum wind speed (km·h-1), Vmed = Mean wind speed (km·h-1).
STmax * Vmax (°C·km·h-1)
010000
2000030000
40000
HP
c (g
·m-2
)
0
1
2
3
4
5
6
STmin * Vmed (°C·km·h-1)
0 5001000
15002000
25003000
HR
v (g
·m-2
)
0.0
0.5
1.0
1.5
2.0
2.5
HPc (g·m-2)
0 1 2 3 4 5 6
Rm
(g·m
-2)
0
1
2
3
4
5
6
STmin (°C)
0 50 100 150 200 250 300 350
Ct (
g·m
-2)
0.0
0.5
1.0
1.5
2.0
2.5
STmax * STmin (°C)
0.05.0e+4
1.0e+51.5e+5
2.0e+52.5e+5
Ot (
g·m
-2)
0.0
0.5
1.0
1.5
2.0
2.5
Tmax * Vmed (°C·km·h-1)
0 50 100 150 200 250 300
Co
(g·m
-2)
0.0
0.1
0.2
0.3
0.4
0.5
0.6
REFERENCIAS
Aceñolaza, P. G., Zamboni, L. P., & Gallardo, J. F. (2009). Aporte de hojarasca en bosques del predelta del río Paraná (Argentina). Bosque, 30(3), 135–145. Obtenido de http://www.scielo.cl/pdf/bosque/v30n3/art03.pdf
Albrektson, A. (1988). Needle litterfall in stands of Pinus sylvestris L. in Sweden in relation to site quality, stand age and latitude. Scandinavian Journal of Forest Research, 3, 333–342. Obtenido de http://www.tandfonline.com/doi/abs/10.1080/02827588809382521
Belmonte, S. F., Romero, D. A., & López, B. F. (1998). Producción de hojarasca en especies del matorral mediterráneo y su relación con algunos factores ambientales. Nimbus, 1(2), 5–16. Obtenido de http://dialnet.unirioja.es/servlet/articulo?codigo=199683
Berg, B., & Meentemeyer, V. (2001). Litter fall in some European coniferous forests as dependent on climate: A synthesis. Canadian Journal of Forest Research, 31(2), 292–301. Obtenido de http://www.nrcresearchpress.com/doi/abs/10.1139/x00-172?journalCode=cjfr
Bosco, J. I., Blanco, J. A., & Castillo, F. J. (2004). Gestión forestal y ciclos de nutrientes en el marco del cambio global. In F. Valladares (Ed.), Ecología de bosque mediterráneo en un mundo cambiante (pp. 479–506). Madrid, España: Ministerio del medio ambiente.
Carnevale, N. J., & Lewis, J. P. (2001). Litterfall and organic matter decomposition in a seasonal forest of the eastern Chaco (Argentina). Revista de Biología Tropical, 49(1), 203–212. Obtenido de http://www.scielo.sa.cr/scielo.php?pid=S0034-77442001000100019&script=sci_arttext
Comisión Nacional del Agua (CONAGUA) (2000). Departamento de hidrología operativa, precipitación y temperatura de la Estación Meteorológica de San Antonio de las Alazanas, Arteaga, Coahuila. México: Autor
González, R. H., Cantú, I., Ramírez, G. R., Gómez, M. V., Domínguez, T. G., Bravo, J., & Maiti, R. K. (2008). Spatial and seasonal litterfall deposition pattern in the Tamaulipan thorscrub, Northeastern Mexico. International Journal of Agriculture Environmental and Biotechnology, 1, 177–181.
Gutiérrez, V. M. H., Méndez, G. J., Flores, L. C., Ramírez, D. J. A., & Gutiérrez, V. B. N. (2012). Caída de hojarasca en plantaciones de Pinus greggii Engelm. y Pinus cembroides Zucc., en Coahuila, México. Revista Fitotecnia Mexicana, 35(2), 123–33. Obtenido de http://www.revistafitotecniamexicana.org/documentos/35-2/3a.pdf
Huber, A., Schlatter, J. E., & Oyarzun C. (1986). Aporte en elementos nutritivos por la hojarasca de un bosque adulto
A)
D)
B)
E)
C)
F)
Revista Chapingo Serie Ciencias Forestales y del Ambiente
155
de Pinus radiata. Bosque, 7(2), 59–64. Obtenido de http://mingaonline.uach.cl/pdf/bosque/v7n2/art01.pdf
Instituto Nacional de Estadística Geografía e Informática (INEGI) (2001). Carta topográfica G14 C35 (San Antonio de las Alazanas) Escala 1: 50 000. México, D.F.: Autor.
Liu, C., Westman, C. J., Berg B., Kutsch, W., Wang, G. Z., Man, R., & Ilvesniemi, H. (2004). Variation in litterfall-climate relationships between coniferous and broadleaf forests in Eurasia. Global Ecology and Biogeography, 13(2), 105–114. doi: 10.1111/j.1466-882X.2004.00072.x
Luna, C. M., Romero, M. A., & García, M. E. (2008). Afinidades en la flora genérica de piñonares del norte y centro de México: Un análisis fenético. Revista Mexicana de Biodiversidad, 79(2), 449–458. Obtenido de http://www.ejournal.unam.mx/bio/BIO79-02/BIO079000219.pdf
Nájera, L. J. A., & Hernández, H. E. (2009). Acumulación de biomasa aérea en un bosque coetáneo de la región de El Salto, Durango. Ra Ximhai, 5(2), 225–230. Obtenido de http://redalyc.uaemex.mx/pdf/461/46111507007.pdf
Pardos, J. A. (1999). Ante un cambio climático: Papel de los montes arbolados y los productos forestales en la retención del carbono. Investigaciones Agrarias Sistema de Recursos Forestales, 1, 93–99. Obtenido de http://www.inia.es/gcontrec/pub/06.J.A.PARDOS_1047902288592.pdf
Pausas, J. G. (1997). Litter fall and litter decomposition in Pinus sylvestris forests of the eastern Pyrenees. Journal of Vegetation Science, 8, 643–650. Obtenido de http://www.uv.es/jgpausas/papers/Pausas1997JVS8.pdf
Pérez-Suárez, M., Arredondo-Moreno, J. T., Huber-Sannwald, E., & Vargas-Hernández, J. J. (2009). Production and quality of senesced and green litterfall in a pine–oak forest in central-northwest Mexico. Forest Ecology and Management, 258(7), 1307–1315. doi: 10.1016/j.foreco.2009.06.031
Prause, J., Arce, De Caram G., & Angeloni, P. N. (2003). Variación mensual en el aporte de cuatro especies forestales nativas
del Parque Chaqueño Humado (Argentina). Quebracho, 10, 39–45. Obtenido de http://fcf.unse.edu.ar/archivos/quebracho/q10-04-prause.pdf
Roing, S., Del Río, M., Cañellas I., & Montero, G. (2005). Litter fall in Mediterranean Pinus pinaster Ait. stands under different thinning regimes. Forest Ecology and Management, 206, 179–190. Obtenido de http://www.ecogesfor.org/pdf/Roig2005.pdf
Rzedowski, J. (2006). Vegetación de México (1a ed.). México: Comisión Nacional para el Conocimiento y Uso de la Biodiversidad. http://www.biodiversidad.gob.mx/publicaciones/librosDig/pdf/VegetacionMx_Cont.pdf
Santa Regina, I., & Gallardo, J. F. (1989). Ciclos biogeoquímicos en bosques de la Sierra de Bejar (provincia de Salamanca). Options Méditerranéennes-Série Séminaires, 3, 147–149. Obtenido de http://ressources.ciheam.org/om/pdf/a03/CI000523.pdf
Statistical Analysis System (SAS). (1989). User´s guide: Statistics. Version 9.1. Cary, N. C., USA: SAS Institute Inc.
Tanner, E. V. J. (1980). Litterfall in montane rain forest of Jamaica and its relation to climate. Journal of Ecology, 68(3), 833–848. Obtenido de http://www.jstor.org/stable/2259459
Vargas, P. L., & Varela, A. (2007). Producción de hojarasca de un bosque de niebla en la reserva natural la planada (Nariño, Colombia). Universitas Scientiarum, 12(1), 35–49. Obtenido de http://www.redalyc.org/src/inicio/ArtPdfRed.jsp?iCve=49912103
Zamboni, P., & Aceñolaza, P. (2004). Aporte al conocimiento de ciclos de materia orgánica (MO) en formaciones boscosas de la llanura de inundación del Río Paraná. Área PNPD. INSUGEO, Miscelánea, 12, 161–168. Obtenido de http://insugeo.org.ar/libros/misc_12/pdf/20.pdf
Zapata, D. C. M., Ramírez, J. A., León, P.J. D., & González H. M. I. (2007). Producción de hojarasca fina en bosques altoandinos de Antioquia, Colombia. Revista Facultad Nacional de Agronomía-Medellín, 60(1), 3771–3784. Obtenido de http://redalyc.uaemex.mx/redalyc/pdf/1799/179914076010.pdf