The importance of prey aggregations to the distribution of Brünnich's guillemots in Storfjorden,...
11
Pol:,r Biol (1996) 16:537 547 Springer-Verlag 1996 Fridtjof Mehlum George L. Hunt, Jr. Zygmunt Klusek Mary Beth Decker. Nina Nordlund Thq) importance of prey aggregations to the distribution of Brimnich's guillemots in Storfjorden, Svalbard Received: 9 June 1995/Accepted: 5 January 1996 Absl:ract We studied the influence of the distribution of pre2., and hydrographic fronts on the spatial distribu- tior~ of foraging Brfinnich's guillemots (Uria lomvia) in Storfjorden, southeastern Svalbard in late July 1992. Two large breeding colonies, comprising a total of 540000 individuals, were located adjacent to the study area, and large numbers of Briinnich's gullemots from these colonies foraged within the area, as well as to the sow:h, outside of Storfjorden. Within the study area, mosL guillemots foraged on the west side of the fjord, coir =ident with a weak subsurface front between warm Atlantic water, which penetrated Storfjorden from the soulh, and cold Arctic water. Food samples from the guili[emots collected in the study area contained prim- arily crustaceans (Parathemisto spp. and Thysanoessa iner;'~is) and polar cod Boreogadus saida. Acoustic ob- serwttions of prey were differentiated into two classes of signals, which we interpreted as originating from aggregated and dispersed organisms. The numbers of foraging guillemots were strongly correlated with the strergth of echoes of the aggregated type, whereas correlations with dispersed echoes were consistently wea;:er. The distribution of foraging guillemots showed no significant correlations with either horizontal or vertx=al gradients of physical properties of the water column. Our finding that guillemots respond differently to a~i;gregated and dispersed prey has important impli- cations both for the interpretation of past work on the This is Norwegian Polar Institute Contribution No. 304 F. M,:hlum (~). N. Nordlund Nor~egian Polar Institute, P.O. Box 5072 Majorstua, N-03C 10slo, Norway fax: 4;'-22 95 95 02 E-mail: [email protected] G.L. Hunt. Jr. M.B. Decker Department of Ecology and Evolutionary Biology, University of California, Irvine, CA 92717, USA Z. KI: sek InstitJ:te of Oceanology, Polish Academy of Sciences, Powstankow Warszawy 55, 81-967 Sopot, Poland foraging ecology of marine birds, and for the manage- ment of fisheries. Introduction The Briinnich's guillemot (Uria lomvia) constitutes a major component of the seabird community in waters surrounding the high-arctic archipelago of Svalbard, where about 1.3 million individuals occupy breeding colonies (Mehlum and Bakken 1994). The largest breeding colonies are located in the southeastern part of the archipelago, and nearly half of the breeding population is located in the Storfjorden area (Figs. 1, 2). The two main seabird colonies in Storfjorden are Stel- lingfjellet (77~ 17~ and the adjacent Koval- skifjellet (77~ 17~ (Fig. 2), where the numbers of Briinnich's guillemots have been estimated recently at 450,000 and 90,000 individuals, respectively (Meh- lum and Bakken 1994). During the breeding season, the guillemots in these colonies show a great demand for food, both for feeding themselves and for provisioning their chicks (Mehlum and Gabrielsen 1993). Briinnich's guillemots provision their nestlings almost exclusively with fish, whereas the adults may also consume a large proportion of crustaceans (Bradstreet and Brown 1985; Decker et al. 1995). Little information is available on the foraging ecol- ogy of Brfinnich's guillemots at sea during their breed- ing season. Kinder et al. (1983) and Decker (1995) demonstrated that Briinnich's guillemots were concen- trated at tidal fronts around the Pribilof Islands during summer. They hypothesized that these concentrations were related to an enhanced availability of prey. Schneider et al. (1990) showed that such aggregations occurred where currents interacted with bathymetry to force the pycnocline to the surface, and Coyle et al. (1992) found that guillemots foraged where tidally forced upwelling opposed the downward swimming of euphausiid prey.
Transcript of The importance of prey aggregations to the distribution of Brünnich's guillemots in Storfjorden,...
Pol:,r Biol (1996) 16:537 547 �9 Springer-Verlag 1996
Fridtjof Mehlum �9 George L. Hunt, Jr. Zygmunt Klusek �9 Mary Beth Decker. Nina Nordlund
Thq) importance of prey aggregations to the distribution of Brimnich's guillemots in Storfjorden, Svalbard
Received: 9 June 1995/Accepted: 5 January 1996
Absl:ract We studied the influence of the distribution of pre2., and hydrographic fronts on the spatial distribu- tior~ of foraging Brfinnich's guillemots (Uria lomvia) in Storfjorden, southeastern Svalbard in late July 1992. Two large breeding colonies, comprising a total of 540000 individuals, were located adjacent to the study area, and large numbers of Briinnich's gullemots from these colonies foraged within the area, as well as to the sow:h, outside of Storfjorden. Within the study area, mosL guillemots foraged on the west side of the fjord, coir =ident with a weak subsurface front between warm Atlantic water, which penetrated Storfjorden from the soulh, and cold Arctic water. Food samples from the guili[emots collected in the study area contained prim- arily crustaceans (Parathemisto spp. and Thysanoessa iner;'~is) and polar cod Boreogadus saida. Acoustic ob- serwttions of prey were differentiated into two classes of signals, which we interpreted as originating from aggregated and dispersed organisms. The numbers of foraging guillemots were strongly correlated with the strergth of echoes of the aggregated type, whereas correlations with dispersed echoes were consistently wea;:er. The distribution of foraging guillemots showed no significant correlations with either horizontal or vertx=al gradients of physical properties of the water column. Our finding that guillemots respond differently to a~i;gregated and dispersed prey has important impli- cations both for the interpretation of past work on the
This is Norwegian Polar Institute Contribution No. 304
F. M,:hlum ( ~ ) . N. Nordlund Nor~egian Polar Institute, P.O. Box 5072 Majorstua, N-03C 10slo, Norway fax: 4;'-22 95 95 02 E-mail: [email protected]
G.L. Hunt. Jr. M.B. Decker Department of Ecology and Evolutionary Biology, University of California, Irvine, CA 92717, USA Z. KI: sek InstitJ:te of Oceanology, Polish Academy of Sciences, Powstankow Warszawy 55, 81-967 Sopot, Poland
foraging ecology of marine birds, and for the manage- ment of fisheries.
Introduction
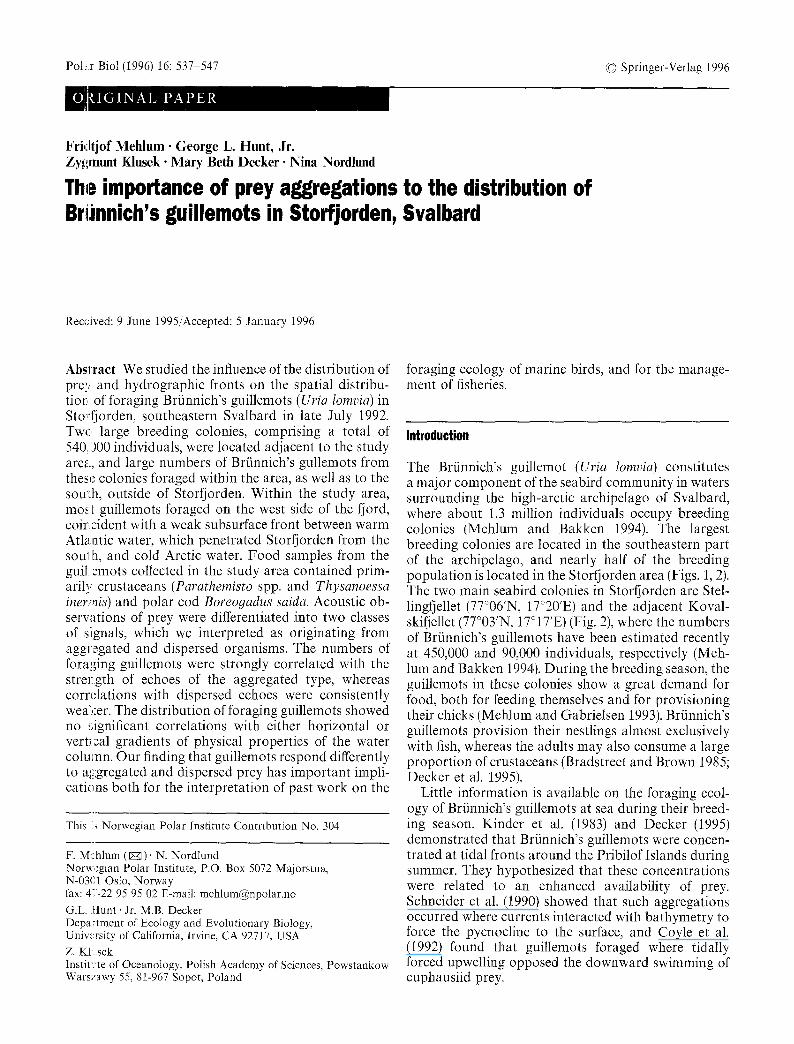
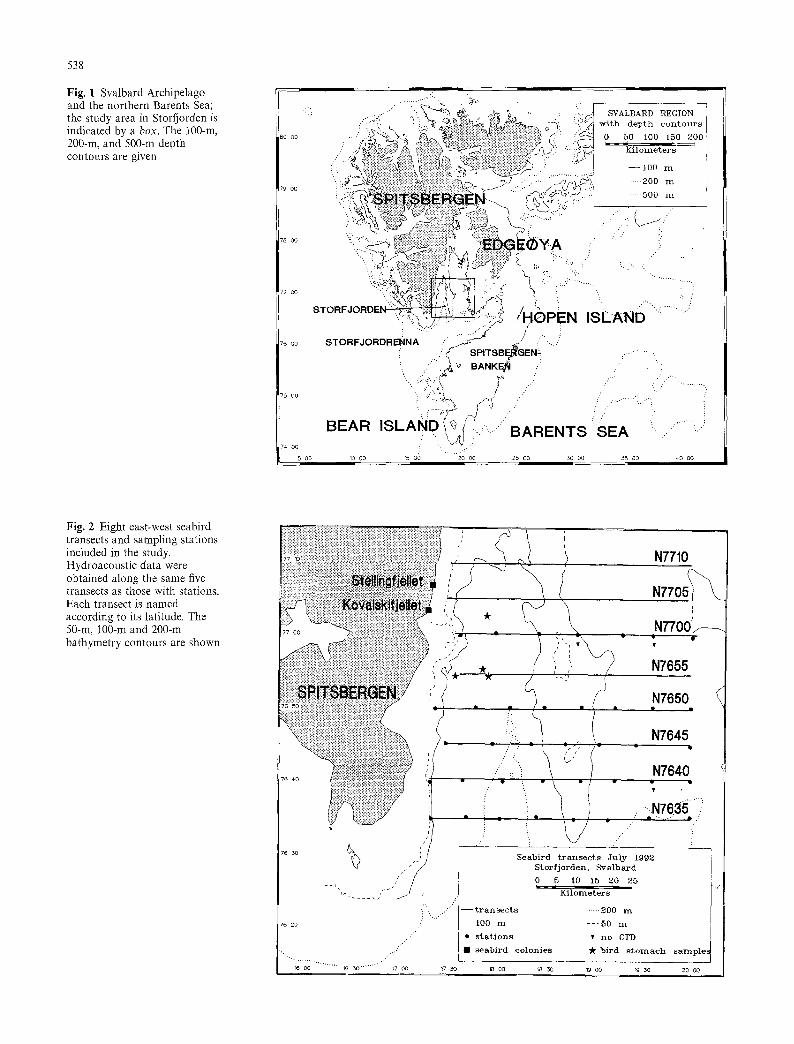
The Briinnich's guillemot (Uria lomvia) constitutes a major component of the seabird community in waters surrounding the high-arctic archipelago of Svalbard, where about 1.3 million individuals occupy breeding colonies (Mehlum and Bakken 1994). The largest breeding colonies are located in the southeastern part of the archipelago, and nearly half of the breeding population is located in the Storfjorden area (Figs. 1, 2). The two main seabird colonies in Storfjorden are Stel- lingfjellet (77~ 17~ and the adjacent Koval- skifjellet (77~ 17~ (Fig. 2), where the numbers of Briinnich's guillemots have been estimated recently at 450,000 and 90,000 individuals, respectively (Meh- lum and Bakken 1994). During the breeding season, the guillemots in these colonies show a great demand for food, both for feeding themselves and for provisioning their chicks (Mehlum and Gabrielsen 1993). Briinnich's guillemots provision their nestlings almost exclusively with fish, whereas the adults may also consume a large proportion of crustaceans (Bradstreet and Brown 1985; Decker et al. 1995).
Little information is available on the foraging ecol- ogy of Brfinnich's guillemots at sea during their breed- ing season. Kinder et al. (1983) and Decker (1995) demonstrated that Briinnich's guillemots were concen- trated at tidal fronts around the Pribilof Islands during summer. They hypothesized that these concentrations were related to an enhanced availability of prey. Schneider et al. (1990) showed that such aggregations occurred where currents interacted with bathymetry to force the pycnocline to the surface, and Coyle et al. (1992) found that guillemots foraged where tidally forced upwelling opposed the downward swimming of euphausiid prey.
538
Fig. 1 Svalbard Archipelago and the northern Barents Sea; the study area in Storfjorden is indicated by a box. The 100-m, 200-m, and 500-m depth contours are given
30 O0
18 O0
77 O0
74 O0
5 O0
. . . . . . . . . . �9 .~::- ,
SVALBARD REGION ~ith depth contours
0 5 0 i00 1 5 0 200
K i l o m e t e r s
- - I00 m
..... 2 0 0 m
.... 5 0 0 m
:-.. : .:
:..... :.,
LAND ' < ............ "
. . . ; ,,,,, ,. , , . . . . . . . . . .
: L.:
: . ,., ".. , :..... ~EA .........
15 00 20 O0 50 oo 35 oo 40 oo
Fig. 2 Eight east-west seabird transects and sampling stations included in the study. Hydroacoustic data were obtained along the same five transects as those with stations. Each transect is named according to its latitude. The 50-m, 100-m and 200-m bathymetry contours are shown
/
- . . . . . z /
' " . . . . . . . . . . . . .
16 O0 . . . . . . . . .
f
' " : . . . . : " "
...,/.'""'"': 16 3o . . . . . . . 17 oo 17 30
N7710
N7705
N7655
I
ii: N7650
N7645
N7640
. .N7635 "] . -., ...
...'" :.
S e a b i r d t r a n s e c t s J u l y 1 9 9 2
S t o r f j o r d e n , S v a l b a r d
0 5 10 15 2 0 2 5
- ~ K i l o m e t e r s ~ i
- - t r a n s e c t s ..... 2 0 0 m
- - 1 0 0 m - - - 5 0 m
�9 s t a t i o n s �9 n o C T D
�9 s e a b i r d c o l o n i e s b i r d s t o m a c h s a m p l e s
18 90 18 30 ~9 O0 19 30 20 O0

539
During the chick-rearing season, the foraging radius of scabirds is constrained by the delivery rate of prey to chkks. Seabirds, however, often travel considerable dis- tances to forage (reviewed by Bradstreet and Brown 198!;). The mechanisms used by seabirds for selecting their foraging area, the types of cues used to locate prey, and the extent to which foraging information is trar fferred between individuals are not known.
hi this paper, at a scale of ~ 10 km we analyzed the dist:ibution and abundance of foraging Briinnich's guillemots in relation to physical oceanography and aco~:tstically determined biomass in Storfjorden. We also sought evidence for physical processes or features in the ocean that might enhance the concentration or avail[ability of prey to guillemots.
Materials and methods
Stud~ area
Storfjorden is a shallow fjord with depths < 180 m (Fig. l). A north- south oriented submarine ridge is located in the western part of the fjord A deeper canyon, Storfjordrenna, is located south of the moul ~ of Storfjorden through which warm Atlantic water penetrates from the west. Further south is a shallow bank, Spitsbergenbanken (or Svalbardbanken). Anderson et al. (t988) and Quadfasel et al. (1988 ~ found three different layers of water in Storfjorden during the sumr~er: (1) relatively warm and low salinity near-surface water, whicl: is influenced by summer warming and melting of ice; (2) warm Atlantic water (at 50 70 m depth); and (3) cold bot tom water. The area is usually completely ice-covered during winter. At the s:art of our study (20 July) there was no sea-ice present in the porti:,n of Storfjorden at which the study took place.
Surw:y design
We s': udied a major foraging area of Briinnich's guillemots exploited by th,: two large breeding colonies of Stellingfjellet and Kovalskifjel- let. Vie selected a grid of latitudinal transects (59-68 km in length) from shallow waters near the eastern coast of Spitsbergen and east'a ard to 20~ at 5' intervals (9 kin) north-south from 76 ~ 35'N to 77 '10'N (Fig. 2). Studies from previous years (F. Mehlum, unpub- lished work) had indicated that few Briinnich's guillemots from the two colonies fly in northern or northeastern directions for foraging; thus, most of our transect lines were selected to the east and south of the colonies. The previous studies also indicated that few guillemots forag~:d east of 20~ All latitudinal transects (8) were surveyed once during the period 20-3t July 1992. We also conducted a transect north'Nard from 76~ 17~ to 78~ 20~ to confirm that t~:w guillemots foraged to the north or northeast of the colonies. Seabirds were registered on all transects; the locations of CTD casts are shown in Fig. 2. Hydroacoustic data were obtained along five of the transects. On transects where hydroacoustic work was done, the ship's speed was reduced from a normal cruising speed of 10 l l knots to 5.0-5.5 knots.
Data =ollection
Birds
The abundance of Briinnich's guillemots observed sitting on the sea surfac: was recorded from the research vessel Lance using standard-
ized transect methods (Tasker et al. 1984). A 300-m standard tran- sect width was used and the presence ofalI birds observed within the transect was registered directly using a computer. Individuals spaced less than 10 m from each other were treated as a group. The com- puter's clock was synchronized with the ship's clock. The ship's geographical position (GPS system) was entered into the field com- puter every 30 rain-1 h during periods with steady course and speed, and otherwise when any changes in speed or direction occurred.
Foraging birds were collected using a shotgun from a small boat. Only 1 of 18 birds examined did not have a brood patch, which indicates that these samples were mainly from breeding individuals. Stomach and esophagus contents were stored in alcohol within 1 h after collection. The food items were identified to the lowest taxon possible. Fish otoliths were measured to the nearest 0.5 ram. Two otoliths that differed less than 0.5 mm in length were considered to be from the same fish. We assmned that unidentified partly digested fish belonged to the same species as otoliths found in tile same bird, if the fish's length was similar to that estimated from otolith length. We used the equation provided by Frost and Lowry (1981) for conversion fi'om otolith length to fish length for polar cod Boreo- gadus saida.
We used the frequency of occurrence and the numerical abundance of different prey taxa in the analysis of the diet (Duffy and Jackson 1986). Frequency of occurrence was determined as the percentage of sampled birds in which the prey type occurred. Numerical abundance was defined as the percentage in numbers of a prey type compared to the total number of identified prey items.
Oceanography
The distance between oceanographic stations was 8-11 km, but in some cases single stations were omitted because of technical prob- lems. Profiles of temperature and salinity as a function of depth were obtained by using an ME-CTD probe (Meerestecknik Electronics). For calibration of the conductivity cell, water samples were collected using a Niskin bottle attached to the wire above the CTD. All water samples were collected at the bot tom of each station. The ME-CTD was equipped with a bot tom alarm and a ca. 290-m wire. At stations shallower than 290 m, data were collected down to about 5 m above the bottom, and at the deeper stations to the end of the wire.
Acoustics
Acoustic data were obtained using a single beam/single frequency echo sounder (LAZ 4700 ELAC) operating at 30 kHz. The trans- ducer with a full beam angle of 16 ~ was mounted inside a V-fin body towed at a depth of 2-3.5 m. The source level and sensitivity of the acoustical system were measured before and after the cruise using a hydrophone (B&K 8100) and a copper calibration sphere. The time interval of ping repetition was 0.56 s and ping duration was usually 0.6 ms. The echo envelope voltages for each ping were converted to digital form at the rate of 3 (or 4) kHz, using 12-bit resolution in real time, and were stored on a hard disk in blocks of 128 pings. Because of imperfections in the hardware TVG (Time- Varied-Gain) function, corrections were made during post-process- ing for the attenuation and spreading losses of sound in the seawater, as well as for nonlinearity of the system. Because we do not know the target strength of the organisms detected by the echo sounder, echo signals are represented as volts 2 only. Estimates of biomass are not essential in this study because we are interested in relative differences in acoustically detected biomass between different parts of transects. During most of the transects the sea was calm (0-1 Beaufort scale), and therefore unwanted noise and excess attenuation of acoustical signals fiom bubbles were low.
Post-processing of echo signals included: filtering out the ship's echo sounder signals, echo type recognition, integration of echo
540
intensity in layers and along the transects, and examination of the statistical properties of signals and space-depth distribution. The sampling window for the quantitative analysis was in the interval 10-50 m depth. The acoustic signals were classified into two groups, dense concentrations of targets (echo type A - aggregated), and dispersed targets (echo type D - dispersed). A simple algorithm for discriminating between the two different type of echoes was de- veloped, based on the dimension and the strength of the echoes. The methods used for removing echoes from the ship's depth sounder, and the algorithm for discriminating between the two types of targets are presented in Appendix 1.
Data analyses
The abundance of Brfinnich's guillemots was represented as the number of birds recorded per kilometer transect length between neighboring CTD stations. We tested the hypothesis that there were no relationships between the abundance of birds along transects and echo return or physical oceanographic gradients.
Spearman Rank correlation coefficients were computed for bird abundance vs echo returns in 10-15, 15-20, 20-25, 25-50, and 10.50 m depth intervals for total echo return, and for type A and type D echoes, separately. In each depth interval, the acoustic data were averaged over the transect interval between two neighboring stations. Bin sizes equalled the distance between neighboring sta- tions (8-11 kin). The significance levels of the correlations were set at P < 0.05.
We also computed Spearman Rank correlation coefficients for both horizontal and vertical gradient strength of temperature and salinity at four depth intervals versus bird abundance, echo type A and echo type D. Horizontal gradients are given as the gradient strength per kilometer distance between neighboring CTD stations along transects at the four depth intervals (10-15, 15-20, 20-25 and 25-50 m). For each depth interval, the gradients were computed by first calculating a regression line through each meter depth value at the actual depth interval for each of two neighboring stations (1 and 2). From these two regression lines, average values of temperature Til and Ti2 or salinity S~1 and S~ 2 for the depth interval at each of the two stations were estimated. Horizontal temperature and salin- ity gradients were calculated using the formulae:
Irll - r i21 IS i l - - S i 2 [ ATHi and A S H i -
d d
where i = depth interval, and d = distance in kin. Vertical gradients between neighboring CTD stations (1 and 2) at
depth interval i are given as the gradient per meter depth using the formula:
(Tla + rib) -- (T2a + Z2b) aTV, = 0.5
b - a
where a = upper and b = lower range of the depth interval, respec- tively. A corresponding formula was used to calculate salinity gradi- ents where salinity values were substituted for temperatures.
Results
Bird transects
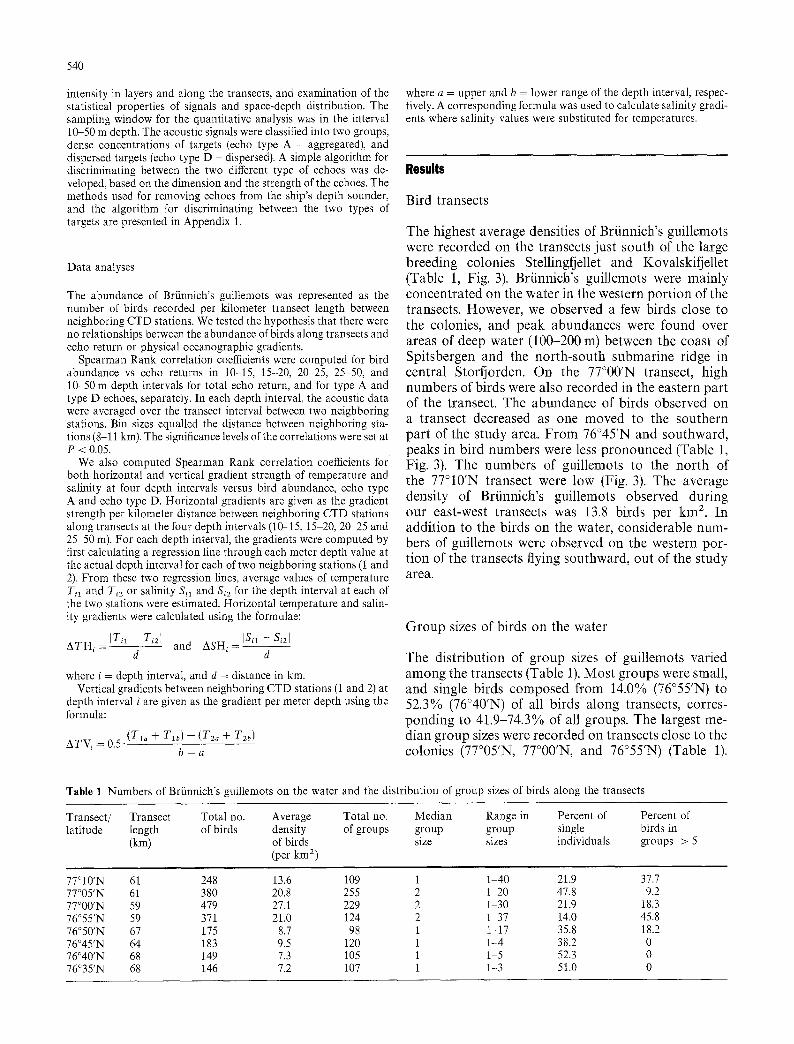
The highest average densities of Briinnich's guillemots were recorded on the transects just south of the large breeding colonies Stellingfjellet and Kovalskifjellet (Table 1, Fig. 3). Briinnich's guillemots were mainly concentrated on the water in the western portion of the transects. However, we observed a few birds close to the colonies, and peak abundances were found over areas of deep water (100-200 m) between the coast of Spitsbergen and the north-south submarine ridge in central Storfjorden. On the 77~ transect, high numbers of birds were also recorded in the eastern part of the transect. The abundance of birds observed on a transect decreased as one moved to the southern part of the study area. From 76~ and southward, peaks in bird numbers were less pronounced (Table 1, Fig. 3). The numbers of guillemots to the north of the 77~ transect were low (Fig. 3). The average density of Briinnich's guillemots observed during our east-west transects was 13.8 birds per km 2. In addiIion to the birds on the water, considerable num- bers of guillemots were observed on the western por- tion of the transects flying southward, out of the study area.
Group sizes of birds on the water
The distribution of group sizes of guillemots varied among the transects (Table 1). Most groups were small, and single birds composed from 14.0% (76~ to 52.3% (76~ of all birds along transects, corres- ponding to 41.9-74.3% of all groups. The largest me- dian group sizes were recorded on transects close to the colonies (77~ 77~ and 76~ (Table 1).
Table 1 Numbers of Brfinnich's guillemots on the water and the distribution of group sizes of birds along the transects
Transect/ Transect Total no. Average Total no. Median Range in Percent of latitude length of birds density of groups group group single
(km) of birds size sizes individuals (per km 2)
Percent of birds in groups > 5
77~ 61 248 13.6 109 1 1-40 21.9 37.7 77~ 61 380 20.8 255 2 1 20 47.8 9.2 77~ 59 479 27.1 229 2 1 30 21.9 18.3 76~ 59 371 21.0 124 2 1 37 14.0 45.8 76~ 67 175 8.7 98 1 1-17 35.8 18.2 76~ 64 183 9.5 120 1 1-4 38.2 0 76~ 68 149 7.3 105 1 1-5 52.3 0 76~ 68 146 7.2 107 1 1-3 51.0 0

Fig. 3 Densities of Br/innich's gui11:mots observed on the water along transects in Stori~ orden. Transects covering arem~ to the north of the main stud? area are also included. The data are grouped in a grid with units 1/4 ~ longitude and 1/12 ~ latitude
* 0 � 9 ~- - - ' 7 ;- - -
c, ,5- /,"
_ , , ,L . . . . .
S 0 �9
~ ". . :::!
. : ". : , ..' ...,, :
�9 ,. : ... 50 % 17 O0 ,; 18 O0 ;" ~ O0 20 O0 21 O(J 22 O0 ." ' " " 2,3 O0
B r u n n i c h ' s g u i l l e m o t s
p e r s q , k m
o.? lo 152o, 2,53o, 3,~4o~ K i ] o m e t e r s
- - - 5 0 m
- - l O 0 m
..... 2 0 0 m
[ ] s m a l l c o l o n y
O l a r g e c o l o n y
�9 0 - g
@ 8-14
14-23
' ~ 2 3 - 3 8
t~, 3 8 - 5 2 ) 5 2 - 1 0 1
541
Table 2 Numerical abundance and liequency of occurrence of prey l axa in Briinnich's guille :nots collected in Stor(iorden, 1992 (n = 23)
Taxon No. of items % Numerical % Frequency abundance of occurrence
Boreogadus saida 34 12.1 56.5 Mallotus viIlosus 2 0.7 8.7 Liparis sp. 2 0.7 4.3 M yo xocephalus scorpicus 2 0.7 4.3 Sebastes mentella 1 0.4 4.3 Thysanoessa inermis 22 7.8 26.1 Parathemisto libellula 85 30.2 69.6 P. abyssorum 115 40.9 30.4 Hyperia 9alba 2 0.7 8.7 Onisimus sp. 3 1.t 4.3 Gammarus witkitzkii 11 3.9 30.4 Eualus 9aimmardi 1 0.4 4.3 Sclerocrangon borealis 1 0.4 4.3
Total 281 100.0 -
These transects also held the highest densities of guille- mot,,~. Group sizes of more than five birds were not recorded on the three southernmost transects. The per- centages of birds occurring in groups > 5 individuals were, highest on the 76~ and 77~ transects (Tat: le 1).
Diet of Briinnich's guillemots
Crustaceans and fish dominated, both in numerical abundance and frequency of occurrence, in the diet of guillemots collected in Storfjorden (Table 2). Two spe- cies of pelagic amphipods, Parathemisto abyssorum and
542
P. libellula, together with the euphausiid Thysanoessa inermis, accounted for 79% of all identified prey items. The amphipod Gammarus wilkirzkii occurred in 30% of the birds, but was not taken in large numbers. Polar cod was the only important species of fish, occurring in 57% of the birds examined. The estimated lengths of the polar cod ranged from 7 to 19 cm (mean 11.7 cm).
T r a n s e c t 770 00' N
1ooo - I 1oo_=. 800 10 a, 600 =
400 1 200
0 , 0.1 22-23 21-22 20-21 19-20 18-t9 17-18
Distribution of biomass detected by acoustic surveys
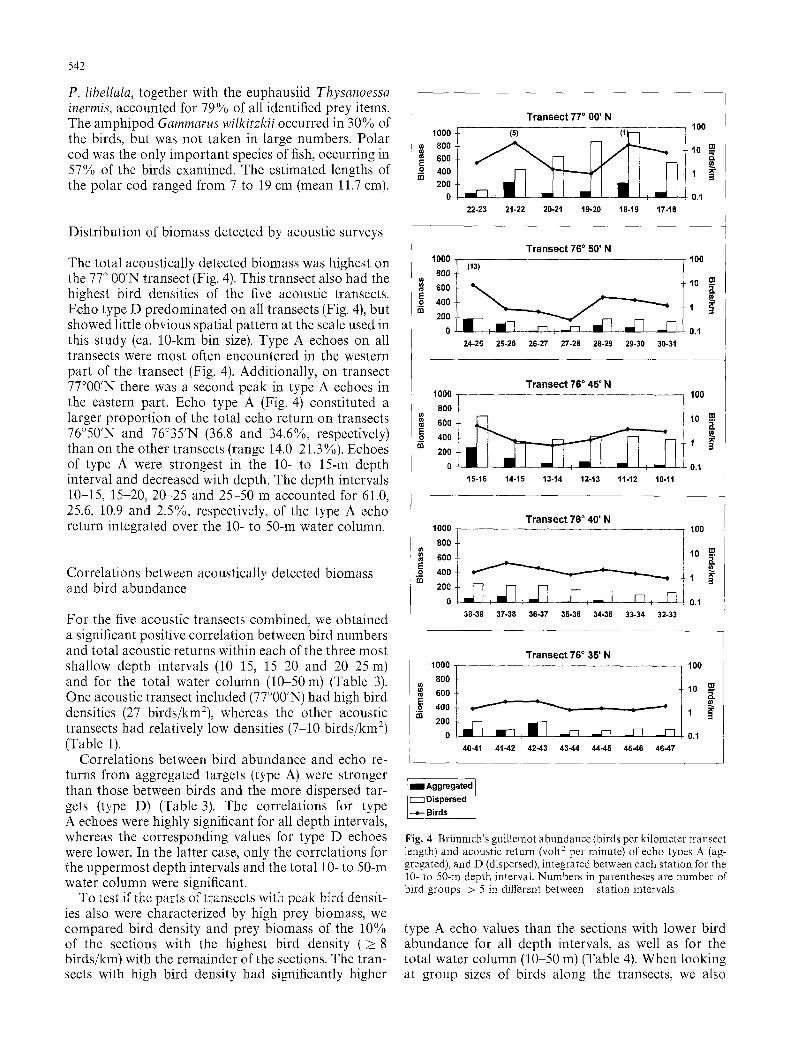
The total acoustically detected biomass was highest on the 77 ~ 00'N transect (Fig. 4). This transect also had the highest bird densities of the five acoustic transects. Echo type D predominated on all transects (Fig. 4), but showed little obvious spatial pattern at the scale used in this study (ca. 10-kin bin size). Type A echoes on all transects were most often encountered in the western part of the transect (Fig. 4). Additionally, on transect 77~ there was a second peak in type A echoes in the eastern part. Echo type A (Fig. 4) constituted a larger proportion of the total echo return on transects 76~ and 76~ (36.8 and 34.6%, respectively) than on the other transects (range 14.0 21.3%). Echoes of type A were strongest in the 10- to 15-m depth interval and decreased with depth. The depth intervals 10-15, 15-20, 20-25 and 25-50 m accounted for 61.0, 25.6, 10.9 and 2.5%, respectively, of the type A echo return integrated over the 10- to 50-m water column.
Correlations between acoustically detected biomass and bird abundance
For the five acoustic transects combined, we obtained a significant positive correlation between bird numbers and total acoustic returns within each of the three most shallow depth intervals (10-15, 15-20 and 20 25 m) and for the total water column (10-50m) (Table 3). One acoustic transect included (77~ had high bird densities (27 birds/km=), whereas the other acoustic transects had relatively low densities (7-10 birds/km a) (Table 1).
Correlations between bird abundance and echo re- turns from aggregated targets (type A) were stronger than those between birds and the more dispersed tar- gets (type D) (Table 3). The correlations for type A echoes were highly significant for all depth intervals, whereas the corresponding values for type D echoes were lower. In the latter case, only the correlations for the uppermost depth intervals and the total 10- to 50-m water column were significant.
To test if the parts of transects with peak bird densit- ies also were characterized by high prey biomass, we compared bird density and prey biomass of the 10% of the sections with the highest bird density (>__ 8 birds/km) with the remainder of the sections. The tran- sects with high bird density had significantly higher
T r a n s e c t 760 50' N lOOO 800 t 113) 800 t % . ,oo 200 ~- , , . - ~ " ~ ,-~ ~ _ oL mm I : m m l - I : _ ~ : . _ ~ mini I , ~ I , ,_[--I
24-26 25-26 26-27 27-28 28-26 29-30 30-31
100
10 ~g
0A
T r a n s e c t 76 ~ 45' N t000 100
8OO 600 ~ 10 •
400 1 200
0 , ~ , 0.1
15-16 14-t5 13-14 12-13 11-12 t0-11
T r a n s e c t 76 ~ 40' N 1 0 0 0 ~ 8 0 0 100
600 10 400 1
200
o J-],_.r-1 I~ , ~ o.t 38-39 37-38 36-37 35-36 34-35 33-34 32-33
T r a n s e c t 76 ~ 35' N 1ooo ]- T 1oo 800
t lO
= t - 1 r
o.1
40-41 41-42 42-43 43-44 44-45 45-46 46-47
! B Aggregated Dispersed
--*- B rds
Fig. 4 Briinnich's guillemot abundance (birds per kilometer transect length) and acoustic return (volt 2 per minute) of echo types A (ag- gregated), and D (dispersed), integrated between each station for the 10- to 50-m depth interval. Numbers in parentheses are number of bird groups > 5 in different between station intervals
type A echo values than the sections with lower bird abundance for all depth intervals, as well as for the total water column (10-50 m) (Table 4). When looking at group sizes of birds along the transects, we also
543
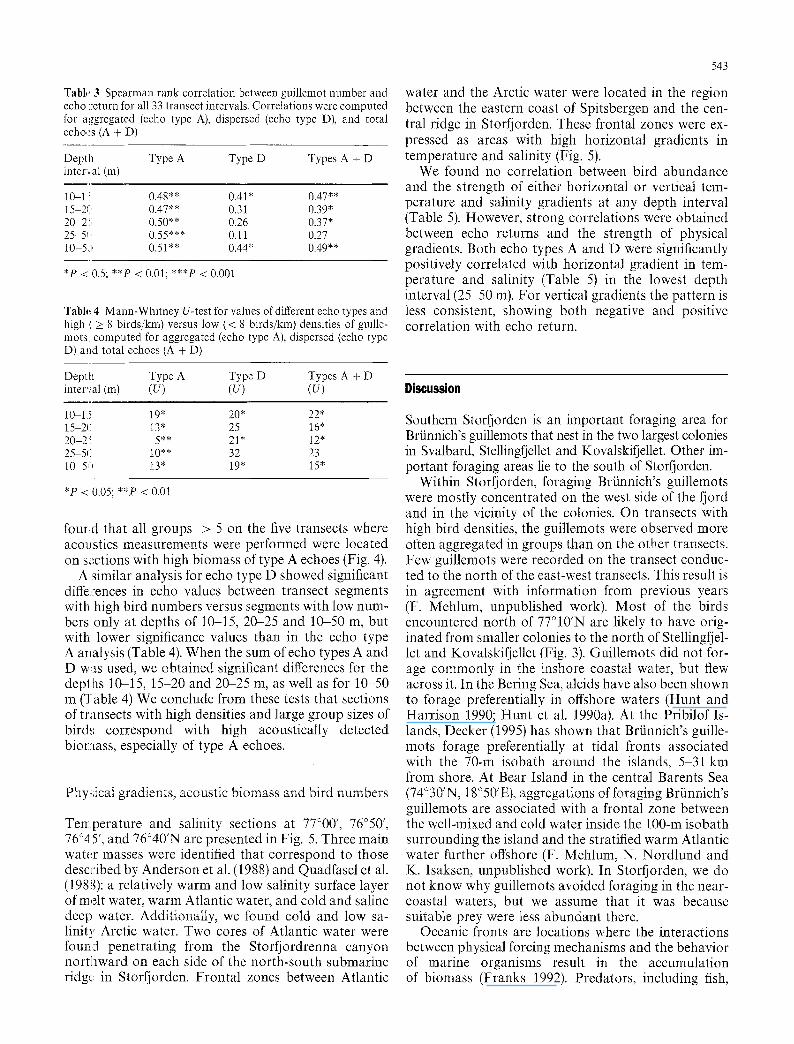
Table 3 Spearman rank correlation between guillemot number and echo ::eturn for all 33 transect intervals. Correlations were computed for aggregated (echo type A), dispersed (echo type D), and total echo~:s (A + D)
Depth Type A Type D Types A + D interval (m)
10-1! 0.48** 0.41" 0.47** 15-217 0.47** 0.31 0.39* 20-2!; 0.50** 0.26 0.37* 25-5( 0.55*** 0.11 0.27 10 52~ 0.51"* 0.44* 0.49**
*P < 0.5; **P < 0.01; ***P < 0.001
Table 4 Mann-Whitney U-test for values of different echo types and high ( _> 8 birds/kin) versus low (< 8 birds/km) densities of guille- mots, computed for aggregated (echo type A), dispersed (echo type D) and total echoes (A + D)
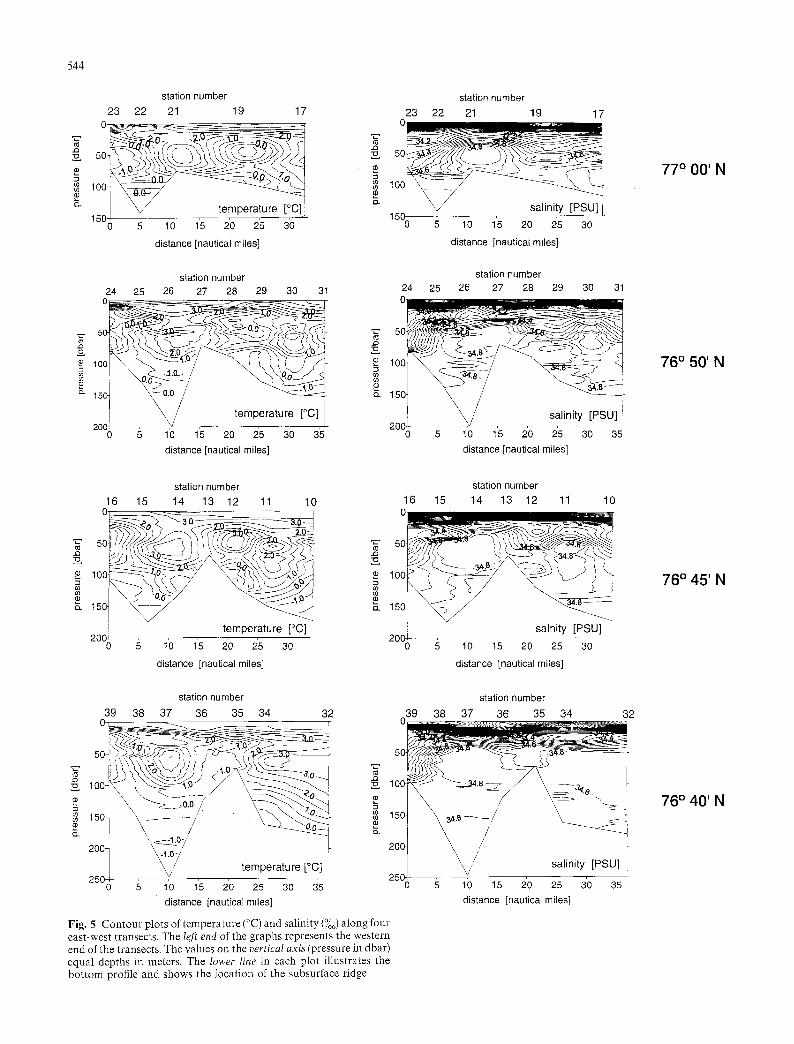
water and the Arctic water were located in the region between the eastern coast of Spitsbergen and the cen- tral ridge in Storfjorden. These frontal zones were ex- pressed as areas with high horizontal gradients in temperature and salinity (Fig. 5).
We found no correlation between bird abundance and the strength of either horizontal or vertical tem- perature and salinity gradients at any depth interval (Table 5). However, strong correlations were obtained between echo returns and the strength of physical gradients. Both echo types A and D were significantly positively correlated with horizontal gradient in tem- perature and salinity (Table 5) in the lowest depth interval (25 50 m). For vertical gradients the pattern is less consistent, showing both negative and positive correlation with echo return.
Depth Type A Type D Types A + D inter'ial (m) (U) (U) (U) Discussion
10 1.! 19" 20* 22* 15 211 13" 25 16" 20-2! 5** 21" 12" 25-5( 10"* 32 23 10 5'? 13" 19" 15"
*P < 0.05; **P < 0.01
fourd that all groups > 5 on the five transects where acoustics measurements were performed were located on s,~ctions with high biomass of type A echoes (Fig. 4).
A similar analysis for echo type D showed significant diffe:~ences in echo values between transect segments with high bird numbers versus segments with low num- bers only at depths of 10-15, 20-25 and 10-50 m, but with lower significance values than in the echo type A analysis (Table 4). When the sum of echo types A and D was used, we obtained significant differences for the depl hs 10-15, 15-20 and 20-25 m, as well as for 10-50 m 0-able 4) We conclude from these tests that sections of transects with high densities and large group sizes of bird!; correspond with high acoustically detected bioraass, especially of type A echoes.
Phy~;icaI gradients, acoustic biomass and bird numbers
Temperature and salinity sections at 77~ ' , 76~ 76~ ', and 76~ are presented in Fig. 5. Three main water masses were identified that correspond to those desc~:ibed by Anderson et al. (1988) and Quadfasel et al. (19811): a relatively warm and low salinity surface layer of melt water, warm Atlantic water, and cold and saline deep water. Additionally, we found cold and low sa- linitf' Arctic water. Two cores of Atlantic water were four~:t penetrating from the Storfjordrenna canyon northward on each side of the north-south submarine ridg,:: in Storfjorden. Frontal zones between Atlantic
Southern Storfjorden is an important foraging area for Briinnich's guillemots that nest in the two largest colonies in Svalbard, Stellingfjellet and Kovalskil~ellet. Other im- portant foraging areas lie to the south of Storfjorden.
Within Storfjorden, foraging Briinnich's guillemots were mostly concentrated on the west side of the fjord and in the vicinity of the colonies. On transects with high bird densities, the guillemots were observed more often aggregated in groups than on the other transects. Few guillemots were recorded on the transect conduc- ted to the north of the east-west transects. This result is in agreement with information from previous years (F. Mehlum, unpublished work). Most of the birds encountered north of 77~ are likely to have orig- inated from smaller colonies to the north of Stellingfjel- let and Kovalskifjellet (Fig. 3). Guillemots did not for- age commonly in the inshore coastal water, but flew across it. In the Bering Sea, alcids have also been shown to forage preferentially in offshore waters (Hunt and Harrison 1990; Hunt et al. 1990a). At the Pribilof Is- lands, Decker (1995) has shown that Briinnich's guille- mots forage preferentially at tidal fronts associated with the 70-m isobath around the islands, 5-31 km from shore. At Bear Island in the central Barents Sea (74~ 18~ aggregations of foraging Briinnich's guillemots are associated with a frontal zone between the well-mixed and cold water inside the 100-m isobath surrounding the island and the stratified warm Atlantic water further offshore (F. Mehlum, N. Nordlund and K. Isaksen, unpublished work). In Storfjorden, we do not know why guillemots avoided foraging in the near- coastal waters, but we assume that it was because suitable prey were less abundant there.
Oceanic fronts are locations where the interactions between physical forcing mechanisms and the behavior of marine organisms result in the accumulation of biomass (Franks 1992). Predators, including fish,
544
station number
23 22 21 19 17 0 _ - - _ _ ~ 0
loo- ~,
temperature [~ , ~- 150 1500 5 1'0 1'5 2'0 2'5 30
distance [nautical miles]
station number
23 22 21 19 17
X / salinity [PSU]
0 ~ io i5 20 25 30 distance [nautical miles]
Z3
r 100
& 150
station number 24 25 26 27 28 29 30 31
so ) ;
200 5 1 '0 1 '5 2'0 2'5 3'0 3'5
distance [nautical miles]
r
station number 24 25 26 27 28 29 30 31
100
2ool salinity [PSU] i 0 5 10 15 20 25 30 35
distance [nautical miles]
77 ~ 00' N
76 ~ 50' N
station number 16 15 14 13 12 11 10
, O '
B. 150
temperature [~ 200
0 5 10 15 20 25 30
distance [nautical miles]
" I3
d)
S.
16
5O
150 ~ < I
i 2001
0
station number
15 14 13 12 11 10
salnity [PSU]
5 10 t5 20 25 30
distance [nautical miles]
station number
39 38 37 36 35 34 32 o ~ _ _ ~ ~ ~
\~%.o-/ 200-
' temperature [~ 250-
0 5 10 15 20 25 30 35 distance [nautical miles]
Fig. 5 Contour plots of temperature (~ and salinity (%0) along four east-west transects. The left end of the graphs represents the western end of the transects. The values on the vertical axis (pressure in dbar) equal depths in meters. The lower line in each plot illustrates the bottom profile and shows the location of the subsurface ridge
station number
039~ 38 37 36 35 34 32
50 _'~ , . = ~ - ~ - -
100 L_~_~a~.e,
200 / /
/ salinity [PSU] 25O
10 15 20 25 30 35 distance [nautical miles]
76 ~ 45' N
76 ~ 40' N

T a b l e 5 S p e a r m a n R a n k c o r r e I a t i o n coeff ic ients b e t w e e n h o r i z o n t a l a n d ~er t i ca l t e m p e r a t u r e a n d s a l i n i t y g r a d i e n t s a t d i f ferent d e p t h inter-~als, a n d b i r d a b u n d a n c e (B), echo t y p e A a n d e c h o type
545
D (n = 27 b e t w e e n - s t a t i o n in terva ls ) . The a c o u s t i c d a t a a re in teg- r a t e d o v e r the 10- to 50-m d e p t h i n t e r v a l
D e p t h T e m p . h o r i z o n t a l T e m p . ve r t i ca l (m) B A D B A D
Sa l in i t y h o r i z o n t a l S a l i n i t y ve r t i ca l B A D B A D
10 1! 0.02 0.09 - 0 . 1 2 0.21 0.07 - 0 . 1 4 15 2~] - 0.17 - 0.01 - 0.18 - 0.21 - 0 .51"* - 0.47* 20 2.! - 0.27 - 0.08 - 0.25 - 0.07 - 0.06 - 0.47* 25-5(1 0.23 0.62*** 0.56** 0.17 0.08 - 0.14
- 0.15 - 0.17 - 0.03 0.29 0.28 0.41" - 0.36 - 0.16 - 0.05 0.02 - 0.31 0.18 - 0.12 0.20 0.19 0.20 - 0.08 0.41"
0.19 0.40* 0.59** 0.20 0.08 0.50**
*P < 0.05; **P < 0.01; ***P < 0.001
mar:he mammals and seabirds, take advantage of these concentrations when they include suitable prey (Haney 1986: Fiedler and Bernard 1987; Wishner et al. 1988; Hun: and Harrison 1990; Schneider et al. 1990; Podestfi et al. 1993; Decker 1995). In the present study, the major concentrations of foraging guillemots were in the vicil~ ity of a weak subsurface front where Atlantic water abutl;ed Arctic water. However, correlations between the r:umbers of foraging guillemots and frontal areas in the s:udy area were not strong. Schneider et al. (1987) have shown that strong fronts are more likely to be atter,~ded by marine birds than are weak fronts. Like- wise, Elphick and Hunt (1993) found that responses by seab:rds to clearly differentiated water masses in the nortlLern Bering Sea were strong when compared to the relatively weak responses of the Antarctic seabird com- munity to weakly differentiated water masses in the Bran.sfield Strait (Hunt et al. 1990b). In the present stud,r the subsurface frontal systems were deep and weal<~, Nevertheless, acoustic biomass was positively correlated with the strength of subsurface horizontal temperature gradients. Over 95% of the aggregated acou,~;tic biomass in the 10- to 50-m depth interval was found between 10 and 25 m. Prey may also have been accuraulated in the 0- to 10-m depth interval, but we do not h ave acoustic biomass data from this interval. Our analyses of bird abundance in relation to horizontal and vertical gradients in temperature and salinity failed to sl:ow significant correlations. However, large ag- gregations of foraging birds occurred in the western parts of the transects over deep water where strong sub-s~xrface fronts were evident. It seems possible that birds observed foraging in the vicinity of these subsur- face fronts were attracted to prey that had aggregated at these features.
Food samples obtained from foraging guillemots col- lected in the Storfjorden study area contained primarily crusntceans and polar cod, whereas capelin (Mallotus villos~s) and other fishes were of less importance. Data from 1989 and 1992 on foods brought to the chicks at the colonies indicate that fish, particularly polar cod, predominate, whereas crustaceans were absent (Mehilum and Gabrielsen 1993; V. Bakken, personal communication). Interestingly, no capelin were identi- fied among the prey items recorded in 1989 and 1992.
Although many guillemots were observed flying south through the study area to forage in an area where capelin schools were common (F. Mehlum, unpub- lished work), we have no data showing a significant use of capelin for feeding guillemot chicks at the two largest colonies in Storfjorden. We are unable to explain why, apparently, a large proportion of the guillemots nesting at the colonies flew south out of the fjord when there were suitable prey nearer to the colonies that were exploitable.
In the acoustic records, we were able to differentiate two classes of signals. One class consisted of groups of strong echoes, and we interpreted these as being from schools of fish or dense aggregations of large zoo- plankters such as Pararhemisto spp. and Thysanoessa inermis. The second class of signals consisted of single, relatively weak, echoes, and we interpreted these as representing a diffuse or scattered distribution of or- ganisms. If our interpretations are correct, these tar- gets were probably small fish, because single small zooplankters would have been too small to reflect a 30-kHz signal.
Foraging guillemots reacted differently to the sour- ces of the two classes of echoes. The numbers of foraging guillemots were strongly correlated with the strength of echoes believed to be from aggregated prey, whereas correlations between guillemot numbers and the strength of echoes from diffuse distributions of acoustic biomass were consistently weaker. This result is the first suggestion that avian predators react differ- ently to aggregated and dispersed prey. When foraging at patches, the correlations between guillemots and acoustically detected biomass suggest that foraging guillemots adjust their numbers in accordance with the predictions of the ideal free distribution (Fretwell and Lucas 1970; Milinski and Parker 1991). When foraging on dispersed prey, the guillemots are apparently rela- tively insensitive to variations in the biomass present in the water.
Previous studies of distributions of marine avian predators with respect to their prey have employed techniques that integrated prey biomass over transect segments varying in length from 0.1 to 10km (for a recent compilation of these studies, see Hunt et al. 1992). In the present study, recording of echoes ping by

546
ping allowed classification of echo types. Our analysis showed that the inclusion of echoes from scattered targets with those from aggregated targets significantly reduced the strengths of correlations between the pred- ators and their prey. In most of the studies reviewed by Hunt et al. (1992), correlations between seabirds and their prey were weaker than those found between guillemots and aggregated targets in this study, and are roughly similar to those found between the guillemots and total prey echoes. It may be essential to remove the estimated biomass attributed to scattered prey if we are to fully appreciate the extent to which marine birds are able to adjust their foraging effort with respect to prey distribution and abundance.
The majority of guillemots observed foraging in the study area were associated with patches of aggregated prey rather than with scattered prey. This preference for aggregated prey may have consequences for the conservation of Briinnich's guillemots and the manage- ment of fisheries in the vicinity of guillemot colonies. If fishery practices remove or disperse schooling prey, these birds may experience difficulty in meeting their nutritional requirements.
Acknowledgements We thank Kazimierz Groza for helping with collection and analyses of the hydroacoustical data, Jan Marcin Weslawski for the identification of seabird prey specimens, and Vidar Bakken for providing unpublished data on prey brought by adults to Brfinnich's guillemot chicks at Kovalskifjellet. We also thank the crew and colleagues on R/V Lance for assistance during the cruise. Funding for G.L. Hunt and M.B. Decker was provided in part by the UCI School of Biological Sciences, by the Division of Polar Programs National Science Foundation grant to G.L. Hunt and by a National Aeronautics and Space Administration Global Change Fellowship to M.B. Decker.
Appendix I
To identify and remove the signals of the ship's depth sounder, we used the fact that bottom echoes from the ship's depth sounder were not present in adjacent pings at the same depth. Therefore we considered an echo (ul,j) (where i is ping number, j is sample number in the ping, u is echo return expressed in voltage, that could be transformed to acoustic pressure) to originate from the ship's echo sounder if the following three conditions were simultaneously fulfil- led: (1) the value of ui, j was larger than some threshold level pgl, typical for the transect's acoustical background (noise + dispersed targets); (2) and if a minimum of five successive samples (to distin- guish single fish echoes from those shorter echoes from the ship's echo sounder) in the i-th ping including the j-th sample are above the pgl value; (3) and if, in comparing samples in the two adjacent pings (i - 1 and i+ l ) in the depth indices interval (j - 1...j+l) with the second threshold level pg2j, we could not find a minimum of two samples fi'om the pings i - 1 and i + l that were above pg2j (i.e. we did not have a biomass patch).
The value of pg2~ for i-th ping was defined as pg2j = u~,j/4 (some- times, depending on the rate of ship's echo sounder to our echo sounder signals pg2j = u~,j6). The ships's echo sounder signals were removed and substituted with the mean from two adjacent ping sample values from the same depth.
Threshold levels were established on the basis of many experi- mental trials. The values of pgl were calculated as averages of maxima from locations with dispersed targets. The pg2, values de-
pended on depth and were different in each block of data. They were defined as the value of an average block (of 128 pings) profile multiplied by 1.41. The selected echoes were those with intensities higher than the 2-dimensional moving averages, i.e. both vertical and horizontal. This means that dense aggregations of targets were defned as patches with echo intensities higher than the local back- ground level. For the purpose of the present paper the acoustic data were reprocessed into a 1-min bin size (corresponding to a distance of 150-160 m) and averaged between neighboring stations. These averaged acoustic returns are given in volts 2 per minute. Precise locations of echo signals were obtained using the ship's GPS system and time of registration. The echo intensity was integrated for the depth layers 10-15, 15-20, 20-25 and 25-50 m. Depths shallower than 10 m were omitted from the analyses to avoid the dead zone of the echo sounder and interference from bubbles and sea surface reflections.
For discriminating between dense concentrations of targets (echo type A - aggregated) and the second, dispersed targets (echo type D - dispersed) we applied the following procedure:
At the first stage the value s~, i was calculated as:
1 k = l s ia=~ ~ (pfl~+k+pf21+k+pf31+k)
k= l
where si,i is a 2-dimensional (3 x 3) moving average of voltages of echo signals around the point with i,j indices, pfl = value of previous echo profile, pf2 = value of present echo profile, and pf3 = value of next profile.
Echoes were classified as aggregated if the following conditions were fulfilled: the sl,j values were larger than the thresholds pgl and pg2; the minimum number of samples surrounding the Ui, j sample (among 8 surrounding samples) higher than pg2 equalled 5.
Otherwise, the echoes were classified as dispersed. The first condi- tion used the fact that the level of echo from an aggregated patch was usually higher than the echoes from dispersed targets; the second and third conditions used the fact that a patch of aggregated targets could be immersed in a layer of dispersed targets.
References
Anderson LG, Jones EP, Lundgren R, Rudels B, Sehlstedt P-I (1988) Nutrient regeneration in cold, high salinity bottom water of the Arctic shelves. Cont Shelf Res 8:1345 1355
Bradstreet MSW, Brown RGB (1985) Feeding ecology of the Atlan- tic alcidae. In: Nettleship DN, Birkhead TM (eds) The Atlantic Alcidae. Academic Press, Orlando, Fla, pp 264-318
Coyle KO, Hunt GL, Decker MB, Weingartner TJ (1992) Murre foraging, epibenthic sound scattering and tidal advection over a shoal near St-George Island, Bering Sea. Mar Ecol Prog Ser 83:1-14
Decker MB (1995) Influences of oceanographic processes on seabird ecology. PhD Thesis. University of California, Irvine
Decker MB, Hunt GL Jr, Byrd GV Jr (1995) The relationships among sea-surface temperature, the abundance of juvenile walleye pollock (Theragra chalcogramma), and the reproductive performance and diets of seabirds at the Pribilof Islands, southeastern Bering Sea. In: Beamish RJ (ed) Climate change and northern fish populations. Can Spec Publ Fish Aquat Sci 121: 425-437
Duffy DC, Jackson S (1986) Diet studies of seabirds: a review of methods. Colon Waterbirds 9:1-17
Elphick CS, Hunt GL Jr (1993) Variations in the distributions of marine birds with water mass in the northern Bering Sea. Condor 95:33-44
Fiedler PC, Bernard HJ (1987) Tuna aggregation and feeding near fronts observed in satellite imagery. Cont Shelf Res 7:871-881
Franks PJS (1992) Sink or swim: accumulation of biomass at fronts. Mar Ecol Prog Set 82:1-12
547
Fret~,ell SD, Lucas HL Jr (1970) On territorial behavior and other fa~:tors influencing habitat distribution in birds. Acta Biotheor 19:16-36
Frosl KJ, Lowry LF (1981) Trophic importance of some marine gaclids in northern Alaska and their body-otolith size relation- sl- Lps. Fish Bull US 79:187-192
Haney JC (1986) Seabird affinities for Gulf Stream frontal eddies: responses of mobile marine consumers to episodic upwelling. J lvIar Res 44:361 384
Hunl GL Jr, Harrison NM (1990) Foraging habitat and prey taken b':. Least Auklets at King Island, Alaska. Mar Ecol Prog Ser 6.,.141-150
Huni GL Jr, Harrison NM, Cooney RT (1990a) The influence of hydrographic structure and prey abundance on foraging Least A:tklets. Stud Avian Biol 14:7-22
Hunt GL, Heinemann D, Veit RR, Heywood RB, Everson I (1990b) Ti:e distribution, abundance and community structure of marine birds in southern Drake Passage and Bransfield Strait, Antarc- tica. Cont Shelf Res 10:243 257
Hunt GL Jr, Heinemann D, Everson I (1992) Distributions and predator-prey interactions of macaroni penguins, Antarctic fur seals, and Antarctic krill near Bird Island, South Georgia. Mar Ecol Prog Ser 86:15-30
Kind:,r TH, Hunt GL Jr, Schneider DC, Schumacher JD (1983) Correlations between seabirds and oceanic fronts around the Pribilof Islands, Alaska. Estuarine Coastal Shelf Sci 1( 209-219
Mehlum F, Bakken V (1994) Seabirds in Svalbard: status, recent changes and management. In: Nettleship DN, Burger J, Gochfeld M (eds) Seabirds on islands: threats, case studies and action plans. BirdLife Conservation Series, no 1, Bird Life International, Cambridge, pp 155 171
Mehlum F, Gabrielsen GW (i993) The diet of high arctic seabirds in coastal and ice-covered pelagic areas near the Svalbard archi- pelago. Polar Res 11:1-20
Milinski M, Parker GA (1991) Competition for resources. In: Krebs JR, Davies NB (eds) Behavioural ecology, an evolutionary ap- proach, 3rd edn. Blackwell, London, pp 137-168
Podestfi GP, Browder JA, Hoey JJ (1993) Exploring the association between swordfish catch rates and thermal fronts on U.S. long- line grounds in the western Atlantic. Cont Shelf Res 13:253 277
Quadfasel D, Rudels B, Kurz K (1988) Outflow of dense water from a Svalbard fjord into Fram Strait. Deep Sea Res 35:1143 1150
Schneider DC, Harrison NM, Hunt GL Jr (1987) Variation in the occurrence of marine birds at fronts in the Bering Sea. Estuarine Coastal Shelf Sci 25:135 141
Schneider DC, Harrison NM, Hunt GL Jr (1990) Seabird diets at a front near the Pribilof Islands, Alaska. Stud Avian Biol 14:61-66
Tasker ML, Hope Jones P, Dixon T, Blake BF (1984) Counting seabirds from ships: a review of methods employed and a sugges: tion for a standardized approach. Auk 101:567-577
Wishner KF, Durbin E, Durbin A, Macauly M, Winn H, Kenny N (1988) Copepod patches and right whales in the Great South Channel off New England. Bull Mar Sci 43:825 844