A Jump-Growth Model for Predator–Prey Dynamics: Derivation and Application to Marine Ecosystems
Upload
khangminh22Category
view
2download
0
1
Effect of prey mass and selection on predator carrying capacity estimates
*Esmarie Jooste1, Matt W. Hayward
1,2, Ross T. Pitman
3 & Lourens H. Swanepoel
1
1Centre for Wildlife Management, University of Pretoria, 0002 South Africa
2Australian Wildlife Conservancy, PO Box 432, Nichols Point, Victoria 3501 Australia
3Marine Biology and Ecology Research Centre, Plymouth University, UK
*Corresponding author: Esmarie Jooste, +1(618) 7136569, [email protected]
Abstract
The ability to determine the prey-specific biomass intake of large predators is fundamental to their
conservation. In the absence of actual prey data, researchers generally use a „unit mass‟ method
(estimated as 3/4 adult female mass) to calculate the biomass intake of predators. However,
differences in prey preference and range across geographic regions are likely to have an influence on
biomass calculations. Here we investigate the influence of estimated prey mass on leopard biomass
calculations, and subsequently carrying capacity estimates, in an understudied mountain population.
Potential leopard feeding sites were identified using global positioning system (GPS) location clusters
obtained from GPS collars. We investigated 200 potential leopard feeding sites, of which 96 where
actual feeding sites. Jaw bones, horns, hooves, and other indicative bones were used to determine
gender and age of prey items, which were subsequently used to calculate mass of each prey item
based on previously published values. There were significant differences in the biomass values
calculated using the traditional unit mass method and the calculated prey masses obtained from
leopard feeding sites. However, there were no considerable differences in the carrying capacity
estimates using the preferred prey species model and leopard density estimates calculated using a non-
biased spatial approach, which suggests that estimating carnivore carrying capacity based on 3/4 adult
female masses is a reliable method, also for the mountain population in this study.
Key Words biomass calculation, carnivore ecology, carrying capacity, diet, GPS, Panthera pardus

2
Introduction
Large carnivores play an important role in regulating natural terrestrial ecosystems (Estes et
al 2011). However, on small enclosed reserves, large carnivores can reduce prey populations
(Bisset et al. 2012). Therefore, knowledge of carnivore numbers and carrying capacity are
important for management of enclosed reserves (Fuller & Sievert 2001, Hayward et al. 2007).
Predator-prey relationships serve as a foundation to determine the prey-specific biomass
intake of predators which can then be used to estimate the carrying capacity of large
carnivores (Hayward et al. 2007). Carrying capacities of several large carnivores (e.g., lions
Panthera leo, leopards Panthera pardus, cheetahs Acinonyx jubatus, spotted hyenas Crocuta
crocuta, and African wild dogs Lycaon pictus) have been predicted and tested for small
reserves by regressing carnivore density to the abundance of their preferred prey (Hayward et
al. 2007).
Although prey preference and abundance are key factors in calculating the carrying
capacity of large predators, availability and range of prey species are also important factors to
consider, especially across different geographic study areas. For example, leopards
preferentially prey on species within the range of 10–40 kg (Hayward et al. 2006). However,
in certain mountainous regions, such as the Cederberg Mountains of South Africa, leopards
mostly have access to smaller species, like klipspringers (Oreotragus oreotragus, ± 12.5 kg)
and rock hyrax (Procavia capensis, ± 3.2 kg) (Martins et al. 2011). These differences in the
average mass of available prey likely affect biomass calculations, and subsequently carrying
capacity estimates of large predators.
In this study, we collected female leopard prey remains to estimate actual age and
mass of the prey species consumed. We then used these masses to calculate biomass
consumed by these female leopards and thus estimate leopard carrying capacity in a mountain
population. To assess the implications of using various metrics of biomass consumption, we
3
also calculated carrying capacity based on the widely used technique of ignoring the gender
and age of each prey item and simply calculating the biomass as 75% of the mass of adult
females of preferred prey species, i.e. unit mass.
Methods
Study Area
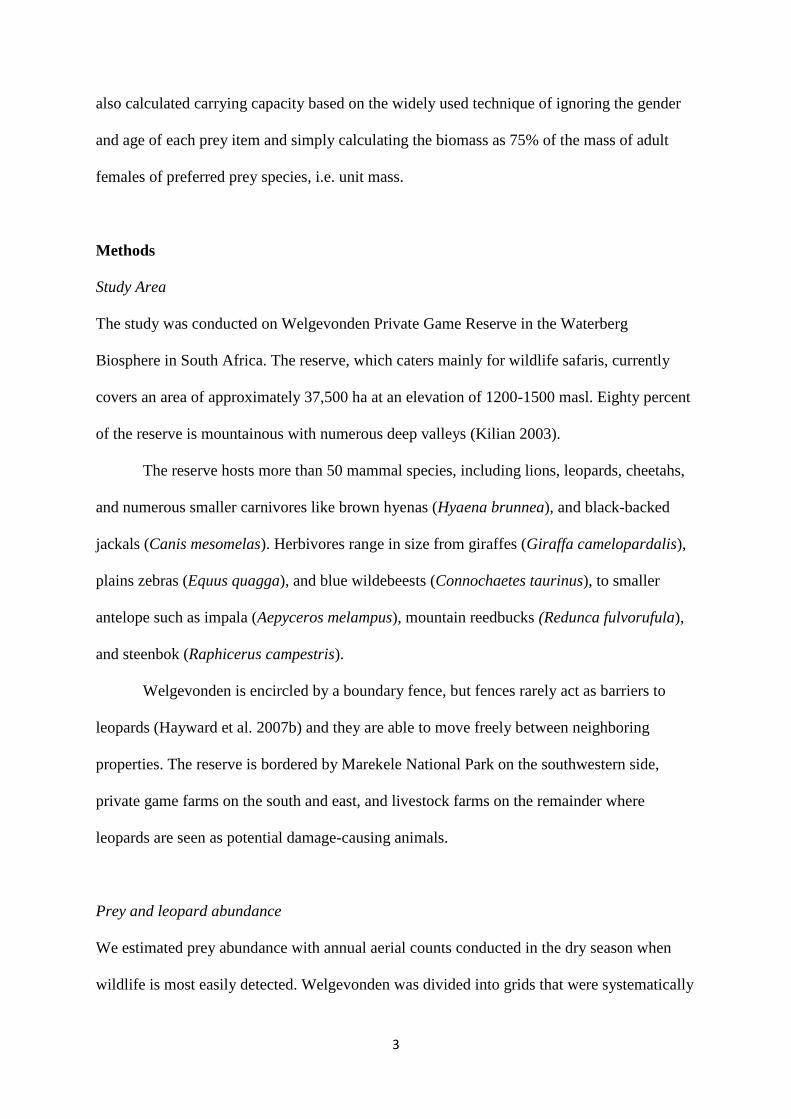
The study was conducted on Welgevonden Private Game Reserve in the Waterberg
Biosphere in South Africa. The reserve, which caters mainly for wildlife safaris, currently
covers an area of approximately 37,500 ha at an elevation of 1200-1500 masl. Eighty percent
of the reserve is mountainous with numerous deep valleys (Kilian 2003).
The reserve hosts more than 50 mammal species, including lions, leopards, cheetahs,
and numerous smaller carnivores like brown hyenas (Hyaena brunnea), and black-backed
jackals (Canis mesomelas). Herbivores range in size from giraffes (Giraffa camelopardalis),
plains zebras (Equus quagga), and blue wildebeests (Connochaetes taurinus), to smaller
antelope such as impala (Aepyceros melampus), mountain reedbucks (Redunca fulvorufula),
and steenbok (Raphicerus campestris).
Welgevonden is encircled by a boundary fence, but fences rarely act as barriers to
leopards (Hayward et al. 2007b) and they are able to move freely between neighboring
properties. The reserve is bordered by Marekele National Park on the southwestern side,
private game farms on the south and east, and livestock farms on the remainder where
leopards are seen as potential damage-causing animals.
Prey and leopard abundance
We estimated prey abundance with annual aerial counts conducted in the dry season when
wildlife is most easily detected. Welgevonden was divided into grids that were systematically

4
inspected to improve accurate detection of prey species. Each count was conducted over a 4-
day period. We estimated prey abundance by using the most recent aerial count (2010).
Aerial census techniques are biased against smaller, cryptic animals, so correction factors
previously applied in Kruger National Park (Owen-Smith & Mills 2008) were used to adjust
counts for these species.
We followed camera trapping protocols for closed population mark recapture studies
on large carnivores to estimate leopard density (Karanth & Nichols 2002). Welgevonden was
divided into 57 (2.5km x 2.5km) grid cells. However, due to a shortage of camera traps we
grouped 12-15 grid cells to create four survey blocks. Twelve to fifteen camera trap
(Moultrie I40 digital infrared; Moultrie Feeders, Inc, Alabaster, AL) pairs operated in each
survey block (12-15 grid cells) for 18-22 days, where after they were moved to the next
survey block until the whole reserve were surveyed. Cameras were positioned at opposite
sides of roads, chosen in such a way as to maximize leopard encounters. Due to a slow
camera trap trigger speed, we baited (rotten eggs and fermented fish) each station every 5
days (Gerber et al. 2012). Our complete camera trapping period (90 days; May-July 2009)
and systematic trap placement assured that we did not violate assumptions of demographic
closure and that no individuals had a non-zero capture probability (Karanth & Nichols 2002;
Wang & Macdonald 2009).
For comparative reasons, we used both a likelihood based spatially explicit capture
recapture (SECR; Efford et al. 2009) and a non-spatial capture recapture model (software
CAPTURE; Rexstadt & Burnham 1991) to estimate leopard density. For the non-spatial
model we pooled data across the four survey blocks (12-15 grid cell areas) to construct a
capture matrix. For the SECR models we used the complete trap layout file and indicated
when camera traps were active. We fitted a heterogeneous (Mh; heterogeneity in capture
probabilities) model to both the SECR (2-class finite mixture for heterogeneity in g0) and

5
non-spatial models (with Jack-knife estimator in CAPTURE), because such a model is
generally thought appropriate for large solitary carnivores (Karanth et al. 2004, Wang &
Macdonald 2009). Leopard density based on abundance estimates from CAPTURE were
calculated by using ½ mean-maximum-distance-moved (MMDM), where we buffered each
camera station with ½ MMDM for all individuals captured more than once to estimate an
effective trapping area (Karanth & Nichols 1998). The R package „secr‟ (Efford 2012) was
used to implement the likelihood based SECR models. SECR models do not make any
assumptions with regard to the effective survey area, can incorporate movement of camera
traps and generally produce less biased density estimates (Noss et al. 2012). For the SECR
model we assumed a half-normal detection function and a Poisson distribution of home range
centers (Efford 2004).
Leopard capture and collaring
We captured leopards from May to August 2010 using soft-hold foot snares (Frank et al.
2003). Leopards were immobilized with teletamine-zolazepam (Zoletil ® 100, Virbac RSA
(Pty) Ltd., Centurion, South Africa; dosage 4-5mg/kg). We weighed, measured, and
examined leopards for general health, and fitted three females and one male with GPS/GSM
cellular collars (Followit Tellus, Lindesberg, Sweden). The male leopard damaged and
dropped his collar shortly after capture; thus, data in this paper concern only the three
females. Immobilized leopards recovered in a wooden crate and were released near the
capture site. We conducted the study under the University of Pretoria Animal Use and Care
Committee ethics clearance protocol AO 22-06 with all its amendments and a Limpopo
Province standing permit (no. S13631) for scientific institutional research. We released all
collars from the leopards on completion of the study using a remote controlled drop-off
function.

6
Locating leopard feeding sites
We programmed collars to record a GPS location every two hours and downloaded GPS
locations via the cellular network on a daily basis. Potential predation GPS clusters were
identified and mapped in ArcGIS v.9.2 (ESRI, Redlands, CA, USA) to locate possible
leopard feeding sites (Valeix et al. 2011, Martins et al. 2011, Tambling et al. 2010). A GPS
location from each potential predation site was used to navigate to clusters on foot and
searched for prey remains for a maximum of 30 minutes. We excluded three occurrences of
scavenging (all blue wildebeest), as indicated by the lack of typical signs of a leopard
feeding/kill site (e.g., plucked hair, blood, drag marks, fighting circle), and two unidentified
prey species from the analysis. Prey remains were photographed in situ and collected for later
identification. We identified prey by either microscopic comparison of cuticular hair scale
patterns and cross sections to reference keys (Dreyer 1966, Keogh 1979, 1983, Buys &
Keogh 1984), or by macroscopic prey remains like horns and skin.
Estimation of age and mass of prey species
We used two methods to estimate the biomass of prey consumed by leopards. First, we
applied the widely used convention of a generalized “unit mass”, defined as ¾ of the average
adult female body mass for each species (referred to as the “unit mass method” herein; e.g.,
Van Orsdol et al. 1985, Radloff & Du Toit 2004, Hayward & Kerley 2005, and Hayward
2006). This method was proposed to adjust biomass calculations assuming that some calves
and sub-adults are also preyed upon (Schaller 1972). It is a popular technique because
difficulty locating kills, species characteristics (e.g., a lack of sexual dimorphism), and the
condition of prey remains make estimating the biomass consumed by carnivores difficult.
Second, we attempted to directly estimate the biomass by determining the gender and
age of each prey item. We relied on hard tissue (e.g., jaw bones, horns, hooves, and other

7
indicative bones) to determine gender and age of prey items captured by leopards. Teeth
wear, replacement, and horn growth served as the most reliable indicators of age. Mean time
of birth was recorded for group-birthing animals (e.g., impala, plains zebra) on the reserve
and was used to assist in determining the age of juveniles. We used the mean mass of the
species when suitable aging samples were absent at feeding sites. There were no abundance
estimates available for smaller species i.e., red rock rabbits (Pronolagis radensis), banded
mongooses (Mungos mungo), African civets (Civettictis civetta), and several bird species. We
therefore excluded them from the carrying capacity estimates but their small size suggests
they would not have increased the estimates using the actual dietary data.
The following studies were used to estimate age and mass of prey species: Roettcher
& Hofmann 1970, Child 1964 (impala); Simpson 1966, Wilson 1965 (kudu Tragelaphus
strepsiceros); Smuts 1972, 1974 (zebra); Wilson & Child 1965 ( klipspringer Oreotragus
oreotragus); Stoltz 1977 (baboon Papio ursinus); Seydack 1983 (bushpig Potamochoerus
larvatus); Norton & Fairall 1991 (mountain reedbuck); Wilson, Schmidt & Hanks 1984
(duiker Sylvicapra grimmia); and Skinner & Chimimba 2005(common reedbuck Redunca
arundinum).
Statistical analysis
We estimated the carrying capacity of leopards using the equation
K = 10 (-2.248=0.405x)
(Hayward et al. 2007)
where x is log10 biomass of the prey. First, we estimated biomass as ¾ of the adult female
mass of the three most preferred prey species of leopards: impala, bushbuck, and duiker
(Hayward et al. 2007, Table II). Second, we calculated biomass as the mean mass of actual
prey consumed by leopards on Welgevonden (Table II). We compared the resulting estimates

8
of carrying capacity against the population estimate obtained from mark-recapture methods
(L.H. Swanepoel, unpublished data).
We used chi-square tests to evaluate overall differences between prey biomass
calculated directly and estimated by the unit mass method. We also used Strauss‟ linear index
of selection (Li = unit massi – direct estimationi; Strauss 1979) to determine if the unit mass
method over- or underestimated our direct calculations of the consumed biomass of each prey
species. Strauss‟ linear index of selection gives values from -1, representing a large
underestimation, to 1, representing a large overestimation of prey biomass with the unit mass
method.
Results
Over a period of five months, we visited 200 potential feeding sites of three female
leopards, 96 of which were determined to be actual leopard feeding sites. Leopards preyed
Table I. Prey item remains located at leopard feeding sites. The determined biomass was calculated with
consideration of gender and age of the prey actually consumed. The unit mass method estimates body mass of
each species as ¾ of adult female body mass.
Biomass
Species Number % of Kills Determined Unit Mass
Impala 18 20.22 20.42 15.77
Kudu 4 4.5 25 13.8
Mountain reedbuck 7 7.9 7.2 3.6
Common reedbuck 1 1.1 2.6 1.5
Klipspringer 11 12.4 5.6 3.1
Zebra 8 9 12.2 51.3
Baboon 18 20.22 18.7 6
Bushpig 2 2.25 4.8 2.4

9
upon a total of 14 species with the most commonly taken prey items being baboons (20.2% of
all identified prey), impala (20.2%), and klipspringers (12.4%) (Table I). Duiker (n = 1) and
bushbuck (n = 0), which are often considered to be preferred prey of leopards, were rarely or
never consumed in this study. Smaller prey species like banded mongooses, red rock rabbits,
African civets, and several bird species accounted for 3.5% of the leopard‟s biomass intake.
Distinct age preferences were seen in some prey, like zebras, where only foals were preyed
upon.
Table II. Minimum, maximum, and average masses of prey taken by leopards on Welgevonden represent the
published values for the ages and genders of individuals found at feeding sites. The ¾ adult female masses are
used in calculations of carrying capacity assuming we had no knowledge of genders and ages of taken prey. The
percentage of kills estimated refers to the % of kills where age-indicative prey remains were located. Ratio
refers to the ratio of juvenile to sub-adult to adult for prey species where age-indicative prey remains were
located.
Species
Minimum
mass
Maximum
mass
Average
mass
% of kills
estimated
(n)
Ratio Unit mass
Impala 10 45 25.71 50 (9) 4:2:3 31.5
Kudu 99 190 143 100 (4) 0:2:2 123.75
Mountain reedbuck 8 31 23.5 43 (3) 1:0:2 18.375
Common reedbuck 60 60 60 100 (1) 0:0:1 52.5
Klipspringer 11 12 11.5 55 (6) 0:0:6 10.125
Zebra 35 35 35 100 (8) 8:0:0 230.625
Baboon 16 35.5 23.79 50 (9) 0:1:8 12
Bushpig 55 55 55 100 (2) 0:0:2 42.75
Chi-square analysis revealed a highly significant difference in estimated prey biomass
killed between the two methods (χ82
= 37.6, P < 0.0001). The biomass of killed zebras was

10
overestimated by the unit mass method (linear selection index: 0.391), which is caused by the
exclusive predation on zebra foals by leopards on Welgevonden (Table II). Baboons (-0.127)
and kudu (0.112) were the two most underestimated prey species.
We photographed 16 individual leopards which equated to a density of 4.5± 1.48
leopards /100km² (CL = 3.0–6.2) using CAPTURE which yielded an estimate of 17 leopards
for Welgevonden; SECR yielded an estimate of 13 leopards for Welgevonden (density = 3.26
± 1.42 leopards per 100km2, CL = 1.44-7.36).
Table III. Abundance and biomass data (based on actual kills and ¾ adult female body mass) from
Welgevonden. While all actual prey items were used in our refined calculations of the carrying capacity, only
those significantly preferred prey species with asterisks (*) were used in estimations of carrying capacity using
the traditional method.
Species Abundance
estimate
Owen-Smith &
Mills (2008)
correction factors
Biomass based on
body mass of
actual prey
individuals (kg
km-2
)
Biomass
based on ¾
adult female
body mass
(kg km-2
)
Baboon 828 1.2 52.5 24.8
Bushpig 129 3 0 15.5
Common duiker 3 1 0 0.1 *
Impala 1105 1.7 75.8 60.2 *
Klipspringer 16 1 0.5 0.4
Kudu 275 1.8 105 99.1
Reedbuck, common 159 3 25.4 16.2
Reedbuck, mountain 45 3 2.8 2.7
Zebra, plains 728 1.2 68 339.9

11
Using the preferred prey species model (Hayward et al. 2007) of leopard carrying
capacity and calculating biomass as ¾ adult female body mass yielded an estimate of 11
leopards (3.1 per 100 km2; Table III), which is six below the CAPTURE estimate of 17 and
two below the SECR estimate of 13. Calculating carrying capacity based on the calculated
biomass of the actual prey consumed (i.e., accounting for all species consumed as well as the
age and gender of each individual) yielded an estimate of carrying capacity of 22.
Discussion
Our leopard density estimates concur with various other studies where likelihood based
SECR models estimated lower densities than boundary strip methods (e.g. ½ MMDM
methods; Obbard et al. 2010, Noss et al. 2012). Boundary strip methods using ½ MMDM
seem to overestimate density because they underestimate the effective trap area which
subsequently results in an overestimation of density (Soisolo & Cavalcanti 2006, Obbard et
al. 2010). The use of SECR models have subsequently been advocated (Obbard et al. 2010,
Noss et al. 2012) since they do not rely on geographic closure (Effort 2004). They can also
account for relevant heterogeneity in capture probabilities and home ranges (Obbard et al.
2012) and include additional sources of uncertainty in the variance around estimated densities
compared to boundary strip methods (Obbard et al. 2010). The more reliable leopard
densities derived from the SECR models were similar to estimates by Gusset & Burgener
(2005; 3.2/100km2) for leopards in the Waterberg, however, it was considerably higher than
the 1.9/100km2 estimated by Grimbeek (1992). Such a difference in densities from historical
studies (e.g. Grimbeek 1992) can be due to increases in prey availability associated with
growth in game farms and game reserves in the Waterberg (De Klerk 2003). However, we
acknowledge that such differences can also arise due to different methodologies used by the

12
different studies (e.g. density estimates derived from track counts, capture-recapture and from
radio-tracking data).
Taking into consideration only the species for which population estimates were available,
female leopards on Welgevonden consumed prey species ranging in size from 8-190 kg
(Table II). There were obvious differences in the estimated mass of several prey species when
using the unit mass method and direct estimation. For example, since the leopards in this
study mostly preyed upon adult baboons rather than sub-adults (Jooste et al. in press), we
estimated an average mass of nearly 24 kg, compared to 12 kg as specified by the unit mass
method. The leopards in this study preyed commonly on baboons (Table I), and these
estimated mass differences (which lead to underestimates of biomass intake in the unit mass
method) affected estimated carrying capacity estimates. The same holds for kudu where we
estimated an average of 143 kg compared to the previously used 123.75 kg.
We found the standard method of using ¾ of the adult female body mass to estimate
the biomass eaten by large carnivores underestimated the leopard carrying capacity at
Welgevonden when using the CAPTURE estimate (11 vs. 17); however, it was within closer
range to the more reliable SECR estimate (11 vs. 13). There are two possible reasons for this
slight underestimation. First, the average masses of almost all prey species taken by leopards
in this study were underestimated by the unit mass method except for plains zebra, which was
overestimated. The most underestimated mass were those of kudu, baboon, and mountain
reedbuck, all because mostly adults were taken. Conversely, all plains zebras preyed upon
were foals, which resulted in an overestimation of biomass from the unit mass method.
Predation on zebras mainly occurred after the onset of the first summer rains, which may
have forced plains zebras into the mountains where juveniles were especially susceptible to
predation. Given intraspecific differences in the mass of prey species, we recognize that

13
calculations of prey biomass based on studies done in other areas may lead to biases in our
Strauss‟ index values. Second, basing calculations of density on the biomass of species
preferentially taken by leopards elsewhere (bushbuck, common duiker, and impala) as
suggested by Hayward et al. (2007) seems to create a bias in the estimate because of
differences in prey taken. Prey abundance estimates from Welgevonden suggest that common
duiker and bushbuck are present in negligible densities; thus leopards can‟t prey on them.
Therefore, such estimates underestimate the biomass available to support leopards and thus
the estimated carrying capacity. However, when using the SECR leopard density estimate,
the preferred prey species model proved reliable. An alternative explanation for the
underestimation by the model is that leopards may be above the reserve‟s carrying capacity,
especially if leopards are hunting livestock on adjacent farmland and using Welgevonden as a
refuge, allowing a higher population to be sustained with reduced food availability on site.
However, we didn‟t locate any livestock remains at leopard feeding sites in this study. It is
also important to note that using GPS clusters to locate leopard kills are biased towards
bigger prey items and could explain why the unit mass method estimation was closer to the
SECR estimate than when using the actual biomass (11-13 vs 22-13). However, this bias
seems to be less pronounced for leopards than other large carnivores (Martins et al. 2011)
Our study demonstrates that two important variables in biomass computation, namely
prey selection and prey mass, can influence carnivore carrying capacity predictions. While
Hayward et al. (2007) successfully predicted a range of carnivore carrying capacities across
South Africa, and although not apparent in our study, we suggest that for leopards at least
some local populations might be over- or underestimated using the generalized unit mass
rather than site specific kill information, especially when prey species absent from the
specific study area are included in the carrying capacity model. Leopard feeding ecology has
been biased towards the more mesic parts of South Africa, with few studies in mountainous

14
areas. However, the recent advances in GPS telemetry systems will undoubtedly improve
dietary studies for data poor areas, which will greatly improve biomass computations and
predictions for carnivore carrying capacity. However, taking into consideration the advances
of spatially explicit density prediction methods (Noss et al. 2012), we recognize that predator
carrying capacity can reliably be predicted using the preferred prey species model, even in a
mountain population.
Although our study contributes firsthand knowledge to large carnivore predation and
carrying capacity prediction, we acknowledge some shortcomings of our study. First, the
model predicts carrying capacity and not population size; thus, to test the predictive success
of the model, we need several years of data. In addition, we make the assumption that the
current leopard population estimate is accurate. Using a non-spatial approach such as
CAPTURE could have overestimated the population size (Noss et al. 2012). We also did not
take gender or other covariates into consideration in the SECR or CAPTURE models, which
could have underestimated leopard density and abundance (Gray & Prum 2011).
Second, we only have a sample size of three females which may result in a biased
record of prey selection in the population as a whole. If this bias leads to underestimating
prey biomass (because leopards are size-constrained predators and females are smaller than
males), our carrying capacity predictions may be too high. Conversely, if larger males can
prey upon a wider range of species, our estimates may have underestimated biomass available
and therefore carrying capacity. Third, the annual aerial counts could have undercounted the
small, cryptic prey species which leopards do eat on Welgevonden (e.g., klipspringer), which
could lead to an underestimation of carrying capacity estimates. Although correction factors
(Owen-Smith & Mills 2008) were applied to adjust prey counts, differences in vegetation
types in Kruger National Park and our study area could have caused potential biases. Fourth,
we were unable to collect data year round (late winter – midsummer) and prey selection is

15
likely to change (e.g., zebra foals are obviously only seasonally available). Finally, the body
masses we used were obtained from studies of savanna prey species, which may be different
than body masses of these species in more nutrient-deficient, mountainous areas.
Nevertheless, we still show that biomass computation can vary greatly from the unit mass
method and should be taken into account in estimating predator carrying capacities,
especially for understudied areas or populations.
Management Implications
Estimating carrying capacities using the unit mass method may be the best information
available in some cases (particularly where no information about the actual diet is available).
Using data on the actual diet of large predators, as we have done here, is time consuming and
logistically difficult, and did not improve carrying capacity estimates. It is possible that
inclusion of more study animals over several seasons would potentially eliminate the
discrepancy between methods in predator abundance estimates and therefore general
consensus needs to be reached regarding sampling intensity. Where detailed annual
information on the diet of predators is unavailable, the coarser unit mass method is likely to
continue to yield viable estimates of carrying capacity.
Acknowledgments
We thank the management team of Welgevonden Private Game Reserve for assistance during
fieldwork and Justin Boyles for valuable input into this paper. Funding was received from the
Wilson Foundation and Centre for Wildlife Management, University of Pretoria. Darien
Simpson and Anton van Loggerenberg assisted with the capturing of leopards. LHS was
supported by National Research Foundation grant nr. 74819. We also thank two anonymous
reviewers for the improvement of this paper.

16
References
Buys D & Keogh HJ (1984) Notes on the microstructure of hair of the Orycteropodidae,
Elephantidae, Equidae, Suidae and Giraffidae. S Afr J Wildl Res14: 111-119
Bisset C, Bernard RTF & Parker DM (2012) The response of lions (Panthera leo) to changes
in prey abundance on an enclosed reserve in South Africa. Acta Theriologica 57:225-
231
Child G (1964) Growth and ageing criteria of impala, Aepyceros melampus. Arnoldia 27:128-
135
De Klerk A (2003) Waterberg biosphere: a land use model for ecotourism development. MSc
thesis, University of Pretoria.
Dreyer JH (1966) A study of the hair morphology in the family Bovidae. Onderstepoort J Vet
Res 379-472
Efford M (2004) Density estimation in live-trapping studies. Oikos 106:598-610
Efford MG, Borchers DL & Byrom AE (2009) Density estimation by spatially explicit
capture-recapture: likelihood-based methods In: Modeling demographic processes in
marked populations: 255-269. Thompson DL, Cooch EG & Conroy MJ (Eds.). New
York: Springer
Efford MG (2012) secr: Spatially explicit capture-recapture models. R package version 2.3.2.
http://CRAN.R-project.org/package=secr
Estes JA, Terborgh J, Brashares JS, Power ME, Berger J, Bond WJ, Carpenter SR, Essington
TE, Holt RD, Jackson JBC, Marquis RJ, Oksanen L, Oksanen T, Paine RT, Pikitch EK,
Ripple WJ, Sandin SA, Scheffer M, Schoener TW, Shurin JB, Sinclair ARE, Soulé ME,
Virtanen R, and Wardle DA (2011) Trophic downgrading of planet earth. Science
333:301-306

17
Frank L, Simpson D & Woodroffe R (2003) Foot snares: An effective method for capturing
African lions. Wildl Soc Bull 31:309-314
Fuller TK & Sievert PR (2001) Carnivore demography and the consequences of changes in
prey availability. In JL Gittleman, SM Funk, DW MacDonald & RK Wayne, editors.
Carnivore Conservation. Cambridge University Press and the Zoological Society of
London, Cambridge
Gerber B, Karpanty S & Kelly MJ (2012) Evaluating the potential biases in carnivore
capture–recapture studies associated with the use of lure and varying density estimation
techniques using photographic-sampling data of the Malagasy civet. Popul Ecol 54:43-
54
Gray TNE & S Prum (2012) Leopard density in post-conflict landscape, Cambodia: Evidence
from spatially explicit capture–recapture. The Journal of Wildlife Management 76:163-
169
Grimbeek AM (1992) The ecology of the leopard (Panthera pardus) in the Waterberg. MSc
thesis, University of Pretoria, Pretoria.
Gusset M & Burgener N (2005) Estimating larger carnivore numbers from track counts and
measurements. Afr J Ecol 43: 320-324.
Hayward MW (2006) Prey preferences of the spotted hyaena (Crocuta crocuta) and degree of
dietary overlap with the lion (Panthera leo). J Zool (London) 270:606-614
Hayward MW, Adendorff J, Moolman LC, Hayward GJ, Kerley GIH (2007b) The successful
reintroduction of leopard Panthera pardus to the Addo Elephant National Park. Afr J
Ecol 45:103-104
Hayward MW, Henschel P, O'Brien J, Hofmeyr M, Balme G & Kerley GIH (2006) Prey
preferences of the leopard (Panthera pardus). J Zool (London) 270: 298-313

18
Hayward MW & Kerley GIH (2005) Prey preferences of the lion (Panthera leo). J Zool
(London) 267:309-322
Hayward MW, O‟Brien J & Kerley GIH (2007) Carrying capacity of large African predators:
Predictions and tests. Biol Conserv 139:219-229
Jooste E, Pitman RT, Van Hoven W & Swanepoel LH (2013) Unusually high predation on
Chacma baboons by female leopards in the Waterberg Mountains, South Africa. Folia
Primatol: In Press
Karanth KU & JD Nichols (1998) Estimation of tiger densities in India using photographic
captures and recaptures. Ecology 79:2852-2862
Karanth KU & J D Nichols, editors (2002) Monitoring tigers and their prey: A manual for
Researchers, Managers and Conservationists in Tropical Asia. Centre for Wildlife
Studies, Bangalore, India
Karanth KU, Chundawat RS, Nichols JD & Kumar NS (2004) Estimation of tiger densities in
the tropical dry forests of Panna, Central India, using photographic capture-recapture
sampling. Anim Conserv 7:285-290
Keogh HJ (1979) An atlas of hair from southern African mammal species with reference to
its taxonomic and ecological significance. Dissertation, University of Pretoria
Keogh HJ (1983) A photographic reference system of the microstructure of the hair of
southern African bovids. S Afr J Wildl Res 13:89-132
Kilian PJ (2003) The ecology of reintroduced lions on the Welgevonden Private Game
Reserve, Waterberg. Thesis, University of Pretoria
Martins Q, Horsnell WGC, Titus W, Rautenbach T & Harris S (2011) Diet determination of
the Cape Mountain leopards using global positioning system location clusters and scat
analysis. J Zool (London) 283:81-87
19
Norton PM & Fairall N (1991) Mountain reedbuck Redunca fulvorufula growth and age
determination using dentition. J Zool (London) 225:293-307
Noss AJ, Gardner B, Maffei L, Cuéllar E, Montaño R, Romero-Muñoz A, Sollman R &
O‟Connell AF (2012) Comparison of density estimation methods for mammal
populations with camera traps in the Kaa-lya del Gran Chaco landscape. Anim Conserv
doi:10.1111/j.1469-1795.2012.00545x
Obbard ME, Howe EJ & Kyle CJ (2010) Empirical comparison of density estimators for
large carnivores. J Appl Ecol 47: 76-84
Owen-Smith N & Mills MGL (2008) Predator-prey size relationships in an African large-
mammal food web. J Anim Ecol 77:173–183
Radloff FGT & Du Toit JT (2004) Large predators and their prey in a southern African
savanna: a predator‟s size determines its prey size range. J Anim Ecol 73:410-423
Rexstadt E & Burnham K (1991) User‟s guide for interactive program CAPTURE. Colorado
Cooperative Fish and Wildlife Research Unit, Colorado State University, Fort Collins,
Colorado 80523, USA
Roettcher D & Hofmann RR (1970) The ageing of impala from a population in the Kenya rift
valley. East Afr Wildl J 8:37-42
Schaller GB (1972) The Serengeti lion. University of Chicago Press, Chicago
Seydack AHW (1983) Age assessment of the bushpig Potamochoerus porcus Linn. 1758 in
the Southern Cape. Thesis, University of Pretoria
Simpson CD (1966) Tooth eruption, growth and ageing criteria in greater kudu –
Tragelaphus strepsiceros pallas. Arnoldia 2:1-12
Skinner JD & Chimimba CT (Rev) (2005) The mammals of the southern African subregion.
3rd ed. Cambridge University Press, Cambridge

20
Smuts GL (1972) Seasonal movements, migration and age determination of Burchell‟s zebra
(Equus burchelli antiquorum, H. Smith, 1841) in the Kruger National Park. Thesis,
University of Pretoria
Smuts GL (1974) Growth, reproduction and population characteristics of Burchell‟s zebra
(Equus burchelli antiquorum, H. Smith, 1841) in the Kruger National Park.
Dissertation, University of Pretoria
Soisolo MK & Cavalcanti SMC (2006) Estimating the density of a jaguar population in the
Brazilian Pantanal using camera-traps and capture-recapture sampling in combination
with GPS radio-telemetry. Biol Conserv 129: 487-496
Stoltz LP (1977) The population dynamics of baboons Papio ursinus Kerr 1792, in the
Transvaal. Dissertation, University of Pretoria
Strauss RE (1979) Reliability estimates for Ivlev‟s electivity Index, the forage ratio, and a
proposed linear index of food selection. T AM Fish Soc 108:344-352
Tambling CJ, Cameron EZ, Du Toit JT & Getz WM (2010) Methods for locating African
lion kills using global position system movement data. J Wildl Manage 74:549-56
Valeix M, Chamaille´-Jammes S, Loveridge AJ, Davidson Z, Hunt JE, Madzikanda H &
Macdonald DW (2011) Understanding patch departure rules for large carnivores: Lion
movements support a patch-disturbance hypothesis. Am Nat 178:269-275
Van Orsdol KG, Hanby JP & Bygott JD (1985) Ecological correlates of lion social
organisation (Panthera leo). J Zool (London) 206:97-112
Wang SW & DW Macdonald (2009) The use of camera traps for estimating tiger and leopard
populations in the high altitude mountains of Bhutan. Biol Conserv 142:606-613
Wilson VJ (1965) Observations on the greater kudu Tragelaphus strepsiceros pallas
from a tsetse control hunting scheme in Northern Rhodesia. East Afr Wildl J 3:27-37

21
Wilson VJ & Child G (1965) Notes on Klipspringer from Tsetse fly control areas in Eastern
Zambia. Arnoldia 1:1-19
Wilson VJ, Schmidt JL & Hanks J (1984) Age determination and body growth of the
common duiker Sylvicapra grimmia (Mammalia). J Zool (London) 202:283-297
Copyright © 2022 FDOKUMEN