Dynamics of free-living nitrogen-fixing bacterial populations and nitrogen fixation in a...
16
ecological modelling 218 ( 2 0 0 8 ) 323–338 available at www.sciencedirect.com journal homepage: www.elsevier.com/locate/ecolmodel Dynamics of free-living nitrogen-fixing bacterial populations and nitrogen fixation in a two-prey–one-predator system A. Kavadia a,b,c , D.V. Vayenas b , S. Pavlou c , G. Aggelis a,∗ a Division of Genetics, Cell & Development Biology, Department of Biology, University of Patras, Patras, Greece b Department of Environmental and Natural Resources Management, School of Natural Resources and Enterprise Management, University of Ioannina, Agrinion, Greece c Department of Chemical Engineering, University of Patras, and Institute of Chemical Engineering and High Temperature Chemical Processes-FORTH, Patras, Greece article info Article history: Received 20 October 2007 Received in revised form 17 July 2008 Accepted 17 July 2008 Published on line 28 August 2008 Keywords: Population dynamics Nitrogen fixation Competition Predation Coexistence abstract The dynamics of a model of a free-living nitrogen-fixing population, grown in a chemostat together with a non-nitrogen-fixing bacterial population in competition for the available nutrients and a predator, was studied through bifurcation analysis. When the nitrogen- fixing population is slightly inhibited by ammonium nitrogen (NH 3 ), then this population survives at steady state at low NH 3 concentration for a wide range of dilution rate values. At high NH 3 concentration the nitrogen-fixing population survives at high dilution rate values, while at lower dilution rate values survival of the nitrogen-fixing population is possible when both the competitive population and the predator are present. When inhibition of NH 3 is high, the nitrogen-fixing population survives at steady state at low NH 3 concentrations for a wide range of dilution rate values, while at high NH 3 concen- tration the competitive prey stimulates the coexistence state of all populations. Therefore, under high NH 3 concentration conditions the competitive population appears to be benefi- cial for the system and for the survival of the nitrogen-fixing prey. However, the presence of the competitive prey, in the regions where the nitrogen-fixing prey coexists with its predator at a stable state seems to have a negative effect on the nitrogen-fixing activity. © 2008 Elsevier B.V. All rights reserved. 1. Introduction The biogeochemical cycle of nitrogen is essential for agricul- ture, as well as for the productivity of natural ecosystems. Nitrogen being of major importance for all living organisms is often a limiting growth factor in soil ecosystem. Soil reservoirs are fed by biologically fixed nitrogen and/or by chemically fixed nitrogen (in the form of fertilizers) but the balance is frequently negative due to significant losses of this element through denitrification, erosion, leaching and volatilization. ∗ Corresponding author. Tel.: +30 2610969260; fax: +30 2610969260. E-mail address: [email protected] (G. Aggelis). Among the various steps of the nitrogen cycle, nitrogen fixation should be considered as the limiting step as it is functioned by a restricted number of prokaryotes, i.e., those belonging to the genus Azospirillum, and specific symbiotic associations, including the well-known association of Rhi- zobium or Bradyrhizobium with leguminous plants (Postgate, 1982; Bailey and Ollis, 1986; Atlas and Bartha, 1993). Bio- logical nitrogen fixation is, in fact, a unique activity, in which specific bacterial populations are involved, and which is controlled, and restricted, by many physicochemical and 0304-3800/$ – see front matter © 2008 Elsevier B.V. All rights reserved. doi:10.1016/j.ecolmodel.2008.07.018
-
Upload
independent -
Category
Documents
-
view
2 -
download
0
Transcript of Dynamics of free-living nitrogen-fixing bacterial populations and nitrogen fixation in a...
Da
Aa
b
Uc
P
a
A
R
R
1
A
P
K
P
N
C
P
C
1
TtNoafift
0d
e c o l o g i c a l m o d e l l i n g 2 1 8 ( 2 0 0 8 ) 323–338
avai lab le at www.sc iencedi rec t .com
journa l homepage: www.e lsev ier .com/ locate /eco lmodel
ynamics of free-living nitrogen-fixing bacterial populationsnd nitrogen fixation in a two-prey–one-predator system
. Kavadiaa,b,c, D.V. Vayenasb, S. Pavlouc, G. Aggelisa,∗
Division of Genetics, Cell & Development Biology, Department of Biology, University of Patras, Patras, GreeceDepartment of Environmental and Natural Resources Management, School of Natural Resources and Enterprise Management,niversity of Ioannina, Agrinion, GreeceDepartment of Chemical Engineering, University of Patras, and Institute of Chemical Engineering and High Temperature Chemicalrocesses-FORTH, Patras, Greece
r t i c l e i n f o
rticle history:
eceived 20 October 2007
eceived in revised form
7 July 2008
ccepted 17 July 2008
ublished on line 28 August 2008
eywords:
opulation dynamics
itrogen fixation
a b s t r a c t
The dynamics of a model of a free-living nitrogen-fixing population, grown in a chemostat
together with a non-nitrogen-fixing bacterial population in competition for the available
nutrients and a predator, was studied through bifurcation analysis. When the nitrogen-
fixing population is slightly inhibited by ammonium nitrogen (NH3), then this population
survives at steady state at low NH3 concentration for a wide range of dilution rate values. At
high NH3 concentration the nitrogen-fixing population survives at high dilution rate values,
while at lower dilution rate values survival of the nitrogen-fixing population is possible
when both the competitive population and the predator are present.
When inhibition of NH3 is high, the nitrogen-fixing population survives at steady state at
low NH3 concentrations for a wide range of dilution rate values, while at high NH3 concen-
ompetition
redation
oexistence
tration the competitive prey stimulates the coexistence state of all populations. Therefore,
under high NH3 concentration conditions the competitive population appears to be benefi-
cial for the system and for the survival of the nitrogen-fixing prey. However, the presence of
the competitive prey, in the regions where the nitrogen-fixing prey coexists with its predator
at a stable state seems to have a negative effect on the nitrogen-fixing activity.
1982; Bailey and Ollis, 1986; Atlas and Bartha, 1993). Bio-logical nitrogen fixation is, in fact, a unique activity, in
. Introduction
he biogeochemical cycle of nitrogen is essential for agricul-ure, as well as for the productivity of natural ecosystems.itrogen being of major importance for all living organisms isften a limiting growth factor in soil ecosystem. Soil reservoirsre fed by biologically fixed nitrogen and/or by chemicallyxed nitrogen (in the form of fertilizers) but the balance is
requently negative due to significant losses of this elementhrough denitrification, erosion, leaching and volatilization.∗ Corresponding author. Tel.: +30 2610969260; fax: +30 2610969260.E-mail address: [email protected] (G. Aggelis).
304-3800/$ – see front matter © 2008 Elsevier B.V. All rights reserved.oi:10.1016/j.ecolmodel.2008.07.018
© 2008 Elsevier B.V. All rights reserved.
Among the various steps of the nitrogen cycle, nitrogenfixation should be considered as the limiting step as it isfunctioned by a restricted number of prokaryotes, i.e., thosebelonging to the genus Azospirillum, and specific symbioticassociations, including the well-known association of Rhi-zobium or Bradyrhizobium with leguminous plants (Postgate,
which specific bacterial populations are involved, and whichis controlled, and restricted, by many physicochemical and

i n g
324 e c o l o g i c a l m o d e l lbiological factors. All other organisms (animals, plants, andmicroorganisms) require for growth fixed forms of nitrogen.
Many studies have been concerned with the physiology,ecology and potential use of Azospirillum sp. in agriculture andenvironmental biotechnology due to their ability of efficientlyconverting molecular nitrogen into ammonium (Ueckert andFendrik, 1995; Kefalogianni and Aggelis, 2002; Tsagou et al.,2003; Bahat-Samet et al., 2004; Bashan and Holguin, 1997;Bashan et al., 2004). This conversion is performed through theaction of nitrogenase complex the synthesis and activity ofwhich is strongly repressed by ammonium and molecular oxy-gen (Steenhoudt and Vanderleyden, 2000; Tsagou et al., 2003).
Bacterial growth depends on the abundance of energyresources in the growth environment. In the natural ecosys-tems the low availability of assimilative carbon is critical forthe microbial growth and survival, especially for nitrogen-fixing populations, since the fixation of nitrogen is a highlyenergy consuming process, requiring 20–30 ATP molecules permole of N2 reduced to NH3 (Klucas, 1991).
It is well known that ammonium nitrogen inhibits thenitrogenase complex (responsible for the conversion of molec-ular nitrogen into ammonium), in both transcriptional andenzymatic activity levels (Steenhoudt and Vanderleyden,2000). On the other hand, ammonium nitrogen has a doubleeffect on the growth of Azospirillum. Under aerobic conditionsit enhances the growth of these bacteria (Okon et al., 1976)but under high ammonium and low dissolved oxygen con-centrations the growth is inhibited (Hurek et al., 1987; Tsagouet al., 2003; Bashan et al., 2004; Tsagou and Aggelis, 2006).However, under microaerobic conditions Azospirillum can growin the presence of low ammonium nitrogen concentration,while after the depletion of ammonium nitrogen, they are ableto grow by fixing molecular nitrogen (Fritzsche et al., 1990;Fritzsche and Niemman, 1990; Kefalogianni and Aggelis, 2002;Tsagou and Aggelis, 2006). However, even if the growth con-ditions are optimal, the rate of nitrogen fixation is low andis considered as the limiting growth step (Kefalogianni andAggelis, 2002; Tsagou et al., 2003).
In a soil ecosystem the free-living nitrogen-fixing popu-lations are affected by several biotic interactions, includingpredation by protozoa and Bdellovibrio and related species(Mallory et al., 1983; Germida, 1987; Rønn et al., 2001; Davidovet al., 2006; Rogosky et al., 2006), parasitism by bacteriophages,microbial competition for resources and direct interspecificmicrobial interactions. Interspecific interactions might haveeither negative effects on the microbial community (i.e.,inhibitory effects due to the production of chemical sub-stances possessing antimicrobial activity) or positive effects(i.e., through the increase of nutrient availability) (Strigul andKravchenko, 2006).
Numerous mathematical models have been used in thestudy of interactions between species that share commonresources and of the effect of predators on the dynamics ofbiological systems (Smith and Waltman, 1995; Leibold, 1996;Krivan and Sikder, 1999; Kooi and Kooijman, 2000; Pelletier,2000; Richards et al., 2000; Krivan and Eisner, 2003; Krivan,
2003; Aggelis et al., 2005; Vayenas and Pavlou, 1999, 2001;Vayenas et al., 2005; Pei et al., 2005).In the case of competition, Kooi and Kooijman (2000) provedthat a competitor can stabilize a nutrient–prey–predator sys-
2 1 8 ( 2 0 0 8 ) 323–338
tem, while Zhang (2003), introducing mutualism in competi-tive systems, showed that coexistence of populations is pro-moted while the carrying capacity of the system is enhanced.
In a previous work, we studied the dynamics of a free-living nitrogen-fixing population in antagonistic conditions(Kavadia et al., 2006). It was shown that the nitrogen-fixingpopulation was able to survive alone or together with its com-petitor at high carbon and ammonium concentrations in awide range of parameter values but at low carbon concentra-tion it could survive only if it had the competitive advantageover its competitor. In particular, the competitor’s existencewas beneficial for the system and enhanced coexistence byclearing the growth environment from ammonium, which isan inhibitor for the nitrogen-fixing population.
In this paper, the dynamics of a nitrogen-fixing populationis studied in a two-prey–one-predator system. The system isstudied using bifurcation analysis in order to determine theinfluence of several important parameters on the survival ofthe nitrogen-fixing population. Specifically, the effect of theammonium nitrogen concentration in the feed and the preda-tor’s effect is studied for a wide range of operating conditionsand parameter values, and some practical conclusions aredrawn.
2. Modeling
It is assumed that two populations (N1 and N2) grow in thesame chemostat together with their predator (P), which preyson them at various rates. N1 is a nitrogen-fixing populationand N2 grows competitively to N1. Both prey populations growon the same nutrients (carbon and mineral nitrogen), whichact as limiting factors. It is assumed that the concentrationof the dissolved oxygen in the growth environment is lowenough to allow nitrogenase synthesis (when the ammoniumconcentration is low). The distinction of this system from thetypical two-prey–one-predator systems is associated with thepresence of nitrogenase complex in the system. This enzymepermits the nitrogen-fixing population to fix nitrogen, whenthe concentration of NH3 in the growth environment is low.Indeed, the nitrogen-fixing population is able to partition thecarbon source in order to sustain both synthesis of cellularmass and nitrogen fixation. Therefore, an important amountof the carbon source is absorbed in the nitrogenase reaction.
Besides the negative effect of the ammonium ions onthe nitrogenase synthesis and activity, the nitrogen-fixingpopulation is strongly inhibited by high concentration ofammonium nitrogen in the growth environment (Hurek etal., 1987; Tsagou et al., 2003; Tsagou and Aggelis, 2006). Thisfeature is taken into account in the model development, andvarious nitrogen-fixing populations, showing different resis-tances to the ammonium nitrogen, are considered.
A conceptual diagram illustrating the system is given inFig. 1 while the mathematical model used is presented below.
Balance of populations:
dN1
dt= (r1 − D)N1 − rP1 P
1YP/N1
(1)

e c o l o g i c a l m o d e l l i n g 2 1 8 ( 2 0 0 8 ) 323–338 325
Fig. 1 – Conceptual diagram illustrating the model used for the study of the dynamics of a nitrogen-fixing population grownin a two-prey–one-predator system. A nitrogen-fixing population (N1) grows together with a competitive population (N2) inthe presence of ammonium nitrogen (NH3). The limiting growth factors are for both populations the carbon and energysource (S) and the NH3. The predator (P) preys on the two populations with different rates. When the concentration of NH3 isl d niti e N1
wpapc
wiygry
wcY
n
ow in the growth environment, growth of N1 population ans accumulated in the growth environment, then, besides th
dN2
dt= (r2 − D)N2 − rP2 P
1YP/N2
(2)
dP
dt= (rP1 + rP2 ) P − DP (3)
here r1 and r2 are the specific growth rates of the N1 and N2
opulations, respectively; D is the chemostat dilution rate; rP1
nd rP2 are the specific growth rates of predator on N1 and N2
opulations, respectively; YP/N1 and YP/N2 are the yield coeffi-ients of P on N1 and N2 populations, respectively.
Balance of carbon and energy resource:
dS
dt= D(Sf − S) − r1N1
1YN1/S
− r2N21
YN2/S− rEEN1
1YNH3/S
(4)
here Sf and S are the carbon source concentrations in thenlet and outlet medium, respectively; YN1/S and YN2/S are theield coefficients of N1 and N2 on S, respectively; E is the nitro-enase concentration (units per volume of N1); rE is the specificate of nitrogen fixation; YNH3/S is the ammonium nitrogenield coefficient on S.
Balance of ammonium nitrogen:
dNH3
dt= D
[(NH3)f − (NH3)
]+ rEEN1 − r1N1
1YN1/NH3
− r2N21
YN2/NH3
(5)
here (NH3)f and (NH3) are the ammonium nitrogen con-entrations in the inlet and outlet medium, respectively;
N1/NH3 and YN2/NH3 are the yield coefficients on ammonium
itrogen of N1 and N2, respectively.Balance of nitrogenase (units per volume of N1):
dE
dt= qE − rDE − r1E (6)
rogenase (E) synthesis and activity are favored. When NH3
population, E synthesis and activity are inhibited.
where qE is the specific rate of nitrogenase synthesis; rD isthe specific rate of nitrogenase destruction. In Eq. (6) the termr1E represents the decrease of active protein concentrationobserved due to the increase of the cell volume (Fredrickson,1976).
The specific growth rate of the N1 population is modeledby the model proposed by Monod (1942) as modified by Graefand Andrews (1974):
r1(S, NH3) = r1 maxS
K1S + S
NH3
K1NH3 + NH3 +(
KiNH3 (NH3)2) (7)
where r1 max is the maximum specific growth rate; K1S andK1NH3 are the saturation constants for S and NH3, respectively;KiNH3
is the inhibition constant of ammonium nitrogen on N1.The nitrogen-fixing activity is regulated in both nitrogenase
synthesis (genes transcription) and nitrogenase activity levels,as given in Eqs. (8)–(10).
The specific rate of nitrogenase synthesis is given as
qE(Q, r1) = ar1Q (8)
where Q is described by the equation:
Q(NH3) = 11 + C NH3
(9)
where C is a parameter related to the nif operators found undercatabolic repression.
In Eq. (8) Q is a function of the repressive compound (NH3).The factor Q accounts for modification of the rate of nitro-genase synthesis via a catabolic repression control mode (for
mechanism of catabolic repression see Imanaka and Aiba,1977; Bailey and Ollis, 1986). In this equation, the term C repre-sents the sensitivity of the genes, which code for nitrogenasesynthesis to the ammonium nitrogen.
i n g
326 e c o l o g i c a l m o d e l lThe specific rate of nitrogen fixation is given by the equa-tion
rE(S, NH3) = rE maxKiE
KiE + NH3
S
KSE + S(10)
where rE max is the maximum specific rate of nitrogen fixation;KSE is the saturation constant; KiE is the inhibition constant.
The specific rate for microbial growth of the competitivepopulation (N2) is given by the following equation:
r2(S, NH3) = r2 maxS
K2S + S
NH3
K2NH3 + NH3(11)
where r2 max is the maximum specific growth rate of the N2
population; K2S and K2NH3 are the saturation constants for Sand NH3, respectively.
The specific growth rates of the predator on the N1 and N2
populations are given by the following equations:
rP1 (N1) = rP1 maxN1
N1 + KN1
(12)
rP2 (N2) = rP2 maxN2
N2 + KN2
(13)
where rP1 max and rP2 max are the maximum specific growthrates of the predator on N1 and N2 populations, respectively;KN1 and KN2 are the saturation constants for N1 and N2, respec-tively.
3. Methodology
The long-term behavior of the system depends on the valuesof its parameters. Of importance is the effect of the operatingparameters and in particular the chemostat dilution rate Dcontrolled by the medium flowrate through the reactor andthe ammonium nitrogen concentration in the feed.
An illustrative way to present the effect of those param-eters on the system is through two-parameter bifurcationdiagrams. In such a diagram each region represents parametervalues for which the system exhibits different dynamic behav-iors. The boundaries of those regions are locations wherebifurcations occur and the system undergoes a qualitativechange in its dynamic behavior. This qualitative change con-sists in the change of the number or the character (stability) ofsteady and periodic states. Construction of a bifurcation dia-gram is achieved by tracing the location of bifurcations in thetwo-parameter space. This is accomplished with the help ofnumerical algorithms that we have developed and are basedon the continuation algorithm AUTO (Doedel et al., 1997).
For the above-mentioned system there are six possiblesteady states:
(1) Extinction of all populations: N1 = N2 = P = 0 (washoutstate).
(2) Survival of N1 only: N1 > 0, N2 = 0, P = 0 (N1 state).(3) Survival of N2 only: N1 = 0, N2 > 0, P = 0 (N2 state).(4) Survival of N1 and P only: N1 > 0, N2 = 0, P > 0 (N1P state).(5) Survival of N2 and P only: N1 = 0, N2 > 0, P > 0 (N2P state).
2 1 8 ( 2 0 0 8 ) 323–338
(6) Coexistence of all three populations: N1 > 0, N2 > 0, P > 0(N1N2P state).
In addition to these steady states, there is the possibility ofstable periodic states of survival of N1 and P, of survival of N2
and P, or of coexistence of all populations, in which the popu-lation densities in the chemostat vary periodically with time.
The form of the bifurcation diagram of the system dependson the values of the kinetic parameters and in particular onthose of the specific growth rates of the populations. Theparameter values of predator’s specific growth rate are of greatimportance, since faster growth of the predator on one ofthe two-prey populations yields qualitative different cases.Other important parameters are the inhibition constant KiNH3
of ammonium nitrogen on the nitrogen-fixing population (rep-resenting the susceptibility of the nitrogen-fixing populationto the ammonium containing media and affecting the specificgrowth rate of the N1 population) and rmax and KS of the N1
and N2 populations that determine which prey has the com-petitive advantage. The value of operating parameter Sf for allbifurcation diagrams was kept constant at Sf = 5 g/L.
The population dynamics was studied for all possible casesby using the parameter values shown in Table 1.
4. Results
4.1. Dynamic behavior of a one-predator–two-preysystem under low ammonium nitrogen inhibition
4.1.1. The predator preys faster on the nitrogen-fixingprey than on the competitive prey (cases A–C of Table 1)In cases A–C of Table 1 the rp1 max and rp2 max values wereselected so that the predator preys faster on N1 than on N2
prey. The respective bifurcation diagrams (Figs. 2–4) consist oftranscritical bifurcation curves (T), on which two steady statesexchange stability characteristics, of Hopf bifurcation curves(H), on which stable periodic states of N1P, N2P and N1N2P coex-istence are born and of limiting-point bifurcation curves (L), onwhich two steady states are born. The character of each steadystate in the various regions of the diagrams is listed in Table 2.S denotes stable steady state, whereas U1 indicates an unsta-ble steady state with one positive eigenvalue, U2 indicates anunstable steady state with two eigenvalues with positive realparts and U3 indicates an unstable steady state with threeeigenvalues with positive real parts.
The dynamic behavior of the system in which the predatorpreys faster on N1 than on N2 is illustrated in Fig. 2 (case A). Inregion 1 of this diagram only extinction of all populations ispossible, since the washout is the only stable. In region 8 the N1
prey dominates in a steady state. In regions 9, 30, 59 and 60 theN1 population can survive in a steady state only in coexistencewith the predator. At low NH3 concentration, N1 and N1P in asteady state are observed but at high NH3 concentration val-ues, domination of the N1 population alone or in coexistencewith the predator occurs only at high D. In regions 13, 24, 47
and 63 a stable periodic state of N1P is observed while region33 exhibits multistability since stable periodic states of bothN1P and N2P appear. It depends on the initial conditions of thechemostat which of the two states will be eventually reached.
e c o l o g i c a l m o d e l l i n g 2 1 8 ( 2 0 0 8 ) 323–338 327
Table 1 – Sets of parameter values used in the analysis of the model
A B C D E F G H
rp1 max (h−1) 0.30 0.30 0.20 0.20 0.30 0.30 0.20 0.20rp2 max (h−1) 0.25 0.15 0.15 0.25 0.25 0.15 0.15 0.25KiNH3
(g/L) 0.01 0.01 0.01 0.01 0.50 0.50 0.50 0.50
ax = 0.2 h−1, rDE = 0.001 h−1, KS1 = 0.4 g/L, KS2 = 0.5 g/L, KN1 = 0.3 g/L, KN2 =N1 /S = 0.3, YN1/NH3 = 0.3, YNH3/S = 0.1, YN2 /S = 0.3, YN2/NH3 = 0.5, YP/N1 =
trN(tp1p3p
ip8sots
FsnclTr
Other parameter values used were r1 max = 0.25 h−1, r2 max = 0.2 h−1, rE m
0.3 g/L, K1NH3 = 0.1 g/L, K2NH3 = 0.5 mg/L, KiE = 0.02 g/L, KSE = 0.2 g/L, Y
0.8, YP/N2 = 0.8, C = 50 and a = 2.
In case B, the predator’s predation rate on N2 is lowerhan in case A. In the respective diagram (Fig. 3) some newegions appear, in which either stable coexistence state of
1N2P (regions 25, 27, 73 and 74) or a stable periodic state of N1Pin the regions under the H1P curve) exists. Another observa-ion is the coexistence of the N2 population together with theredator at a stable steady state in regions 26 and 34. Regions3 and 47 are smaller and regions 24 and 33 are larger com-ared to the respective regions of case A. In regions 32, 33 and5 multistability is observed, since both N1P and N2P in stableeriodic states are possible.
When the predation rate of the predator on both N1 and N2
s low (case C), the survival of N1 alone in a stable steady state isossible for a wider range of dilution rate values (Fig. 4, regionsand 52). The coexistence of N1 with the predator in this case
eems to be restricted to lower dilution rate values, because
f the N1 domination. Regions 63 and 32 have vanished, whilehe remaining regions are smaller. The region where the N1N2Ptate occurs is also smaller.ig. 2 – Bifurcation diagram for a two-prey–one-predatorystem in the case that the predator preys on theitrogen-fixing prey with a higher rate than on theompetitive prey and the ammonium nitrogen inhibition isow (case A of Table 1). Labeling of curves is presented inable 3. The character of each steady state in the variousegions is listed in Table 2.
Fig. 3 – Bifurcation diagram for a two-prey–one-predatorsystem in the case that the predator preys on thenitrogen-fixing prey with a higher rate than on thecompetitive prey and the ammonium nitrogen inhibition islow (case B of Table 1). Labeling of curves is presented inTable 3. The character of each steady state in the various
regions is listed in Table 2.4.1.2. The predator preys faster on the competitive preythan on the nitrogen-fixing prey (case D of Table 1)In the case of Fig. 5 the predator is fed mainly on the N2
prey and, as a result, the nitrogen-fixing population domi-nates. Actually, the N1 prey can survive alone (regions 8 and52) or in coexistence with its predator in a stable steady state(regions 9, 30, 59 and 60), at low ammonium concentrations,or at high ammonium concentrations and high dilution rates.Also it can survive in a stable periodic state at high ammoniaconcentrations and low dilution rates (region 47).
4.2. Dynamic behavior of a one-predator–two-preysystem under high ammonium nitrogen inhibition
4.2.1. The predator preys faster on the nitrogen-fixingprey than on the competitive prey (cases E–G of Table 1)In case E, where the N1 prey is strongly inhibited by NH3, thegeneral form of the bifurcation diagrams is completely dif-

328 e c o l o g i c a l m o d e l l i n g 2 1 8 ( 2 0 0 8 ) 323–338
Table 2 – Character of steady statea in the various regions of the bifurcation diagrams
Region Steady state
Washout state N1 state N2 state N1P state N2P state N1N2 state N1N2P state
1 S – – – – – –2 S S, U1 – – – – –3 S U1, U1 – S – – –4 S U1, U1 – U2(P) – – –5 S U1, U2 – – – – –6 U1 U1, U2 S – – – –7 U1 – S – – – –8 U1 S – – – – –9 U1 U1 – S – – –
10 U1 U1, U2 U1 U2(P) U1 – –11 U1 U1, U1 S U2(P) – – –12 U1 U1, U2 S U2(P) – U1 –13 U2 U1 U2 U2(P) U1 – –14 U1 U1, U3 U1 – – – S15 U1 U1, U3 S – – U2 –16 U1 U1, U2 U1 – S – –17 U1 – U1 – S – –18 U1 U1, U3 U1 – S U2 –19 U1 U1, U3 U2 – S – –20 U1 U1, U3 U2 – U1 – S21 U1 U1, U2 U2 U3 U1 – S22 U2 U1 U2 U3(P) U1 – S23 U2 U1 U1 U3(P) – – S24 U2 U1 U1 U2(P) – – –25 U2 U1 U2 U2(P) U1 – S, U3
26 U2 U1 U2 U2(P) S – U3
27 U2 U1 U2 U2(P) U1 – S, U1
28 U1 U1, U3 U1 – U2(P) U2 –29 U1 U1, U3 U2 – U2(P) – –30 U2 U1 U2 S U1 – –31 U1 U1, U2 U1 U3 U2(P) U2 –32 U2 U1 U2 U3(P) U2(P) – –33 U2 U1 U2 U2(P) U2(P) – U3
34 U2 U1 U2 U2(P) S – U1
35 U2 U1 U2 U2(P) U2(P) – U1
36 U1 U1, U2 U1 U2(P) – – S, U3
37 U1 U1, U2 S U3 – U1 U2
38 U1 U1, U3 S – – U1 U2
39 U1 U1, U2 U2 U2(P) U1 – S, U3
40 U1 U1, U2 U1 U2(P) S U2 U3
41 U1 U1, U2 U1 U3 S U2 –42 U1 U1, U2 U2 U2(P) S – U3
43 U1 U1, U2 U1 – U2(P) – –44 U1 U1, U2 U2 U3 S – –45 U1 U1, U2 U2 U3 U2(P) – –46 U2 U1 U2 U3(P) S – –47 U2 U1 U2 U2(P) U3 – –48 U2 U1 U1 U3 U2(P) U2 –49 U1 U1, U1 U1 U2(P) S – –50 U1 U1, U1 S S – – –51 U1 S, U1 S – – – –52 U2 S U1 – – – –53 U1 S, U2 U1 – – – –54 U1 S, U2 S – – U1 –55 U1 U1, U2 S S – U1 –56 U1 U1, U2 S U2(P) – U2 U3
57 U1 U1, U2 S U3 – U2 –58 U1 U1, U2 U1 S – – –59 U2 U1 U1 S – – –60 U2 U1 U2 S U3 – –61 U1 U1, U2 S S – U2 U1
62 U1 U1, U2 S U2(P) – U1 U2, U3

e c o l o g i c a l m o d e l l i n g 2 1 8 ( 2 0 0 8 ) 323–338 329
Table 2 (Continued )
Region Steady state
Washout state N1 state N2 state N1P state N2P state N1N2 state N1N2P state
63 U1 U1 – U2(P) – – –64 U1 U1, U1 U1 S S – –65 U1 U1, U2 U1 S S U2 U3
66 U1 U1, U2 U2 S S – U3
67 U1 U1, U2 U2 S U1 – –68 U2 U1 U2 S S – U3
69 U1 U1, U2 U1 U2 U2(P) U2 U3
70 U1 – U1 – U2(P) – –71 U1 U1, U2 U2 U2(P) U2(P) – U3
72 U1 U1, U2 U1 U2(P) S U1 –73 U2 U1 U1 U2(P) – – S, U3
74 U2 U1 U1 U2(P) – – S, U1
75 U2 U1 U2 S U3 – U3
76 U1 U1, U2 U1 U2(P) – – –77 U1 U1, U2 U1 U3 – – U2(P)78 U1 U1, U2 U1 U3 – – S79 U1 U1, U3 U1 – – – U2(P)80 U1 U1, U2 U1 U2(P) – – U2(P), U3
81 U2 U1 U2 S U2(P) – U3
82 U2 U1 U1 U2(P) – – U2(P), U3
83 U1 U1, U2 U2 S U1 – S, U1
84 U1 U1, U2 U2 S S – U1
85 U2 U1 U2 S S – U1
86 U1 U1, U2 U1 S – – U2(P), U3
87 U1 U1, U2 U1 S – – S, U3
88 U2 U1 U1 S – – S, U3
89 U1 U1, U2 U2 U2(P) U1 – –90 U1 U1, U2 U1 U2(P) – – S, U3
91 U1 U1, U2 S U2(P) – U2 U3
92 U1 U1, U2 S U2(P) – U1 S, U3
93 U1 U1, U2 U2 S – U1 S, U1
94 U1 S, U2 U2 – – U1 S, U1
95 U1 U1, U2 U1 S – – S, U1
96 U1 U1, U2 U1 S S U2 U1
97 U1 U1, U2 S S – U1 U2, U3
98 U1 S, U2 U1 – – – S, U1
99 U1 U1, U2 U1 U2(P) S U2 U1
100 U1 U1, U2 U1 S S U1 –101 U1 U1, U2 S S – U2 U3
102 U1 U1, U2 S U2(P) – U2 U1
103 U1 U1, U2 U1 U2 – – U2(P), U3
104 U1 U1, U2 U2 U2 U1 – S, U3
105 U1 U1, U2 U2 U2 S – U3
U
sitive
fapNc(tiNars1c
106 U2 U1 U2
a S, steady state; Ui: unstable state; i: number of eigenvalues with po
erent (Fig. 6a and b). In regions 1 and 5 the extinction ofll populations is the only stable, while in region 5, the N1
rey exists also in an unstable steady state. Domination of the
1 population is established in regions 2 and 8. The N1 preyan survive alone in a stable steady state at low NH3 valuesNH3 < 1.5 g/L) for a wide range of dilution rate values. Alsohe N1P state, observed in regions 3, 9, 30, 59 and 60, is lim-ted compared to case A (see Fig. 2) and occurs only at lowH3 concentrations. In addition, regions 13 and 47 are locatedt lower NH3 concentration values (compared to case A). In
egion 4, a stable steady state of washout and a stable periodictate of N1P are established. In numerous regions (i.e., regions0, 13, 24, 26, 32–34, 47, 89, etc.) the nitrogen-fixing populationan survive in coexistence with its predator at a stable peri-3 S – –
real parts. P in parentheses indicates stable periodic state.
odic state. In regions 11 and 12 multistability is observed, sincetwo stable states are observed, the N2 steady state and the sta-ble periodic N1P state. The N2 steady state appears in regions6 and 7. Coexistence of the N2 population with its predatorin a stable steady state appears in regions 16–19, 41, 44, 105and 106. Multistability is observed in regions 26, 34, 40 and 49,since both N1P in a stable periodic state and N2P in a stablesteady state are established, and in regions 32 and 33 wherestable periodic states of both N1P and N2P are established. Bothregions 33 and 47 are shifted to lower NH3 concentrations,
compared to case A. In regions 28, 29, 31, 43, 45, 48 and 70 N2survives together with the predator in a stable periodic stateand in regions 62 and 91 N1 survives together with the preda-tor in a stable periodic state. Finally, all populations are in a

330 e c o l o g i c a l m o d e l l i n g
Fig. 4 – Bifurcation diagram for a two-prey–one-predatorsystem in the case that the predator preys on thenitrogen-fixing prey with a higher rate than on thecompetitive prey and the ammonium nitrogen inhibition islow (case C of Table 1). Labeling of curves is presented in
Table 3. The character of each steady state in the variousregions is listed in Table 2.steady state of coexistence in regions 90, 92 and 104, while in90 and 92 coexistence of N1 and P is also observed in a stableperiodic state. It depends on the initial state of the chemostatwhich of the two possible states will be eventually reached.
Fig. 5 – Bifurcation diagram for a two-prey–one-predatorsystem in the case that the predator preys on thecompetitive prey with a higher rate than on thenitrogen-fixing prey and the ammonium nitrogeninhibition is low (case D of Table 1). Labeling of curves ispresented in Table 3. The character of each steady state inthe various regions is listed in Table 2.
2 1 8 ( 2 0 0 8 ) 323–338
This location of coexistence of all three populations gives theopportunity to the nitrogen-fixing population to survive in astable steady state at NH3 < 2 g/L and high dilution rates.
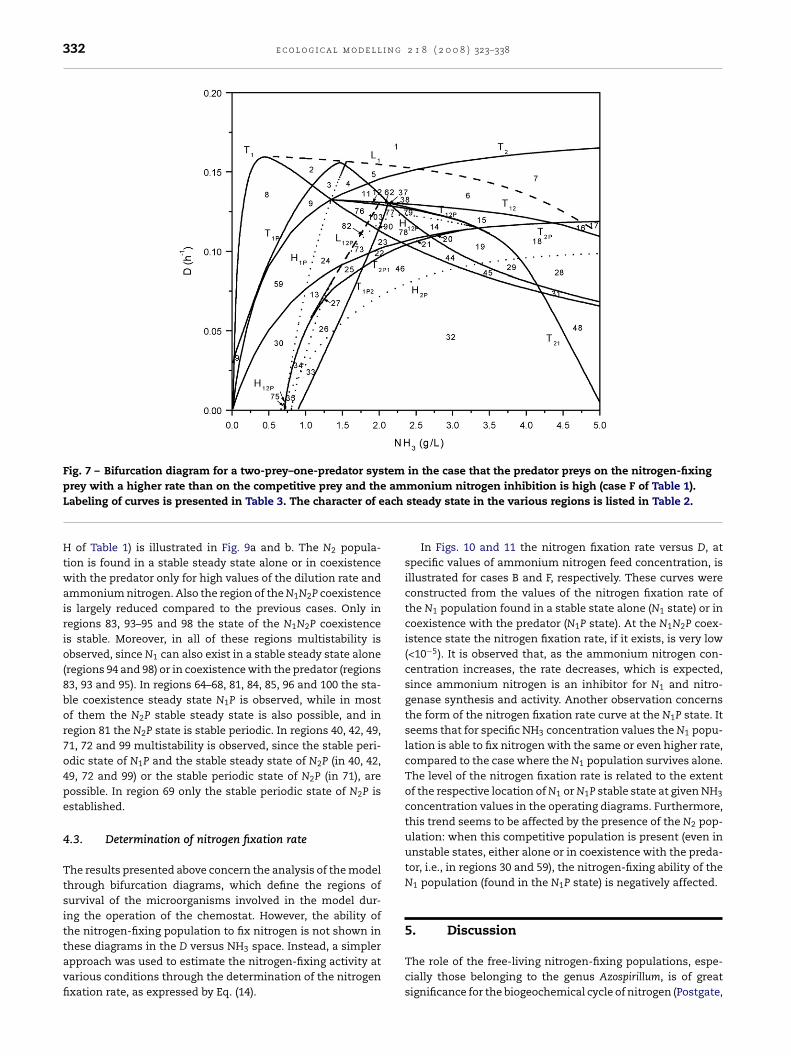
In case F (Fig. 7), in which the predator preys on N2 withlower rate than in case E, the N1 population dominates aloneor in coexistence with its predator, in a stable steady state, atNH3 < 1.5 g/L and for a wide range of dilution rates. In regions14, 20–23, 25, 27, 73, 78 and 90 coexistence of all populationsis observed at steady state. In several of these regions (22,23, 25, 27 and 73) multistability is observed since a N1P sta-ble periodic state occurs too. New regions appear because ofthe different predation rates. Regions 15, 37 and 38 increasethe range where N2 exists in a stable steady state, while inthese regions the N1 prey is present only in unstable states.Multistability is observed in regions 32, 33 and 35, since boththe N1P and N2P states exist as stable periodic states, and inregions 26, 34 and 46, since N1P is a stable periodic state andN2P is a stable steady state. N1 survives in a stable steady statein coexistence with the predator in regions 3, 9, 30, 59 and 75,while in regions 13, 24 and 76 N1 dominates in a stable peri-odic state. In region 82, multistability is observed, since bothN1P and N1N2P are stable periodic states. Finally, in regions 77,79 and 103 N1 survives in a stable periodic state only in coex-istence with all populations (N1N2P state). In conclusion, thenitrogen-fixing population can survive alone or in N1P coexis-tence for low NH3 values and in N1N2P coexistence for higherNH3 values, while the N2 population survives either alone orin coexistence (N2P or N1N2P) only for high NH3 values.
In case G (Fig. 8a and b) the predator preys on N1 with lowerrate than in case F. In this case the domination of the N1 pop-ulation alone in a stable steady state is extended in the newregions 51–54. Also coexistence of N1 and P in a stable steadystate (regions 30, 50, 55, 58, 59, 61, 85–88, 97 and 101) and ina stable periodic state (regions 11, 12, 25, 26, 32–34, 36, 39, 42,46, 47, 56, 62, 73, 80 and 102) is observed, for higher NH3 con-centration values compared to case F. In regions 25, 27, 36, 39and 73 multistability is observed since N1 can survive eitherin a N1N2P stable steady state or in a N1P stable periodic state.
Coexistence of all three populations in a stable periodic state isobserved in regions 77, 79, 80 and 86, while multistability (N1Pand N2P in a stable steady state) occurs in region 85. In regions50, 55, 61, 97 and 101 both N2 and N1P states are found as sta-Table 3 – Labelling of curves
Symbols Explanation
T1 Transcritical bifurcation between washout and N1 stateT2 Transcritical bifurcation between washout and N2 stateT12 Transcritical bifurcation between N1 and N1N2 stateT21 Transcritical bifurcation between N2 and N1N2 stateT12P Transcritical bifurcation between N1N2 and N1N2P stateT1P Transcritical bifurcation between N1 and N1P stateT2P Transcritical bifurcation between N2 and N2P stateT1P2 Transcritical bifurcation between N1P and N1N2P stateT2P1 Transcritical bifurcation between N2P and N1N2P stateH1P Hopf bifurcation of N1P stateH2P Hopf bifurcation of N2P stateH12P Hopf bifurcation of N1N2P stateL1 Limit-point bifurcation of N1 stateL12P Limit-point bifurcation of N1N2P state

e c o l o g i c a l m o d e l l i n g 2 1 8 ( 2 0 0 8 ) 323–338 331
Fig. 6 – Bifurcation diagram for a two-prey–one-predator system in the case that the predator preys on the nitrogen-fixingprey with a higher value than on the competitive prey and the ammonium nitrogen inhibition is high (case E of Table 1).L achs
bitw
abeling of curves is presented in Table 3. The character of ehows an enlargement of the region marked in (a).
le steady states, while in regions 11, 12, 56, 62 and 102 N1Ps found as a stable periodic state. In conclusion, in this casehe nitrogen-fixing population survives in the chemostat for aider range of parameter values, compared to cases E and F.
steady state in the various regions is listed in Table 2. (b)
4.2.2. The predator preys slower on nitrogen-fixing preythan on competitive prey (case H of Table 1)The dynamic behavior of the system in the case where thepredator essentially feeds on the N2 prey instead of N1 (case
332 e c o l o g i c a l m o d e l l i n g 2 1 8 ( 2 0 0 8 ) 323–338
Fig. 7 – Bifurcation diagram for a two-prey–one-predator system in the case that the predator preys on the nitrogen-fixingam
ach
prey with a higher rate than on the competitive prey and theLabeling of curves is presented in Table 3. The character of eH of Table 1) is illustrated in Fig. 9a and b. The N2 popula-tion is found in a stable steady state alone or in coexistencewith the predator only for high values of the dilution rate andammonium nitrogen. Also the region of the N1N2P coexistenceis largely reduced compared to the previous cases. Only inregions 83, 93–95 and 98 the state of the N1N2P coexistenceis stable. Moreover, in all of these regions multistability isobserved, since N1 can also exist in a stable steady state alone(regions 94 and 98) or in coexistence with the predator (regions83, 93 and 95). In regions 64–68, 81, 84, 85, 96 and 100 the sta-ble coexistence steady state N1P is observed, while in mostof them the N2P stable steady state is also possible, and inregion 81 the N2P state is stable periodic. In regions 40, 42, 49,71, 72 and 99 multistability is observed, since the stable peri-odic state of N1P and the stable steady state of N2P (in 40, 42,49, 72 and 99) or the stable periodic state of N2P (in 71), arepossible. In region 69 only the stable periodic state of N2P isestablished.
4.3. Determination of nitrogen fixation rate
The results presented above concern the analysis of the modelthrough bifurcation diagrams, which define the regions ofsurvival of the microorganisms involved in the model dur-ing the operation of the chemostat. However, the ability ofthe nitrogen-fixing population to fix nitrogen is not shown in
these diagrams in the D versus NH3 space. Instead, a simplerapproach was used to estimate the nitrogen-fixing activity atvarious conditions through the determination of the nitrogenfixation rate, as expressed by Eq. (14).monium nitrogen inhibition is high (case F of Table 1).steady state in the various regions is listed in Table 2.
In Figs. 10 and 11 the nitrogen fixation rate versus D, atspecific values of ammonium nitrogen feed concentration, isillustrated for cases B and F, respectively. These curves wereconstructed from the values of the nitrogen fixation rate ofthe N1 population found in a stable state alone (N1 state) or incoexistence with the predator (N1P state). At the N1N2P coex-istence state the nitrogen fixation rate, if it exists, is very low(<10−5). It is observed that, as the ammonium nitrogen con-centration increases, the rate decreases, which is expected,since ammonium nitrogen is an inhibitor for N1 and nitro-genase synthesis and activity. Another observation concernsthe form of the nitrogen fixation rate curve at the N1P state. Itseems that for specific NH3 concentration values the N1 popu-lation is able to fix nitrogen with the same or even higher rate,compared to the case where the N1 population survives alone.The level of the nitrogen fixation rate is related to the extentof the respective location of N1 or N1P stable state at given NH3
concentration values in the operating diagrams. Furthermore,this trend seems to be affected by the presence of the N2 pop-ulation: when this competitive population is present (even inunstable states, either alone or in coexistence with the preda-tor, i.e., in regions 30 and 59), the nitrogen-fixing ability of theN1 population (found in the N1P state) is negatively affected.
5. Discussion
The role of the free-living nitrogen-fixing populations, espe-cially those belonging to the genus Azospirillum, is of greatsignificance for the biogeochemical cycle of nitrogen (Postgate,

e c o l o g i c a l m o d e l l i n g 2 1 8 ( 2 0 0 8 ) 323–338 333
Fig. 8 – Bifurcation diagram for a two-prey–one-predator system in the case that the predator preys on the nitrogen-fixingprey with a higher rate than on the competitive prey and the ammonium nitrogen inhibition is high (case G of Table 1).L achs
1iKt2aup
abeling of curves is presented in Table 3. The character of ehows an enlargement of the region marked in (a).
982), and these bacteria have been successfully usedn environmental applications (Ueckert and Fendrik, 1995;efalogianni and Aggelis, 2002; Tsagou et al., 2003) and sus-
ainable agriculture (Bahat-Samet et al., 2004; Bashan et al.,
004). Their ability to fix nitrogen is highly influenced bymmonium nitrogen concentration in the soil. Specifically,nder high ammonia concentration the nitrogenase com-lex becomes inactivate and the bacteria stop fixing nitrogen,steady state in the various regions is listed in Table 2. (b)
while under low dissolved oxygen concentration ammoniuminhibits microbial growth. Furthermore, nitrogen fixation isa highly energy consuming process, while the carbon andenergy sources are frequently present at low concentration
that are actually limiting for the free-living nitrogen-fixingpopulations growing competitively in the soil microbial com-munity. Although a number of models have been proposedfor the study of the biogeochemical cycle of nitrogen (van
334 e c o l o g i c a l m o d e l l i n g 2 1 8 ( 2 0 0 8 ) 323–338
Fig. 9 – Bifurcation diagram for a two-prey–one-predator system in the case that the predator preys on the competitive preywith a higher rate than on the nitrogen-fixing prey and the ammonium nitrogen inhibition is high (case H of Table 1).
ach
Labeling of curves is presented in Table 3. The character of eshows an enlargement of the region marked in (a).Dam and van Breemen, 1995; Christian et al., 1996; Chapelleet al., 2000; Kercher and Chambers, 2001; Corbeels et al.,
2005; Bruce et al., 2006; McNeil et al., 2006), studies of thedynamics of nitrogen-fixing populations have not been pub-lished. Some interactions between Azospirillum and othermicroorganisms have been previously studied using specificsteady state in the various regions is listed in Table 2. (b)
experimental systems (Cacciari et al., 1986; Kloss et al., 1986;Mar Vázquez et al., 2000). Also experimental studies regarding
prey–predator interactions showed that nitrogen-fixing bacte-ria (as well as other Gram negative species) are prey for severalimportant soil predators such as Bdellovibrio and related organ-isms and protozoa (Mallory et al., 1983; Germida, 1987; Rønn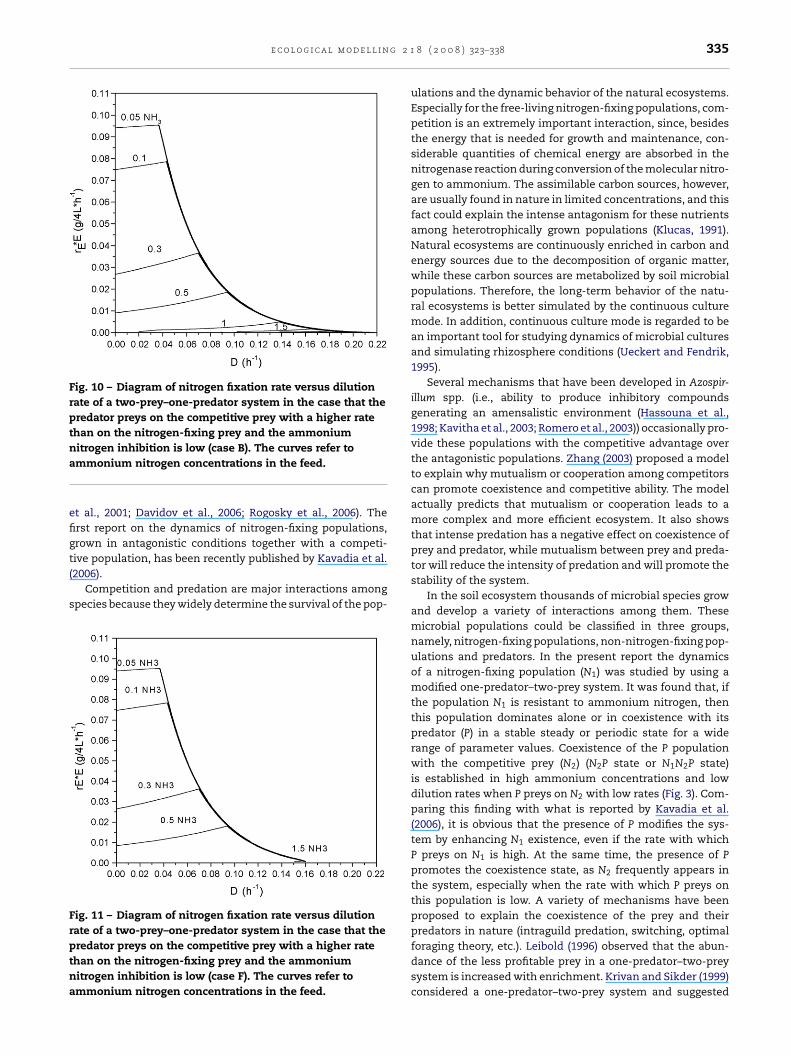
e c o l o g i c a l m o d e l l i n g 2 1
Fig. 10 – Diagram of nitrogen fixation rate versus dilutionrate of a two-prey–one-predator system in the case that thepredator preys on the competitive prey with a higher ratethan on the nitrogen-fixing prey and the ammoniumna
efigt(
s
Frptna
itrogen inhibition is low (case B). The curves refer tommonium nitrogen concentrations in the feed.
t al., 2001; Davidov et al., 2006; Rogosky et al., 2006). Therst report on the dynamics of nitrogen-fixing populations,rown in antagonistic conditions together with a competi-
ive population, has been recently published by Kavadia et al.2006).Competition and predation are major interactions amongpecies because they widely determine the survival of the pop-
ig. 11 – Diagram of nitrogen fixation rate versus dilutionate of a two-prey–one-predator system in the case that theredator preys on the competitive prey with a higher ratehan on the nitrogen-fixing prey and the ammoniumitrogen inhibition is low (case F). The curves refer tommonium nitrogen concentrations in the feed.
8 ( 2 0 0 8 ) 323–338 335
ulations and the dynamic behavior of the natural ecosystems.Especially for the free-living nitrogen-fixing populations, com-petition is an extremely important interaction, since, besidesthe energy that is needed for growth and maintenance, con-siderable quantities of chemical energy are absorbed in thenitrogenase reaction during conversion of the molecular nitro-gen to ammonium. The assimilable carbon sources, however,are usually found in nature in limited concentrations, and thisfact could explain the intense antagonism for these nutrientsamong heterotrophically grown populations (Klucas, 1991).Natural ecosystems are continuously enriched in carbon andenergy sources due to the decomposition of organic matter,while these carbon sources are metabolized by soil microbialpopulations. Therefore, the long-term behavior of the natu-ral ecosystems is better simulated by the continuous culturemode. In addition, continuous culture mode is regarded to bean important tool for studying dynamics of microbial culturesand simulating rhizosphere conditions (Ueckert and Fendrik,1995).
Several mechanisms that have been developed in Azospir-illum spp. (i.e., ability to produce inhibitory compoundsgenerating an amensalistic environment (Hassouna et al.,1998; Kavitha et al., 2003; Romero et al., 2003)) occasionally pro-vide these populations with the competitive advantage overthe antagonistic populations. Zhang (2003) proposed a modelto explain why mutualism or cooperation among competitorscan promote coexistence and competitive ability. The modelactually predicts that mutualism or cooperation leads to amore complex and more efficient ecosystem. It also showsthat intense predation has a negative effect on coexistence ofprey and predator, while mutualism between prey and preda-tor will reduce the intensity of predation and will promote thestability of the system.
In the soil ecosystem thousands of microbial species growand develop a variety of interactions among them. Thesemicrobial populations could be classified in three groups,namely, nitrogen-fixing populations, non-nitrogen-fixing pop-ulations and predators. In the present report the dynamicsof a nitrogen-fixing population (N1) was studied by using amodified one-predator–two-prey system. It was found that, ifthe population N1 is resistant to ammonium nitrogen, thenthis population dominates alone or in coexistence with itspredator (P) in a stable steady or periodic state for a widerange of parameter values. Coexistence of the P populationwith the competitive prey (N2) (N2P state or N1N2P state)is established in high ammonium concentrations and lowdilution rates when P preys on N2 with low rates (Fig. 3). Com-paring this finding with what is reported by Kavadia et al.(2006), it is obvious that the presence of P modifies the sys-tem by enhancing N1 existence, even if the rate with whichP preys on N1 is high. At the same time, the presence of Ppromotes the coexistence state, as N2 frequently appears inthe system, especially when the rate with which P preys onthis population is low. A variety of mechanisms have beenproposed to explain the coexistence of the prey and theirpredators in nature (intraguild predation, switching, optimal
foraging theory, etc.). Leibold (1996) observed that the abun-dance of the less profitable prey in a one-predator–two-preysystem is increased with enrichment. Krivan and Sikder (1999)considered a one-predator–two-prey system and suggested
i n g
r
336 e c o l o g i c a l m o d e l l
that optimal foraging behavior of predators may promotecoexistence, while Krivan (1996, 1998) and Krivan and Eisner(2003) showed that optimal behavior leads to persistence ofprey–predator systems and reduction of oscillations in popula-tion densities. Krivan (2003) observed that adaptive predationsignificantly enlarges the set of parameters for which thetwo preys coexist in the food web. Aggelis et al. (2005) sug-gested that in a prey–predator system, which is controlled bya catabolic repression mechanism, the dominance of the preypopulation is favored and, under certain circumstances, thecoexistence of prey and predator also. According to Tschirhart(2004), switching predation depends on the relative energyexpenditures for the prey species and predators may special-ize in one prey or switch gradually between preys. Vayenaset al. (2005) showed that in a two-prey–one-predator system,controlled by a catabolic repression mechanism, when thealternative prey has the competitive advantage over the desir-able prey, the state of dominance of the desirable prey andthe state of coexistence of prey and predator are both affectednegatively.
If the N1 population exhibits sensitivity to ammoniumnitrogen (the inhibition constant value is high), then this pop-ulation survives alone only at low ammonium concentrations(Fig. 7). Above a threshold of NH3 concentration, N1 survivesin a stable periodic state in coexistence with the predator or inregions where multistability is observed (N1P and N2P, both ina stable periodic state). In particular, the predator’s presencein the system restricts the domination of the N1 prey at lowNH3 values, while the N2 prey dominates alone or in coexis-tence with the predator at high values of D and NH3, comparedto the results of Kavadia et al. (2006).
Modifying both the rates with which the predator preys onthe two populations, the location of their survival in a stablesteady state is altered accordingly. In general, the coexistenceof all populations in the chemostat (N1N2P state) is favoredby predation. Especially, when the predator reduces its preda-tion rate on N2, the range of stability of N1N2P increases andthus N1 manages to survive in a stable steady state togetherwith the other populations, although it is preyed upon by Pmore than population N2 (Figs. 6 and 7). This fact could beexplained through the role of the N2 prey on the system. Actu-ally, N2 enables N1 to survive at higher NH3 concentrationsin the incoming medium, by reducing the NH3 concentrationin the chemostat and thus lowering its inhibitory effect onthe N1 population. Kooi et al. (1999) and Kooi and Kooijman(2000) have studied the effect of predation in food chains byusing a Holling type II functional response. The predator’sinclusion in food chains leads to a resistant to further inva-sion system, while invasion of a competitor of the prey canstabilize an oscillatory nutrient–prey–predator bi-trophic foodchain. In the present work it was found that the occurrenceof the predator promotes coexistence, while the competitiveprey plays a significant role in promoting the domination ofthe N1 prey.
Although N1 can survive in a stable steady state at highNH concentration, with the help of N , it fixes nitrogen only
3 2at low NH3 concentrations while the nitrogen fixation rate isconversely proportional to NH3 concentration and to dilutionrate values. When the N1 prey dominates alone in a stablesteady state, the nitrogen fixation rate curve drops, while an
2 1 8 ( 2 0 0 8 ) 323–338
increase of the nitrogen fixation rate is observed when N1 sur-vives in coexistence with its predator in a stable steady state.The presence of the competitive population in an unstablestate, at certain regions where N1 coexists with its predator,could explain this situation, as the population N2 assimilatesome quantities of NH3 discharging the system from thisinhibitory compound. However, at low NH3 concentrations,the population N2 has a negative effect on the nitrogen-fixingactivity of the population N1, probably by absorbing somequantities of the carbon and energy source. Although, underthese conditions, the low NH3 concentration values permit thenitrogen-fixing activity, it seems that the nitrogenase complexis found under carbon limited conditions, due to the presenceof the N2 population.
6. Conclusions
The survival of the free-living nitrogen-fixing populations,which is crucial for the system maintenance and productivity,is strongly dependent on a number of interactions occurringamong populations in natural ecosystems. It is demonstratedthat in a two-prey–one-predator system, the survival of thenitrogen-fixing population depends not only on the NH3 con-centration in the growth environment but also on the rate withwhich the predator preys on the prey populations. In particu-lar, under low NH3 inhibition, the nitrogen-fixing populationcan survive in a stable state, alone or in coexistence with itspredator, at low NH3 concentration, for a wide range of dilu-tion rate values, while at high NH3 concentration its survivalis restricted to high dilution rates only. Under high NH3 inhi-bition the survival of N1 in a stable state is observed only atlow NH3 concentration.
The competitive prey enhances the survival of thenitrogen-fixing prey and the equilibrium of the system. Atlow NH3 inhibition values, when the predation rate on N2 islower, the coexistence state of all populations is attainable.On the other hand, at high NH3 inhibition values, the N2 preyclears the system from NH3 allowing the N1 prey to grow incoexistence with the other populations.
Nitrogenase activity occurs at low NH3 concentrations in allcases, while the rate of nitrogen fixation is conversely relatedto the NH3 concentration. The nitrogen-fixing population canfix nitrogen even in a coexistence state with its predator. How-ever, in the case of N1 and P coexistence, the existence of the N2
prey reduces the nitrogen fixation rate, since under these con-ditions the nitrogenase complex is probably found in carbonlimited conditions.
Acknowledgement
State Scholarship Foundation, Athens, Greece, is acknowl-edged for the doctoral fellowship of A. Kavadia.
e f e r e n c e s
Aggelis, G., Vayenas, D.V., Tsagou, V., Pavlou, S., 2005.Prey–predator dynamics with predator switching regulated bya catabolic repression control mode. Ecol. Model. 183, 453–464.

g 2 1
A
B
B
B
B
B
C
C
C
C
D
D
F
F
F
G
G
H
H
e c o l o g i c a l m o d e l l i n
tlas, R.M., Bartha, R., 1993. Microbial Ecology: Fundamentalsand Applications, 3rd ed. Addison-Wesley, Reading.
ahat-Samet, E., Castro-Sowinski, S., Okon, Y., 2004. Arabinosecontent of extracellular polysaccharide plays a role in cellaggregation of Azospirillum brasilense. FEMS Microbiol. Lett.237, 195–203.
ailey, J.E., Ollis, D.F., 1986. Biochemical EngineeringFundamentals, 2nd ed. McGraw- Hill Int., Singapore.
ashan, Y., Holguin, G., 1997. Azospirillum plant relationships:environmental and physiological advances (1990–1996). Can. J.Microbiol. 43, 103–121.
ashan, Y., Holguin, G., de-Bashan, L.E., 2004. Azospirillum-plantrelationships: physiological, molecular, agricultural, andenvironmental advances (1997–2003). Can. J. Microbiol. 50,521–577.
ruce, L.C., Hamilton, D., Imberger, J., Gal, G., Gophen, M., Zohary,T., Hambright, K.D., 2006. A numerical simulation of the roleof zooplankton in C, N and P cycling in Lake Kinneret, Israel.Ecol. Model. 193, 412–436.
acciari, I., Del Gallo, M., Ippoliti, S., Lippi, D., Pietrosanti, T.,Pietrosanti, W., 1986. Growth and survival of Azospirillumbrasilense and Arthrobacter giacomelloi in binary continuousculture. Plant Soil 90, 107–116.
hapelle, A., Ménesguen, A., Deslous-Paoli, J.-M., Souchu, P.,Mazouni, N., Vaquer, A., Millet, B., 2000. Modelling nitrogen,primary production and oxygen in Mediterranean lagoon.Impact of oysters farming and inputs from the watershed.Ecol. Model. 127, 161–181.
hristian, R.R., Forés, E., Comin, F., Viaroli, P., Naldi, M., Ferrari, I.,1996. Nitrogen cycling networks of coastal ecosystems:influence of trophic status and primary producer form. Ecol.Model. 87, 111–129.
orbeels, M., McMutrie, R.E., Pepper, D.A., O’Connell, A.M., 2005.A process-based model of nitrogen cycling in forestplantations. Part II. Simulating growth and nitrogenmineralization of Eucalyptus globulus plantations insouth-western Australia. Ecol. Model. 187, 449–474.
avidov, Y., Huchon, D., Koval, S.F., Jurkevitch, E., 2006. A new�-proteobacterial clade of Bdellovibrio-like predators:implications for the mitochondrial endosymbiotic theory.Environ. Microbiol. 8 (12), 2179–2188.
oedel, E.J., Champneys, A.R., Fairgrieve, T.F., Kuznetsov, Y.A.,Sandstede, B., Wang, X., 1997. AUTO 97: Continuation andBifurcation Software for Ordinary Differential Equations,User’s Manual. Centre for Research on Parallel Computing,California Institute of Technology, Pasadena.
redrickson, A.G., 1976. Formulation of structured growth models(Communication to the editor). Biotechnol. Bioeng. 18,720–725.
ritzsche, C., Niemman, E.G., 1990. Nitrogen fixation incontinuous culture with NH4Cl-containing media. Appl.Environ. Microbiol. 56, 1160–1161.
ritzsche, C., Ueckert, J., Niemann, E.-J., 1990. Growth parametersof microaerobic diazotrophic rhizobacteria determined incontinuous culture. In: Polsinelli, M., Materassi, R., Vincenzini,M. (Eds.), Nitrogen Fixation. Kluwer Academic Publishers,Dordrecht, Boston, London, pp. 232–234.
ermida, J.J., 1987. Isolation of Bdellovibrio spp. that prey onAzospirillum brasilense in soil. Can. J. Microbiol. 33 (5),459–461.
raef, S.P., Andrews, J.F., 1974. Mathematical modelling andcontrol of anaerobic digestion. In: CEP Symposium Series, vol.70, 101–127.
assouna, M.G., El-Saedy, M.A.M., Saleh, H.M.A., 1998. Biocontrolof soil-borne plant pathogens attacking cucumber (Cucumis
sativus) by rhizobacteria in a semiarid environment. Arid SoilRes. Rehabil. 12, 345–357.urek, T., Reinhold, B., Niemann, E.G., 1987. Effect of oxygen onNH4
+-grown continuous cultures of Azospirillum spp. and
8 ( 2 0 0 8 ) 323–338 337
diazotrophic rods closely associated with Kallar grass. Can. J.Microbiol. 33, 919–922.
Imanaka, T., Aiba, S., 1977. A kinetic model of cataboliterepression in the dual control mechanism in microorganisms.Biotechnol. Bioeng. 19, 757–764.
Kavadia, A., Vayenas, D.V., Pavlou, S., Aggelis, G., 2006. Dynamicsof free-living nitrogen-fixing bacterial populations inantagonistic conditions. Ecol. Model. 200, 243–253.
Kavitha, K., Meenakumari, K.S., Sivaprasad, P., 2003. Effect of dualinoculation of native arbuscular mycorrhizal fungi andAzospirillum on suppression of damping off in chilli. Ind.Phytopathol. 56, 112–113.
Kefalogianni, I., Aggelis, G., 2002. Modelling growth andbiochemical activities of Azospirillum spp. Appl. Microbiol.Biotechnol. 58, 352–357.
Kercher, J.R., Chambers, J.Q., 2001. Parameter estimation for aglobal model of terrestrial biogeochemical cycling by aniterative method. Ecol. Model. 139, 137–175.
Kloss, M., Iwannek, K.H., Fendrik, I., Niemman, E.G., 1986.Enrichment of diazotrophic bacteria from rice soil incontinuous culture. Plant Soil 90, 151–164.
Klucas, R.V., 1991. Associative nitrogen fixation in plants. In:Dilworth, M.J., Glenn, A.R. (Eds.), Biology and Biochemistry ofNitrogen Fixation. Elsevier, Amsterdam.
Kooi, B.W., Boer, M.P., Kooijman, S.A.L.M., 1999. Resistance of afood chain to invasion by a top predator. Math. Biosci. 157,217–236.
Kooi, B.W., Kooijman, S.A.L.M., 2000. Invading species canstabilize simple trophic systems. Ecol. Model. 133, 57–72.
Krivan, V., 1996. Optimal foraging and predator–prey dynamics.Theor. Popul. Biol. 49, 265–290.
Krivan, V., 1998. Effects of optimal antipredator behavior of preyon predator–prey dynamics: the role of refuges. Theor. Popul.Biol. 53, 131–142.
Krivan, V., Sikder, A., 1999. Optimal foraging and predator–preydynamics II. Theor. Popul. Biol. 55, 111–126.
Krivan, V., 2003. Competitive co-existence caused by adaptivepredators. Evol. Ecol. Res. 5, 1163–1182.
Krivan, V., Eisner, J., 2003. Optimal foraging and predator–preydynamics III. Theor. Popul. Biol. 63, 269–279.
Leibold, M.A., 1996. A graphical model of keystone predation:effects of productivity on abundance, incidence andecological diversity in communities. Am. Nat. 147,784–812.
Mallory, L.M., Yuk, C.-S., Liang, L.-N., Alexander, M., 1983.Alternative prey: a mechanism for elimination of bacterialspecies by protozoa. Appl. Environ. Microbiol. 46,1073–1079.
Mar Vázquez, M., César, S., Azcón, R., Barea, J.M., 2000.Interactions between arbuscular mychorrizal fungi and othermicrobial inoculants (Azospirillum, Pseudomonas, Trichoderma)and their effects on microbial population and enzymeactivities in the rhizosphere of maize plants. Appl. Soil Ecol.15, 261–272.
McNeil, B.E., Martell, R.E., Read, J.M., 2006. GIS andbiogeochemical models for examining the legacy of forestdisturbance in the Adirondack Park, NY, USA. Ecol. Model. 195,281–295.
Monod, J., 1942. Research on the growth of bacterial cultures. Act.Sci. Ind. 911, 1–215 (in French).
Okon, Y., Albrecht, S.L., Burris, R.H., 1976. Factors affectinggrowth and nitrogen fixation of Spirillum lipoferum. J. Bacteriol.127, 1248–1254.
Pei, Y., Chen, L., Zhang, Q., Li, C., 2005. Extinction andpermanence of one-prey multi-predators of Holling type IIfunction response system with impulsive biological control. J.
Theor. Biol. 235, 495–503.Pelletier, J.D., 2000. Are large complex ecosystems more unstable?A theoretical reassessment with predator switching. Math.Biosci. 163, 91–96.

i n g
338 e c o l o g i c a l m o d e l lPostgate, J.R., 1982. The Fundamentals of Nitrogen Fixation.Cambridge University Press, London.
Richards, S.A., Nisbet, R.G., Wilson, W.G., Possingham, H.P., 2000.Grazers and diggers: exploitation competition andcoexistence among foragers with different feeding strategieson a single resource. Am. Nat. 155, 266–279.
Rogosky, A.M., Moak, P.L., Emmert, E.A.B., 2006. DifferentialPredation by Bdellovibrio bacteriovorus 109J. Curr. Microbiol. 52(2), 81–85.
Romero, A.M., Correa, O.S., Moccia, S., Rivas, J.G., 2003. Effect ofAzospirillum-mediated plant growth promotion on thedevelopment of bacterial diseases on fresh-market and cherrytomato. J. Appl. Microbiol. 95, 832–838.
Rønn, R., Grunert, J., Ekelund, F., 2001. Protozoan response toaddition of the bacteria Mycobacterium chlorophenolicum andPseudomonas chlororaphis to soil microcosms. Biol. Fertil. Soils33, 126–131.
Smith, H.L., Waltman, P., 1995. The theory of the chemostat:dynamics of microbial competition. Cambridge Studies inMathematical Biology, vol. 13. Cambridge University Press,Cambridge.
Steenhoudt, O., Vanderleyden, J., 2000. Azospirillum, a free-livingnitrogen-fixing bacterium closely associated with grasses:
genetic, biochemical and ecological aspects. FEMS Microbiol.Rev. 24, 487–506.Strigul, N.S., Kravchenko, L.V., 2006. Mathematical modeling ofPGPR inoculation in the rizosphere. Environ. Modell. Softw. 21,1158–1171.
2 1 8 ( 2 0 0 8 ) 323–338
Tsagou, V., Aggelis, G., 2006. Growth dynamics of Azospirillumlipoferum at steady and transitory states in the presence ofNH4
+. J. Appl. Microbiol. 100, 286–295.Tsagou, V., Kefalogianni, I., Sini, K., Aggelis, G., 2003. Metabolic
activities in Azospirillum lipoferum grown in the presence ofNH4
+. Appl. Microbiol. Biotechnol. 62,574–578.Tschirhart, J., 2004. A new adaptive system approach to
predator–prey modeling. Ecol. Model. 176,255–276.
Ueckert, J., Fendrik, I., 1995. Continuous culture applications inphysiological investigations on diazotrophic bacteria. In:Fendrik, I., Del Gallo, M., Vanderleyden, J., De Zamaroczy, M.(Eds.), Azospirillum VI and related microorganisms, vol. G37.Springer-Verlag, Heidelberg.
van Dam, D., van Breemen, N., 1995. NICCE: a model for cycling ofnitrogen and carbon isotopes in coniferous forest ecosystems.Ecol. Model. 79, 255–275.
Vayenas, D.V., Pavlou, S., 1999. Chaotic dynamic of a food web in achemostat. Math. Biosci. 162, 69–84.
Vayenas, D.V., Pavlou, S., 2001. Chaotic dynamic of a microbialsystem of coupled food chains. Ecol. Model. 136, 285–295.
Vayenas, D.V., Aggelis, G., Tsagou, V., Pavlou, S., 2005. Dynamicsof a two-prey–one-predator system with predator switching
regulated by a catabolic repression control-like mode. Ecol.Model. 186 (2005), 345–357.Zhang, Z., 2003. Mutualism or cooperation among competitorspromotes coexistence and competitive ability. Ecol. Model.164, 271–282.