Measuring & Managing Park Carrying Capacity - UBC ...
55
Measuring & Managing Park Carrying Capacity Final report: August 2020 Prepared by: Hyeone Park, UBC Sustainability Scholar 2020 Prepared for: Deanne Manzer, Park Planner, Metro Vancouver
-
Upload
khangminh22 -
Category
Documents
-
view
0 -
download
0
Transcript of Measuring & Managing Park Carrying Capacity - UBC ...

Measuring & Managing Park Carrying Capacity
Final report: August 2020
Prepared by: Hyeone Park, UBC Sustainability Scholar 2020 Prepared for: Deanne Manzer, Park Planner, Metro Vancouver

1
Acknowledgements
I acknowledge the research was primarily conducted in the unceded territories of the Coast Salish Peoples. I thank all park managers and planners in Canada, the United States, and Australia who generously took their time during busy, challenging time of COVID-19 and shared their experience and expertise this research. I also thank my mentor Deanne Manzer, the research committee members Jamie Vala and Robyn Worcester at Metro Vancouver and UBC Sustainability Initiative Manager Karen Taylor for their endless support throughout the study.
Executive summary
Metro Vancouver Regional Park’s role is to protect natural areas and connect people to them. Metro Vancouver protects over 13,600 ha of diverse ecosystems as regional park lands. Over the last three decades, park visitation has grown at almost twice the rate of the regional population growth. In 2019 alone, regional parks received over 11.9 million visitors. Park visitation is expected to continue to increase as the regional population grows and more people seek opportunities to connect with, enjoy, be active and learn about the environment. Many regional parks are at or reaching their capacity, with a potential to affect ecological integrity of parks and the quality of visitor experiences. Metro Vancouver aims to take a holistic approach to managing park’s capacity and continue to sustainably protect and connect. Metro Vancouver is not alone in this challenge. Other parts of the country and the world are increasingly experiencing capacity challenges and have started exploring ways to managing their capacity. This report on measuring and managing carrying capacity in parks is informed by a series of conversations with park managers and planners in the country and beyond as well as scientific literature over the last four decades. The report is intended to inform visitor use management planning for Metro Vancouver Regional Parks and support Metro Vancouver in continuing to sustainably manage park visitors, visitor experiences and natural resources.
Disclaimer This report was produced as part of the UBC Sustainability Scholars Program, a partnership between the University of British Columbia and various local governments and organisations in support of providing graduate students with opportunities to do applied research on projects that advance sustainability across the region. This project was conducted under the mentorship of Metro Vancouver staff. The opinions and recommendations in this report and any errors are those of the author and do not necessarily reflect the views of Metro Vancouver or the University of British Columbia.

2
Contents
ACKNOWLEDGEMENTS ........................................................................................................... 1
EXECUTIVE SUMMARY ............................................................................................................ 1
DISCLAIMER ............................................................................................................................ 1
1. PURPOSE AND SCOPE OF THE STUDY .................................................................................. 4
2. OUTLINE OF THE REPORT .................................................................................................... 4
3. INTRODUCTION .................................................................................................................. 4
3.1 METRO VANCOUVER REGIONAL PARKS .......................................................................................... 4 3.2 CURRENT CAPACITY ISSUES ........................................................................................................... 4
4. METHODOLOGY .................................................................................................................. 5
5. CONCEPT OF CARRYING CAPACITY ...................................................................................... 6
5.1 EVOLUTION AND DEFINITION ........................................................................................................ 6 5.2 MANAGEMENT-BY-OBJECTIVE FRAMEWORK .................................................................................... 6 5.3 CORE CAPACITY ATTRIBUTES ......................................................................................................... 8 5.4 CULTURAL CAPACITY ................................................................................................................... 8
6. MEASUREMENT AND TYPES OF CARRYING CAPACITY .......................................................... 9
6.1 MONITORING INDICATORS AND STANDARDS .................................................................................... 9 6.2 MEASURING AND ESTABLISHING ENVIRONMENTAL CAPACITY ............................................................. 13 6.3 MEASURING AND ESTABLISHING SOCIAL CAPACITY ........................................................................... 13 6.4 MEASURING AND ESTABLISHING MANAGERIAL CAPACITY .................................................................. 14 6.5 INTEGRATING ENVIRONMENTAL, SOCIAL AND MANAGERIAL CAPACITIES ................................................ 15
7. CASE STUDIES ................................................................................................................... 17
7.1 VISITOR USE MANAGEMENT PLAN AND VISITOR CAPACITY FOR PETROGLYPH NATIONAL MONUMENT ......... 17 7.2 VISITOR USE MANAGEMENT PLAN, ZONING AND VISITOR CAPACITY FOR DELAWARE WATER GAP NATIONAL RECREATION AREA ......................................................................................................................... 20 7.3 PARKING AND SHUTTLE RESERVATIONS AT MUIR WOODS NATIONAL MONUMENT ................................ 23 7.4 VISITOR RESERVATION SYSTEM OF CONSERVATION HALTON, ONTARIO ................................................ 25 7.5 PAY PARKING AND SHUTTLE SERVICE IN WATERTON LAKES NATIONAL PARK ......................................... 26 7.6 RECOGNITION AND EDUCATION OF BLACKFOOT HISTORY IN WATERTON LAKES NATIONAL PARK ............... 27 7.7 WATCHMEN PROGRAM INTEGRATING CULTURAL, SOCIAL AND ENVIRONMENTAL CAPACITIES AT GWAII HAANAS ...................................................................................................................................... 28
8. KEY FINDINGS ................................................................................................................... 31
9. LITERATURE CITED ............................................................................................................ 33
APPENDIX 1. METHODOLOGIES FOR MEASURING AND ESTABLISHING ENVIRONMENTAL, SOCIAL AND MANAGERIAL CAPACITIES ................................................................................. 41
APPENDIX 1.1 MEASURING AND ESTABLISHING ENVIRONMENTAL CAPACITY ............................................... 41

3
Appendix 1.1.1 Measuring vegetation: Field survey ............................................................. 41 Appendix 1.1.3 Alternative to field survey: Drones ............................................................... 44 Appendix 1.1.4 Establishing standards for environmental capacity: field survey and visual image method ...................................................................................................................... 45
APPENDIX 1.2 MEASURING AND ESTABLISHING SOCIAL CAPACITY ............................................................. 47 Appendix 1.2.1 Crowding and maximum visitor number through visual image method ..... 47 Appendix 1.2.2 Temporal-spatial patterns of park use via GPS-tracking methods .............. 48
APPENDIX 1.3 INTEGRATING ENVIRONMENTAL, SOCIAL, MANAGERIAL AND/OR CULTURAL CAPACITIES ............. 49 Appendix 1.3.1 Physical carrying capacity, real carrying capacity and effective carrying capacity ................................................................................................................................ 49 Appendix 1.3.2 Discrete choice experiment survey ............................................................... 52 Appendix 2.3.3 Modeling for shuttle services ....................................................................... 53

4
1. Purpose and scope of the study
The purpose of this study is to inform and support visitor use management planning for Metro Vancouver Regional Parks in order to sustainably manage park visitors, visitor experiences and natural resources. This study examines methodologies used for defining, measuring and establishing carrying capacity of parks, and includes a set of case studies highlighting best practices.
2. Outline of the report
This report summarises key carrying capacity challenges with which the Metro Vancouver Regional Parks are faced (Section 3); introduces a methodology used for this study (Section 4); discusses the concept of carrying capacity (Section 5); methodologies used for measuring carrying capacity (Section 6); presents 11 case studies that showcase best practice for managing carrying capacity in parks (Section 7); and summarises key findings (Section 8).
3. Introduction
3.1 Metro Vancouver Regional Parks
Metro Vancouver is a partnership of 21 municipalities, one electoral area and one Treaty First Nation that collaboratively plans for and delivers regional-scale services. Its core services are drinking water, wastewater treatment and solid waste management. Metro Vancouver also regulates air quality, plans for urban growth, manages a regional parks system and provides affordable housing. Metro Vancouver manages 23 regional parks, 5 greenways, 2 ecological conservancy areas and 2 park reserves, covering over 136 km2 of land. The Regional Parks Plan provides strategic direction for the management of Metro Vancouver’s Regional Parks through two main goals. One is to protect important natural areas to contribute to regional liveability and enhance connections. The other goal is to, within the context of natural area protection, provide opportunities for people to connect with, enjoy, be active and learn about the environment. Regional Parks received over 11.9 million visitors in 2019. 3.2 Current capacity issues
Regional Park visitation has grown at almost twice the rate of the regional population over the last 30 years. A dramatic rise in number of visitors has been seen during the COVID pandemic, with 600,000 (67%) more visitors in April 2020 than April 2019. Such a spike has amplified capacity challenges that already existed while highlighting the importance of the regional parks for the well-being of the Metro Vancouver residents. Parking capacity, or lack of parking spots, is one of the most prominent capacity challenges. This challenge causes other problems inside and outside of the parks. With the limited parking stalls available, visitors who do not find a parking spot within a park try to park on adjacent roads,

5
which can lead to traffic congestion, affect neighbourhood parking availability for residents and reduce accessibility for emergency vehicles. For example, Lynn Headwaters Regional Park is at parking capacity on many weekends, which leads to overflow onto the park road (e.g. 90 cars parking on roadside) and adjacent neighbourhood throughout the year. Dedicated traffic control is used to help manage parks where this issue is at its worst, which can be resource-intensive. Apart from the immediate challenges that must be addressed, Metro Vancouver aims to take a holistic approach to measuring and managing park’s capacity as increases in visitation can challenge not only parking capacity but also affect visitors’ experience (e.g. crowding) and the health of ecosystems and wildlife. This study looks at three types of capacity– managerial (e.g. park facilities and amenities), environmental (e.g. the acceptable limits of change for the environment) and experiential (e.g. crowding). An outcome of this work is to inform a visitor use management strategy that will outline visitor use limits and strategies to manage visitation within those limits.
4. Methodology
This study includes a review of scientific literature and reports that define, measure, or examine carrying capacity of parks or protected areas. Literature search terms included carrying capacit*, environmental capacit*, physical capacit*, visitor capacit*, social capacit*, user capacit*, recreation capacit*, experiential capacit*, parking, dog, and park* or protected area. The search was limited to a time period between 1980 and 2020. The literature review was complemented with case studies and with interviews with park managers.

6
5. Concept of carrying capacity
5.1 Evolution and definition
Carrying capacity (CC) originated in the shipping industry, concerning “the amount of freight a ship could carry” (Whittaker et al., 2011). The concept of CC was adapted to parks and outdoor recreation in the mid-1930s due to growing awareness of the limits of environmental resources and concern of sustainability in recreation (Ly & Nguyen, 2017; Whittaker et al., 2011). Early work on CC in parks focused on the “limits of acceptable change (LAC)” and attempted to answer a question of “how much use will be permitted to occur before management intervenes?” (Frissell, Lee, Stankey, & Zube, 1980). In park settings, the initial scientific applications of CC focused on the negative impacts of visitor use on ecosystems (i.e. biophysical or ecological capacity). For example, trampling can reduce ground cover vegetation, plant growth and reproduction through brushing and breakage of plants, which can also lead to soil erosion and other negative ecological effects. Park managers advocate that recreation use should be kept within the carrying capacity of the ecosystem (Whittaker et al., 2011). This was expanded to include another dimension of carrying capacity to reflect social values or qualities of visitor experience (i.e. social or experiential capacity) (Wager 1964). Research started showing that visitor experience and environmental impacts of visitor use was not always related to the number of visitors but may be strongly affected by managerial capacity and factors (e.g., designed or built trails, regulation enforcement, personnel, unauthorized use, inconsistent tourism marketing, etc.) (Whittaker et al., 2011). CC is broadly defined as “the amount and type of use that is compatible with the management prescription for an area” (Whittaker et al., 2011). The management prescription describes goals, objectives, desired conditions and corresponding indicators and standards of quality. It also needs to take into account budget and staffing resources. CC can be expressed in a number on a use-level scale, with components of units of use, timing and location (Whittaker et al., 2011). CC is also known as recreation capacity, user capacity and visitor capacity (Graefe et al., 2011; Whittaker et al., 2011). For example, the Visitor Use Management Framework defines visitor capacity as “the maximum amounts and types of visitor use that an area can accommodate while achieving and maintaining desired resource conditions and visitor experiences that are consistent with the purposes for which the area was established” (IVUMC, 2016). 5.2 Management-by-objective framework
A management-by-objectives framework is a systematic approach to analysing and managing CC of parks (Manning 2001; Stankey et al. 1985). A good example of the management-by-objectives framework is the Visitor Use Management Framework (IVUMC, 2016). This framework was developed by the Interagency Visitor Use Management Council of the United

7
States (IVUMC) to provide cohesive guidance on defining, managing and monitoring visitor capacity and visitor impacts on federal lands and waters in the country. It is also intended to be a tool for decision-making on management processes and actions that are legally defensible, transparent and accountable (Fig. 1). Recently, Parks Canada has adopted the framework (IVUMC, 2016) as a planning tool for developing a visitor use management strategy and is in the process of applying the framework at Fathom Five National Marine Park. BC Parks has applied the framework and developed the Visitor Use Management Action Plan (2019) for Joffre Lakes Provincial Park, in collaboration with First Nations and other government administrations. This plan is designed to address immediate capacity issues in Joffre Lakes Park with a goal of developing a longer-term Visitor Use Management Strategy next. Recent reports for Saskatchewan Provincial Parks (Absher et al., 2018) also discuss the application of the framework.
Figure 1 Elements and steps of visitor use management planning (IVUMC, 2016) The framework (IVUMC, 2016) provides step-by-step guidelines for determining management objectives, strategies, associated indicators and standards of quality, and implementation, monitoring and evaluation. Management objectives state the environmental and experiential conditions desired and to be maintained in the park. Indicators “translate the broad description of desired conditions into measurable attributes that can be tracked over time to evaluate change in conditions” (IVUMC, 2016). Standards or thresholds are “minimally acceptable conditions associated with each indicator” (IVUMC, 2016). Standards serve as a “stop sign”, which helps to determine when conditions would become “unacceptable” or “irreversible” and when management attention is required (IVUMC, 2016).

8
5.3 Core capacity attributes
Three core capacity attributes—environmental, social and managerial capacities—have been addressed in different CC frameworks (e.g., Recreation Opportunity Spectrum (USFS, 1982); Visitor Activity Management Process (Environment Canada and Park Service, 1991); Visitor Experience and Resource Protection Framework (NPS, 1997); Visitor Use Management Framework (IVUMC, 2016). Each attribute constrains the ability of a park or a site to accommodate visitor use, and understanding of attributes is critical for establishing carrying capacity (IVUMC, 2016). Based on the case studies and academic research, each capacity attribute may be defined as follows: ⁃ Environmental (ecological or biophysical) capacity is how resilient the ecosystem is to the demands placed on it. Associated attributes may include: vegetation, soil, wildlife behaviour, biodiversity, hydrology, air and water quality, climatic conditions, presence of snow or mud, naturalness, scenic integrity and/or tranquility (Absher et al., 2018; Fefer et al., 2018; IVUMC, 2016). ⁃ Social (or experiential) capacity is how many people can use the space before the experience diminishes. Associated attributes include: amount and type of contact between individuals or groups and between different types of recreation activities (e.g., motorized or non- motorized use); spatial arrangements of activities; and quality and amount of use (Absher et al., 2018; IVUMC, 2016; Whittaker et al., 2011). ⁃ Managerial capacity is the amount of physical space, staffing and financial resources available to achieve a park’s vision and goals. Associated attributes include: park facilities (e.g., trails, parking lots), staffing, and management of visitor behaviour (e.g., regulations and enforcement, education) (NPS, 1997; Whittaker et al., 2011). 5.4 Cultural capacity
Cultural capacity work is specific to the place and peoples who have and currently inhabit an area. Park or area specific definitions of cultural capacity may be developed through place-based conversations with local Indigenous peoples to make sure their values and knowledge are reflected in ways they deem appropriate.
- Cultural capacity is how are cultural values, resources and practices respected, protected and/or supported. Associated attributes include 1) rights, values, interests, language and practices of local indigenous community; 2) cultural, spiritual, pre- historic, historic or heritage sites; 3) culturally-modified species, landscapes or features; or 4) cultural use (IVUMC, 2016; Whittaker et al., 2011).
Existing CC frameworks consider cultural capacity as an element of either social capacity or combined with environmental resources. Metro Vancouver may consider cultural capacity as one of social capacity attributes or consider it as one of core capacities along with environmental, experiential and managerial capacities.

9
6. Measurement and types of carrying capacity
6.1 Monitoring indicators and standards
Monitoring is essential for adaptive management. Monitoring helps to understand the environmental effects of visitors. It also helps to detect changes in conditions of interest, to determine when to take actions to maintain or improve desired conditions, to evaluate the effectiveness of actions and to inform future direction (Reigner et al., 2012). And, in order for monitoring to be effective, monitoring indicators and standards should be carefully determined. The Visitor Use Management Framework (IVUMC, 2016) lays out tips for selecting indicators and establishing standards. First, managers review or establish desired condition statements and identify key capacity issues by reviewing existing data on the environmental effects of visitor use, related scientific research and/or through consultation with stakeholders. Second, managers screen and identify the minimum number of indicators. Good indicators are simple, feasible, reasonable, connected to visitor use and desired conditions and sensitive to change. Third, they determine the appropriate unit of measurement for each indicator. Fourth, park managers establish standards once indicators are selected. Standards maybe be informed by science, professional experience, legal requirements, management objectives and/or desired conditions. Last, park managers evaluate indicators and standards through monitoring to ensure that they detect and reflect changes in conditions. Such process underlies adaptive management (Manning et al., 2011). Table 1 An example of a carrying capacity framework for parks including four core capacities and associated attributes, monitoring indicators and standards. A set of appropriate attributes, indicators and standards will be selected and adapted to each park.
Attribute Element (e.g.) Indicator (e.g.) Standard (e.g.) Reference
Environmental Vegetation Amount of vegetation loss
Amount of vegetation loss at campsite will not exceed 625 ft2 (25 ft x 25 ft); or No more than a 2 ft increase in trampled vegetation from baseline values that were identified as acceptable
IVUMC (2019)
Soil Proportion of bare soil area
20% of area under study Manning et al. (2005)
Hazard rating for soil erosion into a creek at marked sections along the entire trail
Soil erosion hazard rating will not exceed “Low” in 80 percent of the water influence zone
IVUMC (2016)

10
Attribute Element (e.g.) Indicator (e.g.) Standard (e.g.) Reference
Wildlife Density of informal trails in known, sensitive wildlife habitat
No more than 1 informal trail from the designated trail per 1 km
IVUMC (2019)
Population sampling of spotted trout at marked places in a creek during project implementation and following implementation
No downward trend for more than 3 consecutive years
IVUMC (2016)
Water Level of fecal coliform per sampling period
Provincial fecal coliform standard for recreational contact
IVUMC (2019)
Naturalness Distance to roads or to motorized use
The area is 1 km or less from roads and trails open to motorized use (“roaded natural”)
Clark and Stankey (1979)
Social Crowding
Maximum number of people-at-one-time at destination points acceptable
95 persons at selected attraction sites
Manning et al. (2005)
Maximum persons per viewscape along a trail
8 persons on a 50 m section of trail during summer weekend
Lawson et al. (2011)
Number of groups encountered along a trail
No more than 6 encounters with other groups in the management zone 80% of the time
IVUMC (2019)
Number of people standing on the bus
Fewer than 5 people sanding 80% of the time
IVUMC (2019)
Use conflicts Number of incidents specific to use conflicts reported or
No more than 5 incidents specific to use conflicts per year
IVUMC (2019)

11
Attribute Element (e.g.) Indicator (e.g.) Standard (e.g.) Reference
responded to by law enforcement
Safety Number of incidents reported during the hottest months
No more than 30 safety incidents reported during the hottest months on trails
IVUMC (2019)
Noise Increase in sound level (i.e., median ANS-weighted sound pressure level) above natural ambient at locations during daytime hours
During a 30-day monitoring period, only 3 days can exceed natural daytime ambient by 3 dB
National Park Service (2019);
Visitor satisfaction
Number of reasonable visitor complaints related to trail experiences each year
Nor more than 20 reasonable complaints
National Park Service (2019)
Percent of visitors satisfied with the monument’s facilities, trailheads, trail system, visitor center and interpretative programs
90% of visitors responding to the annual visitor satisfaction survey are satisfied within the categories of park facilities and interpretive programs.
Managerial Parking Number of cars in the parking lot per day
Parking lot is at full capacity less than 80 % of the time
IVUMC (2019)
Parking Traffic control Number of staff hours needed and/or annual cost of traffic control per park entrance
Regional Parks

12
Attribute Element (e.g.) Indicator (e.g.) Standard (e.g.) Reference
Banning of dogs
Number of ticketed uncompliant visitors
Taylor and Langeloo (n.a.)
Trail
Number of informal trails per km of designated trail
No more than 1 informal trail leaving designated trail per 1 km segment
IVUMC (2019)
Number of new informal trails leaving the formal trail system
No additional informal trails annually that exceed over 15 meter in length
National Park Service (2019)
Percent change in trail depth
No more than 25% increase in trail depth
National Park Service (2019)
Percent change in trail width
No more than 25% increase in trail width
National Park Service (2019)
Human waste Aggregate number of improperly disposed human waste sites within an area
No more than 50 human waste sites in a zone
IVUMC (2019)
Cultural Cultural resource (e.g. site, artifact)
Number of theft/vandalism incidents
No more than 1 documented incident per year
IVUMC (2019)
Condition rating for integrity of cultural resource features
No less than a condition rating of good (50% integrity)
IVUMC (2019)
Number of cultural or spiritual sites
IVUMC (2019)
Cultural practice
Loss of use by indigenous community
Absher et al. (2018)

13
The following sections 6.2, 6.3, 6.4 and 6.5 summarize methodologies for measuring and establishing some of environmental, social and managerial capacity attributes included in Table 1. The methodologies are discussed in detail in Appendix 2. 6.2 Measuring and establishing environmental capacity
Vegetation is most commonly measured to examine environmental impacts of visitor use in parks. Typically, field survey is conducted to measure vegetation cover, plant composition and tree conditions along formal or informal trails, or at recreational sites. Measurements of vegetation cover and plant composition are compared to ones of adjacent undistributed (control) trails or sites in order to determine trampling impacts on vegetation in a park (Hammitt, 2015). Existing studies have shown vegetation loss on lightly used sites can be nearly as substantial as that on heavily used sites (Guntenspergen, 2014). Soil erosion is another environmental impact of visitor use that is commonly measured. Similar to vegetation, soil erosion on formal or informal trails, or at recreational sites can be measured (Murguzur et al., 2019). Similar to vegetation loss, low levels of repeated visitor use can cause erosion (Cole, 2004). In addition to the frequency of use, use type (e.g., horses or motorized uses) and/or environmental conditions (e.g., steep trail slope, low density vegetation, wet season) can influence the magnitude of soil erosion (Marion and Leung, 2004). The natural range of variation (NRV) of ecosystem qualities may inform decisions on standards for a park or a specific location within a park. NRV assumes that a range of natural variation exists and that there is a point beyond which an ecosystem will irreversibly shift to a different state. In recreation settings, one may establish realistic standards of ecosystem qualities even though the standards are outside NRV. In some cases, desired or current conditions can substantially differ from NRV and they can be difficult to maintain without significant, direct management actions (Hammitt, 2015). In addition, visual image methods can be used to identify visitor values of environmental capacity for a park (Kim and Shelby, 2005). 6.3 Measuring and establishing social capacity
Visitor experience can be influenced by crowding, safety, soundscape, conflict between different visitor uses, wildlife-human conflict, trail conditions, and quality of view (IVUMC, 2019). Among these conditions that can influence visitor experience, crowding at viewpoints and trails is found to have the most significant influence on the quality of visitor experience and visitor satisfaction (Kohlhardt et al., 2017; Manning et al., 2005). Crowding is commonly measured as the number of people-at-one-time (PAOT) at a specific destination, the number of persons per view (PPV) on trails or encounters along trails. A visitor survey with simulated images that represent different levels of PAOT is often used to determine visitors’ acceptability of crowding in a park or at a certain location within a park (Manning et al., 2005). Different standards can be determined for different zones in a park. For a zone emphasizing solitude, for example, a best standard quality of PAOT may be selected. For a zone in which
14
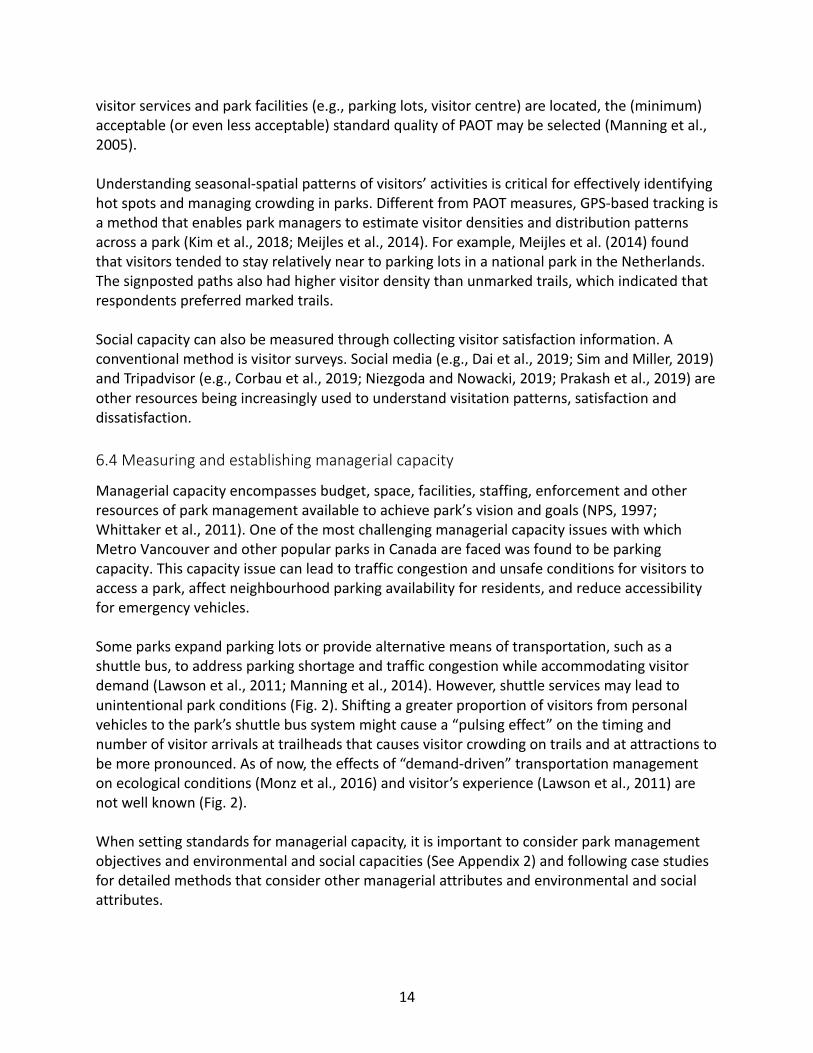
visitor services and park facilities (e.g., parking lots, visitor centre) are located, the (minimum) acceptable (or even less acceptable) standard quality of PAOT may be selected (Manning et al., 2005). Understanding seasonal-spatial patterns of visitors’ activities is critical for effectively identifying hot spots and managing crowding in parks. Different from PAOT measures, GPS-based tracking is a method that enables park managers to estimate visitor densities and distribution patterns across a park (Kim et al., 2018; Meijles et al., 2014). For example, Meijles et al. (2014) found that visitors tended to stay relatively near to parking lots in a national park in the Netherlands. The signposted paths also had higher visitor density than unmarked trails, which indicated that respondents preferred marked trails. Social capacity can also be measured through collecting visitor satisfaction information. A conventional method is visitor surveys. Social media (e.g., Dai et al., 2019; Sim and Miller, 2019) and Tripadvisor (e.g., Corbau et al., 2019; Niezgoda and Nowacki, 2019; Prakash et al., 2019) are other resources being increasingly used to understand visitation patterns, satisfaction and dissatisfaction. 6.4 Measuring and establishing managerial capacity
Managerial capacity encompasses budget, space, facilities, staffing, enforcement and other resources of park management available to achieve park’s vision and goals (NPS, 1997; Whittaker et al., 2011). One of the most challenging managerial capacity issues with which Metro Vancouver and other popular parks in Canada are faced was found to be parking capacity. This capacity issue can lead to traffic congestion and unsafe conditions for visitors to access a park, affect neighbourhood parking availability for residents, and reduce accessibility for emergency vehicles. Some parks expand parking lots or provide alternative means of transportation, such as a shuttle bus, to address parking shortage and traffic congestion while accommodating visitor demand (Lawson et al., 2011; Manning et al., 2014). However, shuttle services may lead to unintentional park conditions (Fig. 2). Shifting a greater proportion of visitors from personal vehicles to the park’s shuttle bus system might cause a “pulsing effect” on the timing and number of visitor arrivals at trailheads that causes visitor crowding on trails and at attractions to be more pronounced. As of now, the effects of “demand-driven” transportation management on ecological conditions (Monz et al., 2016) and visitor’s experience (Lawson et al., 2011) are not well known (Fig. 2). When setting standards for managerial capacity, it is important to consider park management objectives and environmental and social capacities (See Appendix 2) and following case studies for detailed methods that consider other managerial attributes and environmental and social attributes.

15
Figure 2 Conventional and sustainable transportation management models (Manning et al.,
2014)
6.5 Integrating environmental, social and managerial capacities
CC of a park can be estimated by incorporating environmental, social and managerial capacities. One method is the Cifuentes method that was developed to estimate tourism carrying capacity in protected areas. This method is introduced in international guidelines such as the International Union for Conservation of Nature (IUCN) guidelines for tourism in protected areas (Ceballos-Lascuráin, 1996; Eagles et al., 2002) and the World Tourism Organisation guideline for sustainable tourism for local authorities (WTO, 1998). The method has been applied in tourism studies of protected areas around the world (e.g., Corbau et al., 2019; Nghi et al., 2007; Sayan and Ortaçe, 2006). By using the Cifuentes method, Corbau et al. (2019) estimated carrying capacities for popular beach destinations in Italy. A range of the area required for tourist and factors (i.e., daily open period/average time of visit) were considered for different quality of visitor experience or different seasons rather than using one single value. The authors suggest that setting an upper and a lower limit of visitor capacity maybe more useful than estimating a fixed single value. When setting visitor capacity limits, park usage and impacts should be monitored to adjust limits as necessary. Another method is choice experiment survey to predict people’s responses to a set of different potential visitor experiences by asking respondents to make choices among alternative

16
scenarios (Lawson and Manning, 2003). Scenarios are formulated with a series of attributes reflecting diverse hypothetical social, biophysical and managerial conditions within a park under study. These scenarios can be communicated in visual images with or without text. By employing a choice experiment survey, Kohlhardt et al. (2017) identified tradeoffs that people are willing to make for their outdoor experience in Garibaldi Provincial Park. The survey results reiterated that crowding (at viewpoint and trail) has a larger influence on visitor satisfaction in Garibaldi Park than other undesirable attributes such as day use fees, eroded trail conditions, or non-worthy viewpoint destinations. Even natural trails with no erosion and worthy viewpoint destinations were not by themselves sufficient to compensate visitor’s dissatisfaction caused by crowding. The study also found different groups of visitors have different preferences for the park conditions (See appendix 2.3.2 for more details on this study.) Case studies in the Section 7 also discuss how parks approaches to establishing CC for their visitor use management plan.

17
7. Case Studies
7.1 Visitor use management plan and visitor capacity for Petroglyph National Monument
Organization and area: Petroglyph National Monument (monument) is jointly managed by the National Park Service of the United States (NPS) and the City of Albuquerque. The monument covers an area of 29.17 km2 in New Mexico’s West Mesa, featuring more than 20,000 petroglyphs etched by native peoples and early Spanish settlers, a 27-km basalt escarpment and more than 350 archeological sites and ethnographic resources (e.g. cultural landscape, object, etc.). Such features are of spiritual and cultural significance to many pueblo communities and tribes of the Southwest United States. Capacity issues: The monument has seen a significant increase in the number and extent of informal trails created by visitors. These informal trails have contributed to trail widening, vandalism, graffiti, soil erosion, native vegetation loss, invasive species, and damage to petroglyphs and archeological sites. There has been a concern that access of the tribes and traditional use are impacted by current use patterns. In addition, the quality of visitor experiences is affected by crowding in popular areas and conflict among different types of use. Actions taken: NPS developed the Visitor Use Management Plan (NPS, 2019) that formalizes a sustainable trail system to manage public access and use on trails, in collaboration with the city and through consultations with tribal representatives and the public. The entire planning process for the plan (https://parkplanning.nps.gov/PlanProcess.cfm?projectID=66887) was guided by the Visitor Use Management Framework (IVUMC, 2016). The planning process started in 2016 and was completed (Step 11) in 2019 (See below). As of July 2020, the monument is one of the few national parks in the United States that have applied the framework for developing their visitor use management planning and completed the planning process. The Visitor Use Management planning process of Petroglyph National Monument
Step 1. Define purpose and need/develop preliminary alternatives Step 2. Conduct external scoping Step 3. Review scoping comments Step 4. Refine alternatives Step 5. Identify environmental impacts and select preferred alternative Step 6. Prepare plan/environmental document Step 7. Public review of plan/environmental document and open house meetings Step 8. Analyze public comments Step 9. Prepare draft decision document Step 10. Provide draft decision document to the NPS Intermountain Regional Director for final decision Step 11. Release decision document to the public Step 12. Implement decision with site-specific analysis and consultation, as needed

18
In Step 1, NPS developed three management action alternatives—one no-action alternative and two action alternatives—, which were reviewed through public scoping. Each alternative describes their own management strategies for visitor use, public access points, existing trail system, designated trails, administrative roads, unauthorized visitor-created and former roads, utility access corridors, visitor educational and interpretive opportunity, accessibility, partnerships, and volunteer efforts. In addition, key environmental, social and cultural impact issues were identified internally by NPS, other agencies, and tribal governments as well as through public scoping. After the public scoping, NPS refined the alternatives and analyzed key potential individual impacts and cumulative impacts associated with each alternative. Then, the most preferable alternative was chosen by NPS. The interdisciplinary planning team developed six indicators (e.g., change in trail width or trail depth) related to the impact issues (e.g., trail conditions) that would help identify when management action is needed. Then, the team established thresholds (e.g., no more than 25% increase in trail width or trail depth) for each indicator by considering the goals and objectives, existing conditions, relevant research studies, staff management experiences and public preferences. Their plan discusses a rationale for their indicators and thresholds as well as monitoring plan, management strategies, and mitigation measures (e.g., establishing trail borders with rocks, logs, post and cable, or fencing to narrow width) to be implemented. Guided by the framework (IVUMC, 2016), literature and best practices, the planning team established a CC (“visitor capacity”)—maximum amount and type of visitor use that an area can sustainably accommodate—for each key management area by considering environmental, social and managerial attributes, as summarized in Table 2. Table 2 Steps for establishing a carrying capacity for Boca Negra Canyon, Petroglyph National Monument
Steps Example
Step1. Determine the analysis area where high levels of use currently or can impact important resources and quality of visitor experiences and that are directly related to the management goals and objectives
Boca Negra Canyon, the second most visited area of monument. A narrow trail is in close proximity to hundreds of petroglyphs and highly used. Crowding can cause visitor conflicts and damage to petroglyphs.
Step 2. Review existing direction and knowledge including management goals and objectives; indicators and thresholds; and conditions and values that must be protected and most related to visitor use levels
Goal: To maintain sustainable access and trail use Indicator: Number of features affected by visitor use adjacent to trail system (e.g., rocks moved and/or newly recorded modern graffiti or artifacts missing, evidence of site erosion or compaction)

19
Threshold: No more than five documented incidents of damage impacted by visitor activity adjacent to the trail system each year or disruption of tribal access or traditional use Given that the current parking lots can accommodate 36 vehicles and up to three 35- person buses, the current level of use is estimated at 215 PAOT (incl. 20 PAOT from residential walk-in access). The persons-per-vehicle factor of 2.5 was applied.
Step 3. Identify the limiting attributes (e.g. physical, biological, cultural, social or managerial) that are most constraining or sensitive for deciding the amount of use for the analysis areas
Trail system and cultural resources are limiting attributes. There is more parking capacity than ecological, social and cultural conditions can accommodate. In case of full parking, the overwhelming volume of people can cause overcrowding and damage to trails and petroglyph viewing areas.
Step 4. Identify the appropriate amount of use at key areas by understanding current conditions compared to goals and objectives for the area and by reviewing visitation data including daily visitor counts, counts of fees, parking availability and other data sources (e.g., Strava Metro).
Considered the monument’s goal for this area, a maximum of two buses (instead of three buses) and 36 vehicles on site at one time was determined as appropriate. Subsequently, a CC for the canyon is decided at 180 PAOT (incl. 20 PAOT from residential walk-in access) except during the one-time annual event.
Next steps: More detailed planning and environmental compliance may be needed before certain actions of the selected alternative are carried out (e.g., active restoration or rehabilitation of closed routes, stabilization of trails, trail reroutes, etc.). Considerations: The implementation of the plan will depend on future funding and could be affected by changes in NPS staffing, visitor use patterns, unanticipated environmental conditions, development on adjacent lands. The plan intends to be flexible to adapt to these changes. Full implementation could take many years. Other: The planning process may differ between individual parks even though they are guided by the framework (IVUMC, 2016).

20
7.2 Visitor use management plan, zoning and visitor capacity for Delaware Water Gap National
Recreation Area
Organization and area: Delaware Water Gap National Recreation Area (park) is operated by National Park Service (NPS) and located in New Jersey and Pennsylvania. The park covers an area of 28.5 km2 and features the 64-kilometre-long Middle Delaware National Scenic and Recreational River, of which main stem is one of the cleanest rivers in the country, and cultural resources spanning more than 12,000 years of human habitation. The park is among the top 20 most-visited national parks in the states and is located less than a two-hour drive from both New York City and Philadelphia. The park receives an average of 3.8 million visitors every year and is popular for water-based recreation, hiking and camping. Capacity issues: The park was managed by the 1987 General Management Planning zoning, and strategies which were no longer adequate or appropriate for current use. In addition, as demand for parking increases, visitors would park farther away from the entrance and access to the main trailhead through visitor-created trails, which creates unsafe conditions for visitors. As some popular areas become overcrowded, visitors would go off-trails to seek places for solitude. Such visitor behaviors have led to vegetation trampling and degradation, soil erosion, unsafe recreational use and have affected the quality of visitor experiences. Actions taken: In 2015, NPS started the planning process for a visitor use management plan, guided by the framework (IVUMC, 2016), in parallel to revision of the 1987 zoning. NPS conducted a survey to understand visitor use, and two universities conducted studies that informed park decisions on indicators, thresholds for visitor experiences, visitor capacities and monitoring protocols. The public review for the Draft Visitor Use Management Plan (the draft plan) was completed in December 2019 (https://parkplanning.nps.gov/PlanProcess.cfm?projectID=55912). The planning process for the visitor use management plan for Delaware Water Gap National Recreation Area
Step 1. Stating the park purpose and significance Step 2. Identifying applicable laws and policies Step 3. Establishing the purpose and need of the plan Step 4. Identifying the fundamental resources and values of the park Step 5. Engaging the public (Spring 2015) Step 6. Assessing the condition of the visitor experience and park resources Step 7. Identifying issues that the plan will address Step 8. Developing preliminary management strategies and options Step 9. Identifying visitor use management goals and best practices Step 10. Conducting formal public scoping - Summer 2015 Step 11. Refining options to meet objectives and identify management strategies Step 12. Establishing indicators for monitoring visitor experiences and resource conditions Step 13. Changing zoning Step 14. Identifying environmental impacts and selecting proposed action

21
Step 15. Prepare draft plan Step 16. Public review of draft plan Step 17. Analyzing and responding to public comments Step 18. Prepare final plan/environmental document/decision document Step 19. Releasing final plan/decision document to the public
The draft plan provides a detailed description of each zone that has been revised. Each zone has its own management direction, desired natural and cultural resource(s) and facilities, and appropriate visitor use. In some cases, different monitoring indicators and/or thresholds are applied to each zone. A threshold for visitor-created trails in the Visitor Service Area Zone, for example, is no more than 0.4 km of visitor-created trails while a threshold for the Outstanding Natural Feature Zone is no more than 4.8 km of visitor-created trails. Instead of reducing the current visitation levels to reduce visitor use impacts, which was the case for Petroglyph National Monument (Case study 1), NPS plans to maintain the current PAOT as their CC (“visitor capacity”) and to employ other management actions to control the impacts. Table 3 below summarized the process of determining the visitor capacity and examples of management actions planned to control impacts for one of the important areas in the park. Table 3 Steps for establishing a carrying capacity for George W. Childs Park, Delaware Water Gap National Recreation Area
Steps Example
Step 1. Determine the analysis area George W. Childs Park is one of the most affected by high visitation above their intended use level. It is within the Outstanding Natural Feature Zone, featuring a short trail, three waterfalls, historical ruins, etc. Park visitors would go off trails to be close to the waterfalls, affecting the growth of vegetation, causing a high level of soil erosion and crowding-related issues such as diminished visitor experience, illegal parking, littering, human waste, etc.
Step 2. Review existing direction and knowledge
Goal: To accommodate a high level of uses including frontcountry users, hiking, water-base recreation Indicator: Number of visitor use-related incidents (or complaints)

22
Threshold: No more than 25% increase from baseline in reported incidents at any one site within patrol zones. Given that approximately 56 parking spaces available at the park, the current level of use (or current parking capacity) is estimated at 195 PAOT. The persons-per-vehicle factor of 3.5 was applied.
Step 3. Identify the limiting attributes Visitor experience. The current levels of visitor use result in crowding and visitor complaints from user conflicts.
Step 4. Identify visitor capacity and implementation strategies
Visitor capacity: maintaining the current level (i.e., 195 PAOT) as a visitor capacity and allowing no more than current levels of use. Implementation strategies: near-term actions (e.g. evaluation of trail repair needs and completion of trail repair), mid-term actions (e.g. a permit system or metering system with a site attendant, discouragement of roadside parking), and potential actions (e.g. establishing a maximum parking duration). Deer fencing has been installed to help protect the vegetation and promote growth at areas affected by trampling.
Next steps: As of July 2020, NPS is in the process of analyzing public input and will use feedback to inform the final visitor use management plan. Once the plan is finalized, implementation of the management strategies directed in the plan will take many years and be updated and adjusted as needed during implementation. Near and mid-term actions will be evaluated for implementation individually, considering future budget restrictions, requirements for regulatory compliance, NPS’s priorities, etc. Considerations: None Other: The draft plan lists best management practices for vegetation and soil as well as visitor use and experience, historic sites and other capacity attributes.

23
7.3 Parking and Shuttle Reservations at Muir Woods National Monument
Organization and area: Muir Woods National Monument (monument) is managed by the National Park Service (NPS) within Golden Gate National Recreation Area in Marin County, California. The monument of approximately 2.25 km2 in size is managed as both an interpretive corridor and a sensitive resources zone. It preserves one of the last remaining old-growth redwood forests for scientific values and inspiration (NPS, 2017). Capacity issues: In 2000s, the monument received over 700,00 visitors annually arriving by private car. High visitation coupled with limited parking space resulted in increases in wait time for parking spaces, illegal parking on the sideroad, and unsafe, inconvenient conditions for visitors to access the park (e.g., walking over 1.6 km on a narrow two-lane road) while exacerbating crowding at parking lots (NPS, 2017). There is limited space available for expanding parking lots due to the monument being a steep canyon. Moreover, parking expansion would have exacerbated residents’ concern on increasing in traffic in the neighbourhood (Nelson et al., 2008). Actions taken: In 2005, NPS and Marin Transit launched the Muir Woods Shuttle as a three-year pilot project, and the shuttle service has since expanded (Nelson et al., 2008). The shuttle brings visitors from three off-site locations to the monument, and visitors can return by the shuttle at any time until the last shuttle. The shuttle runs on all weekends and holidays year-around at different frequencies, depending on the time of year (e.g., every 10 minutes during peak periods), and additionally on weekdays during the peak summer season. The shuttle round trip costs 3 USD per person. Due to COVID-19, shuttle service is not available as of July 2020 (https://gomuirwoods.com/muir/shuttleInfo). The shuttle service has become an integral component of the transportation system. However, the shuttle did not sufficiently reduce the volume of personal vehicles arriving at the monument. From 2006 to 2014, shuttle ridership had increased by ten times from fewer than 5,000 visitors to over 50,200. During the peak season, 20–25% of Muir Woods’ visitors used the shuttle. Meanwhile, visitation had significantly increased from 775,000 visitors in 2005 to 1,000,747 visitors in 2014. During this period, increase in shuttle ridership did not grow as much as the increase rate of visitation, and visitors predominantly came by personal vehicle. NPS decided that without a system in place to control visitation levels, the shuttle service alone would not sustainably or sufficiently reduce traffic and parking issues even though the shuttle service continued to expand (NPS, 2017). To limit visitation levels, distribute visitation through a day or a year, and reduce the number of visitors per hour during peak times of the day (NPS, 2015), NPS and the County of Marin agreed to create a reservation system for visitors using personal vehicles and shuttles in 2015. While the reservation system was being developed, NPS and the County reduced roadside parking on the south of the Redwood Creek Bridge to 80 cars and increase fines, physical barriers (e.g., a combination of posts and post-and-cable fencing) and parking enforcement (e.g., adding one full time NPS staff person to enforce traffic and parking regulations) (NPS, 2019).

24
The staff report indicated that the parking restriction had significantly reduced roadside parking and improved safety in the area as it shorten the walking distance between their parked cars and the monument entrance. In addition, the physical barriers create a buffer and allow for vegetation regrowth (County of Marin, 2019). In January 2018, the reservation system for visitors using a personal vehicle or the shuttle was launched. The reservation system is operated by Ace Parking Management, Inc. Visitors book a reservation for parking or shuttle via a web-based system (https://gomuirwoods.com) or a call centre, year-round prior to their trip. Parking reservations can be made up to 90 days in advance and are not sold onsite. Visitors reserve a 30 minute-arrival time slot for parking and pay a reservation fee, depending on the length or type of the vehicle (from 8.50 USD for standard vehicle to 45 USD for large vehicle; 8.50 USD for electric vehicle and extra 3 USD if charging is needed), plus the entrance fee of 15 USD per adult. Standard, ADA and electric vehicles can stay until the closing time regardless of their arrival time (http://gomuirwoods.com). Commercial carriers make advance reservations via a separate system managed through www.recreation.gov. There are 232 visitor spaces and 12 commercial spaces at the monument parking lot. After the launch of the reservation system in 2018, road shoulder parking was reduced to 40 cars, and “No Parking” signage was installed (County of Marin, 2019). The reservation system has shown a promising outcome. Since NPS started active enforcement on parking violation in 2015, the number of parking tickets issued had increased. When the reservation system came in place, however, the number of parking tickets significantly decreased as far less visitors parked in no parking zones. Yet, queuing occurs at the parking lot entrance as some visitors arrive without a reservation and parking ambassadors are needed to provide information (County of Marin, 2019). Next steps: With the premise that reservation system would accommodate all parking demand, roadside parking will be limited to 30 cars. NPS is developing plans to improve the parking lot, trails and other arrival facilities to improve safety and visitors experience and stormwater management (County of Marin, 2019). Considerations: The reservation system is expected to reduce from approximately 1.2 million visitors to fewer than 1 million visitors (Gonzales, 2017) and visitation by 40-45 % during peak period weekends and by 20-30 % during off-peak season weekends. Daily vehicle trips are expected to decrease by up to 32 % in July (busiest month) and by about 2 % in January (slowest month) (NPS, 2017). The General Management Plan (NPS, 2014) sets no more than 10% of the days in excess of the performance standards regarding user capacity for the monument (e.g., maximum arrival time of 20 minutes per individual or group; no more than 18 PPV per 50-meter trail section along valley primary trails). With the reservation system in place, the occurrences are expected to further decrease to 9 % of the days (NPS, 2017).
25
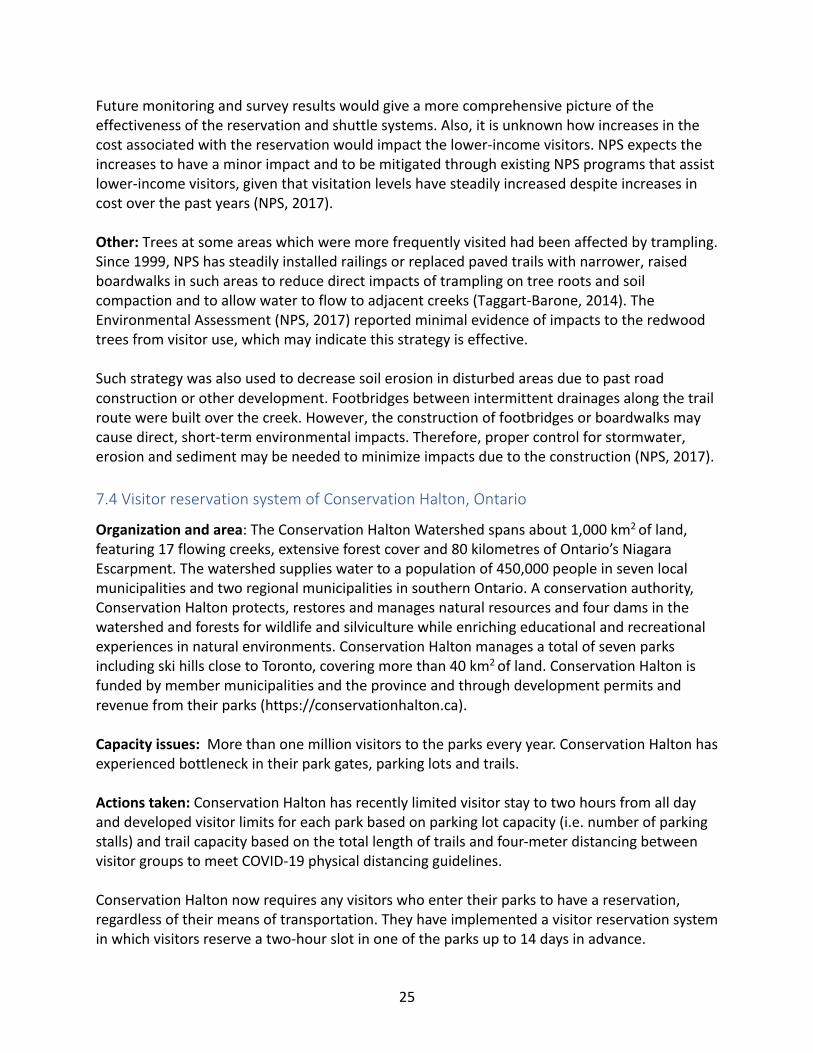
Future monitoring and survey results would give a more comprehensive picture of the effectiveness of the reservation and shuttle systems. Also, it is unknown how increases in the cost associated with the reservation would impact the lower-income visitors. NPS expects the increases to have a minor impact and to be mitigated through existing NPS programs that assist lower-income visitors, given that visitation levels have steadily increased despite increases in cost over the past years (NPS, 2017). Other: Trees at some areas which were more frequently visited had been affected by trampling. Since 1999, NPS has steadily installed railings or replaced paved trails with narrower, raised boardwalks in such areas to reduce direct impacts of trampling on tree roots and soil compaction and to allow water to flow to adjacent creeks (Taggart-Barone, 2014). The Environmental Assessment (NPS, 2017) reported minimal evidence of impacts to the redwood trees from visitor use, which may indicate this strategy is effective. Such strategy was also used to decrease soil erosion in disturbed areas due to past road construction or other development. Footbridges between intermittent drainages along the trail route were built over the creek. However, the construction of footbridges or boardwalks may cause direct, short-term environmental impacts. Therefore, proper control for stormwater, erosion and sediment may be needed to minimize impacts due to the construction (NPS, 2017). 7.4 Visitor reservation system of Conservation Halton, Ontario
Organization and area: The Conservation Halton Watershed spans about 1,000 km2 of land, featuring 17 flowing creeks, extensive forest cover and 80 kilometres of Ontario’s Niagara Escarpment. The watershed supplies water to a population of 450,000 people in seven local municipalities and two regional municipalities in southern Ontario. A conservation authority, Conservation Halton protects, restores and manages natural resources and four dams in the watershed and forests for wildlife and silviculture while enriching educational and recreational experiences in natural environments. Conservation Halton manages a total of seven parks including ski hills close to Toronto, covering more than 40 km2 of land. Conservation Halton is funded by member municipalities and the province and through development permits and revenue from their parks (https://conservationhalton.ca). Capacity issues: More than one million visitors to the parks every year. Conservation Halton has experienced bottleneck in their park gates, parking lots and trails. Actions taken: Conservation Halton has recently limited visitor stay to two hours from all day and developed visitor limits for each park based on parking lot capacity (i.e. number of parking stalls) and trail capacity based on the total length of trails and four-meter distancing between visitor groups to meet COVID-19 physical distancing guidelines. Conservation Halton now requires any visitors who enter their parks to have a reservation, regardless of their means of transportation. They have implemented a visitor reservation system in which visitors reserve a two-hour slot in one of the parks up to 14 days in advance.

26
Conservation Halton members can reserve for free and non-member pay a fee per person. Visitors are allowed to stay maximum two hours; which may be increased to three hours if operationally practical. The main purpose of the reservation system is to stagger visitor arrival time. Visitors can check in maximum 10 minutes before. License processing time is very short, 3 seconds per car on average. No cash is handled. Conservation Halton has opened 6 parks out of 7 parks in late May, and more than 100,000 visitors over the three weeks since then. The feedback received from visitors so far has been very positive (4.8 out of 5). ParkPass, the reservation management platform, provides Conservation Halton with the status of people reserved, people checked-in, cars reserved and cars check-in. It also serves as a communication tool and sends visitors a reminder through email or text before the end of visit or warning notification if visitors fail to show or visitors are late for their exit time. The platform allows analysis of visit duration, age and types of visitors, revenue by park through fees. After creating the system for their first park, it only took an average of three to five days to launch additional parks on the platform. Required information for this process included estimated number of visitors, parking capacity (i.e. # of parking stalls) and length of trails of parks is obtained. Next steps: Conservation Halton is piloting sensors to measure trail capacity in real-time where the staff receive notifications when trails reach their threshold to help to manage overcrowding and adhere to physical distancing guidelines (Personal communication, June 16, 2020). Considerations: Non-members pay their entry fee by the number of people in a group who travel together. The entry fee is 6.50 CAD/adult, 5 CAD/senior and 5 CAD/child (the age of 5 to 14), regardless of their means of transportation, and there is no parking fee. It is unknown how the fee schedule would affect a low-income family visiting parks and influence visitors’ choice of transportation. Other: None 7.5 Pay parking and shuttle service in Waterton Lakes National Park
Organization and area: Waterton Lakes National Park, part of the Crown of the Continent ecosystem, covers 505 km2 in southwestern Alberta. The park is home to more than 60 mammal and 250 bird species and more than half of Alberta’s plant species. The park has one entry point and one townsite in which hotels, restaurants, cottage and camp sites accommodate park visitors (https://www.pc.gc.ca/en/pn-np/ab/waterton). Capacity issues: The park receives about 500,000 visitors every year. Even though it is a smaller park than Banff (e.g. 10 times larger), its visitation per km2 is higher than Banff National Park. Most visitors come in summer from May and September, and visitation peaks during 3-to-4 weeks from June to July.
27
Actions taken: Parks Canada does not generally establish the maximum number of visitors who are allowed to visit parks. Instead, staff monitor and control traffic density and parking capacity. Traffic density is monitored based on the number of cars on the road, the minimum distance between cars and total length of road within the park. Waterton Lakes National Park hires a private traffic control company during peak season to help manage the traffic and parking lot. Their roles include: counting in-coming and out-going vehicles, monitoring parking capacity, controlling traffic, communicating parking capacity on the sign board and turning visitors away when the parking lot is full. In addition, a shuttle service from the townsite to the main destinations in the park, which has been successful in managing traffic and parking capacity. Next steps: None Considerations: Staff determined the shuttle service is the best solution for managing park capacity as their peak time is very short and implementing a parking reservation system requires substantial resources. If the number of days when the parking lots fill exceeds 30 to 40 days, they may consider the reservation system (Personal communication, June 19, 2020). Other: None 7.6 Recognition and education of Blackfoot history in Waterton Lakes National Park Organization and area: Waterton Lakes National Park is part of the traditional territory and a place of significance for the Blackfoot (Niitsitapi). The traditional Blackfoot name for Waterton Lakes is Paahtómahksikimi, which means the inner sacred lake within the mountains (https://www.pc.gc.ca/en/pn-np/ab/waterton/visit/guide). Parks Canada is “committed to a system of national heritage places that recognizes and honours the contributions of Indigenous peoples, their histories and cultures, as well as the special relationships Indigenous peoples have with traditional lands and waters” (Park Canada, 2019a). Parks Canada has been working closely with Blackfoot First Nations to recognize, maintain and provide education on cultural values. Capacity issues: The intense Kenow Wildfire of 2017 destroyed more than 190 km2 of land in the park, resulting in loss of extensive vegetative groundcover and uncovering archaeological sites and artifacts. It posed a threat to loss or damage as some sites became vulnerable to landslides, extreme rainfall, rapid now melts, etc. It also presented a rare and unique opportunity for archaeological research to record archaeological artifacts and sites and expanded knowledge of cultural histories of the Indigenous people and European settlers in the landscape. The wildfire also damaged a visitor centre, which was built in 1958 and had already deemed inadequate to accommodate more than 500,000 visitors every year (Parks Canada, n.d.).

28
Actions taken: After the fire, a five-year plan was developed to revisit and expand knowledge of archaeology of the park. Park staff, archaeologists, and Indigenous students surveyed burnt areas for new archaeological sites, assessed the conditions of the sites and identified the potential risks to the sites in the post-fire environment (Parks Canada, n.d.). Construction of a new visitor centre is underway after four years of planning, public engagement, design and engineering and environmental assessment. Parks Canada and Káínai and Piikáni First Nations have jointly developed interpretive programming for the new visitor centre that provides opportunities for visitors to learn about culture, history and (past and current) connection of the Blackfoot to the park land (Personal communication, June 19, 2020). Interpretative design of the new visitor centre will exhibit and communicate to the public the history and culture of the Blackfoot and why the lands are important to them through stories, songs, graphics and symbols (https://www.pc.gc.ca/en/pn-np/ab/waterton/info/public/interp). Next steps: Parks Canada continues to monitor and share the information with Indigenous communities and elders. The new visitor centre is scheduled to open in spring 2021. Considerations: None Other: Since 2014, members of the Káínai and Piikáni First Nations have been granted free entry to the park. The Káínai and Piikáni First Nations collect plant materials for their cultural practices and participated in ceremonial activities and events in the park such as bison cull, medicine wheel and beaver bundle. Some features and sites in the park have been given traditional names (Parks Canada, 2018). 7.7 Watchmen program integrating cultural, social and environmental capacities at Gwaii
Haanas
Organization and area: Gwaii Haanas— Gwaii Haanas National Park Reserve, National Marine Conservation Area Reserve and Haida Heritage Site— is a protected area in Canada that is co-managed by First Nations and the Government of Canada (Thomlinson and Crouch, 2012). The Archipelago Management Board was established to protect the ecological and cultural integrity of Gwaii Haanas and is currently comprised of three representatives of the Council of the Haida Nation (CHN) and three representatives of the Government of Canada (two Parks Canada, one Fisheries and Oceans Canada). The Haida recognizes that protection of the ecological and cultural integrity on Haida Gwaii is essential to sustaining their culture and that it is important to manage Gwaii Haanas as a single, interconnected ecosystem of land, sea and people guided by principles based on Haida cultural values (CHN and Parks Canada, 2018). Gwaii Haanas covers an area of 5,000 km2 in the southern Haida Gwaii off the other Pacific coast and contains many physical remains of Haida villages, gathering (e.g., food, fibre, medicinal) camps, fish weirs, burial sites and rock shelters. Gwaii Haanas attracts people who
29
seek remote outdoor and/or cultural experiences and plays an important role in the local tourism industry (CHN and Parks Canada, 2018). Capacity issues: Some areas in Gwaii Haans have experienced high visitation and associated vandalism, theft and mistreatment for decades, and there was a growing concern for cultural resources and ecological integrity. In the late 1970s a group of Haida people established a number of camps at old Haida village sites in the southern part of Gwaii Haanas to protect the villages, which have become Haida Gwaii Watchmen sites. Currently, visitor activities are concentrated at such Haida Gwaii Watchmen sites, Rose Harbour, and Burnaby Narrows in Gwaii Haanas, and these attraction sites act as hot spots for travel and visitation (Zorrilla Martinez, 2003). Actions taken: The Haida Gwaii Watchmen program was formally launched in 1981 with the support of the Skidegate Band Council, the Council of the Haida Nation and committed Haida volunteers as one of the measures initiated by the Haida Nation to protect the natural environment and cultural heritage of Gwaii Haanas. From May to October, Watchmen are posted at the five most frequently visited cultural sites in Gwaii Haanas, and at each site there are between two and four designated Watchmen. Their job includes protecting the sites from vandalism, theft and misuse by visitors, explaining basic behavioural rules to visitors, and keeping the site clean and maintained. Watchmen also control tourists’ flow by allowing no more than 12 visitors at the sites and assisting tourists in case of emergency (Zorrilla Martinez, 2003). The Watchmen program offers a first-hand introduction to Haida culture by sharing their knowledge of the land and sea, their stories, songs, dances and traditional foods. Even though interpretation is not the focus of the program and watchmen have the ability to determine the amount and type of interaction that they have with visitors, most Watchmen willingly adopted roles as interpreters of the natural environment, culture, and the old village remains. Many have even given tours in the sites voluntarily. For many visitors, meeting the watchmen is reported at their favourite part of a memorable trip to Haida villages (Parks Canada, 2019c). The Watchmen program has positive impacts for the Watchmen and Haida Gwaii. First, the Watchmen program has provided seasonal employment for Haida men and women. Second, being Watchmen gives an opportunity for the Haida individuals to be in contact with their ancestors, ancestral land and heritage. Third, Haida individuals have felt prouder of their heritage by sharing their culture with visitors who admire and enjoy to learning about Haida lands and culture (Zorrilla Martinez, 2003). Last, the Watchmen program showcases a biocultural approach to conservation and protection that integrates traditional ecological knowledge and conventional scientific knowledge. Haida Gwaii Watchmen program, established by the Haida Nation to monitor, steward, and protect Gwaii Haanas, is considered as a model for other First Nations undertaking management of their traditional territories (Gavin et al., 2018; Stephenson et al., 2014). Next steps: None.

30
Considerations: One important factor for the success of the Watchmen program identified in the literature is recognition and implementation of Indigenous rights. Such Indigenous-led initiatives are often motivated by desire of Indigenous people to reclaim (some level of) control over resources and to rehabilitate degraded ecosystems by using their own principles and approaches in their territory (Stephenson et al., 2014; Stephanie and Jameson, 2020). The other important factor is sustainable and sufficient funding. Today the funding of the program is provided by Parks Canada, and to strengthen existing guardian programs and expand across Canada, securing sustainable and sufficient funding is critical (Bellrichard, 2019). There was a need for enhancing Haida Nation’s capacity, their involvement with compliance and enforcement, and improving communication and partnerships between organizations. In 2018, a new auxiliary Conservation Officer position was created at Conservation Officer Service (COS) in partnership with the Haida Nation and Parks Canada. The new officer, as a fish, wildlife, and land guardian, enforces fish and wildlife laws, environmental pollution and terrestrial cultural features. A member of the Skidegate band who had previously worked as a fisheries guardian with the Haida Nation was hired as a first guardian with a hope of bringing Haida values into daily enforcement operations (Bender, 2019). Other: Across Canada, Indigenous Guardians help care for the land, acting as “eyes and ears” for their communities, monitoring wildlife, protecting ecosystems, and developing management plans. See Coastal Guardian Watchmen (https://coastalfirstnations.ca/) and Indigenous Leadership Initiative (https://www.ilinationhood.ca/) to learn about regional and national network, respectively. In 2019, First Nations guardians gathered in downtown Vancouver to streamline movement and lobby for sustained funding (Bellrichard, 2019). Beyond Canada, best practices of managing cultural and experiential capacity can be found in Australia. For example, Ikara-Flinders Ranges National Park, South Australia, resolved a vandalism issue in cultural sites by closing the sites of concern and only allowing Indigenous-guided visitor group to the site. This also promoted aboriginal tourism (Government of South Australia, 2020). In addition, Australian national parks have three different governance structures of park co-management which may inform Metro Vancouver’s engagement and collaboration with First Nations in managing parks in the future (National Parks and Wildlife Service, n.d.).

31
8. Key findings
1. Carrying capacity is known as visitor capacity, recreation capacity, or user capacity. It is defined as “the maximum amounts and types of visitor use that an area can accommodate while achieving and maintaining desired resource conditions and visitor experiences that are consistent with the purposes for which the area was established” (IVUMC, 2016). Carrying capacity generally concerns environmental (biophysical or ecological), social and/or managerial attributes that limit a site’s ability to accommodate visitor use. Carrying capacity is identified based on desired conditions and the limiting attributes of the site. 2. The Visitor Use Management Framework (IVUMC, 2016) is a comprehensive, systematic planning tool for developing a strategy for visitor use management and establishing a carrying capacity. The framework has been broadly applied in national and/or provincial parks in North America. Visitor use management planning process may differ between parks but include essential steps including development of two or three management action alternative (or scenarios) and assessment of environmental, social and managerial impacts of each alternative; public scoping of stakeholders and public inputs of desired conditions and concerns; development of monitoring indicators and thresholds; establishment of a carrying capacity; and public review of a draft plan. 3. Different methodologies and models for establishing a carrying capacity are used by different park agencies. National parks included in the report set a carrying capacity (“visitor capacity”) for a specific area or zone in a park rather than for the entire park as a park can have multiple popular or sensitive destinations based on important limiting attributes of the area (e.g., parking capacity or trail capacity at certain locations). Some regional parks (i.e., Conservation authorities in Ontario) have determined a CC based on the number of parking stalls, the total length of trails, etc. In some cases, it is the number of vehicles that causes capacity challenges rather than the number of visitors. Establishing the carrying capacity can be complex and often require both quantitative and qualitative data. 4. Depending on the extent and complexity of capacity issues, parks may set a carrying capacity smaller than the current level of use or they may maintain the current level while implementing different strategies to manage/reduce the current level of visitor use impacts. In either way, the impacts of visitor use are monitored and the carrying capacity will be adjusted as needed over time. 5. Shuttle service alone may not sustainably or sufficiently reduce traffic and parking issues without a system in place to control visitation levels. Most case studies discussed in this report have employed the shuttle in parallel to management actions such as increasing enforcement, physical barriers, and/or the amount of parking tickets. Recently, reservation systems have increasingly being implemented. During COVID-19 pandemic, the parks under this study did not operate shuttle services.

32
6. Different types of reservations systems are being used. The reservation can be free of charge or require fees. Arrival time can be limited to stagger arrival times through a day (e.g., from 10 minutes to 30 minutes, to morning or afternoon) or unlimited (e.g., day permit). Visitors may be allowed to stay for a certain period of time (e.g., two or three hours) or a full day. Visitors may book a reservation in advance or book only on the same day of their intended visit. Reservation systems have shown some promising outcomes. Metro Vancouver may consider different options for limiting visitation levels and/or staggering arrival times and diverse strategies to effectively communicate to the public. 7. It is unknown whether and how increases in the entry fees associated with the reservation would impact the lower-income visitors. The reservation fee schedule should be determined with caution in order to minimize financial barriers for lower-income visitors and, at the same time, to have a positive influence on visitor’s choice of transportation. 8. Physical barriers (e.g., fencing) with a signage (“rehabilitation”) or raised boardwalks/platforms are found to be most effective in reducing trampling impacts on vegetation including groundcover, tree roots and soil conditions. 9. Indigenous engagement in park management can vary in terms of rights and title, roles, funding and/or enforcement authority. Management strategies for cultural capacity may be developed through place-based conversations with local Indigenous peoples to make sure their values and knowledge are reflected in ways they deem appropriate. This report discusses examples of Indigenous Guardian and Watchmen program, Indigenous- guided tour and stewards, and an enforcement officer. Such examples show a potential for protecting cultural resources and sites while improving visitor experiences and conservation approaches in parks through Indigenous engagement in park management.

33
9. Literature cited
Absher, J. D., Graefe, A. R., & Olsen, M. H. (2018). Monitoring and Managing Carrying Capacity in Sasktchewan Provincial Parks. Report submitted to the Province of Saskatchewan, Ministry of Parks, Culture and Sport (March 213).
Ancin Murguzur, F. J., Munoz, L., Monz, C., & Hausner, V. H. (2019). Drones as a tool to monitor human impacts and vegetation changes in parks and protected areas. Remote Sensing in Ecology and Conservation, 6(1), 105–113.
BC Parks. (2019a). Joffre Lakes Provincial Park 2019 Visitor Use Management Action Plan. Retrieved from http://bcparks.ca/explore/parkpgs/joffre_lks/docs/6881-joffre-visitor-use-management-action-plan-report.pdf?v=1586649600135
BC Parks. (2019b, June 25). Safety measures implemented at Joffre Lakes Provincial Park. Retrieved from https://news.gov.bc.ca/releases/2019ENV0077-001310
BC Parks. (2020). Joffre Lakes Provincial Park Survey Results. Retrieved from http://bcparks.ca/explore/parkpgs/joffre_lks/docs/joffre-lakes-visitor-survey-results.pdf?v=1586649600135
Bellrichard, C. (2019, March 13). First Nations guardians gathering aims to grow movement and lobby for sustained funding. CBC News. Retrieved from https://www.cbc.ca/news/indigenous/first-nations-guardians-gathering-vancouver-1.5054981
Bender, Q. (2019, February 20). Conservation office launches new guardian role for Haida Gwaii. Haida Gwaii Observer. Retrieved from https://www.haidagwaiiobserver.com/news/conservation-office-launches-new-gaurdian-role-for-haida-gwaii
Ceballos-Lascuráin, H. (1996). Tourism, ecotourism, and protected areas: the state of nature-based tourism around the world and guidelines for its development. IUCN. Retrieved from https://portals.iucn.org/docs/library/html/Tourism/section20.html (Appendix X:Methodology for estimating protected area carrying capacity).
Cifuentes, M. (1992). Determination de capacidad de carga turistica en areas protegidas (Determination of the touristic carrying capacity in Protected Areas). Centro agronomico de investigacion y enseñanza catie, Turrialba, Costa Rica, pp. 23.
Clark, R. N., & Stankey, G. H. (1979). The recreation opportunity spectrum: a framework for planning, management, and research. General Technical Report PNW-98. Portland, OR: U.S. Department of Agriculture, Forest Service, Pacific Northwest Forest and Range Experiment Station.

34
Cole, D. N. (2004). Impacts of hiking and camping on soils and vegetation: A review. (pp. 41-60). Wallingford, UK: CABI Publishing. Cole, D. N., & Fichtler, R. K. (1983) Campsite impact in three western wilderness areas. Environmental Management, 7, 275–288. Dai, P., Zhang, S., Chen, Z., Gong, Y., & Hou, H. (2019). Perceptions of cultural ecosystem services in urban parks based on social network data. Sustainability, 11(19), 5386. County of Marin. (2019). Muir Woods Road Memorandum of Understanding Update County of Marine and National Park Service [Staff Report]. Retrieved from https://www.marincounty.org/-/media/files/maringov/board-actions/2019/december/191210dpwmuirwoodsltr.pdf?la=en
Corbau, C., Benedetto, G., Pietro Paolo Congiatu, Simeoni, U., & Carboni, D. (2019). Tourism analysis at Asinara Island (Italy): Carrying capacity and web evaluations in two pocket beaches. Ocean and Coastal Management, 169, 27–36.
Dai, P., Zhang, S., Chen, Z., Gong, Y., & Hou, H. (2019). Perceptions of Cultural Ecosystem Services in Urban Parks Based on Social Network Data. Sustainability, 11(19), 5386–15.
Environment Canada and Park Service. (1991). Selected Readings on the Visitor Activity Management Process (VAMP). Ottowa, Ontario: Environment Canada.
Farrier, D., & Adams, M. (2011). Indigenous – Government Co-Management of Protected Areas: Booderee National Park and the National Framework in Australia, in B. Lausche, Guidelines for Protected Area Legislation, pp 1-40 ‘Special Protected Area Types’ IUCN, Gland, Switzerland.
Fefer, J., Urioste-Stone, S. M. D., Daigle, J., & Silka, L. (2018). Understanding the perceived effectiveness of applying the visitor experience and resource protection framework for recreation planning: A multi-case study in U.S. national parks. The Qualitative Report, 23(7), 1561-1582.
Festarini, J., & Rodgers, J. (2020, February 21). An update from Parks Canada: Planning for the future [Blog post]. Retrieved from https://bpeg.ca/an-update-from-parks-canada-planning-for-the-future/
Frissell, S. S., Jr., & Stankey, G. H. (1972). Wilderness environmental quality: Search for social and ecological harmony. Paper presented at the Annual Meeting, Society of American Foresters, Hot Springs, Arkansas, October 4.
Gavin, M. C., McCarter, J., Berkes, F., Aroha Te, P. M., Sterling, E. J., Tang, R., & Turner, N. J. (2018). Effective biodiversity conservation requires dynamic, pluralistic, partnership-based approaches. Sustainability, 10(6), 1846.
35
Gonzalez, J. (2017, November 18). Visiting Muir Woods Will Require a Reservation in 2018. NBS. https://www.nbcbayarea.com/news/local/visiting-muir-woods-will-require-a-reservation-in-2018/38099/
Government of South Australia. (2020, March 17). Changes to access at Ikara-Flinders Ranges National Park. Government of Australia. Retrieved from https://www.environment.sa.gov.au/news-hub/news/articles/2020/03/chages-to-ikara-flinders-ranges
Graefe, A. R., Cahill, K., & Bacon, J. (2011). Putting visitor capacity in perspective: A response to the capacity work group. Journal of Park and Recreation Administration, 29(1), 21-37.
Guntenspergen, G.R., ed. (2014). Application of Threshold Concepts in Natural Resource Decision Making. New York: Springer.
Hamilton Conservation Authority. (2019). Strategic Plan 2019-2023. Retrieved from https://conservationhamilton.ca/wpcontent/uploads/sites/5/2018/12/HCA_StrategicPlan_Final_LR.pdf
Hamilton Conservation Authority. (2019). Getting to and from Webster Falls, Tew Falls and Dundas Peak. Retrieved from https://conservationhamilton.ca/wp-content/uploads/sites/5/2019/08/HCA_ShuttleService_Digital-Final.pdf
Hamilton Conservation Authority. (2017, May 8). Shuttle service launches May 13 at Spencer Gorge/Webster Falls Conservation Area [Press release]. Retrieved from https://hamiltonburlingtontrails.ca/wp-content/uploads/2017/05/Spencer-Gorge-Shuttle-Release.pdf
Hammitt, W.E., Cole, D. N., & Monz, C. A. (2015). Wildland recreation: Ecology and management. Hoboken: John Wiley & Sons, Incorporated.
IVUMC (Interagency Visitor Use Management Council). (2016). Visitor Use Management Framework: A guide to providing sustainable outdoor recreation. Denver, CO.
IVUMC (Interagency Visitor Use Management Council). (2019). Monitoring Guidebook: Evaluating effectiveness of visitor use management. Denver, CO.
Kent, J. (2020, May 10). Petroglyph vandalism problem persists. KRQE. Retrieved from https://www.krqe.com/news/crime/petroglyph-vandalism-problem-persists/
Kim, S.-O., & Shelby, B. O. (2005). Developing Standards for Trail Conditions Using Image Capture Technology. Leisure Sciences, 27(3), 279–295.

36
Kim, J., Thapa, B., Jang, S., & Yang, E. (2018). Seasonal Spatial Activity Patterns of Visitors with a Mobile Exercise Application at Seoraksan National Park, South Korea. Sustainability, 10(7), 2263–22.
Kohlhardt, R., Honey-Rosés, J., Lozada, S. F., Haider, W., & Stevens, M. (2017). Is this trail too crowded? A choice experiment to evaluate tradeoffs and preferences of park visitors in Garibaldi Park, British Columbia. Journal of Environmental Planning and Management, 61(1), 1–25. Lawson, S., Chamberlin, R., Choi, J., Swanson, B., Kiser, B., Newman, P. et al. (2011). Modeling the Effects of Shuttle Service on Transportation System Performance and Quality of Visitor Experience in Rocky Mountain National Park. Transportation Research Record: Journal of the Transportation Research Board, 2244(1), 97–106. Ly, T. P., & Nguyen, T. H. H. (2017). Application of carrying capacity management in Vietnamese national parks. Asia Pacific Journal of Tourism Research, 22(10), 1005–1020. Manning, R., Leung, Y.-F., & Budruk, M. (2005). Research to Support Management of Visitor Carrying Capacity of Boston Harbor Islands. Northeastern Naturalist, 12(sp3), 201–220. Manning, R. E., Valliere, W., Anderson, L., McCown, R. S., Pettengill, P., Reigner, N., . . . Riper, C. (2011). Defining, measuring, monitoring, and managing the sustainability of parks for outdoor recreation. Journal of Park and Recreation Administration, 29(3), 24-37. Manning, R.E., & L.E. Anderson. 2012. Managing Outdoor Recreation: Case Studies in the National Parks. Cambridge, MA: CABI. Manning, R. E. (2013). Social norms and reference points: integrating sociology and ecology. Environmental Conservation, 40(4), 310–317. Manning, R. E., Lawson, S., Newman, P., Hallo, J., & Monz, C. (2014). Principles of Sustainable Transportation in the National Parks. The George Wright Forum, 31(3), 345–358. Marion, J. L., & Leung, Y. F. (2001). Trail Resource Impacts and An Examination of Alternative Assessment Techniques. Journal of Park and Recreation Administration. 19, 17-37. Marion, J. L., & Leung, Y. F. (2004). Environmentally sustainable trail management. (pp. 229-243). Wallingford, UK: CABI Publishing.

37
McCool, S., Clark, R., & Stankey, G. (2007). An assessment of frameworks useful for public land recreation planning. Portland, OR: Pacific Northwest Research Station Meijles, E. W., de Bakker, M., Groote, P. D., & Barske, R. (2014). Analysing hiker movement patterns using GPS data: Implications for park management. Computers, Environment and Urban Systems, 47(C), 44–57. Monz, C., D'Antonio, A., Lawson, S., Barber, J., & Newman, P. (2016). The ecological implications of visitor transportation in parks and protected areas: Examples from research in US National Parks. Journal of Transport Geography, 51(C), 27–35. National Parks and Wildlife Service. (n.d.). Co-management of national parks with traditional owners. National Parks and Wildlife Service South Australia. Retrieved from https://www.parks.sa.gov.au/park-management/co-management-of-parks Navab-Tehrani, M., Tomlinson, C., & Morris, B. (2018). Sea to Sky: Outdoor recreation management. A report submitted to the BC ministry of Forests, Lands, Natural Resource Operations and Rural Development (March). Nelson, B., Taylor, V., & Nabti, J. (2008). Shifting Modes of Travel to National Parks: Pilot Study at Muir Woods National Monument, California. Transportation Research Record, 2077(1), 166–174. Nghi, T., Nguyen-Thanh, L., Nguyen-Dinh, T., Mai, D., & Thanh, D. (2007). Tourism carrying capacity assessment for Phong Nha - Ke Bang and Dong Hoi, Quang Binh Province. VNU Journal of Science, Earth Sciences. 23. Niezgoda, A., & Nowacki, M. (2020). Experiencing nature: Physical activity, beauty and tension in tatra national Park—Analysis of TripAdvisor reviews. Sustainability, 12(2), 601. NPS (National Park Service). (1997). VERP: The Visitor Experience and Resource Protection (VERP) Framework – A Handbook for Planners and Managers. Denver, CO. Denver Service Center. NPS (National Park Service). (2014). Golden Gate National Recreation Area and Muir Woods National Monument Final General Management Plan/Environmental Impact Statement Volume 1. Retrieved from https://parkplanning.nps.gov/document.cfm?parkID=303&projectID=15075&documentID=58777 NPS (National Park Service). (2017). Muir Woods National Monument sustainable access project. Retrieved from https://parkplanning.nps.gov/document.cfm?parkID=303&projectID=48923&documentID=80958

38
NPS (National Park Service). (2018). Petroglyph National Monument: Visitor Use Management Plan/Environmental Assessment. National Park Service. Retrieved from https://parkplanning.nps.gov/projectHome.cfm?projectID=66887. NPS (National Park Service). (2019). Delaware Water Gap NRA Draft Visitor Use Management Plan October 2019. National Park Service. Retrieved from https://parkplanning.nps.gov/document.cfm?parkID=220&projectID=55912&documentID=99017 Park, L., Manning, R., & Marion, J., Lawson, S., & Jacobi, C. (2008). Managing Visitor Impacts in Parks: A Multi-Method Study of the Effectiveness of Alternative Management Practices. Journal of Park and Recreation Administration, 26 (1), 97-121. Parks Canada. (2010). State of the Park Report 2010: Fathom Five National Marine Parks of Canada. Parks Canada. Retrieved from file:///Users/hyeonepark/Downloads/FF_SoPR2010_en.pdf Parks Canada. (2018, April 20). Blackfoot First Nations give traditional blessing at Waterton Lakes National Park and honour two Parks Canada’s team members with traditional names [Press release]. Retrieved from https://www.canada.ca/en/parks-canada/news/2018/04/blackfoot-first-nations-give-traditional-blessing-at-waterton-lakes-national-park-and-honour-two-parks-canadas-team-members-with-traditional-names.html Parks Canada. (2019a). Mapping Change: Fostering a Culture of Reconciliation within Parks Canada. Retrieved from https://www.pc.gc.ca/en/agence-agency/aa-ia/reconciliation Parks Canada. (2019b). 2019-20 Departmental Plan. Retrieved from https://www.pc.gc.ca/en/agence-agency/bib-lib/plans/dp/dp2019-20/is-si#responsibilities Parks Canada. (2019c). Gwaii Haanas National Park Reserve, National Marine Conservation Area Reserve, and Haida Heritage Site. Retrieved from https://www.pc.gc.ca/en/pn-np/bc/gwaiihaanas/culture/gardiens-watchmen Parks Canada. (2020). Business Partnerships in Fathom Five [PowerPoint slides]. Retrieved from https://www.pc.gc.ca/en/amnc-nmca/on/fathomfive/info/permis-license/reunion-meeting. Parks Canada (n.d.). Archaeology in a burned landscape: nature gives and nature takes away. Retrieved from https://www.pc.gc.ca/en/pn-np/ab/waterton/nature/environment/feu-fire/feu-fire-kenow/blogue-blog/arch-1
Peeker, S. (2019, August 19). Higher fines and shuttle bus relieve parking woes at Spencer Gorge. Flamborough Review. Retrieved from https://www.flamboroughreview.com/news-story/9555526-higher-fines-and-shuttle-bus-relieve-parking-woes-at-spencer-gorge/

39
Prakash, S. L., Perera, P., Newsome, D., Kusuminda, T., & Walker, O. (2019). Reasons for visitor dissatisfaction with wildlife tourism experiences at highly visited national parks in Sri Lanka. Journal of Outdoor Recreation and Tourism, 25, 102-112.
Queiroz, R. E., Ventura, M. A., & Silva, L. (2014). Plant diversity in hiking trails crossing Natura 2000 areas in the Azores: implications for tourism and nature conservation. Biodiversity and Conservation, 23(6), 1347–1365.
Reigner, N., Kiser, B., Lawson, S., & Manning, R. (2012). Using transportation to manage recreation carrying capacity. The George Wright Forum, 29(3), 322-337. Sayan, S., & Ortacesme, V. (2006). Recreational Carrying Capacity Assessment in a Turkish National Park. Proceedings of the Third International Conference on Monitoring and Management of Visitor Flows in Recreational and Protected Areas. University of Applied Sciences Rapperswil, Switzerland, 13-17 September 2006. Rapperswil. Sim, J., & Miller, P. (2019). Understanding an urban park through big data. International Journal of Environmental Research and Public Health, 16(20), 3816. Stankey, G., Cole, D., Lucas, R., Petersen, M., & Frissell, S. (1985). The Limits of Acceptable Change (LAC) System for Wilderness Planning. General Technical Report INT-176. Ogden, UT: USDA Forest Service, Intermountain Research Station. Stephanie, H., & Jameson, R. (2020, June 12). Indigenous-led conservation signals path forward for Canada's first marine protected area network. Canada’s National Observer. Retrieved from https://www.nationalobserver.com/2020/06/12/opinion/indigenous-led-conservation-signals-path-forward-canadas-first-marine-protected Stephenson, J., Berkes, F., Turner, N., & Dick, J. (2014). Biocultural conservation of marine ecosystems: Examples from New Zealand and Canada. Indian journal of traditional knowledge, 13, 257. Taggart-Barone, A. (2014, March 30). Muir Woods’ boardwalk empire expands. Parks Conservancy. Retrieved from https://www.parksconservancy.org/park-e-ventures-article/muir-woods%E2%80%99-boardwalk-empire-expands

40
Thomlinson, E., & Crouch, G. (2012). Aboriginal peoples, Parks Canada, and protected spaces: a case study in co-management at Gwaii Haanas National Park Reserve. Annals of Leisure Research, 15(1), 69–86. http://doi.org/10.1080/11745398.2012.670965 USFS (U.S. Forest Service). (1982). ROS Users Guide. U.S. Department of Agriculture, U.S. Forest Service, Washington, DC. Vala, J., & Redpath, M. (2020). Capacity Management in Regional Parks [PowerPoint slides]. Retrieved from http://www.metrovancouver.org/boards/Parks/PAR_2020-Jun-17_PPT.pdf Villalon, D. (2020, July 1). Pared-down Muir Woods experience means less visitors. KTVU FOX. Retrieved from https://www.ktvu.com/news/pared-down-muir-woods-experience-means-less-visitors. Wager, J. A. (1964). The carrying capacity of wild lands for recreation. In J. A. Wager (Ed.), Forest Science Monograph 7. Washington, DC: Society of American Foresters. Whittaker, D., Shelby, B., Manning, R., Cole, D., & Haas, G. (2011). Capacity reconsidered: Finding consensus and clarifying differences. Journal of Park and Recreation Administration, 29(1), 1-21.

41
Appendix 1. Methodologies for measuring and establishing environmental, social and managerial capacities
Appendix 1.1 Measuring and establishing Environmental capacity
Appendix 1.1.1 Measuring vegetation: Field survey
Vegetation cover
The most common vegetation indicator is vegetation cover. Vegetation cover is measured as a "percentage of the ground area covered by above ground plant part” (Hammitt et al., 2015) and is measured by placing a 1m2 quadrat on the ground and estimating the percentage of the quadrat area covered by vegetation. The loss of vegetation cover is identified by comparing the vegetation cover on a recreation site before and after recreational use or by comparing the vegetation cover on recreation sites and adjacent undisturbed (control) sites (Marion 1995). Existing studies have shown curvilinear relationships between amount of use and vegetation cover. In other words, vegetation loss on lightly used sites is nearly as substantial as that on heavily used sites. However, the vegetation loss can vary between vegetation types (Guntenspergen, 2014). Plant composition
A second common indicator is plant species composition. The cover of all individual species on a quadrat are measured and compared either before and after recreational use or between recreation sites and undisturbed control sites. Individual species can be grouped into classes of particular interest (e.g. rare, native, invasive) in order to examine the effects of recreation on the classes of interest (Hammitt, 2015).
Many studies have examined plant compositions on trails or at camp sites. Queiroz et al. (2014) established plots, at every 500 meters along the trails, perpendicular to the trail at 0, 10 and 20 meters. At each plot, they estimated the percentage of each vascular plant species of the total cover. They grouped the recorded species into biogeographic and conservation status categories (e.g. Indigenous species, self-sustainable introduce species, invasive species) and calculate Shannon’s diversity index (H). Queiroz et al. (2014) found that hiking trails provide habitat for plant species that are different from that of the core of the surrounding plant communities. The number of species decreased with the distance to the hiking trail margin. However, other factors such as surrounding human activities, presence of roads and altitude of trails influenced plant compositions more pronouncedly than trampling alone.

42
Tree condition
A third common indicator is tree condition. Field surveys usually records percentage, number (e.g., 10 trees) and density of trees (e.g., 10 trees/100 cubic meters) or the frequency of damage to trees such as root exposure, branch breakage or scarring (Hammitt, 2015).
Appendix 1.1.2 Measuring soil erosion: Field survey
Soil erosion is a common problem in parks. Soil erosion may occur due to trail construction and trail use. Similar to vegetation loss, very low levels of repeated use can cause erosion and the “per capita impact associated with increasing visitation” decreases significantly, especially where water runoff and tread widening are well controlled (Cole, 2004). In addition to the frequency of use, the use type (e.g., horses or motorized uses) and/or environmental conditions (e.g., steep trail slope, low density vegetation, wet season) can influence the magnitude of soil erosion (Marion and Leung, 2004).
Condition assessment method
There are two types of trail assessment methods. Condition assessment method (point sampling approach) records trail width, maximum incision of treads and tread conditions at a fixed interval along the trail. Trail tread conditions such as vegetation cover, organic litter, rock and/or exposed soil are evaluated as a proportion of a linear transect, which is placed perpendicular to the trail at each sample point (Marion and Leung, 2001). Condition assessments yield median or mean values of trail width and tread incision (Table 1.1).
Table 1.1 Example of summary results of trail condition assessments, using a point sampling method (Marion and Leung, 2001)
Condition assessments are useful for obtaining accurate measures of trail width and tread incision. It can be used for monitoring temporal trends for continuous trail characteristics (e.g., tread width or depth) and/or trail problems that are common or frequent (e.g., exposed soil)

43
(Marion and Leung, 2001). Assessment results can be used to establish standards based on a combination of median or mean and maximum conditions measured (Marion and Leung, 2001).
On the other hand, condition assessments may not be able to detect unacceptable conditions that are uncommon or infrequent along a trail corridor. To overcome the limitation, the point sampling interval (distance between sampling points) can be reduced, which may provide data similar to a problem assessment method. However, with a shorter sampling interval, more time and resources will be required.
Problem assessment method
A problem assessment method (census approach) records location, frequency of occurrence (#, #/meters) and lineal extent (meters, cumulative meters, % of segment) of problems that are predefined (e.g., excessive width) or infrequent (e.g., secondary treads). For example, a problem assessment in Great Smoky Mountains National Park revealed the most frequent and extensive form of trail degradation was soil erosion exceeding 0.3 meters in depth, which was recorded 55 times and affected 6.6% of the trail segment. Based on the results, a standard can be set as a X number of occurrences of soil erosion exceeding 0.3 meters in depth (Marion and Leung, 2001).
Problem assessment methods are a preferred approach for monitoring problems which can be easily predefined. Problem assessments can yield information on where and how much to allocate trail maintenance resources as they document all occurrences of predefined problems. However, actual trail width and depth of treads cannot be known through problem assessment methods. Impact problems (e.g., what is excessive tread width) and associated standards need to be predefined before the assessment (Marion and Leung, 2001).
Integrated assessment
An integrated assessment can be used to reduce limitations of problem assessment methods. Manning et al. (2005) employed both condition and problem assessment methods to assess the effects of recreation on soil and vegetation in the Boston Harbour Islands national park area. The researchers conducted an inventory of official and unofficial sites and trails with associated GPS coordinates and measured distance to water, distance to trail and vegetation canopy cover. They conducted a point sampling condition assessment by measuring trail width, tread incision depth and tread substrate composition at 60.6 meters interval for the entire length of each trail segment. They also conducted a problem assessment by documenting the frequency of occurrence, length of and proportion (%) of excessive soil erosion (incised more than 0.3 meters for a least 3 meters in length), root exposure and muddy soil in official trails. A rapid assessment for unofficial trails (length, density and overall condition rating) was conducted.

44
Table 1.2 Assessment results of unpaved official trails (Manning et al., 2005)
The integrated assessment revealed the current levels of biophysical conditions and impact problems in the Boston Harbour Islands. The integrated assessment first identified a total of 141 meters of unofficial trails within 50 meters of habitats of rare, threatened and endangered species. It revealed a range of density of unofficial trails (i.e. length of unofficial trail per hectare) in the park and areas close (i.e., within 50 meters) to sensitive habitats that have high densities of unofficial trails. Second, the assessment found the cumulative 372 meters of eroded trails, which accounted for 1.92% of total length of trails surveyed. Third, the assessment found that official recreational sites had 20-30% of bare soil area on the ground. Such assessment provided baseline data for the park and informed the park planning committee of the level at which a realistic standard of quality can be set.
Appendix 1.1.3 Alternative to field survey: Drones
Collecting field data can be time consuming. Recently, drones are increasingly being used for wildlife detection, vegetation mapping, land cover classification, or forest monitoring. Drones can provide high-quality data of site conditions and impacts while reducing time and money invested in data collection. By attaching hyperspectral cameras, drones can provide information on nutrient status in the plants, biomass or invasive species (Murguzur et al., 2019).
Murguzur et al. (2019) assessed the accuracy and reliability of drone data for monitoring human impacts and vegetation change in a protected area in Norway. They obtained geo-referenced, high resolution ground images (i.e., 5 mm/pixel), using a DJI Phantom 3 Standard drone (www.dji.com). They set the flight mission (e.g., flying speed) through the PrecisionFlight app (www.precisionhawk.com) and flew the drone five times along each trail section to assess the measurement variability. Drone images were processed using WebODM (www.opendronemap.org), a free open source photogrammetric software.
Drone images effectively provided information on the trail width and the tread incision in medium-sized areas that were comparable to the field data and that drone images could be used to classify vegetation types and identify bare soil (Fig. 1.1). However, drone flying may be strictly regulated in protected areas and requires dry weather conditions (Murguzur et al., 2019).

45
Figure 1.1 Example of classification on the drone-based orthophoto that allows identifying bare soil against other lad cover types (Murguzur et al., 2019) Appendix 1.1.4 Establishing standards for environmental capacity: field survey and visual image
method
Field survey
Difficulty in determining CC lies in deciding how much impact is acceptable. The natural range of variation (NRV) of ecosystem qualities may inform decisions on standards for a park or a specific location of a park. NRV is a concept that assumes a range of natural variation exists and that there is a point beyond which an ecosystem will irreversibly shift to a different state.
NVR can be determined through field survey. For example, Cole and Fichtler (1983) conducted an inventory of plant compositions and used Sorensen’s similarity indices to calculate the dissimilarity in terms of the presence and relative abundance of individual species among different locations in a park. They detected approximately 25% of variation in plant communities even on between undisturbed sites (Hammitt, 2015).
In recreation settings, it is possible to establish realistic standards even though the standards are outside NRV. In some cases, desired conditions can substantially differ from NRV. They can be difficult to maintain without significant, direct management actions. Or, current conditions may be substantially beyond NRV. For example, a park planning committee of Boston Harbour Islands determined that the 20% of bare soil area as the standard based on the field survey result showing 20-30% of mineral soil exposure on the camp grounds and the fact that only a minority of sites would exceed the standard and require substantial management actions (Manning et al., 2005).

46
Visual image method
Visual image methods can be used to identify social norms on biophysical conditions. Kim and Shelby (2005) illustrate an overall photo evaluation method and two specific evaluation methods that were used to identify the social norms of trail conditions in a provincial park, South Korea. With the overall photo evaluation method, park visitors were shown a series of photographs representing different proportions of bare soil area occupied in the size of photograph (e.g., 2%, 5%, 10%, 15%, 20%, 25%, 30%, 35%, 40% and 50% of bare soil) and rated the acceptability of bare soil area on a trail in the photographs on a 9-point scale (Fig. 1.2). For the first specific evaluation method (SPEM-1), visitors selected a photograph that depicts the maximum amount of bare ground they would accept. For the second specific evaluation method (SPEM-2), the visitors were shown three photographs representing 10%, 20% and 30% of bare soil area and specified the maximum acceptable bare soils of a trail based in an open-ended survey questionnaire.
Figure 1.2 Sample photographs depicting bare soil area (Kim and Shelby, 2005) Kim and Shelby (2005) found there were some variations of bare soils that visitors would accept and recommended that bare soils on trails be maintained at a range of 10%–15% (Fig. 1.3) The authors noted that visitors may not be adequately aware of ecological implications of such conditions and decision-making of biophysical standards could involve different stakeholder groups and use multi-stakeholder normative inputs.

47
Figure 1.3 Overall evaluation curves and specific evaluation standards Appendix 1.2 Measuring and establishing social capacity
Appendix 1.2.1 Crowding and maximum visitor number through visual image method
Crowding concerns “what level of perceived crowding should be allowed before management intervention in needed?” (Manning et al., 2005). Manning et al. (2005) examined park visitors’ sense of crowding and estimated the maximum number of people-at-one-time (PAOT) acceptable in Boston Harbour Islands. Their first survey identified degrees to which a series of issues were problems at the park as a potential indicator of quality of visitor experience. The survey yielded the seven important indicators of social capacity: number of PAOT at selected attraction sites, number of groups encountered per hour while hiking, environmental impacts to trails and at a campsite (bare soil), amount of litter, amount of graffiti, and amount and quality of information about the park.
Using these indicators, the second survey identified a range of potential standards of quality by incorporating a traditional numeral approach and a visual method. The traditional numerical approach was used to measure the acceptability of alternative use levels such as zero, five, or ten encounters with other groups per day long trails on a 9-point scale from -4 (very unacceptable) to +4 (very unacceptable). Visitors also rated the acceptability of a series of five computer-edited photographs showing a range of the indicators such as PAOT and exposed bare soil at a camp site. Participants selected the photos that best represent: 1) the PAOT they preferred (best standard of quality), 2) the PAOT that was so unacceptable that they would no longer visit the island (“displacement”-based standard of quality), 3) maximum PAOT condition that they thought the park manager should allow before restricting visitor use (“management action”-based standard of quality) and 4) the PAOT they experienced on the day of their visit (“existing conditions”).

48
After completion, a series of planning workshops were held to formulate indicators and standards of quality after objectives were established (e.g. visitor solitude). For a zone emphasizing solitude, for example, a standard quality near the preference was selected, while for the visitor services and park facilities zone, a standard of the management action or displacement was selected. Appendix 1.2.2 Temporal-spatial patterns of park use via GPS-tracking methods
Understanding of seasonal-spatial patterns of visitors’ activities is critical for effectively managing crowding in parks. GPS-based tracking methods have enabled researchers and practitioners to understand the temporal-spatial dimensions of visitors’ behaviour. GPS-logger
Meijles et al. (2014) estimated visitor densities and distribution patterns within a national park in the Netherlands. During four public holiday and weekend days in May 2010, the authors randomly recruited visitors at three parking lots who were willing to take a GPS logger while they were hiking in the park. The GPS tracks of 138 visitors were logged on a ten-second interval. On their return to the car park, visitors completed an anonymous questionnaire to obtain information including group composition, motivations for their visit and the route chosen. Their survey responses were linked to the GPS data logs. The GPS points were mapped and counted points per 100 meters of a path segment to calculate visitor density. The map visualized visitor density patterns across the park and was used to enable visual connections to environmental factors and facilities. Three underlying variables were analyzed for their associations to the visitor density: visitors (e.g., motivation and group composition), walking behaviour (e.g., walking pace, total walking distance, trip time and off-path behaviour) and environmental factors (e.g., distance to paths, facilities etc.). Meijles et al. (2014) showed that respondents tended to stay relatively near to the parking lots. The signposted paths had relatively higher visitor density than unmarked trails, which indicated that respondents preferred marked trails. This study suggested that visitor behaviour can be changed by providing visitors with information on the trail and sensitivity of wildlife to disturbance. The authors also noted that depending on the number of devices available, the GPS-logger method can only analyse spatial patterns of a small sample size of people for a short period of time.
GPS-based outdoor exercise mobile application
By using a mobile exercise application, spatial patterns of visitor activities can be recorded for a longer period of time with a large sample size. With this approach, Kim et al. (2018) analyzed the spatial patterns of activity points such as hot spots and activity boundaries across seasons and days (weekdays/weekends) for a year of time in a national park, South Korea. The authors used a depersonalized GPS-based mobile application “Tranggle” whose dataset keeps anonymity of the application users (https://www.tranggle.com). The database provides information on types and time of activities and the GPS coordinates of the locations in which an

49
activity occurs. Kim et al. (2018) extracted the starting and ending points for each activity that occurred within the park from the database. The final sample consisted of 1,206 participants, 2639 activities, and 5142 starting and ending points, spanning a year of time. Such GPS-based mobile applications could capture seasonal and spatial variability of visitor activities in a park for a long period of time with a larger sample size. They can also be used for controlling crowding in the identified congested or hazard areas during fire season, heavy rains or heavy snow fall. Parks may provide visitors with information on the seasonal hot spots, hazard areas and the locations of potential crowding. Strava (www.strava.com) is a mobile exercise application used in the U.S. and Canada. Appendix 1.3 Integrating environmental, social, managerial and/or cultural capacities
Appendix 1.3.1 Physical carrying capacity, real carrying capacity and effective carrying capacity
The Cifuentes method was developed by Cifuentes (1992) to estimate tourism carrying capacity in protected areas, which is intended to integrate natural, social and economic aspects of a site. The method was introduced in international guidelines such as the International Union for Conservation of Nature (IUCN) guidelines for tourism in protected areas (Ceballos-Lascuráin, 1996; Eagles et al., 2002) and the World Tourism Organisation guideline for sustainable tourism for local authorities (WTO, 1998) and has been widely applied in tourism studies of protected areas (e.g., Corbau et al., 2019; Nghi et al., 2007; Sayan and Ortaçe, 2006). The Cifuentes method estimates the number of visitors that a site can accommodate in a defined time period given the environmental, biophysical characteristics of an ecosystem, social factors and management policies. By using the Cifuentes method, Corbau et al. (2019) estimated three carrying capacities— physical carrying capacity, real carrying capacity and effective carrying capacity — for two pockets beaches Asinara Island in Italy. The example of Cala dei Ponsezi beach is used to illustrate the Cifuentes method and each capacity in the report. Physical carrying capacity (PCC)
PCC is defined as the maximum number of tourists who can physically fit into a specific area over a determined period. The PCC is determined using the following equation:
PCC = A/Au × Rf
Where: PCC = Physical carrying capacity; A=Available area for tourist use; Au = Area required per tourist; Rf = Rotation factor corresponding to the number of visits per day. The available area (A) may be limited by physical factors and by limitations due to security reasons or weakness of the ecosystem. Corbau et al. (2019) calculated the total area of Cala dei Ponsezi beach based on an aerial photo of 2008 and images of Google Earth (2016). They also mapped paths and parking lots. The area required per tourist (Au) was decided at 4, 6 and 8 m2,

50
which were used to estimate a range of PCC. The rotation factor (Rf) corresponds to the daily number of visits and was determined using the following equation:
Rf = Daily open period/Average time of visit or occupancy of the beach A first Rf was determined at 4 (8 hours of daily open hours/2 hours of average time of visit). Considering the path to reach the beach, a second Rf was determined at approx. 3 (8 hours of daily open hours/3 hours of average time of visit). As a result, two Rf (4 and 3) were used to estimate the PCC. The PCC calculated ranged from 343 to 916 visitors/day (41,907–111,752 visitors per season from June to September). The minimum capacity, calculated with the Au of 4 (area of 4 m2 per visitor) and the Rf of 4 (2 hours of visit) represents a crowded, less tranquil scenario. A range of Au and Rf may be determined to consider different scenarios of visitor experience quality. Real carrying capacity (RCC)
RCC is the maximum permissible number of tourists, once the corrective factors (Cf) derived from the particular characteristics of the site have been applied to the PCC. The RCC is determined using the following equation:
RCC = PCC × (Cf1 × Cf2 × Cf3 × ...Cfn) Cf concerns biophysical, environmental, ecological, social and managerial characteristics of parks. Corbau et al. (2019) used disturbance to the flora and fauna, human waste, rainfall, wind and presence of animal feces and jellyfish as corrective factors. The corrective factors were calculated using the following formula:
Cfx = 1 − Lmx/Tmx Where: Cfx = Corrective factors of variable x; Lmx = Limiting magnitude of variable x; Tmx = Total magnitude of variable x. For disturbance to the flora and fauna, the authors first estimated a proportion of an area in which both endemic species and tourists are present to the total beach area, which was 5% of the beach area. Subsequently, the disturbance (to the flora and fauna) factor was determined at 0.95 (1-(5/100). Rainfall was the most important corrective factor for the beach because it largely influences the swimming/seaside activities. A rain time series of 10 years (2006–2016) recorded at a local weather station was used to estimate the mean number of rainy days during the summer period (from June to September). The mean number was 8 days during the summer period (122 days), and subsequently the rainfall factor was determined at 0.9344 (1 - (8/122)). Other corrective factor measurements are illustrated in the study of Corbau et al. (2019).

51
By using the formula RCC = PCC × (Cf1 × Cf2 × Cf3 × ...Cfn), the RCC at Cala dei Posenzi decreased to a minimum of 240 visitors per day (29,240 visitors per season) with a Rf of 3 and an Au of 8 to a maximum of 639 visitors per day (77,974 visitors per season) with the Rf of 4 and the Au of 4. Effective carrying capacity (ECC)
ECC is the maximum permissible or sustainable number of visitors of visitors that a site can sustain, given the RCC and management capacity (MC) available. The ECC is determined using the following equation:
ECC = RCC × MC MC is the sum of conditions required in order for the administration to carry out its functions and objectives. Measuring MC can be complex since many MC variables can be subjective. Corbau et al. (2019) first identified and discussed important MC factors with the park authority (Table 1.3): available staff, infrastructures and the equipment for visitor care, surveillance and security of the visitors and flora protection. Then, the authors rated the optimum management capacity (as score = 1) and the actual situation (score from 0 to 1), summed the optimum capacity scores (of 8) and the summed actual situation scores (of 3.5) and then calculated the MC index of 0.43 (8/3.5). The (final) ECC ranged from a minimum of 103 visitors by day (12,573 visitors per season) with the Rf of 3 and the Au of 8 to a maximum of 275 visitors by day (33,529 visitors per season) with the Rf of 4 and the Au of 4. Table 1.3 Matrix for the correction factors (Corbau et al., 2019)
Setting an upper and a lower limit of CC maybe more useful than estimating a fixed single value. For example, Metro Vancouver may select a range of Au and Rf to consider different zones, scenarios or seasons (off-season, peak-season, weekend, COVID-19, etc.) rather than use one single value for Au and Rf. These values should be monitored against and adjusted if necessary.

52
Appendix 1.3.2 Discrete choice experiment survey
A choice experiment survey enables to explore people’s perceptions or predict people’s responses to potential future situations by asking respondents to make choices among alternative scenarios or “configurations of a multi-attribute good” (Lawson and Manning, 2003). Since all respondents are exposed to the same scenarios and attributes, this method allows for controlled analysis in which how respondents’ backgrounds (e.g. cultural, recreational, level of familiarity with an area) influence their preferences for a set of attributes determined can be identified (Kohlhardt et al., 2017). Scenarios are formulated with a series of attributes reflecting diverse hypothetical social, biophysical and managerial conditions within the park under study. These scenarios can be communicated in visual images with/without texts. Kohlhardt et al. (2017) conducted a dichotomous choice experiment with manipulated photographs to identify tradeoff that people are willing to make for their outdoor experience in Garibaldi Provincial Park. Eight attributes were chosen for creating scenarios: viewpoint crowding (social), trail crowding (social), trail conditions (resource or ecological), day use fees (managerial), quality of the view and driving distance (willingness of Park visitors to displace to other locations). Each attribute had four levels except for viewpoint conditions which has either “destination worthy” or “non-worthy.”
Figure 1.4 Choice set example. Garibaldi Park visitors asked: "Which trail would you choose?" (Kohlhardt et al., 2017) From 1 August 2014 to 20 September 2014, Kohlhardt et al. (2017) conducted survey where park visitors were asked to imagine they were searching for hiking options for an upcoming weekend and shown a combination of pictures and information that depict two hypothetical hikes in the Sea to Sky Corridor of BC (Fig. 1.4). Visitors selected the recreational experience (or the preferred pictures) that most appealed to them. The survey also asked basic questions about visitors’ familiarity with the park, demographics, level of expertise as outdoor recreationalists and motivations for visiting Garibaldi Park, ranging from nature- based motivations to social-based motivations. The authors used latent analysis to analyses people’s

53
choices at different subgroups of motivations, level of expertise and visitor’s familiars with the park. The survey results reiterated that crowding (at viewpoint and trail) has a larger influence on visitor satisfaction in Garibaldi Park than other undesirable attributes such as day use fees, eroded trail conditions, or non-worthy viewpoint destinations. Even natural trails with no erosion and worthy viewpoint destinations were not by themselves sufficient to compensate visitor’s dissatisfaction caused by crowding. The study also found that visitors were even more sensitive to crowding at the viewpoint than on the trails. Based on such findings, the authors suggest that park managers monitor and manage viewpoint crowding more carefully than trail crowding and arrange different destinations to disperse crowds across sites for viewing, resting, photography, or interpretive material. The study also found heterogeneity of preferences for the park conditions among three identified visitor groups. The first group (“outdoor tourist”) had a relatively intermediate level of outdoor recreation experience. They cared the most about the quality of viewpoint and was sensitive to crowding at viewpoints and on trails while willing to pay the day use fees for the quality of experience at viewpoints. The second group (“casual recreationalist”) had the least experience with hiking and maybe a beginner group of outdoor recreationalists. This group was strongly sensitive to the day use fees and more concerned with their trail experience such as crowing, trail condition and trail landscapes. The third group (“experienced, freedom-seeking outdoors-person”) had the most hiking experience and preferred natural, single-track trails while showing a strong aversion to eroded trails. Like the “casual recreationalist”, this group rejected the idea of paying the day use fees to visit Garibaldi Park while they cared less about driving distance. In summary, more than a 50% of the study participants did not support day use fees. Based on such observations, the authors suggested that even if a park may be very popular, the implementation of user fees may displace visitors to other free options and not generate large revenues for park maintenance. Appendix 2.3.3 Modeling for shuttle services
Lawson et al. (2011) evaluated transportation system performance and visitor crowding resulting from personal auto and shuttle service in the Bear Lake Road corridor at Rocky Mountain National Park. They developed a traffic model to generate personal vehicle and transit-based visitor arrival schedules (or the estimated number of visitor arrivals by mode of transportation and time of day) to two popular destinations in the corridor by using PARAMICS microscopic traffic simulation software (Fig. 1.5). They also developed visitor models based on crowding thresholds that were identified through visitor survey: maximum number of people at one time (PAOT) at two attraction sites and maximum persons per viewscape (PPV) on a 50-m section of two trails that visitors would consider to be acceptable. Then, the visitor arrival schedules were simulated with the visitor models to estimate the extent of crowding on the

54
trails and at the attractions resulting from existing and alternative shuttle service scenarios during summer 2008.
Figure 1.5 Visitors present at one of the trailheads, by time of day and transportation mode of arrival The study found that one popular destination could only sustain the existing number of visitors who used personal vehicles meanwhile 100% of shuttle riders may need to be displaced to other destinations. Alternatively, if 25% of visitors who travel in their personal vehicle use the park’s shuttle, this shift would reduce vehicle miles traveled in the park and associated greenhouse gas emissions and be the most cost-effective with respect to shuttle service operating costs per passenger. The mode shift scenarios may have mixed effects on parking capacity. For example, increase in the use of shuttle services could reduce parking pressure at the Bear Lake and Glacier Gorge trailheads but increase demand at the Bear Lake park-and-ride lot and may cause onboard crowding as the number of visitors waiting at the park-and-ride lot to board shuttle buses increases, which is already heavily used under the existing conditions. This suggests the parking capacity be expanded at the Bear Lake park-and-ride lot if the Park aims to shift 25% of vehicle use to the shuttle.