The Empirical Correlation Using Linear Regression of Compression Index for Surabaya Soft Soil
Upload
khangminh22Category
view
0download
0
Linear Regression ModelsW4315
Instructor: Dr. Frank Wood
Required Text: Applied Linear RegressionAuthors: Kutner, Nachtsheim, Neter

Not Registered Yet?
Fill out the form athttp://tinyurl.com/mqfq95
Additional books we will draw material from in this course:
I Pattern Recognition and Machine Learning, by Christopher M.Bishop. Springer, 2006.
I Bayesian Data Analysis, Second Edition, by Andrew Gelman,John B. Carlin, Hal S. Stern, and Donald B. Rubin, Chapman& Hall/CRC Texts in Statistical Science

Course Description
Theory and practice of regression analysis, Simple and multipleregression, including testing, estimation, and confidenceprocedures, modeling, regression diagnostics and plots, polynomialregression, colinearity and confounding, model selection, geometryof least squares. Extensive use of the computer to analyze data.
Course website http://bit.ly/9QoeyL
or http://www.stat.columbia.edu/∼fwood/w4315/

Philosophy and Style
I Easy first half.
I Very hard second half.
I Frequent, long digressions from the required book.
I Understanding == proof (derivation) plus implementation.
I Practice makes perfect.
I Frequentist and Bayesian perspectives taught.
If you are looking for a pure applied, pure frequentist treatment ofregression as a diagnostic tool and/or you’ve never programmedbefore, seek another section.
Available sections
I MW 9:10-10:25am, 702 Hamilton Hall (Lindquist)
I MW 6:10-7:25pm, 209 Havemeyer Hall (Yang)

Goals
I Deep theoretical understandingI Book provides only recipesI Much detail missingI Can always look up recipes in future
I Ability to implement/code all regression functionalityI Different levels of understandingI Not enough to simply be able to apply formula and use
pre-built regression software

Fair warning:
I am not perfect in attaining my goals...

Feedback from prior years
Frank was often better at relaying the information whenhe cared about the material. For example, the sectionson Bayesian Statistics were explained more clearly andthoroughly than the earlier sections. Frank answeredquestions well in person, but rarely responded to emails.
Prof. Wood is clearly a brilliant, fascinating individual.Everyone in the class, I think, likes him on a personallevel and his teaching style. However, overall, this coursewas a waste of $4,000. I paid money for an appliedcourse in linear regression models. Instead, basically, thecourse was taught from a theoretical standpoint.

Feedback from prior years
Frank definitely knows what he’s doing; the material cansometimes be a little rough and it’s not always clear whathis motivations are in trying to explain some topics, but Iwouldn’t want to take this class with any other professor.
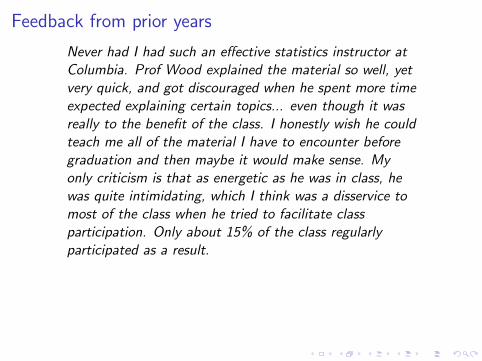
Feedback from prior years
Never had I had such an effective statistics instructor atColumbia. Prof Wood explained the material so well, yetvery quick, and got discouraged when he spent more timeexpected explaining certain topics... even though it wasreally to the benefit of the class. I honestly wish he couldteach me all of the material I have to encounter beforegraduation and then maybe it would make sense. Myonly criticism is that as energetic as he was in class, hewas quite intimidating, which I think was a disservice tomost of the class when he tried to facilitate classparticipation. Only about 15% of the class regularlyparticipated as a result.

About me
I Computer Science PhD, 2007, Brown University
I Postdoc in Machine Learning, Gatsby Unit, University CollegeLondon
I Sports gambling consulting.
I Former entrepreneur.
My research
I Inference for nonparametric Bayesian models.
I Compression.
I Natural language data modeling.
My website: http://www.stat.columbia.edu/∼fwood

Course Outline
First half of the course is on the traditional view of linearregression. The first half of the first half is a formal, theoreticalreview of single variable regression and its classical, frequentisttreatment.
I Roughly 1 chapter per weekI 3-5 weeks, linear regression
I Least squaresI Maximum likelihood, normal modelI Tests / inferencesI ANOVAI DiagnosticsI Remedial MeasuresI Linear algebra reviewI Matrix approach to linear regression

Course Outline Continued
The second half of the first half covers multiple regression and thevarious topics that arise from including multiple predictor variablesinto models.
I 3-4 weeks multiple regressionI Multiple predictor variablesI DiagnosticsI Tests
Midterm

Course Outline Continued
The remainder of the course will deviate from the book and maybe ordered differently than what is shown here. In general we willretain a focus on models that are linear in the parameters, but willlook at nonlinear models and Bayesian treatments of linear models.
I 3-4 weeks on Bayesian regressionI MCMCI Bayesian linear regressionI Gaussian process regressionI Projects
I 3-4 weeks on generalized regressionI Polynomial regressionI Logistic regressionI Neural networksI Generalized linear models

Requirements
I CalculusI Derivatives, gradients, convexity
I Linear algebraI Matrix notation, inversion, eigenvectors, eigenvalues, rank,
quadratic forms
I ProbabilityI Random variablesI Bayes Rule
I StatisticsI Expectation, varianceI EstimationI Bias/VarianceI Basic probability distributions
I Programming

Projects (homework and final)
I Software
I For homework – Matlab.I For final project, don’t care:
I RI MatlabI S-PlusI SASI MinitabI ExcelI java, c++, c, assembly, . . .

Grading
I Bi-weekly homework (35%)I Due every other week
I no late homework accepted
I None allowed to be missingI No homeworks due during final project preparation period.
I Participation (5%) (up a half grade if I know you by the end,down a half grade if not)
I Midterm examination (25%)
I Final project (35%)
I Curve

Office Hours / Website
I http : //www .stat.columbia.edu/ ∼ fwood
I Office hours : TBA
I Office : Room 1017I TA : Wei Wang
I TA office hours TBDI Email: [email protected] Office: 901 SSW

Why regression?
I Want to model a functional relationship between an“predictor variable” (input, independent variable, etc.) and a“response variable” (output, dependent variable, etc.)
I Examples?
I But real world is noisy, no f = maI Observation noiseI Process noise
I Two distinct goalsI Tests about natural of relationship between predictor variables
and response variablesI Prediction

History
I Sir Francis Galton, 19th centuryI Studied the relation between heights of parents and children
and noted that the children “regressed” to the populationmean
I “Regression” stuck as the term to describe statistical relationsbetween variables

Example Applications
Trend lines, eg. Google over 6 mo.

Others
I EpidemiologyI Relating lifespan to obesity, smoking habits, and/or other
patient features.
I Science and engineeringI Relating physical inputs to physical outputs in complex systems
I Grander

Aims for the course
I Given something you would like to predict and some numberof covariates
I What kind of model should you use?I Which variables should you include?I Which transformations of variables and interaction terms
should you use?
I Given a model and some dataI How do you fit the model to the data?I How do you express confidence in the values of the model
parameters?I How do you regularize the model to avoid over-fitting and
other related issues?
I Not be boring
Copyright © 2022 FDOKUMEN