
Local linear spatial quantile regression
29
Local Linear Spatial Quantile Regression Marc Hallin *† , Zudi Lu ‡ , and Keming Yu § Universit´ e Libre de Bruxelles, Curtin University of Technology, Perth, and Brunel University. Abstract Let {(Y i , X i ), i ∈ Z N } be a stationary real-valued (d +1)-dimensional spatial processes. Denote by x 7→ q p (x), p ∈ (0, 1), x ∈ R d , the spatial quantile regres- sion function of order p, characterized by P{Y i ≤ q p (x)|X i = x} = p. Assume that the process has been observed over an N -dimensional rectangular domain of the form I n := {i =(i 1 ,...,i N ) ∈ Z N |1 ≤ i k ≤ n k ,k =1,...,N }, with n =(n 1 ,...,n N ) ∈ Z N . We propose a local linear estimator of q p extending to random fields with unspecified and possibly highly complex spatial dependence structure the quantile regression methods considered in the context of indepen- dent samples or time series. Under mild regularity assumptions, we obtain a Bahadur representation for the estimators of q p and its first order derivatives, from which we establish consistency and asymptotic normality. The spatial process is assumed to satisfy general mixing conditions, generalizing classical time-series mixing concepts. The size of the rectangular domain I n is allowed to tend to infinity at different rates depending on the direction in Z N (non- isotropic asymptotics). The method provides much richer information than the mean regression approach considered in most spatial modelling techniques. AMS 1980 subject classification : Primary 62G05; secondary 60J25, 62J02. Key words and phrases : Random fields, Quantile regression, Bahadur represen- tation, Local linear estimation. 1 Introduction Since the pathbreaking paper by Koenker and Basset [29], quantile regression and autoregression methods have attracted considerable interest, basically in all do- mains of statistics, ranging from time series to survival analysis and growth charts: * Institut de Recherche en Statistique, E.C.A.R.E.S., and D´ epartement de Math´ ematique, Uni- versit´ e Libre de Bruxelles, Brussels, Belgium; also member of ECORE, the recently created associ- ation between CORE and ECARES. † Royal Academy of Belgium. ‡ Department of Mathematics and Statistics, Curtin University of Technology, Perth, Australia § Department of Mathematical Sciences, Brunel University, Uxbridge, West London, U.K. 1
-
Upload
independent -
Category
Documents
-
view
3 -
download
0
Transcript of Local linear spatial quantile regression
Local Linear Spatial Quantile Regression
Marc Hallin∗†, Zudi Lu‡, and Keming Yu§
Universite Libre de Bruxelles, Curtin University of Technology, Perth,and Brunel University.
Abstract
Let (Yi,Xi), i ∈ ZN be a stationary real-valued (d+1)-dimensional spatialprocesses. Denote by x 7→ qp(x), p ∈ (0, 1), x ∈ Rd, the spatial quantile regres-sion function of order p, characterized by PYi ≤ qp(x)|Xi = x = p. Assumethat the process has been observed over an N -dimensional rectangular domainof the form In := i = (i1, . . . , iN ) ∈ ZN |1 ≤ ik ≤ nk, k = 1, . . . , N, withn = (n1, . . . , nN ) ∈ ZN . We propose a local linear estimator of qp extending torandom fields with unspecified and possibly highly complex spatial dependencestructure the quantile regression methods considered in the context of indepen-dent samples or time series. Under mild regularity assumptions, we obtain aBahadur representation for the estimators of qp and its first order derivatives,from which we establish consistency and asymptotic normality. The spatialprocess is assumed to satisfy general mixing conditions, generalizing classicaltime-series mixing concepts. The size of the rectangular domain In is allowedto tend to infinity at different rates depending on the direction in ZN (non-isotropic asymptotics). The method provides much richer information than themean regression approach considered in most spatial modelling techniques.
AMS 1980 subject classification : Primary 62G05; secondary 60J25, 62J02.Key words and phrases : Random fields, Quantile regression, Bahadur represen-
tation, Local linear estimation.
1 Introduction
Since the pathbreaking paper by Koenker and Basset [29], quantile regression andautoregression methods have attracted considerable interest, basically in all do-mains of statistics, ranging from time series to survival analysis and growth charts:
∗Institut de Recherche en Statistique, E.C.A.R.E.S., and Departement de Mathematique, Uni-versite Libre de Bruxelles, Brussels, Belgium; also member of ECORE, the recently created associ-ation between CORE and ECARES.
†Royal Academy of Belgium.‡Department of Mathematics and Statistics, Curtin University of Technology, Perth, Australia§Department of Mathematical Sciences, Brunel University, Uxbridge, West London, U.K.
1

see [28] for a review. Most surprisingly, they seldom have been considered in a spa-tial context, although their potential applications to spatial data clearly are withoutnumber. Very recently, Koenker and Mizera [30] made a first step towards a spatialquantile-based analysis by proposing, under the name of penalized triograms, a pe-nalized spline method based on adaptively selected triangulations of the plane whichallows for computing conditional quantiles over a two-dimensional domain. Theirmethod however does not incorporate covariates, and hence is a spatial smoothingtechnique rather than a spatial (auto)regression one.
Let ZN , N ≥ 1, denote the integer lattice points in the N -dimensional Euclideanspace. A point i = (i1, . . . , iN ) in ZN will be referred to as a site, but also mayinclude a time component. Spatial data are modelled as finite realizations of vectorstochastic processes indexed by i ∈ ZN , also called random fields. In this paper, wewill consider strictly stationary (d + 1)-dimensional real random fields, of the form
(Yi,Xi) ; i ∈ ZN
, (1.1)
where Yi, with values in R, and Xi, with values in Rd, are defined over some prob-ability space (Ω,F ,P). Such spatial data arise in a variety of fields, includingeconometrics, environmental sciences, image analysis, oceanography, geostatistics,and many others. The statistical treatment of such data is the subject of an abun-dant literature, which cannot be reviewed here; for background reading, we referthe reader to the monographs by [2], [11], [21], [42], or [43].
In a number of applications, a crucial problem consists in describing and ana-lyzing the influence of a vector Xi of covariates on some real-valued response Yi.In the spatial context, this study is particularly difficult, due to the possibly highlycomplex spatial dependence among the various sites—a dependence that typicallyhas to be treated as a nuisance. The traditional approach to this problem consists inassuming that Yi has finite expectation, so that the spatial mean regression functiong : x 7→ g(x) := E[Yi
∣∣Xi = x] is well defined and clearly carries relevant informationon the dependence of Y on X. This approach has been successfully considered inseveral papers, among which [24] or [19]. However, (conditional) expectations maynot exist. And, even when they do, they only carry a limited information on thedependence under study. In most practical cases, we would expect different struc-tural relationships for the higher (lower) order quantiles than for the central ones,and the conditional distribution of Y (asymmetry, spread, ...) is likely to depend onX as well. A regression analysis based on conditional means ignores such essentialfeatures of the dependence of Y on X, which can be taken care of by Koenker andBassett’s more general conditional quantile analysis only.
In this paper, instead of spatial mean regression, we thus consider the spa-tial quantile regression functions qp : x 7→ qp(x), 0 < p < 1, characterized byPYi ≤ qp(x)|Xi = x = p. Although qp (just as g) is only defined up to a P-nullset of x values, we treat it, for the sake of simplicity, as a well-defined real-valuedx-measurable function, which has no implication on the probabilistic statements of
2

this paper. In the particular case under which Xi itself is measurable with respectto a subset of Yj’s, with j ranging over some neighborhood of i, qp is called a spatialquantile autoregression function. Parametric (linear) spatial mean autoregressionmodels were considered as early as 1954 by [51]; see [52], or [3] for further develop-ments in this approach. Contrary to [51], we adopt a nonparametric point of view,as in [24], avoiding any parametric specification, both for qp as for the possiblyextremely complex spatial dependence structure of the data.
For N = 1, our problem reduces to the classical one of quantile (auto)regressionfor independent or serially dependent observations, and has received extensive at-tention in the literature: see, for instance, [29], [31], [14], [41], [17], [32], [33], [50],[53], [54], [27], [7], as well as [55]. Quite surprisingly, despite its obvious importancefor applications, the spatial version (N > 1) of the same problem remains essen-tially unexplored. Several recent papers (among which [48], [49], [8], [22] and [23],are dealing with the related problem of estimating the density f of a random fieldof the form Xi ; i ∈ ZN, whereas [24], [35], [36], and [19] consider the estimationof spatial mean regression functions. To the best of our knowledge, no attempt hasbeen made so far to estimate spatial quantile regression functions.
Being of a nonparametric nature, our estimators of spatial quantile regressionfunctions naturally involve some smoothing techniques. The functions qp to be esti-mated being defined over the d-dimensional space of covariates, smoothing naturallyis over the X values, not (as in spatial smoothing methods) over the sites i. Amongall smoothing techniques, the Nadaraya-Watson method, in the traditional serialcase (N = 1), is probably the most standard one; it has been well documented,however—see, for instance, [16]—that it suffers from several severe drawbacks, suchas poor boundary performances, excessive bias and low efficiency, and that the localpolynomial fitting methods developed by [46] and [10] are generally preferable. Suchlocal polynomial methods, and more particularly local linear fitting, have becomeincreasingly popular in the light of recent work by [15], [16], [45], [53], [54], [34],and several others. For N = 1, [27] and [37] have studied the asymptotics of localpolynomial fitting for quantile regression under general mixing conditions. In thispaper, we extend this approach to the context of spatial quantile regression (N > 1)by defining an estimator of qp based on local linear regression quantiles.
Extending classical time-series asymptotics (N = 1) to spatial asymptotics (N >1) however is far from trivial. Due to the absence of a canonical ordering in thespace, there is no obvious definition of tail sigma-fields, ergodicity, mixing, andother traditional time-domain concepts. And, little seems to exist about this in theliterature, where only central limit results are well documented: see, e.g., [5] or [39].Even the simple idea of a sample size n going to infinity (the sample size here is adomain in ZN ) has to be clarified in this setting. Assumptions (A3, A3′, and A3′′)are reasonable and flexible generalizations of traditional time series concepts.
The stationary assumption we are making throughout plays a very fundamentalrole. Its main consequence is that conditional densities (of Yi conditional on Xi =
3

x)—hence the conditional quantile functions qp—only depend on x, not on i. Theregressors Xi and Xj may be strongly dependent (at neighboring sites i ∼ j) ornearly independent (at distant sites i and j): if they take similar values, they willyield similar conditional Y -quantiles: qp(Xi) ∼ qp(Xj). Local linear fitting here thusmeans local in the regressor’s space. Note however that, when the regressors Xi
contain neighboring values of Yi (quantile autoregression), the analysis automaticallyrecovers some spatial smoothing flavor.
Depending on the context, all assumptions can be criticized, and so is the as-sumption of spatial stationarity—no more so, however, than the time series assump-tion of stationarity over time. In the time series context, whenever stationaritydefinitely cannot be assumed, two major remedies are considered (still, in a non-parametric perspective). The most sophisticated one is based on Dahlhaus’ idea oflocally stationary processes ([12]), and relies on an (infill asymptotics scheme. Ex-tending this approach to quantiles and the spatial context however is well beyondthe scope of this paper, and should be left for future research.
A much simpler and less formal method, which is of daily practice in time se-ries analysis, consists in a preliminary detrending of the observations. Transposedto a spatial setting, this idea implicitly relies on a model of the form (Yi, X′
i)′ =
(µY (si),µµµ′X(si))′ + (Yi,X′i)′, where si := (i1/n1, . . . , iN/nN ), 1 ≤ ik ≤ nk, k =
1, 2, · · · , N . Here s 7→ (µY (s),µµµ′X(s))′ is an unspecified nonrandom spatial trend(defined over (0, 1)N , and (Yi,X′
i)′ is an unobservable stationary random field with
unconditional mean or median zero. The analysis then proceeds in two steps. First(detrending), an estimation (µY (si), µµµ′X(si)′) of the spatial trend is removed viasome adequate spatial smoothing method (that is, smoothing with respect to si):see [1], [6] or [56] for recent discussion. In the second step, the detrended data issupposed to satisfy the stationarity assumption, and subjected to the estimationmethod proposed, yielding, for the detrended Y ’s and detrended X’s, an estimatedconditional p-quantile function qp. At site i, the estimated p-quantile of Yi condi-tional on Xi then is obtained as µY (si) + qp(Xi − µµµX(si)).
In most references, including the traditional time series ones, no formal justifi-cation is given for this two-step strategy. A more formal approach is developed inSection 3, where we show that, under adequate assumptions, preliminary detrendingdoes not affect the asymptotic results of Section 2.
The paper is organized as follows. In Section 2.1 we provide the notation andmain assumptions. Sections 2.2 and 2.3 introduce the main ideas underlying locallinear regression in the context of random fields, and sketch the main steps of theproofs to be developed in the sequel. Section 2.4, where asymptotic normalityis stated under various types of asymptotics and various mixing assumptions, isthe main theoretical section of the paper. Section 3 extends those results to thecase of a random field with spatial trend. In Section 4, the method is appliedto an environmental dataset. Proofs and technical lemmas are concentrated in anAppendix (Section 5).
4

2 Local linear estimation of spatial quantile regression
2.1 Notation and main assumptions
For the sake of convenience, we are summarizing here the main assumptions we aremaking on the random field (1.1) and the kernel K to be used in the estimationmethod. Assumptions (A1)-(A3) are related to the random field itself.(A1) (Densities) The process (1.1) is strictly stationary; (Yi,Xi) has density f ,
and, denoting by fX the marginal density of X, by fY |X=x the density of Yconditional on X = x, and by fi,j(x, x) the joint density of (Xi, Xj) at (x, x),
(i) x 7→ fX(x) is strictly positive and continuous for all x;
(ii) for all x, there exist a neighborhood B of y = qp(x) and a neighborhoodB of x such that y 7→ fY |X=x(y) > 0 is continuous over B, uniformly inx ∈ B, while x 7→ fY |X=x(y) is continuous over B for all y ∈ B;
(iii) supi,j∈ZN supx, x∈Rd fi,j(x, x) ≤ C for some C > 0.
(A2) (Spatial quantile regression functions) The function x 7→ qp(x) is twice contin-uously differentiable. Denoting by qp(x) its gradient and by qp(x) the matrixof its second derivatives (at x), x 7→ qp(x) is continuous at all x.
Conditions similar to Assumption (A1) have been considered in the literature, inthe i.i.d. setting (cf. [17]). Assumption (A2) is standard.
Besides (A1) and (A2), we need some appropriate assumption of spatial mix-ing. For any collection S ⊂ ZN of sites, denote by B(S) the σ-field generated by(Yi,Xi)| i ∈ S. Let d(S ′,S ′′) := min‖i′ − i′′‖ | i′ ∈ S ′, , i′′ ∈ S ′′ be the dis-tance between S ′ and S ′′, where ‖i‖ := (i21 + . . . + i2N )1/2 stands for the Euclideannorm. Finally, write Card(S) for the cardinality of S. As in [24], two distinct forms(either (A3) and (A3′) or (A3) and (A3′′)) of spatial mixing are considered.
(A3) (Spatial mixing) There exist two functions, ϕ : R+ → R+ such that ϕ(t)↓t→∞0, and ψ : N2 → R+ symmetric and decreasing in its two arguments, such that
α(B(S ′),B(S ′′)) := sup
|P(AB)− P(A)P(B)|, A ∈ B(S ′), B ∈ B(S ′′)
≤ ψ(Card(S ′),Card(S ′′))ϕ(d(S ′,S ′′)). (2.1)
for any S ′,S ′′ ⊂ ZN . The function ϕ moreover is such that
limm→∞ma
∞∑
j=m
jN−1ϕ(j) = 0 for some constant a > N .
The assumptions we are making on the function ψ are either(A3′) ψ(n′, n′′) ≤ min(n′, n′′)
or (throughout, we denote by C a generic positive constant, the value of which mayvary according to the context)
5

(A3′′) ψ(n′, n′′) ≤ C(n′ + n′′ + 1)κ for some C > 0 and κ > 1.
In case (2.1) holds with ψ ≡ 1, the random field (Yi, Xi) is called strongly mix-ing. In the serial case (N = 1), many stochastic processes and time series are knownto be strongly mixing; cf. [18]; it is shown in[20] that, under certain conditions, lin-ear random fields of the form Xn =
∑j∈ZN gjZn−j, where the Zj’s are independent
random variables, are strongly mixing. Assumptions (A3′) and (A3′′) are the sameas the mixing conditions used by[40] and[47], respectively, and are weaker than theuniform strong mixing condition considered by[39]. Such assumptions are the priceto be paid for the presence of an unspecified spatial dependence structure.
Throughout, we assume that the random field (1.1) is observed over a rectangularregion of the form In := i = (i1, . . . , iN ) ∈ ZN | 1 ≤ ik ≤ nk, k = 1, . . . , N, forn = (n1, · · · , nN ) ∈ ZN with strictly positive coordinates n1, . . . , nN . The totalsample size is thus n :=
∏Nk=1 nk. We write n →∞ as soon as min1≤k≤Nnk → ∞.
A more demanding way for n to tend to infinity is the following one, where allcomponents of n tend to infinity at the same rate: as in[48], we write n =⇒ ∞ ifn →∞ and moreover |nj/nk| < C for some 0 < C < ∞, 1 ≤ j, k ≤ N .
Assumption (A4) deals with the kernel function K : Rd → R, and Assumptions(B1)-(B2) with the bandwidth hn to be used in the estimation method. For anyc := (c0, c′1)′ ∈ Rd+1, define Kc(u) := (c0 + c′1u)K(u), u ∈ Rd.
(A4) (Kernels) (i) For any c ∈ Rd+1, |Kc(u)| is uniformly bounded by some constant
K+c , and is integrable, i.e.,
∫
Rd+1|Kc(x)|dx < ∞;
(ii) for any c ∈ Rd+1, |Kc| has an integrable second order radial majorant, thatis, QK
c (x) := sup‖y‖≥‖x‖[‖y‖2Kc(y)
]is integrable;
(iii) the kernel function K is a continuously differentiable and bounded densityfunction with compact support CK ⊂ Rd such that
∫uK(u)du = 0 and∫
uu′K(u)du is positive definite.
(B1) (Bandwidths) The bandwith is such that limn→∞ hn= 0 and limn→∞ nhdn=∞.
(B2) (Bandwidths) Same as (B1), but moreover nh4+dn = O(1) as n→∞.
Finally, write fY |X(y|x) for fY |X=x(y) and FY |X(y|x) := P(Yi < y|Xi = x) forthe corresponding conditional distribution function. Primes denote transposes.
2.2 Local linear fitting of the spatial quantile regression function
In this section we extend traditional local linear fitting ideas to the context of spatialquantile regression. Write qp(x) = (∂qp(x)/∂x1, · · · , ∂qp(x)/∂xd)′ for the gradientat x = (x1, · · · , xd)′ ∈ Rd of x 7→ qp(x). The basic idea of local linear fitting
6
(see [17], [16], [54] or [34]) consists in approximating in a neighborhood of x theunknown quantile regression function qp(z) by a linear function:
qp(z) ≈ qp(x) + (qp(x))′(z− x) =: a0 + a′1(z− x). (2.2)
Therefore, estimating (qp(x), qp(x)) is locally equivalent to estimating (a0, a1) =(a0(x), a1(x)). The classical theory of quantile regression suggests the estimators
(a0, a1) := arg min(a0,a1)
∑
i∈Inρp(Yi − a0 − a′1(Xi − x))Kh(Xi − x), (2.3)
where ρp(y) := y(p − Iy<0) stands for the traditional check function ρp(y) :=y(p−Iy<0), IA is the indicator function of set A, and Kh(x) := h−d
n K(x/hn), witha kernel function K defined on Rd, and a bandwidth h = hn > 0 tending to 0 asn → ∞. This motivates the choice of qp(x) := a0 and qp(x) := a1 as estimatorsof qp(x) and qp(x), respectively. Note that (2.3) does not require the regular gridstructure we are assuming throughout. It seems intuitively clear that “nearly regulargrids” will not harm the results of this paper. However, the asymptotic treatmentof irregular grids (essentially, a definition of a “nearly regular grid”) is a delicateand problematic issue that we will not consider here.
2.3 Bahadur representation
The definition (2.3) looks simple, but, unlike the local linear fitting estimator forspatial mean regression proposed in [24], does not allow for an explicit solution,which creates additional difficulties in developing the asymptotic theory. We over-come these difficulties by obtaining a Bahadur representation for qp and qp.
Since [44], who (under i.i.d. errors) obtained the first Bahadur representationfor regression quantiles, several results of that type have been proposed in the litera-ture; see [31], [4], [9], [26]. The result by Chaudhuri ([9]), who establishes a Bahadurrepresentation for quantile regression functions and their derivatives of arbitrary or-ders, is particularly remarkable. The context however is a nonparametric regressionmodel of the form Yi = θ(Xi) + εi, where the errors εi are i.i.d., and independent ofthe regressors Xi; the influence on quantiles of the Xi’s thus is limited to conditionalshifts, which precludes all forms of conditional heteroskedasticity. Our result is moregeneral, as it allows for complex spatial dependencies, and does not put any restric-tion on the influence of regressors on the conditional distribution of Y —as long asmixing assumptions are satisfied. On the other hand, our Bahadur representationis a weak one (with oP remainder—which is all we need for asymptotic normality),whereas Chaudhuri’s is a strong one (with a.s. convergence), addressing first-orderderivatives only. The proof of Theorem 2.1 is postponed to Section 5.2.
Theorem 2.1 (Bahadur representation) Let Assumptions A1, A3, A4, and B1hold, and assume that x 7→ qp(x) is continuously differentiable at x, with gradi-ent qp(x)). Then,
7
(nhdn)1/2
(qp(x)− qp(x)
hn(qp(x)− qp(x))
)=
ηp(x)√nhd
n
∑
i∈Inψp(Y ∗
i )
(1
Xi−xhn
)K
(Xi − x
hn
)+oP(1),
as n →∞, where ψp(y) := p− Iy<0, Y ∗i := Y ∗
i (p) = Yi− qp(x)− (qp(x))′(Xi− x),and ηp(x) := (fY |X(qp(x)|x)fX(x))−1.
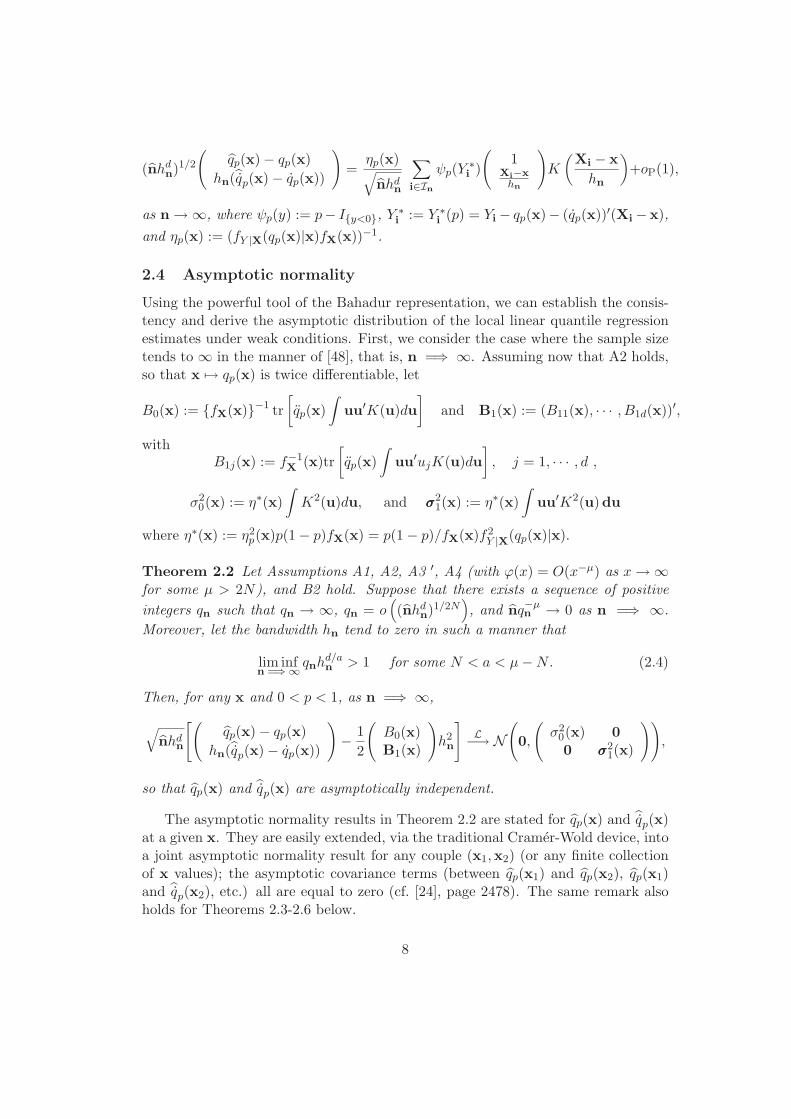
2.4 Asymptotic normality
Using the powerful tool of the Bahadur representation, we can establish the consis-tency and derive the asymptotic distribution of the local linear quantile regressionestimates under weak conditions. First, we consider the case where the sample sizetends to ∞ in the manner of [48], that is, n =⇒ ∞. Assuming now that A2 holds,so that x 7→ qp(x) is twice differentiable, let
B0(x) := fX(x)−1 tr[qp(x)
∫uu′K(u)du
]and B1(x) := (B11(x), · · · , B1d(x))′,
withB1j(x) := f−1
X (x)tr[qp(x)
∫uu′ujK(u)du
], j = 1, · · · , d ,
σ20(x) := η∗(x)
∫K2(u)du, and σσσ2
1(x) := η∗(x)∫
uu′K2(u)du
where η∗(x) := η2p(x)p(1− p)fX(x) = p(1− p)/fX(x)f2
Y |X(qp(x)|x).
Theorem 2.2 Let Assumptions A1, A2, A3 ′, A4 (with ϕ(x) = O(x−µ) as x →∞for some µ > 2N), and B2 hold. Suppose that there exists a sequence of positiveintegers qn such that qn → ∞, qn = o
((nhd
n)1/2N), and nq−µ
n → 0 as n =⇒ ∞.Moreover, let the bandwidth hn tend to zero in such a manner that
lim infn =⇒∞ qnhd/a
n > 1 for some N < a < µ−N. (2.4)
Then, for any x and 0 < p < 1, as n =⇒ ∞,
√nhd
n
[(qp(x)− qp(x)
hn(qp(x)− qp(x))
)− 1
2
(B0(x)B1(x)
)h2n
]L−→ N
(0,
(σ2
0(x) 00 σσσ2
1(x)
)),
so that qp(x) and qp(x) are asymptotically independent.
The asymptotic normality results in Theorem 2.2 are stated for qp(x) and qp(x)at a given x. They are easily extended, via the traditional Cramer-Wold device, intoa joint asymptotic normality result for any couple (x1,x2) (or any finite collectionof x values); the asymptotic covariance terms (between qp(x1) and qp(x2), qp(x1)and qp(x2), etc.) all are equal to zero (cf. [24], page 2478). The same remark alsoholds for Theorems 2.3-2.6 below.
8

An important advantage of local polynomial (and linear) fitting over the Nadaraya-Watson approach is its much better boundary behavior. This advantage often hasbeen emphasized in the usual regression and time-series settings when the regres-sors take values on a compact subset of Rd. For example, considering a univariate(d = 1) regressor X with bounded support ([0, 1], say), it can be proved, using anargument similar to the one developed in the proof of Theorem 3.1 of [24], thatasymptotic normality still holds at boundary points of the form chn, c ∈ R+, butwith asymptotic bias and variances
B0 =fX(0+)
−1[qp(0+)
∫ ∞
−cu2K(u)du
]and σ2
0 = η∗(0+)∫ ∞
−cK2(u)du,
and
B1 =fX(0+)
−1[qp(0+)
∫ ∞
−cu3K(u)du
]and σ2
1 = η∗(o+)∫ ∞
−cu2K2(u) du,
respectively, where η∗(0+) = η2p(0
+)p(1−p)fX(0+) = p(1− p)/fX(0+)f2Y |X(qp(0+)|0+);
similar results can be found in [16] and [18] for mean regression. As pointed outin[24], this advantage is likely to be more substantial as N grows.
In the important particular case under which ϕ(x) tends to zero at exponentialrate, the same results are obtained under milder conditions.
Theorem 2.3 Let Assumptions A1, A2, A3 ′, and A4 hold, with ϕ(x) = O(e−ξx)as x→∞ for some ξ > 0. Then, if hn → 0 as n =⇒ ∞ in such a manner that(nh
d(1+2N/a)n )1/2N (log n)−1→ ∞ for some a > N , the conclusions of Theorem 2.2
still hold.
Note that, for N = 1 and “large” values of a, this condition is “close” to the classicalone (for independent observations) that nhd
n →∞. Next, we consider the situationunder which n tends to ∞ in the “weak” sense (n →∞ instead of n =⇒ ∞).
Theorem 2.4 Let Assumptions A1, A2, A3 ′, and A4 hold, with ϕ(x) = O(x−µ) asx →∞ for some µ > 2N . Let qn be a sequence of positive integers such that qn →∞as n → ∞, and assume that the bandwidth hn factorizes into hn :=
∏Ni=1 hni, with
nq−µn → 0, qn = o((min1≤k≤N (nkh
dnk
))1/2), and lim infn→∞ qnhd/an > 1 for some
N < a < µ−N. Then the conclusions of Theorem 2.2 hold as n →∞.
For ϕ(x) → 0 at exponential rate, parallel to Theorem 2.3, we have the following.
Theorem 2.5 Let Assumptions A1, A2, A3 ′, and A4 hold, with ϕ(x) = O(e−ξx)as x → ∞ for some ξ > 0. Let the bandwidth hn factorize into hn :=
∏Ni=1 hni
in such a way that min1≤k≤N(nkhdnk
)1/2hd/an (log n)−1 → ∞ for some a > N as
n →∞. Then the conclusions of Theorem 2.2 hold as n →∞.
Under (A3′′), we then have the following counterpart of Theorem 2.2.
9

Theorem 2.6 Let Assumptions A1, A2, A3 ′′, and A4 hold, with ϕ(x) = O(x−µ)as x →∞ for some µ > 2N . Denote by qn a sequence of positive integers such thatqn → ∞, qn = o((nbd
n)1/2N ) and nκ+1q−µ−Nn → 0 as n =⇒ ∞. Assume that the
bandwidth hn tends to zero in such a manner that (2.4) is satisfied as n =⇒ ∞.Then the conclusions of Theorem 2.2 hold as n =⇒ ∞.
See Section 5.3 for the proofs. Analogues of Theorems 2.3, 2.4, and 2.5 can alsobe obtained under Assumption (A3′′); details are left to the reader.
3 Random fields with a spatial trend
In Section 2, the observed process Yi,Xi was assumed to be stationary—an as-sumption which in practice is often violated. As a reasonable alternative, we canassume that nonstationarity is due to the presence of a spatial trend and that,instead of the stationary process Yi,Xi, we actually observe Yi, Xi, with
Yi = µY (si) + Yi, Xi = µµµX(si) + Xi, i ∈ In, (3.1)
where si = (si1 , . . . , siN ) := (i1/n1, . . . , iN/nn) and s ∈ [0, 1]N 7→ (µY (s),µµµX(s))is some deterministic but unknown trend function. The procedure described inSection 2 then is applied to the residuals (Yi , Xi) := (Yi − µY (si), Xi − µµµX(si))of some preliminary spatial smoothing (µY (s), µµµX(s)) of the original Yi, Xi.
For the sake of simplicity, we assume, throughout this section, that N = 2, whichis also the most frequent case in practice. Letting
w(si, s) := W ((si − s)/g)/[∑
j∈InW ((sj − s)/g)],
where g = gn is some bandwidth tending to 0, a simple smoothing is obtained as
µY (s) =∑
i∈InYiw(si, s), µµµX(s) =
∑
i∈InXiw(si, s). (3.2)
A sufficient technical requirement for the convergence of this kernel smoothing isthe following set of assumptions (inspired from Theorem 2 in Hansen 2008).
(C0) (i) Xi, Yi is a stationary spatial process with the spatial mixing coefficientspecified in Assumption (A3) with ϕ(m) ≤ Cm−β , where 0 < C < ∞ andβ > 1 + (s− 1)(1 + N)/(s− 2);
(ii) For some s > 2, E|Yi|s < ∞ and E‖Xi‖s < ∞;
(iii) For θ = β − 1 − N − (1 + β)/(s − 1)/β + 3 − N − (1 + β)/(s − 1),(ln n/nθgN
n ) = o(1).
The local linear estimators of the quantile regression then are defined as in (2.3),
(a0, a1) := arg min(a0,a1)
∑
i∈Inρp(Yi − a0 − a′1(Xi − x))Kh(Xi − x), (3.3)
10

yielding the estimators qp(x) := a0 and ˇqp(x) := a1 of qp(x) and qp(x), respectively.In order to study the asymptotic behavior of these estimators, we need some
additional regularity conditions.
(C1) s 7→ µY (s) and s 7→ µµµX(s) are r times differentiable with bounded derivativeson S := [0, 1]2, where r is some positive integer.
(C2) There exists a continuous sampling intensity (density) function f defined onS such that 0 < c0 ≤ f(s) ≤ c1 < ∞ for any s ∈ S and n−1 ∑
i∈In I(si ∈ A) →∫A f(s)ds for any measurable set A ⊂ S, as n →∞.
Assumption (C1) is a classical smoothness assumption on spatial trend functions;Assumption (C2) is mentioned for the sake of generality, and is trivially satisfiedin the case of a regular grid. Depending on r in Assumption (C1), we require thefollowing conditions on the kernel W and the bandwidth gn.
(C3) The kernel W (·), defined on R2, has bounded support with Lipschitz property,that is |W (u)−W (u′)| ≤ C‖u−u′‖ for all u,u′ ∈ R2, where C > 0 is a genericconstant, and satisfies (u⊗k stands for the k-th Kronecker power of u)∫
W (u)du = 1,
∫u⊗kW (u)du = 0, k = 1, 2, · · · , r − 1,
∫u⊗rW (u)du 6= 0.
(C4) As n →∞, gn → 0 and ng2nhn →∞; moreover, gr
n/hn → 0, hd+2n /(ng4
n) → 0,hdn ln n/g2
n → 0, and nhdng2r
n → 0.
Assumption (C3) requires a higher order kernel function W (·) of order r, whichensures that the bias term of the smoothing estimators of the spatial trends is oforder O(gr
n) (the same objective could be achieved through a local polynomial fittingof order (r − 1)). Assumption (C4) on the bandwidths gn and hn is satisfied, forinstance, if we let hn = n−1/(d+4), which is optimal under Assumption (A2), withng
2(d+4)n →∞ and ng
r(d+4)/2n → 0, which holds for r > 4.
Theorem 3.1 (Bahadur representation) Let Assumptions A1, A3, A4, B1 and C0-C4 hold. Assume moreover that x 7→ qp(x) is continuously differentiable at x, withgradient qp(x). Then, as n →∞,
(nhdn)1/2
(qp(x)− qp(x)
hn(ˇqp(x)− qp(x))
)=
ηp(x)√nhd
n
∑
i∈Inψp(Y ∗
i )
(1
Xi−xhn
)K
(Xi − x
hn
)+oP(1).
The proof of Theorem 3.1 is postponed to Section 5.4.It readily follows from this theorem that the asymptotic normality results of
Section 2.4 still hold true for qp(x) and ˇqp(x). Details are left to the reader.
11

4 An application to environmental data.
The dataset we are analyzing here was collected as part of a project, entitled “Geo-statistical Analysis of Plant Community Transitions in the Outer Hebrides”, led byMartin Kent (University of Plymouth), and was kindly provided by his colleagueand coauthor Rana Moyeed. This project aims at a better understanding of the en-dangered coastal ecosystems in the Outer Hebrides of Scotland known as machairs.Of particular interest in that context are the rates of spatial change in plant speciescomposition, and the environmental and biotic factors across landscape boundariesas well as within landscape patches.
Machair is a Gaelic word that describes a distinctive type of coastal grasslandfound in the north and west of Scotland, and in western Ireland. It is associatedwith calcareous sand, blown inland by very strong prevailing winds from beachesand mobile dunes. Machair grassland plains are a complex mosaic of wet and drygrassland communities and ecosystems. Machair systems have high conservationvalue related to their rarity on a global scale, their species composition and botanicalsignificance, in addition to their geomorphological, archaeological and landscapeimportance.
One of the major threats on the fragile equilibrium of the machair ecosystem isthe increase of soil acidity induced, mainly, by an excess of organic matter, possiblyrelated with intensive use of fertilizers containing ammonium or urea. One way ofbalancing the observed increase of soil acidity consists in replacing the lost cationnutrients, particularly calcium. A better understanding of the interaction betweenorganic matter and Ca concentrations on one hand, soil acidity on the other hand,is thus crucial, and spatial quantile regression is particulatly well adapted for anin-depth analysis of such interaction. The example we are treating here is a goodinstance of what can be detected by our method, that would go unnoticed in atraditional regression/correlation approach.
The analysis we are conducting is deliberately simple, with a minimal numberof two covariates (N = d = 2). Data were collected as explained, over a grid of 217sites. The covariates X1 and X2 are densities of Ca (in mg/kg) and organic matter(in %), respectively. The response Y is a measure of soil acidity (pH)—a pH lessthan (resp., greater than) seven is considered acidic (resp., basic or alkaline), sevenbeing the pH of pure water at 25C. Figure 1 presents a spatial plot of raw data.
As a preliminary step, the data were “detrended” via the standard R function‘sm.regression’ in the R library ‘sm’ (see [6] for details). A direct regression of Yagainst X1 and X2 indeed could lead to spurious relations induced by spatial trend(hence, spatial nonstationarity). We then apply our methods to the resulting resid-uals, for q = 0.12 (bandwidth 1.7), 0.50 (bandwidth 1.3), and 0.88 (bandwidth 1.5).This yields the conditional regression quantile surfaces shown in Figure 2.
Due to the impossibility of plotting three q-values in one figure, these figures,however, are not easily readable, and we therefore also provide, in Figure 3, simul-
12

(a) (b)
57.189557.19
57.190557.191
57.1915 57.192
Latitude
−7.42
−7.41
−7.4
−7.39
Longitude
22.
53
3.5
44.
5C
a(m
g/kg
)
57.189557.19
57.190557.191
57.191557.192
Latitude
−7.42
−7.41
−7.4
−7.39
Longitude
020
4060
8010
0or
gani
c m
atte
r (%
)
(c)
57.189557.19
57.190557.191
57.191557.192
Latitude
−7.42
−7.41
−7.4
−7.39
Longitude
45
67
8pH
(1:5
soi
l:wat
er)
Figure 1: Componentwise spatial perspectives of the dataset: (a) Ca density(mg/kg), (b) organic matter concentration (in %), and (c) soil acidity (pH).
taneous plots of the same quantiles, (a) against (detrended) Ca density for threechosen values of organic matter concentration, and (b) against (detrended) organicmatter concentration for three chosen values of Ca density—along with the corre-sponding estimated conditional mean. These graphs clearly show that the (positive)dependence of soil pH on Ca density and its (negative) dependence on organic matterconcentrations are not linear. For low Ca densities (irrespective of organic matterconcentrations) and high organic matter concentrations (irrespective of Ca densi-ties), pH is uniformly low (i.e., the soil is rather acid), with pretty limited impact ofthe covariates. In particular, a minimal Ca density apparently is required, whateverthe organic matter concentration, for inducing any noticeable acidity reduction ef-fect (see Figure 3(a) for this threshold effect); on the other hand, median pH valuesare pretty stable (low pH values, hence high acidity) for high organic matter con-centrations (see Figure 3(b)). Conditional pH distributions moreover look highlyasymmetric and highly “heteroskedastic”, with much higher spread in right-handtails (higher uncertainty on alkalinity) than in the left-hand ones (less uncertaintyon acidity). Such facts could not be revealed by a traditional study of conditional
13

(a) (b)
-40-20
020
4060
org-0.8
-0.6
-0.4
-0.2
0
0.2
0.4
0.6
Ca
-2-1
.5-1
-0.5
00.
51
pH
-40-20
020
4060
org-0.8
-0.6
-0.4
-0.2
0
0.2
0.4
0.6
Ca
-1.5
-1-0
.5 0
0.5
11.
5pH
(c)
-40-20
020
4060
org-0.8
-0.6
-0.4
-0.2
0
0.2
0.4
0.6
Ca
-1-0
.5 0
0.5
11.
52
pH
Figure 2: Estimated conditional quantiles of order q for soil acidity (pH), conditionalon Ca density (mg/kg) and organic matter concentration (in %), for (a) q = 0.12,(b) q = 0.50, and (c) q = 0.88 (all variables detrended).
means; neither would they be revealed by a simpler LAD estimation of conditionallocation. For a localized interpretation at given site i, however, the estimated trendalso should be taken into account, as explained at the end of Section 1.
Asymmetry of the densities involved is confirmed by Figure 4, where kernelestimates of marginal densities (after preliminary detrending) are provided. Thoseestimates moreover indicate that pH measurents exhibit a strongly bimodal profile,meaning that a simple study of conditional means or conditional medians, contraryto our method, is bound to miss some of the essential features of the dataset.
In this analysis, we restricted ourselves to conditioning on the two covariates,treating the spatial dependence as a nuisance. Further analysis of the data set mightbe carried out by introducing neighbouring observations into the set of covariates,which is made possible by our theoretical results. This is likely to improve the re-sults, but also would increase the dimension of the covariate space. Semi-parametricdimension-reduction techniques then should be considered, as in Gao et al. (2006)and Lu et al. (2007). Our purpose here was voluntarily limited to a simple illustra-tion of the spatial regression quantile methods described in Section 2. Limited as itis, however, this short study provides, we hope, a good picture of how our methodmay provide a better understanding of complex spatial processes.
14

(a) (b)
−1.0 −0.5 0.0 0.5 1.0
−1.0
−0.5
0.0
0.5
1.0
Ca
pH
−40 −20 0 20 40
−1.0
−0.5
0.0
0.5
1.0
org
pH
−1.0 −0.5 0.0 0.5 1.0
−1.0
−0.5
0.0
0.5
1.0
Ca
pH
−40 −20 0 20 40
−1.0
−0.5
0.0
0.5
1.0
org
pH
−1.0 −0.5 0.0 0.5 1.0
−1.0
−0.5
0.0
0.5
1.0
Ca
pH
−40 −20 0 20 40
−1.0
−0.5
0.0
0.5
1.0
org
pH
Figure 3: Estimated conditional quantiles of order q = 0.03 and 0.97 (black), q =0.12 and 0.88 (red), and q = 0.50 (blue), and estimated conditional mean (green) forsoil acidity (pH), (a) conditional on Ca density (mg/kg) and organic matter concen-trations -28.5, 0.0, and 39.6, and (b) conditional on organic matter concentrationand Ca densities -0.82, 0.00, and 0.67 (all variables detrended).
15

pH
Den
sity
−2 0 1 2
0.0
0.1
0.2
0.3
0.4
0.5
organic matter (%)
Den
sity
−50 0 50
0.0
0.00
50.
010
0.01
5
Ca (mg/kg)D
ensi
ty
−1.0 0.0 1.0
0.0
0.5
1.0
1.5
Figure 4: Kernel estimates of the marginal densities of soil acidity (pH), organicmatter concentration (in %), and Ca density (mg/kg) (after preliminary detrending).
5 Appendix: Proofs
5.1 A preliminary lemma
The following lemma is an improved version of the cross-term inequality of Lemma 5.2of [24], adapted to the quantile regression context, and plays a crucial role in thesubsequent sections. For the sake of generality, and in order for this lemma to applybeyond the specific framework of this paper, we do not necessarily assume that themixing coefficient take the form imposed in Assumption (A3). Let (Yj,Xj); j ∈ ZNdenote a stationary spatial process with general mixing coefficient
ϕ(j) = ϕ(j1, . . . , jN ) := sup|P(AB)−P(A)P(B)| : A ∈ B(Yi, Xi), B ∈ B(Yi+j, Xi+j)
.
Let (y,x) 7→ b(y,x) be a bounded measurable function defined on R1 × Rd. Set
ηj(x) := b(Yj,Xj)K((x−Xj)/hn), ∆j(x) := ηj(x)− Eηj(x),
and R(x) := (nhdn)−1
∑
i 6=j∈InE [∆i(x)∆j(x)] . For any cn := (cn1, · · · , cnN ) ∈ ZN with
1 < cnk < nk for all k = 1, · · · , N , define J1(x) := h2dn
∏Nk=1(nkcnk) and
J2(x) := nN∑
k=1
ns∑
|js|=1s=1, ··· , k−1
nk∑
|jk|=cnk
ns∑
|js|=1s=k+1, ··· , N
ϕ(j1, · · · , jN ).
16

Lemma 5.1 (Cross-term Lemma) Under Assumptions A1, A2, and A4, there existsa constant C > 0 such that |R(x)| ≤ C(nhd
n)−1[J1(x) + J2(x)]. If furthermoreϕ(j1, . . . , jN ) takes the form ϕ(‖j‖), then J2(x) ≤ Cn
∑Nk=1
∑‖n‖t=cnk
tN−1ϕ(t).
Proof. The main idea of the proof is similar to that of Lemma 5.2 of [24], thoughdetails are different. We only briefly sketch it here. Writing Zj for b(Yj,Xj), wehave ηj(x) = ZjK((x −Xj)/hn), where |Zj| is bounded by some L > 0. For i 6= j,letting Kn(x) := (1/hd
n)K(x/hn),
h−dn [∆j(x)∆i(x)]
= hdn
∫ ∫Kn(x− u)Kn(x− v)g1ij(u,v)fi,j(u,v)− g
(1)1 (u)g(1)
1 (v)f(u)f(v)dudv,
where g1ij(u, v) := E(ZiZj|Xi = u, Xj = v), and g(1)1 (u) := E(Zi|Xi = u). Since
|Zi| is bounded by L, we have that |g1ij(u, v)| ≤ L2 and |g(1)1 (u)g(1)
1 (v)| ≤ L2. Thus,
|g1ij(u, v)fi, j(u, v)−g(1)1 (u)g(1)
1 (v)f(u)f(v)| ≤ L2|fi, j(u, v)−f(u)f(v)|+2L2f(u)f(v).
It then follows from Assumption (A1) and the Lebesgue density Theorem (see Chap-ter 2 of [13]) that
h−dn |E∆j(x)∆i(x)| ≤ hd
n
∫ ∫Kn(x− u)Kn(x− v)L2|fi, j(u, v)− f(u)f(v)| dudv
+hdn
∫ ∫Kn(x− u)Kn(x− v)2L2f(u)f(v) dudv
≤ ChdnL2 = Chd
n. (5.1)
Let cn = (cn1, · · · , cnN ) ∈ RN be a sequence of vectors with positive components.Define
S1 := i 6= j ∈ In : |jk − ik| ≤ cnk, for all k = 1, · · · , Nand
S2 := i, j ∈ In : |jk − ik| > cnk, for some k = 1, · · · , N .
Clearly, Card(S1) ≤ 2N n∏N
k=1 cnk. Splitting R(x) into (nhdn)−1(J1 + J2), with
J` :=∑
i, j∈S`
E∆j(x)∆i(x), ` = 1, 2, it follows from (5.1) that
|J1| ≤ Ch2dn Card(S1) ≤ 2NCh2d
n nN∏
k=1
cnk. (5.2)
Turning to J2, we have |J2| ≤∑
i, j∈S2
|E∆j(x)∆i(x)|. Davydov’s inequality (cf. Lemma 2.1
of [48]) and the boundedness of ∆i(x) yield |E∆j(x)∆i(x)| ≤ Cϕ(j− i). Hence,
|J2| ≤ C∑
i, j∈S2
ϕ(j− i) =: CΣ2, say.
17

We now analyze Σ2 in detail. For any N -tuple 0 6= ` = (`1, . . . , `N ) ∈ 0, 1N , set
S(`1, . . . , `N ) :=i, j ∈ In : |jk − ik| > cnk if `k = 1
and |jk − ik| ≤ cnk if `k = 0, k = 1, · · · , N
and V (`1, . . . , `N ) :=∑
i,j∈S(`1, ..., `N )
ϕ(j− i). Then, Σ2 =∑
i,j∈S2
ϕ(j− i) =∑
06=`∈0,1N
V (`1, . . . , `N )
where, as in equation (5.11) of [24],
V (`1, `2, . . . , `N ) ≤ n∑
|j1|. . .
∑
|jk|. . .
∑
|jN |ϕ(j1, . . . , jN ),
with the sums∑|jk| running over all jk’s such that 1 ≤ |jk| ≤ nk when `k = 0, such
that cn1 ≤ |jk| ≤ nk when `k = 1. Since all terms are nonnegative, for 1 ≤ cnk ≤ nk,sums of the form
∑nk
|jk|=cnk. . . are smaller than those of the form
∑nk
|jk|=1 . . . , and
|J2| ≤ CnN∑
k=1
n1∑
|j1|=1
. . .
nk−1∑
|jk−1|=1
nk∑
|jk|=cnk
nk+1∑
|jk+1|=1
. . .nN∑
|jN |=1
ϕ(j1, . . . , jN ). (5.3)
The first part of the lemma is a consequence of (5.2) and (5.3). The second partfollows from the fact that, if ϕ(j1, . . . , jN ) depends on ‖j‖ only,
n1∑
|j1|=1
. . .
nk−1∑
|jk−1|=1
nk∑
|jk|=cnk
nk+1∑
|jk+1|=1
. . .nN∑
|jN |=1
ϕ(‖j‖) ≤‖n‖∑
t=cnk
t∑
|j1|=1
. . .t∑
|jN−1|=1
ϕ(t) ≤‖n‖∑
t=cnk
tN−1ϕ(t).
¤
5.2 Proof of the Bahadur representation result
We first introduce some notation. Throughout, let C > 0 denote a generic constant.Let Xhi := (Xi − x)/hn, XXX hi := (1, X′
hi)′, Ki := K(Xhi), Hn = (nhd
n)1/2,
θθθ := Hn(a0 − qp(x), hn(a1 − q(x))′
)′, θθθn := Hn
(a0 − qp(x), hn(a1 − q(x))′
)′,
and θθθ := Hn (a0 − qp(x), hn(a1 − q(x))′)′, where (a0, a′1)′, (a0, a′1)′ ∈ R1+d. WithY ∗i defined in Theorem 2.1, put Y ∗
ni(θθθ) := Y ∗i −θθθ′XXX hi/Hn, Tni := (qp(x))′Xhihn, and
Uni := Uni(θθθ) = Tni + θθθ′XXX hi/Hn. With this notation, Y ∗i = Yi − qp(x) − Tni, and
Y ∗ni(θθθ) = Yi − qp(x)−Uni(θθθ) = Yi − a0 − a′1(Xi − x). Since K is a bounded function
with bounded support,
‖Xhi‖ ≤ C and ‖XXX hi‖ ≤ C when Ki > 0. (5.4)
When ‖θθθ‖ ≤ M and Ki > 0, |Tni| ≤ Chn and |Uni| ≤ Chn + CH−1n → 0 as
n →∞. It follows from (2.3) that
θθθn = argminθθθ∈R1+d
∑
i∈Inρp(Y ∗
ni(θθθ))Ki. (5.5)
18
Finally, define Vn(θθθ) := H−1n
∑i∈In ψp(Y ∗
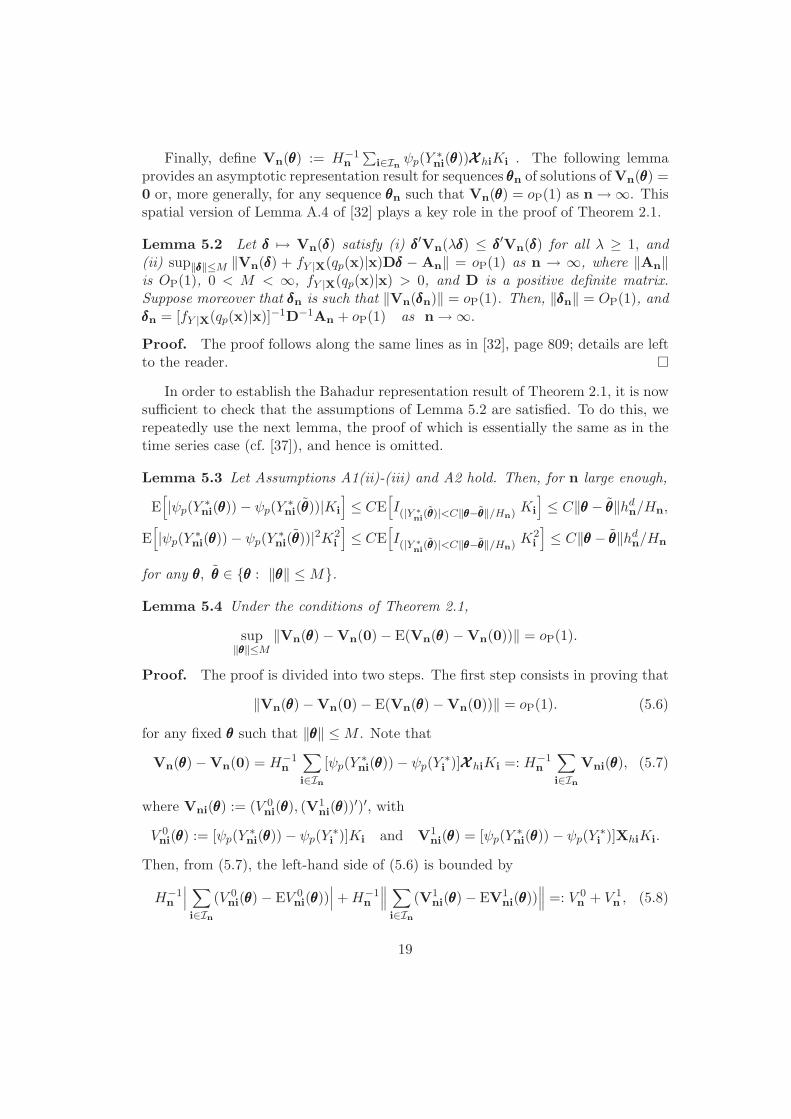
ni(θθθ))XXX hiKi . The following lemmaprovides an asymptotic representation result for sequences θθθn of solutions of Vn(θθθ) =0 or, more generally, for any sequence θθθn such that Vn(θθθ) = oP(1) as n →∞. Thisspatial version of Lemma A.4 of [32] plays a key role in the proof of Theorem 2.1.
Lemma 5.2 Let δδδ 7→ Vn(δδδ) satisfy (i) δδδ′Vn(λδδδ) ≤ δδδ′Vn(δδδ) for all λ ≥ 1, and(ii) sup‖δδδ‖≤M ‖Vn(δδδ) + fY |X(qp(x)|x)Dδδδ − An‖ = oP(1) as n → ∞, where ‖An‖is OP(1), 0 < M < ∞, fY |X(qp(x)|x) > 0, and D is a positive definite matrix.Suppose moreover that δδδn is such that ‖Vn(δδδn)‖ = oP(1). Then, ‖δδδn‖ = OP(1), andδδδn = [fY |X(qp(x)|x)]−1D−1An + oP(1) as n →∞.
Proof. The proof follows along the same lines as in [32], page 809; details are leftto the reader. ¤
In order to establish the Bahadur representation result of Theorem 2.1, it is nowsufficient to check that the assumptions of Lemma 5.2 are satisfied. To do this, werepeatedly use the next lemma, the proof of which is essentially the same as in thetime series case (cf. [37]), and hence is omitted.
Lemma 5.3 Let Assumptions A1(ii)-(iii) and A2 hold. Then, for n large enough,
E[|ψp(Y ∗
ni(θθθ))− ψp(Y ∗ni(θθθ))|Ki
]≤ CE
[I(|Y ∗
ni(θθθ)|<C‖θθθ−θθθ‖/Hn) Ki
]≤ C‖θθθ − θθθ‖hd
n/Hn,
E[|ψp(Y ∗
ni(θθθ))− ψp(Y ∗ni(θθθ))|2K2
i
]≤ CE
[I(|Y ∗
ni(θθθ)|<C‖θθθ−θθθ‖/Hn) K2
i
]≤ C‖θθθ − θθθ‖hd
n/Hn
for any θθθ, θθθ ∈ θθθ : ‖θθθ‖ ≤ M.
Lemma 5.4 Under the conditions of Theorem 2.1,
sup‖θθθ‖≤M
‖Vn(θθθ)−Vn(0)− E(Vn(θθθ)−Vn(0))‖ = oP(1).
Proof. The proof is divided into two steps. The first step consists in proving that
‖Vn(θθθ)−Vn(0)− E(Vn(θθθ)−Vn(0))‖ = oP(1). (5.6)
for any fixed θθθ such that ‖θθθ‖ ≤ M . Note that
Vn(θθθ)−Vn(0) = H−1n
∑
i∈In[ψp(Y ∗
ni(θθθ))− ψp(Y ∗i )]XXX hiKi =: H−1
n
∑
i∈InVni(θθθ), (5.7)
where Vni(θθθ) := (V 0ni(θθθ), (V
1ni(θθθ))
′)′, with
V 0ni(θθθ) := [ψp(Y ∗
ni(θθθ))− ψp(Y ∗i )]Ki and V1
ni(θθθ) = [ψp(Y ∗ni(θθθ))− ψp(Y ∗
i )]XhiKi.
Then, from (5.7), the left-hand side of (5.6) is bounded by
H−1n
∣∣∣∑
i∈In(V 0
ni(θθθ)− EV 0ni(θθθ))
∣∣∣ + H−1n
∥∥∥∑
i∈In(V1
ni(θθθ)− EV1ni(θθθ))
∥∥∥ =: V 0n + V 1
n , (5.8)
19

say. It follows from stationarity together with Lemma 5.1 that
E(V 0n )2 = (nhd
n)−1[ ∑
i∈Invar(V 0
ni(θθθ)) +∑
i 6=j∈Incov(V 0
ni(θθθ), V0nj(θθθ))
]
≤ h−dn var(V 0
n1(θθθ)) + (nhdn)−1[J1(x) + J2(x)], (5.9)
where J1(x) ≤ Cnh2dn
∏Nk=1 cnk and J2(x) ≤ Cn
∑Nk=1
∑‖n‖t=cnk
tN−1ϕ(t), as impliedby Lemma 5.1. Here cnk, k = 1, · · · , N , are positive integers depending on n, to bespecified later on. In order to bound (5.9), we apply Lemma 5.3 with θθθ = 0; for‖θθθ‖ ≤ M , var(V 0
n1(θθθ)) ≤ E[(V 0n1)
2] = E[|ψp(Y ∗ni(θθθ))−ψp(Y ∗
i )|2K2i ] ≤ Chd
n/Hn. Thenit follows from (5.9) with cnk = h
−d/an for k = 1, · · · , N , that
E[(V 0n )2] ≤ CH−1
n + Ch(1−N/a)dn + C
N∑
k=1
cank
∞∑
t=cnk
tN−1ϕ(t) = o(1), (5.10)
in view of Assumption A3 and the fact that hn → 0, nhdn →∞, and a > N . Similarly
to (5.10), we have E(V 1n )2 = o(1) which, with (5.8) and (5.10), implies (5.6).
The second step consists in establishing the uniform consistency with respect to‖θθθ‖ ≤ M by a chaining argument. Decompose θθθ : ‖θθθ‖ ≤ M into cubes based onthe grid (j1γM, · · · , jd+1γM), ji = 0, ±1, · · · , ±[1/γ] + 1, where [1/γ] denotes theinteger part of 1/γ, and γ is a small positive number that does not depend on n.Let R(θθθ) be the lower vertex of the cube that contains θθθ. Clearly, ‖R(θθθ)−θθθ‖ ≤ Cγand the number of elements of R(θθθ) : ‖θθθ‖ ≤ M is finite. Then
sup‖θθθ‖≤M
‖Vn(θθθ)−Vn(0)− E(Vn(θθθ)−Vn(0))‖ ≤ V ∗n1 + V ∗
n2 + V ∗n3 (5.11)
where, following (5.6), V ∗n1 := sup‖θθθ‖≤M ‖Vn(R(θθθ))−Vn(0)−E(Vn(R(θθθ))−Vn(0))‖
is oP(1), V ∗n2 := sup‖θθθ‖≤M ‖Vn(θθθ) −Vn(R(θθθ))‖, and V ∗
n3 := sup‖θθθ‖≤M ‖E(Vn(θθθ) −Vn(R(θθθ)))‖. Using (5.4) and, for ‖θθθ‖ ≤ M , applying Lemma 5.3 with θθθ = R(θθθ) forn large enough,
V ∗n3 ≤ CH−1
n n sup‖θθθ‖≤M
E[|ψp(Y ∗ni(θθθ))−ψp(Y ∗
ni(R(θθθ)))|Ki] ≤ C sup‖θθθ‖≤M
‖θθθ −R(θθθ)‖ ≤ Cγ.
Therefore, letting n →∞ and γ → 0, we have V ∗n3 = o(1).
Let Bi(θθθ) := I(|Y ∗ni
(θθθ)|<Cγ/Hn) ‖XXX hi‖Ki. Since |I(y<a) − I(y<0)| ≤ I(|y|≤|a|),
V ∗n2 ≤ sup
‖θθθ‖≤M‖Vn(θθθ)−Vn(R(θθθ))‖ ≤ C sup
‖θθθ‖≤MH−1
n
∑
i∈InBi(R(θθθ)) ≤ Bn1 + Bn2,
where, by the same argument as above, Bn1 := C sup‖θθθ‖≤M
H−1n
∑
i∈InEBi(R(θθθ)) = o(1),
and, similarly to (5.10), Bn2 := C sup‖θθθ‖≤M
|H−1n
∑
i∈In(Bi(R(θθθ))− EBi(R(θθθ)))| = oP(1).
Thus, V ∗n2 = oP(1), and Lemma 4.4 follows from (5.11). ¤
20

Lemma 5.5 Let D := fX(x)diag(1,∫
uu′K(u)du). Under Assumptions A1(iii)and A2, sup
‖θθθ‖≤M‖E(Vn(θθθ)−Vn(0)) + fY |X(qp(x)|x)Dθθθ‖ = o(1).
Proof. The proof again is similar to that in the time series case (see [37]). ¤
Lemma 5.6 Denote by θθθn the minimizer in (5.5). Then, ‖Vn(θθθn)‖ is oP(H−1n ).
Proof. The proof is similar to that of Lemma A.2 of [44]. ¤
Lemma 5.7 Under Assumptions A1 and A2, if a ≥ N and hn → 0,
E[(c′Vn(0)− c′EVn(0))2] → p(1− p)fX(x)∫
(c0 + c′1u)2K2(u)du
as n →∞, where c = (c0, c′1)′ ∈ R1+d.
Proof. Let vi := ψp(Y ∗i )(c0 + c′1Xhi)Ki. Lemma 5.1 with cnk = h
−d/an for k =
1, · · · , N yields
E[(c′Vn(0)− c′EVn(0))2
]= (nhd
n)−1[ ∑
i∈Invar(vi) +
∑
i 6=j∈Incov(vi, vj)
](5.12)
= h−dn var(v1) + O(1)h(1−N/a)d
n + O(1)N∑
k=1
cank
∞∑
t=cnk
tN−1ϕ(t)
=: vn1 + vn2 + vn3, say. (5.13)
Theorem 3 of [13] (page 8) entails
E[I(Y ∗1 <0)(c0 + c′1Xh1)2K2
1
]= E
[FY |X(qp(x) + qp(X1 − x)|X1)(c0 + c′1Xh1)2K2
1
]
−→ pfX(x)∫
(c0 + c′1u)2K2(u)du
and E[I(Y ∗1 <0)(c0 + c′1Xh1)K1
]−→ pfX(x)
∫(c0+c′1u)K(u)du. This in turn implies
h−dn E[v2
1] = E[(p2 − 2pI(Y ∗1 <0) + I(Y ∗1 <0))(c0 + c′1Xh1)2K21]
−→ p(1− p)fX(x)∫
(c0 + c′1u)2K2(u)du,
and
h−dn E[v1] = E
[(p− I(Y ∗1 <0)
)(c0 + c′1Xh1)K1
]
−→ (p− p)fX(x)∫
(c0 + c′1u)K(u)du = 0.
21

Hence, vn1 = h−dn E
[v21
] − h−dn (Ev1)2 −→ p(1 − p)fX(x)
∫(c0 + c′1u)2K2(u)du. On
the other hand, it clearly follows, from the fact that hn → 0 and Assumption A3
with a > N , that |vn2 + vn3| = O(1)h(1−N/a)dn + O(1)
N∑
k=1
cank
∞∑
t=cnk
tN−1ϕ(t) −→ 0.
The result follows. ¤
Proof of Theorem 2.1. As already mentioned, it is sufficient to check thatthe conditions of Lemma 5.2 are fulfilled. First we note that Lemmas 5.4 and 5.5lead to (ii) of Lemma 5.2. Also, it follows from Lemma 5.6 together with Assump-tions A2 and A3 that ‖Vn(θθθn)‖ = oP(1). Take An = Vn(0). Then it is clear fromLemma 5.7 that An = OP(1). Since y 7→ ψp(y) is monotone increasing, the functionλ 7→ −θθθ′Vn(λθθθ) = H−1
n
∑i∈In ψp(y∗i − λθθθ′Xhi/Hn)(−θθθ′XXX hi)Ki also is. Therefore,
condition (i) of Lemma 5.2 holds. The theorem follows. ¤
5.3 Proof of asymptotic normality
On the basis of the Bahadur representation of Theorem 2.1, the asymptotic normal-ity of our estimators in Theorems 2.2–2.6 follows exactly as in the correspondingproofs for mean regression in [24], with the “cross-term” Lemma 5.1 replacing thecorresponding Lemma 5.2 in that paper, yielding the asymptotic normality with thebias (i.e. the expectation) of the first term on the right-hand side of (2.5) as
E
[ηp(x)√nhd
n
∑
i∈Inψp(Y ∗
i )
(1
Xi−xhn
)K
(Xi − x
hn
) ]
=ηp(x)√nhd
n
nE
[ψp(Y ∗
i )
(1
Xi−xhn
)K
(Xi − x
hn
) ]
= ηp(x)√
nhdnh−d
n E
[(FY |X (qp(Xi)|Xi)−FY |X
(qp(x) + (qp(x))′(Xi − x)|Xi
))
×( 1
Xi−xhn
)K
(Xi − xhn
)]
=√
nhdn
[(1 + o(1))
12
(B0(x)B1(x)
)h2n
],
where the last equality is derived via a first order Taylor expansion of y 7→ FY |X(y|·)and a second order Taylor expansion of x 7→ qp(x) (these expansions exist in view ofAssumptions A1(ii) and A2). The (1+o(1)) factor is got rid of in Theorems 2.2–2.6by using Assumption B2. Details are omitted. ¤
22

5.4 Proof Theorem 3.1
Recall that N = 2 has been assumed throughout this section. Following Hansen (2008),µY (s) and µµµX(s) are such that
sups∈[0, 1]2
|µY (s)− µY (s)| = OP(εn) and sups∈[0, 1]2
‖µµµX(s)− µX(s)‖ = OP(εn),
with εn = (ln n/(ng2))1/2 + gr =: ε1n + ε2n, where ε1n is obtained as in the proof ofTheorem 2 of Hansen (2008) under Assumptions (C0), (C1), (C3) and (A3), whileε2n readily follows from Assumptions (C1) and (C3). Therefore, we have
maxi|Yi − Yi| = OP(εn) and maxi‖Xi −Xi‖ = OP(εn). (5.14)
Hence Υn := maxmaxi|Yi−Yi|,maxi‖Xi−Xi‖ = OP(εn), that is, P[Υn > Cεn] →0 as n → ∞ and C → ∞. Thus we can assume that, with probability arbitrarilyclose to one, Υn ≤ Cεn for some C and n sufficiently large. Let
Vn(θθθ) := H−1n
n1∑
i1=1
n2∑
i2=1
ψp(Y ∗ni(θθθ))XhiKi
with
Y ∗ni(θθθ) = Yi−a0−a′1(Xi−x), Xhi = (1, X′
hi)′, Xhi =
Xi − xh
, Ki = K
(Xi − x
h
).
We only need to show that sup|θθθ|≤M |Vn(θθθ)− Vn(θθθ)| = oP(1), since Lemma 5.3 withVn(θθθ) instead of Vn(θθθ) still applies. Now,
Vn(θθθ)− Vn(θθθ) = H−1n
n1∑
i1=1
n2∑
i2=1
[ψp(Y ∗ni(θθθ))XhiKi − ψp(Y ∗
ni(θθθ))XhiKi] = Bn3 + Bn,4,
(5.15)where
Bn3 := H−1n
n1∑
i1=1
n2∑
i2=1
[ψp(Y ∗ni(θθθ))− ψp(Y ∗
ni(θθθ))]XhiKi
and
Bn4 := H−1n
n1∑
i1=1
n2∑
i2=1
ψp(Y ∗ni(θθθ))[XhiKi −XhiKi].
Proceeding as in the proof of Lemma 5.4 (from equation (5.11) on), by notingthat |ψp(Y ∗
ni(θθθ))− ψp(Y ∗ni(θθθ))| ≤ I|Y ∗
ni(θθθ)|≤Υn, we obtain, since Υn ≤ Cεn,
|c′Bn3| ≤ CH−1n
n1∑
i1=1
n2∑
i2=1
I|Y ∗ni
(θθθ)|≤Υn|Kc
(Xhi
)|
≤ C(1 + oP(1))H−1n
n1∑
i1=1
n2∑
i2=1
I|Y ∗ni
(θθθ)|≤Cεn|Kc (Xhi) |.
23

In view of (5.14), the oP(1) quantity here is uniform in i. Since E[I|Y ∗ni
(θθθ)|≤Cεn|Kc (Xhi) |]is O(εnhd
n) uniformly with respect to θθθ, it follows that
H−1n
n1∑
i1=1
n2∑
i2=1
E[I|Y ∗ni
(θθθ)|≤Cεn|Kc (Xhi) |] = H−1n nO(εnhd
n)
= O(Hnεn) = O((hdn ln n/g2)1/2 + (nhd
ng2r)1/2).
Therefore |c′Bn3| = oP(1), and Bn3 = oP(1) uniformly with respect to θθθ.On the other hand, Kc(x) is continuously differentiable since K(x) is, so that
c′[XhiKi −XhiKi] = Kc
(Xhi
)−Kc (Xhi) = (1 + oP(1))h−1(Kc (Xhi))′(Xi −Xi),
where Kc(x) denotes the gradient of Kc(x) with respect to x; from (5.14), the oP(1)quantity here is uniform with respect to i. Then,
Bn4 = (1 + oP(1))H−1n
n1∑
i1=1
n2∑
i2=1
ψp(Y ∗ni(θθθ))h
−1Kc (Xhi) (Xi −Xi).
Note that, by (3.2) and (3.1),
Xi−Xi = µX(si)−µX(si) = µX(si)−n1∑
j1=1
n2∑
j2=1
Xjw(sj, si) = w(si)−n1∑
j1=1
n2∑
j2=1
Xjw(sj, si),
where w(si) =∑
j∈In(µX(si) − µX(sj))w(sj, si) = O(gr) uniformly, under Assump-tions (C1)–(C3), with respect to i. It easily follows that
Bn4 = (1 + oP(1))[Bn41 −
∑
j∈InX(sj)Bn42j
], (5.16)
where
Bn41 := Bn41(θθθ) := H−1n
n1∑
i1=1
n2∑
i2=1
ψp(Y ∗ni(θθθ))h
−1Kc (Xhi) w(si),
and
Bn42j := Bn42j(θθθ) := H−1n
n1∑
i1=1
n2∑
i2=1
ψp(Y ∗ni(θθθ))h
−1Kc (Xhi) w(sj, si).
Along the same lines as in the proof of Lemma 5.4, it can be shown that, sincew(si) = O(gr) uniformly in si,
E[|Bn41(θθθ)−Bn41(000)− (EBn41(θθθ)− EBn41(000))|2]
= H−2n
[n(hd
n/Hn) (gr/h)2 + n2∏
k=1
cnkh2dn (gr/h)2 + n (gr/h)2
‖n‖∑
t=cnk
tϕ(t)]
= Hn−1 (gr/h)2 + h(1−2/a)d
n (gr/h)2 + (gr/h)2 cank
‖n‖∑
t=cnk
tϕ(t) = o(1).
24

Similarly, taking cnk = [h−dn ]1/a→ ∞, and since w(sj, si) = O
((ng2)−1
)uniformly
in si and sj,
E|Bn42j(θθθ)−Bn42j(000)− (EBn42j(θθθ)− EBn42j(000))|2
= Hn−1
(1/(ng2)h
)2+
2∏
k=1
cnkhdn
(1/(ng2)h
)2+ h−d
n
(1/(ng2)h
)2‖n‖∑
t=cnk
tϕ(t)
= Hn−1
(1/(ng2)h
)2+ h(1−2/a)d
n
(1/(ng2)h
)2+
(1/(ng2)h
)2cank
‖n‖∑
t=cnk
tϕ(t) = o(1),
uniformly with respect to j. Thus, applying the chaining argument as in the proofof Lemma 5.4, it follows that
sup‖θθθ‖≤M
‖Bn41(θθθ)−Bn41(000)− (EBn41(θθθ)− EBn41(000))‖ = oP(1), (5.17)
sup‖θθθ‖≤M
‖Bn42j(θθθ)−Bn42j(000)− (EBn42j(θθθ)− EBn42j(000))‖ = oP(1), (5.18)
uniformly with respect to j. Further, it is easily shown that
Bn41(000)− EBn41(000) = oP(1), Bn42j(000)− EBn42j(000) = oP(1) (5.19)
uniformly with respect to j, while (the last step follows from integration by parts)
En41(θθθ) = H−1n nEψp(Y ∗
ni(θθθ))h−1Kc (Xhi) w(si)
= H−1n nE[F (qp(Xi)|Xi)− F (qp(x) + Uni(θθθ)|Xi)]h−1Kc (Xhi) w(si)
= H−1n n(1 + o(1))fY |X(qp(x)|x)
× E[12(Xi − x)′qp(x)(Xi − x) + θθθ′XhiH
−1n
]Kc (Xhi) (gr/h)
= O((nhd+2n g4)1/2 + gr/h) (5.20)
uniformly with respect to θθθ. Similarly,
EBn42j(θθθ) = H−1n nE[F (qp(Xi)|Xi)− F (qp(x) + Uni(θθθ)|Xi)]h−1Kc (Xhi) w(si, sj)
= (1 + o(1))w(si, sj)[(nhd+2
n )1/2A(x) + h−1θθθ′B(x)]
(5.21)
uniformly with respect to ‖θθθ‖ ≤ M , i and j, where
A(x) := fY |X(qp(x)|x)fX(x)tr(qp(x)
∫uu′Kc(u)du
)
and B(x) := fY |X(qp(x)|x)fX(x)∫(1,u′)′Kc(u)du. Then, (5.17)-(5.21) imply that
Bn41(θθθ) = O((nhd+2
n g4)1/2 + gr/h)
(5.22)
25

uniformly with respect to θθθ, and that
Bn42j(θθθ) = (1 + o(1))w(si, sj)[(nhd+2
n )1/2A(x) + h−1θθθ′B(x)]
(5.23)
uniformly with respect to θθθ, i and j. Since Xi is α-mixing and stationary, withEXi = 0 and w(si, sj) = O(1/ng2) uniformly in i and j, we easily show that
E[ ∑
j∈InXjw(si, sj)
]2= EX2
j
∑j∈In W 2((si − sj)/g)
(∑j∈In W ((si − sj)/g)
)2 +∑
j1 6=j2
EXj1Xj2w(si, sj1)w(si, sj2)
= O(1)((1/ng2) + (1/ng2)2) = O(1/ng2)
uniformly with respect to i. Hence, in view of (5.23), we obtain
∑
j∈InXjBn42j = (1 + o(1))
((nhd+2
n )1/2A(x) + h−1θθθ′B(x)) ∑
j∈InXjw(si, sj)
= (1 + o(1))((nhd+2
n )1/2A(x) + h−1θθθ′B(x))O(1/ng2)
= OP
((hd+2
n /ng4)1/2 + (1/nhg2))
= oP(1) (5.24)
uniformly with respect to θθθ, ‖θθθ‖ ≤ M ; (5.16), (5.22) and (5.24) thus imply thatBn4 is oP(1), uniformly over ‖θθθ‖ ≤ M and, in view of (5.15), we have that Vn(θθθ)−Vn(θθθ) = Bn3 + Bn4 = oP(1) uniformly over |θθθ| ≤ M , which completes the proof. ¤
References
[1] Altman, N. (2000). Krige, smooth, both or neither? Australian & New ZealandJournal of Statistics 42, 441-461.
[2] Anselin, L. and Florax, R.J.G.M. (1995). New Directions in Spatial Economet-rics. Berlin: Springer.
[3] Besag, J.E. (1974). Spatial interaction and the statistical analysis of latticesystems. Journal of the Royal Statistical Society Series B 36, 192-225.
[4] Bhattacharya, P.K and Gangopadhyay, A. (1990). Kernel and nearets neighborestimation of a conditional quantile, Annals of Statistics 18, 1400-1415.
[5] Bolthausen, E. (1982). On the central limit theorem for stationary randomfields. Annals of Probability 10, 1047-1050.
[6] Bowman, A.W. and Azzalini, A. (1997). Applied Smoothing Techniques forData Analysis: The Kernel Approach with S-Plus Illustrations. Oxford: OxfordUniversity Press.
[7] Cai, Z.W. (2002). Regression quantiles for time series. Econometric Theory 18,169-192.
26

[8] Carbon, M., Hallin, M., and Tran, L.T. (1996). Kernel density estimation forrandom fields: the L1 theory. Journal of Nonparametric Statistics 6, 157-170.
[9] Chaudhuri, P. (1991). Nonparametric estimates of regression quantiles and theirlocal Bahadur representation. Annals of Statistics 19, 760-777.
[10] Cleveland, W.S. (1979). Robust locally weighted regression and smoothing scat-terplots. Journal of the American Statistical Association 74, 829-836.
[11] Cressie, N.A.C. (1993). Statistics for Spatial Data. New York: John Wiley.
[12] Dahlhaus, R. (1997). Fitting time series models to nonstationary processes,Annals of Statistics 25, 1-37.
[13] Devroye, L., and Gyorfi, L. (1985). Nonparametric Density Estimation: TheL1 View. New York: John Wiley.
[14] Efron, B. (1991). Regression percentiles using asymmetric squared error loss,Statistica Sinica 1, 93-125.
[15] Fan, J. (1992). Design-adaptive nonparametric regression. Journal of the Amer-ican Statistical Association 87, 998-1004.
[16] Fan, J. and Gijbels, I. (1996). Local polynomial modeling and its applications.London: Chapman and Hall.
[17] Fan, J., Hu, T. C., and Truong, Y. K. (1994), Robust nonparametric functionestimation. Scandinavian Journal of Statistics 21, 433-446.
[18] Fan, J. and Yao, Q. (2003). Nonlinear Time Series: nonparametric and para-metric methods. New York: Springer-Verlag.
[19] Gao. J., Lu, Z., and Tjøstheim, D. (2006). Estimation in Semi-parametric Spa-tial Regression. Annals of Statistics 34, 1395-1435.
[20] Guyon, X. (1987). Estimation d’un champ par pseudo-vraisemblable condi-tionelle: etude asymptotique et application au cas Markovien. In J.-J. Droes-beke et al., Eds, Spatial Processes and Spatial Time Series Analysis, Proceedingsof the 6th Franco-Belgian Meeting of Statisticians. Brussels: FUSL.
[21] Guyon, X. (1995). Random Fields on a Network. New York: Springer Verlag.
[22] Hallin, M., Lu, Z., and Tran, L. T. (2001). Density estimation for spatial linearprocesses. Bernoulli 7, 657-668.
[23] Hallin, M., Lu, Z., and Tran, L. T. (2004a). Density estimation for spatialprocesses: the L1 theory. Journal of Multivariate Analysis 88, 61-75.
[24] Hallin, M., Lu, Z., and Tran, L. T. (2004b). Local linear spatial regression.Annals of Statistics 32, 2469-2500.
[25] Hansen, B. (2008). Uniform convergence rates for kernel estimation with de-pendent data. Econometric Theory, 24, 726-748
27

[26] He, X. and Shao, Q.M. (1996). A general Bahadur representation of M-estimators and its application to linear regression with nonstochatic designs.Annals of Statistics 24, 2608-2630.
[27] Honda T. (2000). Nonparametric estimation of a conditional quantile for α-mi-xing processes. Annals of the Institute of Statistical Mathematics 52, 459-470.
[28] Koenker, R. (2005). Quantile Regression. Cambridge University Press, Cam-bridge, U.K.
[29] Koenker, R. and Bassett, G. (1978). Regression quantiles. Econometrica 46,33-50.
[30] Koenker, R. and Mizera, I. (2004). Penalized triograms: total variation regular-ization for bivariate smoothing. Journal of the Royal Statistical Society SeriesB 66, 145-164.
[31] Koenker, R. and Portnoy, S. (1987). L-estimation for linear models. Journal ofthe American Statistical Association 82, 851-857.
[32] Koenker, R. and Zhao, Q. (1996). Conditional quantile estimation and inferencefor ARCH models. Econometric Theory 12, 793-813.
[33] Koul, H. L. and Mukherjee, K. (1994). Regression quantiles and related pro-cesses under long-range dependence. Journal of Multivariate Analysis 51, 318-337.
[34] Loader, C. (1999). Local Regression and Likelihood, Springer, New York.
[35] Lu, Z. and Chen, X. (2002). Spatial nonparametric regression estimation: non-isotropic case. Acta Mathematicae Applicatae Sinica18, 641-656.
[36] Lu, Z. and Chen, X. (2004). Spatial kernel regression estimation: weak consis-tency. Statistics and Probability Letters 68, 125-136.
[37] Lu, Z., Hui, Y.V., and Zhao, Q. (1998). Local linear quantile regression un-der dependence: Bahadur representation and application. Discussion paper,Department of Management Sciences, City University of Hong Kong.
[38] Lu, Z., Lundervold, A., Tjøstheim, D., and Yao, Q. (2007). Exploring spatialnonlinearity using additive approximation. Bernoulli, 13, 447-472.
[39] Nakhapetyan, B.S. (1980). The central limit theorem for random fields withmixing conditions. In R. L. Dobrushin and Ya. G. Sinai, Eds., Advances inProbability 6, Multicomponent Systems, 531-548. New York: Marcel Dekker.
[40] Neaderhouser, C. C. (1980). Convergence of blocks spins defined on randomfields. Journal of Statistical Physics 22, 673-684.
[41] Portnoy, S. L. (1991). Asymptotic behavior of regression quantiles in non-stationary dependent cases. Journal of Multivariate Analysis 38, 100-113.
28

[42] Possolo, A. (1991). Spatial Statistics and Imaging. IMS Lecture Notes-Monograph Series. Hayward: Institute of Mathematical Statistics.
[43] Ripley, B. (1981). Spatial Statistics. New York: Wiley.
[44] Ruppert, D. and Carroll, R. J. (1980). Trimmed least square estimation in thelinear model. Journal of the American Statistical Association 75, 828-838.
[45] Ruppert D. and Wand, M P. (1994). Multivariate locally weighted least squaresregression. Annals of Statistics 22, 1346-1370.
[46] Stone, C.J. (1977). Consistent nonparametric regression. Annals of Statistics 5,595-620.
[47] Takahata, H. (1983). On the rates in the central limit theorem for weakly depen-dent random fields. Zeitschrift fur Wahrscheinlichkeitstheorie und verwandteGebiete 64, 445-456.
[48] Tran, L. T. (1990). Kernel density estimation on random fields. Journal ofMultivariate Analysis 34, 37-53.
[49] Tran, L. T. and Yakowitz, S. (1993). Nearest neighbor estimators for randomfields. Journal of Multivariate Analysis 44, 23-46.
[50] Welsh, A. H. (1996). Robust estimation of smooth regression and spread func-tions and their derivatives. Statistica Sinica 6, 347-366.
[51] Whittle,P. (1954).On stationary processes in the plane. Biometrika41, 434-449.
[52] Whittle, P. (1963). Stochastic process in several dimensions. Bulletin of theInternational Statistical Institute 40, 974-985.
[53] Yu, K. and Jones, M.C. (1997). A comparison of local constant and local lin-ear regression quantile estimation. Computational Statistics & Data Analysis25, 159-166.
[54] Yu, K. and Jones, M.C. (1998). Local linear quantile regression. Journal of theAmerican Statistical Association 93, 228-237.
[55] Yu, K. and Lu, Z. (2004). Local linear additive quantile regression. ScandinavianJournal of Statistics 31, 333-346.
[56] Zhang, H. and Zimmerman, D.L. (2005). Towards reconciling two asymptoticframeworks in spatial statistics. Biometrika 92, 921-936.
29