Linear Regression - Home | AMS005, Summer 17, Section 01
27
Linear Regression (*) Given a set of paired data, {(x 1 ,y 1 ), (x 2 ,y 2 ),..., (x n ,y n )}, we want a method (formula) for predicting the (approximate) y -value of an observation with a given x-value. Problem: There are many observations with the same x-value but different y -values... ⇒ Can’t predict one y -value from x. 1
-
Upload
khangminh22 -
Category
Documents
-
view
2 -
download
0
Transcript of Linear Regression - Home | AMS005, Summer 17, Section 01

Linear Regression
(*) Given a set of paired data, {(x1, y1), (x2, y2), . . . , (xn, yn)}, we want
a method (formula) for predicting the (approximate) y-value of an
observation with a given x-value.
SD line
(xj,yj)
dj
Problem: There are many observations with the same x-value but
different y-values... ⇒ Can’t predict one y-value from x.
1

(*) More realistic goal: a method (formula) for predicting the (approxi-
mate) average y-value for all observations having the same x-value.
Notation:
• y(xj) = average y-value for all observations with x-value = xj .
• yj = estimated value of y(xj).
• We want a method for calculating yj from xj .
(*) We want the method (formula) to be linear — this means that there
is a specific line and the points (xj , yj) all lie on this line.
(*) In other words, we want to find a formula of the form
yj = β0 + β1xj .
2

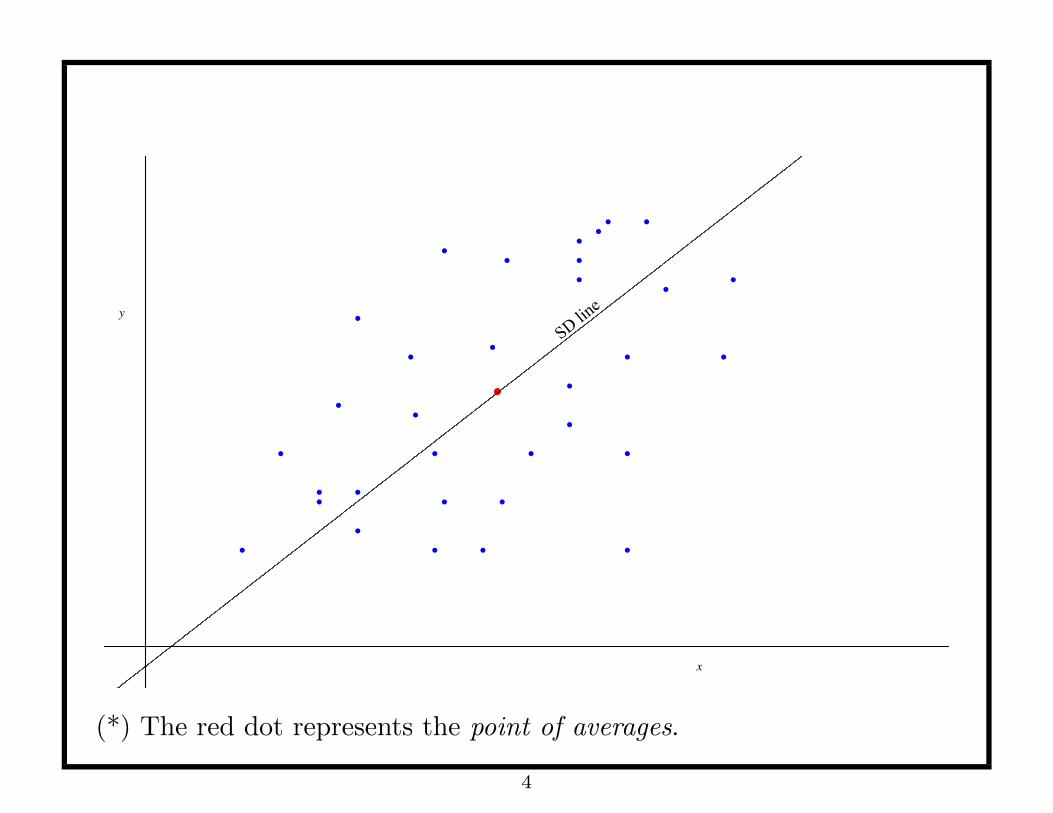
First Guess: The SD-line.
(*) The SD-line is the line that passes through the point of averages
(x, y) with slope m = ±SDy
SDx.
⇒ The slope isSDy
SDxif r ≥ 0.
⇒ The slope is −SDy
SDxif r < 0.
On this line, y, if x increases by one SDx, then y increases by one SDy
(if r > 0) or y decreases by one SDy (if r < 0).
(*) Roughly speaking, the SD-line runs down the middle of the ‘cloud’
of points, in the ‘long’ direction.
3
SD line
(xj,yj)
dj
(*) The red dot represents the point of averages.
4

(*) The correlation coefficient gives a measure of how the data is clustered
around the SD-line. For each point (xj , yj) in the scatter plot, find the
vertical distance dj of (xj , yj) from the SD-line...
SD line
(xj,yj)
dj
... then the clustering around the SD-line is quantified by
√1
n
∑j
d2j .
5

(*) The R.M.S. of the vertical distances to the SD-line can be computed
quickly in terms of the correlation coefficient:√1
n
∑j
d2j =√
2(1− |rxy|)× SDy.
The smaller this number is, the more tightly clustered the points are
around the SD line.
(*) The closer |rxy| is to 1, the more tightly clustered the data will be
around the SD line. But this measure of clustering around the SD-line
depends on both rxy and SDy.
⇒ Two sets of data can have the same correlation, even though one of
them appears to be more tightly clustered around the SD line than the
other, because of changes in scale (smaller standard deviations).
6

Statistics, Fourth EditionCopyright © 2007 W. W. Norton & Co., Inc.
7

Question: How well does the SD-line approximate the averages y(xj)?
SD line
x-y-
? ? ?
Not so well: The SD line is underestimating the average in the strip
to the left of the point of averages and overestimating the average of the
strip to the right of the point of averages.
8

SD line
x-
y-
? ? ?
(*) Hypothetical (cloud of) data with graph of averages (red dots) and
the SD line. The further the vertical strip is from the point of averages,
the worse the SD line approximates the average height of the data in
that strip.
9

SD line
x-
y-
? ? ?
We want to find the line that
(i) Passes through the point of averages.
(ii) Approximates the graph of averages as well as possible.
10

Question: What information is missing from the SD line?
Answer: The correlation between the variables!
(*) Taking correlation into account leads to the regression line.
• The regression line passes through the point of averages.
• The slope of the regression line (for y on x) is given by
rxy ·SDy
SDx.
• The regression line predicts that for every one SDx change in x,
there is an approximate one rxy ·SDy change in the average value
of the corresponding y s.
Paired data and the relationship between the two variables (x and y) is
summarized by the five statistics:
x, SDx, y, SDy and rxy.
11

Example: Regression of weight on height for women in Great Britain
in 1951.
Summary statistics:
h ≈ 63 inches, sh ≈ 2.7 inches,
w ≈ 132 lbs, sw ≈ 22.5 lbs.
rhw ≈ 0.32
The summary statistics can be used to estimate the weights of women
given information about their height.
12

Question: How much did 5’6”-tall British women weigh in 1951 on
average?
Answer: These women were 3 inches above average height. This is
3
2.7≈ 1.11SDh above average height.
The regression line predicts that on average, they would have weighed
about
r︷︸︸︷0.32×
#SDh︷︸︸︷1.11 ≈ 0.355SDw above the average weight.
So, the average weight for these women would have been about
132 + 0.355× 22.5 ≈ 140 lbs.
13

Question: By about how much did average weight increase for every 1
inch increase in height?
Answer: 1 inch represents
1
2.7≈ 0.37SDh,
so each additional inch of height would have added about
0.32× 0.37 ≈ 0.1184SDw = 0.1184× 22.5lbs ≈ 2.66lbs
to the average weight.
14

Example. A large (hypothetical) study of the effect of smoking on the
cardiac health of men, involved 2709 men aged 25 - 45, and obtained the
following statistics,
x = 17, SDx = 8, y = 129, SDy = 7, rxy = 0.64,
where
(*) yj = systolic blood pressure measured in mmHg of the jth subject
(*) xj = number of cigarettes smoked per day by jth subject.
Question: What is the predicted average blood pressure of men in this
age group who smoke 20 cigarettes per day?
Answer: 20 cigarettes is 3 cigarettes above average, which is 3/8 · SDx
above average. The regression line predicts that the average blood
pressure of men who smoke 20 cigarettes/day will be
rx,y ×(
3
8· SDy
)= 0.64×
(3
8· 7)≈ 1.68
mmHg above the overall average blood pressure — about 130.68 mmHg.
15

Question: John is a 31-year old man who smokes 30 cigarettes a day.
What is John’s predicted blood pressure.
Answer: Our best guess for John is the average blood pressure of men
who smoke 30 cigarettes a day. Since 30 is 13 = 13/8 × SDx above x,
the regression line predicts that John’s blood pressure will be about
rx,y ×(
13
8· SDy
)= 0.64×
(13
8· 7)≈ 7.28
mmHg above average — about 136.28 mmHg.
Question: How accurate is this estimate likely to be?
To answer this question we need to have an idea of the spread around
the average in the vertical strip corresponding to x = 30.
16

Example. Students in a certain kindergarten class are given an IQ test
in the fall and then again in the Spring. Researchers want to know if the
academic program in this kindergarten helps boost the children’s IQ.
(*) The average on both tests is about 100 and both SD s are about 15,
so at first glance it seems that a year of kindergarten had no overall
effect.
(*) A closer look at the data finds shows that students with high scores
on the first test, tended to have lower scores on the second test, on
average. Also, students with lower scores on the first test did better, on
average, on the second test.
(*) Why?
17

(*) Suppose that the relation between x and y is positive.
The regression effect is caused by the spread around the SD line:
if xj is one SDx above x, then yj will be greater than y, but only by
r× SDy on average. If xj is one SDx below x, then yj will be less than
y on average, but only by r × SDy.
SD line
x-y-
? ? ?
18

The regression effect – a famous example.
Example: Heights of sons on heights of fathers.
average height of fathers ≈ 68 inches, SD ≈ 2.7 inches
average height of sons ≈ 69 inches, SD ≈ 2.7 inches r ≈ 0.5
Statistics, Fourth EditionCopyright © 2007 W. W. Norton & Co., Inc.
Figure 5., p.171 in FPP, sons
and fathers’ heights, with SD
line and regression line.
19

• The average heights of the sons for each height class of the fathers
follow the regression line, not the SD line.
• The average height of the sons grows more slowly than the height of
their fathers.
• Fathers that are much taller than 70 inches, will have sons that are,
on average, shorter than them.
• Fathers that are shorter than 70 inches will have sons that are, on
average, taller than them.
• The same logic applies, for example to of test-retest scenarios: higher
than average scores on the first test will be followed by somewhat
lower scores on the second test, on average. Likewise, lower than
average scores on the first test will be followed by somewhat better
scores on the second test, on average.
• The belief that the regression effect is anything more than a statis-
tical fact of life is the regression fallacy.
20

Example: A study of education and income is done for men age 30 -
35. A representative sample of 10000 men in this age group is surveyed,
and the following statistics are collected:
E = 13 SDE = 1.5
I = 46 SDI = 10 rI,E = 0.45
where E = years of education and I = annual income, in $1000s.
(*) A 32-year old man is observed, our best guess for his income is ...
... the average income for all men in this age group, I = 46.
(*) A 32-year old man with 16 years of education is observed, our best
guess for his income is ...
... the average income of all men in this age group with 16 years of
education:
I(16) ≈ 46 + 0.45× 16− 3
1.5× 10 = 55.
21

Example: A study of education and income is done for men age 30 -
35. A representative sample of 10000 men in this age group is surveyed,
and the following statistics are collected:
E = 13 SDE = 1.5
I = 46 SDI = 10 rI,E = 0.45
where E = years of education and I = annual income, in $1000s.
(*) A 32-year old man is observed, our best guess for his income is ...
... the average income for all men in this age group, I = 46.
(*) A 32-year old man with 16 years of education is observed, our best
guess for his income is ...
... the average income of all men in this age group with 16 years of
education:
I(16) ≈ 46 + 0.45× 16− 3
1.5× 10 = 55.
(*) How can we make our estimates more informative?
21

(*) We can make our first answer more informative by saying that
most men in this age group (probably) have incomes in the range
I ± SDI = 46± 10.
(*) We would like to do the same for the second estimate, when we know
the man’s level of education.
(*) To do this, we need an estimate for the SD of the incomes for all
men in this study with 16 years of education.
⇒With access to all the data, we could isolate the men with 16 years of
education and calculate the average and SD of their incomes (in which
case, we wouldn’t need the regression method either!).
(*) Question: is there some way to generate an estimate for the SD we
want using only the five basic statistics
E, SDE , I, SDI and rI,E?
22

SD line
(xj,yj)
0>εj
(xj , yj)
(xj , ŷj)
Regression line
(xk , yk)
(xk , ŷk)
εk>0
jth residual: εj = yj - ŷj
23

The “Root-Mean-Square” error of regression (also called the Standard
error of regression, SER) is given by
SER =
√1
n
∑j
ε2j =
√1
n
∑j
(yj − yj)2,
where
• yj is the y-value of the jth observation,
• yj is the predicted value of yj (by the regression line),
• εj = yj − yj is the jth residual or prediction error.
(*) The R.M.S. Error for regression (SER) is like an SD for the points
in a scatter plot, with the regression line playing the role of the average.
24

Rule of thumb: Most of the points in a scatter plot lie in a strip around
the regression line — from one SER below the regression line to one
SER above the regression line. SD line
(xj,yj)
0>εj
(xj , yj)
(xj , ŷj)Regression line(xk , yk)
(xk , ŷk)
εk>0
jth residual: εj = yj - ŷj
SERSER
25

(*) Back to the question of finding an SD for the set of yjs of all
observations with the same xj ....
For certain types of paired data, the SER gives a good approximation of
the SD in every vertical strip
In other words we can use the regression estimate together with the SER
to give more informative predictions for yj given xj .
(*) The regression method says that y(xj) ≈ yj(xj). This gives the
‘point estimate’ (prediction) yj ≈ y(xj) ≈ yj(xj).
(*) The SER adds a margin of error, and we can say that ...
... yj is likely to fall in the range yj ± SER.
This becomes particularly useful because there is a convenient shortcut
for the SER:
SER =√
1− r2 × SDy.
26